Article

Effect of Cationic/Anionic Diffusion Dominated Passive Film Growth on Tribocorrosion

1
College of Materials Science and Engineering, Chongqing University of Technology, Chongqing 400054, China
2
Corrosion and Protection Center, Advanced Institute for Materials and Technology, University of Science and Technology, Beijing 100083, China
*
Author to whom correspondence should be addressed.
Metals 2022, 12(5), 798; https://doi.org/10.3390/met12050798
Submission received: 31 March 2022 / Revised: 28 April 2022 / Accepted: 29 April 2022 / Published: 5 May 2022
(This article belongs to the Special Issue Metal Degradation: Synergism between Corrosion and Wear)

Abstract

:
Tribocorrosion behaviours of nickel (Ni) and niobium (Nb) in sodium sulfate (Na2SO4) solution under potentiodynamic and potentiostatic conditions were studied. Under the potentiodynamic condition, the passivation was early broken, accompanied by a sharp increase in frictional coefficient on Nb. The current was more fluctuant, and larger material loss appeared at the higher potential in the potentiostatic condition. However, these phenomena did not occur for Ni, and it even showed lower material loss at the higher potential in the potentiostatic tribocorrosion test. The differences in tribocorrosion behaviour had a close relationship to the passive film growth mechanism, which decided the passive film/metal interface structure. Nb with anionic diffusion dominated mechanism in passive growth would cause the accumulation of oxygen vacancies at the passive film/metal interface. This may weaken the adhesion between the metal and the passive film. However, with the cationic diffusion dominated passive film growth on Ni, cation vacancies concentrated at the passive film/tribo-film interface, and this did not affect the adhesion between metal and passive film. Ni or other passive elements with the cationic diffusion-dominated mechanism in passive film growth were recommended as the alloying element for improving the tribocorrosion resistance of alloys.

1. Introduction

When metallic materials are mechanically worn in a corrosive environment, a new failure phenomenon, which is called tribocorrosion, appears [1,2,3]. In tribocorrosion, corrosion and wear are greatly accelerated due to the synergistic effect between them, and it often results in rapid failure of materials and even accidents [4,5]. Inhibiting the synergistic effect is the key factor in improving the tribocorrosion resistance of materials. The synergistic effect could be divided into two parts: wear-accelerated corrosion and corrosion-accelerated wear [6]. The wear-accelerated corrosion is mainly caused by mechanical depassivation [7]. The passive film is thinned or removed by mechanical wear, leading to acceleration of anodic dissolution [8]. Quick repassivation of the worn region can effectively inhibit the anodic dissolution and lower the wear-accelerated corrosion rate [9,10]. Another part is the corrosion-accelerated wear which is induced by the formation of the mechanically weak passive film, such as oxide and hydroxide [11]. Evidently, the two parts of the synergistic effect are closely related to passivation.
Depassivation and subsequent repassivation take place alternately during tribocorrosion; thus, the passive film is often broken when it is still growing. Therefore, the re-growth of the passive film and the properties of the new film, such as corrosion protection and wear resistance, must have a significant influence on tribocorrosion [12,13]. According to the point defect model (PDM), the growth of oxide passive film depends on the diffusion of cations and anions over vacancies in the film [14,15]. The exchange of metal atoms and cation vacancies at the film/metal interface occurs to support continued film growth without loss of adherence. In normal corrosion, the passive film growth mechanism has no obvious influence on corrosion protection since the passive film is formed. However, considering the frequent depassivation/repassivation, the passive film growth mechanism certainly has an impact on tribocorrosion because the interface structure of film/metal depends on the growth mechanism. In fact, the growth of passive film on some passive metals is dominated by a cation diffusion process, such as on Ni, Cr, Co, Cu and Mn [16], while the anion diffusion process is dominant on Nb, Ti, Zr and Ta [14]. Under cation diffusion domination, the passive film grows at the solution/film interface. Under anion diffusion domination, the passive film grows at the film/metal interface. The growing interface with lots of defects is unstable compared with the formed film, and it is a weakness for the passive film during tribocorrosion. For some metals, their passive abilities are too weak or even have no passive ability. Therefore, the mentioned passive elements are often added to the metals to improve their passive ability. A typical example is stainless steel [17]. The addition of the passive element of Cr significantly enhances the corrosion resistance of iron by forming Cr-riched oxide passive film. Whereas, with the introduction of wear in tribocorrosion, the experiences in designing corrosion-resistance alloys are not completely applicable for the tribocorrosion-resistance alloys.
As far as we know, the influence of passive film growth mechanism on tribocorrosion behaviour has not been concerned and investigated in designing tribocorrosion resistance alloys. The aim of this study is to investigate whether the passive film growth mechanism affects tribocorrosion behaviour. If it does, how does it work? Therefore, the tribocorrosion behaviours of two typically passive metals (Ni and Nb), which have been widely used as anti-corrosion materials or as passive elements to produce anti-corrosion alloy, and, more importantly, have different passive film growth mechanisms, were investigated under potentiodynamic and potentiostatic conditions in Na2SO4 solution. Using pure metals could also obviate the interferences from the solvent elements. It was found that the passive film growth mechanisms had a significant influence on tribocorrosion behaviour by changing the film/metal interface structure. It was suggested that the passive elements with cationic diffusion dominated passive film growth (e.g., Ni) are desirable as added alloying elements for improving tribocorrosion resistance. This study aims to help to understand the tribocorrosion further and guide the design of anti-tribocorrosion alloys.

2. Materials and Methods

2.1. Sample Preparation

Commercially pure Ni and Nb plates (purity ≥ 99.9 wt.%) were used as the substrates. The plates were cut into slices with a dimension of 20 mm × 6 mm × 2 mm. The slice was placed in a polyvinylchloride tube, welded with wire and embedded with epoxy resin. The exposed area was 20 mm × 6 mm. The exposed side of the sample was ground with SiC papers up to 3000 grit and then polished with diamond paste. After polishing, the samples were ultrasonically cleaned in ethanol and finally dried in the air. The microhardness of the Ni and Nb samples were HV 182.2 ± 7.0 and HV 141.6 ± 4.0, respectively. The corrosion medium was 5 wt.% Na2SO4 aqueous solution with a pH of 8.4 (unregulated), which was widely used in the research for passivation and tribocorrosion [18,19,20]. All the tests were carried out at room temperature (~25 °C) in the atmospheric environment.

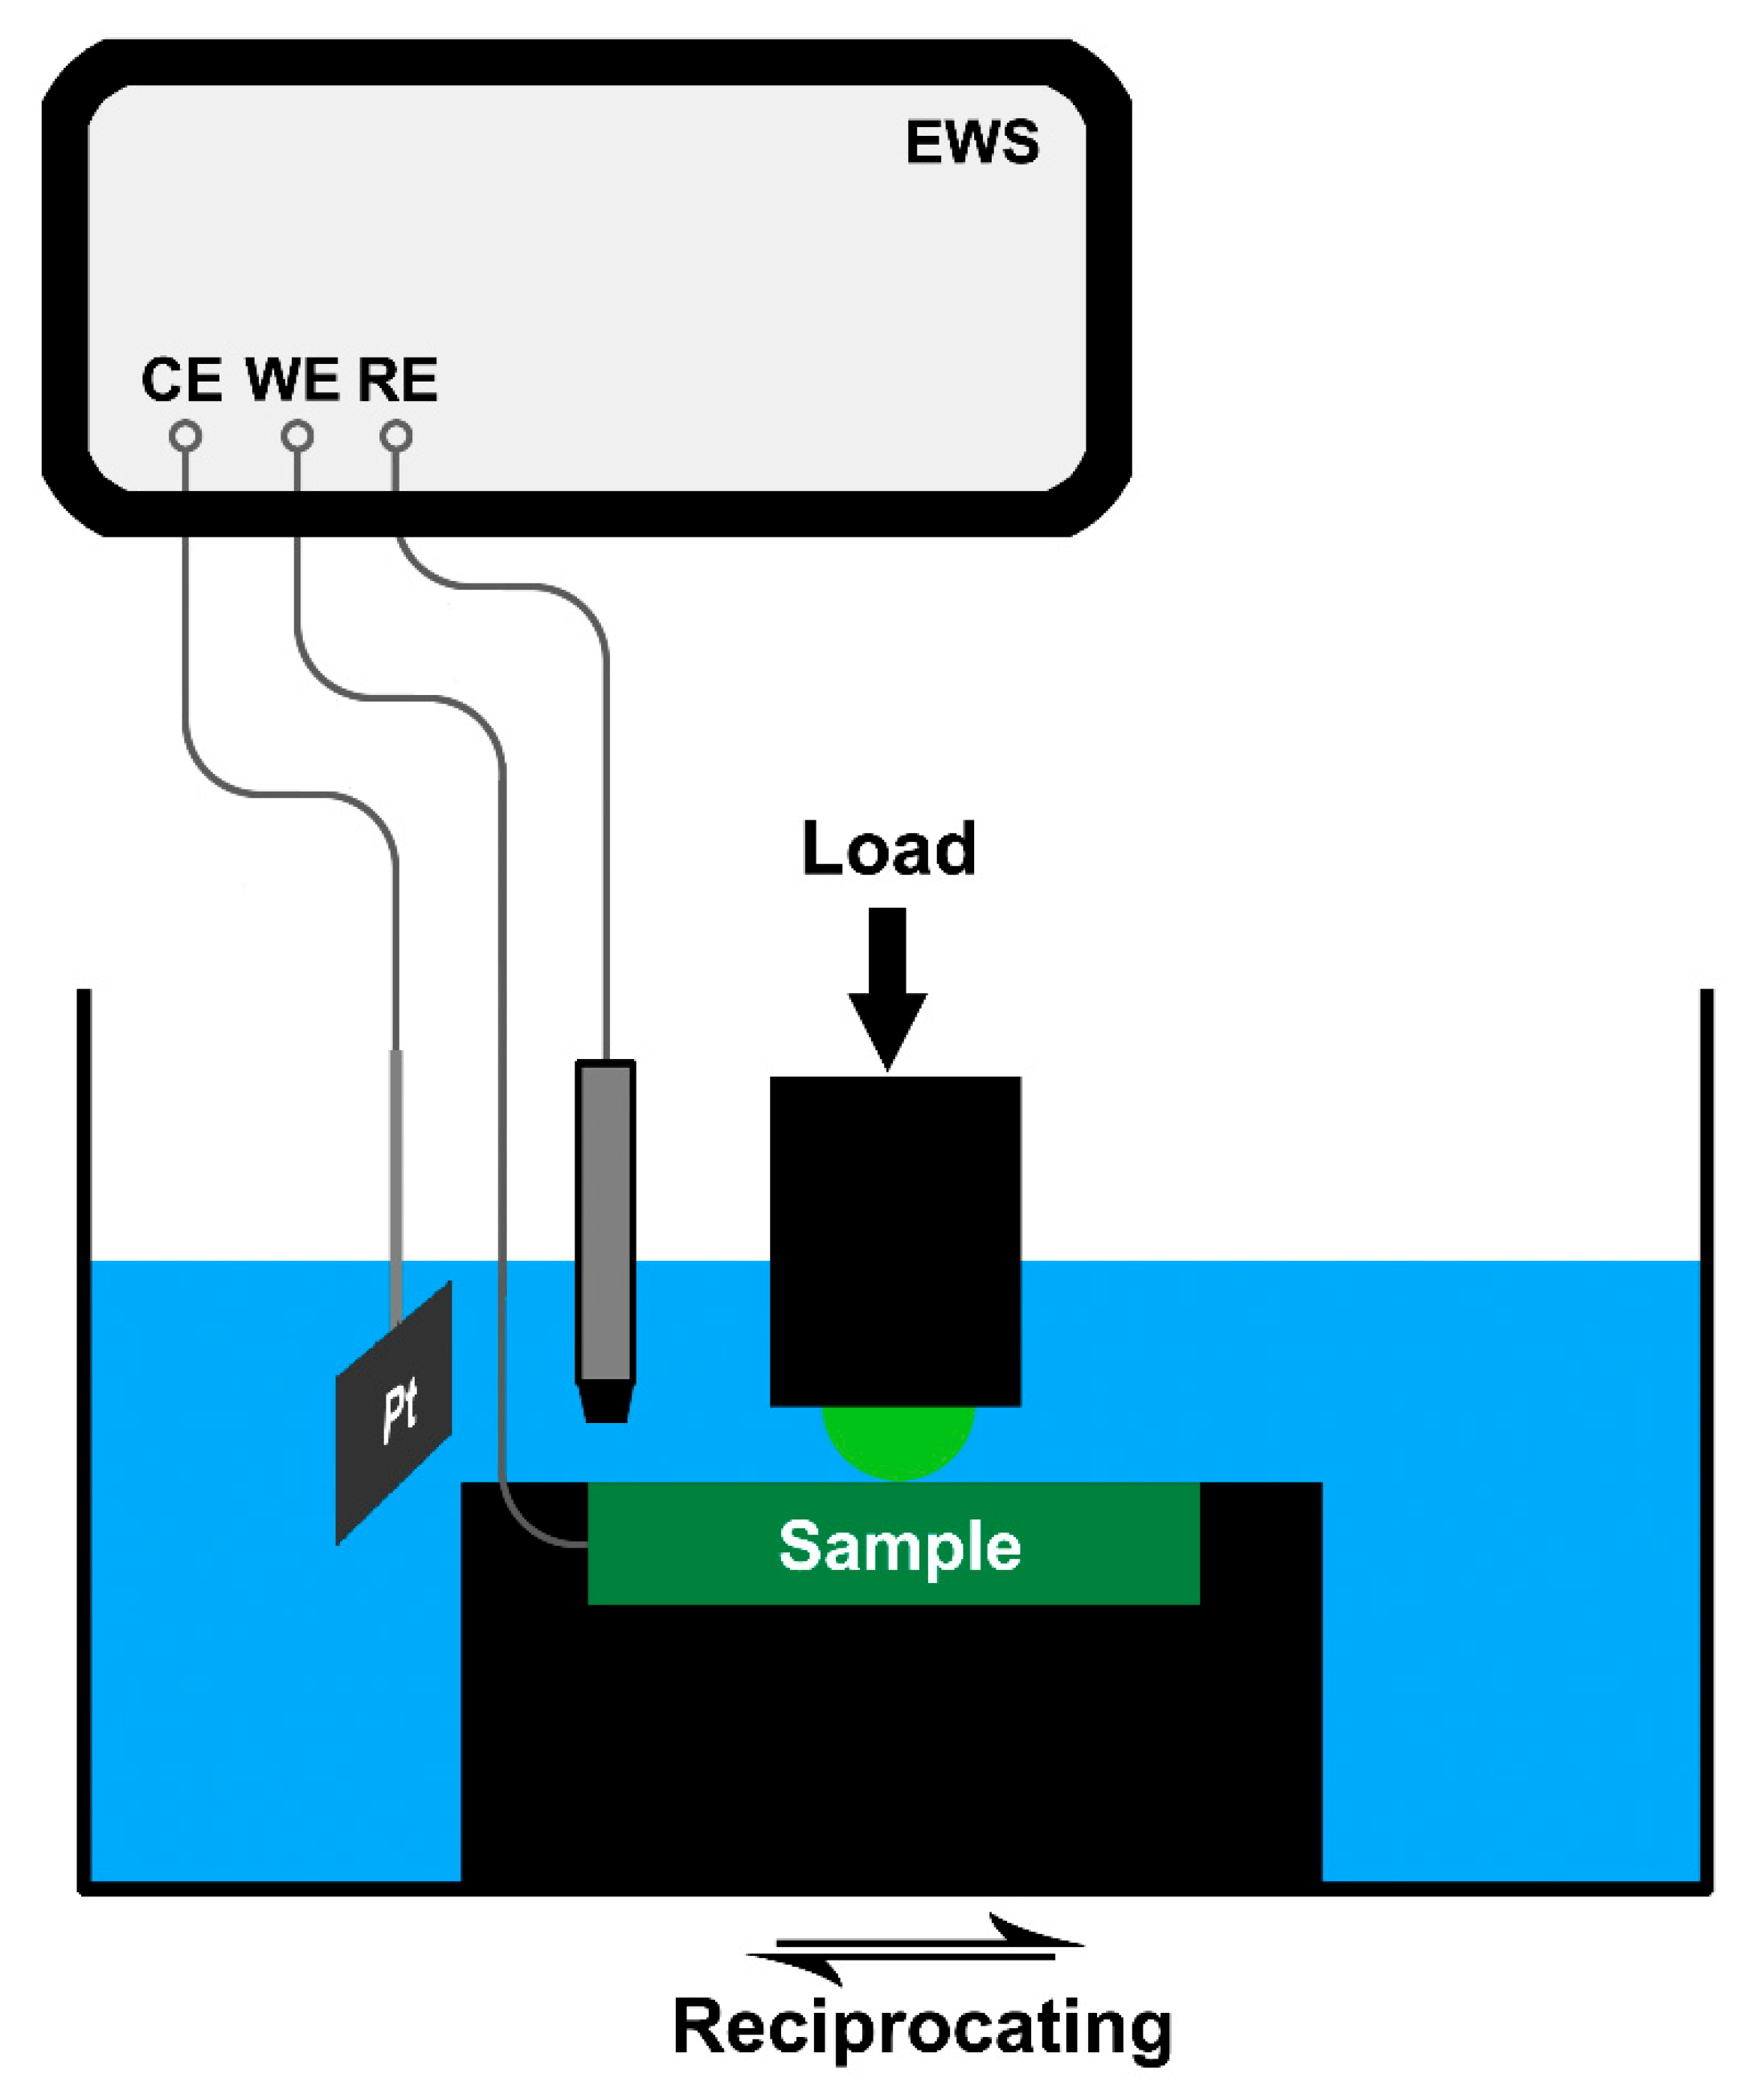
2.2. Tribocorrosion Tests

A tribometer (UMT2, CETR) and an electrochemical work station (CH660E, CH Instruments, Bee Cave, TX, USA) were combined in the tribocorrosion test. The diagram of the tribocorrosion setup is shown in Figure 1. By using this setup, the tribological and electrochemical signals during the tribocorrosion process could be recorded simultaneously. The sample was fixed in a polytetrafluoroethylene cell which was assembled on the tribometer. Point contact configuration (sphere-on-plate) was adopted in the tests. The counterpart was a Φ10 mm ZrO2 ceramic sphere. In the test, the tribometer applied a load on the sphere to contact the sample surface. Then, the sample reciprocated together with the cell. The sample, a Pt plate (15 mm × 15 mm) and an Ag/AgCl electrode were connected to the electrochemical work station and worked as working electrode, a counter electrode and reference electrode, respectively. The positions of the three electrodes were relatively fixed. The potentials in this study were all versus the Ag/AgCl electrode.
The tribocorrosion tests were performed under potentiodynamic (PD) and potentiostatic (PS) conditions. In the potentiodynamic tribocorrosion test (PDTT), 100 mL Na2SO4 solution was first added to the cell. Then, the counterpart contacted the sample with the applied load of 5 N. Due to the difference in elastic modulus and Poisson’s ratios, the initial contact stress was 633 MPa on Nb and 796 MPa on Ni, respectively. Then, the cell started to reciprocate. The sliding distance was 18 mm per cycle. After sliding at open circuit potential (OCP) for 600 s, the dynamic potential polarisation was started. The scan was started from 150 mV vs. OCP, and the scanning rate was 1 mV·s−1. In the potentiostatic tribocorrosion test (PSTT), the sample was first passivated in 100 mL Na2SO4 solution with a static potential. The wear with a load of 5 N and frequency of 1 Hz was started 600 s later. After 1 h, the wear was stopped. A total of 3600 wear cycles were performed on each sample, and the total wear distance was 64.8 m. Each tribocorrosion test was repeated three times.

2.3. Scratch Tests

The scratch test was employed to obtain the repassivation kinetics parameters of the two metals. The testing setup was the same as that in the tribocorrosion test. In the test, the sample was first passivated with a static potential for 600 s in 5 wt.% Na2SO4 solution, and then the passivated surface was scratched by the ZrO2 ceramic sphere with a load of 5 N. The scratching speed was 20 mm·s−1, and the scratching length was 2 mm. The current was recorded with a frequency of 20 Hz during the whole test.

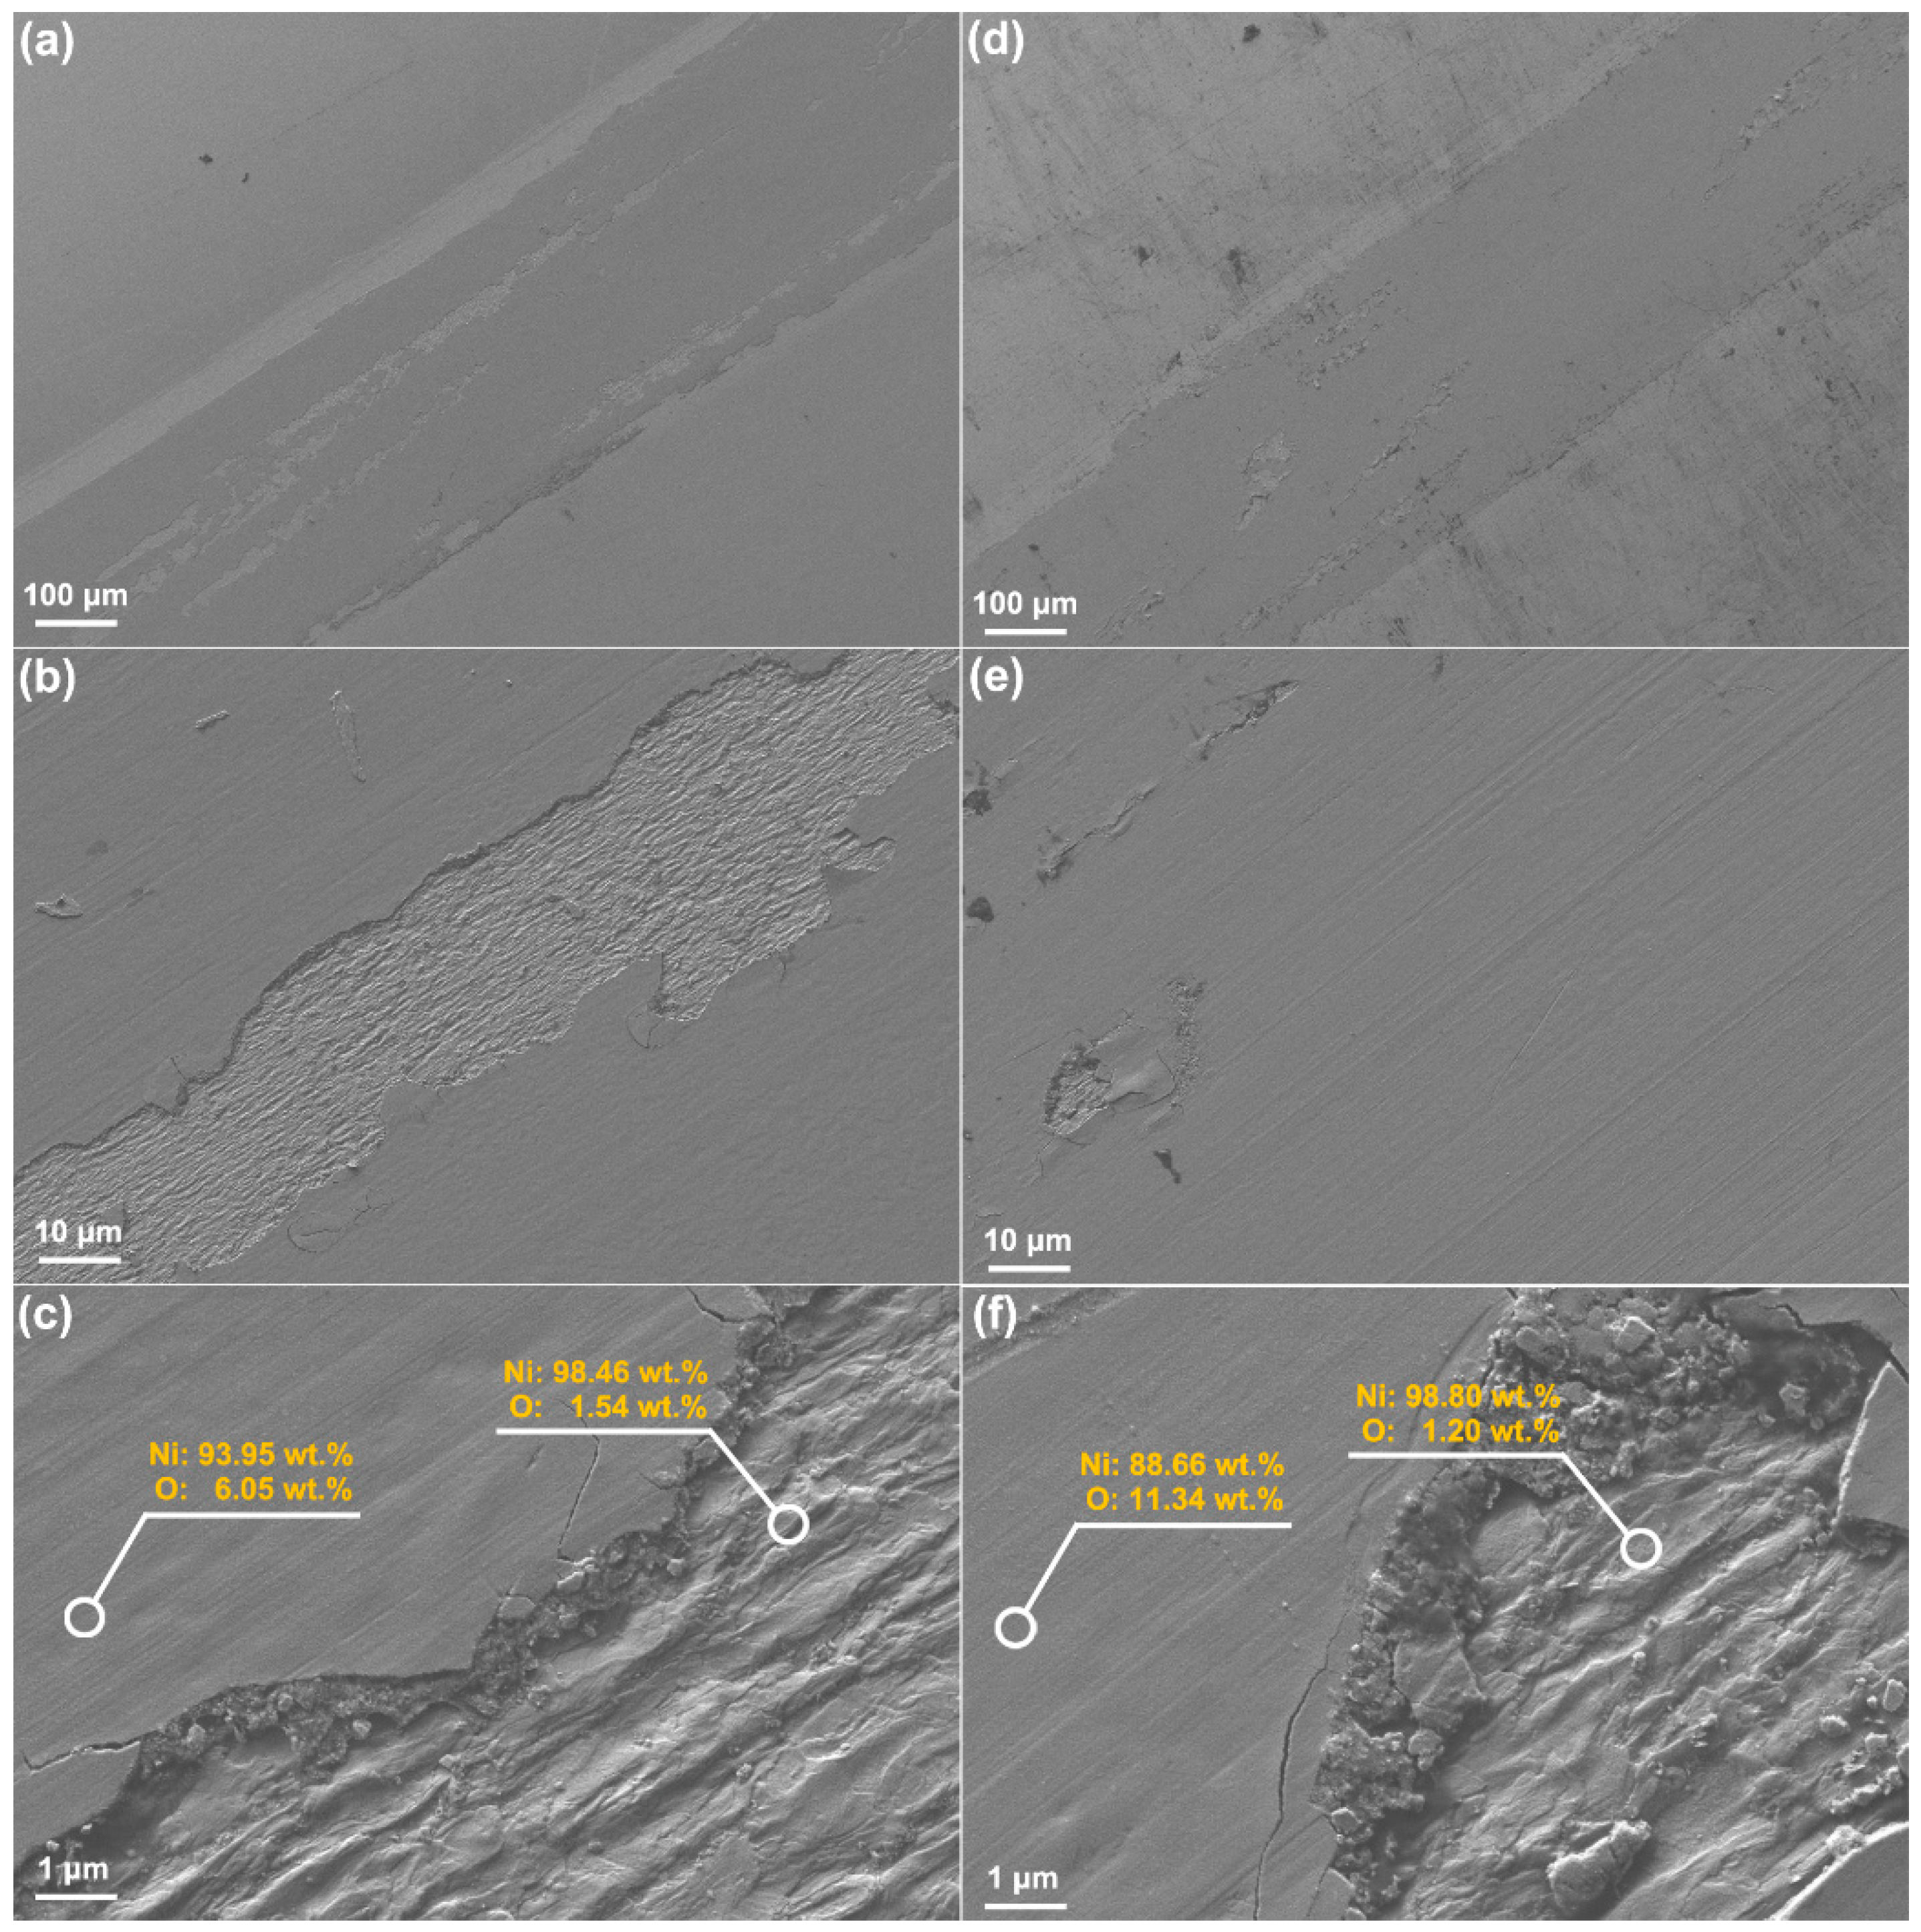
2.4. Characterisation

The wear tracks were first characterised using a white light interferometer (ContourGT-K1, Bruker, Billerica, MA, USA). The microtopgraphies of wear tracks were examined using a field emission scanning electron microscope (FESEM, SUPRA 55, Zeiss, Oberkochen, Germany). The surface chemical composition was analysed using the energy dispersive spectrometer (EDS). The cross-section of the sample was prepared by using an ultra-thin slicer (Leica EM UC7, Wetzlar, Germany). Then, it was observed in the SEM.
The semiconducting property of passive film was established by Mott–Schottky analysis [21]. The relations between the space charge capacitance and passive potential were measured. Specifically, the polished sample was first passivated at different potentials in 5 wt.% Na2SO4 solution for 1800 s, then the capacitance varying with potential was measured by using an alternating potential amplitude of 10 mV with 103 Hz and a step potential of 20 mV.

3. Results and Discussion

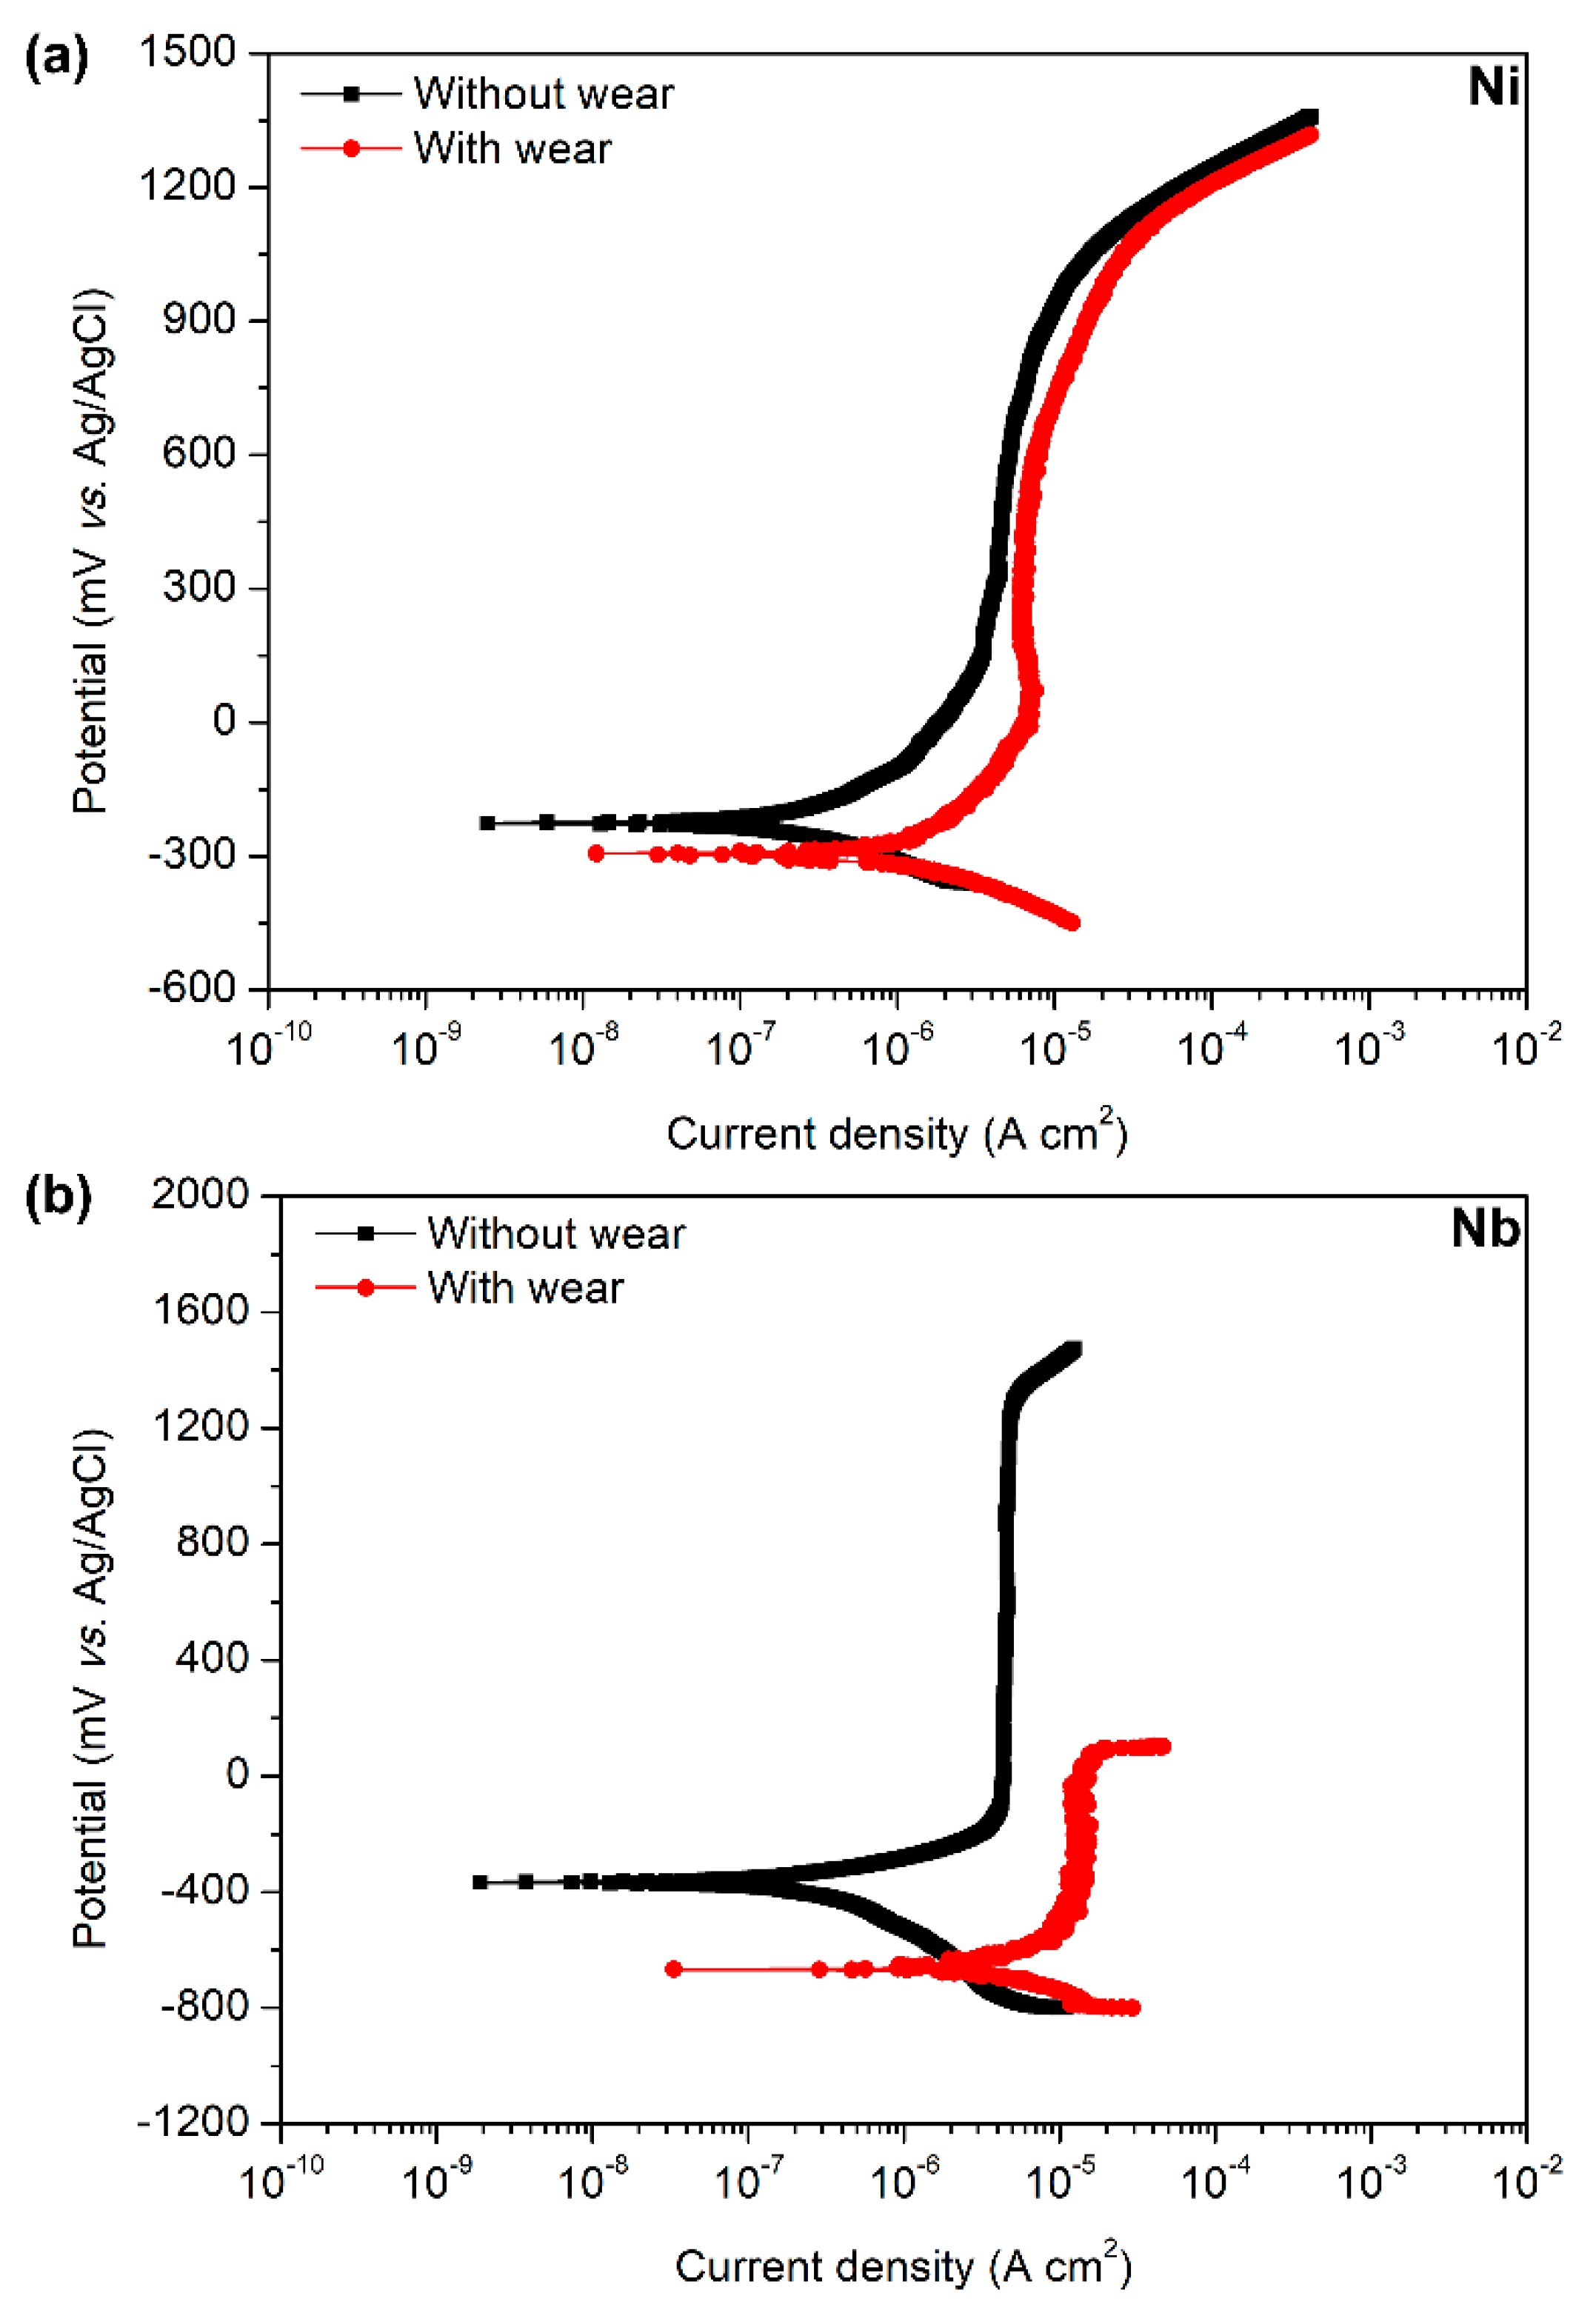
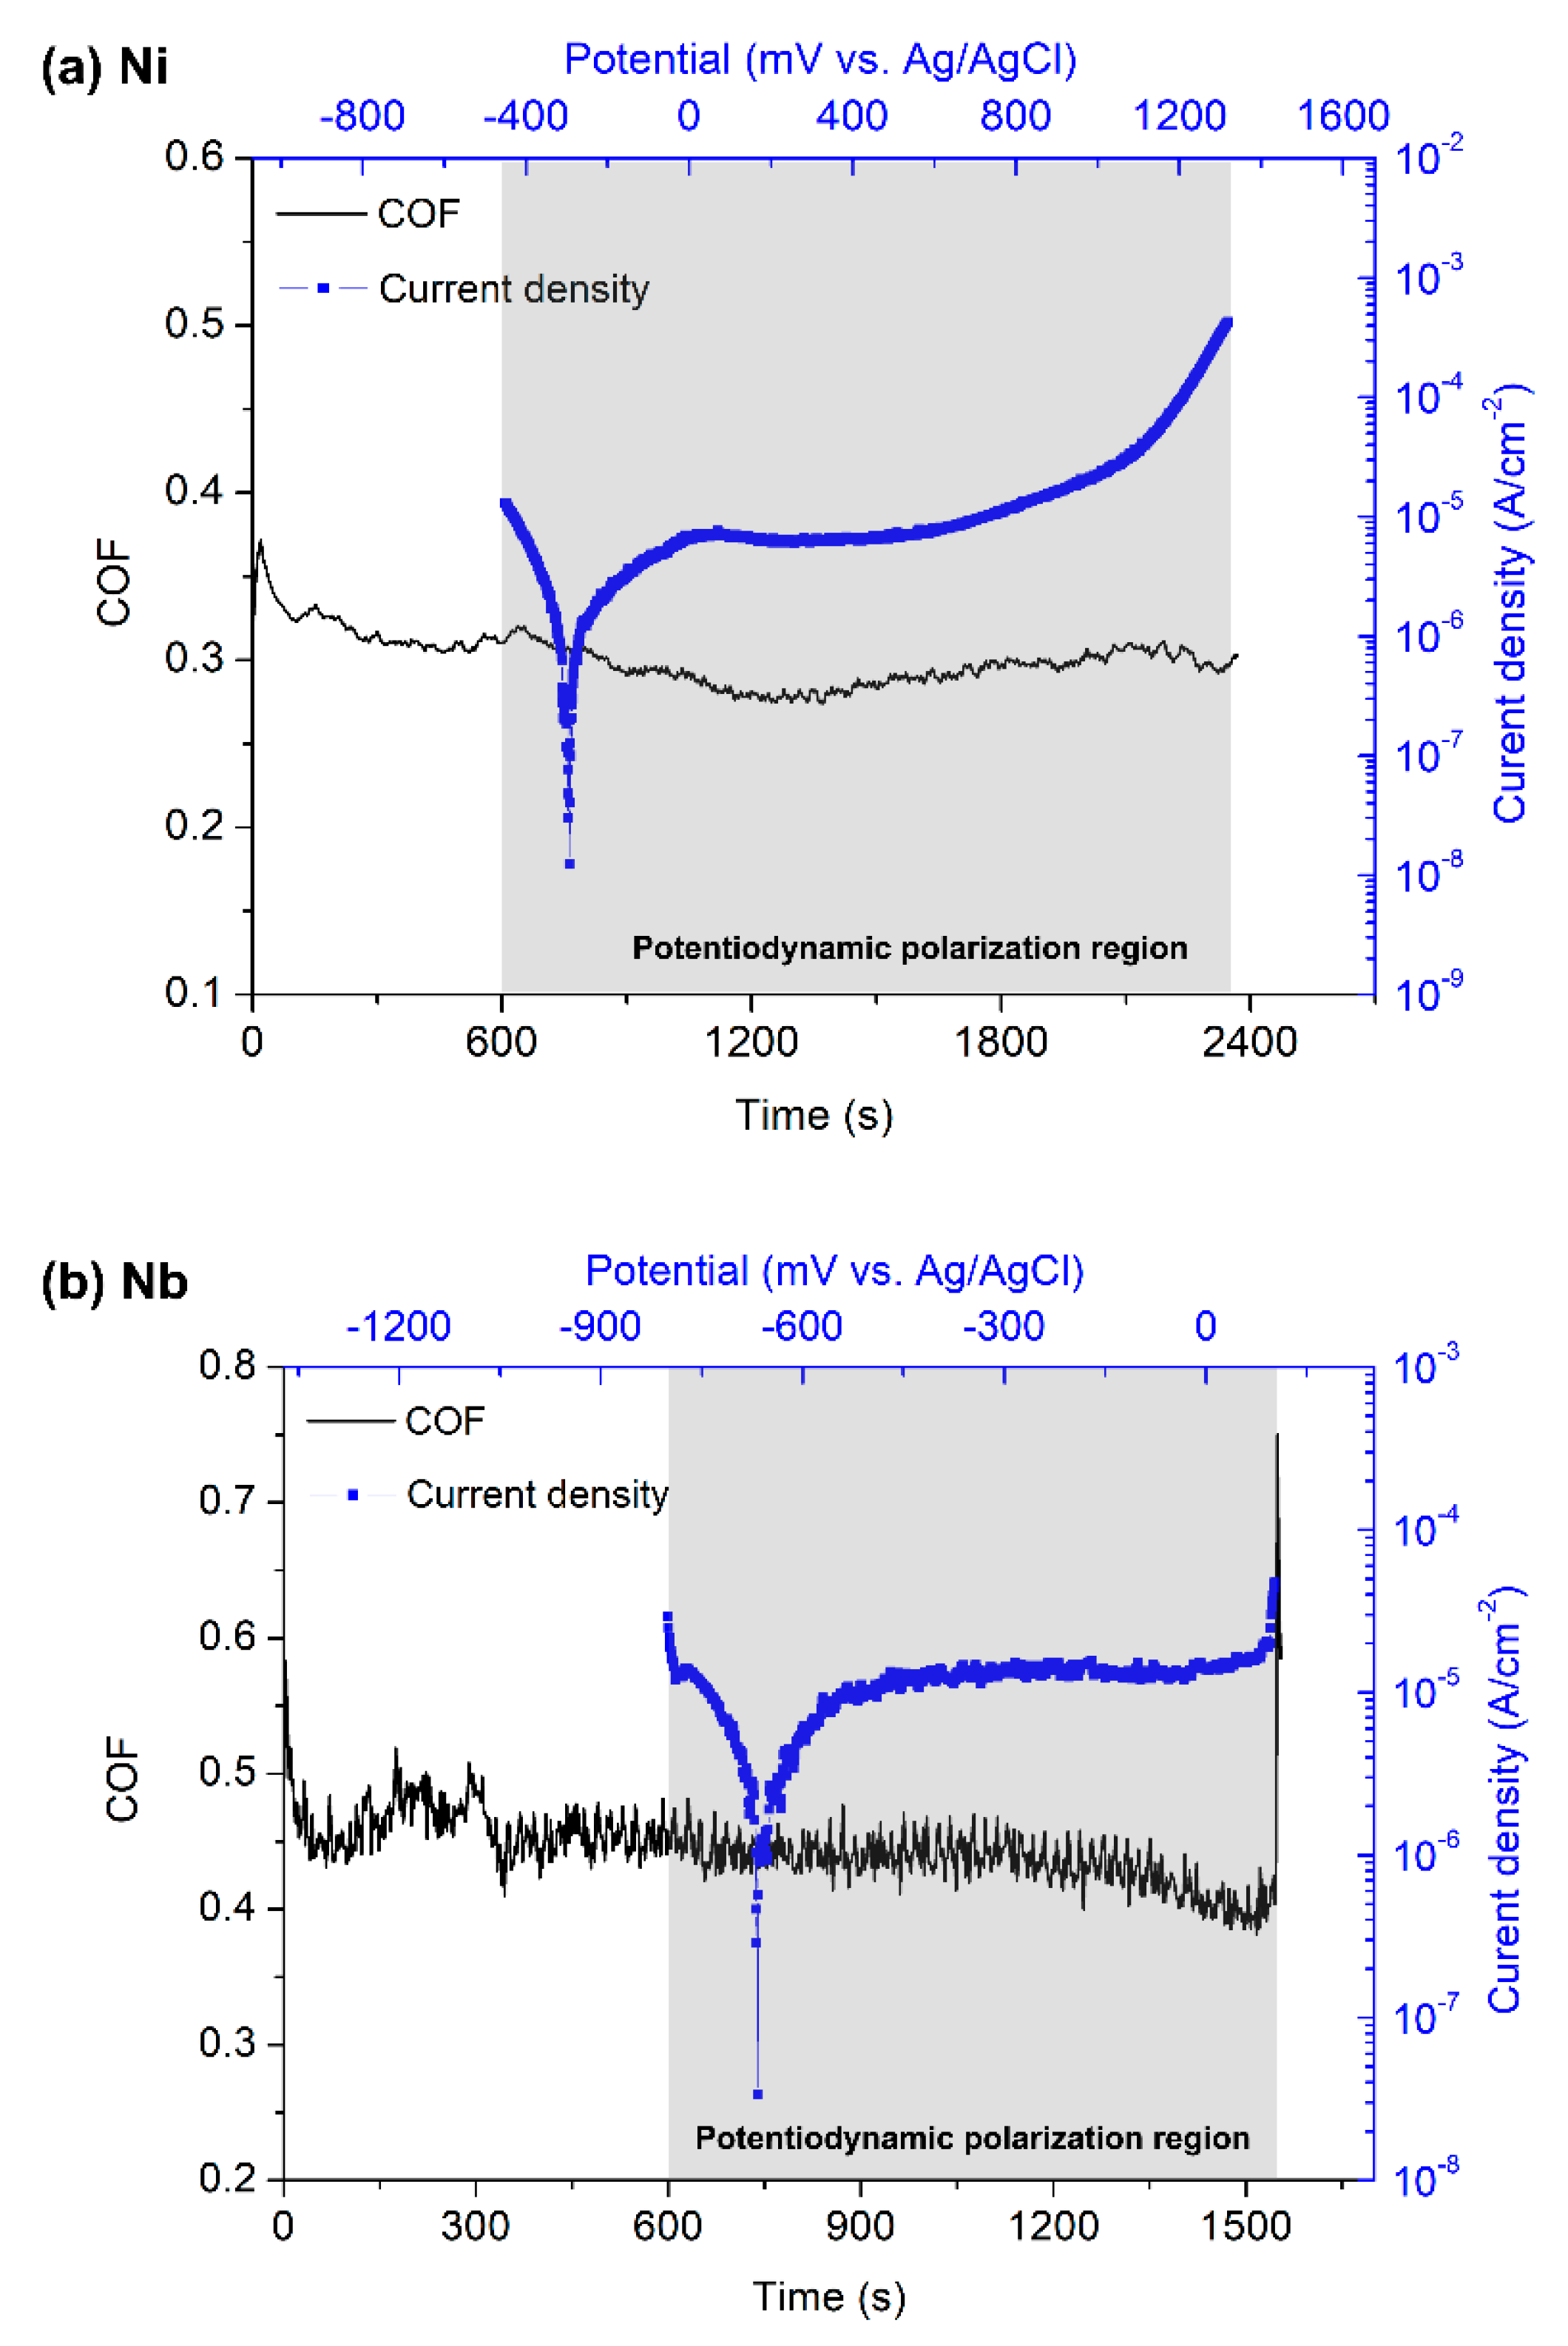
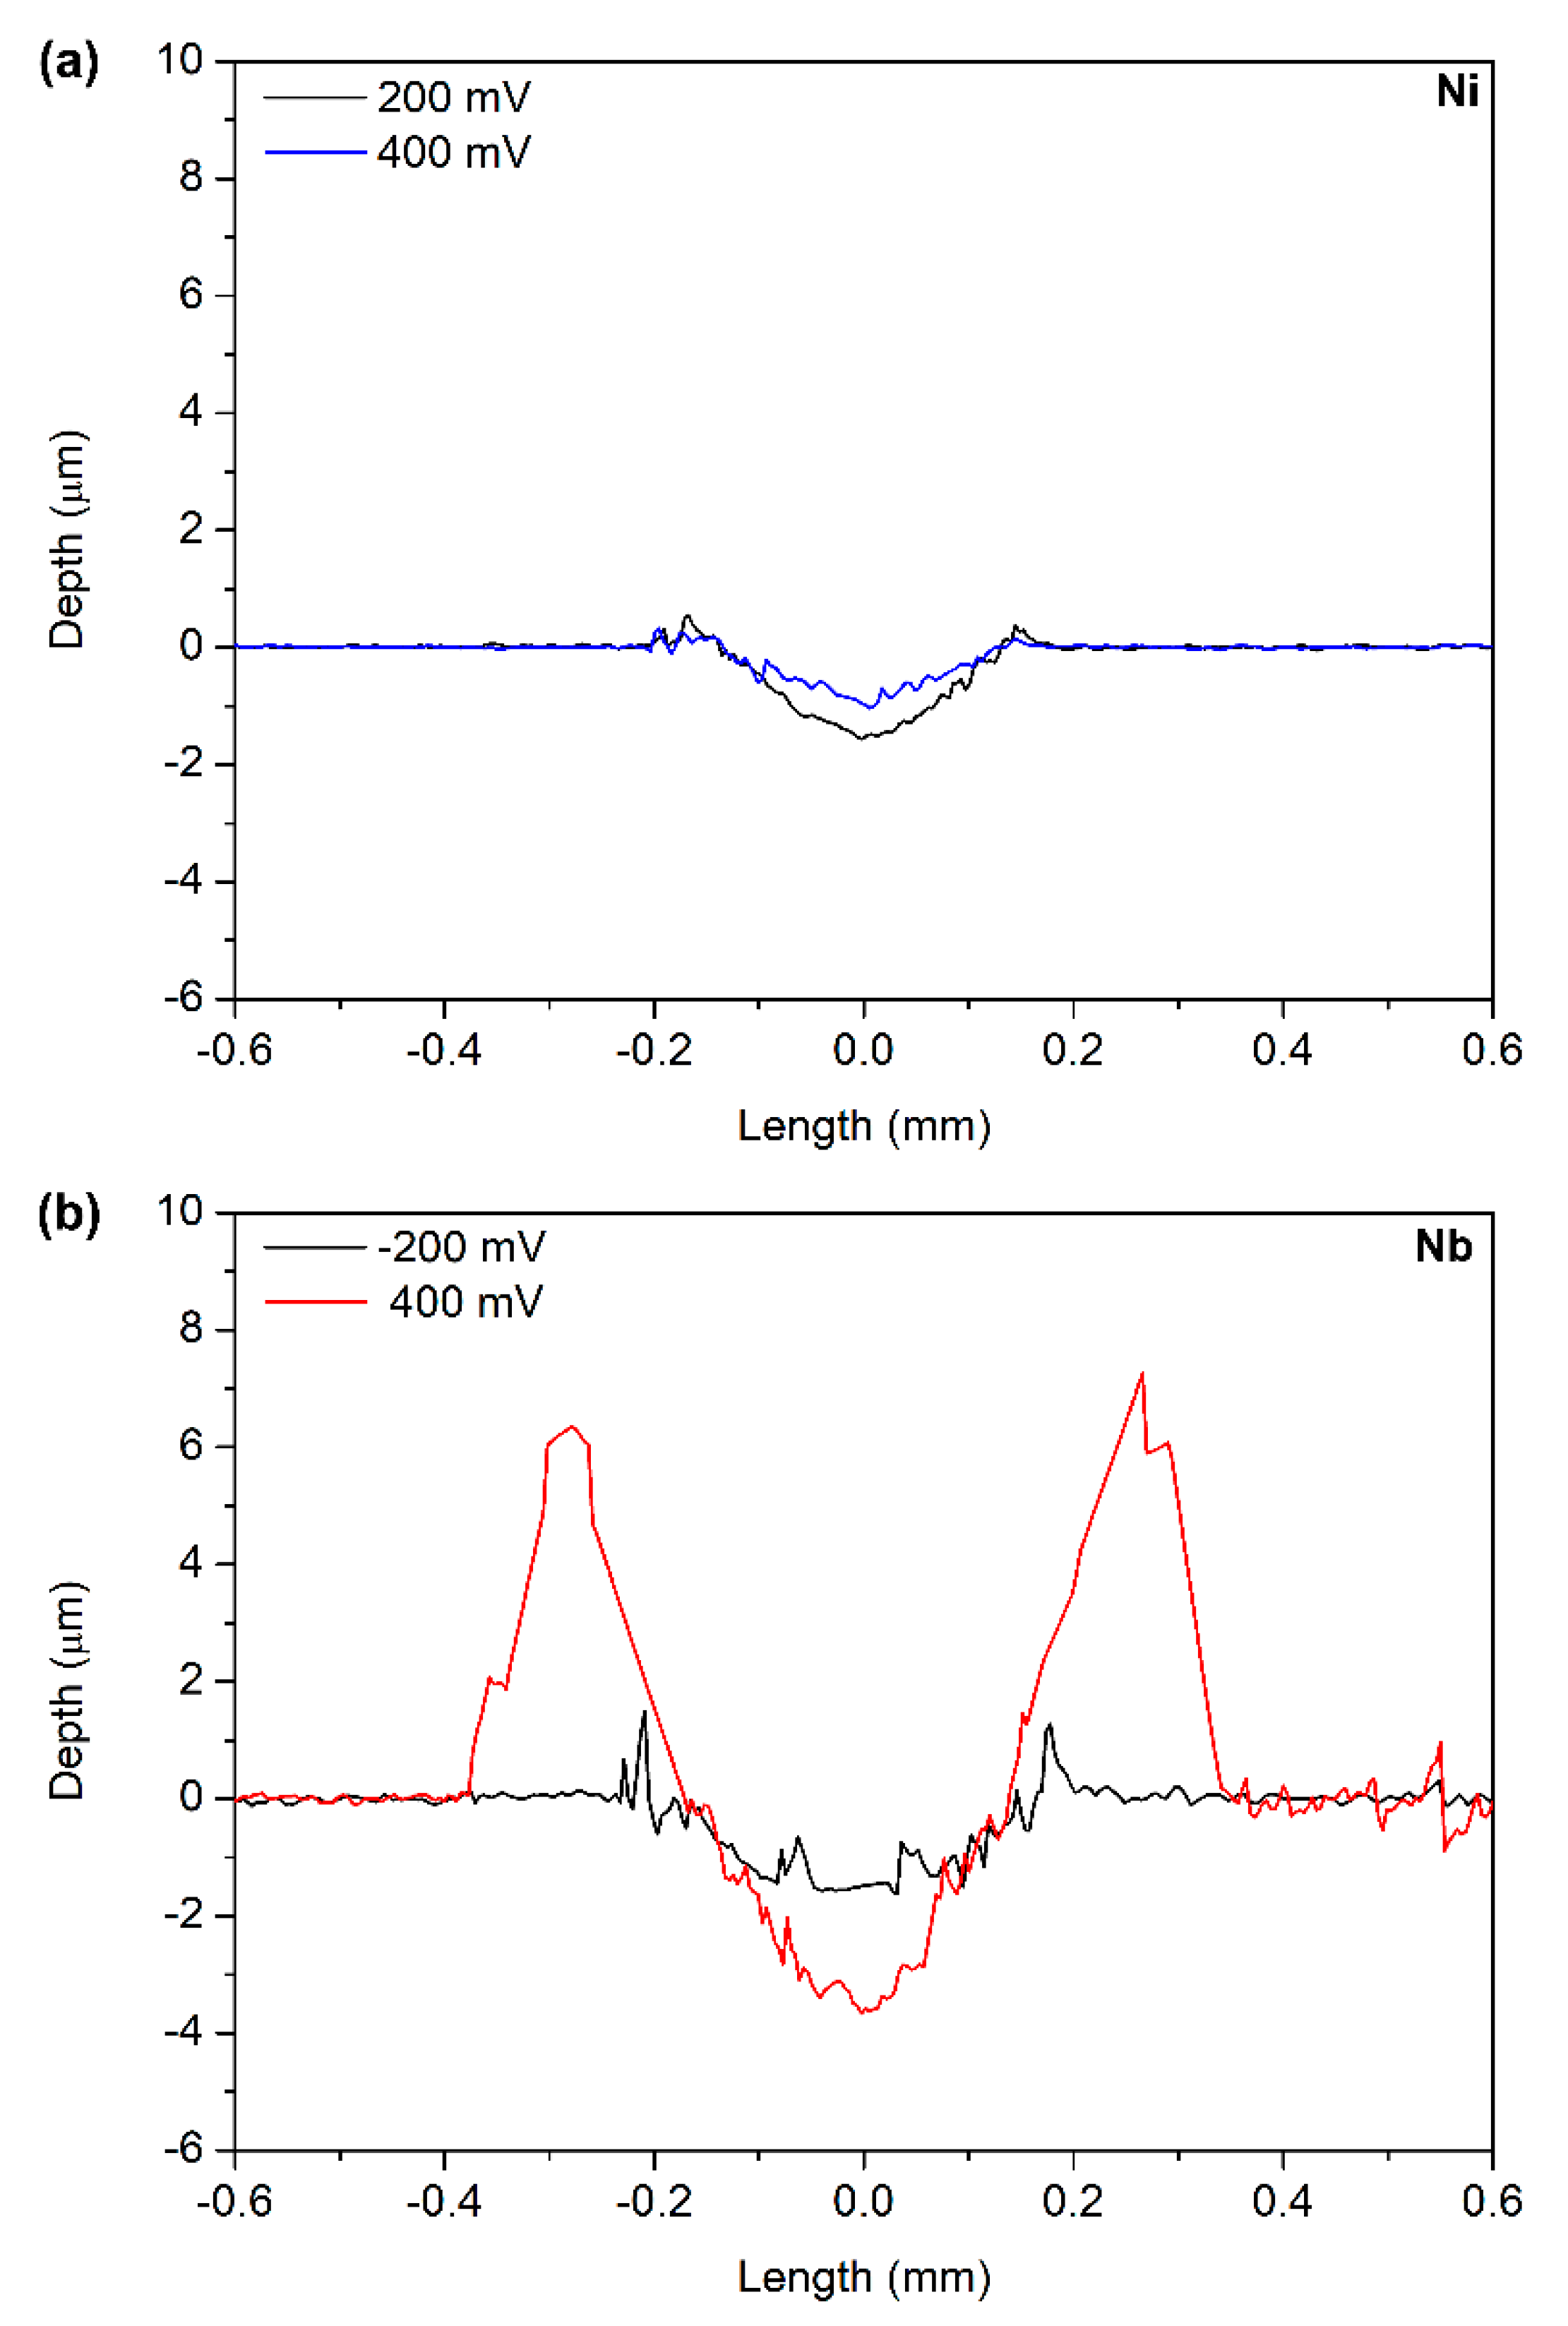
3.1. Potentiodynamic Tribocorrosion Tests (PDTTs)

In the potentiodynamic test, the electrochemical corrosion condition of the metal is controlled by applied potential. If the tribological parameters are recorded simultaneously during the polarisation test, the tribocorrosion behaviours at different corrosion conditions could be obtained [9,22,23]. Figure 2a,b show the potentiodynamic polarisation curves of Ni and Nb, respectively. The electrochemical corrosion parameters from the potentiodynamic polarisation curves are listed in Table 1. With the introduction of wear, the corrosion potential decreased, and the corrosion current and passive current increased on both metals. This was caused by mechanical depassivation. Interestingly, the breakdown potential of Nb dramatically dropped under the wear condition; however, this phenomenon did not appear on Ni. This difference was caused by the different passive film growing interface structures. The details are discussed in a later section.
The measured current in the PDTT can be considered as the sum of two partial currents [24]:
i = i w + i un - w
where i was the measured current, iw was the current originated from the wear region, and iun-w was the current originated from the un-worn region. Due to the relatively low resistance on the wear track when compared with the un-worn region, the anodic current mostly came from the wear track [25]. Thus, i was approximately equal to iw. Under the condition without wear, Ni showed typically passive characteristic. There was a wide passive region starting from ~0.15 V to ~1.00 V. With the introduction of wear, the anodic current was increased, which was called wear-accelerated corrosion, but Ni still maintained (pseudo) passive characteristic. The wear did not evidently influence the breakdown potential (Eb) of Ni. When the potentials exceeded Eb, the currents tended to be the same. This was because the passive films were electrochemically broken at Eb, and the depassivation was no longer caused by wear. On the contrary, the Eb of Nb dramatically dropped down with the introduction of wear.
Clearly, Nb showed an obviously different tribocorrosion behaviour compared with Ni at the higher potential. In order to investigate this phenomenon further, the coefficient of friction (COF) during the PDTT was analysed. Figure 3a shows the COF as the function of time on Ni, and the potential-current curve is also shown in the figure. The COF tended to be stable before the polarisation. When the polarisation scan started, the COF first increased. It may be caused by the cathodic dissolution of the passive film under the influence of cathodic potential that decreased the COF. Then, the COF continually decreased, which was caused by the lubricating effect of corrosion products [23]. In the passive region, the COF slowly increased with the increase in potential, but the COF was still lower than that in the stage before scanning. When the potential reached the breakdown potential, the COF decreased instead, which may be caused by the viscous anolyte that induced a lubrication effect [5]. These indicated that passivation on Ni was beneficial for relief wear in tribocorrosion. The influence of corrosion on the COF of Nb was different (Figure 3b). The COF slightly decreased with increasing potentials in the passive region. It indicated that the corrosion products formed on Nb also had a lubrication effect. However, when the potential exceeded ~0.08 V, which was much lower than the normal breakdown potential, the current and COF suddenly jumped. It meant that the passivation was early broken, and the synergistic effect between wear and corrosion was drastically promoted. It was predictable that the material would quickly fail under this potential.

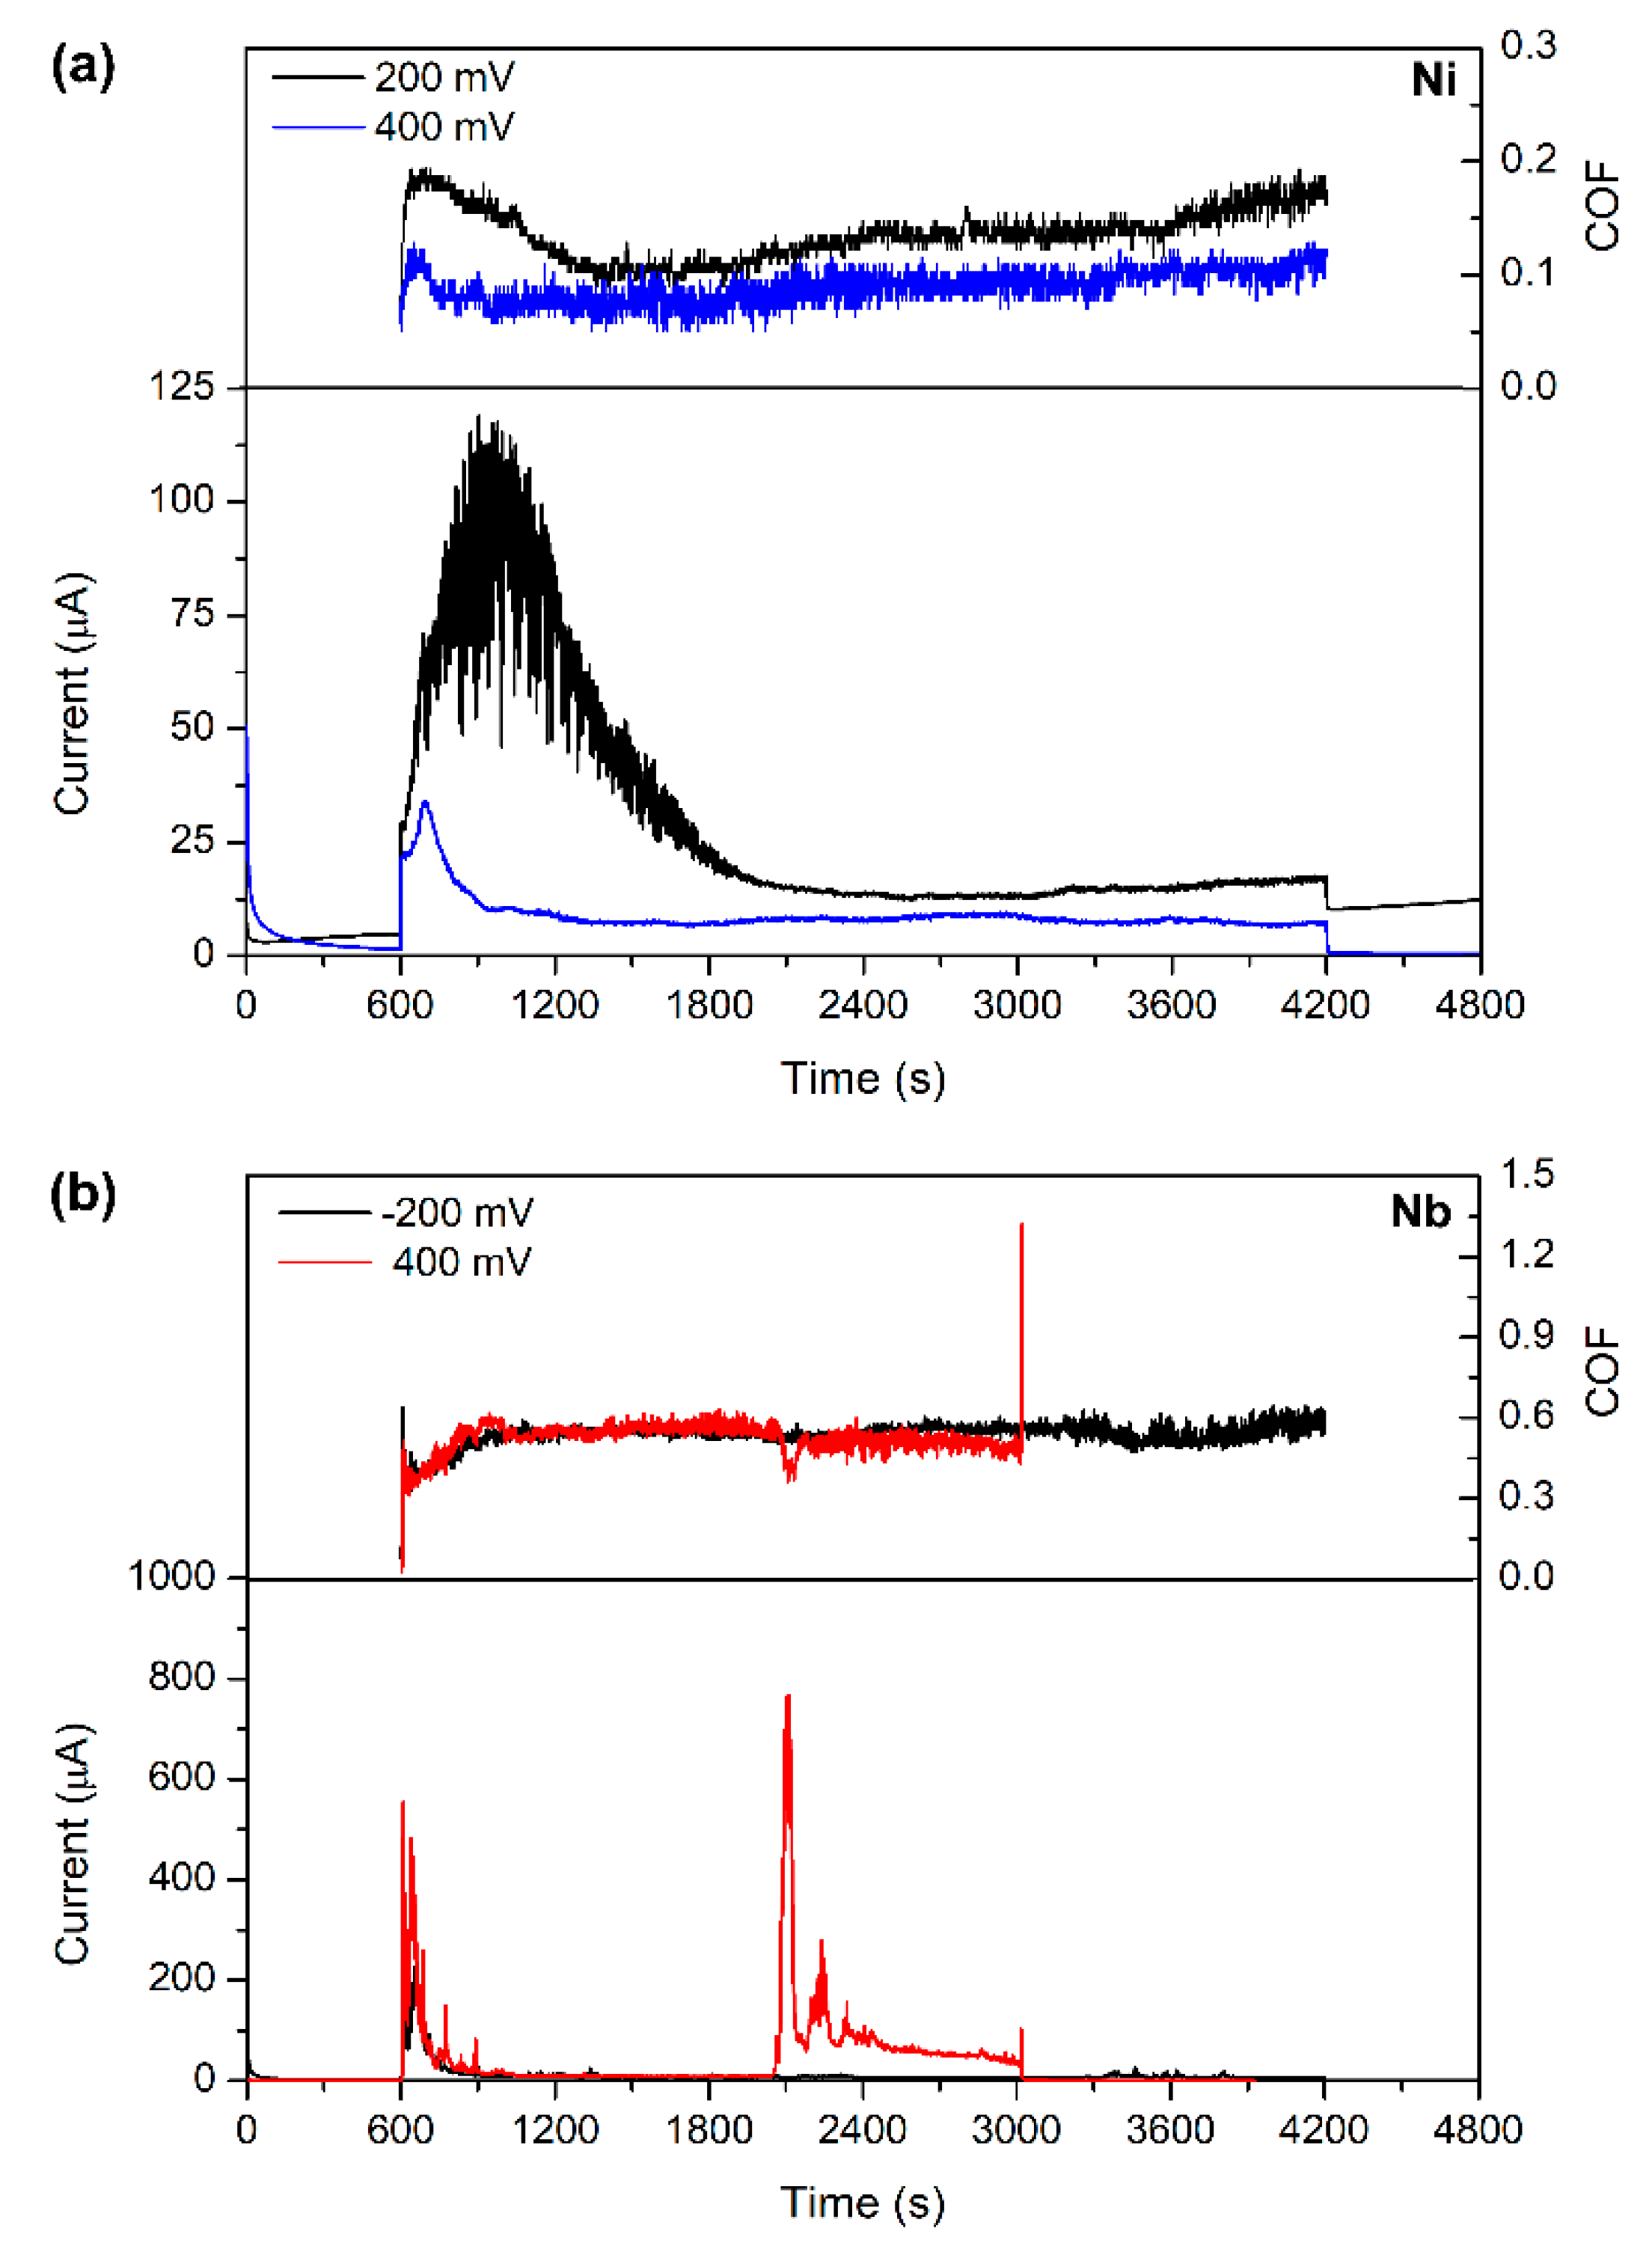
3.2. Potentiostatic Tribocorrosion Tests (PSTTs)

Based on the PDTTs results, two passive potentials were selected for each metal in the PSTTs. Figure 4a shows the currents and COF evolutions of Ni during the PSTTs under 200 mV and 400 mV. Before the wear, currents quickly dropped down and became stable due to passivation. When the wear was started, the currents jumped due to depassivation. Then, the currents continuously increased. This was caused by the widening of the wear track in the running-in stage. The currents then started to decrease due to the decrease of contact stress and the formation of tribo-film (shown later) [10]. The current at 400 mV showed quick decay and a lower value than that at 200 mV. The COF at 400 mV was lower than that at 200 mV during the whole test. These indicated that Ni had better tribocorrosion resistance at a higher potential. Figure 4b shows the currents and COF evolutions of Nb under 200 mV and 400 mV (higher than the Eb). Nb could be passivated at both two potentials before wear. Then, the currents also jumped with the beginning of wear before they started to decay. The current and COF at 200 mV showed stable evolution in the subsequent test, but some fluctuations appeared on the decaying curve at 400 mV, and the current rose drastically at about 2000 s, accompanied by a small drop of COF. Then, the current dropped down but jumped again at 3050 s. At this time, the COF sharply increased to about 1.3, which triggered the self-protection of the tribometer and led to the cease of the test. The fluctuations of current and current indicated that Nb had poorer tribocorrosion resistance at a higher potential.
Figure 5 shows the wear track profiles of Ni and Nb after the PSTTs. The total lost volume of the metals could be calculated by integrating the profiles. As expected, Ni had the shallower wear track and lower lost volume after worn at the potential of 400 mV (1.26 × 10⁻³ mm3) than 200 mV (2.17 × 10⁻³ mm3). Nb had a much wider and deeper wear track and larger lost volume after being worn at 400 mV (5.64 × 10⁻³ mm3) than 200 mV (2.72 × 10⁻³ mm3), though the test was stopped early at the higher potential. This indicated that the increase in applied potential had an opposite influence on the tribocorrosion of Ni and Nb.
Figure 6a to c were the SEM images of Ni after the PSTT with 200 mV. The worn surface was covered by a film that was formed under the combination of electrochemical and mechanical actions and called a tribo-film [26,27]. It was proved that the tribo-film was formed on the passive film [3,28]. Some scratches that were parallel to the sliding direction were found on the tribo-film. Parts of the film had been removed. The region that lost the coverage of the tribo-film showed huge plastic flow with roughness surface (Figure 6b). The EDS results indicated the surface covered or not covered by the tribo-film was all consisted of Ni and O, but the O content on the former was higher (Figure 6c). Similar microtopography was found at 400 mV, but the tribo-film was more complete (Figure 6d,e). This may be the reason why Ni showed a lower current at 400 mV during the PSTT than that at 200 mV. Further, as the potential increased to 400 mV, the compositions of the exposed substrates were similar to that at 200 mV, but the O content on the tribo-film increased. From the micro-topographies of the wear track, the wear mechanism of Ni was mainly corrosive wear. The metal was first transformed into the tribo-film and then removed.
Figure 7 shows the SEM images of Nb after the PSTT with 200 mV and 400 mV. The tribo-films also existed, and parts of them were removed. Cracks appeared under the tribo-film (Figure 7c,f). The tribo-film was more complete at the lower potential on Nb. The tribo-film was continuously removed under 400 mV that was induced by abrasion. This caused the sudden jump in current and COF during the PSTT. On the other side, the O content on the tribo-film decreased with the increase in potential. The main wear mechanism of Nb was also corrosive wear, but severe abrasion happened at 400 mV
The difference in tribocorrosion behaviour of the two metals was more obvious at the higher potential. Thus, the cross-sections of the wear tracks formed at 400 mV were observed (Figure 8). The distribution of the O element proved the existence of the tribo-films on both two metals. The tribo-film on Ni had lost the connection with the substrate. However, there was still an oxide film covered on the metal surface. It was believed that the oxide film could protect the metallic substrate from corrosion after the tribo-film was removed. Nb had a thicker tribo-film than Ni. The tribo-film also detached from the substrate, but there was no oxide film existed between the metal and the tribo-film. When the tribo-film was removed, the metal directly contacted the solution and was corroded. This could explain the fluctuations of current during PSTT.
The material loss caused by tribocorrosion could be described as the following Equation:
V t = V w + V c + V s
where Vt was the total materials loss volume, Vw was the loss caused by wear alone, Vc was the loss caused by corrosion alone and Vs was the loss caused by the synergistic effect of corrosion and wear. The Vw was obtained by the PSTT under cathodic protection potential (800 mV). The Vc was obtained by using Faraday’s law and the stably passive current before wear in the PSTTs. Figure 9 shows the contributions of corrosion, wear and their synergic effect to the total material loss of Ni and Nb under different applied potentials. Due to the higher hardness, Ni showed lower Vw than Nb under the cathodic protection potential. With the potential increased to the anodic region, Vc appeared, but it was very small compared with the other two factors and almost negligible. Vs also appeared at anodic potentials and led to the increase in total loss volumes. The synergistic effect was weakened at the higher potential on Ni, which caused the decrease in loss volume. On the contrary, the synergistic effect was obviously promoted at the higher potential on Nb, which led to a sharp increase in the total material loss.

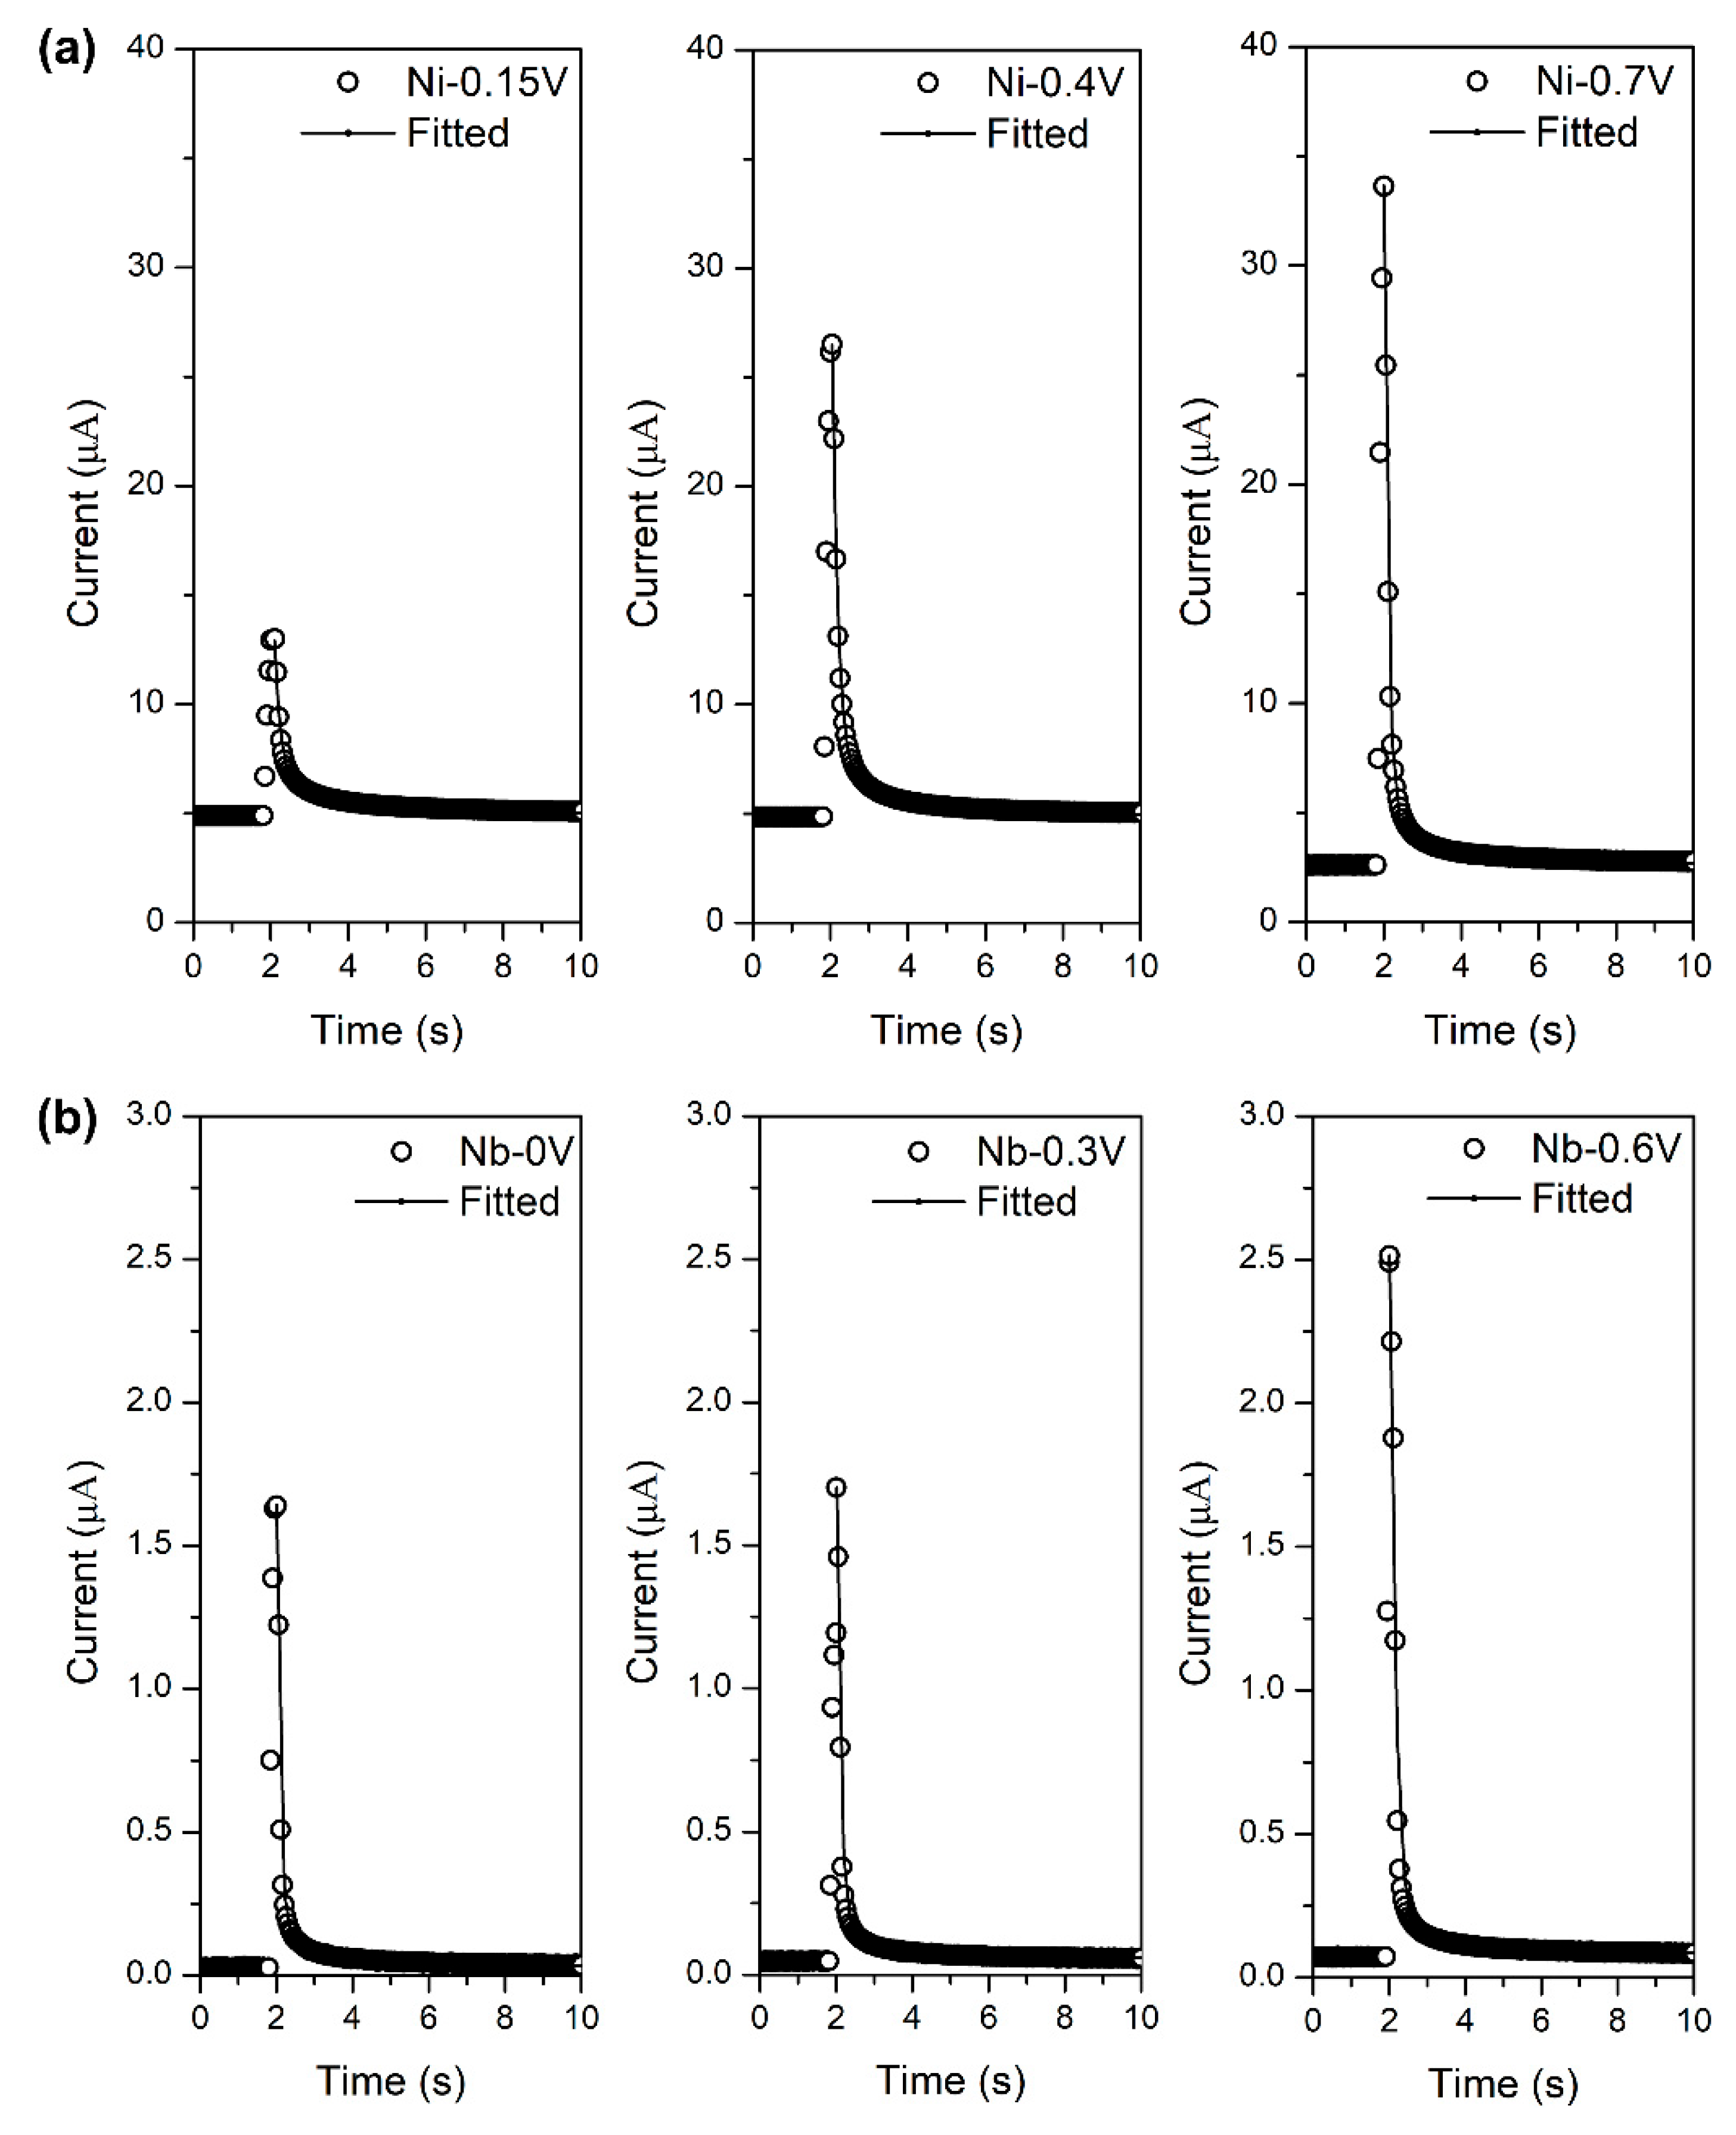
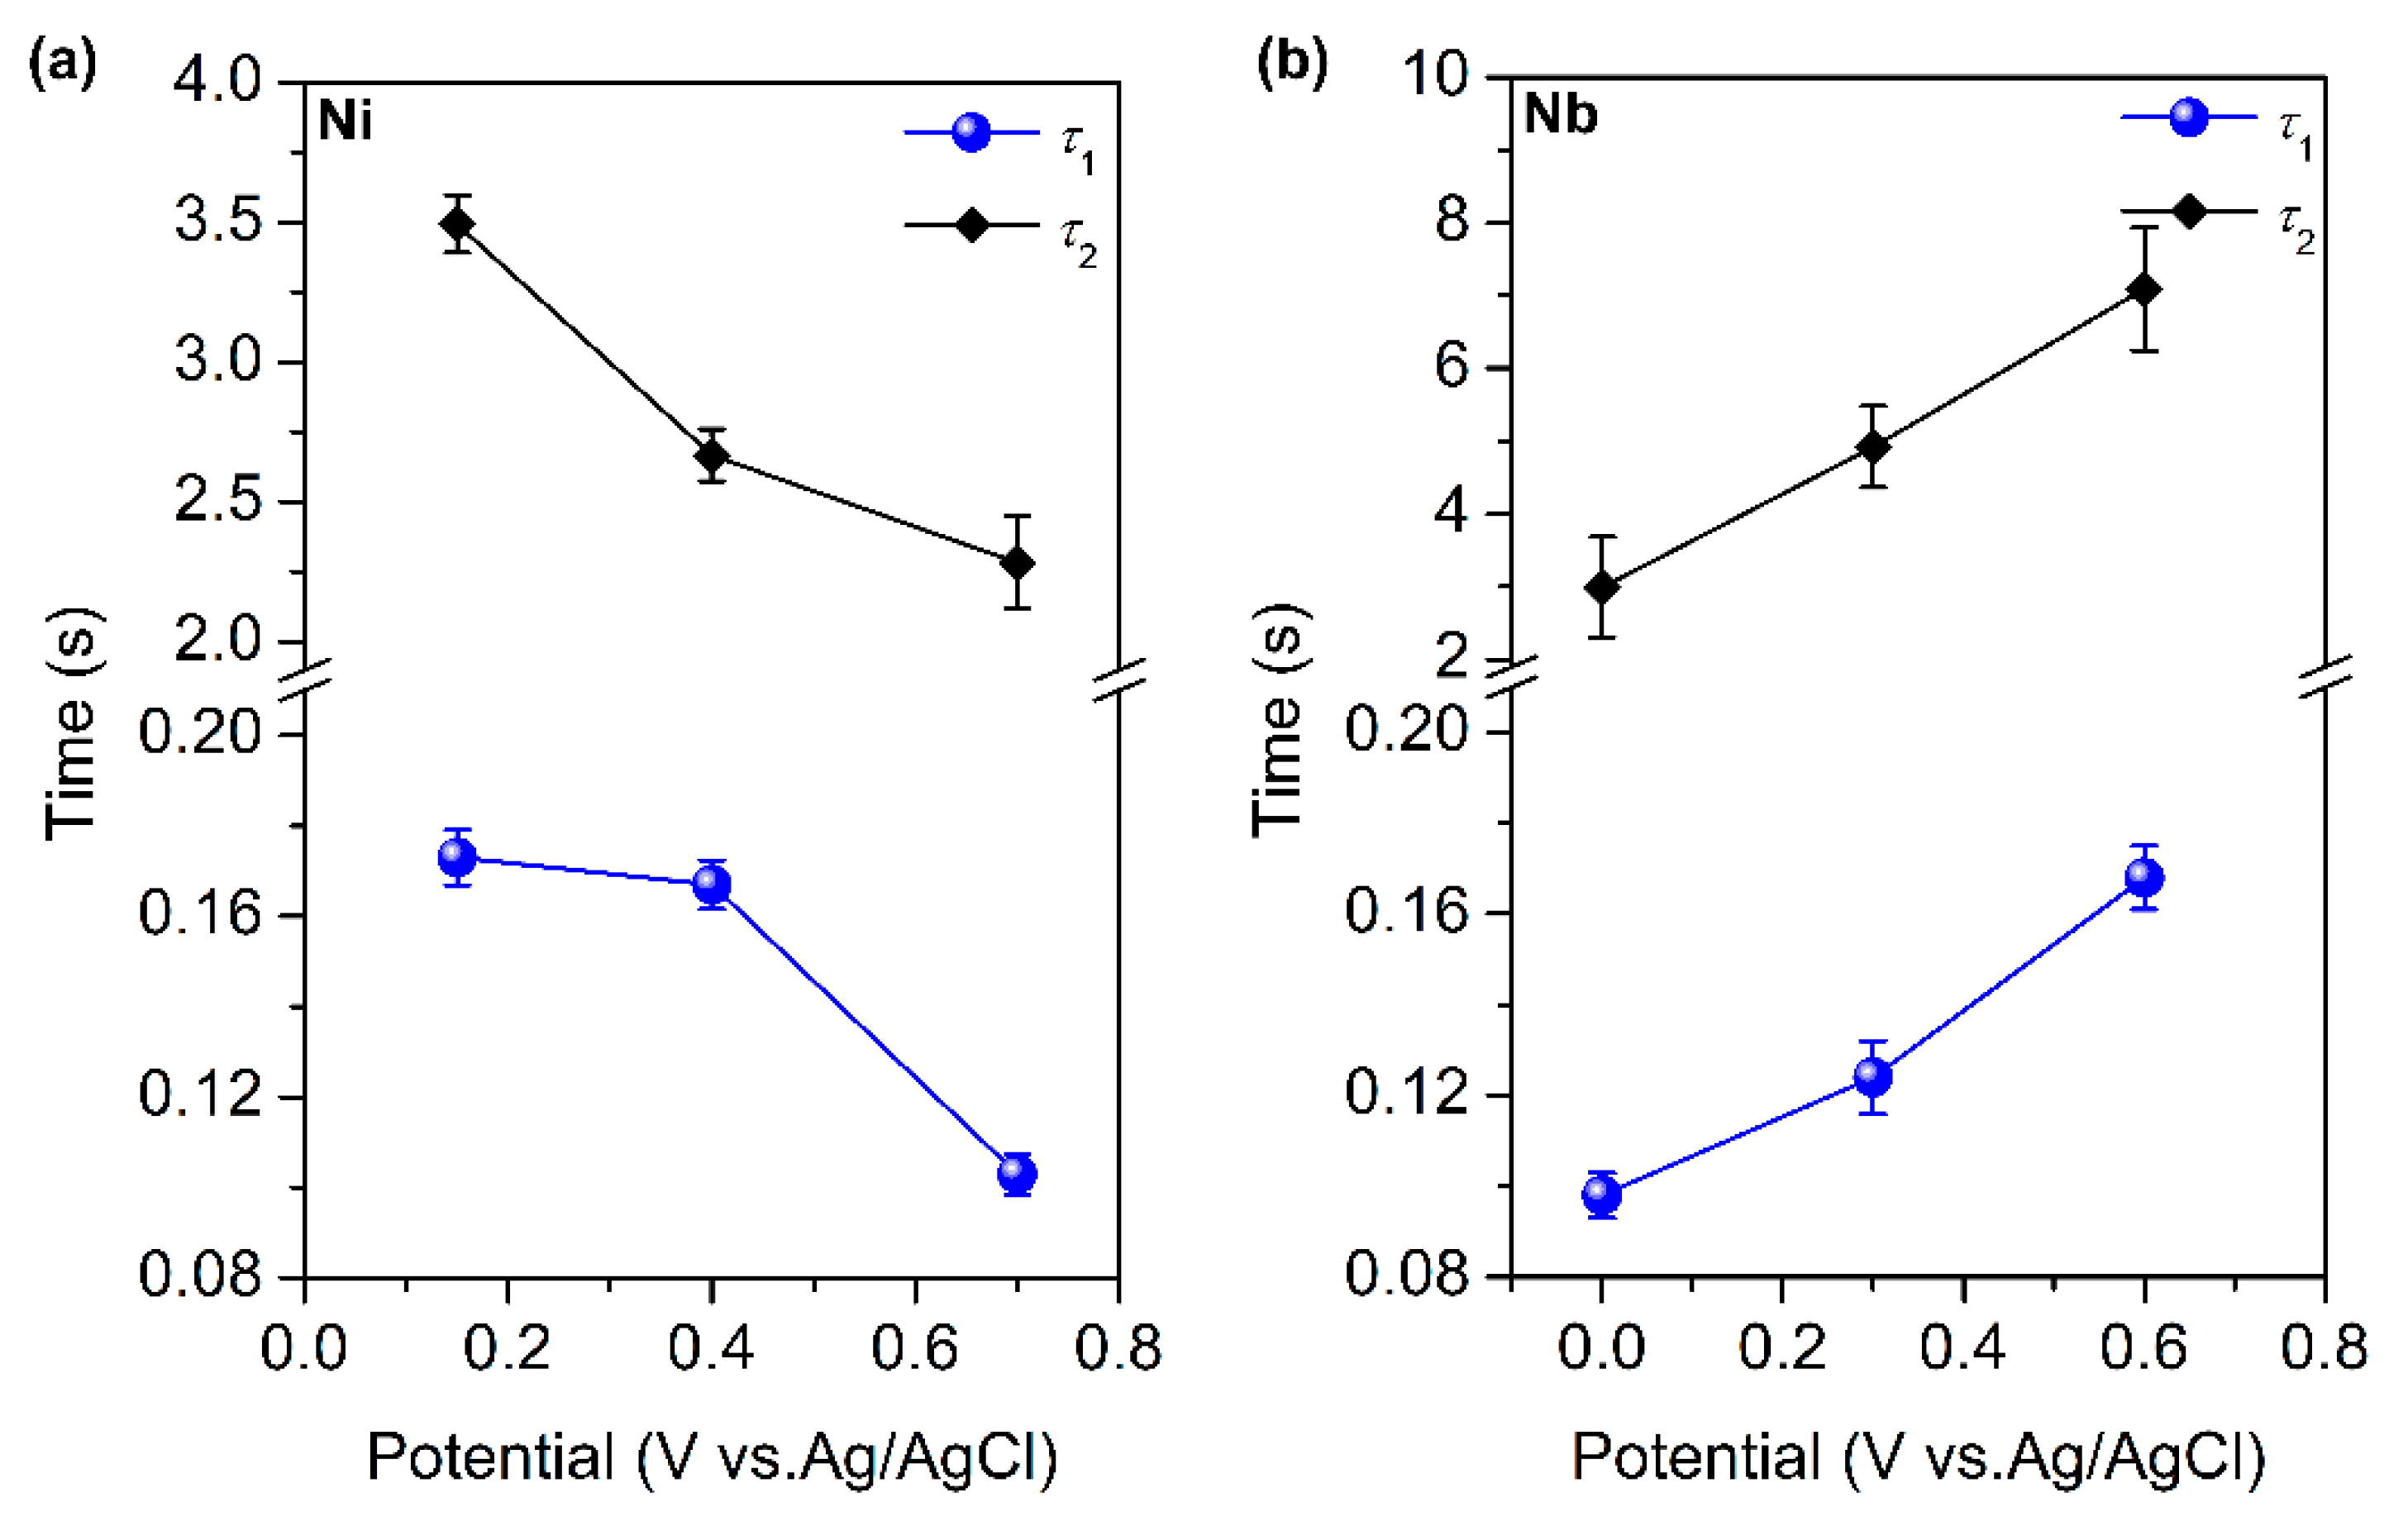
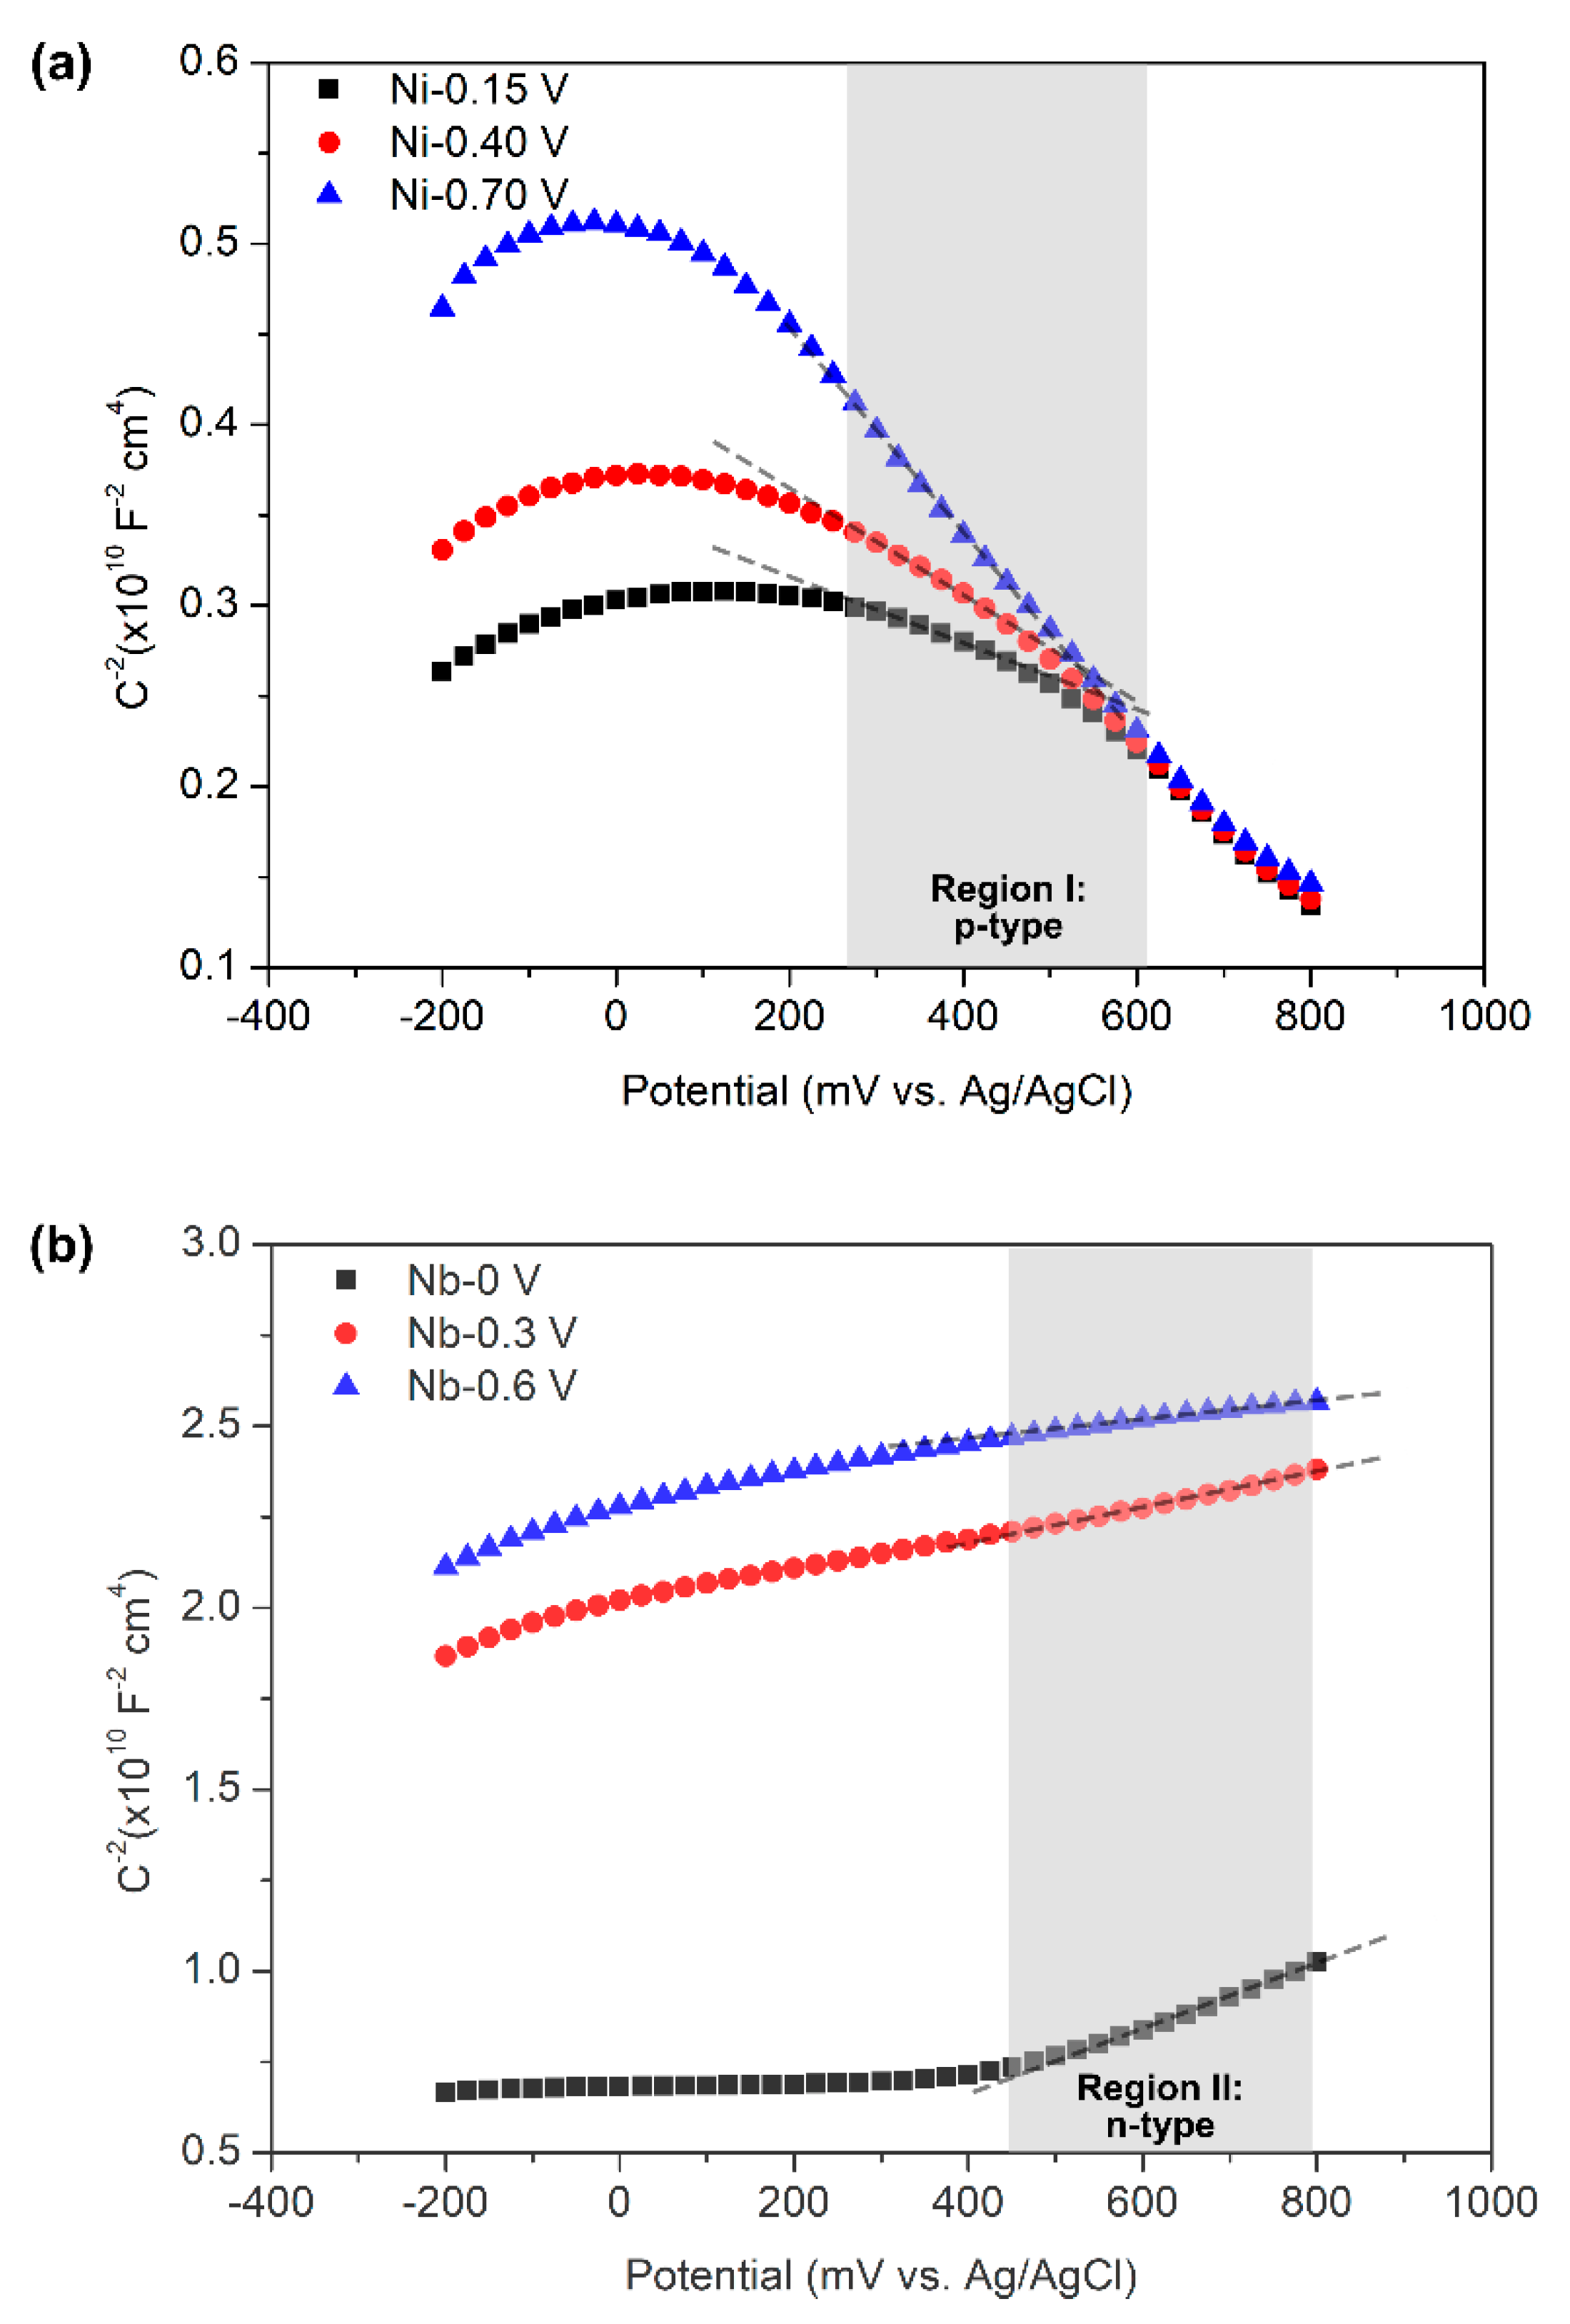
3.3. Repassivation Kinetics of Ni and Nb

Metals must have a strong repassivation ability to inhibit corrosion and synergistic effect in tribocorrosion. Repassivation rate was one of the key factors in exploring the difference in tribocorrosion behaviours between Ni and Nb. The repassivation kinetics parameters could be obtained from the scratch tests. Figure 10 showed the current curves of Ni and Nb under different passive potentials during the scratch tests. Due to passivation, Ni and Nb showed stable currents before scratching. When scratch started, all the currents sharply increased that was due to the removal of the passive films and the subsequent anodic dissolution of the active metal surfaces. The peak values of the current curve increased as the potential increased on both two metals. This was caused by the increase in thermodynamic driving force at the higher potential, which accelerated the dissolution of the metals. After scratching, the currents quickly dropped down due to repassivation.
In order to obtain the detailed repassivation kinetics parameters, the bi-exponential decay law was used to fit the current curves in the decaying stage. This law was widely and successfully used to describe the repassivation kinetics of passive metals and alloys [29]. The law can be expressed as the following equation:
i = i s + i 1 e x p t τ 1 + i 2 e x p t τ 2
where is is the stably passive current before scratch, the second term relates to the quickly decaying process induced by the formation of the first monolayer passive film on the scratched region, and the third term relates to the slowly decaying process induced by the continuing growth of the as-formed monolayer passive film. The i1 + i2 = ipeak, where ipeak is the peak value of the current. The τ1 and τ2 are the decay constants that reflect the repassivation rate in the two growth stages. The bi-exponential decay law showed good fits to the repassivation current curves (solid lines in Figure 10). The fitting results are shown in Figure 11. Clearly, τ1 was much shorter than τ2 because the first stage of repassivation only involved the dissolution of metal and subsequent formation of a monolayer oxide film. The film then continuously grows at a relatively slow rate due to the inhibition of mass and electron transmission by the as-formed film. More importantly, when the applied potential increased, the τ1 and τ2 on Ni were both decreased but were increased on Nb. It indicated that Ni needed a shorter time to recover passivation at the higher potential, whereas Nb needed more time.
It could be assumed that if the repassivation time were longer than the frictional interval, it would be hard for the metal to maintain passivation during the tribocorrosion test. In the PDTTs and PSTTs, the frictional interval was 0.5 s. The longest τ1 of Ni measured in the scratching tests was ~0.17 s at 0.15 V, and the τ1 was decreased with the increasing potential. Thus, Ni had enough time to form the first monolayer passive film, and the film continuously grew for a while. In other words, Ni could partially recover passivation during the tribocorrosion tests. This was helpful for inhibiting the wear-accelerated corrosion (protection effect) and lowering the COF (lubricating effect).
Looking back to Nb, though it needed more time to recover passivation at the higher potential, the τ1 values were still shorter than the frictional interval. This indicated that the first monolayer passive film was formed, and the film could also continuously grow during the tribocorrosion tests. However, Nb lost passive characteristic at ~0.08 V in the PDTT (Figure 2b). At this potential, the repassivation time of Nb was even shorter than that of Ni. In the PSTT with the applied potential of 400 mV, Nb also had time to reform passive film. However, the current fluctuated wildly during the decaying process, and the decayed current jumped again in the following test (Figure 4b). The repassivation kinetics could not explain this phenomenon. On the other side, the passive film was protected by the tribo-film from wear in the later period of the PSTT. Thus, the passive film would not be frequently broken. These indicated that the repassivation rate was not the key factor causing the difference in tribocorrosion behaviour between Ni and Nb.

3.4. Effect of Growing Mechanism of Passive Film on Tribocorrosion

Based on the above section, the properties of the passive film and its upper tribo-film became the focus of attention. They had a close relation to the growing mechanism of the passive film. The PDM was introduced to describe the passive film/metal interface structure. The PDM was prosed to describe the growth of passive film formed on reactive metals in contact with a corrosive environment [15]. Figure 12 is the reaction scheme of the PDM. After the quick formation of the first monolayer passive film, the continuous growth of film depends on the diffusion of ions and vacancies crossing the previously formed film. In the film growth process, there are vacancies (cation vacancy and oxygen vacancy) formed in the film; thus, the cations and anions can diffuse over the vacancies in the lattice or grain boundaries. The vacancies were annihilated in the diffusion, and then the film was thickened.
In reality, there are two different growth mechanisms: outward cation diffusion dominated growth, and inward anion diffusion dominated growth [14,16]. In order to confirm the growth mechanism of passive film on Ni and Nb, Mott–Schottky analysis was used. Some passive films showed semiconducting properties due to the existence of crystal defects in the film, such as vacancies [30,31]. According to the PDM, the growth of passive film involved the emergence and annihilation of vacancies. Thus, the semiconducting properties of passive films could be investigated by the Mott–Schottky theory. According to the Mott–Schottky theory, when the carriers are depleted by the potential, the space changer capacitance (C) has a relationship with the potential (E) by the following equations [32]:
1 C 2 = 2 ε 0 ε r e N D A 2 E E f b k T e   for   n - type   semiconductor
1 C 2 = 2 ε 0 ε r e N A A 2 E E f b k T e   for   p - type   semiconductor
where ε0 is the vacuum permittivity, εr is the dielectric constant of the passive film (εr = 11.9 for NiO, εr = 35 for Nb2O5), e is the electron charge, ND and NA stand for the donor and acceptor concentration for the n-type and p-type semiconductors, respectively. A is the exposed area of the metal to the solution. Efb, k and T represent the flat band potential, Boltzmann constant and absolute temperature, respectively. Figure 13a showed the Mott–Schottky measurement results of the passive films formed on Ni under different potentials. The linear data showed a negative slope (region I) that indicated the passive films had p-type semiconducting properties, and the cation vacancies acted as acceptors [29]. It meant the growth of passive film on Ni was dominated by cation diffusion. The dominant defects in the passive film were oxygen vacancies that acted as donors and made the passive film showed n-type semiconducting characteristics (Figure 13b) [33]. Therefore, the growth of passive film on Nb was dominated by the inward anion diffusion process.
The acceptor concentration in p-type semiconductors and the donor concentration in n-type semiconductors could be obtained by fitting the linear data (dash lines in Figure 13). Figure 14 shows the fitting results. The passive film formed at the higher potential on Ni had the lower acceptor (cation vacancy) concentration that was consistent with a previous report [30], and the passive film formed at the higher potential on Nb had the higher donor (oxygen vacancy) concentration.
Unlike normal semiconductor materials, such as Si, the semiconductivity of passive film could not be obtained by doping other elements. It must rely on the existence of cation/oxygen vacancies in oxide. Thus, the cation/oxygen vacancies can only be formed in the growth process of the passive film. The cationic and anionic diffusion-dominated growth mechanisms are opposite to some degree. If one of the mechanisms could not dominate the growth, yet the number of cation or oxygen vacancy was not larger than another vacancy, the passive film would not show semiconductivity. Essentially, the formation of cation or oxygen vacancy is dependent on the movement of cation and anion. The unmatched diffusion rates of the cation and anion result in the formation of vacancies in the passive film. Based on these, the defect type is linked to passivation kinetics. Further, the ion diffusion rate was accelerated by the increasing potential (electric field). For the cationic diffusion-dominated growth (Ni), the high potential could promote the diffusion of cation, which can occupy the cation vacancies at the film/solution interface to form a passive film. This was proved by the scratch tests, which demonstrated that Ni needs a shorter repassivation time at a higher potential (Figure 11). However, for the anionic diffusion dominated growth (Nb), though the higher potential accelerated the diffusion of the anion (oxygen), the accelerated diffusion of cation made lots of oxygen vacancies in the metal/film interface. The anion must first cross the as-formed film, then occupy the anion vacancies to grow the film. However, due to the unmatched diffusion rates, the number of anion vacancies was increased at a higher potential (Figure 14).
Figure 15a shows the schematic illustration of the interface structure of growing passive film and its upper tribo-film on Ni during tribocorrosion. It could be seen that the passive film will grow at the passive film/tribo-film interface, and the cation vacancies concentrate in the interface [14,16]. This may weaken the adhesion between the passive film and the tribo-film, but the adhesion between the passive film and the metal was not affected. On the other side, the substrate of Ni showed plastic flow under the tribo-film. It indicated that the substrate could coordinate the deformation of the tribo-film [34]. This was beneficial to the tribo-film to bond with the metal substrate. Further, the passive film formed at the higher potential had a lower cation vacancy concentration (Figure 14a). This indicated that the adhesion between the passive film and the tribo-film was stronger at a higher potential; thus, the tribo-film was more difficult to be removed. At the same time, the adhesion between passive film and metal was not affected by the increasing potential. There was evidence that a thin oxide layer existed between metal and the tribo-film from the SEM image of the cross-section (Figure 8a). These were beneficial for Ni to resist mechanical depassivation. This could be proved by the fact that the Ni showed a more complete tribo-film at a higher potential in the PSTTs. Thus, Ni showed lower material loss volume at a higher potential. In the PDTTs, the passive film was harder to be removed, and the repassivation rate was faster at the higher potential; thus, Ni also maintained the (pseudo) passivation.
Figure 15b shows the interface structure of the growing passive film and its upper tribo-film on Nb. The passive film grows at the passive film/metal interface [14,16,35]. If the oxygen vacancies could not be annihilated in time, they would cumulate in the interface, which weakens the adhesion between the passive film and the metal. Further, the substrate of Nb under the tribo-film did not show good plastic deformation properties because some cracks appeared. The metal substrate may not coordinate the deformation of the tribo-film that led to the detaching of the tribo-film. On the other side, the passive film formed at the higher potential had a higher oxygen vacancy concentration; thus, the passive film and its upper tribo-film were more easily to be removed from the metal by frictional shear stress. During the PDTTs, when the potential was increased to the threshold value, the passive film with weak adhesion may be completely removed, which led to the sharp decrease in Eb. In the PSTT on Nb, decaying current and COF fluctuated greatly at the higher applied potential (Figure 4b). This may be caused by the accumulation of oxygen vacancies with a high concentration in the passive film/metal interface. When the adhesion between passive film and metal decreased to the threshold, the passive film and its upper tribo-film were completely removed. This could be proved by the cross-section image of the worn surface (Figure 8b) that the passive film and its upper tribo-film were completely detached from the metal substrate. Finally, the large detached tribo-film led to abrasion and a sharp increase in COF [36]. The synergistic interaction between corrosion and wear was dramatically promoted in this situation. As a result, Nb showed a larger lost volume at a higher potential.

4. Conclusions

Tribocorrosion behaviours of Ni and Nb in Na2SO4 solution under potentiodynamic and potentiostatic conditions were studied. By comparing the tribocorrosion behaviours and repassivation kinetics parameters of the two metals at different applied potentials, observing the surface/interface of the worn region and testing the semiconducting properties of passive films, the following conclusions could be drawn:
(1)
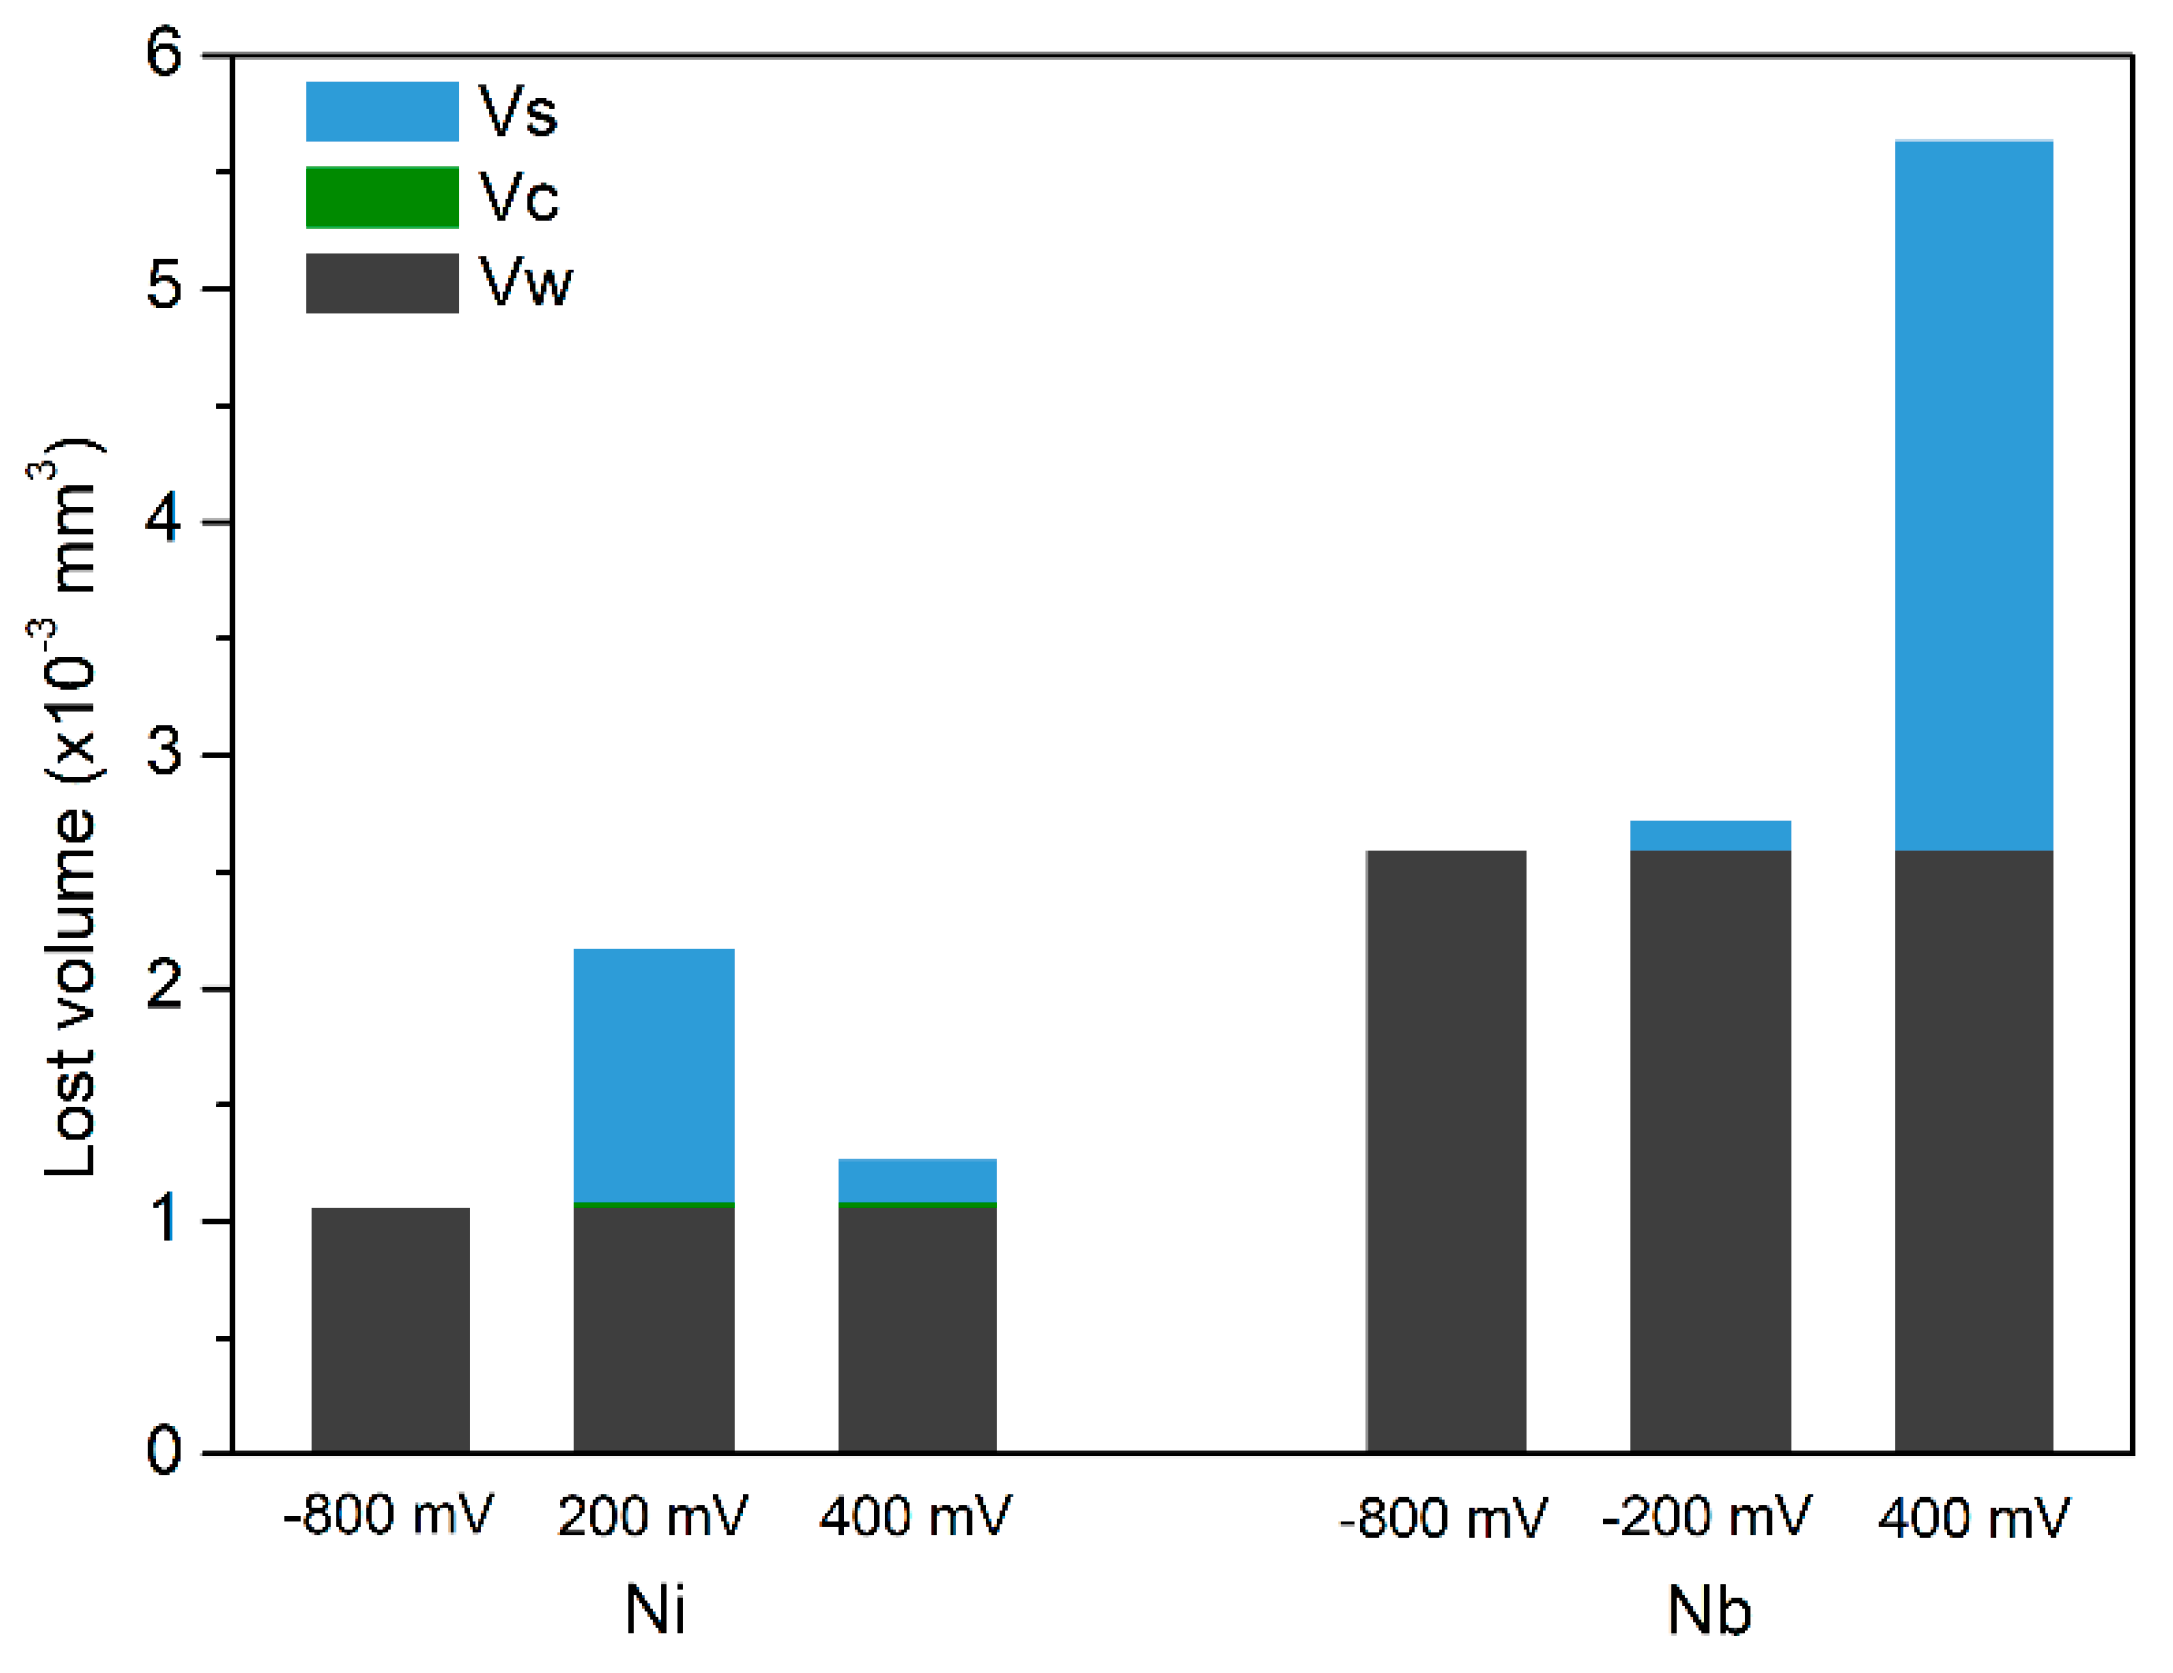
Ni could maintain (pseudo) passive characteristic by its repassivation ability during the potentiodynamic tribocorrosion test. It showed lower COF, current and material lost volume in the potentiostatic tribocorrosion test at the higher potential. However, the passivation on Nb was early broken, accompanied by a sharp increase in COF in the potentiodynamic tribocorrosion test. Additionally, Nb showed much more fluctuating current, jumping COF and larger material lost volume in the potentiostatic tribocorrosion test at the higher potential;
(2)
The repassivation kinetics parameters indicated that the repassivation rate was not the key factor causing the difference in tribocorrosion behaviour between the two metals because they both had time to partially recover passivation during the tribocorrosion tests;
(3)
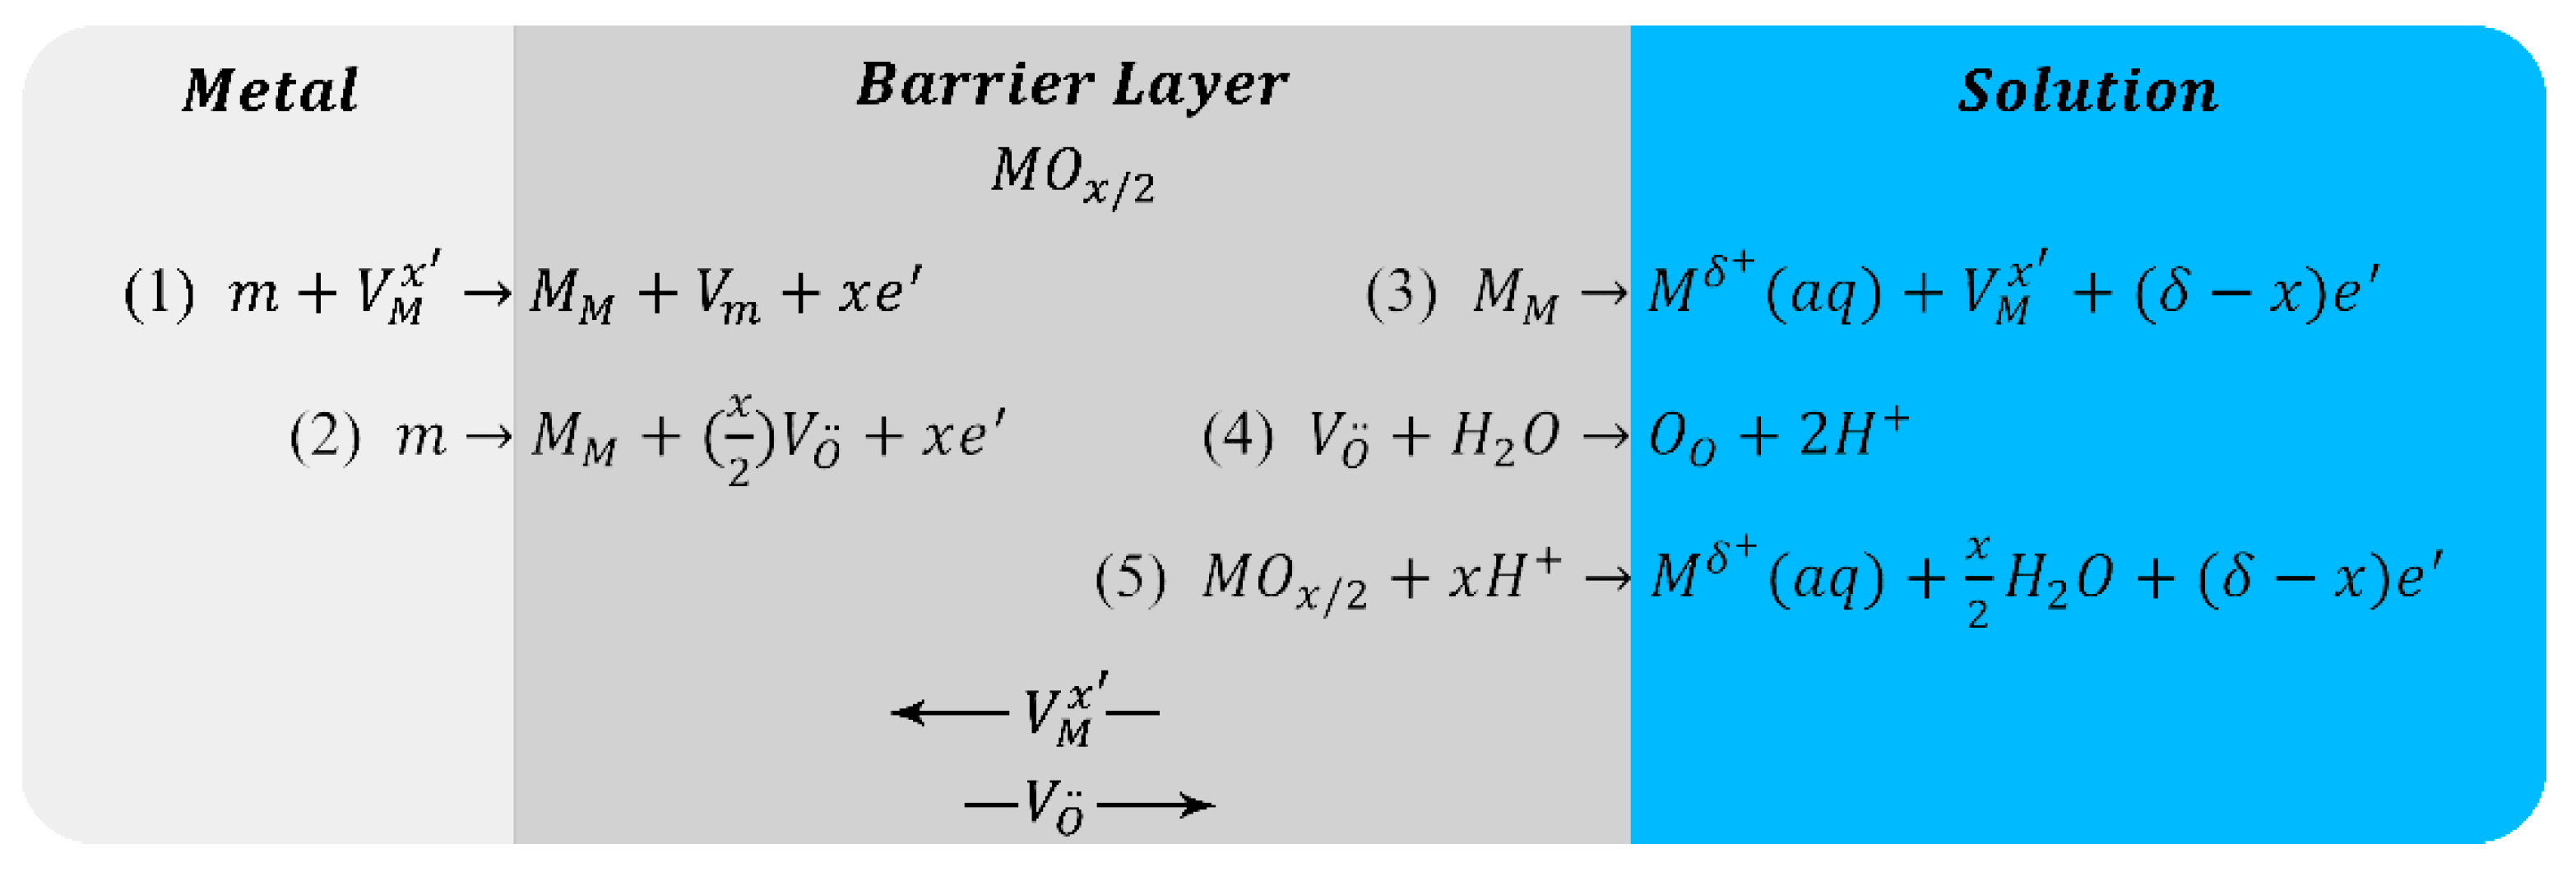
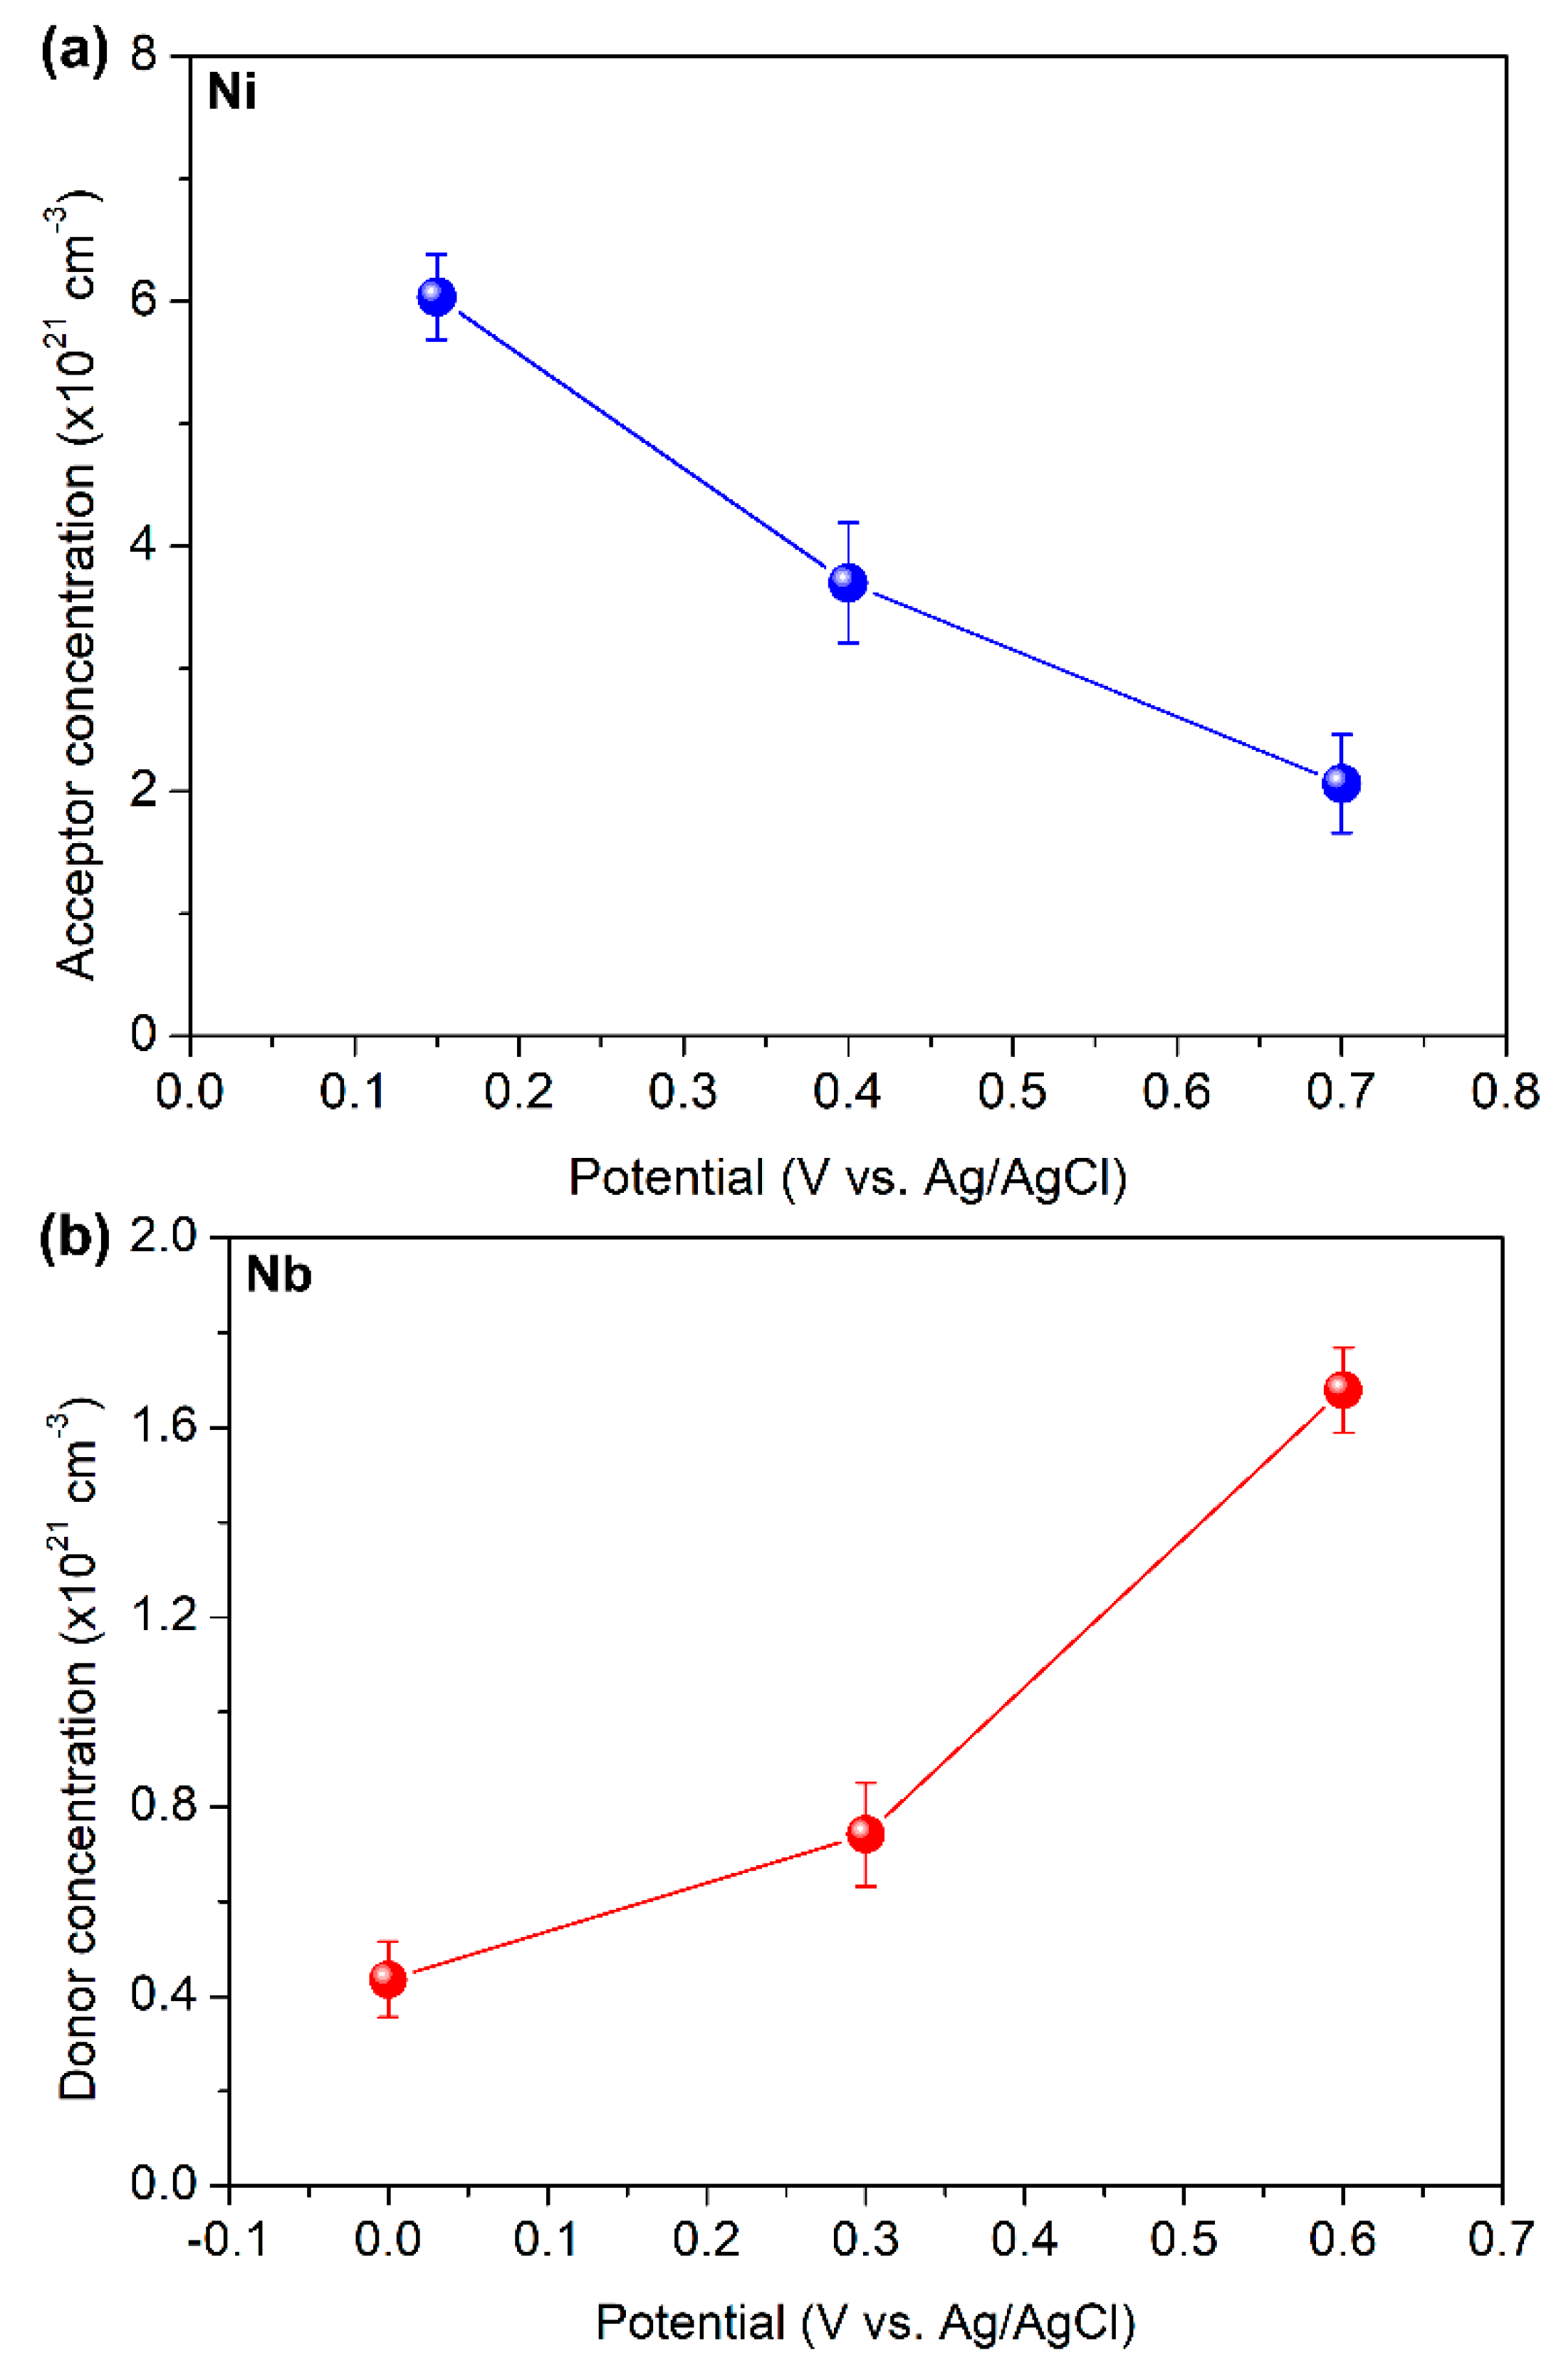
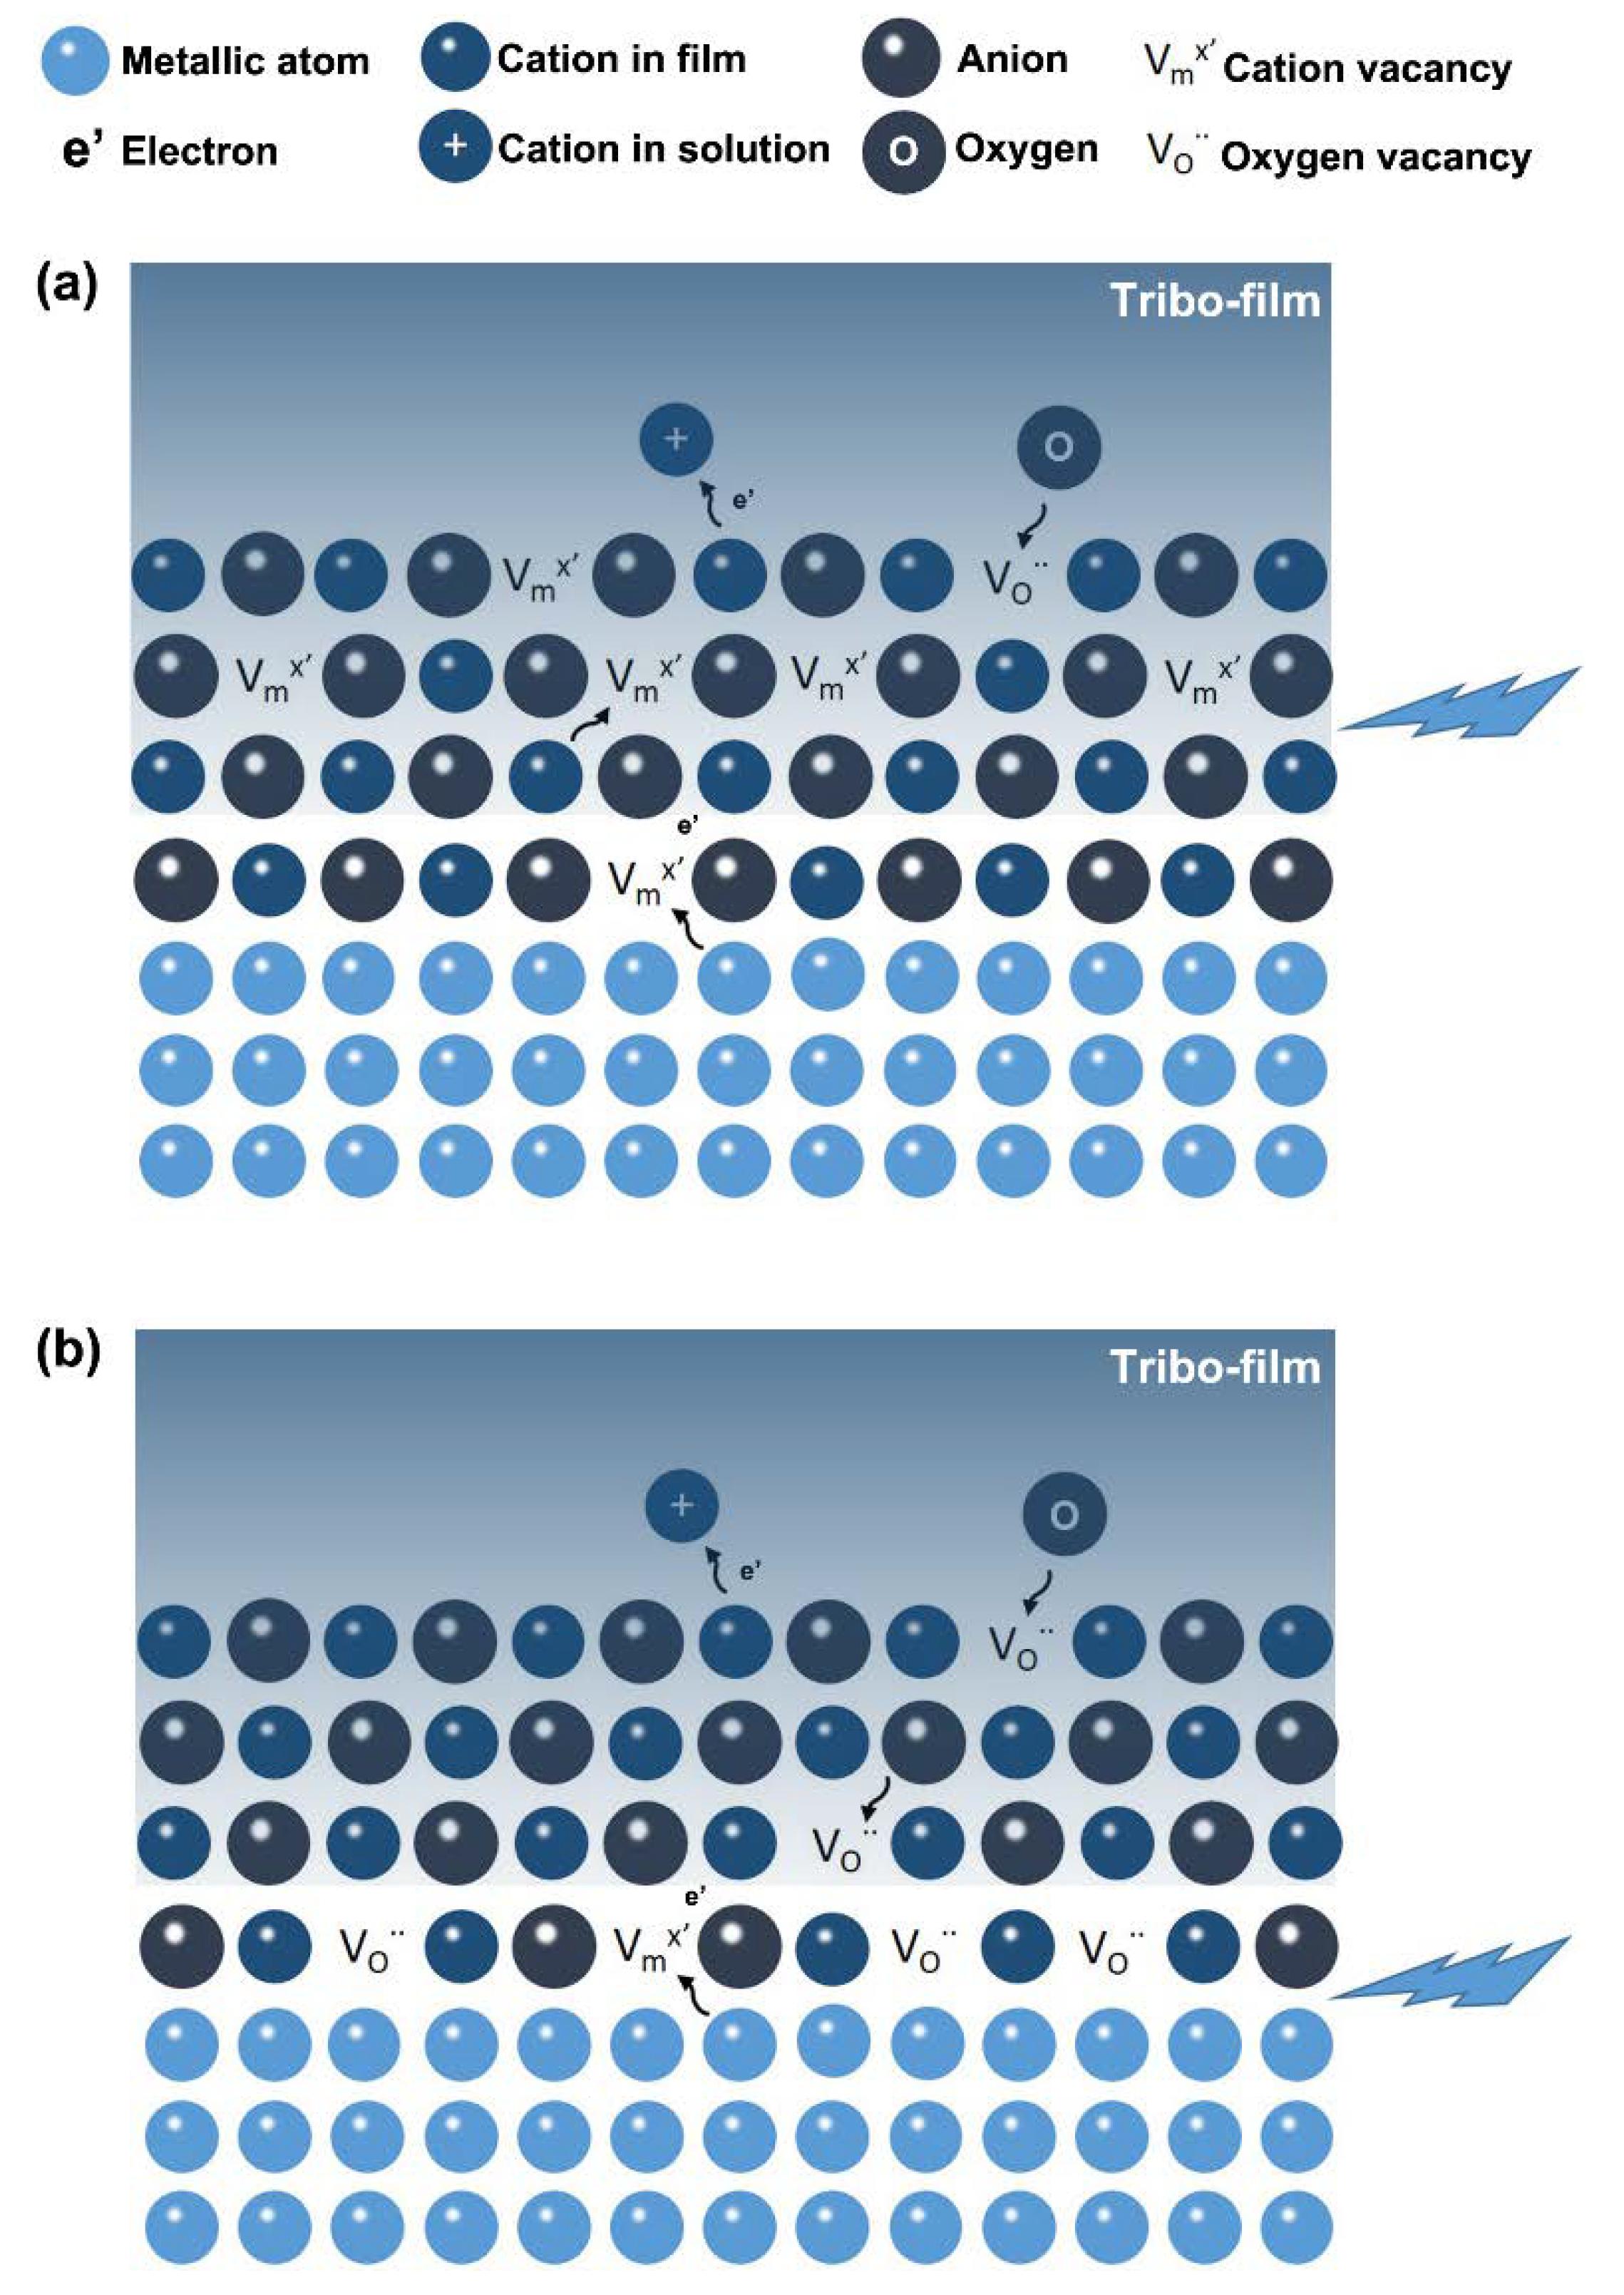
The difference in tribocorrosion behaviour on Ni and Nb has a close relation to the different passive film growth mechanisms. Ni had the cationic diffusion-dominated mechanism in passive growth. The cation vacancies are concentrated at the passive film/tribo-film interface. This did not affect the adhesion between metal and passive film. Further, the cation vacancy concentration was decreased with the increasing potential, which was helpful for the tribo-film to resist the mechanical detachment. Additionally, the flexible substrate of Ni could coordinate the deformation of the tribo-film. This was beneficial to the tribo-film to bond with the metal. Nb with anionic diffusion dominated mechanism in passive growth caused the accumulation of oxygen vacancies at the passive film/metal interface. This may weaken the adhesion between the metal and the film. The oxygen vacancy concentration was increased with the increasing potential; thus, the passive film and its upper tribo-film were both removed when the potential increased to the threshold (Eb). Further, the substrate of Nb under the tribo-film did not show good deformation property. It cannot coordinate the deformation of the tribo-film well, which leads to the detaching of the passive film and tribo-film;
(4)
Ni or other passive elements with the cationic diffusion-dominated mechanism in passive film growth were recommended as the alloying element for improving the tribocorrosion resistance of alloys.

Author Contributions

Conceptualization, Z.W.; methodology, Z.W.; investigation, R.Z.; resources, Y.M., Y.Y. and L.Q.; data curation, R.Z.; writing—original draft preparation, R.Z.; writing—review and editing, Z.W.; project administration, Z.W. All authors have read and agreed to the published version of the manuscript.

Funding

This work was supported by the National Natural Science Foundation of China (No. 51801016); the Science and Technology Research Program of Chongqing Municipal Education Commission (No. KJQN201901132); the Natural Science Foundation of Chongqing (No. cstc2019jcyj-msxmX0134); the Scientific Research Foundation of Chongqing University of Technology (No. 2019ZD02) and University Innovation Research Group of Chongqing (CXQT20023).

Institutional Review Board Statement

Not applicable.

Informed Consent Statement

Not applicable.

Data Availability Statement

Not applicable.

Conflicts of Interest

The authors have no conflict of interest to declare that are relevant to the content of this article.

References

  1. Sun, Y.; Haruman, E. Tribocorrosion Behaviour of Low Temperature Plasma Carburised 316L Stainless Steel in 0.5 M NaCl Solution. Corros. Sci. 2011, 53, 4131–4140. [Google Scholar] [CrossRef]
  2. Aha, I.; Alves, A.C.; Chirico, C.; Tsipas, S.A.; Toptan, F. Interactions between Wear and Corrosion on Cast and Sintered Ti-12Nb Alloy in Comparison with the Commercial Ti-6al-4v Alloy. Corros. Sci. 2020, 176, 108925. [Google Scholar] [CrossRef]
  3. Wang, Z.; Yan, Y.; Wang, Y.; Su, Y.; Qiao, L. Lifecycle of Cobalt-Based Alloy for Artificial Joints: From Bulk Material to Nanoparticles and Ions Due to Bio-Tribocorrosion. J. Mater. Sci. Technol. 2020, 46, 98–106. [Google Scholar] [CrossRef]
  4. Huttunen-Saarivirta, E.; Kilpi, L.; Hakala, T.J.; Carpen, L.; Ronkainen, H. Tribocorrosion Study of Martensitic and Austenitic Stainless Steels in 0.01 M NaCl Solution. Tribol. Int. 2016, 95, 358–371. [Google Scholar] [CrossRef]
  5. Silva, R.C.C.; Nogueira, R.P.; Bastos, I.N. Tribocorrosion of Uns S32750 in Chloride Medium: Effect of the Load Level. Electrochim. Acta 2011, 56, 8839–8845. [Google Scholar] [CrossRef]
  6. Dalmau, A.; Richard, C.; Muñoz, A.I. Degradation Mechanisms in Martensitic Stainless Steels: Wear, Corrosion and Tribocorrosion Appraisal. Tribol. Int. 2018, 121, 167–179. [Google Scholar] [CrossRef]
  7. Vieira, A.C.; Rocha, L.A.; Papageorgiou, N.; Mischler, S. Mechanical and Electrochemical Deterioration Mechanisms in the Tribocorrosion of Al Alloys in Nacl and in Nano3 Solutions. Corros. Sci. 2012, 54, 26–35. [Google Scholar] [CrossRef] [Green Version]
  8. Krawiec, H.; Vignal, V.; Heintz, O.; Ponthiaux, P.; Wenger, F. Local Electrochemical Studies and Surface Analysis on Worn Surfaces. J. Electrochem. Soc. 2008, 155, C127–C130. [Google Scholar] [CrossRef]
  9. Salasi, M.; Stachowiak, G.; Stachowiak, G. Tribo-Electrochemical Behaviour of 316L Stainless Steel: The Effects of Contact Configuration, Tangential Speed, and Wear Mechanism. Corros. Sci. 2015, 98, 20–32. [Google Scholar] [CrossRef]
  10. Diomidis, N.; Mischler, S.; More, N.S.; Roy, M. Tribo-Electrochemical Characterization of Metallic Biomaterials for Total Joint Replacement. Acta Biomater. 2012, 8, 852–859. [Google Scholar] [CrossRef]
  11. Iwabuchi, A.; Lee, J.W.; Uchidate, M. Synergistic Effect of Fretting Wear and Sliding Wear of Co-Alloy and Ti-Alloy in Hanks’ Solution. Wear 2007, 263, 492–500. [Google Scholar] [CrossRef]
  12. Zhang, B.; Wang, J.; Zhang, Y.; Han, G.; Yan, F. Comparison of Tribocorrosion Behavior between 304 Austenitic and 410 Martensitic Stainless Steels in Artificial Seawater. RSC Adv. 2016, 6, 107933–107941. [Google Scholar] [CrossRef]
  13. Mary, N.; Ter-Ovanessian, B.; Normand, B. Growth Mechanism and Repassivation Kinetic Determinations on Stainless Steel under Sliding: Role of the Solution Ph and Dissolved Oxygen Concentration. Wear 2020, 460–461, 203478. [Google Scholar] [CrossRef]
  14. Pieraggi, B.; MacDougall, B.; Rapp, R.A. The Role of the Metal/Oxide Interface in the Growth of Passive Films in Aqueous Environments. Corros. Sci. 2005, 47, 247–256. [Google Scholar] [CrossRef] [Green Version]
  15. Macdonald, D.D. The History of the Point Defect Model for the Passive State: A Brief Review of Film Growth Aspects. Electrochim. Acta 2011, 56, 1761–1772. [Google Scholar] [CrossRef]
  16. Pieraggi, B.; Rapp, R.A.; Pieraggi, B.; Rapp, R.A. Chromia Scale Growth in Alloy Oxidation and the Reactive Element Effect. J. Electrochem. Soc. 1992, 140, 2844–2850. [Google Scholar] [CrossRef]
  17. Guo, L.Q.; Li, M.; Shi, X.L.; Yan, Y.; Li, X.Y.; Qiao, L.J. Effect of Annealing Temperature on the Corrosion Behavior of Duplex Stainless Steel Studied by in Situ Techniques. Corros. Sci. 2011, 53, 3733–3741. [Google Scholar] [CrossRef]
  18. Farid, O.; Moamen, O.A.A.; Shehata, M.M. Preliminary Investigation on the Effect of Irradiation on Tribocorrosion Behavior of 316L Stainless Steel Alloy. J. Radiat. Res. Appl. Sci. 2019, 12, 367–374. [Google Scholar] [CrossRef] [Green Version]
  19. Pejaković, V.; Totolin, V.; Rodríguez Ripoll, M. Tribocorrosion Behavior of Ti6Al4V in Artificial Seawater at Low Contact Pressures. Tribol. Int. 2018, 119, 55–65. [Google Scholar] [CrossRef]
  20. Totolin, V.; Brenner, J.; Goecerler, H.; Ripoll, M.; Rodriguez, P. Friction and Wear Behaviour of Selected Titanium and Zirconium Based Nitride Coatings in Na2SO4 Aqueous Solution under Low Contact Pressure. Tribol. Int. 2015, 91, 267–273. [Google Scholar] [CrossRef]
  21. Fattah-alhosseini, A.; Vafaeian, S. Comparison of Electrochemical Behavior between Coarse-Grained and Fine-Grained AISI 430 Ferritic Stainless Steel by Mott–Schottky Analysis and EIS Measurements. J. Alloys Compd. 2015, 639, 301–307. [Google Scholar] [CrossRef]
  22. Mischler, S. Triboelectrochemical Techniques and Interpretation Methods in Tribocorrosion: A Comparative Evaluation. Tribol. Int. 2008, 41, 573–583. [Google Scholar] [CrossRef]
  23. López, A.; Bayón, R.; Pagano, F.; Igartua, A.; Arredondo, A.; Arana, J.L.; González, J.J. Tribocorrosion Behaviour of Mooring High Strength Low Alloy Steels in Synthetic Seawater. Wear 2015, 338–339, 1–10. [Google Scholar] [CrossRef]
  24. Benea, L.; Ponthiaux, P.; Wenger, F.; Galland, J.; Hertz, D.; Malo, J.Y. Tribocorrosion of Stellite 6 in Sulphuric Acid Medium: Electrochemical Behaviour and Wear. Wear 2016, 256, 948–953. [Google Scholar] [CrossRef]
  25. Ponthiaux, P.; Wenger, F.; Drees, D.; Celis, J.P. Electrochemical Techniques for Studying Tribocorrosion Processes. Wear 2004, 256, 459–468. [Google Scholar] [CrossRef]
  26. Gosvami, N.N.; Bares, J.A.; Mangolini, F.; Konicek, A.R.; Yablon, D.G.; Carpick, R.W. Mechanisms of Antiwear Tribofilm Growth Revealed in Situ by Single-Asperity Sliding Contacts. Science 2015, 348, 102–106. [Google Scholar] [CrossRef] [Green Version]
  27. Zhou, Z.; Rainforth, W.M.; Luo, Q.; Hovsepian, P.E.; Ojeda, J.J.; Romero-Gonzalez, M.E. Wear and Friction of Tialn/Vn Coatings against Al2O3 in Air at Room and Elevated Temperatures. Acta Mater. 2010, 58, 2912–2925. [Google Scholar] [CrossRef] [Green Version]
  28. Wang, Z.; Yan, Y.; Su, Y.; Qiao, L. Effect of Electrochemical Corrosion on the Subsurface Microstructure Evolution of a Cocrmo Alloy in Albumin Containing Environment. Appl. Surf. Sci. 2017, 406, 319–329. [Google Scholar] [CrossRef]
  29. Lu, B.T.; Luo, J.L.; Mohammadi, F.; Wang, K.; Wan, X.M. Correlation between Repassivation Kinetics and Corrosion Rate over a Passive Surface in Flowing Slurry. Electrochim. Acta 2008, 53, 7022–7031. [Google Scholar] [CrossRef]
  30. Sikora, E.; Macdonald, D.D. Nature of the Passive Film on Nickel. Electrochim. Acta 2002, 48, 69–77. [Google Scholar] [CrossRef]
  31. Liu, L.; Li, Y.; Wang, F. Influence of Micro-Structure on Corrosion Behavior of a Ni-Based Superalloy in 3.5% NaCl. Electrochim. Acta 2007, 52, 7193–7202. [Google Scholar] [CrossRef]
  32. Wang, Z.W.; Yan, Y.; Qiao, L.J. Protein Adsorption on Implant Metals with Various Deformed Surfaces. Colloids Surf. B Biointerfaces 2017, 156, 62–70. [Google Scholar] [CrossRef] [PubMed]
  33. Cámara, O.R.; Avalle, L.B.; Oliva, F.Y. Protein Adsorption on Titanium Dioxide: Effects on Double Layer and Semiconductor Space Charge Region Studied by Eis. Electrochim. Acta 2010, 55, 4519–4528. [Google Scholar] [CrossRef]
  34. Li, J.; Lu, W.; Gibson, J.; Zhang, S.; Raabe, D. Compatible Deformation and Extra Strengthening by Heterogeneous Nanolayer Composites. Scr. Mater. 2020, 179, 30–35. [Google Scholar] [CrossRef]
  35. Oh, K.N.; Ahn, S.H.; Eom, K.S.; Kwon, H.S. A Study on the Localized Corrosion and Repassivation Kinetics of Fe-20Cr-XNi (X = 0–20 wt%) Stainless Steels Via Electrochemical Analysis. Corros. Sci. 2015, 100, 158–168. [Google Scholar] [CrossRef]
  36. Cao, S.; Mischler, S. Modeling Tribocorrosion of Passive Metals—A Review. Curr. Opin. Solid State Mater. Sci. 2018, 22, 127–141. [Google Scholar] [CrossRef]
Figure 1. Schematic illustration of the tribocorrosion test setup.
Metals 12 00798 g001
Figure 2. Potentiodynamic polarisation curves of (a) Ni and (b) Nb under different wear conditions in 5 wt.% Na2SO4 solution.
Metals 12 00798 g002
Figure 3. Evolutions of current and COF during the potentiodynamic tribocorrosion tests: (a) Ni and (b) Nb.
Metals 12 00798 g003
Figure 4. Evolutions of current and COF during the potentiostatic tribocorrosion tests: (a) Ni and (b) Nb.
Metals 12 00798 g004
Figure 5. The wear track profiles of (a) Ni and (b) Nb after the potentiostatic tribocorrosion tests.
Metals 12 00798 g005
Figure 6. The SEM images of Ni after the potentiostatic tribocorrosion tests with different applied potentials: (ac) 200 mV, (df) 400 mV; the EDS results were inserted in the images.
Metals 12 00798 g006
Figure 7. The SEM images of Nb after the potentiostatic tribocorrosion tests with different applied potentials: (ac) 200 mV, (df) 400 mV; the EDS results were inserted in the images.
Metals 12 00798 g007
Figure 8. The SEM images and EDS lining scans of the cross-sections of the wear tracks from the potentiostatic tribocorrosion tests (400 mV): (a) Ni and (b) Nb.
Metals 12 00798 g008
Figure 9. Contribution of corrosion, wear and their synergic interactions to the total material loss volume of Ni and Nb in potentiostatic tribocorrosion tests with different applied potentials.
Metals 12 00798 g009
Figure 10. Current curves of (a) Ni and (b) Nb during the scratching tests at different potentials.
Metals 12 00798 g010
Figure 11. Parameters of repassivation kinetics obtained by fitting the current curves during the scratching tests: (a) Ni and (b) Nb.
Metals 12 00798 g011
Figure 12. Physicochemical processes scheme in the PDM: m is metal atom, V M x is cation vacancy, MM is metal cation in cation site, Vm is vacancy in metal phase, e′ is electron, V O . . is oxygen (anion) vacancy, Mδ+(aq) is cation in layer/solution interface, OO is oxide ion in anion site, MOx/2 is stoichiometric barrier layer.
Metals 12 00798 g012
Figure 13. Mott–Schottky analysis of the metals after passivated at different potentials: (a) Ni and (b) Nb.
Metals 12 00798 g013
Figure 14. Defect concentration in the passive films formed at different potentials: (a) Ni and (b) Nb.
Metals 12 00798 g014
Figure 15. Schematic illustrations of interface structure of growing passive film in (a) cationic diffusion dominated growth and (b) anionic diffusion dominated growth.
Metals 12 00798 g015
Table 1. Electrochemical corrosion parameters from the potentiodynamic polarisation curves.
MetalConditionEcorr (V)icorr (μA·cm2)ipass (μA·cm2)Eb (V)
NiWithout wear−0.226 ± 0.0320.36 ± 0.084.65 ± 0.151.027 ± 0.054
With wear−0.292 ± 0.0250.92 ± 0.107.20 ± 0.211.041 ± 0.036
NbWithout wear−0.367 ± 0.0190.27 ± 0.074.55 ± 0.271.329 ± 0.052
With wear−0.666 ± 0.0224.48 ± 0.3813.77 ± 0.490.083 ± 0.171
Publisher’s Note: MDPI stays neutral with regard to jurisdictional claims in published maps and institutional affiliations.

