Article

Effects of Heat Treatment on Microstructures and Properties of Cold Rolled Ti-0.3Ni Sheets as Bipolar Plates for PEMFC

1
State Key Laboratory of Advanced Welding and Joining, Harbin Institute of Technology, Harbin 150001, China
2
School of Materials Science and Engineering, Harbin Institute of Technology, Harbin 150001, China
3
Center of Analysis and Measurement, Harbin Institute of Technology, Harbin 150001, China
*
Author to whom correspondence should be addressed.
Metals 2022, 12(5), 792; https://doi.org/10.3390/met12050792
Submission received: 1 April 2022 / Revised: 21 April 2022 / Accepted: 30 April 2022 / Published: 4 May 2022
(This article belongs to the Special Issue Hot Forming/Processing of Metallic Materials)

Abstract

:
As promising materials for bipolar plates substrate, as-cold rolled Ti-0.3Ni (wt.%) sheets were heat treated with three different processes in this work. As-cold rolled sheets consist of α matrix and dispersed Ti2Ni intermetallic precipitates, and typical Widmanstatten microstructure can be observed after heat treatment. Lamellar Ti2Ni precipitates inside the colonies. Elongation of as-cold rolled sheets equals less than 7% while this value rises up to around 20%, and tensile strength decreases by more than 47% after heat treatment. Open circuit potentials of as-cold rolled sheets treated at 950 °C for 1 h followed by wind cooling (950 °C/1 h/WC), sheets aged at 500 °C for 3 h followed by air cooling (950 °C/1 h/WC + 500 °C/3 h/AC), and sheets treated at 950 °C for 1 h followed by furnace cooling (950 °C/1 h/FC) equals −0.536 V, −0.476 V, −0.486 V, −0.518 V, respectively. A potentiodynamic polarization test reveals that all of the specimens exhibit typical active–passive transition behavior. Sheets treated at 950 °C/1 h/WC possess the lowest corrosion current density (155.4 μA·cm−2). Results of electrochemical impedance spectroscopy (EIS) show that 950 °C/1 h/WC treated sheets possess the largest polarization resistance (Rpol), 122.6 Ω·cm2. Moreover, steady-state current densities (Iss) increase in the order of 950 °C/1 h/WC, 950 °C/1 h/WC + 500 °C/3 h/AC, 950 °C/1 h/FC according to the results of potentiostatic polarization. This can be attributed to various amounts of Ti2Ni precipitation caused by different cooling rates.

1. Introduction

Proton exchange membrane fuel cells (PEMFCs) are an energy conversion device with promising development potential due to the low operating temperature, fast start-up, long service life, high energy conversion efficiency, and stable operation [1,2,3,4,5]. As a component of PEMFCs, bipolar plates account for around 45% of total cell cost and 78% of total cell weight [6], undertaking the responsibility of conducting current, transmitting heat, distributing reaction gas, and removing water in a fuel cell.
Nowadays, bipolar plates made of graphite are widely commercialized. However, high manufacturing cost and inferior mechanical properties confined their further application. In comparison with graphite bipolar plates, metallic bipolar plates have attracted the attention of many researchers because of their lower manufacturing cost, superior formability as well as enough mechanical strength [5,7,8,9,10,11,12,13]. However, poor corrosion resistance becomes the main problem that metallic bipolar plates need to be settled. Thus, a lot of work for improving the corrosion resistance of metallic bipolar plates by surface modification has been carried out. However, defects such as pinholes often occur during coating manufacturing, and corrosive electrolytes will react with the underlying substrate [5,14]. Consequently, the corrosion resistance of the substrate largely determines the longevity of bipolar plates.
At present, stainless steel is the most widely used metallic bipolar plate substrate [7,9,10]. Nevertheless, high density and inferior corrosion resistance in PEMFCs operating conditions become disadvantages of bipolar plates made of stainless steel. As a prospective candidate material for bipolar plate substrate, titanium alloys possess superior corrosion resistance and low density, which can prolong the longevity and reduce the weight of bipolar plates. However, taking cost, corrosion resistance, and formability into consideration, most titanium alloys are not suitable for bipolar plate substrate.
As a common method that improves the corrosion resistance of titanium in reducing acid, alloying is a low-cost, simple, and effective way. Tomashov et al. [15] proposed several ways to enhance the corrosion resistance of titanium. One of the methods is cathodic alloying by adding elements including platinum-group metals (PGMs) or Ni into titanium. Sedriks et al. [16] studied the electrochemical behavior of titanium and Ti-Ni alloys in acid NaCl solution at ambient temperature and boiling point, finding that introduction of Ti2Ni intermetallic compounds enhanced corrosion resistance of titanium by increasing the efficiency of the cathodic process. Bonilla et al. [17] improved corrosion resistance of titanium in 0.1 M H2SO4 at 80 °C via surface alloying with Ni, Ni-Mo, or Pd. Wang et al. [18] compared the corrosion behavior of Ti-0.3Mo-0.8Ni, Ti-0.2Pd, and pure titanium in 25 °C fluoride-containing sulfuric acids. By using mixed potential theory, it was found that Ti-0.3Mo-0.8Ni and Ti-0.2Pd alloys were more corrosion resistant than pure titanium due to the acceleration effect of Ni and Pd on the cathodic process. Robert [19] systematically investigated the electrochemical behavior of TiCode-12 alloy in hydrochloric acid and found that alloy passivity resulted from a galvanic coupling between intermetallic Ti2Ni and Ti matrix.
To our knowledge, there are few studies on the corrosion behavior of titanium-nickel alloys in the PEMFC’s operating environment. In the present work, cold-rolled binary Ti-0.3Ni (wt.%) sheets were manufactured. The content of Ni addition is controlled to less than 1% to avoid the adverse influence of elements on the formability of the alloys. In order to obtain various microstructures, as-cold rolled sheets were heat-treated in different processes. Microstructures of as-cold rolled and heat-treated sheets were observed. Corrosion behavior and tensile properties of as-cold rolled and heat-treated sheets were investigated.

2. Materials and Methods

Materials used in this work were 0.7 mm thick as-cold rolled Ti-0.3Ni (wt.%) sheets. The as-cold rolled sheets were heat-treated in electric chamber furnace by three processes, including solid solution treatment at 950 °C for 1 h followed by wind cooling (denoted as 950 °C/1 h/WC), solid solution treatment at 950 °C for 1 h followed by wind cooling, then the specimens were aged at 500 °C for 3 h followed by air cooling (denoted as 950 °C/1 h/WC + 500 °C/3 h/AC), solid solution treatment at 950 °C for 1 h followed by furnace cooling (denoted as 950 °C/1 h/FC).
10 mm × 10 mm square specimens were cut from each sheet by electrical discharge machining for microstructural investigation and electrochemical experiments. The specimens were ground with SiC emery paper up to 3000 grit, and subsequently mechanical polished with 0.25 μm diamond. Then, each specimen was ultrasonically cleaned successively with acetone, ethanol, and distilled water. For microstructure observation, the polished specimens were etched in Kroll’s reagent, i.e., 10 vol.% HF, 10 vol.% HNO3, 80 vol.% H2O. Microstructure observation of specimens was conducted by scanning electron microscopy (FEI, Hillsboro, OR, USA). Area fractions of Ti2Ni intermetallic compounds in specimens were calculated using Image-Pro Plus software (6.0, Media Cybernetics Inc., Rockville, MD, USA).
Electrochemical experiments were carried out with CHI 760E electrochemical workstation. A conventional three-electrode cell was used, which consisted of Pt foil counter electrode, saturated calomel reference electrode (SCE) connected to the cell via a salt bridge with a luggin capillary, and the specimen as the working electrode. The working electrodes were embedded in epoxy resin with 1 cm2 exposed area. Unless otherwise stated, potentials in this work are provided with respect to SCE.
Open circuit potential (OCP) measurements were performed for 3600 s. Potentiodynamic polarization test was conducted from −1.0 VSCE to +1.5 VSCE at a scan rate of 0.5 mV/s. Electrochemical impedance spectroscopy (EIS) analysis was carried out at OCP using a sinusoidal potential perturbation of 10 mV in a frequency ranging from 10 mHz to 100 kHz. Fitting of the EIS data was carried out by Zview software (3.1, Scribner Associates Inco., Southern Pines, NC, USA). All of the measurements were at least triplicated in simulated PEMFC solution, i.e., naturally aerated 0.5M H2SO4 solutions with 5 ppm F. Potentiostatic polarization measurements at +0.6 V were conducted for 21,600 s (6 h). Temperatures of electrolyte were maintained at 80 °C via thermostatic water bath during tests.
Tensile testing at room temperature was performed using Instron 5569 universal testing machine (Instron, Norwood, MA, USA) at the strain rate of 5 × 10⁻⁴ s−1. The tensile direction was respectively parallel to rolling direction (RD) and transverse direction (TD) of each heat-treated sheet. Strain extensometer was used in order to guarantee the accuracy of strain measurement.

3. Results and Discussion

3.1. Microstructure

Figure 1 exhibits photographs of Ti-0.3Ni alloys treated by various processes. Some pits can be seen in high magnification photos due to corrosion caused by the etchant. On the basis of the Ti-Ni binary phase diagram, eutectoid microstructure composed of α-Ti and Ti2Ni intermetallic compounds will be obtained in the form of the following reaction at 765 °C [19,20]:
Β→α + Ti2Ni
For as-cold rolled sheets, dispersed Ti2Ni in the α-Ti matrix and a large number of fine grains due to the cold rolling process can be observed. In contrast, a typical Widmanstatten microstructure can be found after being heat-treated at 950 °C. The microstructure evolution of heat-treated sheets is described as follows. During the heating of specimens, α grains transform into β grains via the reaction αβ at α/β transform temperature. Moreover, the soluting of Ni atoms into Ti lattice reduces the hindrance of grain growth. Consequently, the size of β grains significantly increases. In the period of cooling, the α phase firstly forms on the grain boundary of β grains when temperature decreases to β/α transform temperature. Then α grains grow into β grains with temperature further decreasing. When temperature declines to 765 °C, i.e., the eutectoid temperature of Ti-0.3Ni alloy according to Ti-Ni binary phase diagram [16], a eutectoid reaction takes place, and β phase transforms into α phase and Ti2Ni intermetallic compounds.
As the highest cooling rate in the present study, in the case of 950 °C/1 h/WC, the temperature of the specimen decreases so rapidly that only a small amount of Ni atoms precipitate in the form of Ti2Ni. Thus, less Ti2Ni is observed in Figure 1c,d. Moreover, a high cooling rate results in the formation of jagged grains, as marked in Figure 1d. As for specimens treated by 950 °C/1 h/WC + 500 °C/3 h/AC, more Ti2Ni precipitates on account of the lower cooling rate, as depicted in Figure 1e. Additionally, jagged grains still exist, but the number of them becomes rather smaller. As for the specimen treated at 950 °C/1 h/FC, the cooling rate is further declined, and the time for Ti2Ni precipitation is prolonged, making Ti2Ni precipitates more sufficient. This can be evidenced that the amount of Ti2Ni in Figure 1g is more than Figure 1c,e. The widths of Ti2Ni laths are approximately 1 μm, larger than other specimens. Typical (α-Ti + Ti2Ni) eutectoids with clear boundaries instead of jagged grains can be observed.

3.2. Mechanical Properties

Figure 2 presents engineering stress-strain curves of specimens treated by different processes. The results of the room temperature tensile experiment are listed in Table 1. According to Figure 2 and Table 1, as-cold rolled specimens possess the highest ultimate tensile strength (UTS) of 733.6 MPa and 748.8 MPa in RD and TD, respectively. However, elongations of as-cold rolled specimens equal only 6.12% and 2.01% in RD and TD, respectively.
While UTSs of the heat-treated specimens significantly differ from the as-cold rolled ones. Anisotropy of the specimens reduces by observing the curves after heat treatment. Moreover, the plasticity of the heat-treated specimens is enhanced, observed by the apparent increase in elongation. For 950 °C/1 h/WC treated specimens, UTSs in RD and TD are 374.3 MPa and 376.8 MPa, respectively. Moreover, elongations of the specimens in RD and TD are 19.1% and 22.3%. In the case of heat-treated specimens, no discernable difference can be noted among them. Additionally, under the action of aging at 500 °C, more Ti2Ni precipitates, resulting in slightly lower elongation, i.e., 20.8% and 20.3% in RD and TD, respectively. In the case of specimens treated at 950 °C/1 h/FC, UTSs and elongations decrease to 261.5 MPa and 256.0 MPa, 15.7% and 21.0% in RD and TD, respectively. As the previous investigation stated, higher content of the intermetallic phase in the ductile matrix will deteriorate mechanical properties, especially the plasticity of the alloys [21]. Herein, the hard, brittle Ti2Ni phase existing in the alloy matrix is the dominant factor that affects the mechanical properties of the heat-treated Ti-0.3Ni sheets. Moreover, the amount of Ti2Ni precipitation in heat-treated sheets increases in the order of 950 °C/1 h/WC, 950 °C/1 h/WC + 500 °C/3 h/AC, 950 °C/1 h/FC. Hence, elongation decreases in the same order.

3.3. Open Circuit Potential Measurements

Figure 3 shows the variation of OCPs with immersion time for as-cold rolled and heat-treated Ti-0.3Ni sheets in simulated PEMFC solution. For all of the specimens, OCPs turn out to be a quick decrease followed by an abrupt decline to the lowest values due to chemical dissolution of native oxide formed on the surface by the following reaction: [22]
TiO2 + 6F + 4H+→TiF62− + 2H2O
After decreasing to the lowest values, a small rebound of curves can be observed. Finally, the OCPs relatively stabilize at a certain value, and no evident fluctuation is noted.
As-cold rolled specimen possesses the most negative OCP (−0.536 V). The heat-treated sheets exhibit nobler potential in different degrees compared with as-cold rolled ones. OCPs of sheets treated at 950 °C/1 h/WC and 950 °C/1 h/WC + 500 °C/3 h/AC are −0.476 V and −0.486 V, which are respectively 0.06 V and 0.05 V nobler than the as-cold rolled one. With respect to sheets treated at 950 °C/1 h/FC, their OCP (−0.518 V) is nobler than as-cold rolled ones and more negative than 950 °C/1 h/WC as well as 950 °C/1 h/WC + 500 °C/3 h/AC treated sheets.

3.4. Potentiodynamic Polarization Measurements

Potentiodynamic polarization curves for as-cold rolled and heat-treated sheets in naturally aerated 0.5 M H2SO4 + 5 ppm F solution are displayed n in Figure 4. According to the curves, apparent anodic peak and passive zone can be observed for all of the specimens, demonstrating typical active–passive behavior of specimens in simulating PEMFC solution. Moreover, corrosion potentials (Ecorr) of the specimens increase in the order of as-cold rolled, 950 °C/1 h/WC, 950 °C/1 h/WC + 500 °C/3 h/AC, 950 °C/1 h/FC, and their values equal −0.481 V, −0.437 V, −0.454 V, −0.491 V, respectively. Corrosion current densities (icorr) are obtained through Tafel extrapolation method and the results of fitting equal 446.3 μA·cm−2, 155.4 μA·cm−2, 1286 μA·cm−2, 482.1 μA·cm−2 for as-cold rolled, 950 °C/1 h/WC, 950 °C/1 h/WC + 500 °C/3 h/AC, 950 °C/1 h/FC, respectively. Attention should be paid to the work by Sedriks et al. [16], where the conclusion that Ti2Ni could enhance the corrosion resistance of titanium was drawn. However, in the present work, the introduction of Ti2Ni does not appear to have an obvious positive effect on the corrosion resistance of titanium. The contradiction between these results can be ascribed to the different content of Ni in these two investigations. The Ni contents used in the former work were more than 2 wt.%. Nonetheless, Ni contents of the alloys equal 0.3 wt.% in this work. As stated above, Ni content should be controlled at a lower level so as to decrease the adverse effect of Ti2Ni on the plasticity of the sheets used for bipolar plates.
According to relevant research, the cathodic reaction of titanium alloys in acid solution is mainly a hydrogen evolution reaction (HER). In the anodic branch of the curves, there are several regions, including the active dissolution region, active–passive transition region and passive region existing. In the active region, titanium dissolves as the following steps [23,24]. The detailed curves of each specimen near the active region are shown in Figure 4b.
Ti + H 2 O   Ti H 2 O ad
Ti H 2 O ad   Ti OH ad + H +
Ti OH ad   TiOH ad + e
TiOH ad   TiOH ad + + e
TiOH ad +   TiOH 2 + + e
TiOH 2 + + H +   Ti 3 + + H 2 O
Within the period of the active–passive transition, as shown in Figure 3, the following reactions occur, and the active dissolution of titanium will be inhibited [23,25,26]. The decreasing current density should be associated with the formation of TiO2 in reaction 13.
TiOH ad +   TiOH ad 2 + + e
H 2 O + TiOH ad     Ti OH 2 ad 2 + + H + + e
H 2 O + TiOH ad     Ti OH 2   2 + + H + + e
Ti OH 2 ad 2 +   Ti OH 2   2 +
Ti OH 2 ad 2 +   TiO 2 + 2 H +
Eventually, the curves enter a passive region ranging from 0 V–1.5 V. In the region, due to the valve metals properties of titanium [27,28,29,30], anodically-grown passive film forms upon the surface of specimens and current densities decline at a relatively low rate with the applied potential scanning to nobler direction according to Figure 4.

3.5. Electrochemical Impedance Spectroscopy Measurements

EIS measurements of as-cold rolled and heat-treated specimens in naturally aerated 0.5 M H2SO4 + 5 ppm F solution were presented through Bode plots and Nyquist plots, respectively, in Figure 5a,b. According to Figure 5a, each specimen possesses two peaks in medium and low frequency. Moreover, the maximum phase angle of each specimen is lower than 60°. The phase angles of 950 °C/1 h/WC and as-cold rolled sheets are relatively lower than other sheets. Two capacitive loops can be observed in the Nyquist plot of each specimen. According to relevant research, the phenomenon observed above is an echo of a porous layer formed on the sheets due to the adverse effect of fluoride ions on passive film [18,31,32,33]. Radii of low-frequency capacitive loops decrease in the order of 950 °C/1 h/WC, as-cold rolled, 950 °C/1 h/FC as well as 950 °C/1 h/WC + 500 °C/3 h/AC.
Results of EIS were investigated by the equivalent circuit exhibited in Figure 6, which was applied extensively for Ti alloys to fit EIS data with two-time constants [18,31,33]. In the equivalent circuit, Rf and Qf correspond to the resistance and capacitance of the porous layer, respectively. Rct and Qdl are charge transfer resistance and capacitance of the electrical double layer, respectively. Moreover, Rs is the resistance of solution between passive film/solution interface and the tip of the luggin probe [26,34]. To substitute the ideal capacitance due to the distribution of relaxation times as a result of the non-uniform surface of the alloy in the solution, a constant phase element (CPE) is employed. The impedance of CPE is defined as the following equation:
ZCPE = [C()n]−1
where j2 = −1, ω = 2πf. The exponent n is an adjustable parameter that lies between −1 and 1, corresponding to a perfect inductor and perfect capacitor, respectively.
Parameters obtained from the equivalent circuit model are listed in Table 2. The validity of the obtained parameters is evaluated by the quite small chi-square values (χ2) [31]. The fitted data is in good accord with experiment data based on the table. In the present study, due to the porous structure, the layer cannot provide sufficient protection to the substrate from interacting with the solution. Based on Table 2, Rct of as-cold rolled sheets and the ones treated at 950 °C/1 h/WC, 950 °C/1 h/WC + 500 °C/3 h/AC, 950 °C/1 h/FC equal 18.0 Ω·cm2, 30.5 Ω·cm2, 10.4 Ω·cm2, 16.6 Ω·cm2, respectively. In order to further evaluate the corrosion resistance of sheets treated by different processes, polarization resistance (Rpol) is calculated using the following expression for the equivalent circuit in Figure 6:
Rpol = Rct + Rf
Figure 7 shows polarization resistance of as-cold rolled and heat-treated sheets in naturally aerated 0.5 M H2SO4 + 5 ppm F solution. According to the plot, sheets treated at 950 °C/1 h/WC possess the highest polarization resistance of 121.4 Ω·cm2. The polarization resistance of as-cold rolled sheets is 77.5 Ω·cm2 lower than 950 °C/1 h/WC treated ones. Additionally, polarization resistances of both sheets mentioned above are apparently higher than 950 °C/1 h/WC + 500 °C/3 h/AC and 950 °C/1 h/FC treated sheets, suggesting passive film formed on these sheets are more resistant to corrosion.

3.6. Potentiostatic Polarization Measurements

In order to simulate the loading process of PEMFC, potentiostatic polarization of as-cold rolled and heat-treated sheets was carried out. Attention should be paid that in this section, only heat-treated sheets were tested owing to poor ductility and inferior corrosion resistance of as-cold rolled sheets. The results of potentiostatic polarization are exhibited in Figure 8. Figure 8b is the magnification of the dashed rectangular region marked in Figure 8a. As suggested by a previous investigation, steady-state current density (Iss) is the current density obtained after the specimen is potentiostatic polarized for a period of time. According to Figure 8a, current densities decrease abruptly at the beginning of the experiment, which is observed in the case of all tested sheets. This is due to the formation of the passive film [35,36]. After that, decreasing rates of current densities gradually slow down, and current densities eventually stabilize at around 1 μA·cm−2, as is shown in Figure 8b. Steady-state current densities of 950 °C/1 h/WC, 950 °C/1 h/WC + 500 °C/3 h/AC as well as 950 °C/1 h/FC treated specimens are 0.68 μA·cm−2, 0.86 μA·cm−2, 1.03 μA·cm−2, respectively.
On the basis of microstructure observation mentioned above, different Iss obtained from specimens treated in various processes can be attributed to the amount of Ti2Ni precipitation. After heat treatment at 950 °C and cooling at various rates, the amount of precipitation differs. The more Ti2Ni intermetallic compounds precipitate, the more defects may be introduced into the passive film of titanium alloy sheets, which does harm the integrity of the passive film [21,37]. Consequently, Iss of the sheets increased in the order of sheets treated at 950 °C/1 h/WC, 950 °C/1 h/WC + 500 °C/3 h/AC, and 950 °C/1 h/FC.
Figure 9 displays steady-state current densities of specimens polarized at 0.6 V and Ti2Ni area fractions as functions of different heat treatment processes. It can be observed that the current densities of the specimens increase with the area fraction of Ti2Ni precipitation. Based upon investigation by Osório et al. [21] on the electrochemical behavior of binary Ti-Cu alloys with different Cu contents, nobler Ti2Cu intermetallic compounds serve as a cathode in the matrix. Moreover, more Ti2Cu precipitate after increasing Cu contents, and passive current densities increase with Cu contents, which is a similar tendency to the present work.

4. Conclusions

Binary Ti-0.3Ni sheets were manufactured by cold rolling, and the effects of heat treatment on microstructures and properties were investigated. The following conclusions are reached:
(1)
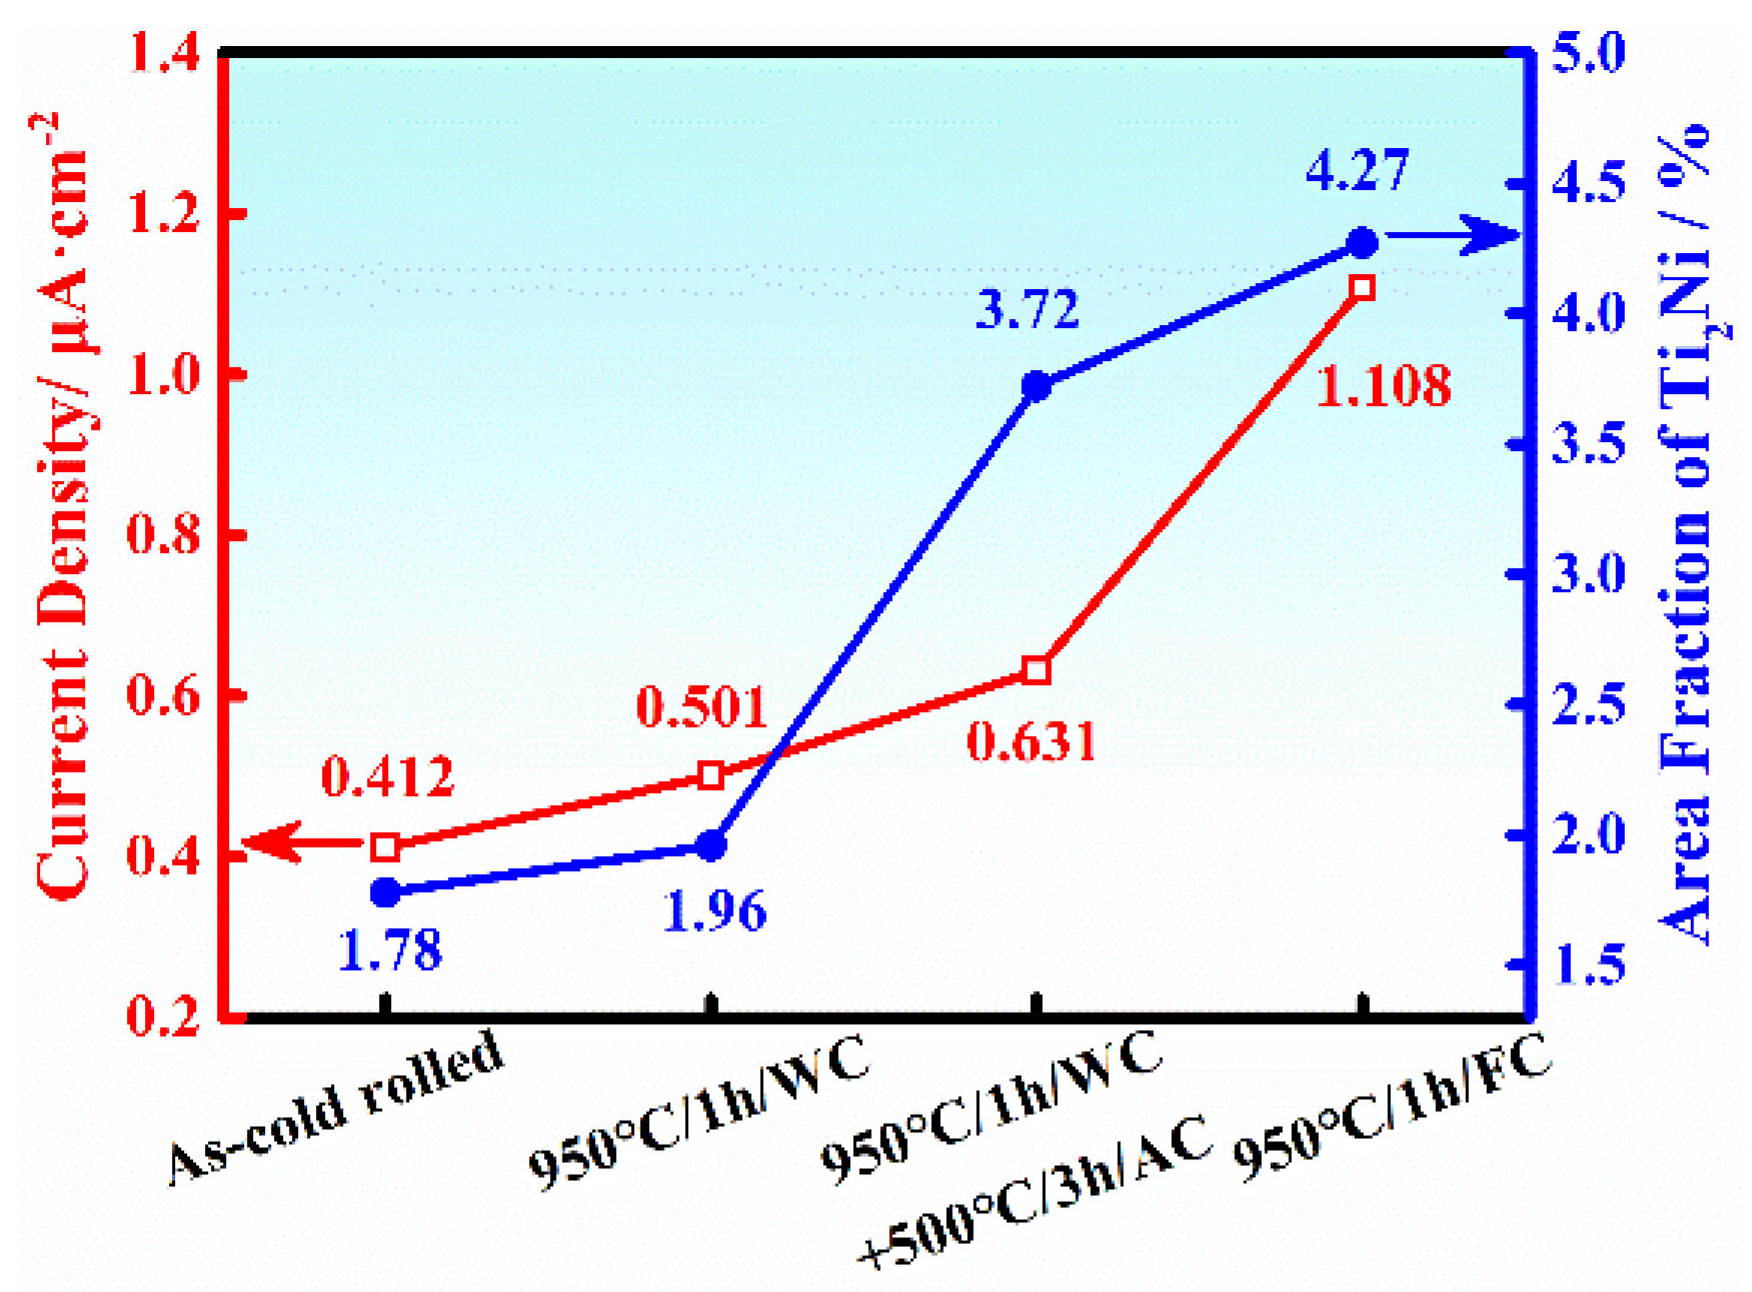
Dispersed Ti2Ni intermetallic compounds are observed in as-cold rolled sheets. In contrast, typical Widmanstatten microstructures can be seen in the case of heat-treated sheets. Amounts of Ti2Ni precipitations increase in the order of as-cold rolled, 950 °C/1 h/WC, 950 °C/1 h/WC + 500 °C/3 h/AC, and 950 °C/1 h/FC treated sheets.
(2)
Mechanical properties of as-cold rolled and heat-treated specimens vary greatly. Elongations of as-cold rolled specimens increase by more than 110% while tensile strengths reduce by more than 47% after heat treatment, improving the formability of the sheets.
(3)
Specimens treated at 950 °C/1 h/WC possess the noblest corrosion potential. In contrast, the steady-state current density of sheets treated at 950 °C/1 h/FC is higher than other sheets. This can be attributed to the adverse effect of Ti2Ni precipitations on the integrity of the passive film.

Author Contributions

Writing−original draft, H.Z.; investigation, H.Z.; formal analysis, H.Z.; writing−review & editing, X.W.; supervision, X.W. and W.M.; methodology, W.M. and F.K.; resources, F.K. All authors have read and agreed to the published version of the manuscript.

Funding

This work was supported by National Key Research and Development Program (2020YFB1505901). This work was also supported by open project of State Key Laboratory of Vanadium and Titanium Resources Comprehensive Utilization (2020P4FZG08A). Their supports are gratefully appreciated by the authors.

Institutional Review Board Statement

Not applicable.

Informed Consent Statement

Not applicable.

Data Availability Statement

Not applicable.

Conflicts of Interest

The authors declare no conflict of interest.

References

  1. Gao, P.; Xie, Z.; Wu, X.; Ouyang, C.; Lei, T.; Yang, P.; Liu, C.; Wang, J.; Ouyang, T.; Huang, Q. Development of Ti bipolar plates with carbon/PTFE/TiN composites coating for PEMFCs. Int. J. Hydrogen Energy 2018, 43, 20947–20958. [Google Scholar] [CrossRef]
  2. Wang, J.; Min, L.; Fang, F.; Zhang, W.; Wang, Y. Electrodeposition of graphene nano-thick coating for highly enhanced performance of titanium bipolar plates in fuel cells. Int. J. Hydrogen Energy 2019, 44, 16909–16917. [Google Scholar] [CrossRef]
  3. Yi, P.; Dong, C.; Zhang, T.; Xiao, K.; Ji, Y.; Wu, J.; Li, X. Effect of plasma electrolytic nitriding on the corrosion behavior and interfacial contact resistance of titanium in the cathode environment of proton-exchange membrane fuel cells. J. Power Sources 2019, 418, 42–49. [Google Scholar] [CrossRef]
  4. Shi, J.; Zhang, P.; Han, Y.; Wang, H.; Wang, X.; Yu, Y.; Sun, J. Investigation on electrochemical behavior and surface conductivity of titanium carbide modified Ti bipolar plate of PEMFC. Int. J. Hydrogen Energy 2020, 45, 10050–10058. [Google Scholar] [CrossRef]
  5. Bi, J.; Yang, J.; Liu, X.; Wang, D.; Yang, Z.; Liu, G.; Wang, X. Development and evaluation of nitride coated titanium bipolar plates for PEM fuel cells. Int. J. Hydrogen Energy 2021, 46, 1144–1154. [Google Scholar] [CrossRef]
  6. Tsuchiya, H. Mass production cost of PEM fuel cell by learning curve. Int. J. Hydrogen Energy 2004, 29, 985–990. [Google Scholar] [CrossRef]
  7. Ma, J.; Zhang, B.; Fu, Y.; Hu, X.; Cao, X.; Pan, Z.; Wei, Y.; Luo, H.; Li, X. Effect of cold deformation on corrosion behavior of selective laser melted 316L stainless steel bipolar plates in a simulated environment for proton exchange membrane fuel cells. Corros. Sci. 2022, 201, 110257. [Google Scholar] [CrossRef]
  8. Gou, Y.; Chen, H.; Li, R.; Geng, J.; Shao, Z. Nb–Cr–C coated titanium as bipolar plates for proton exchange membrane fuel cells. J. Power Sources 2022, 520, 230797. [Google Scholar] [CrossRef]
  9. Yang, L.X.; Liu, R.J.; Wang, Y.; Liu, H.J.; Zeng, C.L.; Fu, C. Corrosion and interfacial contact resistance of nanocrystalline β-Nb2N coating on 430 FSS bipolar plates in the simulated PEMFC anode environment. Int. J. Hydrogen Energy 2021, 46, 32206–32214. [Google Scholar] [CrossRef]
  10. Rojas, N.; Sánchez-Molina, M.; Sevilla, G.; Amores, E.; Almandoz, E.; Esparza, J.; Cruz Vivas, M.R.; Colominas, C. Coated stainless steels evaluation for bipolar plates in PEM water electrolysis conditions. Int. J. Hydrogen Energy 2021, 46, 25929–25943. [Google Scholar] [CrossRef]
  11. Ghorbani, M.M.; Taherian, R.; Bozorg, M. Investigation on physical and electrochemical properties of TiN-coated Monel alloy used for bipolar plates of proton exchange membrane fuel cell. Mater. Chem. Phys. 2019, 238, 121916. [Google Scholar] [CrossRef]
  12. Tsai, S.-Y.; Lin, C.-H.; Jian, Y.-J.; Hou, K.-H.; Ger, M.-D. The fabrication and characteristics of electroless nickel and immersion Au-polytetrafluoroethylene composite coating on aluminum alloy 5052 as bipolar plate. Surf. Coat. Technol. 2017, 313, 151–157. [Google Scholar] [CrossRef]
  13. Lee, Y.H.; Noh, S.; Lee, J.-H.; Chun, S.-H. Durable graphene-coated bipolar plates for polymer electrolyte fuel cells. Int. J. Hydrogen Energy 2017, 42, 27350–27353. [Google Scholar] [CrossRef]
  14. Feng, K.; Kwok, D.T.K.; Liu, D.; Li, Z.; Cai, X.; Chu, P.K. Nitrogen plasma-implanted titanium as bipolar plates in polymer electrolyte membrane fuel cells. J. Power Sources 2010, 195, 6798–6804. [Google Scholar] [CrossRef]
  15. Tomashov, N.D.; Altovsky, R.M.; Chernova, G.P. Passivity and Corrosion Resistance of Titanium and Its Alloys. J. Electrochem. Soc. 1961, 108, 113. [Google Scholar] [CrossRef]
  16. Sedriks, A.J.; Green, J.A.S.; Novak, D.L. Electrochemical Behavior of Ti-Ni Alloys in Acidic Chloride Solutions. Corrosion 1972, 28, 137–142. [Google Scholar] [CrossRef]
  17. Bonilla, F.A.; Ong, T.S.; Skeldon, P.; Thompson, G.E.; Piekoszewski, J.; Chmielewski, A.G.; Sartowska, B.; Stanislawski, J. Enhanced corrosion resistance of titanium foil from nickel, nickel-molybdenum and palladium surface alloying by high intensity pulsed plasmas. Corros. Sci. 2003, 45, 403–412. [Google Scholar] [CrossRef]
  18. Wang, Z.B.; Hu, H.X.; Zheng, Y.G.; Ke, W.; Qiao, Y.X. Comparison of the corrosion behavior of pure titanium and its alloys in fluoride-containing sulfuric acid. Corros. Sci. 2016, 103, 50–65. [Google Scholar] [CrossRef]
  19. Glass, R.S. Effect of intermetallic Ti2Ni on the electrochemistry of TiCODE-12 in hydrochloric acid. Electrochim. Acta 1983, 28, 1507–1513. [Google Scholar] [CrossRef]
  20. Ruppen, J.A.; Diegle, R.B.; Glass, R.S.; Headley, T.J. Some Effects of Microstructure and Chemistry on Corrosion and Hydrogen Embrittlement of Ticode–12. MRS Proc. 1982, 15, 471–474. [Google Scholar] [CrossRef]
  21. Osório, W.R.; Cremasco, A.; Andrade, P.N.; Garcia, A.; Caram, R. Electrochemical behavior of centrifuged cast and heat treated Ti–Cu alloys for medical applications. Electrochim. Acta 2010, 55, 759–770. [Google Scholar] [CrossRef]
  22. Kong, D.S. The influence of fluoride on the physicochemical properties of anodic oxide films formed on titanium surfaces. Langmuir ACS J. Surf. Colloids 2008, 24, 5324. [Google Scholar] [CrossRef] [PubMed]
  23. Utomo, W.B.; Donne, S.W. Electrochemical behaviour of titanium in H2SO4–MnSO4 electrolytes. Electrochim. Acta 2006, 51, 3338–3345. [Google Scholar] [CrossRef]
  24. Wang, Z.B.; Hu, H.X.; Zheng, Y.G. Determination and explanation of the pH-related critical fluoride concentration of pure titanium in acidic solutions using electrochemical methods. Electrochim. Acta 2015, 170, 300–310. [Google Scholar] [CrossRef]
  25. Su, B.; Luo, L.; Wang, B.; Su, Y.; Wang, L.; Ritchie, R.O.; Guo, E.; Li, T.; Yang, H.; Huang, H.; et al. Annealed microstructure dependent corrosion behavior of Ti-6Al-3Nb-2Zr-1Mo alloy. J. Mater. Sci. Technol. 2021, 62, 234–248. [Google Scholar] [CrossRef]
  26. Su, B.; Wang, B.; Luo, L.; Wang, L.; Su, Y.; Wang, F.; Xu, Y.; Han, B.; Huang, H.; Guo, J.; et al. The corrosion behavior of Ti-6Al-3Nb-2Zr-1Mo alloy: Effects of HCl concentration and temperature. J. Mater. Sci. Technol. 2021, 74, 143–154. [Google Scholar] [CrossRef]
  27. Cvijović-Alagić, I.; Laketić, S.; Bajat, J.; Hohenwarter, A.; Rakin, M. Grain refinement effect on the Ti-45Nb alloy electrochemical behavior in simulated physiological solution. Surf. Coat. Technol. 2021, 423, 127609. [Google Scholar] [CrossRef]
  28. Ji, P.F.; Li, B.; Chen, B.H.; Wang, F.; Ma, W.; Zhang, X.Y.; Ma, M.Z.; Liu, R.P. Effect of Nb addition on the stability and biological corrosion resistance of Ti-Zr alloy passivation films. Corros. Sci. 2020, 170, 108696. [Google Scholar] [CrossRef]
  29. Robin, A.; Meirelis, J.P. Influence of fluoride concentration and pH on corrosion behavior of titanium in artificial saliva. J. Appl. Electrochem. 2007, 37, 511–517. [Google Scholar] [CrossRef]
  30. Metikoš-Huković, M.; Kwokal, A.; Piljac, J. The influence of niobium and vanadium on passivity of titanium-based implants in physiological solution. Biomaterials 2003, 24, 3765–3775. [Google Scholar] [CrossRef]
  31. Wang, Z.B.; Hu, H.X.; Liu, C.B.; Zheng, Y.G. The effect of fluoride ions on the corrosion behavior of pure titanium in 0.05 M sulfuric acid. Electrochim. Acta 2014, 135, 526–535. [Google Scholar] [CrossRef]
  32. Imani, A.; Asselin, E. Fluoride induced corrosion of Ti-45Nb in sulfuric acid solutions. Corros. Sci. 2021, 181, 109232. [Google Scholar] [CrossRef]
  33. Kumar, S.; Sankara Narayanan, T.S.N.; Saravana Kumar, S. Influence of fluoride ion on the electrochemical behaviour of β-Ti alloy for dental implant application. Corros. Sci. 2010, 52, 1721–1727. [Google Scholar] [CrossRef]
  34. Zhang, H.; Man, C.; Dong, C.; Wang, L.; Li, W.; Kong, D.; Wang, L.; Wang, X. The corrosion behavior of Ti6Al4V fabricated by selective laser melting in the artificial saliva with different fluoride concentrations and pH values. Corros. Sci. 2021, 179, 109097. [Google Scholar] [CrossRef]
  35. Li, X.; Wang, L.; Fan, L.; Cui, Z.; Sun, M. Effect of temperature and dissolved oxygen on the passivation behavior of Ti–6Al–3Nb–2Zr–1Mo alloy in artificial seawater. J. Mater. Res. Technol. 2022, 17, 374–391. [Google Scholar] [CrossRef]
  36. Tang, J.; Luo, H.; Qi, Y.; Xu, P.; Lv, J.; Ma, Y.; Zhang, Z. Effect of nano-scale martensite and β phase on the passive film formation and electrochemical behaviour of Ti-10V-2Fe-3Al alloy in 3.5% NaCl solution. Electrochim. Acta 2018, 283, 1300–1312. [Google Scholar] [CrossRef]
  37. Siddiqui, M.A.; Ren, L.; Macdonald, D.D.; Yang, K. Effect of Cu on the passivity of Ti–xCu (x = 0, 3 and 5 wt%) alloy in phosphate-buffered saline solution within the framework of PDM-II. Electrochim. Acta 2021, 386, 138466. [Google Scholar] [CrossRef]
Figure 1. SEM photographs of Ti-0.3Ni sheets treated by different processes in various magnification in SE imaging mode: (a,b) as-cold rolled, (c,d) treated at 950 °C/1 h/WC, (e,f) treated at 950 °C/1 h/WC + 500 °C/3 h/AC and (g,h) treated at 950 °C/1 h/FC.
Metals 12 00792 g001
Figure 2. Room temperature tensile testing results of as-cold rolled and heat treated sheets: (a) engineering stress-strain curves, (b) ultimate tensile strengths and elongations of the specimens.
Metals 12 00792 g002
Figure 3. OCPs of as−cold rolled and solid solution treated sheets versus immersion time in naturally aerated 0.5 M H2SO4 + 5 ppm F solution at 80 °C.
Metals 12 00792 g003
Figure 4. Potentiodynamic polarization of as-cold rolled and solid solution sheets in naturally aerated 0.5 M H2SO4 + 5 ppm F solution: (a) overall curves and (b) magnified curves near active region of each specimen.
Metals 12 00792 g004
Figure 5. EIS results of as−cold rolled and heat treated sheets in naturally aerated 0.5 M H2SO4 + 5 ppm F solution: (a) Bode plots and (b) Nyquist plots.
Metals 12 00792 g005
Figure 6. Equivalent circuit used to fit impedance data.
Metals 12 00792 g006
Figure 7. Variations of Rpol as a function of heat treatment process.
Metals 12 00792 g007
Figure 8. Current transients of heat treated specimens in simulated PEMFC solution at 0.6 V: (a) current density-time curves of the specimens, (b) magnification of dashed rectangular region marked in Figure 7a.
Metals 12 00792 g008
Figure 9. Variation of steady state current densities polarized at 0.6 V for 6 h and Ti2Ni area fraction of different specimens.
Metals 12 00792 g009
Table 1. Mechanical properties of as-cold rolled and heat treated sheets.
SpecimenTensile Strength
/MPa
Yield Strength
/MPa
Elongation
/%
As-cold rolled-RD733.6610.26.12
As-cold rolled-TD748.8564.02.01
950 °C/1 h/WC-RD374.3269.219.1
950 °C/1 h/WC-TD376.8281.022.3
950 °C/1 h/WC
+500 °C/3 h/AC-RD
385.1291.220.8
950 °C/1 h/WC
+500 °C/3 h/AC-TD
375.3282.420.3
950 °C/1 h/FC-RD356.3261.515.7
950 °C /1 h/FC-TD341.5256.021.0
Table 2. Equivalent circuit parameters for as-cold rolled and heat treated sheets in naturally aerated 0.5 M H2SO4 + 5 ppm F solution.
SpecimenRs /
Ω·cm2
Qdl /
mS·cm−2·sn
ndlRct /
Ω·cm2
Qf /
mS·cm−2·sn
nfRf /
Ω·cm2
χ2 /10−3
Process 1 *7.060.500.9118.050.40.8425.90.56
Process 29.820.480.8930.529.50.8690.90.94
Process 36.671.310.8710.491.20.9120.10.67
Process 413.640.560.9216.654.20.8625.40.31
*: Process 1 represents cold rolling. Process 2 represents 950 °C/1 h/WC treatment. Process 3 represents 950 °C/1 h/WC + 500 °C/3 h/AC treatment. Process 4 represents 950 °C/1 h/FC treatment.
Publisher’s Note: MDPI stays neutral with regard to jurisdictional claims in published maps and institutional affiliations.

