
Beam Shaping in Laser Powder Bed Fusion: Péclet Number and Dynamic Simulation

 , ,
, ,  ,
,  ,
,  ,
,  and
and 
Abstract
:1. Introduction
- Airy distribution of the first harmonic (donut) TEM01* = TEM01 + TEM10;
- Uniform cylindrical (flat-top) distribution TEMFT = TEM01* + TEM00.
- -
- -
- -
- laser power, spot size, and laser power distribution among the laser system and optic parameters,
- scanning speed and strategy and hatch distance among strategy parameters,
- powder particle size, shape and morphology, and layer thickness among powder parameters,
- inertness of the atmosphere, impermeability of the chamber, dimensions of the part on the working platform (maximum angle of deviation of the beam from the vertical), and so on.
2. Numerical Simulations
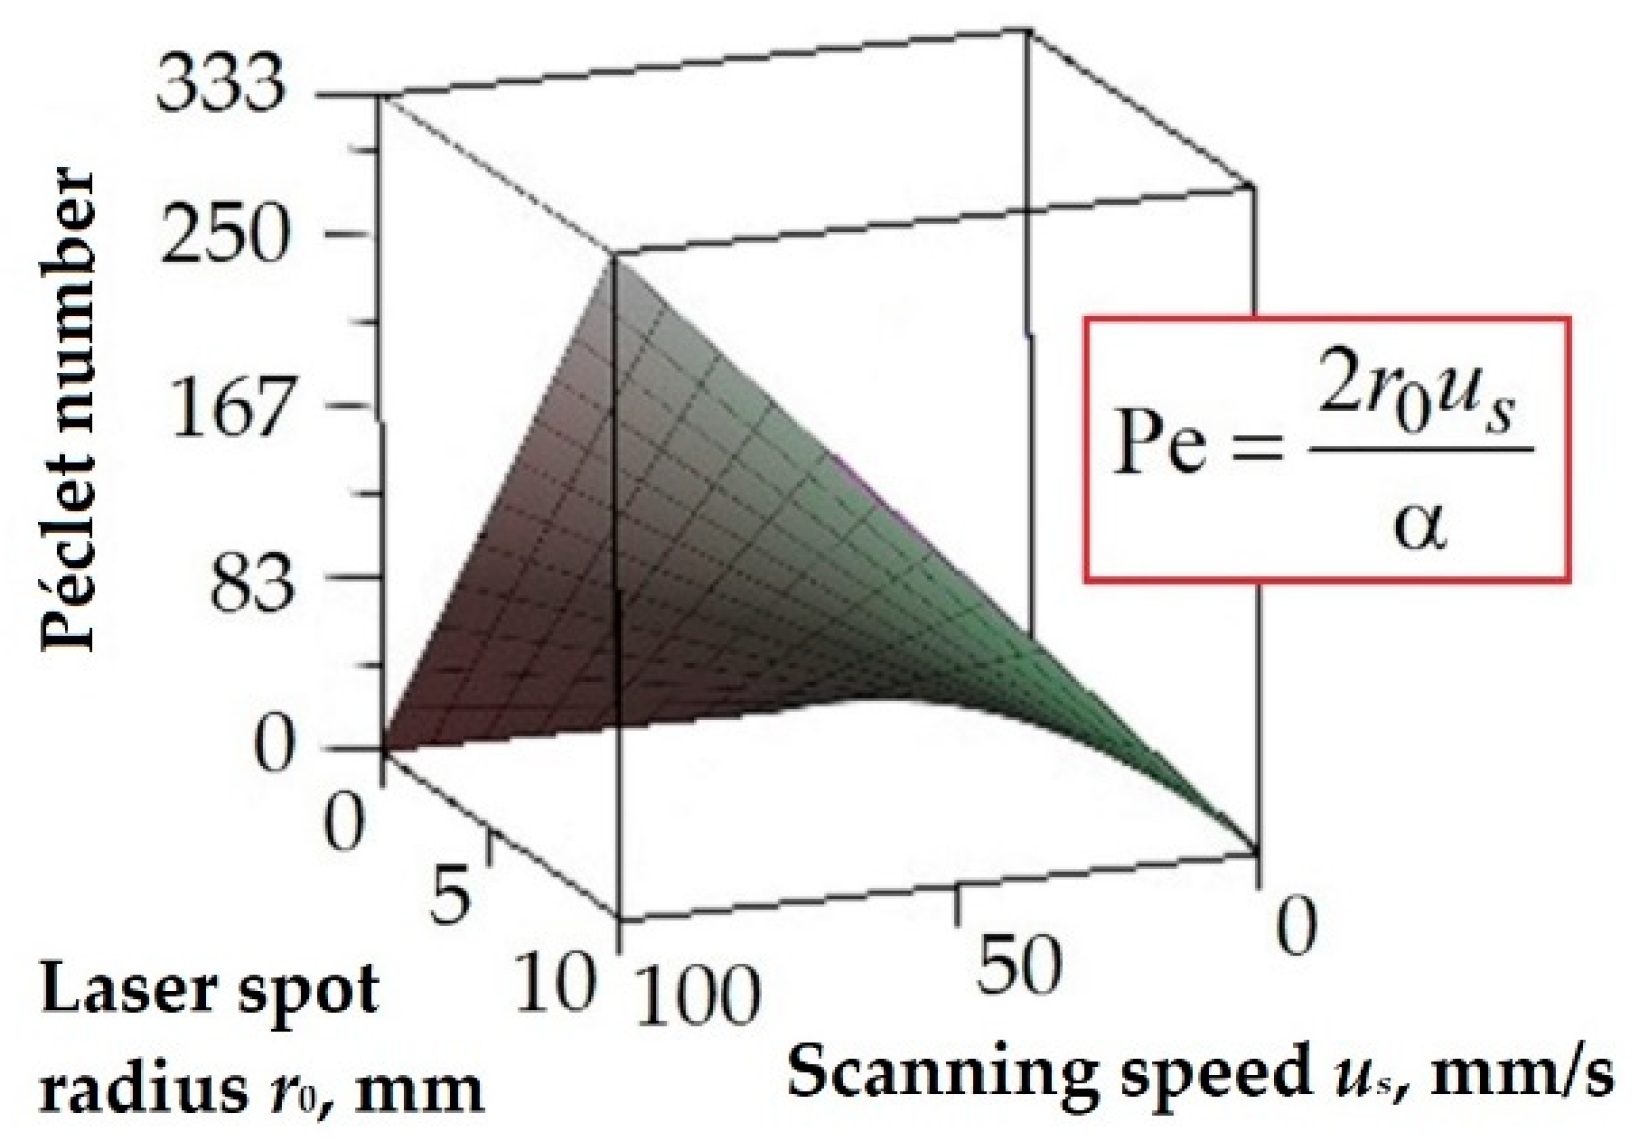
2.1. Simulations and Influence of Scanning Speed
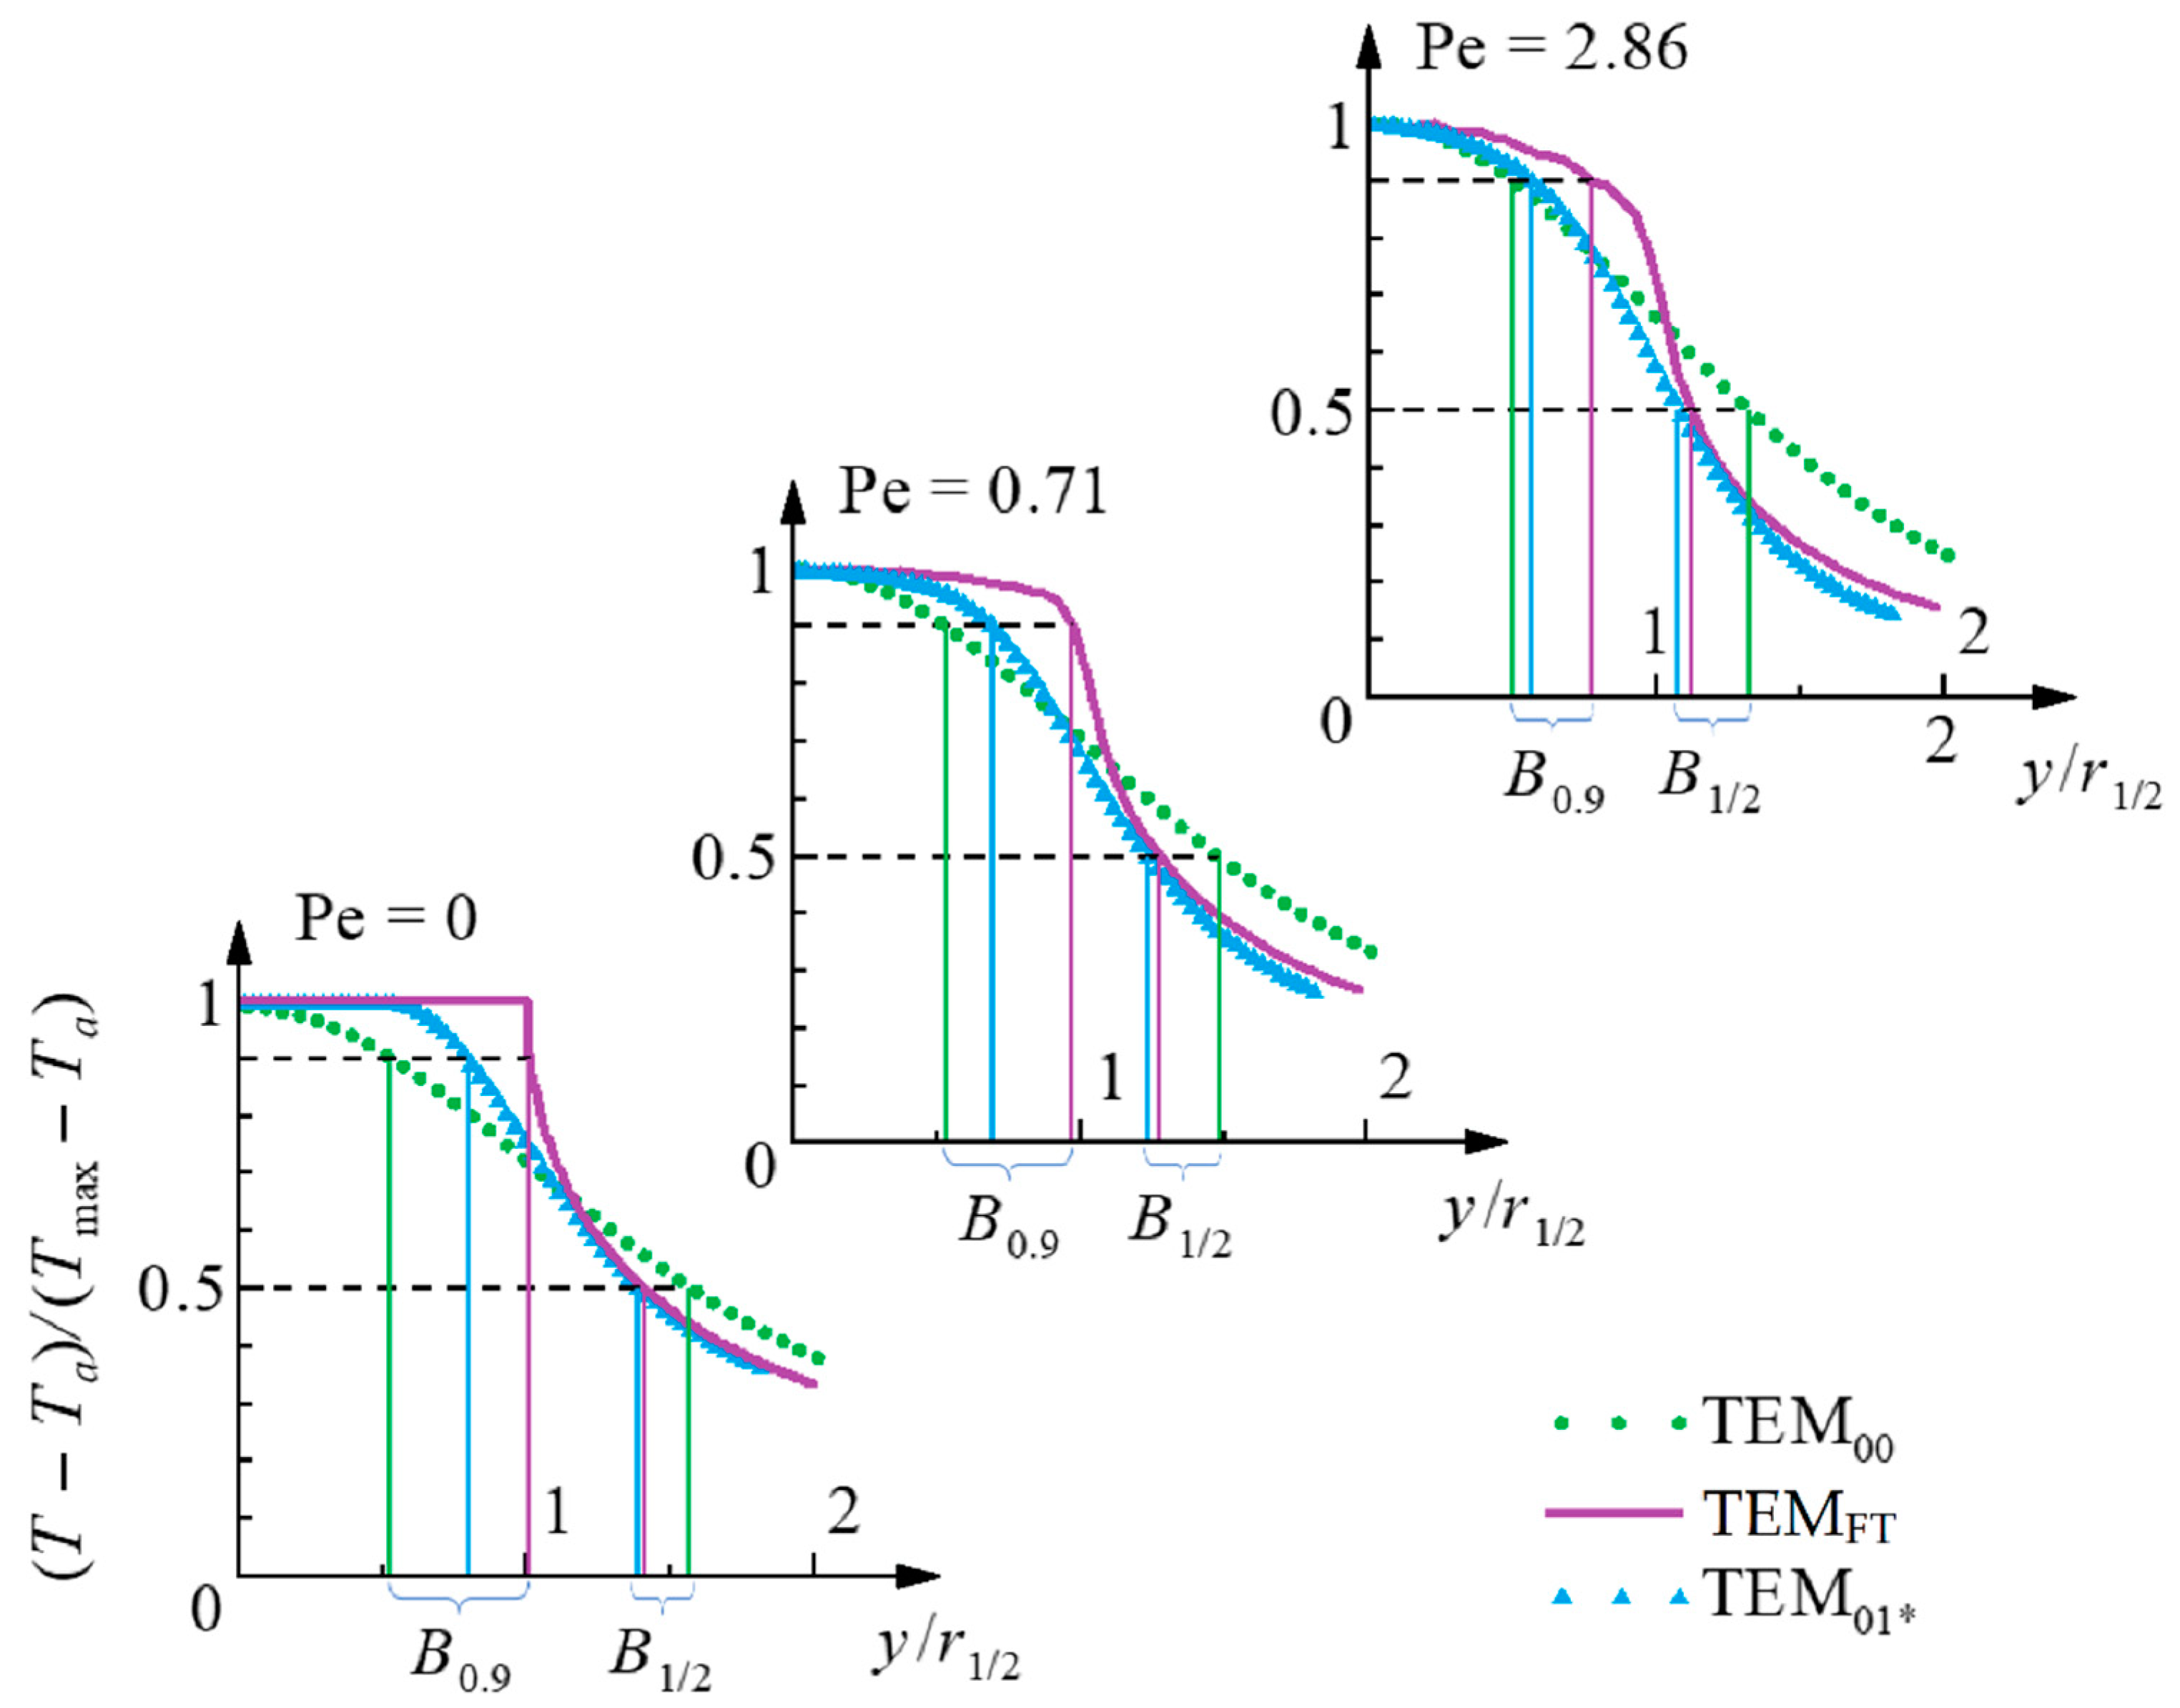
2.2. Temperature and Energy Flux Profiles
3. Model Evaluation
3.1. Quantitative Evaluation
3.2. Dynamic Evaluation
4. Discussion
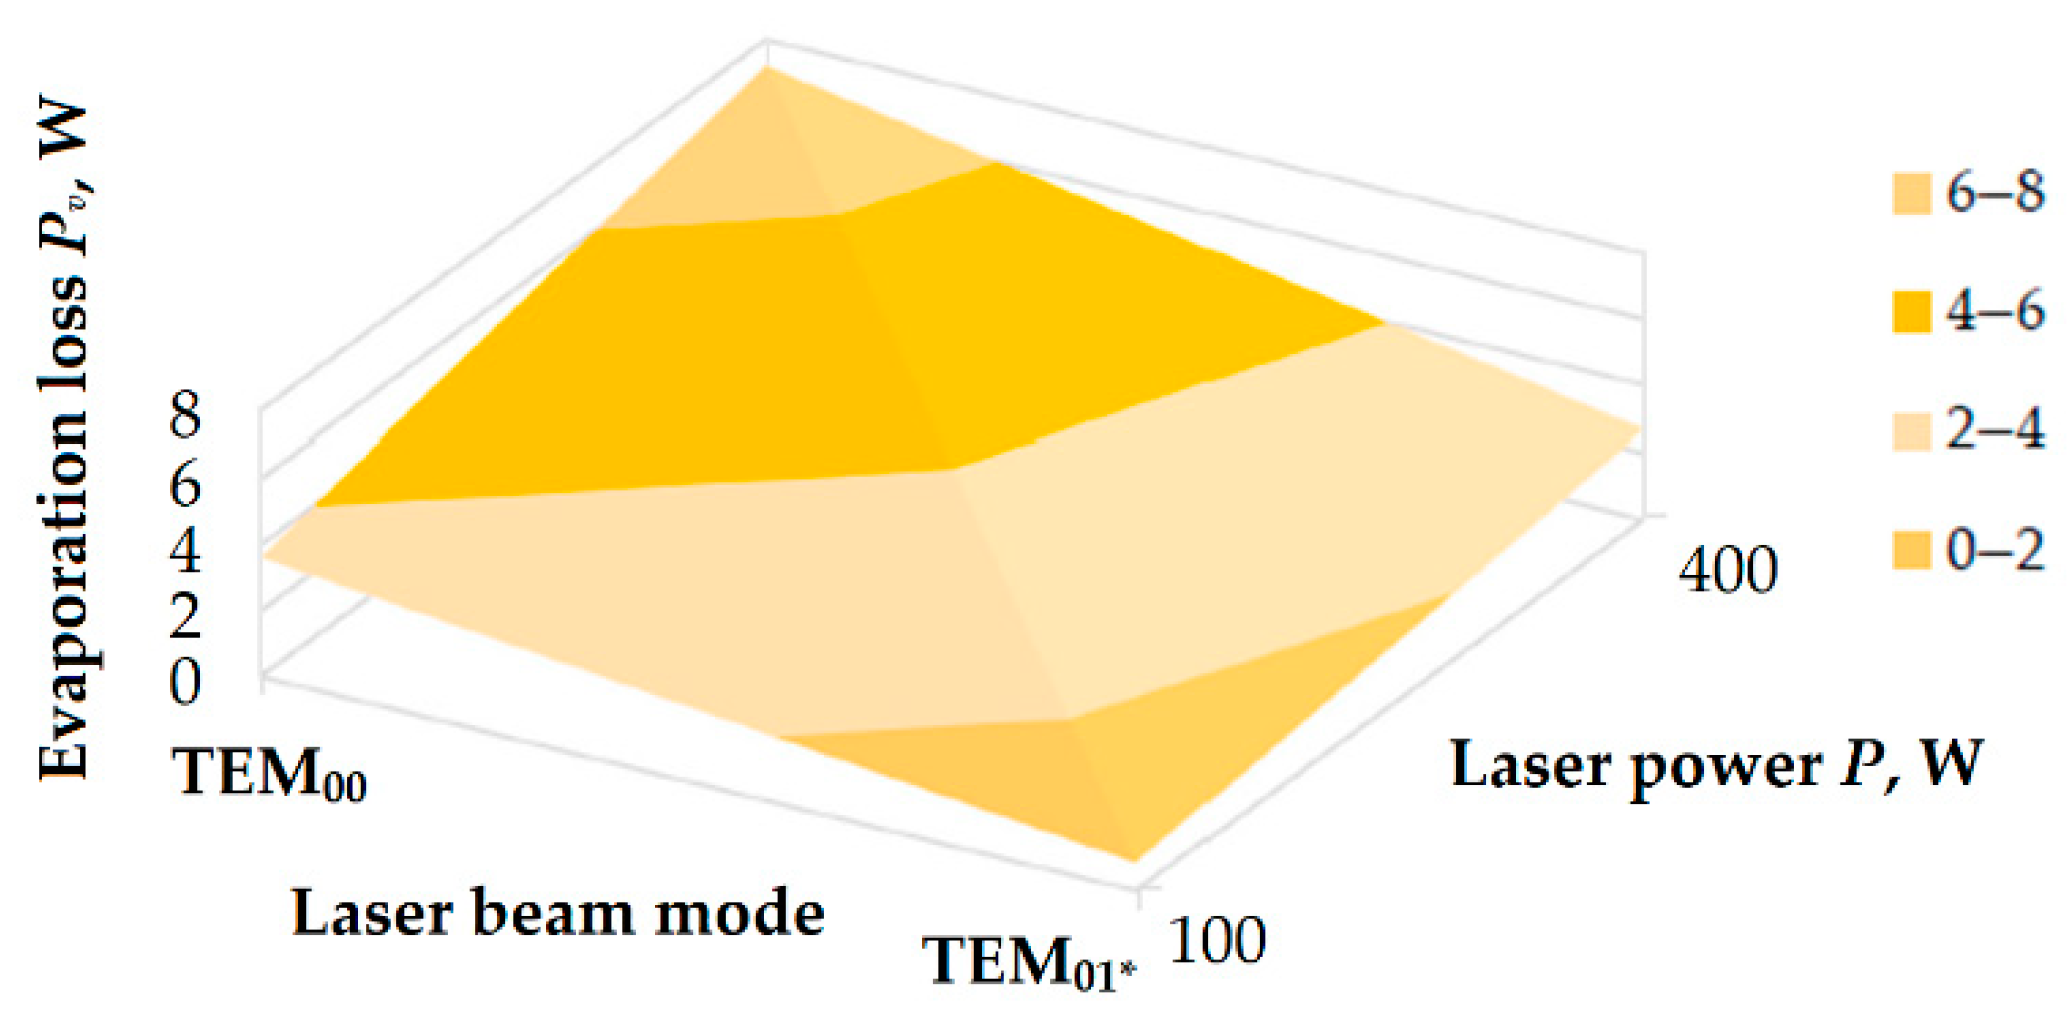
- avoiding overheating in the centrum of the melt pool and consequences such as material loss on evaporation and ejecting granules from the melt pool of thermal heat with the laser power set at more than 100 W;
- avoiding secondary remelting and involvement of the previously solidified layers in the newly formed melt pool; and
- melt ejection under steam pressure.
5. Conclusions
Author Contributions
Funding
Institutional Review Board Statement
Informed Consent Statement
Data Availability Statement
Acknowledgments
Conflicts of Interest
References
- Lee, W.J.; Kim, E.A.; Woo, Y.J.; Park, I.; Yu, J.H.; Ha, T.; Choi, Y.S.; Lee, H.S. Effect of different WC particle shapes on laser-exposed microstructures during the directed energy deposition. Powder Metall. 2022, 65, 22–30. [Google Scholar] [CrossRef]
- Ahsan, F.; Razmi, J.; Ladani, L. Process Parameter Optimization in Metal Laser-Based Powder Bed Fusion Using Image Processing and Statistical Analyses. Metals 2022, 12, 87. [Google Scholar] [CrossRef]
- Gurin, V.D.; Kotoban, D.V.; Podrabinnik, P.A.; Zhirnov, I.V.; Peretyagin, P.Y.; Okunkova, A.A. Modeling of 3D technological fields and research of principal perspectives and limits in productivity improvement of selective laser melting. Mech. Ind. 2016, 17, 714. [Google Scholar] [CrossRef] [Green Version]
- Khairallah, A.; Anderson, A.T.; Rubenchik, A.; King, W.E. Laser powder-bed fusion additive manufacturing: Physics of complex melt flow and formation mechanisms of pores, spatter, and denudation zones. Acta Mater. 2016, 108, 36–45. [Google Scholar] [CrossRef] [Green Version]
- Sova, A.; Grigoriev, S.; Okunkova, A.; Smurov, I. Potential of cold gas dynamic spray as additive manufacturing technology. Int. J. Adv. Manuf. Technol. 2013, 69, 2269–2278. [Google Scholar] [CrossRef]
- Sova, A.; Grigoriev, S.; Okunkova, A.; Sova, A.; Bertrand, P.; Smurov, I. Cold spraying: From process fundamentals towards advanced applications. Surf. Coat. Technol. 2015, 268, 77–84. [Google Scholar]
- Monte, A.F.G.; Alves, G.A.; Marques, F.A.M. Thermal conductivity determination of erbium-doped crystals measured by spatially resolved confocal luminescence. Appl. Opt. 2018, 57, 7910–7914. [Google Scholar] [CrossRef]
- Patel, S.; Reddy, P.; Kumar, A. A methodology to integrate melt pool convection with rapid solidification and undercooling kinetics in laser spot welding. Int. J. Heat Mass Transf. 2021, 164, 120575. [Google Scholar] [CrossRef]
- Zhou, J.; Tsai, H.L. Modeling of transport phenomena in hybrid laser-MIG keyhole welding. Int. J. Heat Mass Transf. 2008, 51, 4353–4366. [Google Scholar] [CrossRef]
- Doan, H.D.; Naoki, I.; Kazuyoshi, F. Laser processing by using fluidic laser beam shaper. Int. J. Heat Mass Transf. 2013, 64, 263–268. [Google Scholar] [CrossRef]
- Litvin, I.A.; King, G.; Strauss, H. Beam shaping laser with controllable gain. Appl. Phys. B-Lasers Opt. 2017, 123, 1–5. [Google Scholar] [CrossRef]
- Xia, X.P.; Cai, Z.B.; Yi, L. The splitted beam profile of laser beam in the interaction of intense lasers with overdense plasmas. Laser Part. Beams 2011, 29, 161–168. [Google Scholar] [CrossRef]
- Gusarova, A.V.; Chumaevskii, A.V.; Osipovich, K.S.; Kalashnikov, K.N.; Kalashnikova, T.A. Regularities of Structural Changes after Friction Stir Processing in Materials Obtained by the Additive Method. Nanosci. Technol.-Int. J. 2020, 11, 195–205. [Google Scholar] [CrossRef]
- Barro, Ó.; Arias-González, F.; Lusquiños, F.; Comesaña, R.; del Val, J.; Riveiro, A.; Badaoui, A.; Gómez-Baño, F.; Pou, J. Effect of Four Manufacturing Techniques (Casting, Laser Directed Energy Deposition, Milling and Selective Laser Melting) on Microstructural, Mechanical and Electrochemical Properties of Co-Cr Dental Alloys, Before and After PFM Firing Process. Metals 2020, 10, 1291. [Google Scholar] [CrossRef]
- Sendino, S.; Gardon, M.; Lartategui, F.; Martinez, S.; Lamikiz, A. The Effect of the Laser Incidence Angle in the Surface of L-PBF Processed Parts. Coatings 2020, 10, 1024. [Google Scholar] [CrossRef]
- Nalivaiko, A.Y.; Arnautov, A.N.; Zmanovsky, S.V.; Gromov, A.A. Al-Si-Cu and Al-Si-Cu-Ni alloys for additive manufacturing: Composition, morphology and physical characteristics of powders. Mater. Res. Express 2019, 6, 086536. [Google Scholar] [CrossRef]
- Zavalov, Y.N.; Dubrov, A.V. Short Time Correlation Analysis of Melt Pool Behavior in Laser Metal Deposition Using Coaxial Optical Monitoring. Sensors 2021, 21, 8402. [Google Scholar] [CrossRef]
- Chen, J.H.; Zhao, C.C.; Li, K.L.; Shen, Z.J.; Liu, W. Formability and Controlling of Cracks in Laser Powder Bed Fusion of Tungsten-5% Tantalum Carbide Alloys. Chin. J. Lasers-Zhongguo Jiguang 2021, 48, 1502006. [Google Scholar]
- Alberti, E.A.; Bueno, B.M.P.; D’Oliveira, A.S.C.M. Additive manufacturing using plasma transferred arc. Int. J. Adv. Manuf. Technol. 2016, 83, 1861–1871. [Google Scholar] [CrossRef]
- Kishore, V.; Ajinjeru, C.; Nycz, A.; Post, B.; Lindahl, J.; Kunc, V.; Duty, C. Infrared preheating to improve interlayer strength of big area additive manufacturing (BAAM) components. Addit. Manuf. 2017, 14, 7–12. [Google Scholar] [CrossRef]
- Fateri, M.; Kaouk, A.; Cowley, A.; Siarov, S.; Palou, M.V.; Gonzalez, F.G.; Marchant, R.; Cristoforetti, S.; Sperl, M. Feasibility study on additive manufacturing of recyclable objects for space applications. Addit. Manuf. 2018, 24, 400–404. [Google Scholar] [CrossRef]
- Sleiman, K.; Rettschlag, K.; Jaschke, P.; Capps, N.; Kinzel, E.C.; Overmeyer, L.; Kaierle, S. Material loss analysis in glass additive manufacturing by laser glass deposition. J. Laser Appl. 2021, 33, 042050. [Google Scholar] [CrossRef]
- Żrodowski, Ł.; Wróblewski, R.; Choma, T.; Morończyk, B.; Ostrysz, M.; Leonowicz, M.; Łacisz, W.; Błyskun, P.; Wróbel, J.S.; Cieślak, G.; et al. Novel Cold Crucible Ultrasonic Atomization Powder Production Method for 3D Printing. Materials 2021, 14, 2541. [Google Scholar] [CrossRef] [PubMed]
- Harkin, R.; Wu, H.; Nikam, S.; Quinn, J.; McFadden, S. Analysis of Spatter Removal by Sieving during a Powder-Bed Fusion Manufacturing Campaign in Grade 23 Titanium Alloy. Metals 2021, 11, 399. [Google Scholar] [CrossRef]
- Zubko, M.; Loskot, J.; Świec, P.; Prusik, K.; Janikowski, Z. Analysis of Stainless Steel Waste Products Generated during Laser Cutting in Nitrogen Atmosphere. Metals 2020, 10, 1572. [Google Scholar] [CrossRef]
- Metel, A.S.; Grigoriev, S.N.; Tarasova, T.V.; Melnik, Y.A.; Volosova, M.A.; Okunkova, A.A.; Podrabinnik, P.A.; Mustafaev, E.S. Surface Quality of Metal Parts Produced by Laser Powder Bed Fusion: Ion Polishing in Gas-Discharge Plasma Proposal. Technologies 2021, 9, 27. [Google Scholar] [CrossRef]
- Okunkova, A.; Peretyagin, P.; Vladimirov, Y.; Volosova, M.; Torrecillas, R.; Fedorov, S.V. Laser-beam modulation to improve efficiency of selecting laser melting for metal powders. In Proceedings of the Conference on Laser Sources and Applications II, Laser Sources and Applications II, Brussels, Belgium, 14–17 April 2014; Mackenzie, J.I., Jelinkova, H., Taira, T., Ahmed, M.A., Eds.; SPIE-Int Soc Optical Engineering: Bellingham, WA, USA, 2014; Volume 9135, p. 913524. [Google Scholar]
- Zhirnov, I.V.; Podrabinnik, P.A.; Okunkova, A.A.; Gusarov, A.V. Laser beam profiling: Experimental study of its influence on single-track formation by selective laser melting. Mech. Ind. 2015, 16, 709. [Google Scholar] [CrossRef] [Green Version]
- Wang, S.D.; Zhang, X.; Zheng, Y.; Li, B.W.; Qin, H.T.; Li, Q. Similarity evaluation of 3D surface topography measurements. Meas. Sci. Technol. 2021, 32, 125003. [Google Scholar] [CrossRef]
- Sagbas, B.; Gumus, B.E.; Kahraman, Y.; Dowling, D.P. Impact of print bed build location on the dimensional accuracy and surface quality of parts printed by multi jet fusion. J. Manuf. Processes 2021, 70, 290–299. [Google Scholar] [CrossRef]
- Zakharov, O.V.; Brzhozovskii, B.M. Accuracy of centering during measurement by roundness gauges. Meas. Tech. 2006, 49, 1094–1097. [Google Scholar] [CrossRef]
- Rezchikov, A.F.; Kochetkov, A.V.; Zakharov, O.V. Mathematical models for estimating the degree of influence of major factors on performance and accuracy of coordinate measuring machines. MATEC Web Conf. 2017, 129, 01054. [Google Scholar] [CrossRef] [Green Version]
- Zakharov, O.V.; Balaev, A.F.; Kochetkov, A.V. Modeling Optimal Path of Touch Sensor of Coordinate Measuring Machine Based on Traveling Salesman Problem Solution. Procedia Eng. 2017, 206, 1458–1463. [Google Scholar] [CrossRef]
- Wu, J.; Tao, K.; Miao, J.M. Production of centimeter-scale sub-wavelength nanopatterns by controlling the light path of adhesive photomasks. J. Mater. Chem. C. 2015, 3, 6796–6808. [Google Scholar] [CrossRef]
- Sima, C.; Gates, J.C.; Rogers, H.L.; Mennea, P.L.; Holmes, C.; Zervas, M.N.; Smith, P.G.R. Phase controlled integrated interferometric single-sideband filter based on planar Bragg gratings implementing photonic Hilbert transform. Opt. Lett. 2013, 38, 727–729. [Google Scholar] [CrossRef] [Green Version]
- Raciukaitis, G.; Stankevicius, E.; Gecys, P.; Gedvilas, M.; Bischoff, C.; Jager, E.; Umhofer, U.; Volklein, F. Laser Processing by Using Diffractive Optical Laser Beam Shaping Technique. J. Laser Micro Nanoeng. 2011, 6, 37–43. [Google Scholar] [CrossRef]
- Nammi, S.; Vasa, N.J.; Balaganesan, G.; Gupta, S.; Mathur, A.C. Influence of pulsed Nd3+: YAG laser beam profile and wavelength on microscribing of copper and aluminum thin films. J. Micro-Nanolithography Mems Moems 2015, 14, 044503. [Google Scholar] [CrossRef]
- Zhu, R.; Zhang, Y.K.; Lin, C.H.; Chen, Y. Residual stress distribution and surface geometry of medical Ti13Nb13Zr alloy treated by laser shock peening with flat-top laser beam. Surf. Topogr.-Metrol. Prop. 2020, 8, 045026. [Google Scholar] [CrossRef]
- Yen, W.C.; Huang, C.T.; Liu, H.P.; Lee, L.P. A Nd:YAG laser with a flat-top beam profile and constant divergence. Opt. Laser Technol. 1997, 29, 57–61. [Google Scholar] [CrossRef]
- Wu, T.N.; Wu, Z.P.; He, Y.C.; Zhu, Z.; Wang, L.X.; Yin, K. Femtosecond laser textured porous nanowire structured glass for enhanced thermal imaging. Chin. Opt. Lett. 2022, 20, 033801. [Google Scholar] [CrossRef]
- Yin, K.; Wu, Z.P.; Wu, J.R.; Zhu, Z.; Zhang, F.; Duan, J.A. Solar-driven thermal-wind synergistic effect on laser-textured superhydrophilic copper foam architectures for ultrahigh efficient vapor generation. Appl. Phys. Lett. 2021, 118, 211905. [Google Scholar] [CrossRef]
- Aleksandrova, M.; Nikolov, N.; Pandiev, I. Thermo-Stimulation of Charges by Peltier Element for Trap Analysis in Polymer Layers. Int. J. Polym. Anal. Charact. 2011, 16, 221–227. [Google Scholar] [CrossRef]
- Gusarov, A.V. Radiative transfer, absorption, and reflection by metal powder beds in laser powder-bed processing. J. Quant. Spectrosc. Radiat. Transf. 2020, 257, 107366. [Google Scholar] [CrossRef]
- Yu, H.; Hayashi, S.; Kakehi, K.; Kuo, Y.-L. Study of Formed Oxides in IN718 Alloy during the Fabrication by Selective Laser Melting and Electron Beam Melting. Metals 2019, 9, 19. [Google Scholar] [CrossRef] [Green Version]
- Cao, Y.; Bai, P.; Liu, F.; Hou, X. Investigation on the Precipitates of IN718 Alloy Fabricated by Selective Laser Melting. Metals 2019, 9, 1128. [Google Scholar] [CrossRef] [Green Version]
- Qin, Y.; Liu, J.; Chen, Y.; Wen, P.; Zheng, Y.; Tian, Y.; Voshage, M.; Schleifenbaum, J.H. Influence of Laser Energy Input and Shielding Gas Flow on Evaporation Fume during Laser Powder Bed Fusion of Zn Metal. Materials 2021, 14, 2677. [Google Scholar] [CrossRef]
- Gokcekaya, O.; Ishimoto, T.; Todo, T.; Suganuma, R.; Fukushima, R.; Narushima, T.; Nakano, T. Effect of Scan Length on Densification and Crystallographic Texture Formation of Pure Chromium Fabricated by Laser Powder Bed Fusion. Crystals 2021, 11, 9. [Google Scholar] [CrossRef]
- Grigoriev, S.N.; Metel, A.S.; Tarasova, T.V.; Filatova, A.A.; Sundukov, S.K.; Volosova, M.A.; Okunkova, A.A.; Melnik, Y.A.; Podrabinnik, P.A. Effect of Cavitation Erosion Wear, Vibration Tumbling, and Heat Treatment on Additively Manufactured Surface Quality and Properties. Metals 2020, 10, 1540. [Google Scholar] [CrossRef]
- Wang, J.-H.; Ren, J.; Liu, W.; Wu, X.-Y.; Gao, M.-X.; Bai, P.-K. Effect of Selective Laser Melting Process Parameters on Microstructure and Properties of Co-Cr Alloy. Materials 2018, 11, 1546. [Google Scholar] [CrossRef] [Green Version]
- Metel, A.S.; Stebulyanin, M.M.; Fedorov, S.V.; Okunkova, A.A. Power Density Distribution for Laser Additive Manufacturing (SLM): Potential, Fundamentals and Advanced Applications. Technologies 2019, 7, 5. [Google Scholar] [CrossRef] [Green Version]
- Kopec, M.; Jóźwiak, S.; Kowalewski, Z.L. A Novel Microstructural Evolution Model for Growth of Ultra-Fine Al2O3 Oxides from SiO2 Silica Ceramic Decomposition during Self-Propagated High-Temperature Synthesis. Materials 2020, 13, 2821. [Google Scholar] [CrossRef]
- Bulina, N.V.; Makarova, S.V.; Baev, S.G.; Matvienko, A.A.; Gerasimov, K.B.; Logutenko, O.A.; Bystrov, V.S. A Study of Thermal Stability of Hydroxyapatite. Minerals 2021, 11, 1310. [Google Scholar] [CrossRef]
- Kuzin, V.V.; Grigor’ev, S.N.; Volosova, M.A. Effect of a TiC Coating on the Stress-Strain State of a Plate of a High-Density Nitride Ceramic under Nonsteady Thermoelastic Conditions. Refract. Ind. Ceram. 2014, 54, 376–380. [Google Scholar] [CrossRef]
- Volosova, M.A.; Grigor’ev, S.N.; Kuzin, V.V. Effect of Titanium Nitride Coating on Stress Structural Inhomogeneity in Oxide-Carbide Ceramic. Part 4. Action of Heat Flow. Refract. Ind. Ceram. 2015, 56, 91–96. [Google Scholar] [CrossRef]
- Grigoriev, S.N.; Kozochkin, M.P.; Porvatov, A.N.; Volosova, M.A.; Okunkova, A.A. Electrical discharge machining of ceramic nanocomposites: Sublimation phenomena and adaptive control. Heliyon 2019, 5, e02629. [Google Scholar] [CrossRef] [Green Version]
- Kimura, H.; Myung, W.N.; Kobayashi, S.; Suzuki, M.; Toda, K.; Yuine, T. Consolidation of Mechanically Alloyed Amorphous Conbzr Powder by HIP. J. Jpn. Inst. Met. 1992, 56, 833–841. [Google Scholar] [CrossRef] [Green Version]
- Gusarov, A.V.; Grigoriev, S.N.; Volosova, M.A.; Melnik, Y.A.; Laskin, A.; Kotoban, D.V.; Okunkova, A.A. On productivity of laser additive manufacturing. J. Mater. Process. Technol. 2018, 261, 213–232. [Google Scholar] [CrossRef]
- Ponomarev, S.V.; Bulanov, E.V.; Bulanova, V.O.; Divin, A.G. Minimization of Measurement Errors of the Coefficients of Heat Conductivity and Thermal Diffusivity of Thermal Insulating Materials by the Plane Pulsed Heat Source Method. Meas. Tech. 2019, 61, 1203–1208. [Google Scholar] [CrossRef]
- Sova, A.; Okunkova, A.; Grigoriev, S.; Smurov, I. Velocity of the Particles Accelerated by a Cold Spray Micronozzle: Experimental Measurements and Numerical Simulation. J. Therm. Spray Technol. 2012, 22, 75–80. [Google Scholar] [CrossRef]
- Gusarov, A.V.; Okun’kova, A.A.; Peretyagin, P.Y.; Zhirnov, I.V.; Podrabinnik, P.A. Means of Optical Diagnostics of Selective Laser Melting with Non-Gaussian Beams. Meas. Tech. 2015, 58, 872–877. [Google Scholar] [CrossRef]
- Yadroitsev, I.; Bertrand, P.; Antonenkova, G.; Grigoriev, S.; Smurov, I. Use of track/layer morphology to develop functional parts by selectivelaser melting. J. Laser Appl. 2013, 25, 052003. [Google Scholar] [CrossRef]
- Kotoban, D.; Grigoriev, S.; Okunkova, A.; Sova, A. Influence of a shape of single track on deposition efficiency of 316L stainless steel powder in cold spray. Surf. Coat. Technol. 2017, 309, 951–958. [Google Scholar] [CrossRef]
- Doubenskaia, M.; Pavlov, M.; Grigoriev, S.; Tikhonova, E.; Smurov, I. Comprehensive Optical Monitoring of Selective Laser Melting. J. Laser Micro Nanoeng. 2012, 7, 236–243. [Google Scholar] [CrossRef]
- Smurov, I.; Doubenskaia, M.; Grigoriev, S.; Nazarov, A. Optical Monitoring in Laser Cladding of Ti6Al4V. J. Spray Tech. 2012, 21, 1357–1362. [Google Scholar] [CrossRef]
- Sova, A.; Grigoriev, S.; Okunkova, A.; Smurov, I. Cold spray deposition of 316L stainless steel coatings on aluminium surface with following laser post-treatment. Surf. Coat. Technol. 2013, 235, 283–289. [Google Scholar] [CrossRef]
- Metel, A.; Tarasova, T.; Gutsaliuk, E.; Khmyrov, R.; Egorov, S.; Grigoriev, S. Possibilities of Additive Technologies for the Manufacturing of Tooling from Corrosion-Resistant Steels in Order to Protect Parts Surfaces from Thermochemical Treatment. Metals 2021, 11, 1551. [Google Scholar] [CrossRef]
- Khmyrov, R.S.; Grigoriev, S.N.; Okunkova, A.A.; Gusarov, A.V. On the possibility of selective laser melting of quartz glass. Phys. Procedia 2014, 56, 345–356. [Google Scholar] [CrossRef] [Green Version]
- Khmyrov, R.S.; Protasov, C.E.; Grigoriev, S.N.; Gusarov, A.V. Crack-free selective laser melting of silica glass: Single beads and monolayers on the substrate of the same material. Int. J. Adv. Manuf. Technol. 2016, 85, 1461–1469. [Google Scholar] [CrossRef]
- Grigoriev, S.; Peretyagin, P.; Smirnov, A.; Solis, W.; Diaz, L.A.; Fernandez, A.; Torrecillas, R. Effect of graphene addition on the mechanical and electrical properties of Al2O3 -SiCw ceramics. J. Eur. Ceram. Soc. 2017, 37, 2473–2479. [Google Scholar] [CrossRef]
- Li, E.L.; Wang, L.; Yu, A.B.; Zhou, Z.Y. A three-phase model for simulation of heat transfer and melt pool behaviour in laser powder bed fusion process. Powder Technol. 2021, 381, 298–312. [Google Scholar] [CrossRef]
- Pelevin, I.A.; Ozherelkov, D.Y.; Chernyshikhin, S.V.; Nalivaiko, A.Y.; Gromov, A.A.; Chzhan, V.B.; Terekhin, E.A.; Tereshina, I.S. Selective laser melting of Nd-Fe-B: Single track study. Mater. Lett. 2022, 315, 131947. [Google Scholar] [CrossRef]
- Gorshkov, B.G.; Danileiko, Y.K.; Nikolaev, V.N.; Sidorin, A.V. An Effect of Multiple Exposure in Laser Damage of Optical-Materials. Kvantovaya Elektron. 1983, 10, 640–643. [Google Scholar]
- Baburin, N.V.; Galagan, B.I.; Danileiko, Y.K.; Il’ichev, N.N.; Masalov, A.V.; Molchanov, V.Y.; Chikov, V.A. Two-frequency mode-locked lasing in a monoblock diode-pumped Nd3+: GGG laser. Quantum Electron. 2001, 31, 303–304. [Google Scholar] [CrossRef]


| Laser Beam Profile | Beam Radius at Half Maximum, r1/2/r0 | (Tmax − Ta)/T0 | ||
|---|---|---|---|---|
| Pe = 0 | Pe = 0.71 | Pe = 2.86 | ||
| TEM00 (Gaussian) | 1.027 | 0.8417 | ||
| TEM01* (donut) | 1.6366 | 1.6453 | 0.5889 | 0.4735 |
| TEMFT (flat-top) | 1 | 1 | 0.9613 | 0.8819 |
| Properties | Density, g/cm3 | Melting Point, °C | Boiling Point, °C | Tensile Strength, kN/cm2 | Yield Strength, kN/cm2 | Young’s Modulus, GPa | Coefficient of Thermal Expansion, ×10−6 °C−1 | Thermal Conductivity, W/(m·K) |
|---|---|---|---|---|---|---|---|---|
| CoCr alloy | 8.0–8.4 | 1250–1650 | 2800–3000 | ≥61.7–70 | ≥50–64 | 210–250 | 11.2–14.2 | 13 |
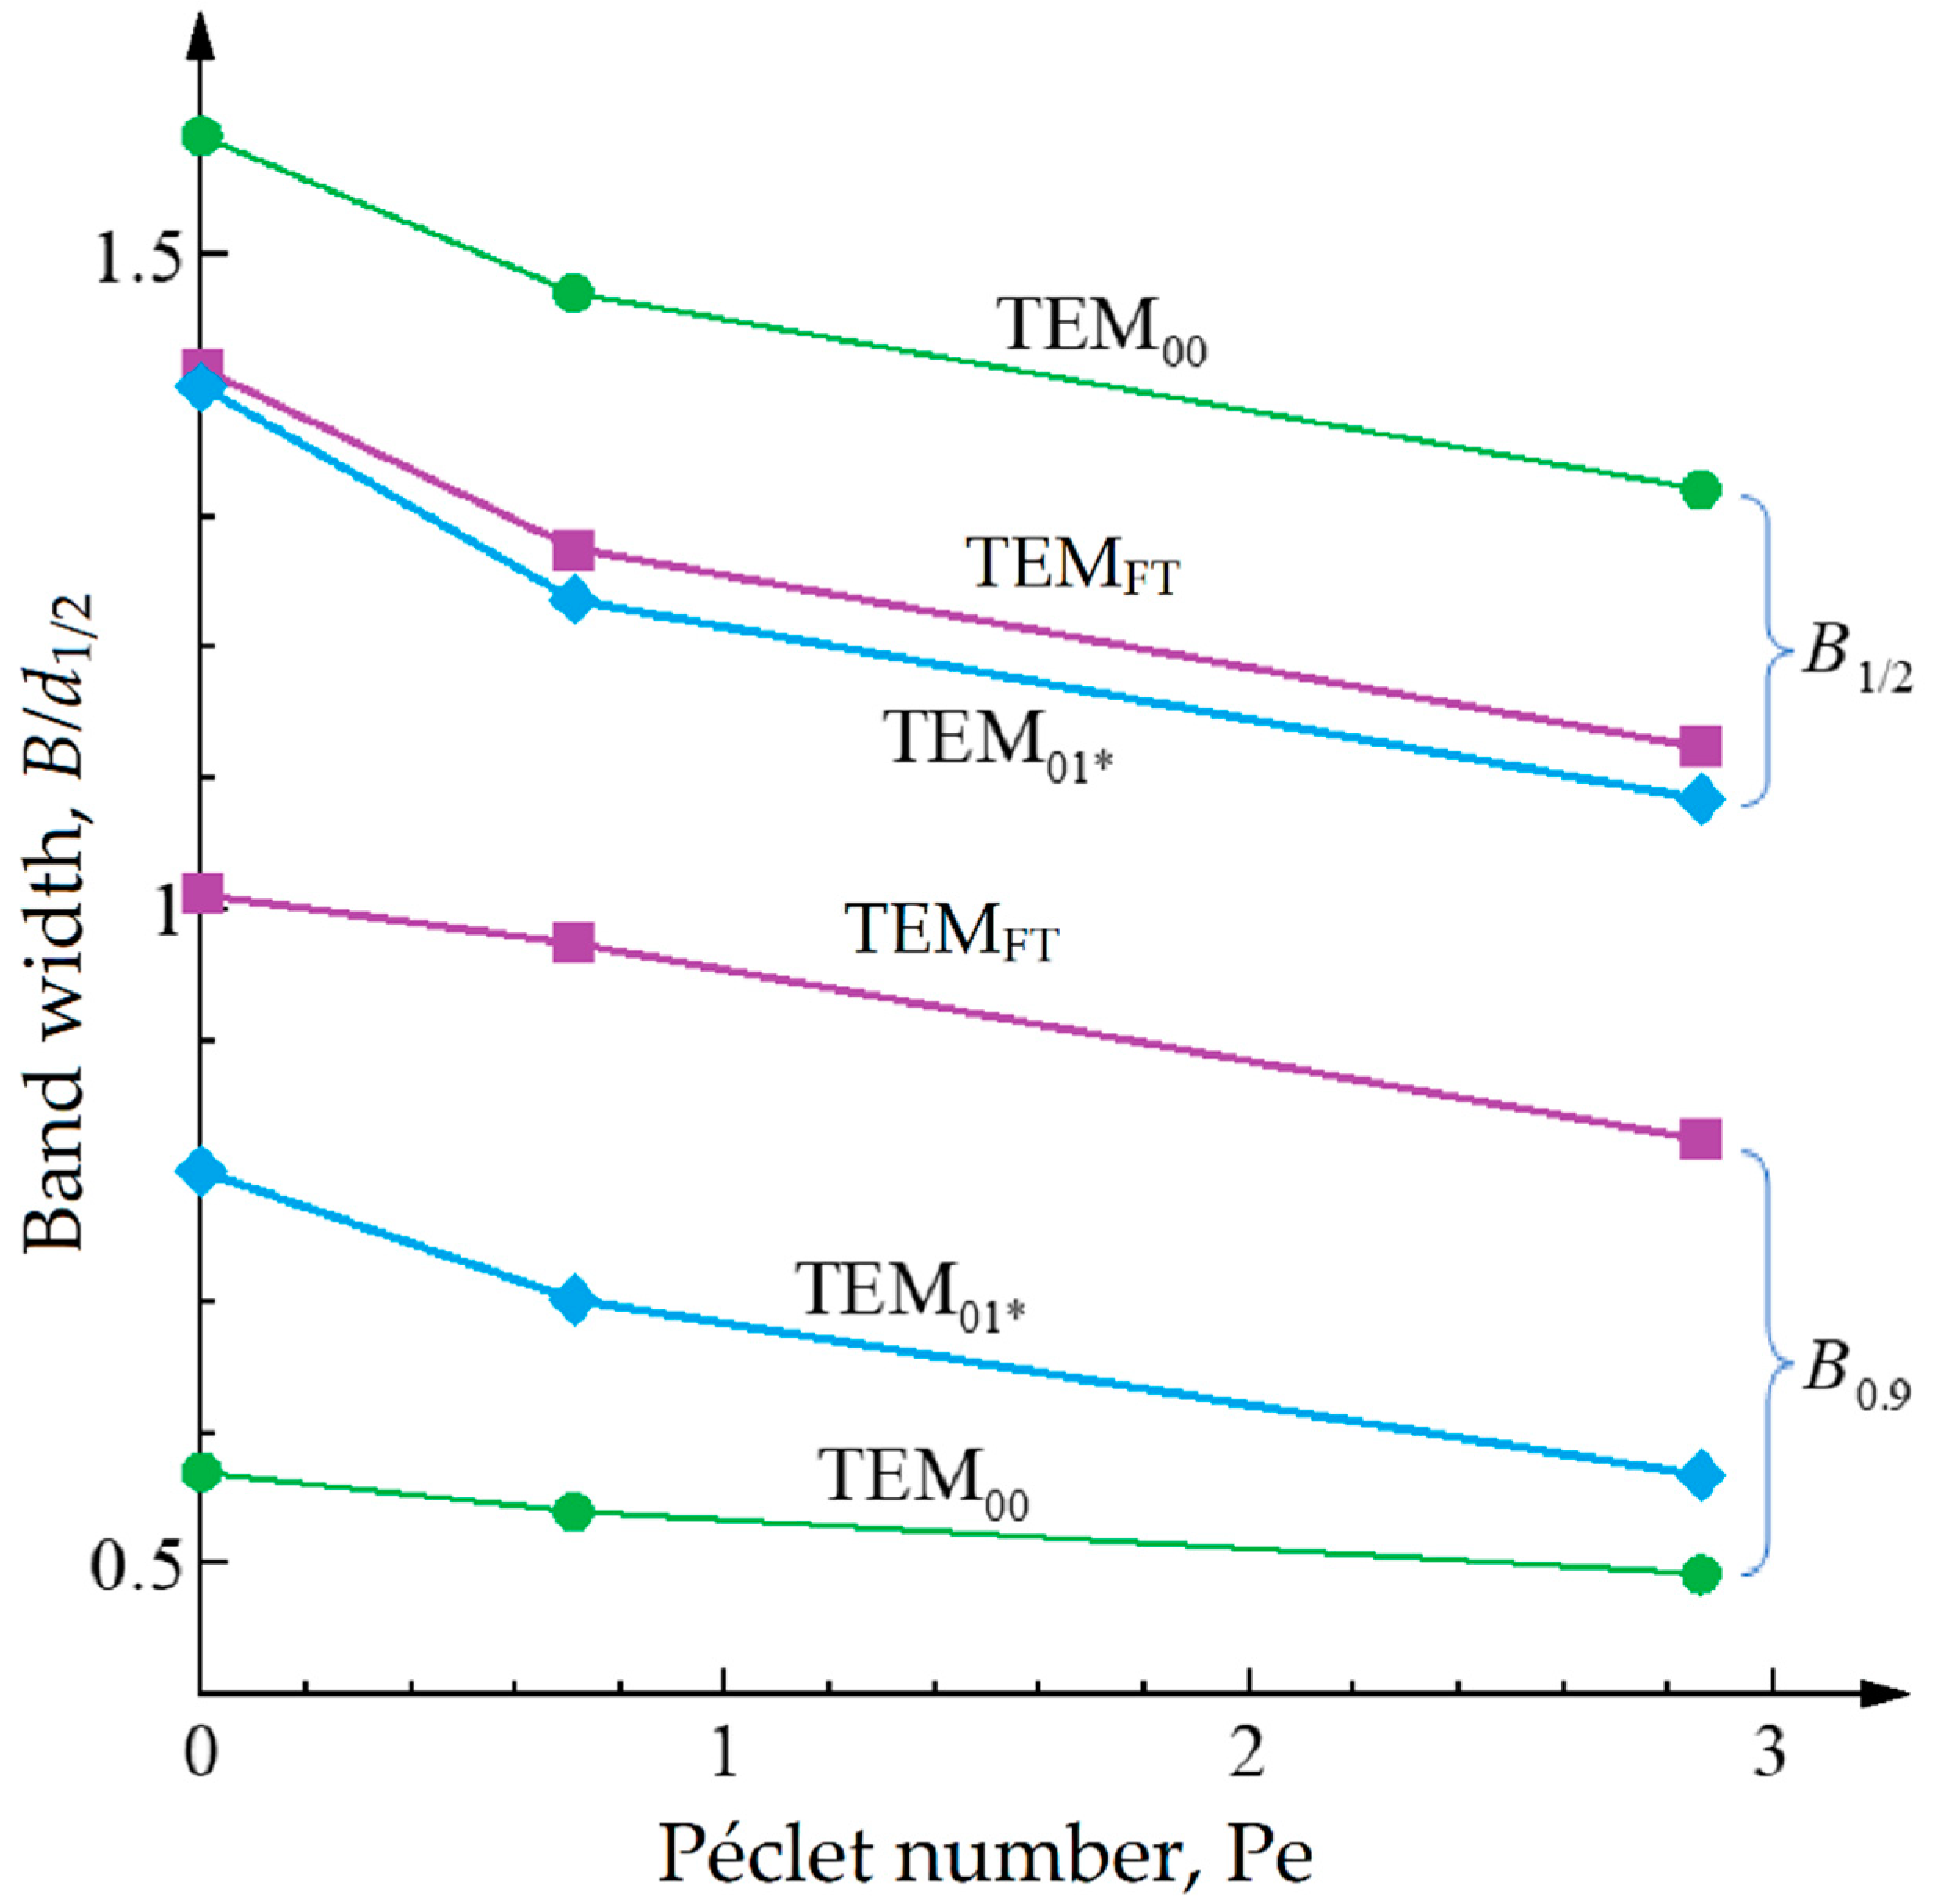
| Laser Beam Profile | B1/2/d1/2 | B0.9/d1/2 | ||||
|---|---|---|---|---|---|---|
| Pe = 0 | Pe = 0.71 | Pe = 2.86 | Pe = 0 | Pe = 0.71 | Pe = 2.86 | |
| TEM00 (Gaussian) | 1.57 | 1.485 | 1.32 | 0.53 | 0.535 | 0.50 |
| TEMFT (flat-top) | 1.415 | 1.28 | 1.118 | 1.012 | 0.974 | 0.775 |
| TEM01* (donut) | 1.39 | 1.24 | 1.07 | 0.80 | 0.70 | 0.565 |
| Laser Beam Profiles | Laser Spot Diameter, mm | Steady Temperature (Tmax − Ta), K | |
|---|---|---|---|
| P = 100 W | P = 400 W | ||
| TEM00 (Gaussian) | ~0.1 | 1923 | 7692 |
| TEM01* (donut) | ~0.3 | 641.03 | 2564 |
| Factor | Measuring Unit | Values | |
|---|---|---|---|
| Absorbed power of the beam, P | W | 100 | 400 |
| Laser beam radius, r0 | mm | ~0.1/2 | ~0.3/2 |
| Scanning velocity, us | m/s | 0.0213 | 0.0286 |
| Normalized power density distribution, q0 | W/m2 | 0.320 × 10⁸ | 0.142 × 10⁸ |
| Specific energy contribution, E | J/m2 | 1.5 × 10⁵ | 0.5 × 10⁵ |
| Péclet’s number, Pe | - | 0.71 | 2.86 |
| Thermal Diffusivity α, cm2/s | |
|---|---|
| at 20 °C | at 500 °C |
| 0.02–0.14 | 0.03–0.074 |
| Parameter | Evaporation Loss, Pv (W) | |
|---|---|---|
| TEM00, P = 100 W, Pe = 0.71 | TEM01*, P = 400 W, Pe = 2.86 | |
| Max vapor velocity uv, m/s | 3.63 | 14.51 |
| Max recoil pressure precoil − p0, Pa | 17.67 | 267.67 |
| Mass loss rate Lmass, mg/s | 144.30 | 520.22 |
| Recoil force Frecoil, mN | 0.55 | 7.57 |
| Power loss for evaporation Pe, W | 3.53 | 2.68 |
Publisher’s Note: MDPI stays neutral with regard to jurisdictional claims in published maps and institutional affiliations. |
© 2022 by the authors. Licensee MDPI, Basel, Switzerland. This article is an open access article distributed under the terms and conditions of the Creative Commons Attribution (CC BY) license (https://creativecommons.org/licenses/by/4.0/).
Share and Cite
Grigoriev, S.N.; Gusarov, A.V.; Metel, A.S.; Tarasova, T.V.; Volosova, M.A.; Okunkova, A.A.; Gusev, A.S. Beam Shaping in Laser Powder Bed Fusion: Péclet Number and Dynamic Simulation. Metals 2022, 12, 722. https://doi.org/10.3390/met12050722
Grigoriev SN, Gusarov AV, Metel AS, Tarasova TV, Volosova MA, Okunkova AA, Gusev AS. Beam Shaping in Laser Powder Bed Fusion: Péclet Number and Dynamic Simulation. Metals. 2022; 12(5):722. https://doi.org/10.3390/met12050722
Chicago/Turabian StyleGrigoriev, Sergey N., Andrey V. Gusarov, Alexander S. Metel, Tatiana V. Tarasova, Marina A. Volosova, Anna A. Okunkova, and Andrey S. Gusev. 2022. "Beam Shaping in Laser Powder Bed Fusion: Péclet Number and Dynamic Simulation" Metals 12, no. 5: 722. https://doi.org/10.3390/met12050722