Article

Low-Temperature Reactive Sintered Porous Mg-Al-Zn Alloy Foams

1
College of Mechanics and Materials, Hohai University, Nanjing 211100, China
2
Suqian Research Institute of Hohai University, Suqian 223814, China
3
Nantong Ocean and Coastal Engineering Research Institute, Hohai University, Nantong 226019, China
4
State Key Laboratory of Powder Metallurgy, Central South University, Changsha 410083, China
*
Authors to whom correspondence should be addressed.
Metals 2022, 12(4), 692; https://doi.org/10.3390/met12040692
Submission received: 9 March 2022 / Revised: 31 March 2022 / Accepted: 12 April 2022 / Published: 18 April 2022
(This article belongs to the Special Issue Synthesis and Applications of Metallic Foams)

Abstract

:
By using carbamide granules as the space holder, Mg alloy foams with interconnected pore structures were synthesized by reactive sintering of a mixture of Mg, Al and Zn powders. The effect of Zn/Al on the microstructural evolution and compressive strength of porous Mg-9Al-xZn (x = 1, 5) alloy foams was investigated. The phase diagram simulation approach was used to determine the sintering temperature. The analysis results show that the formation of binary secondary phases or intermetallic compounds is a crucial factor in achieving bonding strength for the porous Mg alloy foams. The intermetallic compounds were formed by solid-state diffusion between the metal powder elements. Mg17Al12 intermetallics was the most stable compound formed in the cell walls of porous Mg alloy foams. The addition of Zn influences the solubility and stability of the intermetallic compound. Thermodynamic calculations show that Mg17Al12 was preferentially formed in the cell walls owing to its high negative enthalpy energy. Moreover, various metastable transition phases may exist in the microstructures, especially in the porous Mg-9Al-5Zn alloy foam. The intermetallic phases act as reinforcing phases, combined with grain refinement, significantly increasing the strength of the foam. At the given relative density of 0.42, the porous Mg-9Al-5Zn alloy foam exhibits the highest yield strength of 9.0 MPa, which is 23% higher than the strength of the porous Mg-9Al-1Zn alloy foam.

1. Introduction

Recent advances in materials development have been focused on weight reduction and properties’ improvement without compromising cost, performance or safety [1,2,3,4]. Metallic foams have demonstrated tremendous potential for lightweight applications, impact energy absorption and good specific strength [5,6]. In the past few decades, Mg alloy foams with an open-pore structure (porous Mg alloy foams) have garnered a lot of interest because of their good mechanical properties, biocompatibility and extraordinary light weight.
Porous Mg alloy foams are mainly produced via the replication casting process, in which the Mg alloy melt is poured into a porous preform that has already been constructed, and then the melt solidifies and the liquid medium is used to evacuate the preform to create hollow frameworks in the Mg alloy [7,8,9,10,11]. This process can produce highly porous Mg alloy foam, but it has some drawbacks, such as partial penetration caused by the Mg alloy melt not wetting with the template and corrosion of the Mg alloy during preform evacuation. In looking at alternative methods, it has been demonstrated that the powder metallurgy (PM) route can be applied for producing porous Mg alloy foams with impressive structures, desired porosities and refined microstructures [12,13,14,15]. The PM approach necessitates element metal powder compaction with a space-holder material as well as dissolution before sintering. Carbamide is often used to create desirable pore geometries and porosities into porous Mg alloy foams because of its high solubility in water and low-temperature decomposition during the sintering process [16].
Moreover, sintering is a thermal process that allows the formation of alloys starting from elemental powder mixtures [17,18]. On one hand, it is a thermodynamically based process that involves atomic diffusion, reaction and formation of secondary phases. On the other hand, it may generate a wide range of non-equilibrium phases, such as supersaturated solid solutions, intermediate metastable phases, quasi-crystalline grains and nano-structural phases, all of which can influence the properties of the metallic alloys [19]. It is noticed from previous studies that the majority of porous Mg alloy foams fabricated via sintering of powder metals are carried out at a high temperature [20,21,22]. However, high sintering temperatures can cause local melting, liquid oozing and/or burning [22,23] due to the low melting temperature of the secondary phases formed in Mg-Al/Zn systems, which is detrimental to the porous structure. Therefore, an alternative approach to fabricating porous Mg alloy foams is necessary. Reactive sintering [24], which is conducted at a low temperature, is very crucial for this purpose. The reactive sintering principle entails a series of elemental powder diffusion and reactions that result in the formation of metallurgically bonded compounds that can strengthen the alloy matrix.
Specifically, the porous Mg-Al/Mg-Zn alloy foams stand out among other porous Mg alloy foams because of their low cost, remarkable mechanical properties and corrosion resistance [25]. The Zn element in Mg alloys is usually added to enhance the strength through grain refinement and precipitation hardening. By using ammonium bicarbonate particles as the space holder, the porous Mg-6 wt.% Zn alloy foam was fabricated via the PM route [26]. The mechanical and electrochemical performance of the fabricated porous Mg alloy foam demonstrates a superb compressive strength and good corrosion resistance owing to the added Zn. Seyedraoufi et al. [21] investigated porous Mg-(4 wt.%/6 wt.%) Zn alloy foams after sintering at a temperature ranging from 500 °C to 580 °C for 2 h. The optimal Zn content was 6 wt. %, while the strength of the fabricated porous Mg-Zn alloy foam decreases with increasing sintering temperature. Additionally, it was found that Zn is a significant grain refiner and strengthener for the porous Mg-Zn alloy foams.
Furthermore, it has been noticed that besides the relative density (or porosity) and pore size, which are crucial in determining the mechanical property of a metallic foam, the effect of the cell wall’s microstructure on the foam compression property is also indispensable. Therefore, in this study, by using carbamide granules as the space holder, a low-temperature reactive sintering PM route was developed to fabricate the porous Mg-Al-Zn alloy foams, and the effects of adding Zn/Al and sintering treatment on the cell wall microstructure’s evolution were investigated. Finally, the compression behavior of the porous Mg-Al-Zn alloy foams was examined and evaluated.

2. Experiments

2.1. Composition Simulation

The JMatPro, a material properties simulation software (Public Release Version 7.0.0, Sente Software Ltd., Guildford, UK), was used to perform a composition simulation of the Mg alloys. Two categories of alloying elements: Mg (90 wt.%), Al (9 wt.%), Zn (1 wt.%), and again, Mg (86 wt.%), Al (9 wt.%), and Zn (5 wt.%) were defined in the software with temperature ranging from 0 °C to 700 °C. The resulting compositional data, which consists of different alloy phases, were studied to determine the sintering temperature for the Mg-Al-Zn system.

2.2. Porous Mg-Al-Zn Alloy Foam Fabrication

The commercial carbamide granules (NH2)2CO, having a ball-like shape with a size around 2 mm–5 mm, as shown in Figure 1a, were used as the space holder material. The TG–DSC (thermos-gravimetric analysis–differential scanning calorimetry, STA 409 PC, Netzsch, Germany) experiments were carried out to reveal the carbamide thermal property, and the results are shown in Figure 1b. According to Figure 1b, the melting point of carbamide is around 140 °C because an endothermic peak appears while the corresponding TG curve does not change. Carbamide starts to decompose at ~185 °C because the TG curve starts to decrease and an endothermic peak appears at the same time.
Two categories of metal powder mixtures, Mg-9Al-1Zn (Mg-9 wt.%-1 wt.%Zn) and Mg-9Al-5Zn (Mg-9 wt.%Al-5 wt.%Zn), were made using commercial Mg (purity > 99.5%, 150–250 µm), Al (purity > 99.5%, 50–100 µm) and Zn (purity > 99.5%, 30–52 µm) (all the metal powders were purchased from Nanjing Wanqing Chemical Glassware Instrument Co., Ltd. Nanjing, China). The weighed powder mixtures were placed in the small plastic vials and then mixed for 12 h. The powder mixture was again admixed with carbamide granules to form a powder/carbamide composite with a mass ratio of metal mixture to carbamide being 57:43. Then, the composite was uniaxially compacted in a steel die at a given pressure of 360 MPa and kept for 2 min to form a green compact. Subsequently, the porous green compacts were obtained after the majority of the carbamide embedded in the green compact was evacuated by submerging them in the distilled water for 30 min at room temperature. The porous green compact was dried at 50 °C for 3 hrs and heated at 180 °C for 3 hrs to get rid of the leftover carbamide. Finally, the porous green compact was wrapped in the Al foil, immersed in the sand and sintered at 380 °C for 12 h. After sintering, the obtained foam with porosity of around 60% was quenched in the water to inhibit any phase transformation and then was dried again at 50 °C for 6 h before subsequent analysis.

2.3. Structural and Chemical Characterization

The porosity (Pr), which is the pore fraction of the specimen, was calculated by the foam mass (M) and its volume (V) by the equation of Pr (%) = [VM / ρs]/V × 100%, where ρs is the metal matrix density. The compositions and phases of the cell wall were characterized by the X-ray diffractometer (XRD, D8 Advanced, Bruker, Germany) by using Cu-Kα radiation operating at 40 kV and 40 mA. Scans were performed on 2theta between 10° and 90° with a 10 mm divergence slit and a 1° diffracted beam slit. In addition, the crystal structure was refined by the Rietveld method with FullProf software [27]. A scanning electron microscope (SEM, CX-200Plus, COXEM Co., Ltd., Daejeon, Korea) equipped with energy-dispersive X-ray spectroscopy (EDS, Oxford, Bruker) was utilized to observe the microstructure and analyze the corresponding compositions of the cell walls of the fabricated porous Mg-Al-Zn alloy foams.

2.4. Compression Testing

The foam samples used for the compression testing were cylindrical in shape (ϕ25 mm × 20 mm). The quasi-static compression tests were performed at room temperature using the Universal Testing Machine (CMT4503, SUST Company, Shenzhen, China) with a constant cross-head speed of 2 mm/min. The loading force–displacement curves were recorded and converted into the corresponding engineering stress (σ)–strain (ε) curves, where the stress was calculated by dividing the force by the original section area of the specimen and the strain was calculated by dividing the displacement by the original height of the specimen. The compression tests on porous samples with the same composition and porosity were conducted three times to verify the repeatability of the mechanical performance.

3. Results and Discussion

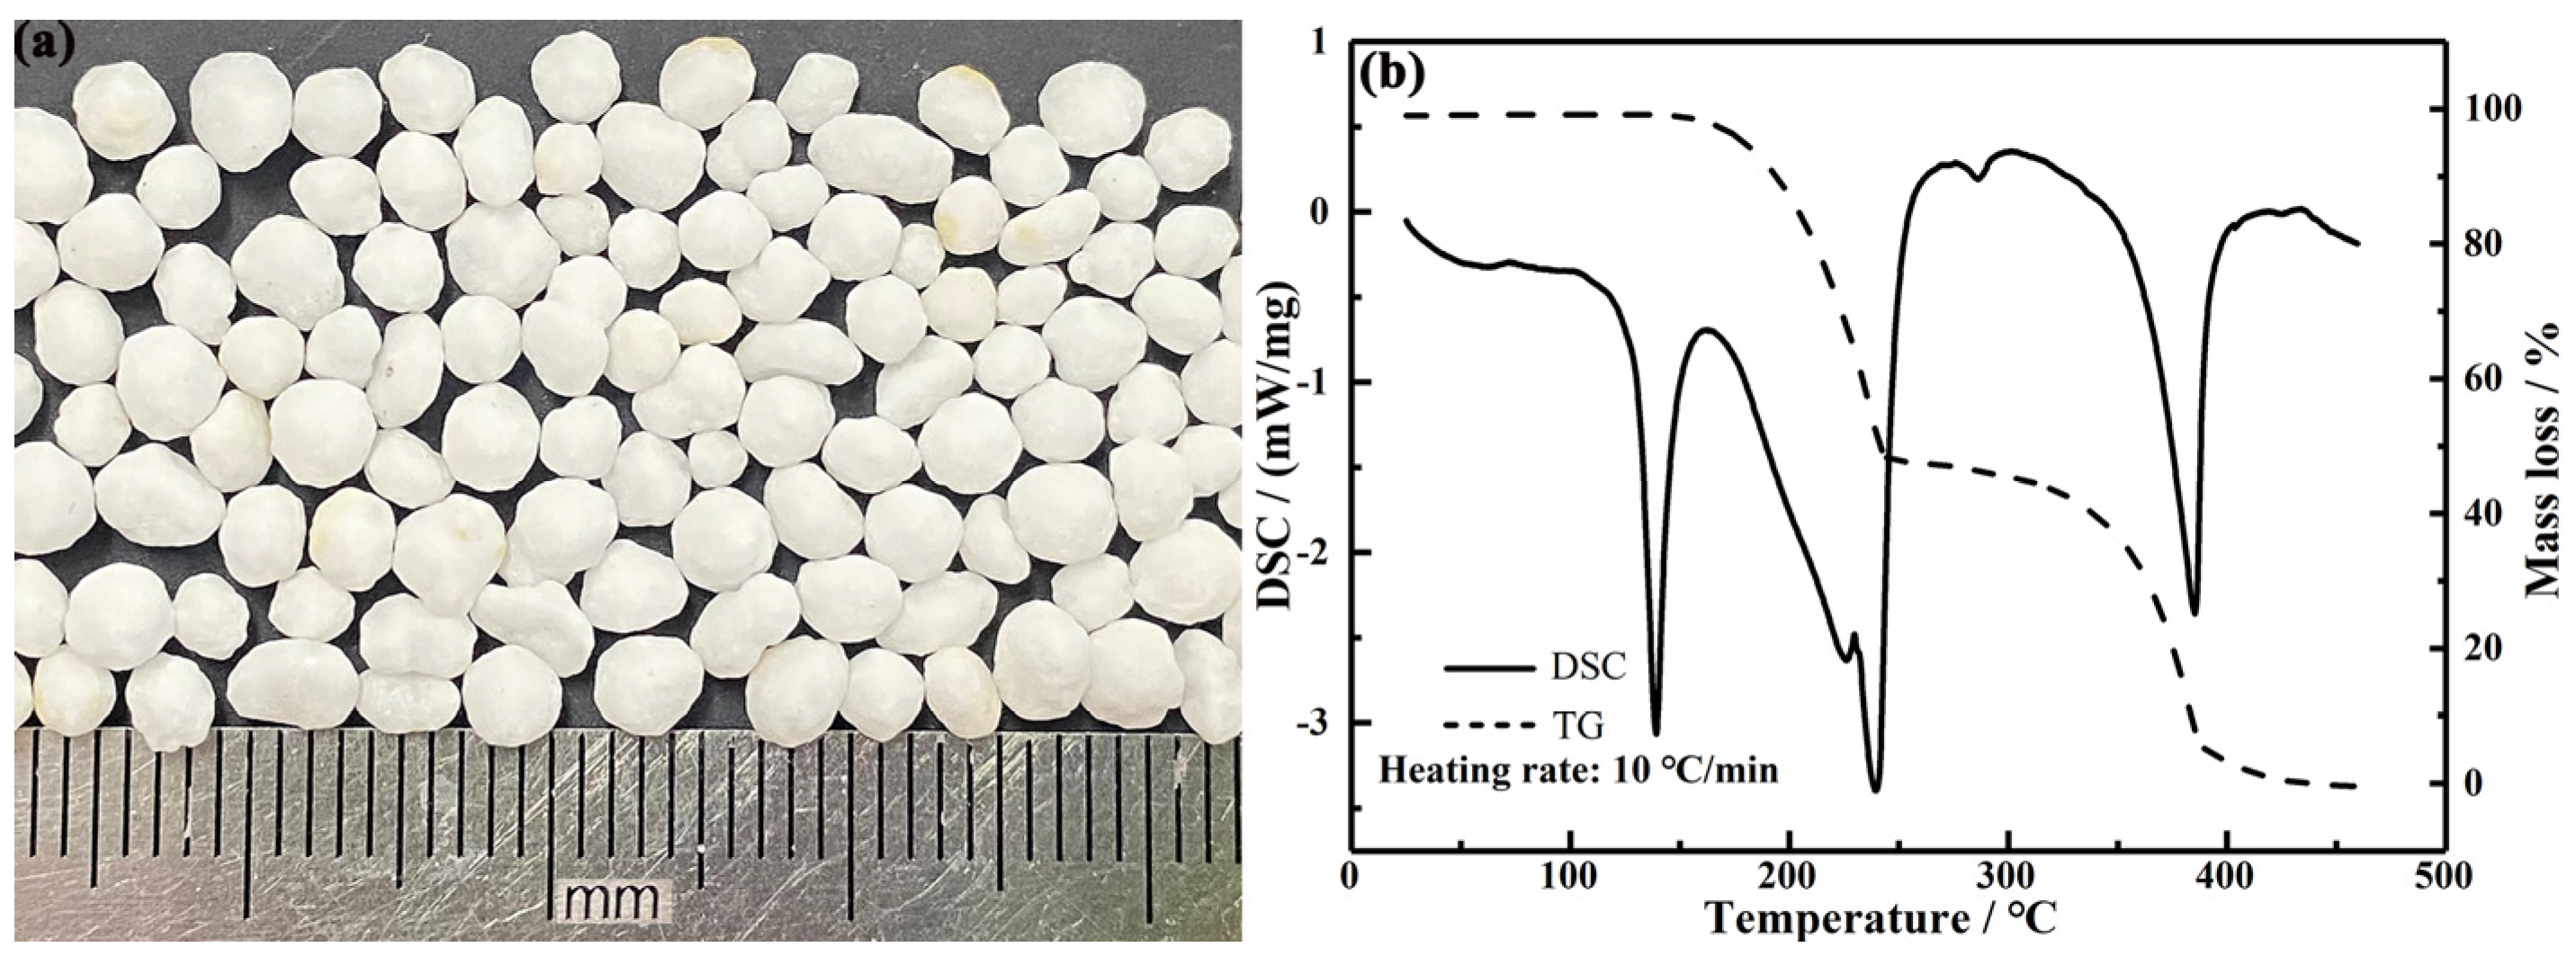
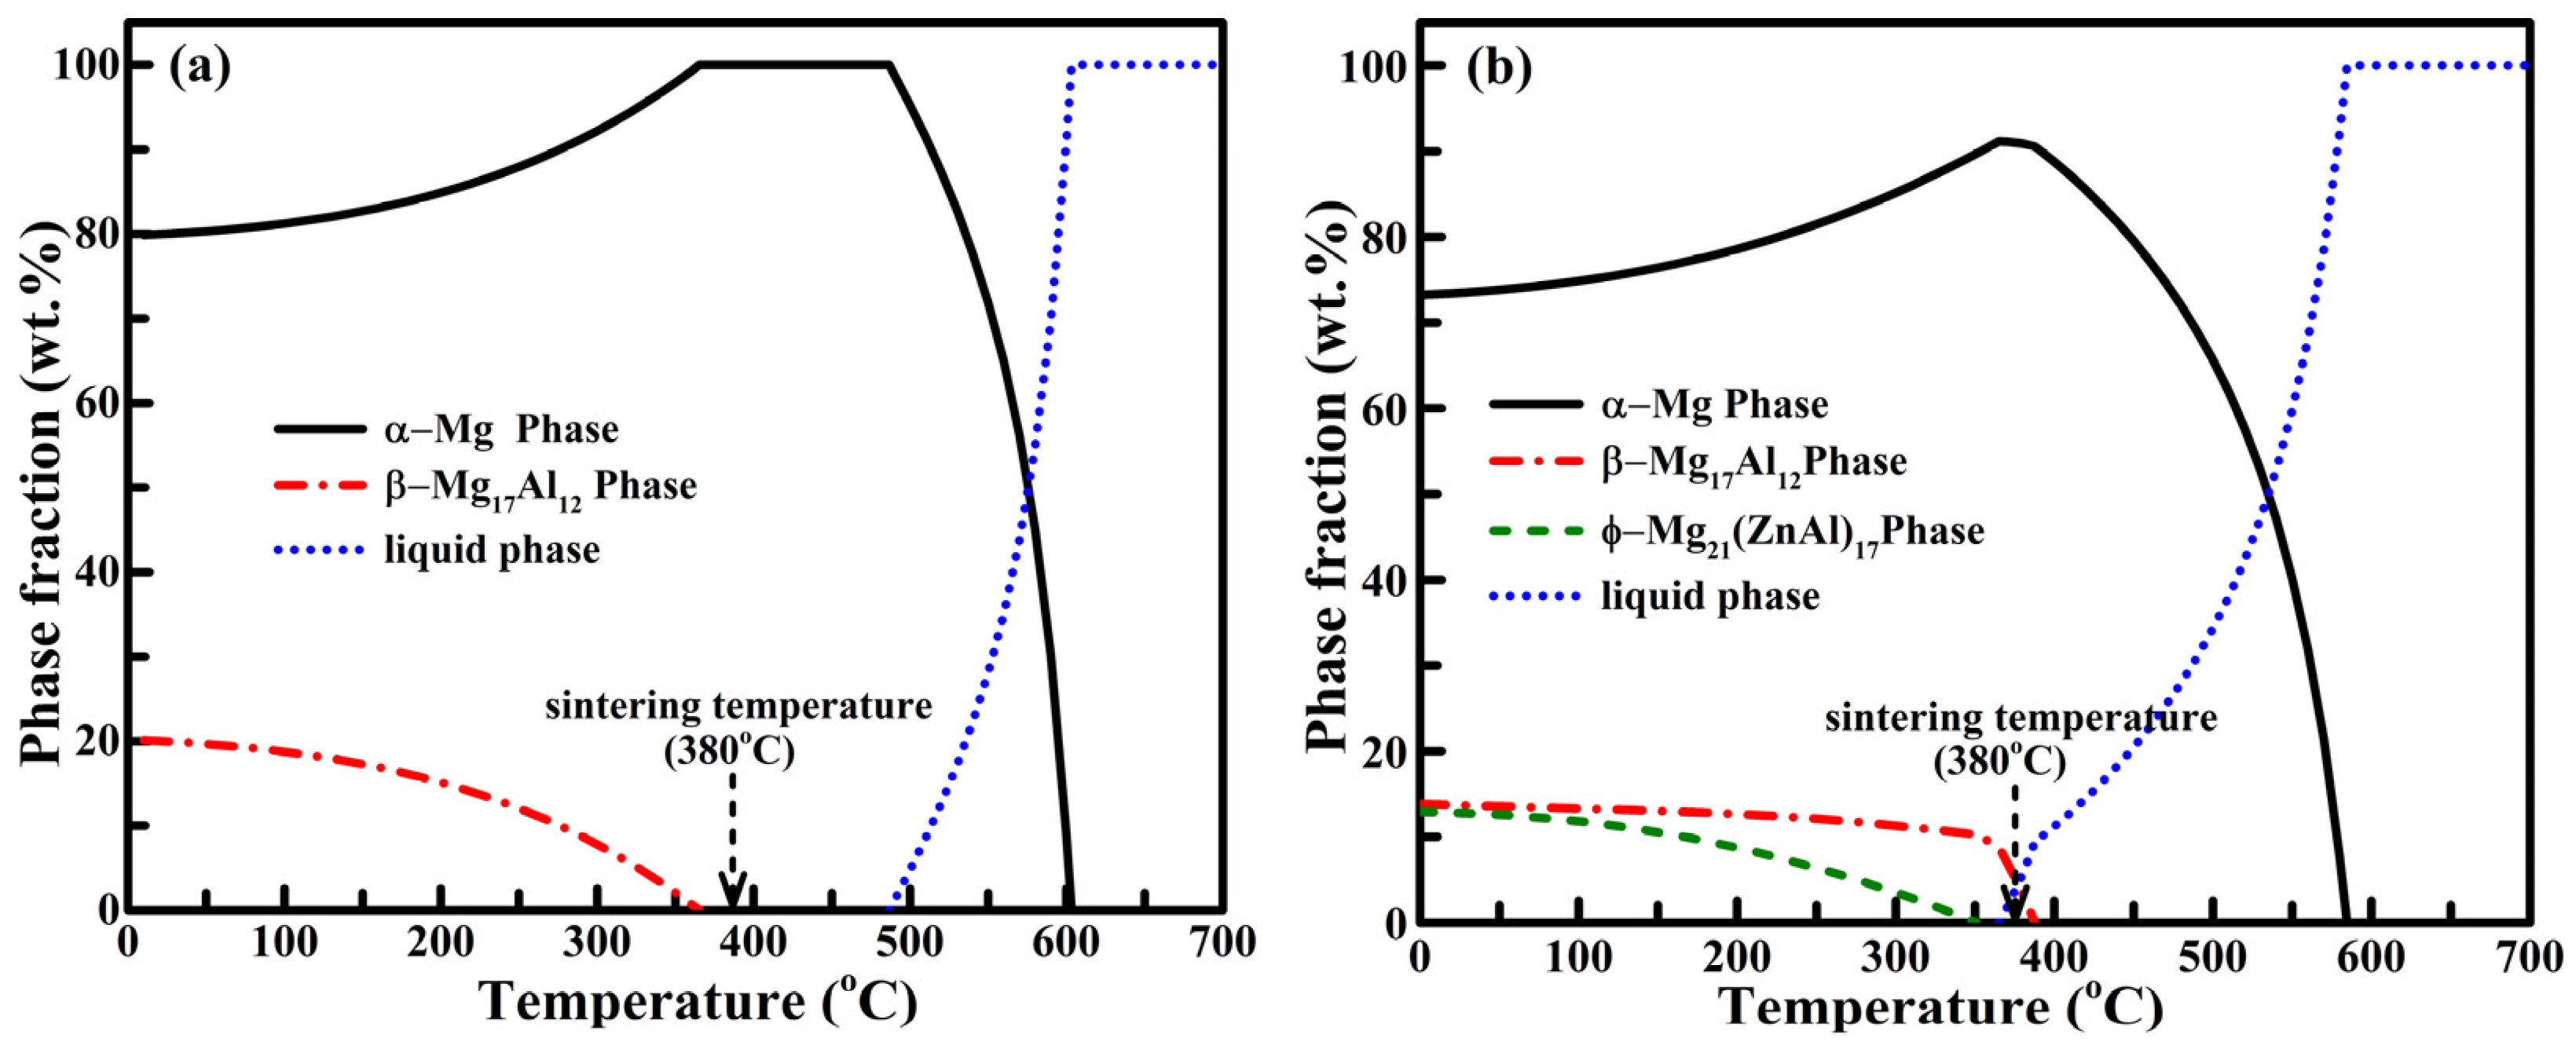
3.1. Simulation Result and Sintering Temperature Determination

Figure 2 shows the simulation results of phase changes as the temperature rises. Specifically, at a temperature between 0 and 700 °C, only three phases, namely, α (Mg), β (Mg17Al12) and liquid phases, are present in the Mg-9Al-1Zn alloy (Figure 2a). Meanwhile, as shown in Figure 2b, the Mg-9Al-5Zn alloy also shows these three phases and the ϕ-Mg21(ZnAl)17 phase as well. When the temperature rises, the contents of all the secondary phases gradually decrease. In the case of the Mg-9Al-1Zn system, the concentration of the β (Mg17Al12) phase is decreased from 20.0 wt. % to the basis before the alloy starts to melt. In the case of the Mg-9Al-5Zn system, the content of the β (Mg17Al12) phase reduced and then stabilized up to 10 wt.% before it steeply decreased to the basis at around 370–380 °C when the alloy started melting. The ϕ phase in the Mg-9Al-5Zn alloy behaves like the β (Mg17Al12) phase in the Mg-9Al-1Zn alloy, where the content of the ϕ phase is reduced from 12.0 wt.% phase fraction to the basis before the alloy reaches the melting temperature. A feature that should be noted is that the Mg-9Al-1Zn alloy has a longer range of solid solutions than the Mg-9Al-5Zn alloy. The wide range of solid solutions can permit higher solubility of solute atoms before melting. However, the two alloys turned into the liquid phase completely at temperatures above 605 °C for the Mg-9Al-1Zn alloy and 587 °C for the Mg-9Al-5Zn alloy. Consequently, the temperature of 380 °C was chosen for the reactive sintering temperature to ensure that all generated intermetallic compounds do not entirely melt but are stabilized in the alloy.

3.2. Macrostructure of Porous Mg Alloy Foam

Figure 3 exhibits the images of a representative foam sample. The fabricated sample with a porosity of 60.2% is shown in Figure 3a. The foam surface is covered with pores and has firm edges. The corresponding cross-section image (Figure 3b) demonstrates the round pores with interconnected channels, which are denoted by the yellow arrows. The pore interconnections were caused by carbamide agglomeration, which is common during the metal-powders-mixture/carbamide loading and cold compaction, and the round pores were inherited from the spherical shape of the carbamide granules.

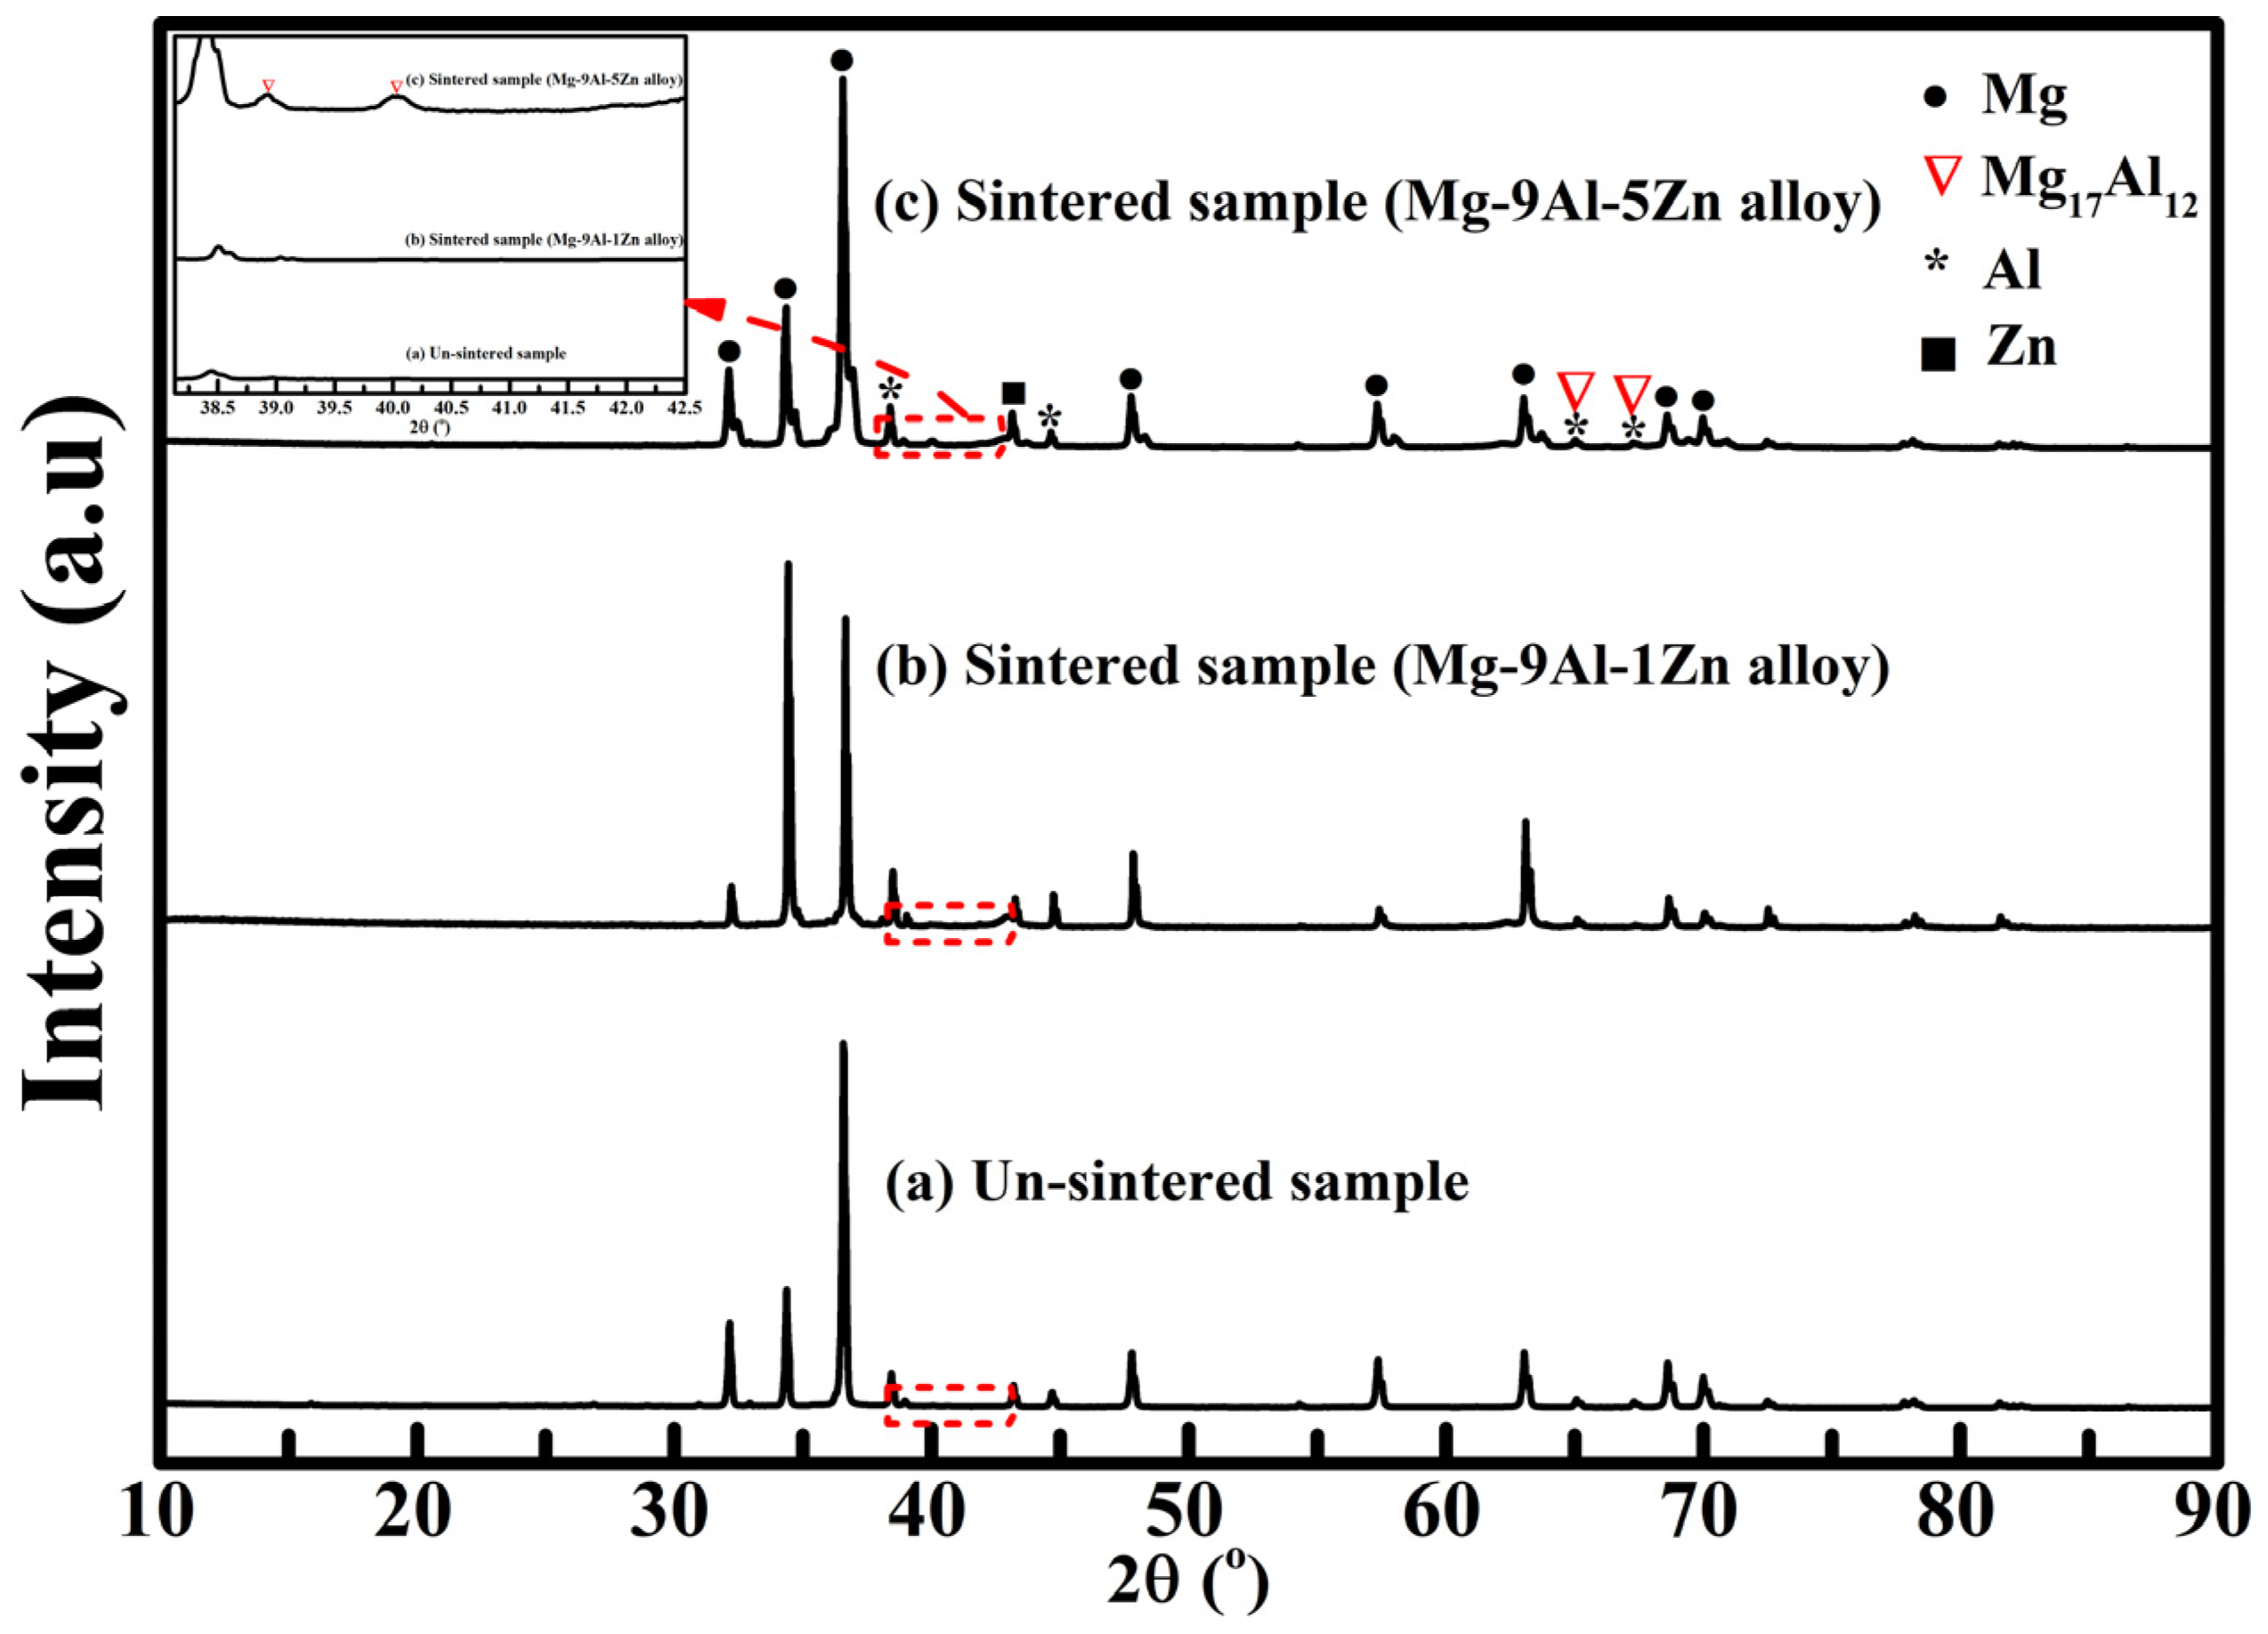
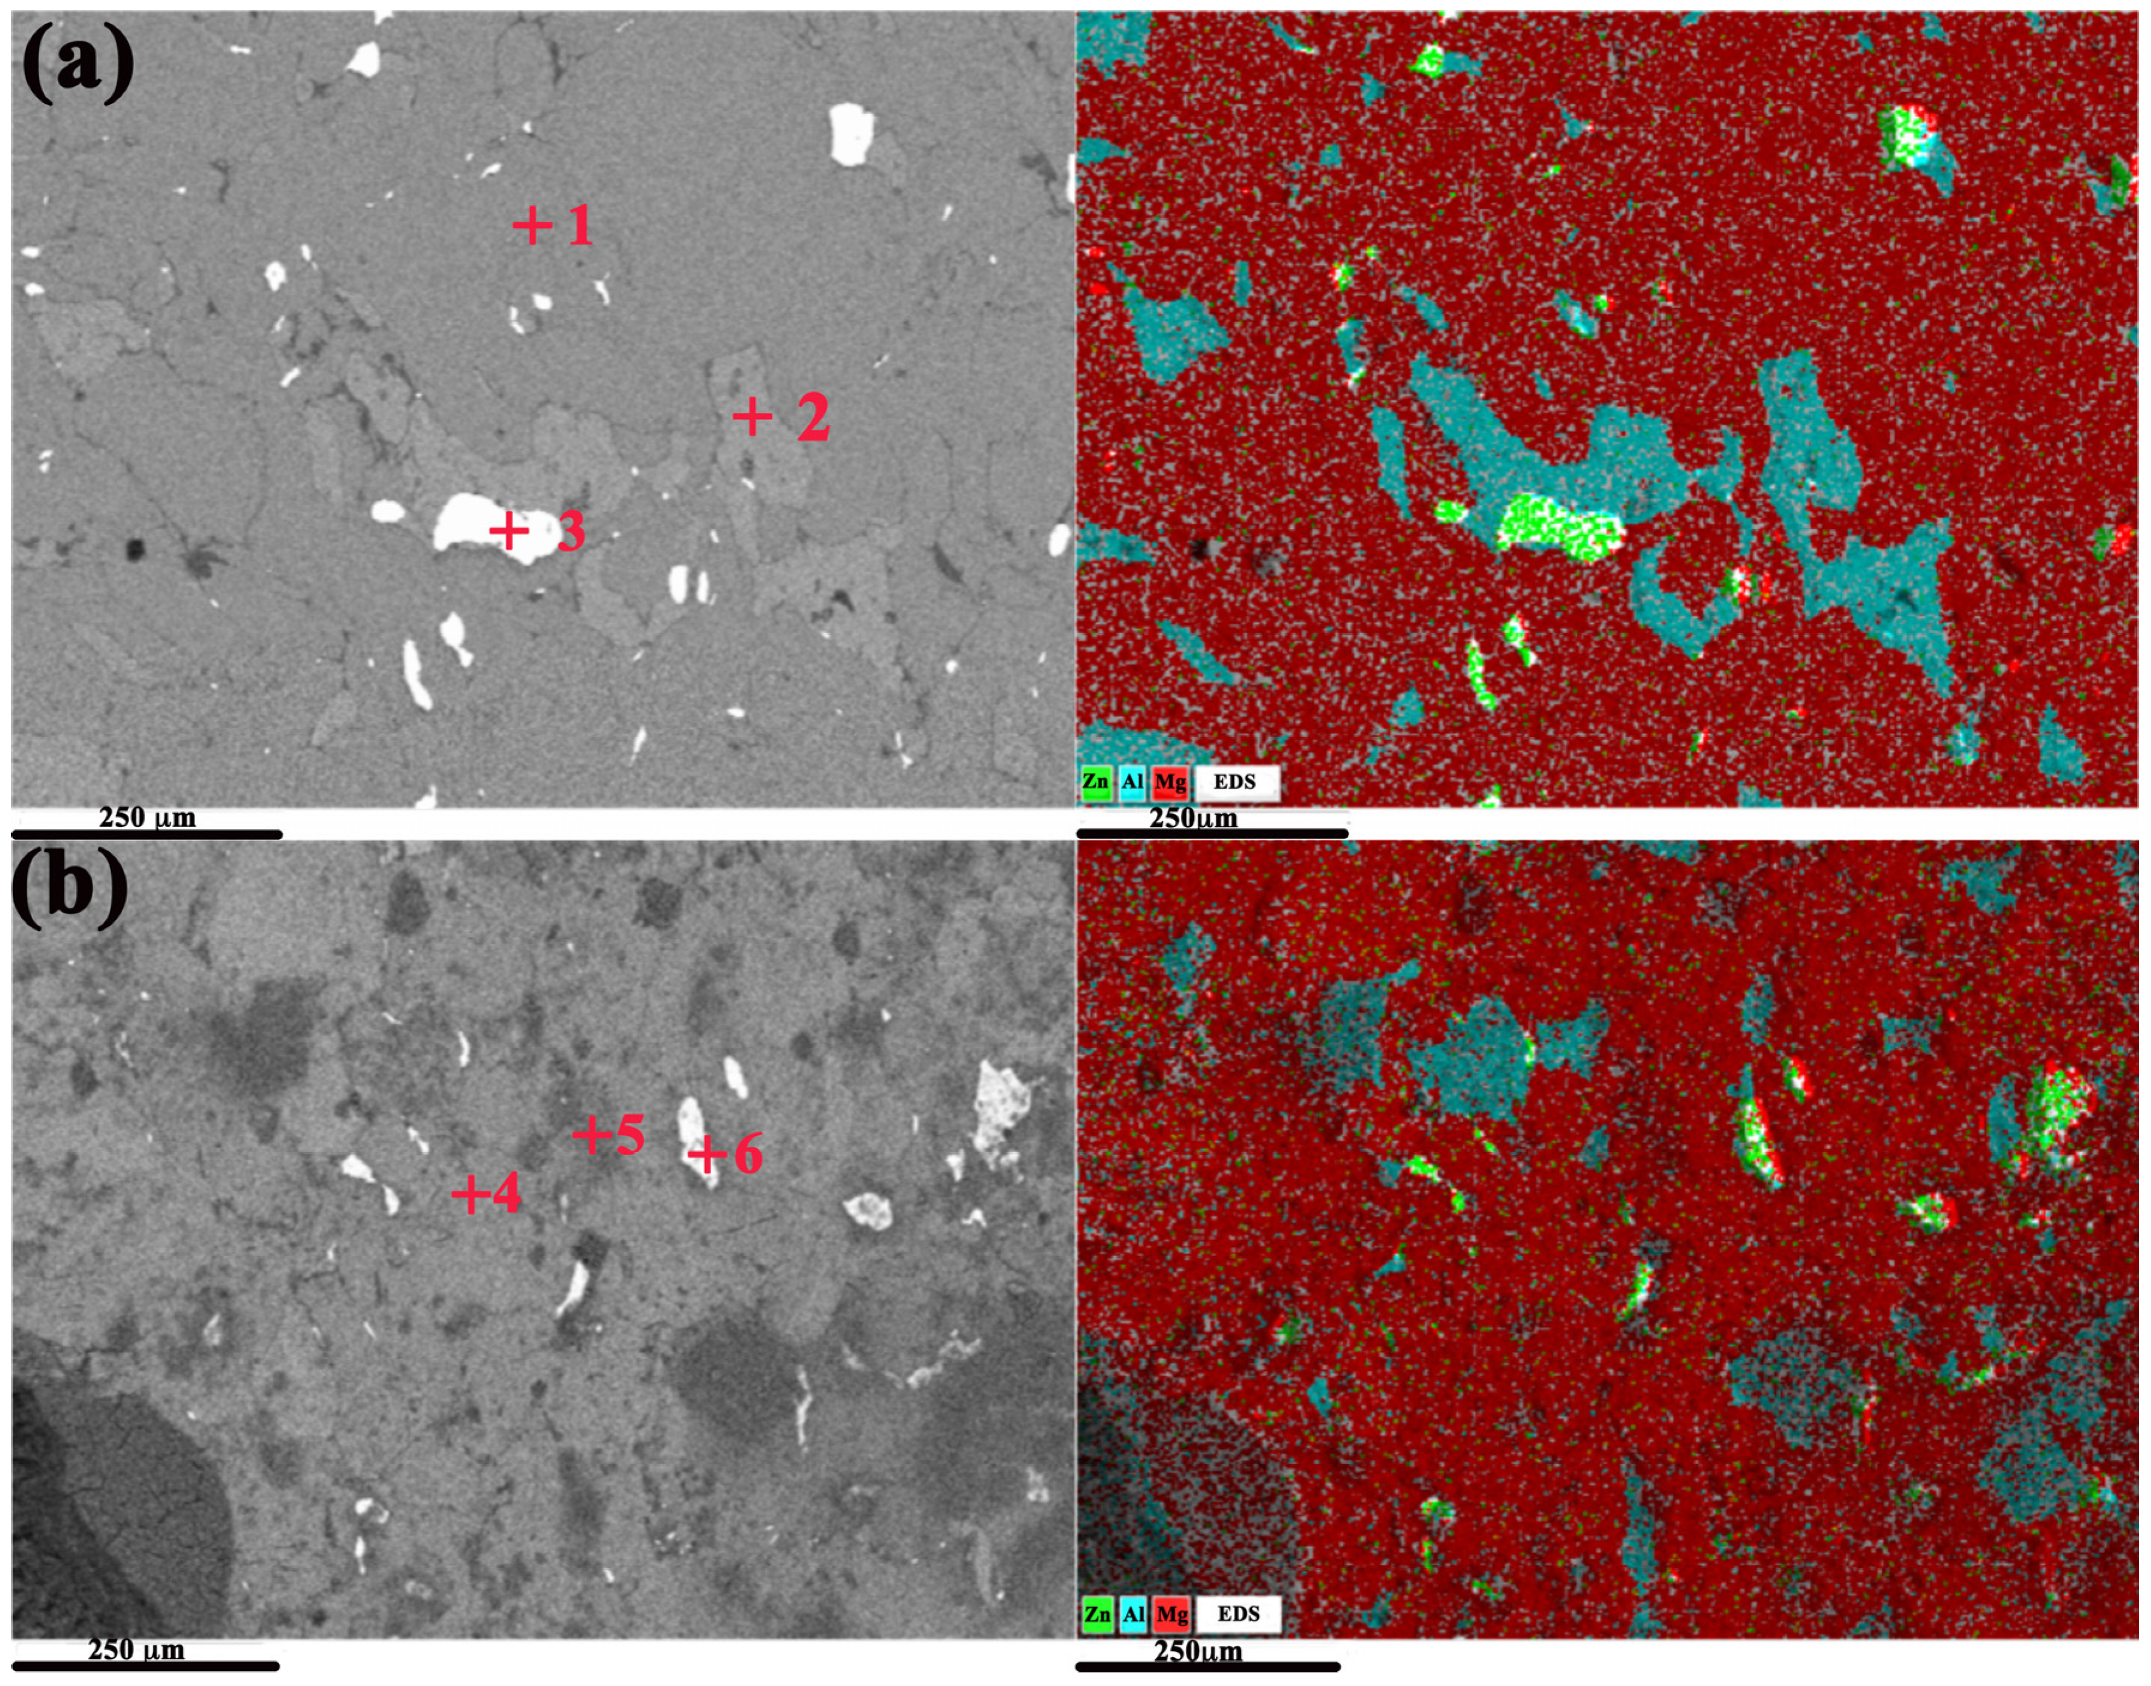
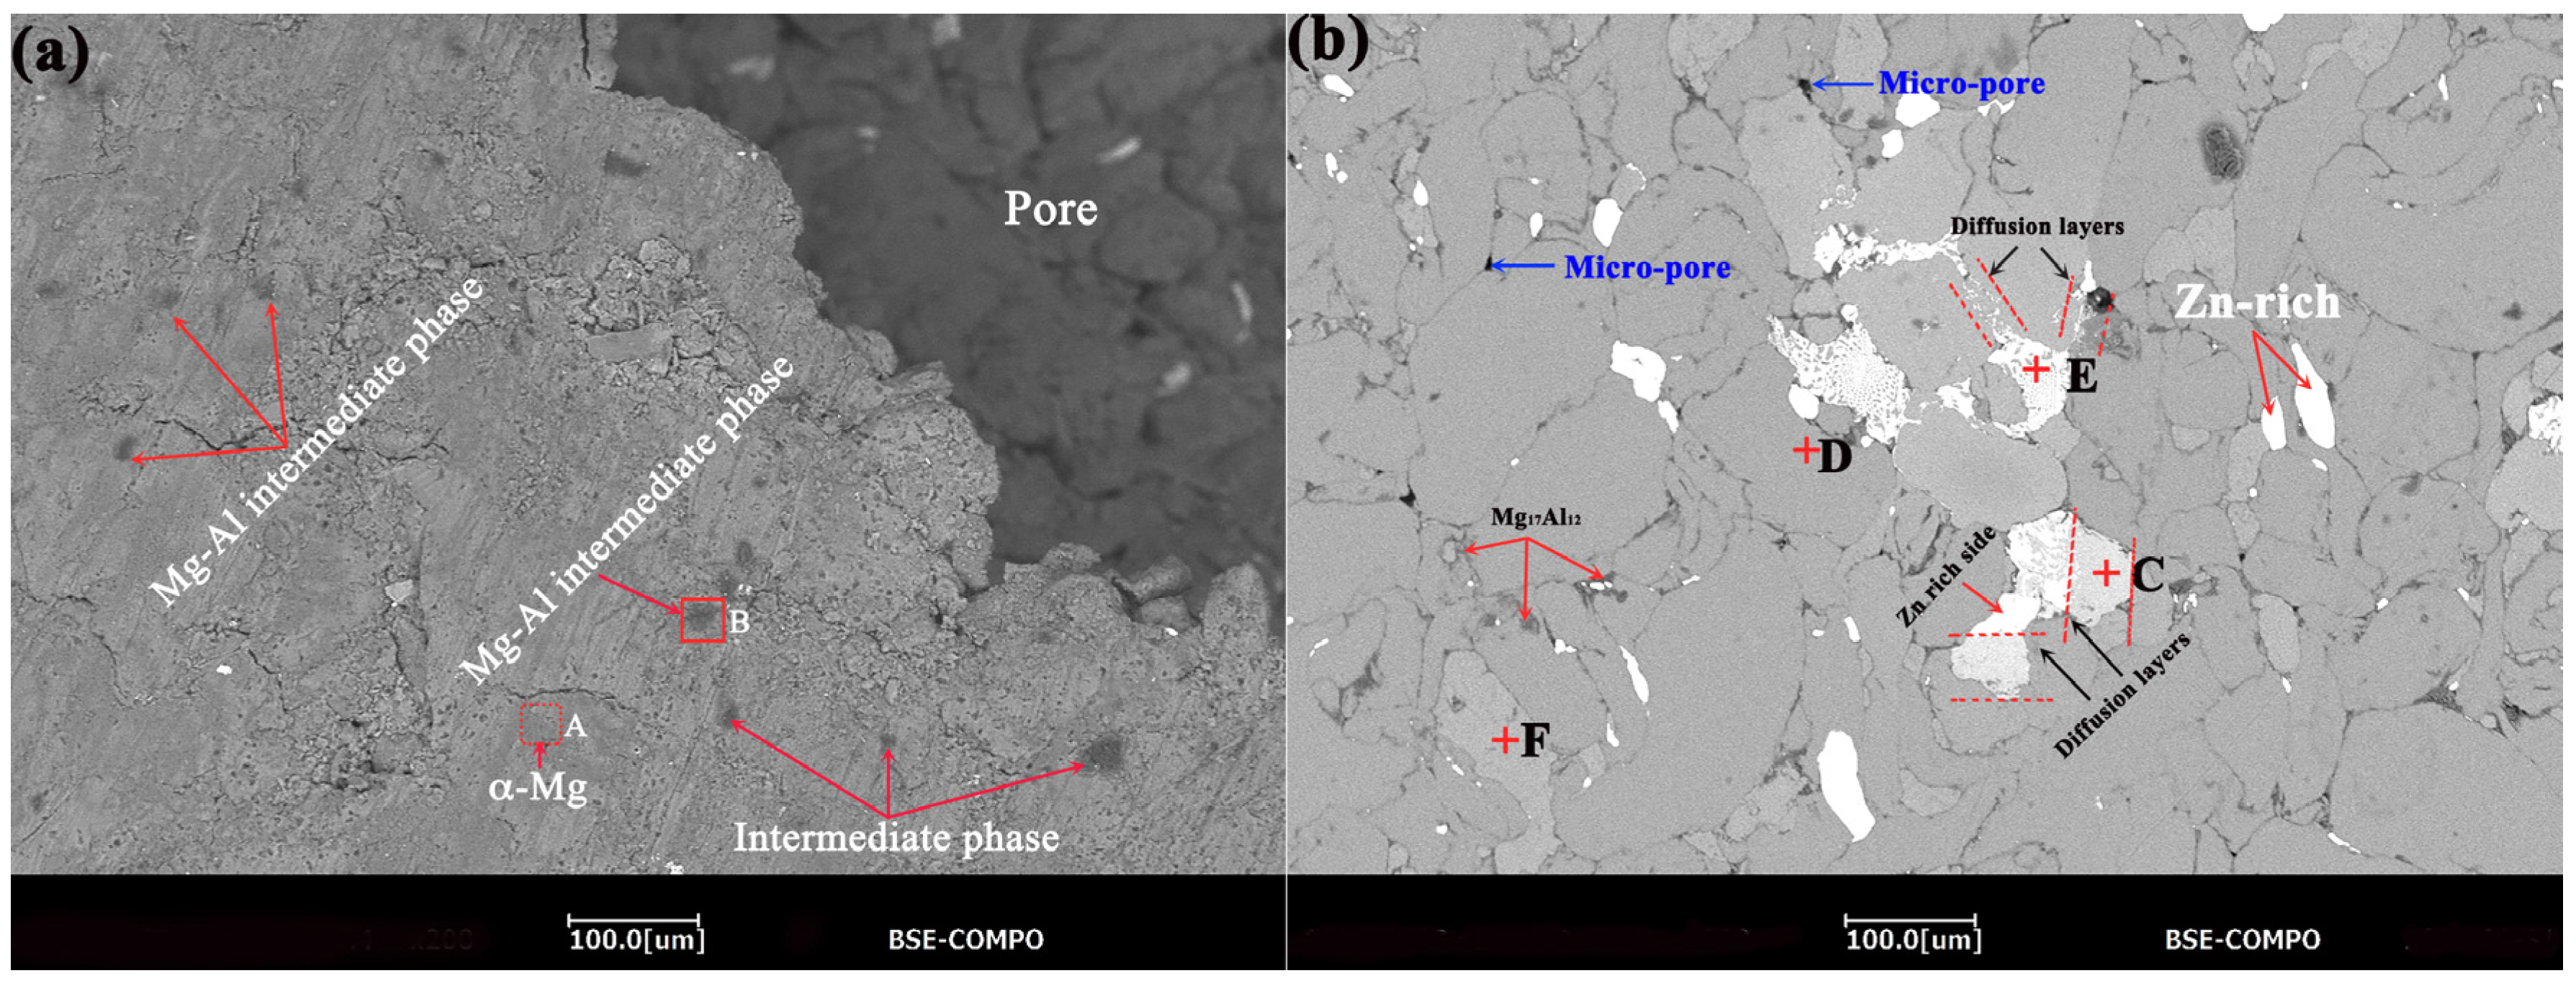
3.3. Microstructures of the Cell Walls of Porous Mg-Al-Zn Alloy Foam

Figure 4 shows the XRD patterns of the cell walls of the three samples, which are (a) the sample before sintering, (b) the sintered sample of porous Mg-9Al-1Zn alloy foam and (c) the sintered sample of porous Mg-9Al-5Zn alloy foam. It is observed that the porous Mg-Al-Zn precursor before sintering contains no intermetallics, and the XRD index only shows three phases corresponding to the pure Mg, pure Al and pure Zn (as shown in Figure 4a). After the sintering treatment, four phases were primarily indexed in the patterns, i.e., the α-Mg solid solution, the Mg17Al12 phase, the Al-rich phase and the Zn-rich phase. The presence of Mg17Al12 intermetallics denotes the reaction between Mg and the alloying elements. The XRD did not reveal any ϕ phase (Mg21 (ZnAl) 17) or Mg-Zn phase in the alloys. On the other hand, by increasing the Zn content in the alloy, the Mg17Al12 secondary phase increased in content. Specifically, as can be seen in the inset shown in Figure 4, some small peaks of the Mg17Al12 intermetallic phase can be observed at an angle between 38.5° and 40.5° in the porous Mg-9Al-5Zn alloy foam, which are absent both in the Mg-9Al-1Zn alloy sample and in the un-sintered sample, confirming that the Mg17Al12 intermetallic compound increases with more Zn added.
Rietveld refinement of the obtained XRD patterns for the Mg-9Al-1Zn alloy foam sample and the Mg-9Al-5Zn alloy foam sample was performed using the Fullprof Suite software. The refinement was accomplished by taking the structural phase models from the matching reference patterns calculated through the crystallography open database (COD). Using the refinement steps performed by Overman et al. [28] on the AZ91 alloy, a structural model of the magnesium hexagonal crystal structure (P 63/mm c, COD No: 9013057) was chosen as the starting point, which allows full assessment of the matrix crystal structure at all stages over a wide range of the diffraction angles. After respective refinement, several other weak diffraction peaks, such as Al- and Zn-rich peaks, were still evident, which did not allow the observed diffraction pattern to fit with the calculated patterns satisfactorily. Therefore, aluminum and zinc structure models with space groups of (F m-3 m, COD No: 9012003) and (P 63/mm c, COD No: 9008522) were separately introduced and used to refine the diffraction peaks further. The Mg17Al12 secondary phase was not particularly refined in this study due to challenges in obtaining its file from the COD, and its peaks in the XRD patterns are relatively weak and superimposed on the Al- and Zn-rich phases (see Figure 4). Therefore, the attempts to employ the Mg17Al12 theoretical simulated crystal structure model yield implausible results.
A linear Interpolation function was chosen to fit the background of polynomial terms. The pseudo-Voigt function was chosen for the peak shape refinement because it is the linear combination of Lorentzian and Gaussian functions and can be used to resolve size and strain contributions to peak broadening [29]. The refined parameters in this study include unit-cell parameters, shape parameters, preferred orientation (G1), atomic positions, zero-shift correction factor, background parameters and FWHM parameters. The stable refinements and good fits, as indicated by the smoothness of the difference in intensities between observed intensity (Iobs) and calculated intensity (Icalc) curves, Iobs–Icalc, are clearly seen in Figure 5, which confirms the veracity of the refinement.
The quantitative results of the peak shape and peak position, structure and background are calculated in terms of the least-square profile of R-factors and are shown in Table 1. According to Table 1, all the goodness of fits is more than unity. In essence, it should be noted that the goodness of fit (X2) cannot be less than unity or equivalent. When this occurs, it indicates that either the standard uncertainty for the data is overestimated or the model is adjusting to fit the noise [30]. Hence, the study results herein demonstrate that the values of (X2 >> 1) are reasonable, but there are some imperfections in the peak shapes. These imperfections may be due to some intermediate metastable phases in the alloys or the solid solution. All the values of R-factors are less than 12% of the existing pattern and refined pattern, which seems satisfactory for an alloy with multicomponent phases based on the suggestions of previous researchers who also obtained similar results [31,32,33].
Figure 6 shows the plots of the refined α-Mg lattice parameter dependent on the added Zn, which were taken from a file created by FullProf Suite. The initial values of pure Mg unit cell parameters in the plots are taken from matching reference patterns of the COD file. The refinement result shown in Figure 6a demonstrates that the values of the lattice parameters decrease with the addition of Zn. The solutes (Al and Zn elements) have smaller atomic sizes compared to pure Mg (the atomic sizes of Mg, Al and Zn are 163 pm, 143 pm and 139 pm, respectively), so it can be assumed that the solutes dissolve in the Mg lattices and then cause local atomic position distortion. Moreover, it has been reported that increasing the solute atoms’ size and decreasing the number of solvent atoms to form a solid solution can decrease the size of the lattice parameters [34]. However, the values of the lattice axes (a and c) of α-Mg do not seem to decrease linearly with the increase in Zn concentration. The value of the lattice parameter decreases rapidly in the Mg-9Al-1Zn alloy and then increases slightly in the Mg-9Al-5Zn alloy, which might be due to the formation of some metastable intermediate phases in the alloys. Nevertheless, these results are similar to those of the binary Mg alloys (Mg-Al, Mg-Zn and Mg-Li) found in the work of Park et al. [31].
According to Figure 6b, the unit cell volume of α-Mg decreases and then increases slightly, while the axial ratio (c/a) decreases steadily with the increase in Zn content. This phenomenon is a consequence of the lattice distortions in the α-Mg solid solution. Essentially, it can be stated that in the Mg-9Al-1Zn alloy, most of the Al and Zn elements were incorporated into the Mg solid solution lattices by substitution, then resulting in axis contraction and a decrease in unit cell volume. This could also be the reason for the low content of Mg17Al12 intermetallics and the corresponding relative weak intensity in the XRD pattern (see Figure 4). In contrast, the elements of Al and Zn in the Mg-9Al-5Zn alloy can react with Mg to produce a high content of Mg17Al12 intermetallics and, possibly, some metastable compounds, which are thought to interstitially occupy the Mg lattice position and then increase the α-Mg unit cell volume.
Figure 7 shows the cell wall SEM images (backscattered electron images, BSEI) and the corresponding EDS elemental mapping results for the porous Mg-9Al-5Zn foams before and after sintering treatment. Some distinct boundaries between the Mg, Al and Zn components can be observed in the sample before sintering, as shown in Figure 7a, indicating that the elemental metal powders were mechanically compacted at this stage, and it should be no strong metallurgical bonding occurring. Conversely, the microstructure and associated EDS elemental mapping in Figure 7b show that the boundary between the powder components after sintering at 380 °C for 12 hrs is not that clear, which implies that the atoms of the elements Mg, Al and Zn have diffused and distributed in the microstructure, and consequently, the intermetallic phases’ formation might occur and the metallurgical bonding was established.
The results of the EDS point analysis for the positions marked in Figure 7 are listed in Table 2. According to Table 2, the positions (“1”, “2” and “3”) of the un-sintered sample shown in Figure 7a are mainly unreacted Mg, the Al-rich phase and the Zn-rich phase, which confirms that the elemental powders have not yet reacted too much. For the sintered sample, the gray region (marked as “4” in Figure 7b) is the α-Mg solid solution. The darker gray region (marked as “5” in Figure 7b) has a chemical composition corresponding to the Mg17(Al, Zn)12 intermetallic compound. As initially stated, this compound is formed during the sintering process and is distributed throughout the microstructure. The light color morphology indicated by point “6” in the microstructure in Figure 7b also shows the composition of the α-Mg solid solution.
Figure 8 shows the effects of Zn concentration on the grain size and microstructure evolution of the porous Mg alloy foam cell wall. The microstructure of the porous Mg-9Al-1Zn alloy cell wall (Figure 8a) shows coarse grains with an average size of around 200 µm. The homogenous grains contain a sparsely distributed Mg-Al intermediate phase that appears as the dark spots in the microstructure morphology. The EDS analysis results of the grey region (marked as “A” in Figure 8a) and the dark spot region (marked as “B” in Figure 8a) are listed in Table 3. The EDS results indicate that the grey region of position “A” is a primary α-Mg solid solution, while the dark spot region of position “B” possesses a composition of Mg/Al atomic ratio approximately (1:1). This atomic ratio is unrelated to any equilibrium phase composition in the Mg-Al phase diagram [35,36,37]. Therefore, it is considered a metastable phase that is supersaturated by Al in Mg, suggesting that the elements Mg and Al in the Mg-9Al-1Zn foam sample almost dissolved in each other’s lattices with an equal atomic proportion. In essence, the intermediate phase appeared as finely intragranular precipitates in the microstructure of the homogenously distributed α-Mg phase, confirming that most of the solute atoms were substitutionary absorbed into α-Mg of the sample containing 1wt.% Zn content.
Figure 8b shows the microstructure with the Zn concentration of 5 wt.%. It is obvious that the microstructure has undergone grain refinement, with an average grain size of around 60 µm. Moreover, some micropores with an average size of 9 µm can also be seen in the microstructure. The grain refinement is caused by increased Zn content and the formation of secondary phases, while the micropores are due to the volume shrinkage and diffusion between elemental powder during the sintering process. Apparently, there are a number of inter-diffusion layers in the microstructure morphology. The EDS analysis results of part of the diffusion layers (i.e., the position marked “C” in Figure 8b) show a chemical composition related to Mg17Al12, whose chemical composition is listed in Table 3. Apart from the inter-diffusion layers, the Mg17Al12 intermetallic can be found at the grain boundaries. Essentially, the Mg17Al12 intermetallic compound is the only stable secondary phase in the cell wall. Moreover, there also exist an α-Mg phase and a metastable phase containing a Mg phase with enriched Al and Zn contents, whose EDS analysis (position “D” and “E” marked in Figure 8b) results are listed in Table 3. Furthermore, the position marked “F” shows an Al-rich phase. Particularly, these microstructures are inherently heterogeneous due to the reactive sintering mechanisms, local element reactions and variational interatomic diffusion.
More specifically, the Al-rich phase and the Zn-rich phase in the microstructure were caused by an incomplete reaction of the elements during the sintering condition. The reason could be the particle size of the metal powder because it has been reported that the particle sizes of metal powders influence how fast the diffusion rate and elements reaction [24,38]. When the size of the powder particles is excessively large, it impedes diffusion due to the longer diffusion path. Therefore, to ensure that the Al and Zn particles are fully reacted, a smaller size of powder particle, higher sintering temperature and/or a longer holding time is required, but care must be taken not to melt the Mg alloy.

3.4. Thermodynamic Calculation of Binary Phases in Mg-Al-Zn System

So far, the microstructural analysis revealed a binary Mg17Al12 intermetallic compound as the only stable secondary phase in the cell wall. To estimate the enthalpy energy that was responsible for the spontaneous formation of binary compounds in the Mg-Al-Zn system, the Miedema thermodynamic theorem was used [39]. According to the theorem, the formation energy of a crystalline solid solution containing binary components A-B is a sum of the chemical, elastic and structural contribution enthalpies required to form a bond between A and B in the system. The formation energy of the crystalline solid solution of A and B is expressed by Equation (1) [40]:
Δ H A   i n   B c r y s = Δ H c h e m + Δ H e l a s + Δ H s t r u c
where ∆Hchem is the chemical contribution enthalpy of the formation of the new components and breaking of atomic bonds, ∆Helas is the elastic contribution enthalpy (elastic mismatch energy) in solid solutions and ∆Hstruc is the structural contribution enthalpy of lattice stability energy due to differences in valence electrons of solute and solvent atoms. Without ab initio calculations, determining the structural contribution to the enthalpy is challenging. It is argued that structural contribution has minimal influence when compared to the chemical and elastic contributions to the total enthalpy of the system [41]. So, in this investigation, the structural contribution enthalpy is neglected (∆Hstruc≈0). As a result, Equation (1) becomes:
Δ H A   i n   B c r y s = Δ H c h e m + Δ H e l a s
Hence, the chemical contributions to the formation enthalpy in a binary alloy can be estimated by applying the semi-empirical model of Miedema, which is widely used because of its simplicity. In the model, ∆Hchem for each of the binary components (A-B) contained in the system can be determined by Equation (3) [42,43]:
Δ H A i n B = f A i n B     ·   x A ·   [ 1 + μ A x B ·   ( ϕ A ϕ B ) ] · [ 1 + μ B x A ·   ( ϕ B ϕ A ) ] x A V A 2 / 3 ·   [ 1 + μ A x B ( ϕ A ϕ B ) ] + x B V B 2 / 3 ·   [ 1 + μ B x A ( ϕ B ϕ A ) ] + x B
in which fAinB is the concentration of adjacent atoms in solid solution and can be written as:
f AinB   = 2 P V A 2 / 3 V B 2 / 3 n ws A 1 / 3 + n ws B 1 / 3   ·   [ ( ϕ B ϕ A ) 2 + Q P   ·   ( n ws A 1 3 + n ws B 1 3 ) 2 α × R P ]
In Equations (3) and (4), xA and xB are the mole fractions of atoms of A and B; VA and VB are the molar volumes of A and B, respectively Conversely, nws is the electronic density at the Wigner–Seitz cell boundary of the constituent elements; ϕ is the work function of the constituent elements. Moreover, α, µA, µB, Q, P, Q/P and R/P are semi-empirical parameters, which are evaluated and reported by Miedema and other researchers [34,44,45,46].
The elastic contribution (∆Helas) can be calculated by Equation (5) in Martínez et al. [34], where ∆EAinB is the elastic mismatch energy caused by element A dissolved in element B, and ∆EBinA is the elastic mismatch energy caused by element B dissolved in element A. The ∆Ei in j values can be calculated using Equation (6), where K and G are the bulk and shear moduli of the constituents’ elements, respectively.
Δ H e l a s = x A · x B · ( x A · Δ E B i n A + x B · Δ E B i n A )
Δ E A i n B = 2 K A G B   ·   ( V B V A ) 3 K A V B + 4 G B V A ,       Δ E B i n A = 2 K B G A   ·   ( V A V B ) 3 K B V A + 4 G A V B
The parameters required to solve Equations (3)–(6) for the Mg-Al-Zn system are listed in Table 4. For each binary component (Mg-Al, Mg-Zn and Al-Zn in the Mg-Al-Zn system), the mole fractions are calculated so that xi + xj = 1, where the, j = A, B. Finally, using Equation (2), the heat of formations of the binary compounds in the Mg-Al-Zn system was computed, and the resulting plots are shown in Figure 9.
According to Figure 9, the formation enthalpy of the Mg-Al phase is significantly larger in negative values with a maximum value of −3.50 kJ·mol−1 than that of the Mg-Zn compound with a value of −2.25 kJ·mol−1. On the other hand, the enthalpy energy of the Al-Zn compound is linearly constant and almost zero, indicating that no reaction is possible between Al and Zn elements in the alloy system. This explains why the Mg17Al12 intermetallic compound was preferentially formed throughout the microstructure, and there was no phase of the Mg-Zn compound in the alloy system under the same treatment condition. Most specifically, other phases such as Mg3Al2, Mg2Al3, Mg23Al30 and Mg89Al14 have been identified in the Mg-Al phase diagram [48]; however, they were not specifically detected in the microstructure in this study. Therefore, it is possible that those compounds were responsible for the metastable phases found in the microstructure. Prior to the Mg-Al-Zn system reaching equilibrium stability, many microstructural changes occurred during the practical sintering process, which, when combined with the rapid cooling of the Mg alloy foam samples in water, hindered the equilibrium transformation of some of those compounds and then led to the metastable transition phases found in the cell wall’s microstructure.

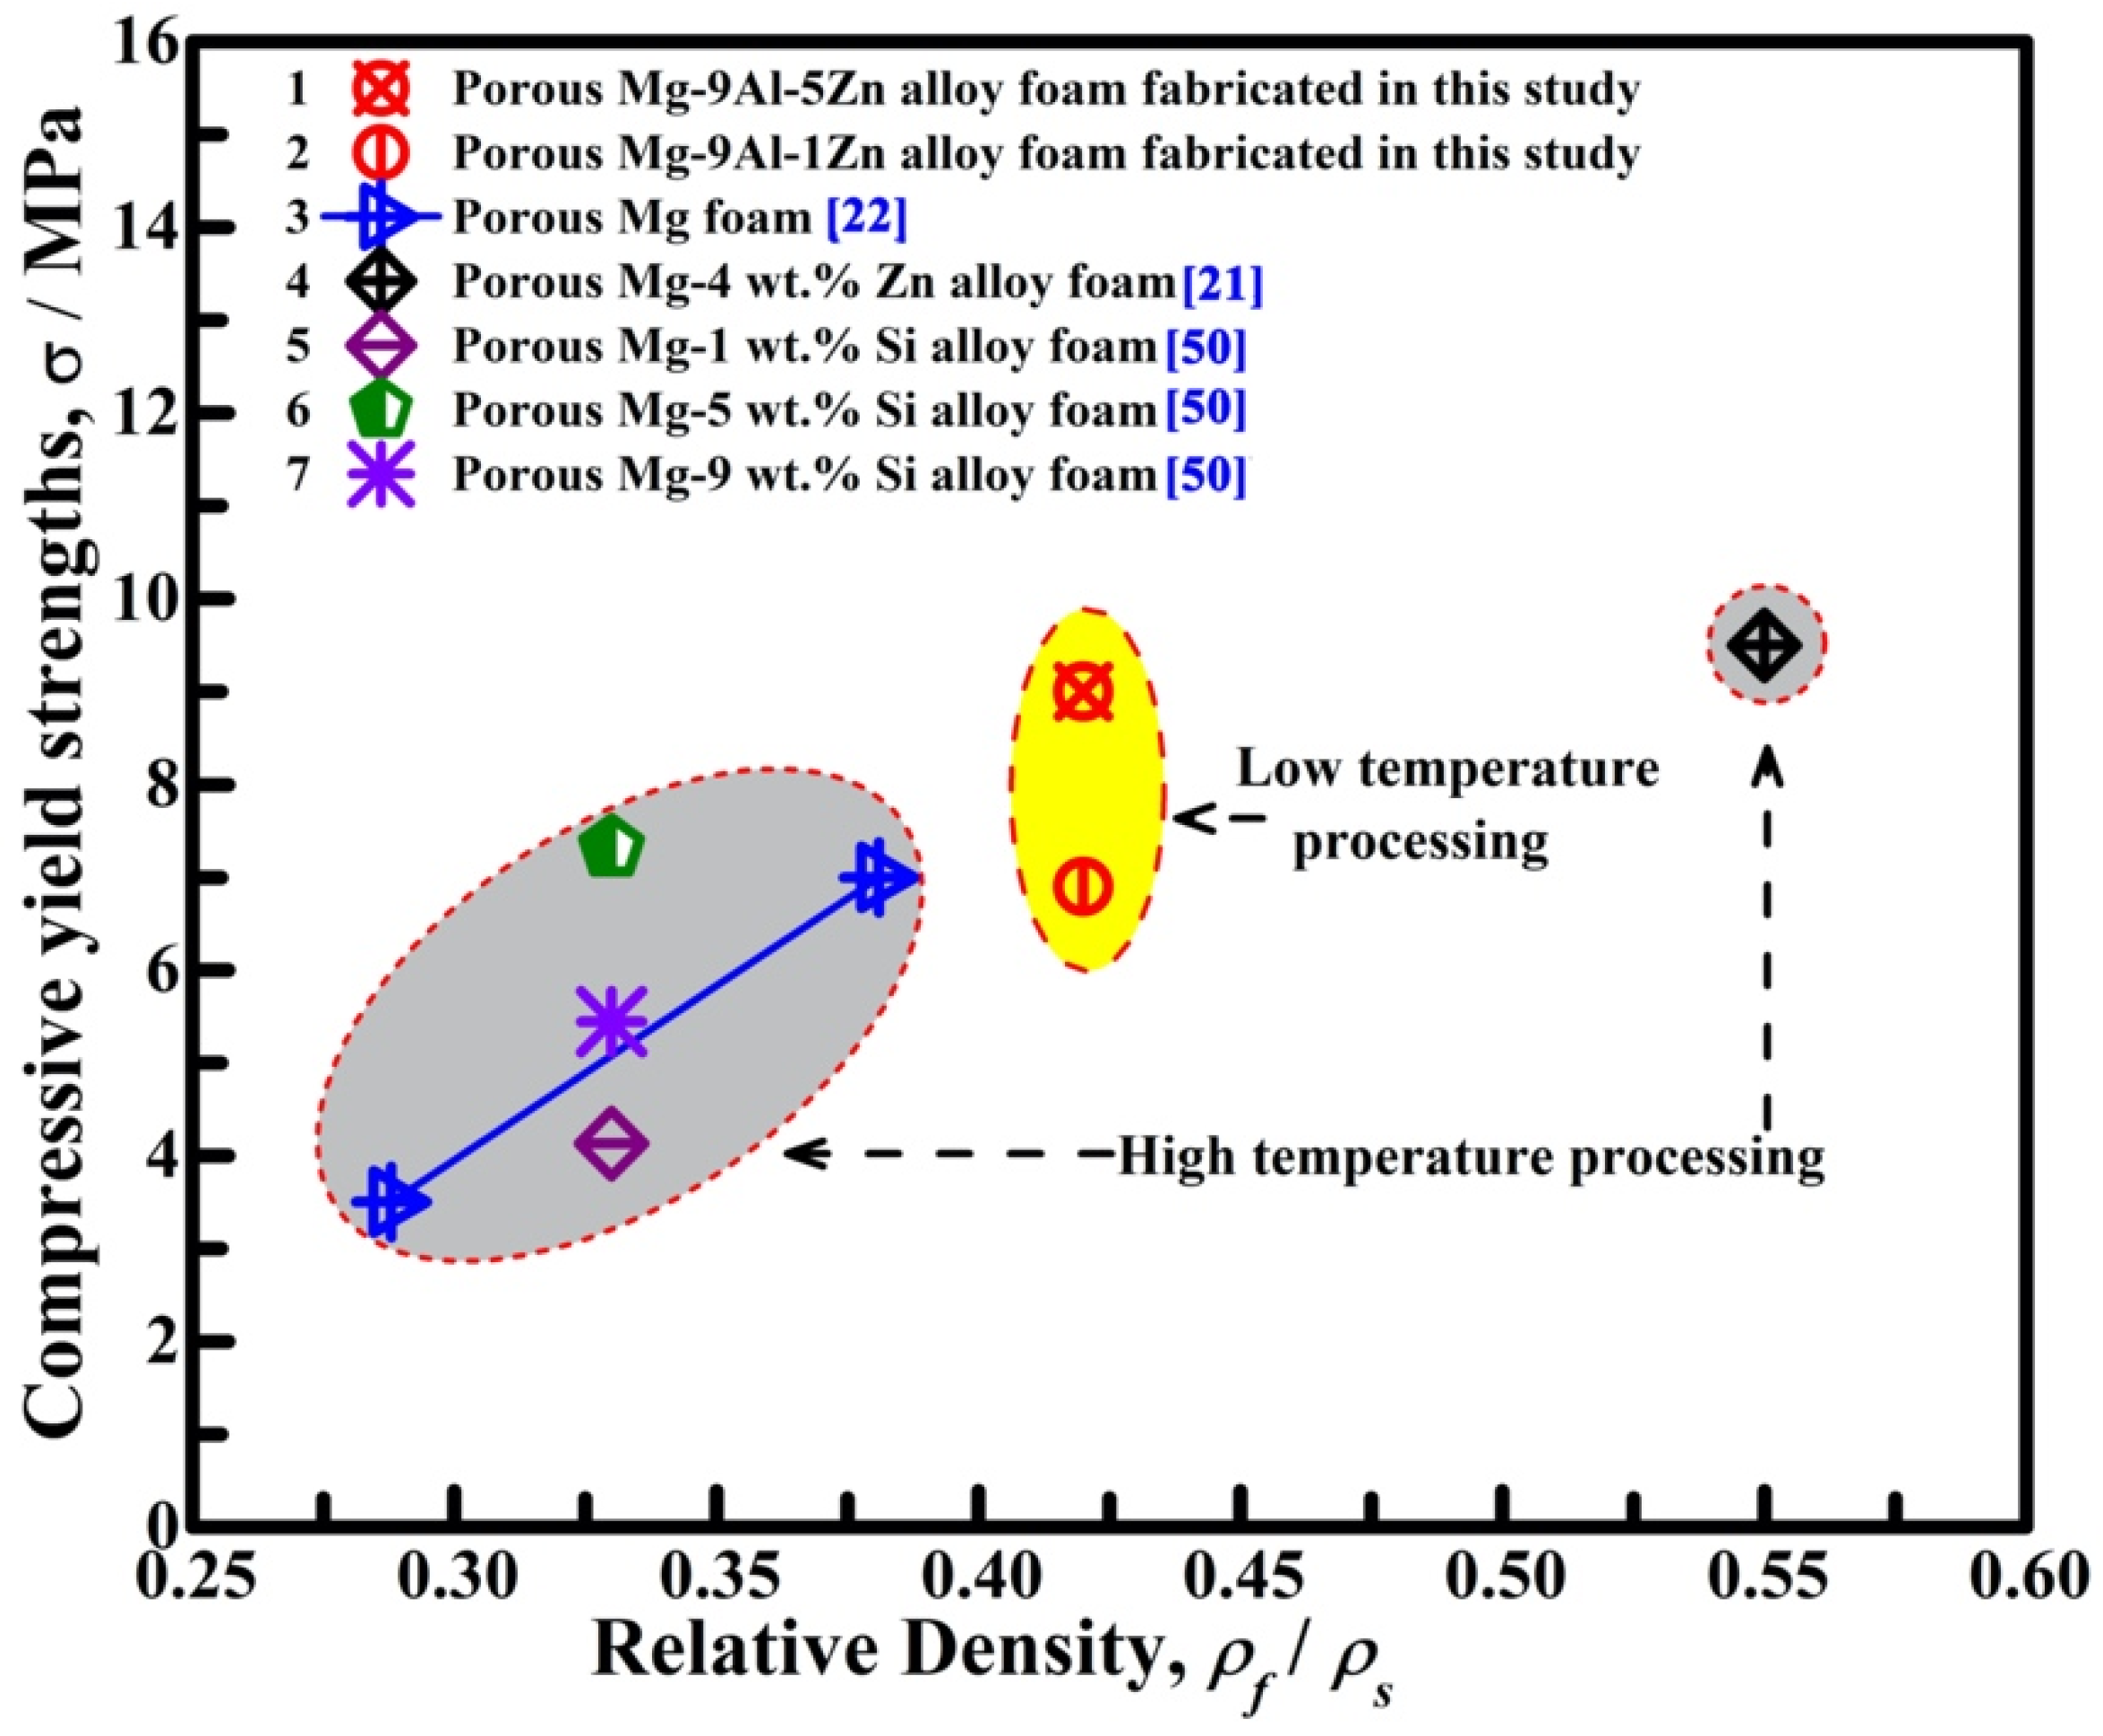
3.5. Compressive Strength Evaluation

The compression performance of the fabricated porous Mg alloy foams with the same composition and porosity is almost the same. Figure 10 shows the typical compressive stress–strain curves of the Mg alloy foams with equivalent relative density (R.D.) of 0.42 (corresponding porosity, Pr, is 58%). The shapes of the curves are typical of porous Mg/Mg alloy foams [22,49], having the following distinct sections: (i) linear deformation section, (ii) plateau deformation section and (iii) densification section. The linear deformation zone is the section of the stress–strain curve where the stress increases gradually with strain up to the peak stress value. Thereafter, the stress drops to the plateau region due to cracking during yielding. The plateau region is the section where the stress continues to consolidate in an oscillatory manner before the onset of densification. However, in this case, the oscillations were more pronounced in the sintered foam specimens than in the un-sintered specimens, which could be due to the presence of intermetallics in the cell walls. The densification section of the plots is the region where the stress increases exponentially at a small strain.
Essentially, in this study, the carbamide volume fraction in the porous Mg alloy foams was kept constant while the Zn concentration was varied. Consequently, the stress–strain curves show that the compressive strength of the foams increases with increasing Zn content. The porous Mg-9Al-5Zn alloy foam sample exhibits a yield strength of 9.0 MPa, which was 23% higher than the yield strength of the porous Mg-9Al-1Zn alloy foam sample of (6.9 MPa), both of which were higher than the yield strength of the un-sintered sample (2.5 MPa). It can be suggested that the addition of Zn improves the yield strengths of the foam.
In particular, the results of the XRD and SEM/EDS analyses have shown that intermetallic and grain refinement occurred in the microstructure of the cell wall. Therefore, it can be concluded that the intermetallic compounds and microstructure refinement improved the strength of the foam significantly, especially for the porous Mg-9Al-5Zn alloy foam sample. Liu et al. [50,51] have reported that intermetallic compounds/secondary phases are good reinforcements for porous Mg alloy foams, but when their concentrations are excessively high, they decrease the foam’s strength by acting as stress concentrators in the microstructure of the cell wall. Although the reinforcing intermetallics in this study are not laves phases, they are rather layers of compounds that have been diffusely inter-bonded in the cell wall’s microstructure, so they are unlikely to act as stress concentrators in the microstructure of the cell wall.
Figure 11 shows the comparison between the compressive yield strengths in this study and those of other porous Mg/Mg alloy foams prepared by high-temperature sintering of PM [21,22] and melt infiltration casting [50]. Based on the given relative densities, the reactively sintered foams in this study can provide high strengths, which conform to the strengths of other porous Mg/Mg alloy foams prepared by high-temperature sintering. This indicates that the principle of reactive sintering is a viable approach and a lower energy cost for fabricating porous Mg alloy foams.

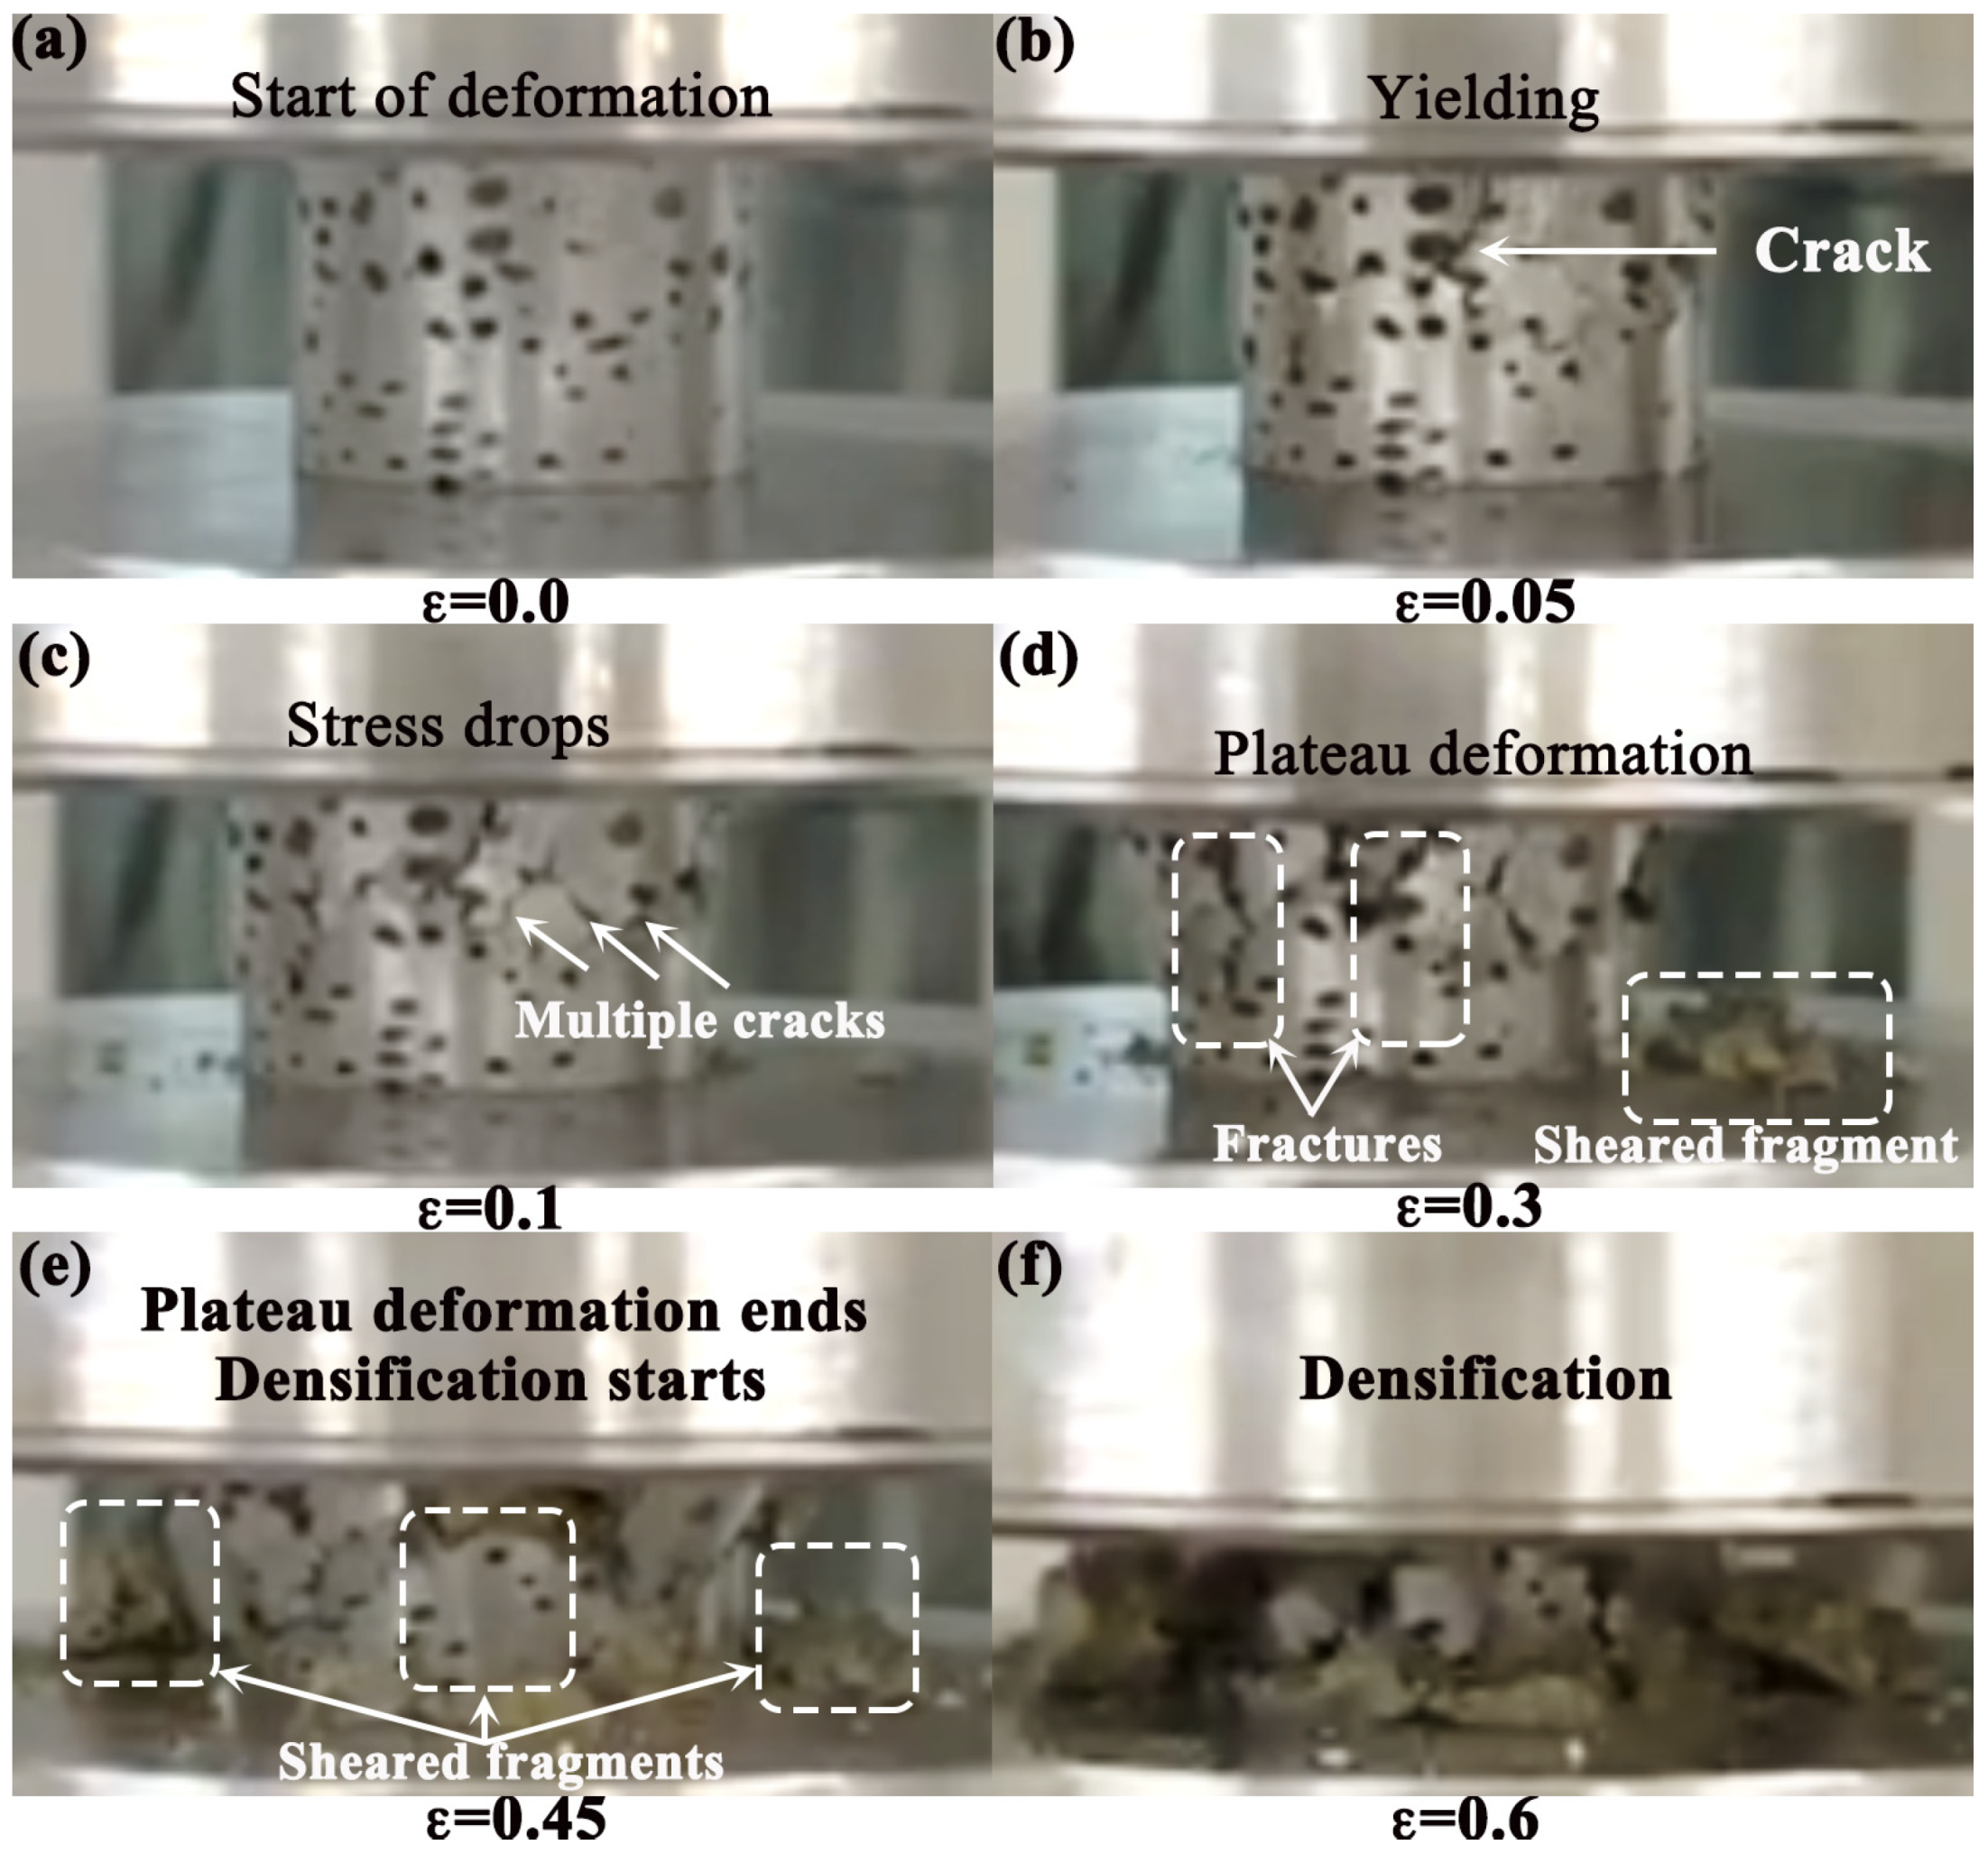
3.6. Deformation Mechanism

Figure 12 demonstrates the deformation behavior of the fabricated porous Mg alloy foams, and six different strain phases were photographed. As mentioned earlier, three different deformation sections of the foam were found and classified as linear deformation, plateau deformation and densification sections. During the compression process, the shape of the foam surface does not change during the linear deformation section (see Figure 12a). From the beginning of the test until yielding, the foam surface has clear, spherical pores and no cracking. At this stage, the cell walls simply bend and stretch in response to the applied loads. This linear deformation action continues until the peak stress is reached, at which a surface crack forms (as shown in Figure 12b). Beyond this stage, there was a rapid decrease in stress in the plateau region, which could be related to the propagation of many cracks and the onset of cell wall collapse, as shown in Figure 12c. The formation and propagation of cracks during foam compression may be due to several causes, including (1) the local stress concentrations from interconnected pores and (2) the weak and brittle cell walls. Since the cell walls in this situation were rich in intermetallics, they could be considered brittle cell walls, resulting in a rapid stress drop and a rupture of the cell walls when they were in the plateau region. When the applied stress is further increased, the cracks continue to elongate and propagate throughout the entire foam. At this stage, the oscillatory movements of the curves have begun, accompanied by a progressive collapse of the cell walls, crushing and fracture under nearly constant loading with increasing strain (as shown in Figure 12d).
However, certain sections of the cell walls were sheared from the foam specimen, as shown in Figure 12d,e. Specifically, the shearing off of the foam left a small area of the foam to be deformed, and then concentrating the applied load on the small area led to the rapid drop of the stress and low plateau stress. Finally, Figure 12f shows the densification of the foam sample. In this section, some of the cracked cell walls overlap in layers and become denser, while the cell walls deform continuously. As mentioned earlier, this section is characterized by an exponential increase in stress with minimal strain. Hence, the deformation modes of the porous Mg alloy foam can be classified as (1) bending, (2) cracking and crushing and (3) fracture and shearing of the cell walls.

4. Conclusions

The reactive sintering of powder metallurgy was used to fabricate the porous Mg-Al-Zn alloy foams with interconnected pore structures. Round and connected pores were introduced into the foams using 43 wt.% spherical carbamides. The porous Mg alloy foams were successfully fabricated at low-temperature sintering. The metallurgical bonding or intermetallic compounds can be formed during the sintering process. The potential for forming the intermetallics between the binary compounds in the Mg-Al-Zn system was based on the principles of the reaction-diffusion mechanism.
The Rietveld refinement results show that the values of the lattice parameters decreased as the solute atoms (Al and Zn) dissolved in the Mg solid solution. Specifically, the value of the α-Mg lattice parameters was reduced in the porous Mg-9Al-1Zn alloy foam and slightly increased in porous Mg-9Al-5Zn alloy foam, which was due to the stable and metastable compounds formed in the microstructure of the cell wall.
The SEM-EDS analysis results of the sintered alloy (Mg-9Al-1Zn) confirm that when the Zn content was 1 wt.%, the constituent solute atoms (Al and Zn) are absorbed substitutionally into the lattices of the Mg solid solution. Meanwhile, when the Zn content was increased to 5wt.% in the Mg-9Al-5Zn system, the dissolution of the solute atoms was limited, a substantial proportion of both stable equilibrium compounds (Mg17Al12) and several metastable compounds were formed in the cell wall. Additionally, the cell wall’s microstructure morphology of porous Mg-9Al-5Zn alloy foam was refined as a result of the formation and segregation of the Mg-Al compound in the grain boundary. Furthermore, the thermodynamic calculations prove that the large negative enthalpy energy of the binary Mg-Al compound leads to the preferential formation of the Mg17Al12 intermetallic phase in the cell walls.
Based on the given relative density of 0.42, the stress–strain behavior of the sintered Mg-9Al-5Zn alloy foam exhibits the highest yield strength (9.0 MPa), which was 23% higher than the strength of the Mg-9Al-1Zn alloy foam because of the influence of the intermetallics and grain refinement. All the plateau regions of the compressed foams are serrated, indicating that the foams were seemly brittle. The compressive strengths of the porous Mg alloy foams fabricated in this study are comparable with the strengths of other porous Mg/Mg alloy foams that were fabricated by high-temperature sintering. Furthermore, the deformation modes of the foams were bending, cracking, fracturing and shearing-off of the cell walls.

Author Contributions

Conceptualization, D.Y. and S.-O.A.; methodology, D.Y.; validation, D.Y., and J.C.; data curation, D.Y.; writing—original draft preparation, S.-O.A.; writing—review and editing, D.Y., J.C. and H.W.; supervision, D.Y. and L.W.; project administration, D.Y. and L.W.; funding acquisition, D.Y. and L.W. All authors have read and agreed to the published version of the manuscript.

Funding

This work is supported by the Basic Science Research Project of Nantong of China (Grant No. JC2021190), the Nature Science Foundation of Jiangsu Province of China (Grant. No. BK20171437), the Guiding Capital for Industry Development Project of Suqian and National Science Foundation of China (No. 11472098), and the Nature Science Foundation of China (Grant. No. 12072105).

Institutional Review Board Statement

Not applicable.

Informed Consent Statement

Not applicable.

Data Availability Statement

Not applicable.

Conflicts of Interest

The authors declare no conflict of interest.

References

  1. Agbedor, S.-O.; Yang, D.; Cao, J.; Chen, J.; Saleh, B.; Qiu, C.; Wang, L.; Jiang, J.; Ma, A. Recent progress in porous Mg-based foam preparation approaches: Effect of processing parameters on structure and mechanical property. J. Iron Steel Res. Int. 2022, 29, 371–402. [Google Scholar] [CrossRef]
  2. Lehmhus, D.; Vesenjak, M.; De Schampheleire, S.; Fiedler, T. From foam to designed structure: Balancing cost and performance of cellular metals. Materials 2017, 10, 922. [Google Scholar] [CrossRef] [PubMed] [Green Version]
  3. Kucharczyk, A.; Naplocha, K.; Kaczmar, J.W.; Dieringa, H.; Kainer, K.U. Current status and recent developments in porous magnesium fabrication. Adv. Eng. Mater. 2017, 20, 1700562. [Google Scholar] [CrossRef]
  4. Rajak, D.K.; Kumaraswamidhas, L.A.; Das, S. Technical overview of aluminum alloy foam. Rev. Adv. Mater. Sci. 2017, 48, 68–86. [Google Scholar]
  5. Gibson, L.J.; Ashby, M.F. Cellular Solids: Structure and Properties, 2nd ed.; Cambridge Unviersity Press: Cambridge, UK, 2004. [Google Scholar]
  6. Banhart, J. Manufacture, characterisation and application of cellular metals and metal foams. Prog. Mater. Sci. 2001, 46, 559–632. [Google Scholar] [CrossRef]
  7. Kirkland, N.T.; Kolbeinsson, I.; Woodfield, T.; Dias, G.J.; Staiger, M.P. Synthesis and properties of topologically ordered porous magnesium. Mater. Sci. Eng. B 2011, 176, 1666–1672. [Google Scholar] [CrossRef]
  8. Lara-Rodriguez, G.A.; Figueroa, I.A.; Suarez, M.A.; Novelo-Peralta, O.; Alfonso, I.; Goodall, R. A replication-casting device for manufacturing open-cell Mg foams. J. Mater. Processing Technol. 2017, 243, 16–22. [Google Scholar] [CrossRef]
  9. Trinidad, J.; Marco, I.; Arruebarrena, G.; Wendt, J.; Letzig, D.; Sáenz de Argandoña, E.; Goodall, R. Processing of magnesium porous structures by infiltration casting for biomedical applications. Adv. Eng. Mater. 2014, 16, 241–247. [Google Scholar] [CrossRef]
  10. Osorio-Hernández, J.O.; Suarez, M.A.; Goodall, R.; Lara-Rodriguez, G.A.; Alfonso, I.A.; A Figueroa, I. Manufacturing of open-cell Mg foams by replication process and mechanical properties. Mater. Des. 2014, 64, 136–141. [Google Scholar] [CrossRef]
  11. Dong, Q.; Li, Y.; Jiang, H.; Zhou, X.; Liu, H.; Lu, M.; Chu, C.; Xue, F.; Bai, J. 3D-cubic interconnected porous Mg-based scaffolds for bone repair. J. Magnes. Alloy. 2021, 9, 1329–1338. [Google Scholar] [CrossRef]
  12. Kirkland, N.T.; Kolbeinsson, I.; Woodfield, T.; Dias, G.; Staiger, M.P. Processing-property relationships of as-cast magnesium foams with controllable architecture. Int. J. Mod. Phys. B 2009, 23, 1002–1008. [Google Scholar] [CrossRef]
  13. Zou, N.; Li, Q. Mechanical properties of lightweight porous magnesium processed through powder metallurgy. JOM 2018, 70, 650–655. [Google Scholar] [CrossRef]
  14. Temiz, A.; Yaşar, M.; Koç, E. Fabrication of open-pore biodegradable magnesium alloy scaffold via infiltration technique. Int. J. Met. 2021, 16, 317–328. [Google Scholar] [CrossRef]
  15. Seyedraoufi, Z.S.; Mirdamadi, S. In vitro biodegradability and biocompatibility of porous Mg-Zn scaffolds coated with nano hydroxyapatite via pulse electrodeposition. Trans. Nonferrous Met. Soc. China 2015, 25, 4018–4027. [Google Scholar] [CrossRef]
  16. Wen, C.E.; Yamada, Y.; Shimojima, K.; Chino, Y.; Hosokawa, H.; Mabuchi, M. Compressibility of porous magnesium foam: Dependency on porosity and pore size. Mater. Lett. 2004, 58, 357–360. [Google Scholar] [CrossRef]
  17. Akinwekomi, A.D.; Law, W.-C.; Choy, M.-T.; Chen, L.; Tang, C.-Y.; Tsui, G.C.-P.; Yang, X.-S. Processing and characterisation of carbon nanotube-reinforced magnesium alloy composite foams by rapid microwave sintering. Mater. Sci. Eng. A 2018, 726, 82–92. [Google Scholar] [CrossRef]
  18. Akinwekomi, A.D. Microstructural characterisation and corrosion behaviour of microwave-sintered magnesium alloy AZ61/fly ash microspheres syntactic foams. Heliyon 2019, 5, e01531. [Google Scholar] [CrossRef] [Green Version]
  19. Akinwekomi, A.D.; Law, W.-C.; Tang, C.-Y.; Chen, L.; Tsui, C.-P. Rapid microwave sintering of carbon nanotube-filled AZ61 magnesium alloy composites. Compos. Part B Eng. 2016, 93, 302–309. [Google Scholar] [CrossRef]
  20. Wen, C.E.; Mabuchi, M.; Yamada, Y.; Shimojima, K.; Chino, Y.; Asahina, T. Processing of biocompatible porous Ti and Mg. Scr. Mater. 2001, 45, 1147–1153. [Google Scholar] [CrossRef]
  21. Seyedraoufi, Z.S.; Mirdamadi, S. Synthesis, microstructure and mechanical properties of porous Mg-Zn scaffolds. J. Mech. Behav. Biomed. Mater. 2013, 21, 1–8. [Google Scholar] [CrossRef]
  22. Hao, G.; Han, F.; Li, W. Processing and mechanical properties of magnesium foams. J. Porous Mater. 2009, 16, 251–256. [Google Scholar] [CrossRef]
  23. Bafti, H.; Habibolahzadeh, A. Production of aluminum foam by spherical carbamide space holder technique-processing parameters. Mater. Des. 2010, 31, 4122–4129. [Google Scholar] [CrossRef]
  24. Chen, Z.; Takeda, T.; Ikeda, K. Microstructural evolution of reactive-sintered aluminum matrix composites. Compos. Sci. Technol. 2008, 68, 2245–2253. [Google Scholar] [CrossRef]
  25. Witte, F.; Feyerabend, F.; Maier, P.; Fischer, J.; Störmer, M.; Blawert, C.; Dietzel, W.; Hort, N. Biodegradable magnesium-hydroxyapatite metal matrix composites. Biomaterials 2007, 28, 2163–2174. [Google Scholar] [CrossRef] [PubMed] [Green Version]
  26. Yan, Y.; Kang, Y.; Li, D.; Yu, K.; Xiao, T.; Wang, Q.; Deng, Y.; Fang, H.; Jiang, D.; Zhang, Y. Microstructure, mechanical properties and corrosion behavior of porous Mg-6 wt.% Zn scaffolds for bone tissue engineering. J. Mater. Eng. Perform. 2018, 27, 970–984. [Google Scholar] [CrossRef]
  27. Rodríguez-Carvajal, J. Recent advances in magnetic structure determination by neutron powder diffraction. Phys. B 1993, 192, 55–69. [Google Scholar] [CrossRef]
  28. Overman, N.R.; Whalen, S.A.; Bowden, M.E.; Olszta, M.J.; Kruska, K.; Clark, T.; Stevens, E.L.; Darsell, J.T.; Joshi, V.V.; Jiang, X.; et al. Homogenization and texture development in rapidly solidified AZ91E consolidated by shear assisted processing and extrusion (ShAPE). Mater. Sci. Eng. A 2017, 701, 56–68. [Google Scholar] [CrossRef]
  29. Ramkumar, T.; Selvakumar, M.; Vasanthsankar, R.; Sathishkumar, A.; Narayanasamy, P.; Girija, G. Rietveld refinement of powder X-ray diffraction, microstructural and mechanical studies of magnesium matrix composites processed by high energy ball milling. J. Magnes. Alloy. 2018, 6, 390–398. [Google Scholar] [CrossRef]
  30. Toby, B.H. R factors in Rietveld analysis: How good is good enough? Powder Diffr. 2006, 21, 67–70. [Google Scholar] [CrossRef] [Green Version]
  31. Park, J.S.; Chang, Y.W. The effect of alloying elements on the c/a ratio of magnesium binary alloys. Adv. Mater. Res. 2007, 26–28, 95–98. [Google Scholar] [CrossRef]
  32. Zhao, P.; Lu, L.; Liu, X.; De La Torre, A.G.; Cheng, X. Error analysis and correction for quantitative phase analysis based on rietveld-internal standard method: Whether the minor phases can be ignored? Crystals 2018, 8, 110. [Google Scholar] [CrossRef] [Green Version]
  33. Chatelier, C.; Wiskel, J.B.; Ivey, D.G.; Henein, H. The effect of skelp thickness on precipitate size and morphology for X70 microalloyed steel using rietveld refinement (quantitative X-ray diffraction). Crystals 2018, 8, 287. [Google Scholar] [CrossRef] [Green Version]
  34. Martínez, C.; Aguilar, C.; Briones, F.; Guzmán, D.; Zelaya, E.; Troncoso, L.; Rojas, P.A. Effects of Zr on the amorphization of Cu-Ni-Zr alloys prepared by mechanical alloying. J. Alloys Compd. 2018, 765, 771–781. [Google Scholar] [CrossRef]
  35. He, K.; Zhao, J.; Cheng, J.; Shangguan, J.; Wen, F.; Duan, J.; Su, R.; Yuan, B.; Wen, H. Effect of pouring temperature during a novel solid–liquid compound casting process on microstructure and mechanical properties of AZ91D magnesium alloy parts with arc-sprayed aluminum coatings. J. Mater. Sci. 2020, 55, 6678–6695. [Google Scholar] [CrossRef]
  36. Ren, Y.; Qin, G.; Pei, W.; Li, S.; Guo, Y.; Zhao, H. Phase equilibria of Mg-rich corner in Mg-Zn-Al ternary system at 300 °C. Trans. Nonferrous Met. Soc. China 2012, 22, 241–245. [Google Scholar] [CrossRef]
  37. Wei, K.; Zeng, X.; Wang, Z.; Deng, J.; Liu, M.; Huang, G.; Yuan, X. Selective laser melting of Mg-Zn binary alloys: Effects of Zn content on densification behavior, microstructure, and mechanical property. Mater. Sci. Eng. A 2019, 756, 226–236. [Google Scholar] [CrossRef]
  38. Valant, M.; Suvorov, D.; Pullar, R.C.; Sarma, K.; Alford, N.M. A mechanism for low-temperature sintering. J. Eur. Ceram. Soc. 2006, 26, 2777–2783. [Google Scholar] [CrossRef]
  39. Barkker, H. Enthalpy in Alloys, Miedema’s Semi-Emperical Model; Trans Tech Publications: Zurich, Switzerland, 1967. [Google Scholar]
  40. Jin, L.; Kevorkov, D.; Medraj, M.; Chartrand, P. Al-Mg-RE (RE = La, Ce, Pr, Nd, Sm) systems: Thermodynamic evaluations and optimizations coupled with key experiments and Miedema’s model estimations. J. Chem. Thermodyn. 2013, 58, 166–195. [Google Scholar] [CrossRef]
  41. Ray, P.K.; Akinc, M.; Kramer, M.J. Applications of an extended Miedema’s model for ternary alloys. J. Alloys Compd. 2010, 489, 357–361. [Google Scholar] [CrossRef]
  42. Wu, Y.; Du, W.; Nie, Z.; Cao, L.; Zuo, T. Thermodynamic calculation of intermetallic compounds in AZ91 alloy containing calcium. Trans. Nonferrous Met. Soc. China 2006, 16, 392–396. [Google Scholar] [CrossRef]
  43. Zhang, R.F.; Sheng, S.H.; Liu, B.X. Predicting the formation enthalpies of binary intermetallic compounds. Chem. Phys. Lett. 2007, 442, 511–514. [Google Scholar] [CrossRef]
  44. Abaspour, S. Thermodynamics-Based Design of Creep Resistant Mg Solid Solutions Using the Miedema Scheme. Ph.D. Thesis, The University of Queensland, St Lucia, Australia, 2014. [Google Scholar]
  45. Cai, H.; Guo, F.; Su, J.; Liu, L. Thermodynamic analysis of Al-RE phase formation in AZ91-RE (Ce, Y, Gd) magnesium alloy. Phys. Status Solidi B 2020, 257, 1900453. [Google Scholar] [CrossRef]
  46. Zhang, R.F.; Zhang, S.H.; He, Z.J.; Jing, J.; Sheng, S.H. Miedema Calculator: A thermodynamic platform for predicting formation enthalpies of alloys within framework of Miedema’s theory. Comput. Phys. Commun. 2016, 209, 58–69. [Google Scholar] [CrossRef]
  47. Cheng, T.; Zhang, L. Thermodynamic Descriptions of the Quaternary Mg–Al–Zn–Sn System and Their Experimental Validation. In Magnesium Technology 2020; The Minerals, Metals & Materials Series; Jordon, J., Miller, V., Joshi, V., Neelameggham, N., Eds.; Springer: Cham, Switzerland, 2020. [Google Scholar] [CrossRef]
  48. Mezbahul-Islam, M.; Mostafa, A.O.; Medraj, M. Essential magnesium alloys binary phase diagrams and their thermochemical data. J. Mater. 2014, 2014, 1–33. [Google Scholar] [CrossRef] [Green Version]
  49. Hao, G.L.; Han, F.S.; Wu, J.; Wang, X.F. Mechanical and damping properties of porous AZ91 magnesium alloy. Powder Metall. 2007, 50, 127–131. [Google Scholar] [CrossRef]
  50. Liu, J.; Zhang, L.; Liu, S.; Han, Z.; Dong, Z. Effect of Si content on microstructure and compressive properties of open-cell Mg composite foams reinforced by in-situ Mg2Si compounds. Mater. Charact. 2020, 159, 110045. [Google Scholar] [CrossRef]
  51. Liu, J.; Shi, S.; Zhang, L. Enhanced compressive properties of open-cell Mg-Gd-Zn foams with long-period stacking ordered phase at elevated temperatures. Mater. Lett. 2018, 231, 154–158. [Google Scholar] [CrossRef]
Figure 1. Morphology of carbamide granules used as the space holder for fabricating porous Mg alloy foams (a) and TG–DSC curves of carbamide (b), where the heating rate is 10 °C and atmosphere is Ar gas flow of 40 mL/min.
Metals 12 00692 g001
Figure 2. Simulation results of phases changing with temperature in Mg-Al-Zn alloys: (a) Mg-9Al-1Zn alloy; (b) Mg-9Al-5Zn alloy.
Metals 12 00692 g002
Figure 3. Image of the porous Mg alloy foam with porosity of 60.2% after sintering (a) and its corresponding cross-section image (b).
Metals 12 00692 g003
Figure 4. X-ray diffraction patterns of the cell walls of porous Mg-Al-Zn foam samples before and after sintering.
Metals 12 00692 g004
Figure 5. Rietveld refinement results for the Mg-Al-Zn alloy foams: (a) porous Mg-9Al-1Zn alloy and (b) porous Mg-9Al-5Zn alloy.
Metals 12 00692 g005
Figure 6. The lattice parameters dependence of the α-Mg phase on Zn content in the Mg-Al–Zn ternary system as determined by Rietveld refinement: (a) axes parameters; (b) cell volume and axial ratio.
Metals 12 00692 g006
Figure 7. SEM (BSE) images and corresponding elemental mapping images of Mg-9Al-5Zn alloy foam: (a) before sintering treatment; (b) after sintering treatment.
Metals 12 00692 g007
Figure 8. SEM image of the cell wall of the porous Mg-9Al-1Zn alloy foam (a) and SEM image of the cell wall of the porous Mg-9Al-5Zn alloy foam (b). The EDS analysis results marked as “A” to “F” are listed in Table 3.
Metals 12 00692 g008
Figure 9. The formation enthalpy of binary phases of Mg-Al, Mg-Zn and Al-Zn compounds in the Mg-Al-Zn system.
Metals 12 00692 g009
Figure 10. Compressive stress–strain curves of the un-sintered sample, porous Mg-9Al-1Zn alloy foam sample and porous Mg-9Al-5Zn alloy foam sample with equivalent relative density (R. D. = 0.42).
Metals 12 00692 g010
Figure 11. Relationships between the compressive yield strength and relative density of Mg-based foams. In the figure, 1 and 2 are porous Mg alloy foams in this study; 3 is the porous Mg foam data from [22]; 4 is the porous Mg-4 wt. % Zn alloy foam data from [21]; 5, 6 and 7 are Porous Mg-xSi composite foam (x = 1, 5, and 9 wt.%) data from [50].
Metals 12 00692 g011
Figure 12. Different stages of deformation behavior straining the porous Mg alloy foams. (af) are the images to demonstrate the foam after compressed to the strains (ε) of 0.0, 0.05, 0.1, 0.3, 0.45 and 0.6, respectively.
Metals 12 00692 g012
Table 1. Rietveld refined structural parameters for Mg-Al-Zn alloy foams: a dependency on the α-Mg phase.
Alloy CompositionLattice ParametersAxial Ratio (c/a)Unit Cell Volume (nm3)R-Factors (%)
Mg-9Al-1Zna0 = 3.2093 nm1.6237139.4393Rp = 9.24
b0 = 3.2093 nmRwp = 10.19
c0 = 5.2109 nmRexp = 5.55
α = 90°, β = 90°, γ = 120°X2 = 4.15
Mg-9Al-5Zna0 = 3.2121 nm1.6232139.7658Rp = 10.05
b0 = 3.2121 nmRwp = 11.10
c0 = 5.214 nmRexp = 3.90
α = 90°, β = 90°, γ = 120°X2 = 5.67
Table 2. EDS analysis results of positions marked in Figure 7.
PositionElement (at. %)
MgAlZnPossible Phase
1100//Mg
24.1695.84/Al-rich
312.661.0286.32Zn-rich
483.4416.56/α -Mg
560.4324.1115.46Mg17(Al, Zn)12
686.432.3511.42α-Mg
Table 3. EDS analysis results of positions marked in Figure 8.
PositionElement (at. %)
MgAlZn
A95.684.32/
B51.7748.23/
C61.7030.507.80
D84.264.2811.46
E73.4210.4616.12
F1.7598.25/
Table 4. Parameters for the thermodynamic calculations of Mg-Al-Zn system [40,42,45,46,47].
ElementsΦ
(V)
n w s 1 / 3
cm−1
V
(cm3·mol−1)
P
(kJ·V−2· cm−1)
Q
(kJ·V−1)
µQ/PR/PG
(1010 N·m−2)
K
(1010 N·m−2)
Mg3.451.175.8010.699.60.140.106420.001.603.31
Al4.201.394.6010.699.60.070.106420.002.406.80
Zn4.101.324.4010.699.60.100.106420.004.507.0
Publisher’s Note: MDPI stays neutral with regard to jurisdictional claims in published maps and institutional affiliations.

