Article

Distribution of Nonmetallic Inclusions in Slab for Tinplate

1
Collaborative Innovation Center of Steel Technology, University of Science and Technology Beijing, Beijing 100083, China
2
Technical Center, Shougang Jingtang United Iron and Steel Co., Ltd., Tangshan 063200, China
3
Beijing Laboratory for Modern Transportation Advanced Metal Materials and Processing Technology, University of Science and Technology Beijing, Beijing 100083, China
*
Author to whom correspondence should be addressed.
Metals 2022, 12(4), 679; https://doi.org/10.3390/met12040679
Submission received: 30 December 2021 / Revised: 8 April 2022 / Accepted: 13 April 2022 / Published: 15 April 2022

Abstract

:
Tinplate is widely used in food packaging and chemical packaging. Industrial production continues to reduce the thickness of tinplate steel, which puts higher requirements on the control of inclusions. In this study, compared with traditional detection methods, the Ultrasonic Detection method can analyze the distribution of nonmetallic inclusions in larger size samples, which is closer to the actual production process. The numerical simulation model is established to analyze the flow, heat transfer and solidification behavior of molten steel. The results show: There are two nonmetallic inclusion bands in the sample at the edge of the slab, one is the inner and outer arc side of the sample, and the other is the 1/8 to 1/4 slab thickness region of the inner arc side in the sample. The inclusions in the thickness direction of the slab edge within the range of 1/8 to 1/4 are captured in areas 800 mm to 1400 mm below the meniscus. The solidification of the inner and outer arcs is not symmetrical, which leads to the asymmetrical distribution of inclusions in the inner and outer arcs. This study can provide a reference for improving the tinplate production process.

1. Introduction

Tinplate is a steel plate coated with a thin layer of metallic tin on the surface. Tinplate is one of the most widely used food canning materials [1]. It is widely used in food packaging and chemical packaging, and DI (Drawing and Ironing) can represent the highest-end requirements in tin plates. Tinplate has the characteristics of strong oxidation resistance, high strength, and good formability. Industrial production is keeping on reducing the thickness of tinplate steel to adapt to shaping and forming changes and costs reduction.
Studies have shown that the production process of black plate is often accompanied by cracks and surface defects, which are usually caused by some large-sized nonmetallic inclusions with high melting points and poor deformability [2], and the thinner tinplate steel puts higher requirements on the control of inclusions [3,4]. Emi [5] introduced data in his book: The critical size of harmful inclusions in DI-can slabs is 50 μm, and the size of the nonmetallic inclusions in DI-can sheets needs to be less than 20 μm. However, in the steelmaking process, due to the interaction of molten steel with slag and refractory materials, large-sized inclusions are inevitably formed [6,7,8], and a large number of microscopic inclusions will be formed in the process of deoxidation and alloying [9]. The mold is the last metallurgical reactor in the floating of inclusions. The flow, heat transfer, and solidification of molten steel in the mold not only affect the formation of different structures in the slab [10] but also have a great impact on the capture of nonmetallic inclusions at the solidification front.
Many researchers have studied the flow behavior of molten steel in the mold and believe that casting speed, submerged entry nozzle (SEN) clogging, and other factors have a great influence on the flow state of molten steel [11,12,13,14,15], the temperature field distribution of the molten steel and the solidification heat transfer of the slab [16,17,18]. The movement and existence of microscopic inclusions in the mold are mainly affected by the flow pattern of molten steel. Microscopic inclusions are less affected by buoyancy, and at a lower casting speed, the scouring effect on the solidifying front is also weak because of the lower surface flow velocity; thus, microscopic inclusions tend to accumulate at the solidification front. The movement and existence of macroscopic inclusions are mainly affected by the flow pattern of molten steel and the buoyancy of inclusions. Under a high casting speed, the mold liquid level fluctuates greatly, there will be slag entrapment, and the possibility of macroscopic inclusions will increase [19,20]. The distribution of large-sized inclusions will also vary with the SEN structure [21]. Zhang et al. [22] used the sink term approach to simulate the distribution of inclusions in the billet mold and believed that the inclusions were mainly concentrated on the surface of the billet and rarely in the center of the billet. Lei et al. [23] applied numerical simulation methods to study the distribution of inclusions in the casting mold and found that most of the large-sized inclusions floated in 0–30 s, and other inclusions flowed with the molten steel and mixed with the small-sized inclusions. With the solidification front capturing and the influence of the flow stream, the distribution of the inclusion in the inner surface layer becomes uneven. Deng et al. [24] used an ASPEX automated inclusion analyzer to study low-carbon aluminum killed steel. They believed that in the area 0.5 mm thick from the surface of the slab in the width direction, due to the deeper Hook and the lower flow velocity of the molten steel in the solidification front, the appearance of macroscopic inclusions is mainly concentrated in the center of the width direction of the slab. Song et al. [25] studied the trajectories of inclusions in the CSP (Compact Strip Production) thin slab mold through numerical simulation. They believed that the diameter, density of the inclusions, and casting speed all affect the removal of inclusions. Inclusions with a diameter larger than 80μm are more likely to be trapped in the solidifying shell on the surface with a depth of 2–6 mm. The removal of inclusions with a diameter of less than 50 μm is relatively insignificant. Nie et al. [26] studied the movement of inclusions in the CSP mold by a combination of inclusion analysis and numerical simulation. Most of the inclusions were captured by the solidifying shell in the parallel funnel region of the mold, causing inclusions to accumulate in this area, the removal fraction is less than 4%, and the larger inclusions are mainly concentrated at 1/4 of the width of the slab.
In this study, the Ultrasonic Detection method can directly analyze the distribution of nonmetallic inclusions in a large area of the sample. The increase in the detection area can more truly reflect the actual distribution of the density of inclusions in the production process of the slabs. Numerical simulation was used to analyze the flow, heat transfer, and solidification behavior in the mold during the production of tinplate steel. The distribution rule of nonmetallic inclusions in the slab was explored through flow and solidification conditions combined with Ultrasonic Detection.

2. Experiment

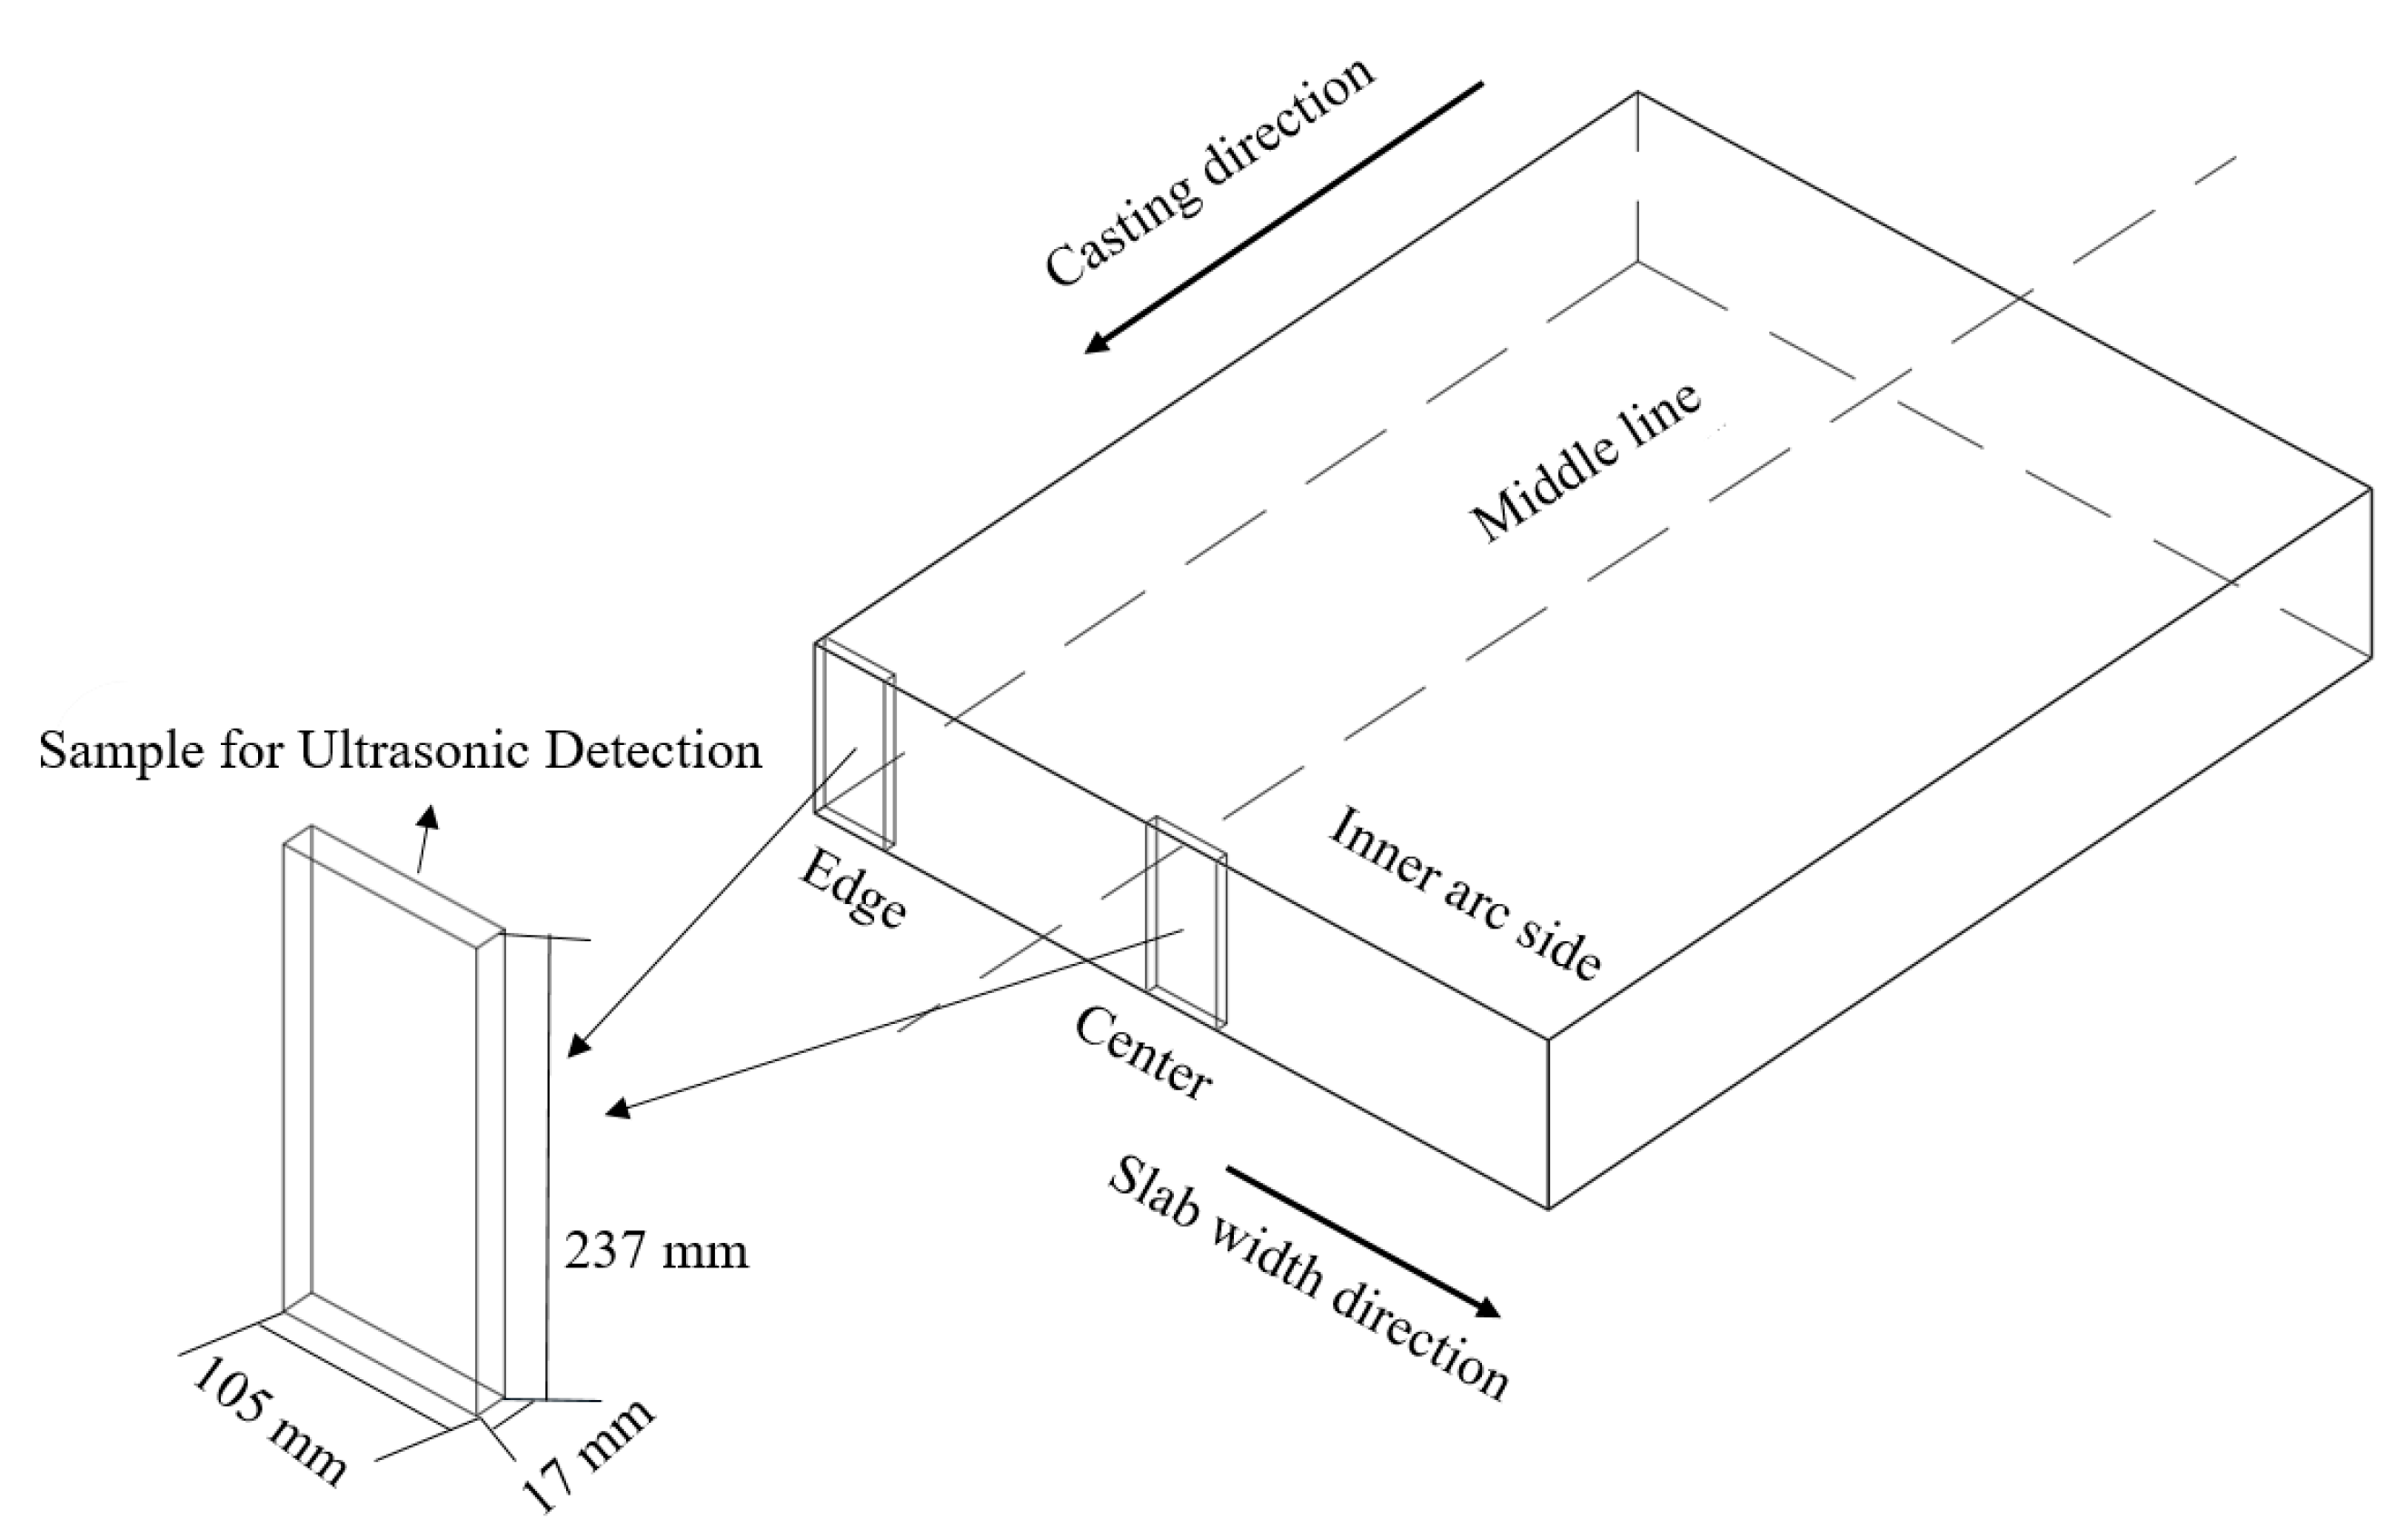
2.1. Sampling of Ultrasonic Detection

Systematic sampling of a certain batch of products from a tinplate production line of Shougang Jingtang United Iron and Steel Co., Ltd. in Tangshan, China, the sampling plan is as follows:
The size of the samples for Ultrasonic Detection is 105 mm × 17 mm × 237 mm, coming from the edge and center of the slabs of 1150 mm width and 237 mm thickness. The sampling diagram is shown in Figure 1.

2.2. Ultrasonic Detection Method

Ultrasonic Detection, as a non-destructive testing method, can quickly and comprehensively evaluate the defects in the slab without damaging the material [27]. Provides rich information on the size, quantity, and spatial distribution of nonmetallic inclusions in steel, and the detection is efficient and accurate [28].
The equipment used was a SAM-300 ultrasonic microscope from the PVA Company in Wettenberg, German. The whole equipment is composed of an ultrasonic probe, special water media, etc. We used a 30 MHz probe with a focal length of 12.7 mm, a focal Column Length of 225 μm, a thickness of 50 μm as the imaging layer, and a scanning step accuracy of 460 μm. The Ultrasonic Detection system uses a high-frequency focusing probe to perform high-precision layered focus scanning on the sample. The three-dimensional reconstruction of the ultrasound images obtained by scanning can obtain the distribution characteristics of defects at different depths within the material. A schematic diagram of Ultrasonic Detection is shown in Figure 2. Each time the probe is focused on a specific position, multiple ultrasound images can be obtained, and each image reflects the distribution of defects in the scanning area. By moving the probe down for multiple focusing, the entire area is scanned, and all ultrasound images reflecting the distribution of internal defects in the material are obtained. On this basis, three-dimensional reconstruction of ultrasound images can demonstrate the distribution characteristics of internal defects. The scanning path is shown in Figure 3.

2.3. Mathematical Models

The flow of molten steel in the mold is a complex turbulent flow process. According to the studied molten steel characteristics and flow characteristics in the mold, the following assumptions are as follows:
(1)
The flow of molten steel in the mold is viscous and incompressible;
(2)
The fluctuation of the molten steel surface and the influence of protective slag, vibration, and phase transformation are not considered;
(3)
The molten steel is a homogeneous medium, the thermo-physical parameters are assumed to be constant, and the heat transfer process in the mold is steady-state heat transfer;
(4)
In the stable casting stage, the thickness of the solidified shell in the mold remains unchanged, and the solidification process is regarded as a steady-state treatment.
ANSYS FLUENT software (ANSYS, Inc., Canonsburg, PA, USA) is used to study the flow, heat transfer, and solidification behavior of molten steel during the production of blackplate. The simulation process uses the continuity equation, momentum equation and turbulent model [17]. The turbulent model uses the k-ε model, and the empirical constant adopts the recommended values of Launder and Spalding [29]. An enthalpy-porosity technique is used to model the solidification/melting process. For calculating the solidification of the steel, the energy equation is written as:
( ρ l H ) x j + ( ρ l v H ) = ( k H ) + S e
where ρ l is the density of molten steel, v is the velocity of molten steel, H is the enthalpy of the material, and Se is the source term.
H = h ref + T ref T c p d T + f l L
S e = ρ l L v i ( 1 f l ) ρ l L f l t
where h ref is the reference enthalpy, T ref is the reference temperature, c p is the specific heat at constant pressure, and L is latent heat. The liquid fraction f l can be defined as:
{ f l = 0 ,   if   T < T solidus f l = T     T solidus T liquidus     T solidus ,   if   T solidus < T < T liquidus f l = 1 ,   if   T > T liquidus

2.4. Numerical Simulation Boundary Conditionsand Details

The model parameters are shown in Table 1, and the mold model is shown in Figure 4. The calculation zone is extended to the bending part. Fluent Meshing software (ANSYS, Inc., Canonsburg, PA, USA) was used to divide the mesh, and the mesh type was Poly-Hexcore. The zone with the intense flow in the nozzle and mold is locally densified. The wall boundary layer is three layers in all zones. The number of cells is 1,199,668, and the maximum skewness is 0.69. The SIMPLE-Consistent (SIMPLEC) scheme was adapted to couple the pressure and velocity. During the numerical simulation, the boundary conditions are defined as follows.
(1)
Inlet boundary: The inlet of the SEN, and the type of inlet is velocity. The velocity is calculated according to the inlet flow rate:
v inlet = v pull · A A in
where ρ l is the casting speed, A is the area of the mold outlet, and A in is the area of the inlet.
(2)
Outlet boundary: The exit of the model is defined as outflow.
(3)
Surface: Ignore the influence of surface tension and slag layer on the surface.
(4)
Wall: Both walls of the mold and the SEN are considered to be standard non-slip walls with normal velocity. Normal components of other variables are also taken as zero. In the mold, the distribution function of heat flux in the drawing direction is simplified as a function of the residence time of molten steel in the mold. Taking into account the strong cooling effect of the corner, the corner temperature will be lower. As shown in Equation 6, the correction coefficient f (T) is used to modify the heat flow density of the mold wall [30]. In the secondary cooling section, convection heat transfer is used for calculation, and the convection heat transfer coefficient is shown in Table 1.
q m = f ( T ) q m { f ( T ) = 1.0 , if   1300 < T f ( T ) = 0.9 , if   1200 < T < 1300 f ( T ) = 0.4 , if   1100 < T < 1200 f ( T ) = 0.1 , if   T < 1100

3. Results and Discussion

The three-dimensional distribution of inclusions in the slab samples was detected by Ultrasonic Detection, and the distribution law of inclusions in the slab was analyzed. Using the method of numerical simulation, the flow field, temperature features, and solidification features of the slab during the production of tinplate were analyzed under industrial conditions (Table 1). Coordinated with the ultrasonic inspection results, searching locations where the inclusions may produce traps.

3.1. Ultrasonic Detection Analysis

The distribution of inclusions in the samples was analyzed by Ultrasonic Detection, and the three-dimensional spatial distribution results of the nonmetallic inclusions inside the samples were obtained, as shown in Figure 5 and Figure 6.
In Figure 5 and Figure 6, the dot marks are the distribution positions of inclusions or defects in the samples.
It can be seen from Figure 5 that there are obvious inclusion accumulation areas in the inner and outer arc sides of the slab edge sample (in the blue areas). The distribution of the number of inclusions is most obvious near 1/8~1/4 slab thickness regions of the inner arc side (in the red area), while a small number of inclusions are scattered in the remaining part of the sample.
It can be seen from Figure 6 that only a few inclusions in the center sample of the slab are scattered, and the density is smaller than that of the sample at the edge of the slab. Additionally, there is no obvious accumulation of inclusions at 1/8~1/4 slab thickness regions of the inner arc side (in the orange area). The central sample of the slab has inclusions distributed at 1/8~1/4 slab thickness regions of the inner arc side dispersedly, and the number of inclusions is slightly more than the corresponding position of the outer arc side. The number of inclusions in the center sample of the slab as a whole is lower than that of the sample at the edge of the slab.
As shown in the blue area in Figure 5, there are inclusions gathering areas on the inner and outer arc sides of the sample at the edge of the slab because the molten steel has a faster heat transfer and a faster solidification rate close to the narrow surface after entering the mold. However, due to the double-roll flow (there is an upper circulation zone and a lower circulation zone) characteristics in the mold, when the molten steel flows through this solidification zone, the inclusions are easily trapped in the solidifying shell near the narrow surface, thus forming an accumulated area of inclusions on the inner and outer arc sides of the sample at the edge of the slab.
In Figure 5 and Figure 6, the slab edge sample and the slab center sample have more inclusions near 1/8~1/4 slab thickness regions of the inner arc side than other positions in the thickness regions. This is the result of casting using a vertical-bending caster. The vertical section of the vertical bending caster of this plant is 1805 mm, which is conducive to the floating of inclusions. Compared with the traditional curved continuous caster, it can easily capture the floating inclusions at the solid–liquid interface in the bending zone near the 1/4 region of the inner arc side. As shown by the blue circle in Figure 5, the position of the inclusions on both sides of the inner and outer arc of the slab is basically symmetrical; the inclusions gathering zone is formed at 1/8~1/4 slab thickness regions of the inner arc side, but no gathering zone is found on the outer arc side.
Comparing the distribution of nonmetallic inclusions in Figure 5 and Figure 6, it is found that the number of inclusions in the center sample of the slab is less than that of the sample at the edge of the slab. Because of the influence of the mold flow field, the 1/4 region of the slab width is the main inclusion area, the number of inclusions at the edge of the slab is the second, and the number of inclusions at the center is the least [23,31]. Therefore, under the same Ultrasonic Detection scale, the number of inclusions in the center of the slab in the width direction is less than that of the slab edge position during the solidification process, the number of inclusions captured in the inner and outer arcs of the center sample of the slab is less. However, Ultrasonic Detection found a row of defects or inclusions parallel to the width direction at 1/2 of the thickness direction of the slab, as shown in the green area in Figure 6. Combined with the solidification process of the slab, it can be known that there will be shrinkage cavities, porosities, and other central defects in the solidification at 1/2 of the thickness direction. In the remaining part, only a few inclusions are dispersed.
The random distribution of large-sized inclusions will cause potential hazards to the slab. When the slab is subjected to external force or deformation, large-sized brittle inclusions can cause sliver defects, which will adversely affect the subsequent processing of the slab and the manufacturing of the finished product.

3.2. Molten Steel Flow Field

Figure 7 shows the flow field on the Y = 0 plane under two different simulation conditions. The solidification model will affect the flow field in the mold. Without considering the solidification process, the flow field is asymmetrical, and the flow velocity of the top of the mold is large. There is obvious circulation in the upper part, and the lower circulation is not obvious. After the molten steel exits the mold, there is a large velocity close to the wall near the mold narrow. Considering the solidification process, the flow field in the mold is symmetrical, and the stream at the SEN outlet of the mold is more concentrated. There are two circulations on both sides of the mold. After the molten steel exits the mold, the molten steel flows toward the center in the horizontal direction under the action of solidified billet shell and circulation, and then the horizontal component gradually decreases. There is a solidification process of molten steel in the mold in actual production. The solidified billet shell gradually thickens. The flow close to the narrow side after leaving the mold is not conforming to the actual situation. The flow situation in the mold, considering the solidification process, is more consistent with the actual production process.
According to Figure 7b, at the lower part of the mold and leaving the mold, molten steel mainly flows downward on the narrow side, and the inclusions are easier to be captured by the slab shell. While in the central position, due to the action of circulation, the inclusions are easier to float up at the lower part of the mold and are not easily captured by the solidified shell.

3.3. Molten Steel Thermal Features

Figure 8 shows the temperature distribution in the Y = 0 plane. During the simulation, the pouring temperature is 1831 K. After the mainstream flowing from the SEN reaches the narrow side of the mold, it produces upward and downward diversion, creating a temperature gradient. The vortexes on both sides of the mainstream homogenize the temperature of molten steel, and a wide range of similar temperature areas are generated on both sides of the mainstream, which is consistent with the results of flow field simulation. In the width direction, the temperature field is symmetrical. Near the narrow side of the mold, the low-temperature zone increases gradually with the increase in the distance from the meniscus. Below the mold outlet, the narrow side of the slab is cooled by the water spray in the secondary cooling zone, and the growth rate of the low-temperature zone is accelerated.
Figure 9 shows the temperature distribution in a different plane. It can be seen that the temperature distribution at the same slab thickness position is inconsistent on the inner and outer arc sides, the temperature at the outer arc side decreases faster, and the temperature decreases faster after leaving the mold. At the slab thickness position of 1/8, the temperature field on the outer arc side changes from a “V-V” shape in the mold to an inverted “U” shape. At the inner arc 1/8, the temperature field gradually changes from a “V-V” shape to a “W” shape. At the position of 1/4 slab thickness, the temperature distribution is similar to that on the central surface (Y = 0). The temperature in the region on both sides of the mainstream is similar. The temperature of the inner arc and the outer arc of the same thickness is inconsistent, which may be due to the existence of arc segments in the continuous casting process. The inconsistency of temperatures in the inner and outer arcs of the slab may cause uneven solidification and different distribution of inclusions.
Figure 10 shows the temperature distribution at the edge of the slab. The selected sections are 400 mm and 450 mm away from the center of the mold. It can be seen from the figure that, due to the action of the mainstream flowing of molten steel, there is a higher temperature area in the mold, and the solidification process of molten steel is accelerated after exiting the mold. At the X = 400 plane, the temperature of the outer arc side is lower than that of the inner arc side. At the X = 450 plane, the temperature distribution of the inner and outer arcs of the billet is similar.

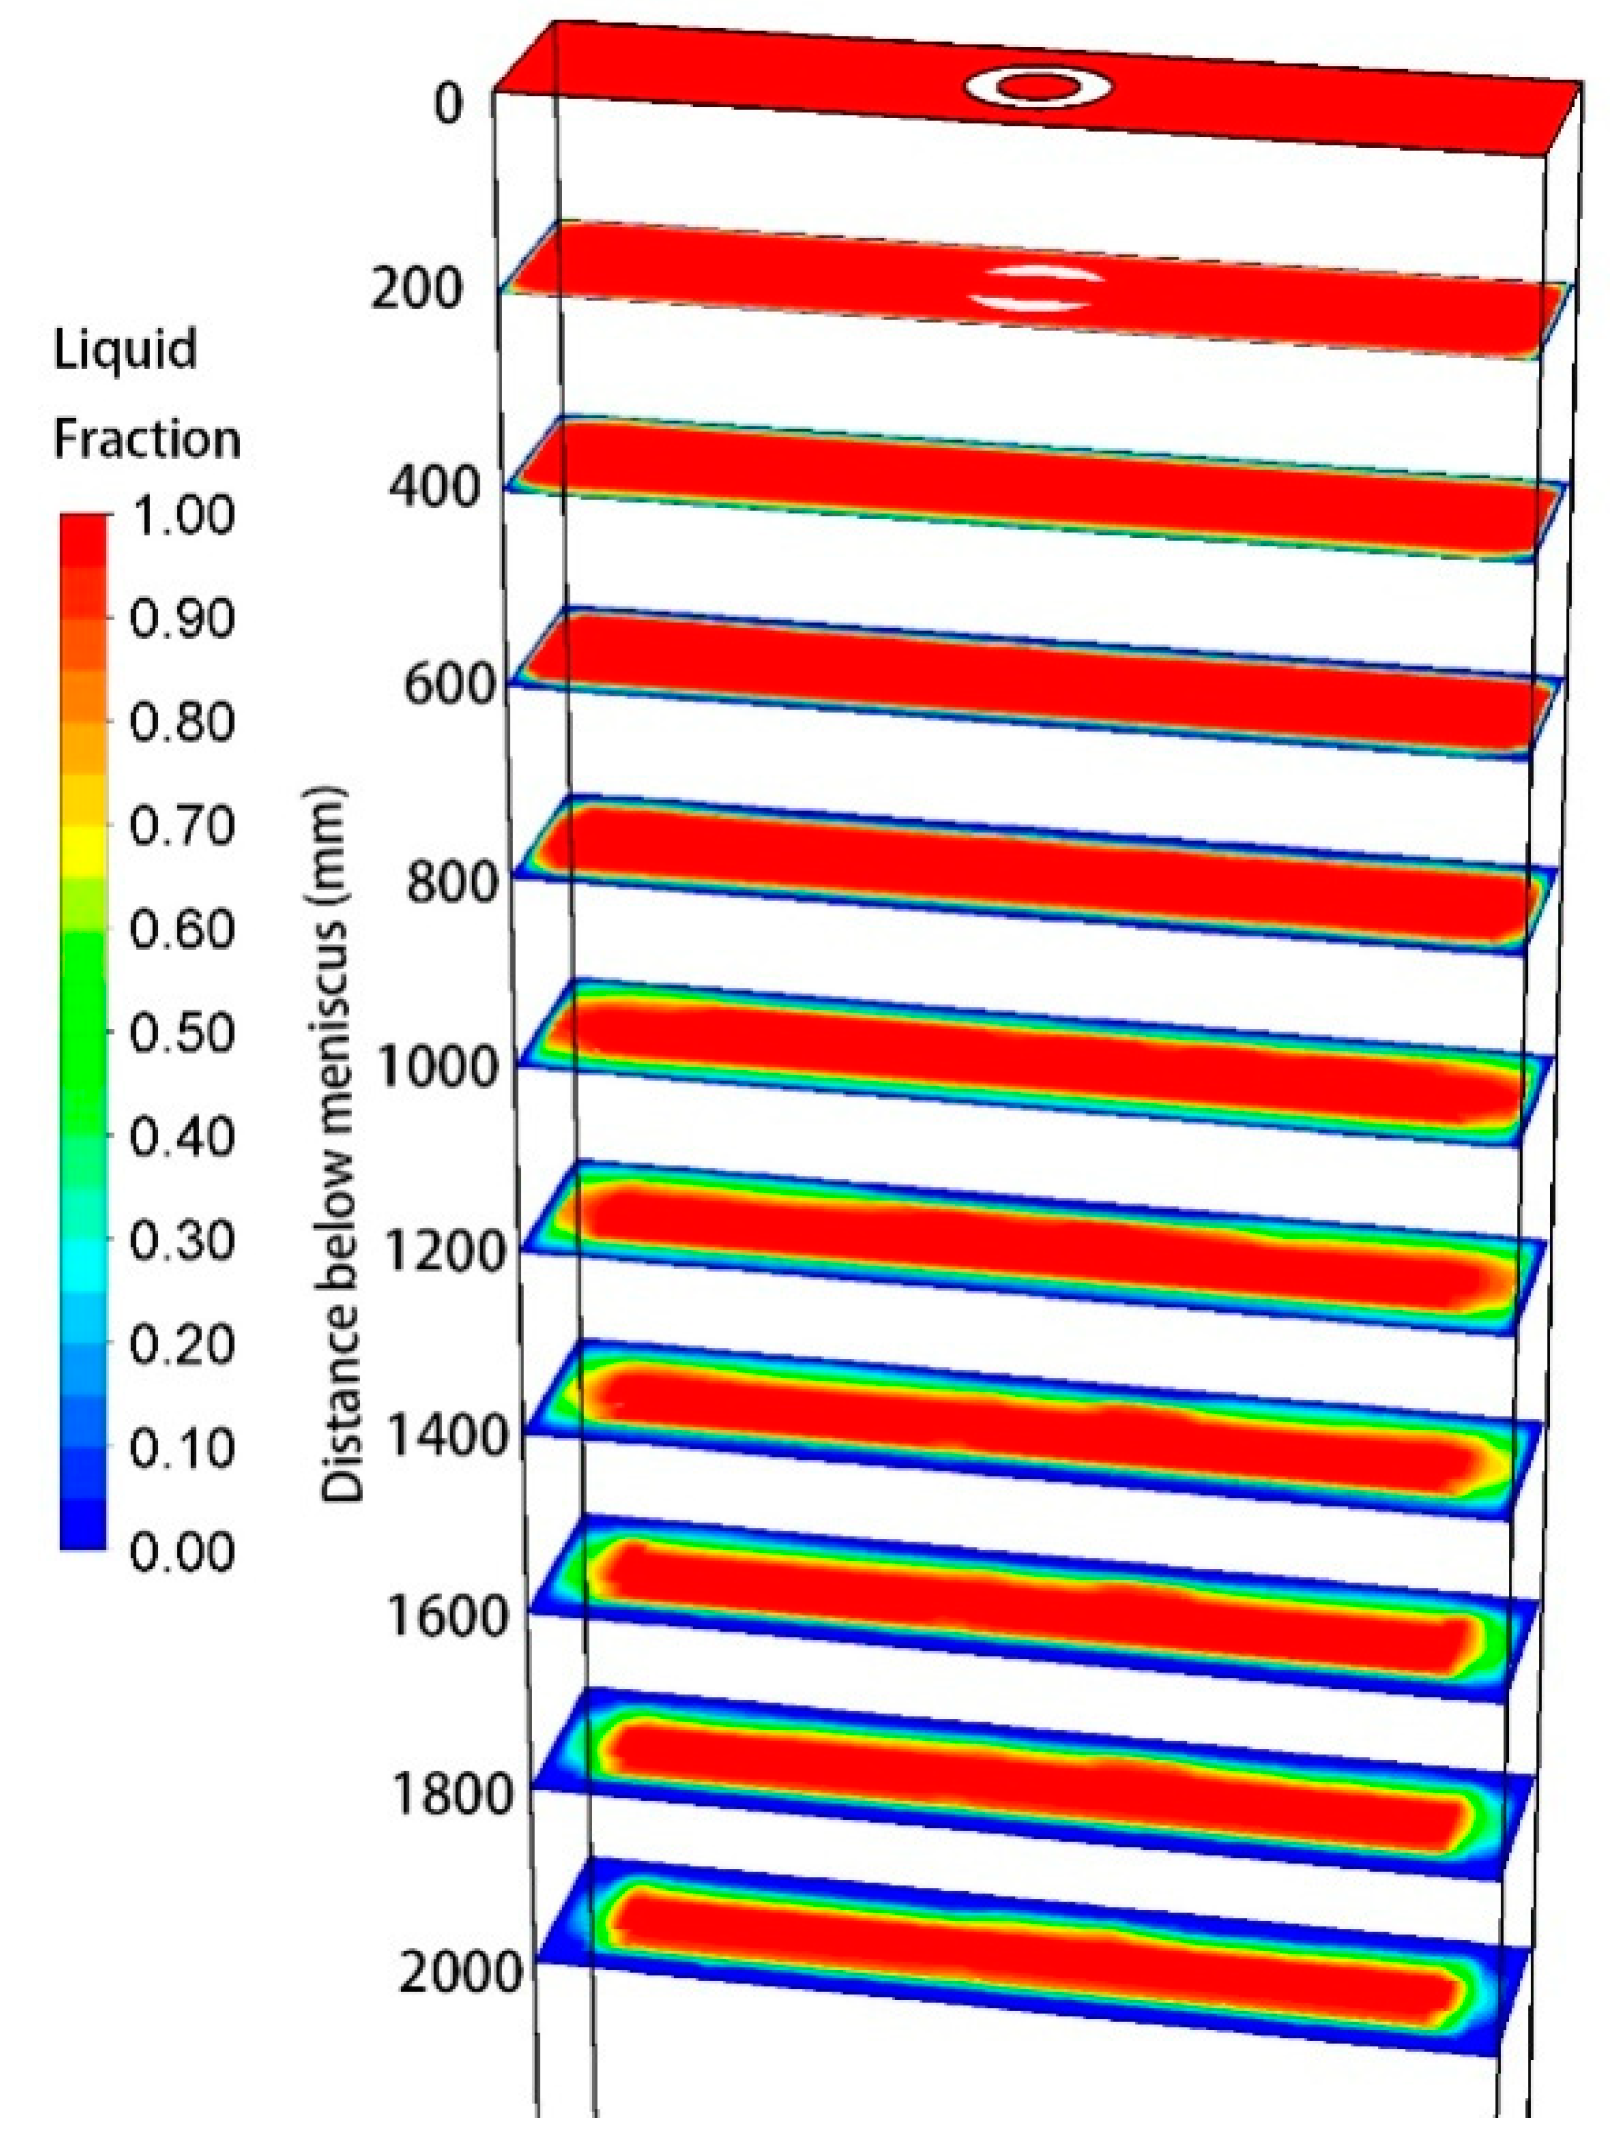
3.4. Molten Steel Solidification Features

Figure 11 shows the solidification of the cross-section of the cast slab at different positions from the meniscus of the mold. The blue part is the pure solid phase region, the red part is the pure liquid phase region, and the intermediate colors are different liquid phase regions. It can be seen that as the distance from the meniscus increases, the thickness of the slab shell gradually increases, and the thickness of the slab shell increases faster after exiting the mold. The corners of the slab are simultaneously subjected to the cooling effect of the wide and narrow sides, and the cooling strength is high, with a thick solidified slab shell. Figure 12 shows the liquid fraction at the exit of the mold. In the width direction, the liquid fraction is symmetrical. The thickness of the solidified slab shell at the center of the narrow side is 11.11 mm. In the thickness direction, the thickness of the slab shell is asymmetric.
Figure 13 shows the isoline with a liquid fraction of 0.6 when X = 450. Some researchers believe that the inclusion will be captured by the solidified shell and enter the slab when it reaches the position of the 0.6 liquid fraction [22,26]. In the detection results of inclusions, the inclusion is more distributed on the edge of the slab near 1/8 to 1/4 of the distance from the inner arc. As shown in Figure 13, the part with a liquid fraction of 0.6 in the thickness direction from 1/8 to 1/4 is located 800 mm to 1400 mm below the meniscus. It shows that the inclusion capture mainly occurs in the area after the mold exit during slab production. At the same time, the solidification of the inner and outer arcs is not symmetrical, which leads to the asymmetrical distribution of inclusions in the inner and outer arcs.
In this study, the Ultrasonic Detection method is used to detect the three-dimensional distribution of nonmetallic inclusions in a large-area slab without damaging the sample. The flow, heat transfer, and solidification behavior of molten steel were studied by numerical simulation, the reasons for the distribution of nonmetallic inclusions were analyzed, and the possible trapping positions of inclusions were found. This study analyzes the solidification of the slab in the production of tinplate, which can provide a reference for improving the improvement of the process.

4. Conclusions

(1)
The Ultrasonic Detection method can directly analyze the distribution of nonmetallic inclusions in large-area samples, and the results are consistent with the numerical simulation analysis, which provides a reference for the production process of tinplate.
(2)
The inclusions concentrate in the areas near the inner arc side and the outer arc side in the slab edge sample. At the corresponding position, the accumulation of inclusions of the slab center sample is not found. The solidified shell easily captures the inclusions near the narrow side.
(3)
There are inclusions gathering at the position of 1/8 to 1/4 slab thickness regions of the inner arc side in the slab edge sample. In the slab center sample, a small amount of inclusions is scattered in the same area. The distribution of inclusions at the edge of the slab is more than that at the center of the slab.
(4)
The inclusions in the thickness direction of the slab edge within the range of 1/8 to 1/4 are captured in an area 800 mm to 1400 mm below the meniscus. The solidification of the inner and outer arcs is not symmetrical, which leads to the asymmetrical distribution of inclusions in the inner and outer arcs.

Author Contributions

Conceptualization, Z.M. and H.C.; methodology, Z.M. and Z.Z.; software, R.W.; validation, Y.F. and H.L.; formal analysis, Z.W. and R.W.; investigation, Y.L. and S.W.; writing—original draft preparation, Z.M.; writing—review and editing, R.W. and Z.W.; visualization, Z.Z.; supervision, H.C.; project administration, H.C. All authors have read and agreed to the published version of the manuscript.

Funding

This research received no external funding.

Data Availability Statement

Not applicable.

Conflicts of Interest

The authors declare no conflict of interest.

References

  1. Kamm, G.G. Progress in materials for can stock and future trends. Trans. Iron Steel Inst. Jpn. 2007, 29, 614–624. [Google Scholar] [CrossRef] [Green Version]
  2. Li, X.; Wang, N.; Chen, M.; Ma, T. Tracking Large-size Inclusions in Al Deoxidated Tinplate Steel in Industrial Practice. ISIJ Int. 2021, 61, 2074–2082. [Google Scholar] [CrossRef]
  3. Xia, D.H.; Wang, J.H.; Song, S.Z.; Zhong, B.; Han, Z.W. The Corrosion Behavior of Lacquered Tinplate in Functional Beverage. Adv. Mater. Res. 2011, 233–235, 1747–1751. [Google Scholar] [CrossRef]
  4. Zumelzu, E.; Cabezas, C. Observations on the influence of microstructure on electrolytic tinplate corrosion. Mater. Charact. 1995, 34, 143–148. [Google Scholar] [CrossRef]
  5. Sahai, Y.; Emi, T. Non-Metallic Inclusions. In Tundish Technology for Clean Steel Production; World Scientific Publishing Co. Pte. Ltd.: Singapore, 2008; pp. 13–19. [Google Scholar]
  6. Riaz, S.; Mills, K.C.; Bain, K. Experimental examination of slag/refractory interface. Ironmak. Steelmak. 2002, 29, 107–113. [Google Scholar] [CrossRef]
  7. Okano, S.; Nishimura, T.; Ooi, H.; Chino, T. Relation between large inclusions and growth directions of columnar dendrites in continuously cast slabs. Tetsu Hagane 1975, 61, 2982–2990. [Google Scholar] [CrossRef] [Green Version]
  8. Zhang, L.; Rietow, B.; Thomas, B.G.; Eakin, K. Large Inclusions in Plain-carbon Steel Ingots Cast by Bottom Teeming. ISIJ Int. 2006, 46, 670–679. [Google Scholar] [CrossRef] [Green Version]
  9. Yang, W.; Wang, X.; Zhang, L.; Wang, W. Characteristics of Alumina-Based Inclusions in Low Carbon Al-Killed Steel under No-Stirring Condition. Steel Res. Int. 2013, 84, 878–891. [Google Scholar] [CrossRef]
  10. Liu, Z.; Niu, R.; Wu, Y.; Li, B.; Gan, Y.; Wu, M. Physical and numerical simulation of mixed columnar-equiaxed solidification during cold strip feeding in continuous casting. Int. J. Heat. Mass Transf. 2021, 173, 121237. [Google Scholar] [CrossRef]
  11. Andrzejewski, P.; Köhler, K.U.; Pluschkell, W. Model investigations on the fluid flow in continuous casting moulds of wide dimensions. Steel Res. 1992, 63, 242–246. [Google Scholar] [CrossRef]
  12. Liu, Z.; Sun, Z.; Li, B. Modeling of Quasi-Four-Phase Flow in Continuous Casting Mold Using Hybrid Eulerian and Lagrangian Approach. Metall. Mater. Trans. B 2016, 48, 1248–1267. [Google Scholar] [CrossRef]
  13. Chen, W.; Ren, Y.; Zhang, L.; Scheller, P.R. Numerical Simulation of Steel and Argon Gas Two-Phase Flow in Continuous Casting Using LES + VOF + DPM Model. JOM 2018, 71, 1158–1168. [Google Scholar] [CrossRef]
  14. Hua, C.; Wang, M.; Senk, D.; Wang, H.; Zhang, Q.; Zhi, J.; Bao, Y. Cone Clogging of Submerged Entry Nozzle in Rare Earth Treated Ultra-Low Carbon Al-Killed Steel and Its Effect on the Flow Field and Vortex in the Mold. Metals 2021, 11, 662. [Google Scholar] [CrossRef]
  15. Wu, Y.; Liu, Z.; Wang, F.; Li, B.; Gan, Y. Experimental investigation of trajectories, velocities and size distributions of bubbles in a continuous-casting mold. Powder Technol. 2021, 387, 325–335. [Google Scholar] [CrossRef]
  16. Yang, J.; Du, Y.; Shi, R.; Cui, X. Fluid Flow and Solidification Simulation in Beam Blank Continuous Casting Process With 3D Coupled Model. J. Iron Steel Res. Int. 2006, 13, 17–21. [Google Scholar] [CrossRef]
  17. Liu, H.; Yang, C.; Zhang, H.; Zhai, Q.; Gan, Y. Numerical Simulation of Fluid Flow and Thermal Characteristics of Thin Slab in the Funnel-Type Molds of Two Casters. ISIJ Int. 2011, 51, 392–401. [Google Scholar] [CrossRef] [Green Version]
  18. Vakhrushev, A.; Kharicha, A.; Wu, M.; Ludwig, A.; Tang, Y.; Hackl, G.; Nitzl, G.; Watzinger, J.; Bohacek, J. On Modelling Parasitic Solidification Due to Heat Loss at Submerged Entry Nozzle Region of Continuous Casting Mold. Metals 2021, 11, 1375. [Google Scholar] [CrossRef]
  19. Yin, Y.; Zhang, J.; Dong, Q.; Li, Y. Modelling on Inclusion Motion and Entrapment during the Full Solidification in Curved Billet Caster. Metals 2018, 8, 320. [Google Scholar] [CrossRef] [Green Version]
  20. Fei, P.; Min, Y.; Liu, C.; Jiang, M. Effect of continuous casting speed on mold surface flow and the related near-surface distribution of non-metallic inclusions. Int. J. Miner. Metall. Mater. 2019, 26, 186–193. [Google Scholar] [CrossRef]
  21. Habu, Y.; Kitaoka, H.; Yoshii, Y.; Iida, Y.; Imai, T.; Ueda, T. Effect of the Penetration Depth of Casting Stream in Crater on the Accumulation of Large Oxide Inclusions in Continuously Cast Slab. Trans. Iron Steel Inst. Jpn. 1975, 15, 246–251. [Google Scholar] [CrossRef]
  22. Zhang, L.; Wang, Y. Modeling the Entrapment of Nonmetallic Inclusions in Steel Continuous-Casting Billets. JOM 2012, 64, 1063–1074. [Google Scholar] [CrossRef]
  23. Lei, S.; Zhang, J.; Zhao, X.; He, K. Numerical Simulation of Molten Steel Flow and Inclusions Motion Behavior in the Solidification Processes for Continuous Casting Slab. ISIJ Int. 2014, 54, 94–102. [Google Scholar] [CrossRef] [Green Version]
  24. Deng, X.; Ji, C.; Dong, W.; Li, L.; Yin, X.; Yang, Y.; McLean, A. Distribution of macro-inclusions in low carbon aluminium-killed steel slabs. Ironmak. Steelmak. 2018, 45, 592–602. [Google Scholar] [CrossRef]
  25. Song, X.; Cheng, S.; Cheng, Z. Numerical Computation for Metallurgical Behavior of Primary Inclusion in Compact Strip Production Mold. ISIJ Int. 2012, 52, 1824–1831. [Google Scholar] [CrossRef] [Green Version]
  26. Nie, C.; Zhang, X.; Wang, B.; Sun, Y.; Liu, Q. Characteristics of inclusion motion and accumulation in CSP mold. ISIJ Int. 2015, 55, 1677–1683. [Google Scholar] [CrossRef] [Green Version]
  27. Li, M.; Li, X.; Gao, C.; Song, Y. Acoustic microscopy signal processing method for detecting near-surface defects in metal materials. NDT E Int. 2019, 103, 130–144. [Google Scholar] [CrossRef]
  28. Ding, H.; Qian, Q.; Li, X.; Wang, Z.; Li, M. Casting Blanks Cleanliness Evaluation Based on Ultrasonic Microscopy and Morphological Filtering. Metals 2020, 10, 796. [Google Scholar] [CrossRef]
  29. Launder, B.E.; Spalding, D.B. Lectures in Mathematical Models of Turbulence; Academic Press: London, UK, 1972. [Google Scholar]
  30. Zhang, X.; Dou, K.; Wang, Y.; Nie, C.; Liu, Q. Numerical simulation of flow and solidification of molten steel in the CSP mold. J. Wuhan Univ. Sci. Technol. 2013, 36, 401–405. [Google Scholar]
  31. Yin, Y.; Zhang, J.; Lei, S.; Dong, Q. Numerical Study on the Capture of Large Inclusion in Slab Continuous Casting with the Effect of In-mold Electromagnetic Stirring. ISIJ Int. 2017, 57, 2165–2174. [Google Scholar] [CrossRef] [Green Version]
Figure 1. Schematic illustration during the sampling process.
Metals 12 00679 g001
Figure 2. Schematic diagram of Ultrasonic Detection [28].
Metals 12 00679 g002
Figure 3. Scanning diagram of Ultrasonic Detection.
Metals 12 00679 g003
Figure 4. Geometric model of the computational domain and mesh.
Metals 12 00679 g004
Figure 5. Three-dimensional distribution diagram of different angle nonmetallic inclusions in the edge of the slab.
Metals 12 00679 g005
Figure 6. Three-dimensional distribution diagram of nonmetallic inclusions at different angles in the center sample of the slab.
Metals 12 00679 g006
Figure 7. Velocity distribution and contours profiles in Y = 0 plane: (a) without solidification model; (b) with solidification model.
Metals 12 00679 g007
Figure 8. The contour of temperature in the Y = 0 plane.
Metals 12 00679 g008
Figure 9. The contour of temperature in different Y plane: (a) Y= −88.875 ( outer arc 1/8); (b) Y = −59.25 ( outer arc 1/4); (c) Y= 88.875( inner arc 1/8); (d) Y = 59.25 ( inner arc 1/4).
Metals 12 00679 g009
Figure 10. The contour of temperature in the different X plane.
Metals 12 00679 g010
Figure 11. The contour of the liquid fraction in the different Z planes.
Metals 12 00679 g011
Figure 12. The contour of the liquid fraction at the outlet of the mold.
Metals 12 00679 g012
Figure 13. The distribution of the liquid fraction of 0.6 in the X = 450 plane of the mold.
Metals 12 00679 g013
Table 1. Geometry dimensions and simulation conditions.
ItemParametersItemParameters
Slab section size1000 mm × 237 mmMolten steel density7020 kg·m−3
Mold height, mm 800 mmMolten steel viscosity0.0062 kg·m−1·s−1
SEN immersed depth150 mmCasting temperature1831 K
SEN port inclination−15°Solidus temperature1740 K
Casting speed1.7 m·min−1Liquidus temperature1804 K
Mold heat flux, wide3,538,000 + 220,680 × t0.5 (W·m−2)Specific heat of steel680 J·kg−1·K−1
Heat flux, narrow3,538,000 + 484,932 × t0.5 (W·m−2)Thermal conductivity41 W·m−1·K−1
Secondary cooling zone heat transfer coefficient, wide1450 W·m−2·K−1Pure Solvent Melting Heat270,000 J·kg−1
Secondary cooling zone heat transfer coefficient, narrow1300 W·m−2·K−1mushy zone constant5 × 108
Publisher’s Note: MDPI stays neutral with regard to jurisdictional claims in published maps and institutional affiliations.

