Article

Experimental Investigation of Fracture Performances of SBHS500, SM570 and SM490 Steel Specimens with Notches

1
Department of Civil Engineering, Meijo University, Nagoya 468-8502, Japan
2
National Engineering Research Center of Biomaterials, Nanjing Forestry University, No.159 Longpan Road, Nanjing 210037, China
3
School of Civil Engineering and Transportation, South China University of Technology, Guangzhou 510641, China
4
State Key Laboratory of Subtropical Building Science, South China University of Technology, Guangzhou 510641, China
*
Authors to whom correspondence should be addressed.
Metals 2022, 12(4), 672; https://doi.org/10.3390/met12040672
Submission received: 6 March 2022 / Revised: 1 April 2022 / Accepted: 7 April 2022 / Published: 14 April 2022
(This article belongs to the Special Issue Modelling, Test and Practice of Steel Structures)

Abstract

:
High-strength steels (HSSs) with nominal yield stress not less than 460 MPa have been increasingly employed in bridge structures. Compared with SM490 normal-strength steel (NSS), HSSs, including SBHS500 and SM570, have higher strength but lower ductility, and brittle fracture can easily occur in the HSSs members with notches. Therefore, 48 tension specimens with U-notch or V-notch made of SBHS500, SM570 and SM490 structural steels are carried out. The influences of notch depth, U-notch radius, V-notch degree and chemical composition on the mechanical and fracture performances of the steel specimens are investigated. It is concluded from experimental results that SBHS500 and SM570 HSSs with higher yield stress have a relatively higher elastic stress concentration factor, crack initiation appears earlier, and brittle fracture is more likely to occur. Compared to SM570 HSS, SBHS500 HSS has better weldability.

1. Introduction

In engineering structures and components, notches are difficult to avoid, and some notch-like geometries are necessary for structural design [1,2,3]. Notches produce stress and strain concentration, then the stress state with high stress triaxiality, and these make it easy for brittle fracture to occur [4,5,6,7,8]. U-notch and V-notch are the two main notch types [9,10]. High-strength steel (HSS) usually refers to steels with nominal yield stress not less than 460 MPa [11,12]. High yield stress might lead to poor plastic deformation capacity. Accordingly, it is necessary to investigate the crack initiation, propagation and final failure performances of notched HSS specimens, which is important to ensure the safety of HSS structures with notches.
Great efforts have been put into fracture behavior of HSSs without notches in previous studies [13,14,15,16]. These include Q460 [11], Q550 [16], Q690 [4,15,16], Q890 [16], ASTM A572 [17], DP980 [18], ASTM A36 [19], ASTM A572 [19] and ASTM A992 [19] HSSs. Additionally, for the Japanese bridge steel SM490 [20], the ductile fracture mechanism of SM490 base metal, weld and heat affect zone was investigated for welded SM490 specimens in the reference [20], and a three-stage and two-parameter ductile fracture model was proposed. Tension tests on U-notch and V-notch specimens with different detailed geometries were carried out to investigate the ductile fracture behavior of SM490 steel [6]. An improved three-stage and two-parameter ductile fracture model was proposed to accurately predict the ductile fracture behavior of specimens with notches by considering the effect of stress triaxiality in the softening stage.
In the past, SM490 steel was widely used in steel bridges in Japan. However, HSSs, including SBHS500 and SM570, are employed in Japanese bridges in recent years to reduce steel consumption by 10% [21,22] compared with SM490 steel because of their high yield stress. In the previous study, the post-fire mechanical properties of SBHS500 HSS were experimentally investigated [23]. Although HSS bridges have a significant advantage in improving the bearing capacity of structures, the application of HSSs (including SBHS500 and SM570) in seismic structures is limited, owing to their relatively poor ductility compared with that of normal strength steel (NSS). HSS bridges have several HSS members with notches. This shortcoming of poor ductility limits the application of SBHS500 and SM570 HSSs in seismic areas, especially for the HSS members with notches.
In this study, the fracture performances of notched steels are investigated for three types of structural steels used in Japanese bridges, including SM490, SM570 and SBHS500, in which SM570 and SBHS500 are HSSs standardized by the Japanese Industrial Standards (JIS) Committee in the code JIS G 3140 [24], and SM490 is NSS standardized by JIS G 3106 [25]. Tension tests on U-notch and V-notch specimens with different detailed geometries are carried out to study fracture performances of the steel specimens at different stress triaxialities [6]. Crack initiating performances and crack initiation regions are identified. Fracture surfaces of tested specimens are deeply analyzed. Moreover, effects of notch depth, U-notch radius, V-notch degree and chemical composition on the yield stress and ultimate stress of HSSs are investigated experimentally.

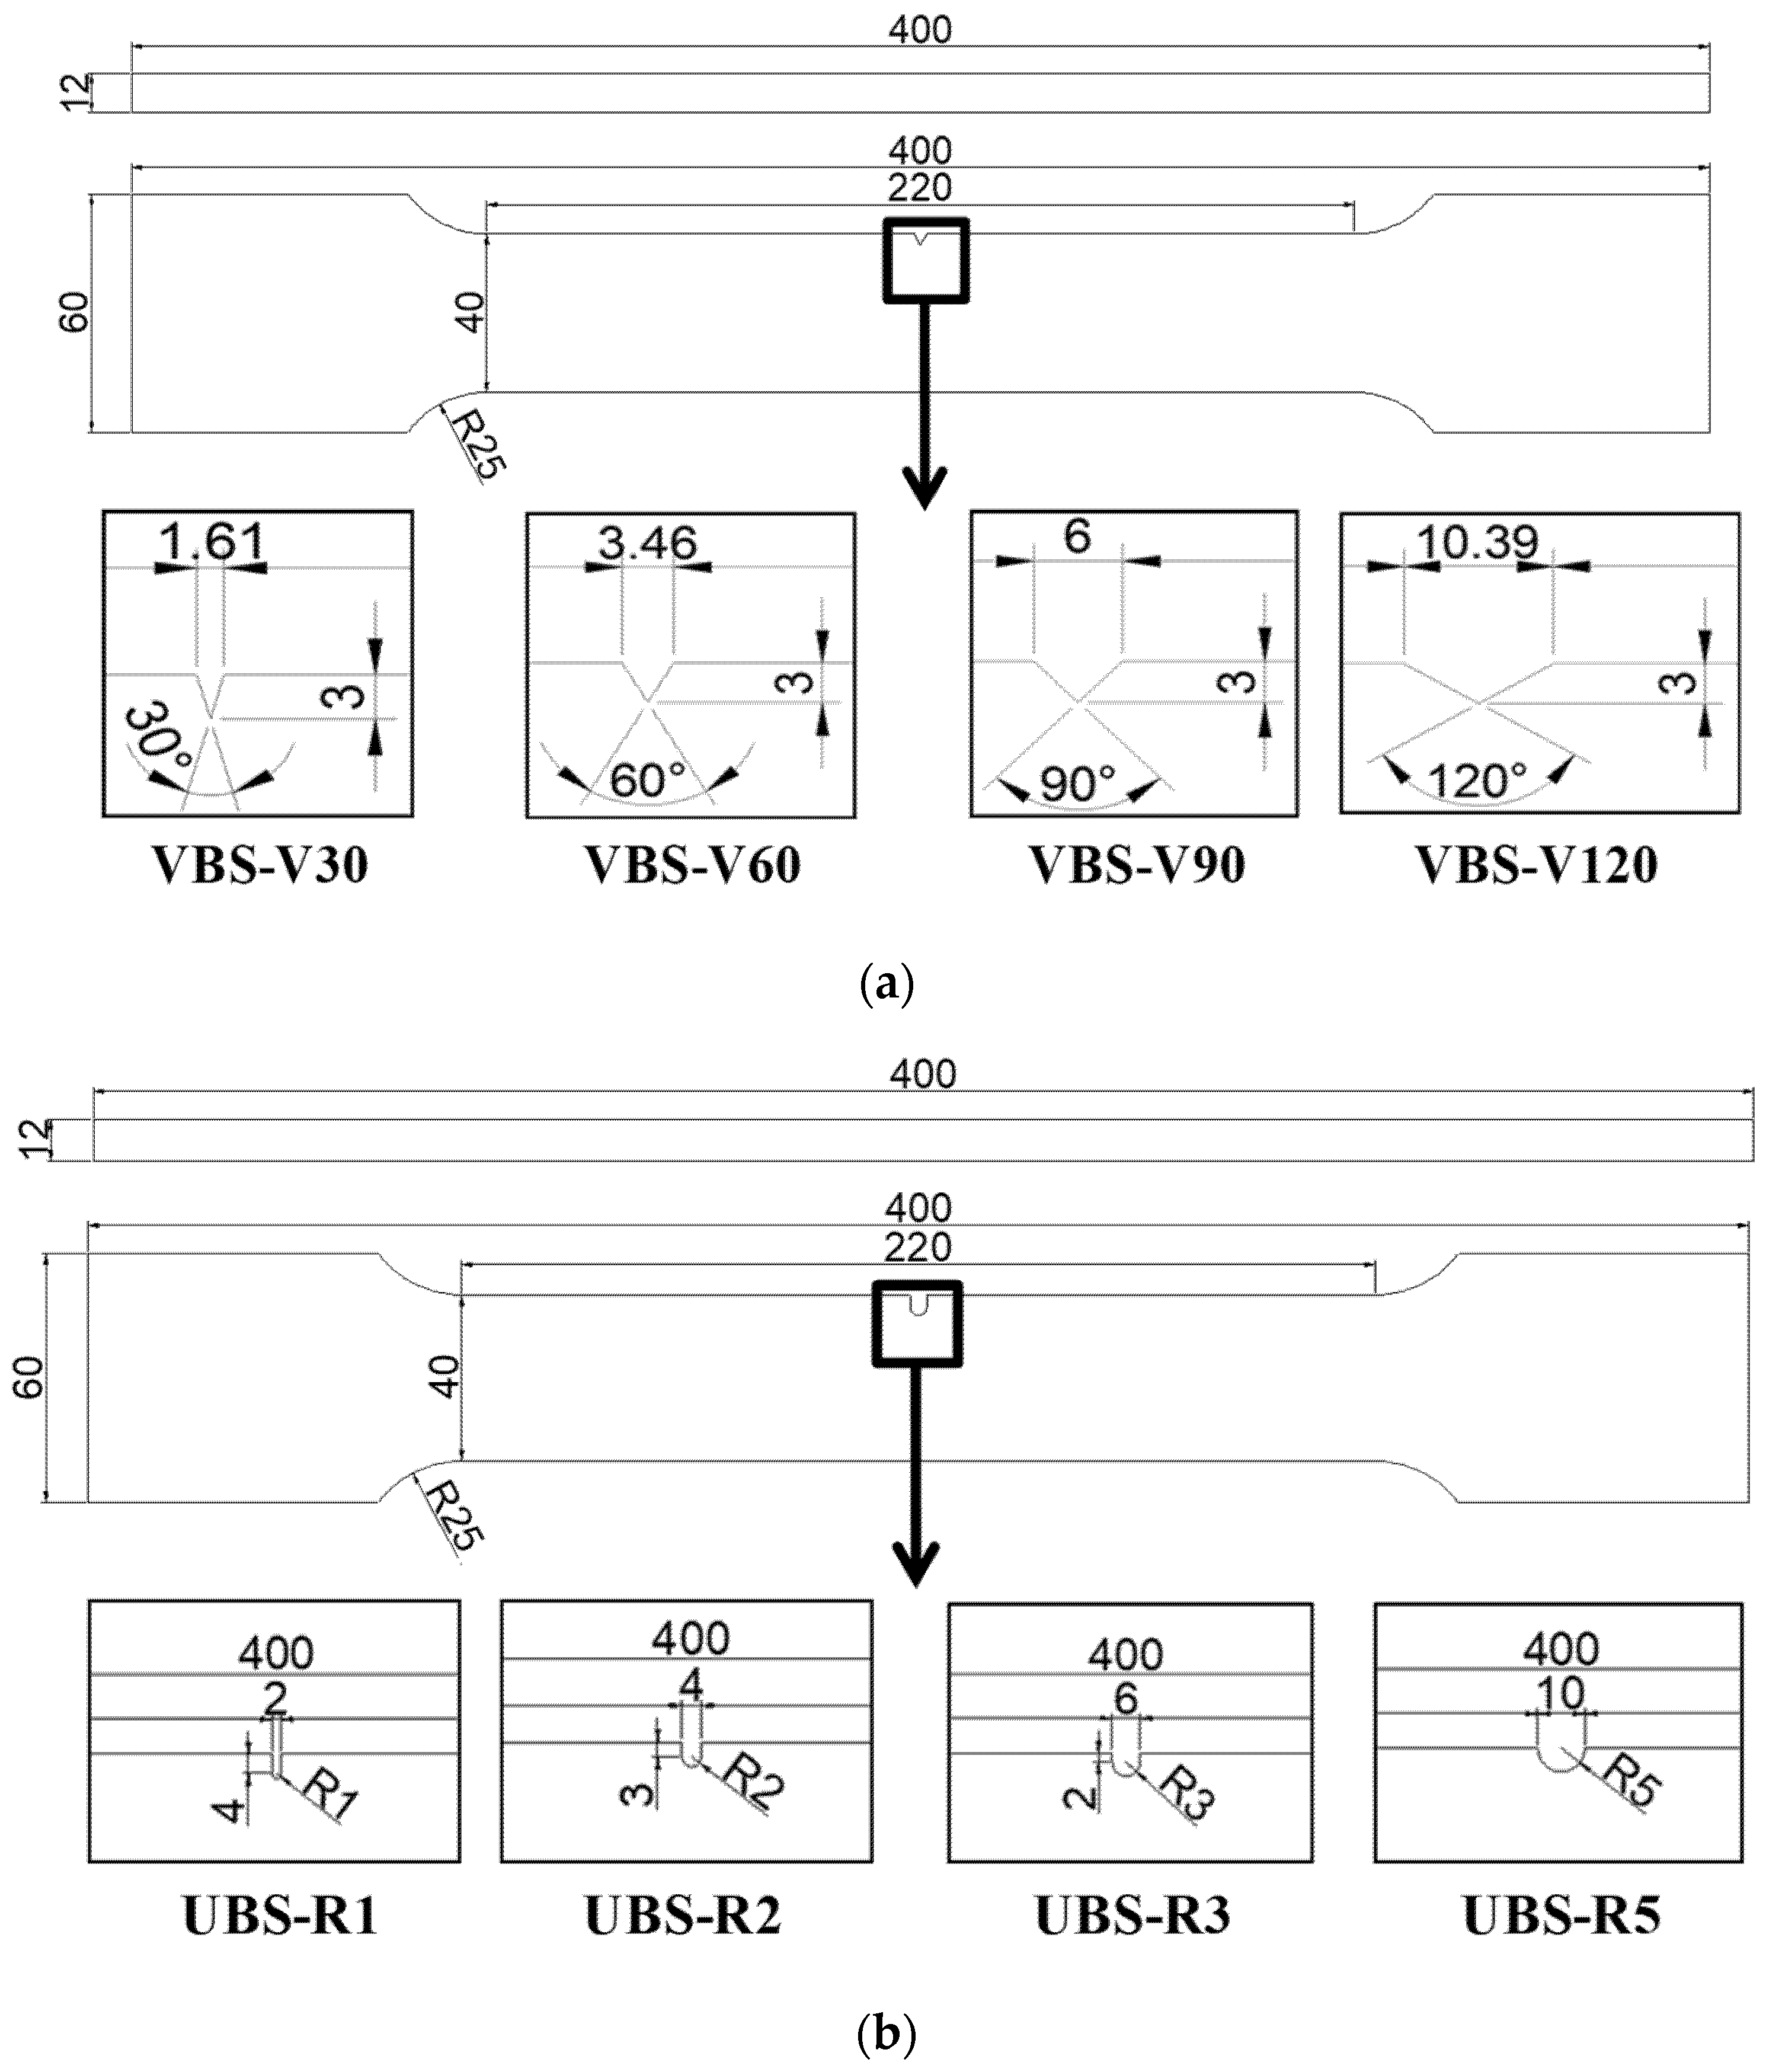
2. Experimental Program and Tested Specimens

Uniaxial tension tests were carried out to obtain the ductile fracture behavior of SBHS500, SM570, and SM490 structural steels, using single-side notched flat bar specimens made of these three types of steels, which consist of two series of notched specimens with V-notch (abbreviated to VBS) and U-notch (abbreviated to UBS). In this experimental investigation, uniaxial tension tests on flat bar specimens with various notches were employed to investigate the dependence of ductile fracture behavior on stress triaxiality. The geometric dimensions of VBS and UBS specimens tested are illustrated in Figure 1. Different stress triaxialities are provided by changing the notch degree in VBS specimens and the notch radius in UBS specimens [6]. For the VBS specimens, all of the specimens have the same 3 mm notch depth, and four different notch degrees (30°, 60°, 90° and 120°) are employed. Regarding the UBS specimens, all of the specimens have the same 5 mm notch depth, and four different notch radii (1 mm, 2 mm, 3 mm and 5 mm) are used. Two specimens are allocated in each set and a total of 48 specimens were prepared for the experimental tests. The actual flat bar thickness of VBS and UBS specimens are listed in Table 1, and the photo of specimens is shown in Figure 2. Surface crack initiation behaviors for all types of specimens were observed and recorded continuously by one high-speed camera (Canon Inc., Tokyo, Japan). Though there are solutions, such as damage inspection by magnetic dye penetrant or fractographic measurement, ductile crack initiation is defined as the point when crack length extends to 1–2 mm according to visual or video camera observation [20].
All specimens were tested using a 500 kN MTS material testing machine (MTS, Minnesota, MN, USA) under displacement control, as shown in Figure 3a. The specimens were loaded at a rate of 0.02 to 0.05 mm/s (nominal corresponding strain rate 1 × 10⁻⁴/s to 2.5 × 10⁻⁴/s). The observed point displacements were measured using a contact Ω extensometer (TML, Tokyo, Japan) in a gauge length of 200 mm, as shown in Figure 3b. During the testing, the load P and observed point displacement were measured and recorded by a data logger (TDS-530, TML, Tokyo, Japan).

3. Experimental Results and Discussions

3.1. Experimental Results

For comparison, Figure 4 shows the engineering stress-engineering strain curves obtained from base metal specimens (non-notched flat bar specimens) made of SBHS500, SM570, and SM490 structural steels, respectively, in which three tensile coupons of each material (named as -C1, -C2, and -C3) are tested in this study. The engineering stress is defined as the load divided by section area, and the engineering strain is defined as the displacement from an extensometer divided by 200 mm. It can be observed that the three tensile coupons’ engineering stress-engineering strain curves of each material, as shown in Figure 4, are very close. The mechanical properties of SBHS500, SM570, and SM490 structural steels are listed in Table 2, in which the values are the average of results obtained from three tensile coupons. For the SM570 and SM490 steels with obvious yield platform, the yield stress is regarded as the stress when the material reaches yielding. Because the SBHS500 HSS has no yield platform, 0.2% proof stress is regarded as the yield stress, where 0.2% proof stress is the engineering stress corresponding to the residual plastic strain level of 0.2%. It is to be noted that the SBHS500 and SM570 HSSs have similar mechanical properties, including elastic modulus, yield stress, ultimate stress, and elongation, although SBHS500 HSS has no obvious yield platform, which exists in SM570 HSS. However, SM490 NSS has relatively low yield stress and relatively large elongation.
The experimental load–displacement curves of VBS and UBS specimens made of SBHS500, SM570 and SM490 structural steels are shown in Figure 5. It is evident from Figure 5 that the load–displacement curves of the two specimens of the same type and material are in agreement with each other, including elastic and plastic parts, although softened and fractured parts of the two specimens of the same type and material have a difference of less than 10%. Regarding UBS specimens, with the increase in U-notch radius, ductile crack initiation occurs later. Figure 6 illustrates the strain-displacement curves of VBS-V90 specimens made of SBHS500, SM570 and SM490 structural steels, where the strain and displacement are directly obtained from a large strain gauge (YFLA-2, TML, Tokyo, Japan) in Figure 7a and extensometer, respectively. The maximum strain that can be measured by this large strain gauge is 20%. It can be observed from Figure 6 that the notched specimens of SBHS500 HSS have a relatively larger strain rate compared to those of SM570 and SM490 steels, so the notched specimens of SBHS500 HSS have a relatively faster crack propagation speed.
The strain gauge was arranged at the position 5 mm away from the notch tip, as shown in Figure 7a. When the displacement is about 1 mm, and the specimen is in the elastic range, SM570 and SM490 specimens have the same strain increase rate; however, the SBHS500 specimen has a relatively smaller strain increase rate. When the displacement is 4 mm, the strain of the SM490 NSS specimen is about 2%, and that of SM570 and SBHS500 HSS specimens is about 3%. It can be observed and obtained that the plastic deformation capacity of SM570 and SBHS500 HSS specimens is relatively worse than that of SM490 specimens, and the inelastic strain of SM570 and SBHS500 HSS specimens concentrates at the notch region of specimens. On the contrary, the SM490 NSS specimens with better plastic deformation capacity have a greater gauged displacement. Therefore, a smaller strain at the notch region can be observed in the SM490 NSS specimens compared to SM570 and SBHS500 HSS specimens.
Average elongation values of VBS and UBS specimens for ductile fracture tests are listed in Table 3. Regarding the VBS specimens, it is evident that the elongation of the specimen has no obvious relationship with the notch degree. For the UBS specimens, the obvious relationship between the elongation and the notch radius is not observed except for the specimens with a notch radius of 1 mm. However, the elongation of UBS specimens is 2% greater than that of VBS specimens on average. The phenomenon’s reason is that the stress triaxiality and inelastic strain concentration degree of VBS specimens are higher than those of UBS specimens. It can be concluded from Table 3 and Figure 8 that the elongation of SBHS500 HSS specimens is the smallest of all specimens made of three steel materials in this study, and brittle fracture occurs in the SBHS500 HSS specimens. Additionally, the elongations of SM570 and SM490 specimens change more greatly along with the notch shape change; however, the varied range of elongation of SBHS500 HSS specimens along with the notch shape is fewer than that of SM570 and SM490 specimens.

3.2. Crack Initiation

“Linear notch mechanics” proposed by Nishitani [26,27] is regarded as an engineering method to evaluate the mechanical properties of members with the notch. The elastic stress concentration factor is approximately defined as follows:
K = 1 + 2 d R
where K is the elastic stress concentration factor, d is the notch depth, and R is the notch radius. For the UBS specimens, when the notch radius is equal to 1 mm and 2 mm, the crack initiation occurs before the ultimate loading point; when the displacement is equal to 3 mm and 5 mm, the crack initiation occurs after the ultimate loading point.
The parameters of UBS specimens calculated and obtained from tests are listed in Table 4. It can be observed from Table 4 that the ε ¯ crack value of UBS specimens decreases with the increase in the notch radius. Compared to the SM490 NSS specimens with better plastic deformation capacity, the SBSH500 and SM570 HSS specimens with worse plastic deformation capacity have smaller strain values at crack initiation ( ε ¯ crack).
The ε ¯ crack/εy-1/K relationship of the UBS specimens is shown in Figure 9. A linear relationship is observed between the value of ε ¯ crack/εy and 1/K. With the increase of 1/K, the ε ¯ crack/εy of three series of the specimens increases. The coefficient of determination of these three curves is more than 0.9. Regarding the SBHS500 and SM570 HSSs specimens with a high yield stress, with the decrease in notch radius, the elastic stress concentration factor increases and the strain at crack initiation decreases. This fact might lead to a brittle fracture occurring before the plastic deformation is fully employed.

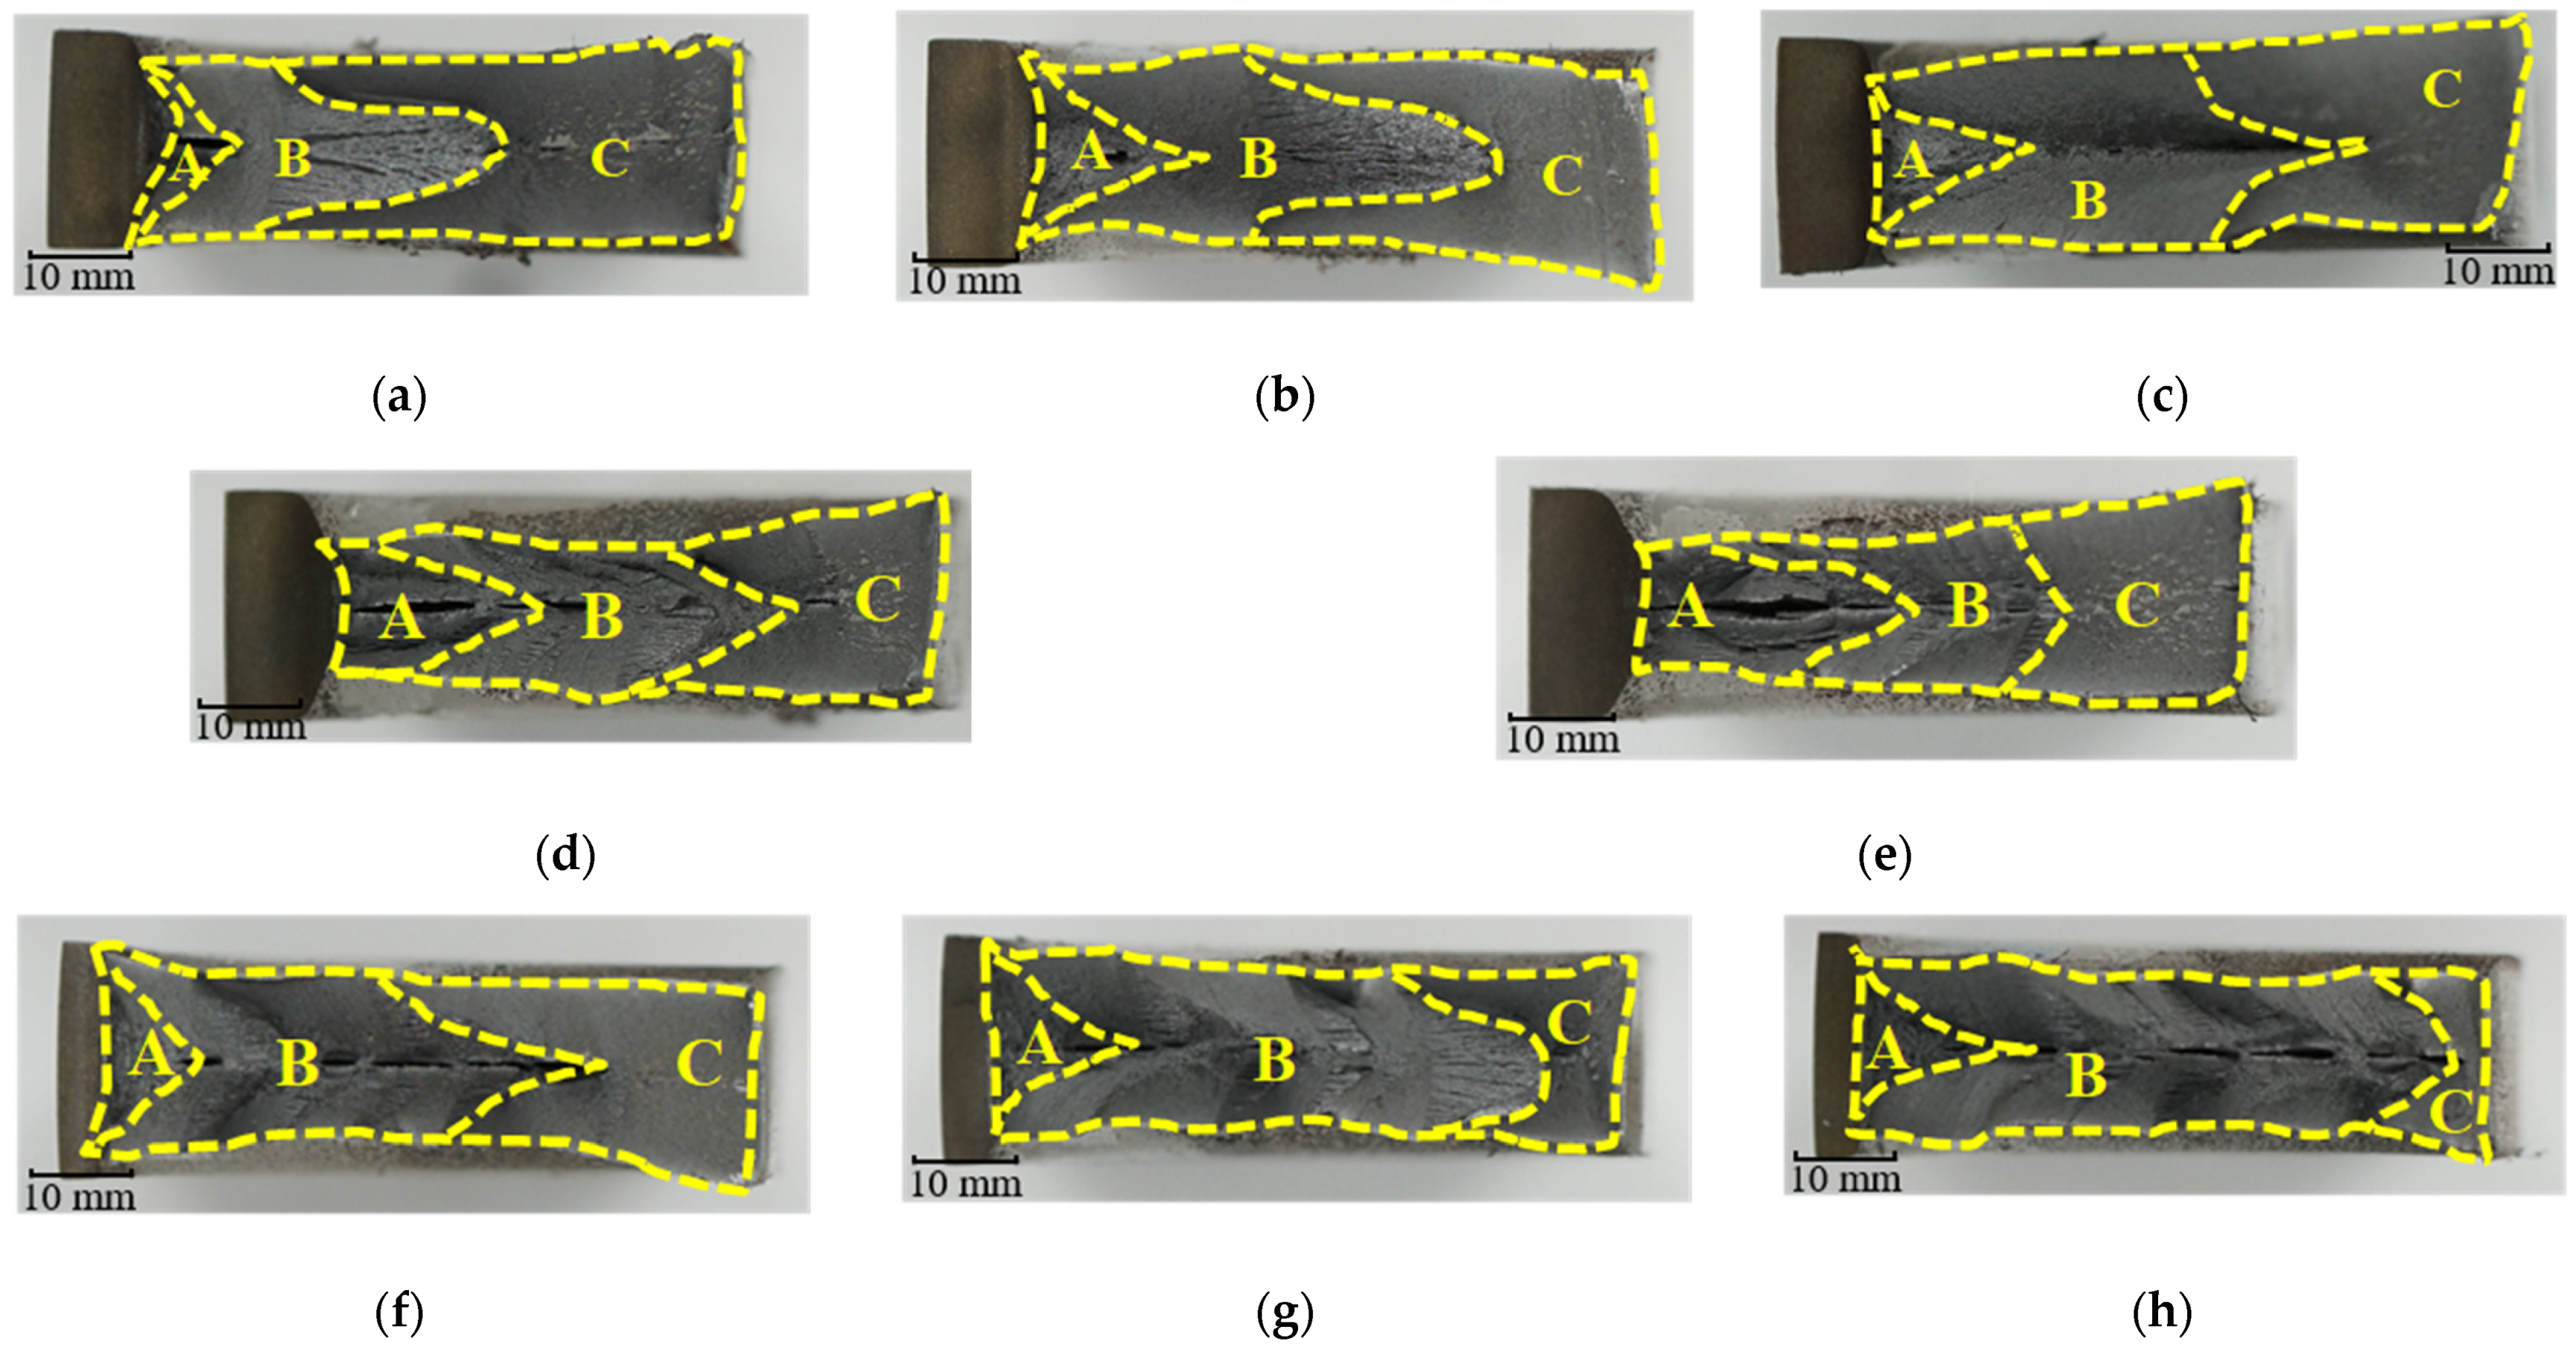
3.3. Fracture Surface

It can be observed from tests that for VBS and UBS specimens, as shown in Figure 10, cracking is induced by the growth and coalescence of numerous nucleated micro-voids from the surface of the notch root region (Zone A), then propagation in a herringbone pattern (Zone B), leading to final shear mode failure (Zone C) [20]. Zone A and Zone B are coarse surfaces; Zone C is very smooth and along a local shear band oriented at an angle of about 45° in relation to the tensile axis [12].
It can be concluded from Figure 10a–c that the specimens made of SM490 with the best plastic deformation capacity have the relatively larger crack initiation region and crack propagation region; however, the specimens made of SBHS500 with the worst plastic deformation capacity have the relatively smaller crack initiation region and crack propagation region. It can be observed in Figure 10a,d,e that the crack initiation region greatly increases with the increase in the U-notch radius. From Figure 10f–h, it can be observed that the crack initiation region slightly increases with the increase in V-notch degree. Moreover, there is obvious delamination in the failure surface of SBHS500 and SM570 HSS specimens.

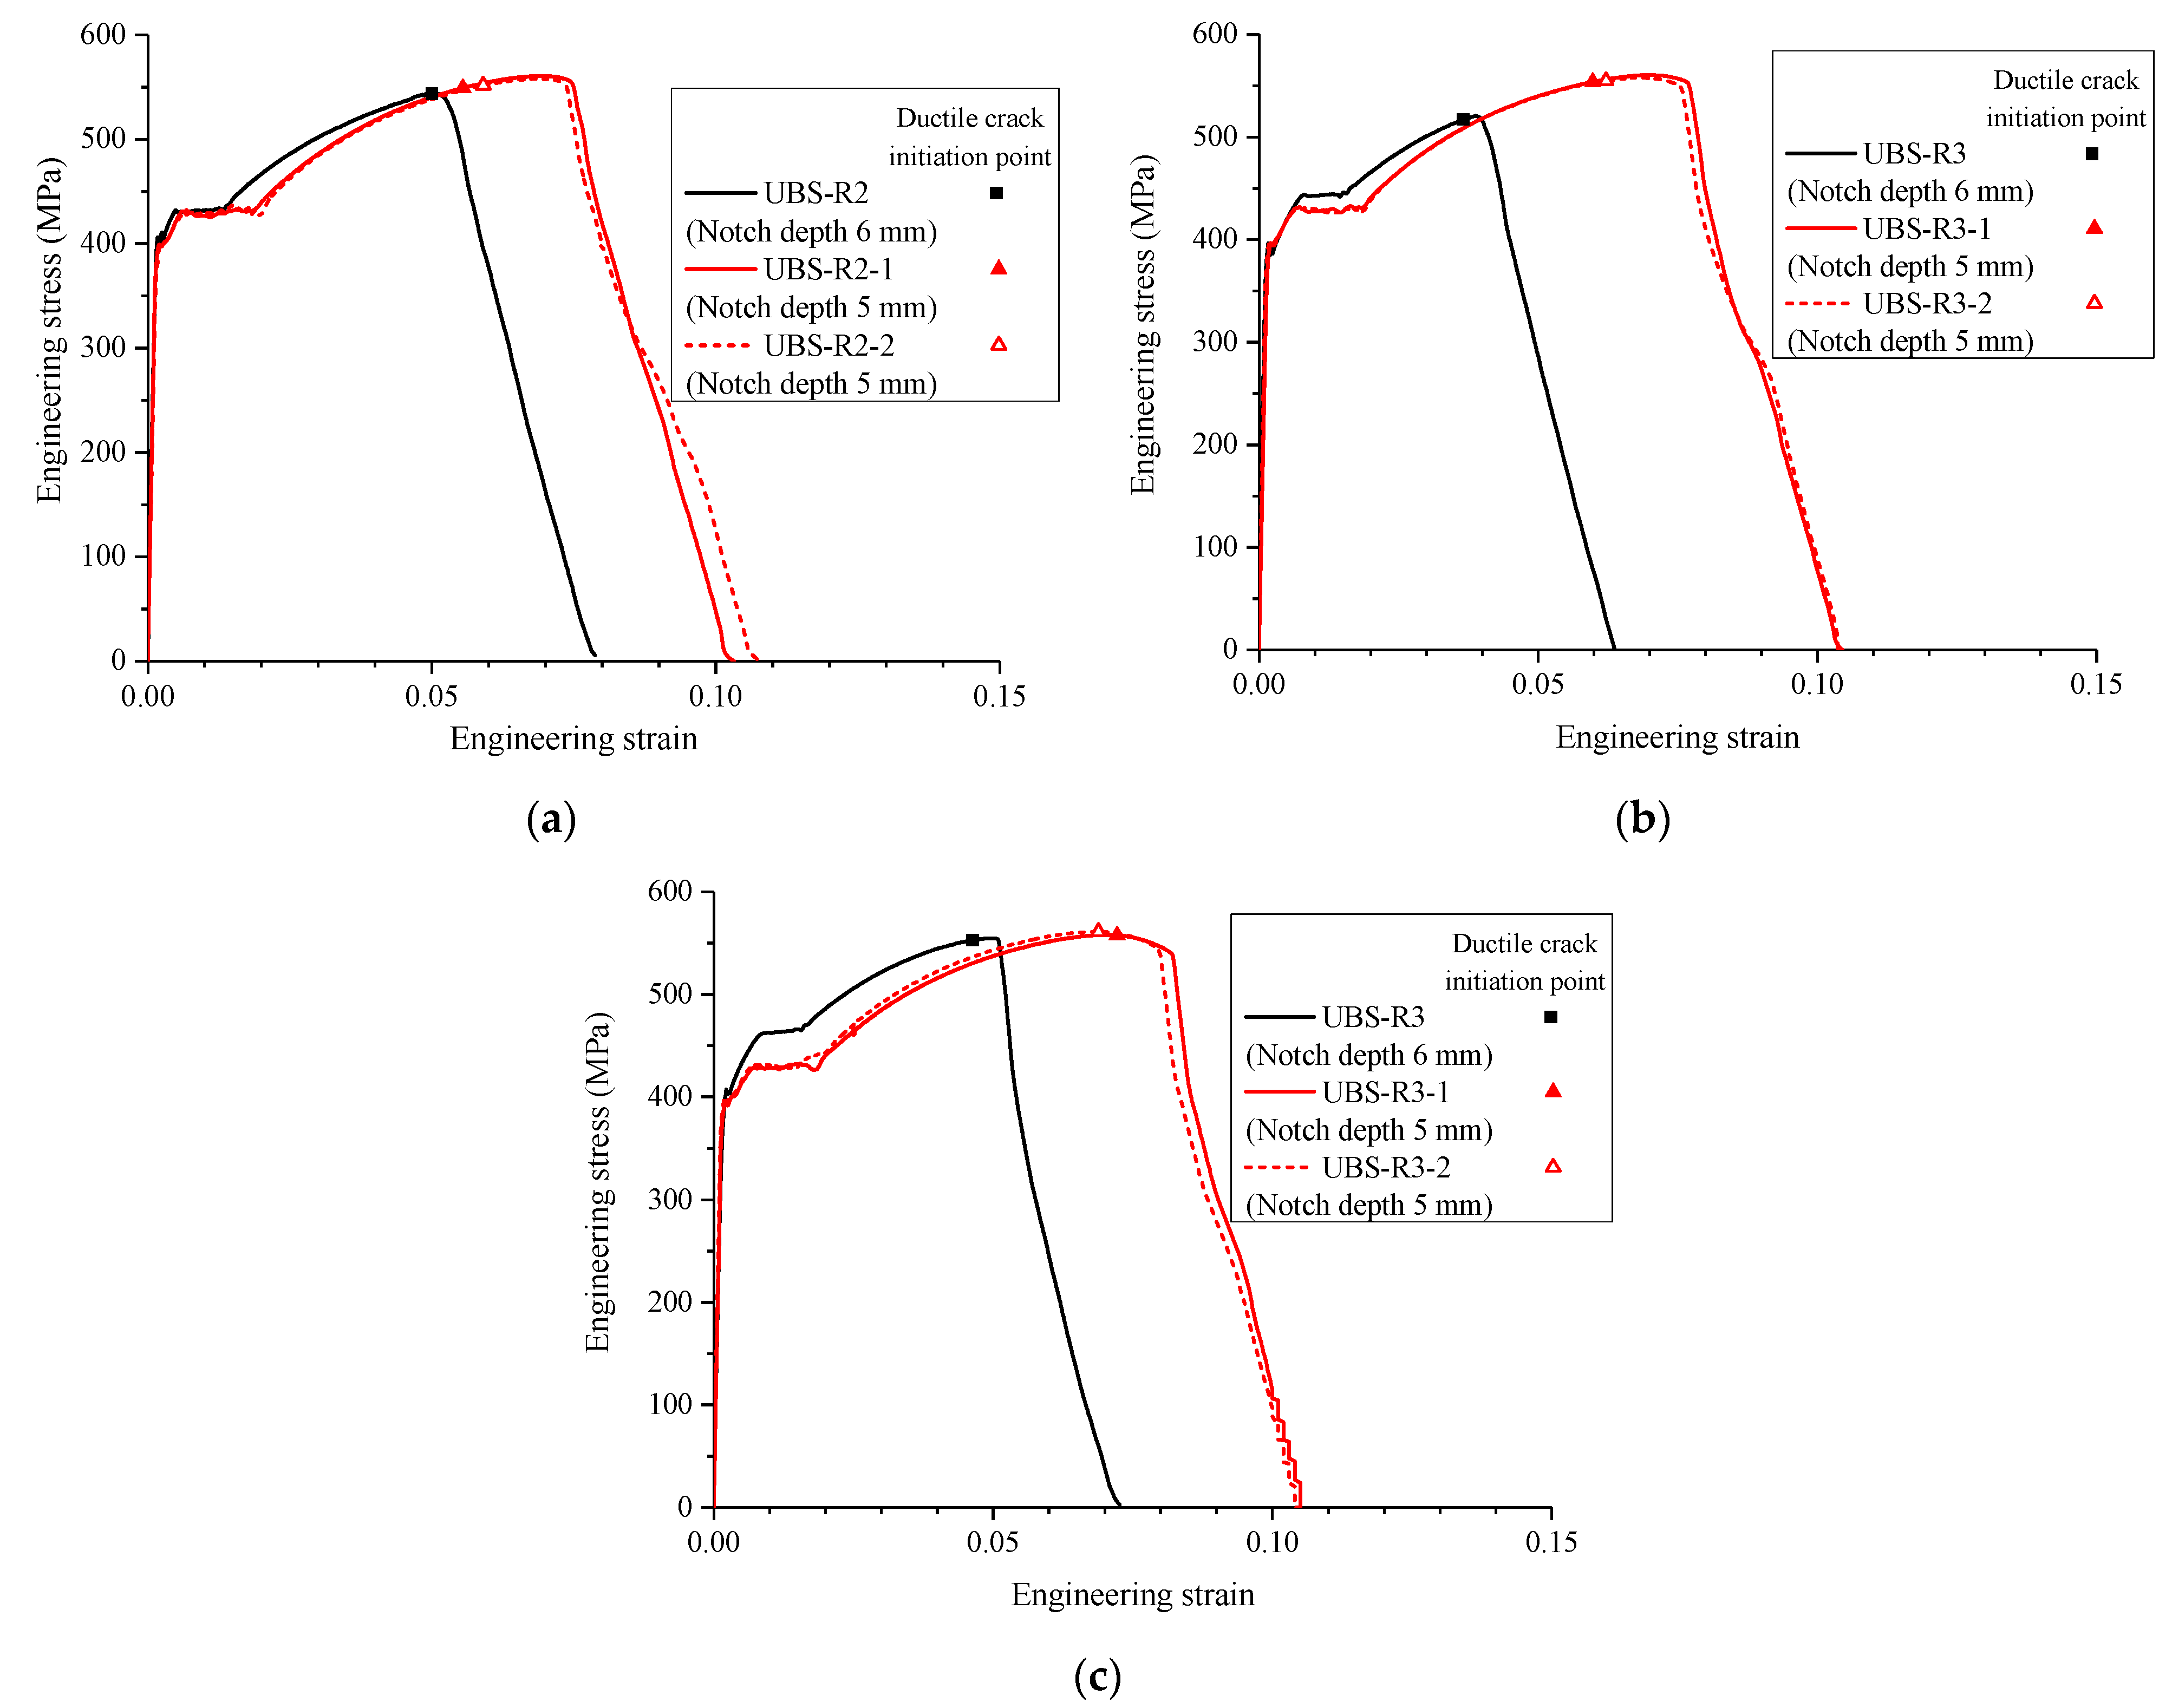
3.4. Effect of Notch Depth

To investigate the effect of notch depth on fracture behavior, Figure 11 illustrates the VBS test results of SM490 specimens with a notch depth of 3 mm in this study and those of SM490 specimens with a notch depth of 6 mm in the reference [6]. Figure 12 shows the UBS test results of SM490 specimens with a notch depth of 5 mm in this study and those of SM490 specimens with a notch depth of 6 mm in the reference [6].
In this section, the yield and ultimate stresses are defined as the 0.2% proof stress and the maximum stress during tests, respectively. When there is no obvious yield platform, the yield stress can be defined as 0.2% proof stress [28]. In the VBS tests, as listed in Table 5, the yield stress of VBS specimens with a notch depth of 3 mm in this study is 400 MPa; however, that of VBS specimens with a notch depth of 6 mm in the previous study is 450 MPa. The ultimate stress of VBS specimens with a notch depth of 3 mm and 6 mm is 550 MPa and 480 MPa, respectively. In other words, with the increase in notch depth, the yield stress increases, but the ultimate stress decreases. The same phenomenon occurs in the UBS specimens, as shown in Figure 12. The yield stress of UBS specimens with a notch depth of 6 mm is greater than that with a notch depth of 5 mm; however, the ultimate stress is the opposite. The decent rate of a load of specimens in this study is not related to notch shape and notch depth. The greater the notch depth, the earlier the crack initiation. A greater notch depth might result in brittle fracture because the plastic deformation capacity cannot be fully employed. Therefore, a detailed notch geometry should be obtained in practical engineering because a greater notch depth might lead to brittle fracture of members.
Because the tested specimens in this study are single-groove, the HSS material in the notch region firstly reaches to yielding, as marked by the black circle in Figure 13a, and then the full cross-section enters yielding. During this process, the neutral axis moves to the side without the notch because the elastic modulus will decrease once the material enters plastic. In this study, the yielding stress of specimens tested is regarded as the point that a full cross-section enters plasticity because the yielding point of the notch region cannot be determined easily.

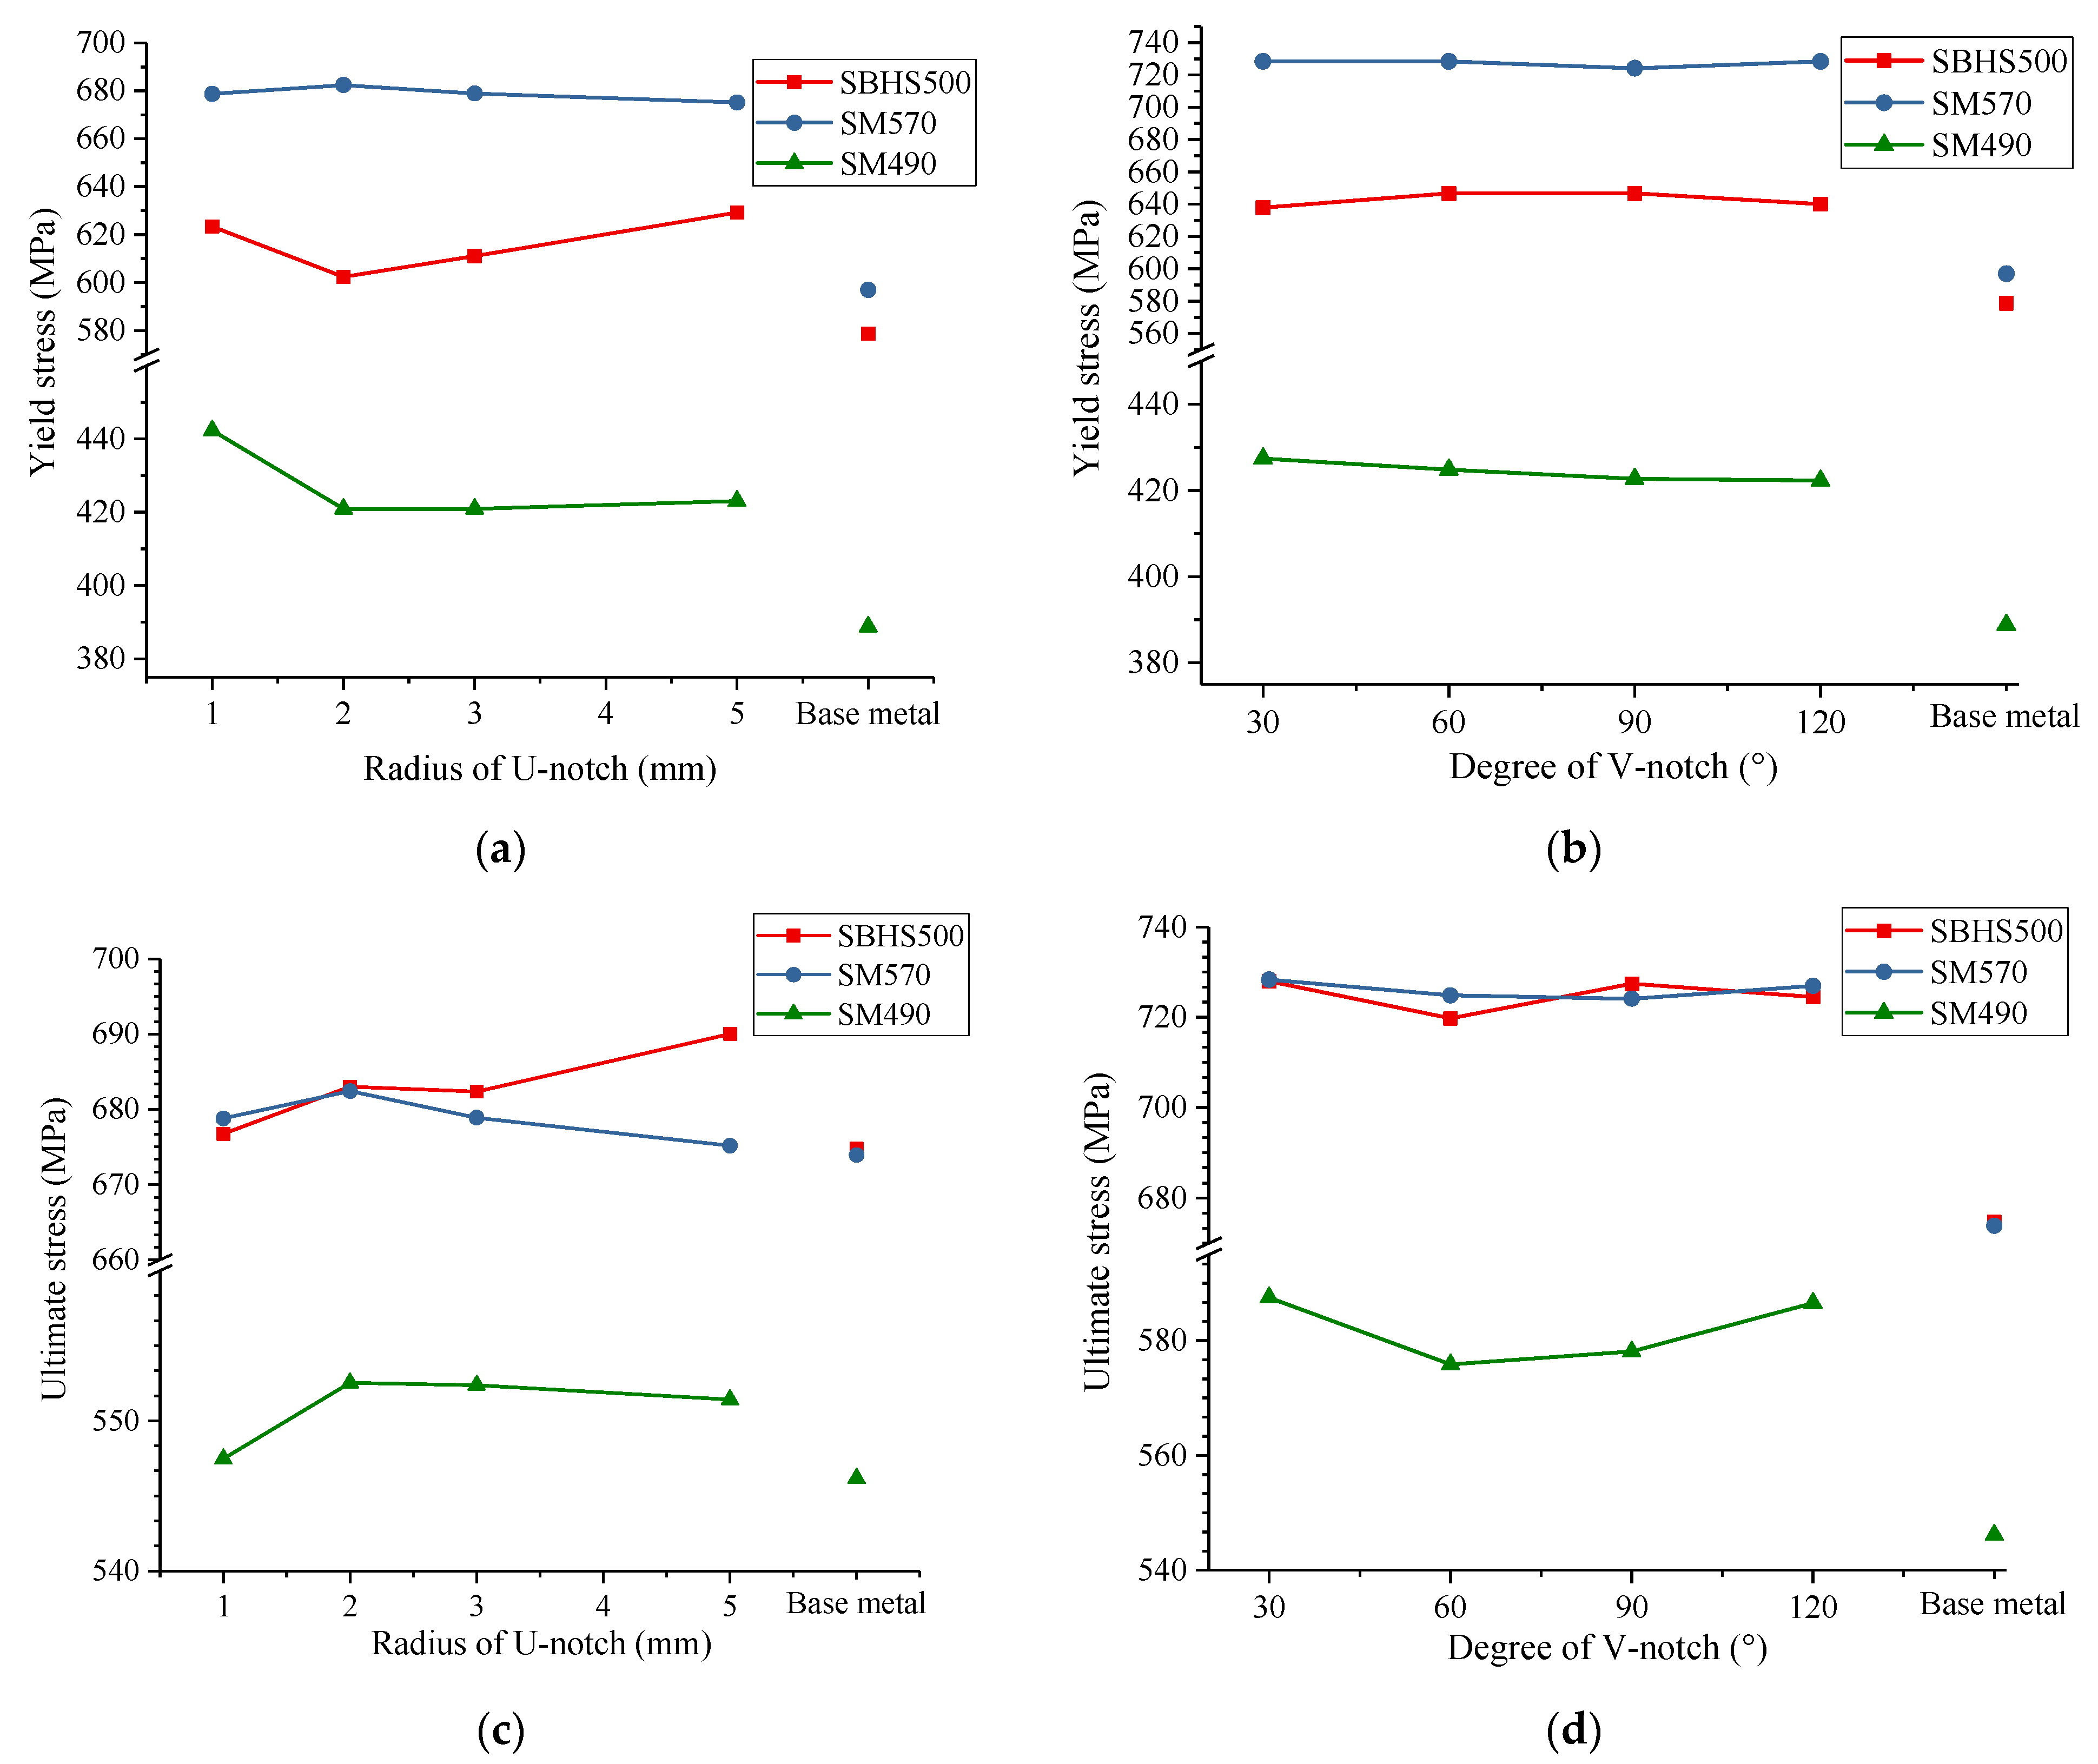
3.5. Relationships between Detailed Notch Geometry with Yield and Ultimate Stresses

The relationships between detailed notch geometry (U-notch radius and V-notch degree) with yield and ultimate stresses are shown in Figure 14. The yield and ultimate stresses in Figure 14 are defined as the yield load and ultimate load divided by the notched minimum sectional area, respectively. It can be observed that the yield stress has no obvious relationship with the detailed notch geometry, including both the U-notch radius and V-notch degree. The yield stress of VBS and UBS specimens is about 1.1 times greater than that of base metal specimens. Similarly, the ultimate stress has no obvious relationship with the detailed notch geometry. Accordingly, the effect of notch depth is higher than the effects of notch degree or notch radius.

3.6. Weldability

It is remarked that from the metallurgical point of view, both the grain sizes and microstructural arrays of distinctive materials and alloys have important roles in the resulting material’s properties (e.g., mechanical and corrosion behaviors), as previously reported [29,30,31,32,33,34,35,36]. In this study, the weldability of these steels is studied based on the chemical composition.
Table 6 lists the chemical compositions of HSSs in this study, including SM570 and SBHS500, from HSS manufacturers. The chemical composition of SM490 NSS is not provided by the manufacturer. As shown in Table 6, C, Si, Mn, P, and S are the main five compositions, in which C, Si and Mn play an important role in the control of mechanical and impact properties, and P and S are impurities. Except for these five compositions, other compositions can be added to HSS materials to improve impact properties or to refine particle size. Generally, increasing C content can lead to an increase in yield and ultimate stresses. In this study, SBHS500 and SM570 HSSs have almost the same ultimate stress; however, the yield stress of SM570 is greater than that of SBHS500 because the C content of SM570 HSS is 0.02% higher than that of SBHS500. Adding the composition of Cr can result in improving the corrosion, oxidation, and abrasion resistance; adding the Cr content has no effect on the mechanical properties of HSS. The carbon equivalent value Ceq and the welding crack sensitivity index PCM, which is a weldability index, are defined as follows:
C eq = C + Mn 6 + Si 24 + Ni 40 + Cr 5 + Mo 4
P CM = C + Mn 20 + Si 30 + Cu 20 + Ni 60 + Cr 20 + Mo 15 + V 10 + 5 B
Table 7 lists the calculated values of Ceq and PCM in Equations (2) and (3). It is illustrated that the Ceq value of SBHS500 is equal to that of SM570; however, the PCM value of SBHS500 is 0.02% less than that of SM570. Therefore, the preheating of welding of SBHS500 specimens or members can be carried out at a relatively low temperature, the crack due to heating during welding is not easy to occur, and SBHS500 specimens or members have better weldability.

4. Conclusions

The ductile fracture performances of two types of HSSs, including SBHS500 and SM570, and an NSS SM490 are investigated by a series of V-notch and U-notch fracture tests. Four various V-notch degrees and four U-notch radii are employed to create different stress triaxialities. A total of 48 specimens are tested. The following conclusions can be obtained:
(1)
For the three structural steels, with the decreases of the degree of V-notch or radius of U-notch, both the ductile crack initiation point and drop in the load–displacement responses of VBS and UBS specimens appear earlier;
(2)
The elongation of specimens made of SM490 and SM570 vary greatly along with the notch shape change; however, the elongation changes of specimens made of SBHS500 along with the notch shape change is relatively small;
(3)
NSS SM490 is the structural steel with the best plastic deformation capacity in the three structural steels of this study. SBHS500 and SM570 HSSs have the worse plastic deformation capacity because of their higher yield stress;
(4)
SBHS500 and SM570 HSSs with higher yield stress have a relatively higher elastic stress concentration factor, the crack initiation appears earlier, and the brittle fracture is more likely to occur;
(5)
Compared to SM570 HSS, SBHS500 HSS has a lower PCM and better weldability.

Author Contributions

Y.L. (Yan Liu) performed the experiment; S.I. and Y.L. (Yanyan Liu) performed the data analyses; L.K. wrote the manuscript; H.G. proposed the idea and provided the funding. All authors have read and agreed to the published version of the manuscript.

Funding

This research was funded by [the National Natural Science Foundation of China] grant number [52178286], [the Natural Science Foundation of Guangdong Province] grant number [2020A1515011070] and [the Guangdong Provincial Key Laboratory of Modern Civil Engineering Technology] grant number [2021B1212040003].

Informed Consent Statement

Informed consent was obtained from all subjects involved in the study.

Data Availability Statement

Not applicable.

Acknowledgments

The study is also supported in part by grant from the Advanced Research Center for Natural Disaster Risk Reduction, Meijo University. All the sources of support are gratefully acknowledged.

Conflicts of Interest

The authors declare no conflict of interest.

References

  1. Valentini, R.; Tedesco, M.M.; Corsinovi, S.; Bacchi, L. Delayed Fracture in Automotive Advanced High Strength Steel: A New Investigation Approach. Steel Res. Int. 2019, 90, 1900136. [Google Scholar] [CrossRef]
  2. Fujie, W.; Taguchi, M.; Kang, L.; Ge, H.; Xu, B. Ductile crack initiation evaluation in stiffened steel bridge piers under cyclic loading. Steel Compos. Struct. 2020, 36, 463–480. [Google Scholar]
  3. Kang, L.; Wang, Y.; Liu, X.; Uy, B. Investigation of residual stresses of hybrid normal and high strength steel (HNHSS) welded box sections. Steel Compos. Struct. 2019, 33, 489–507. [Google Scholar]
  4. Hai, L.-T.; Li, G.-Q.; Wang, Y.-B.; Wang, Y.-Z. Experimental and numerical investigation on Q690 high strength steel beam-columns under cyclic lateral loading about weak axis. Eng. Struct. 2021, 236, 112107. [Google Scholar] [CrossRef]
  5. Liu, Y.; Jia, L.-J.; Ge, H.; Kato, T.; Ikai, T. Ductile-fatigue transition fracture mode of welded T-joints under quasi-static cyclic large plastic strain loading. Eng. Fract. Mech. 2017, 176, 38–60. [Google Scholar] [CrossRef]
  6. Kang, L.; Ge, H.; Fang, X. An improved ductile fracture model for structural steels considering effect of high stress triaxiality. Constr. Build. Mater. 2016, 115, 634–650. [Google Scholar] [CrossRef]
  7. Jia, L.-J.; Ge, H.; Shinohara, K.; Kato, H. Experimental and Numerical Study on Ductile Fracture of Structural Steels under Combined Shear and Tension. J. Bridg. Eng. 2016, 21, 04016008. [Google Scholar] [CrossRef]
  8. Wang, W.-Z.; Jiang, L.-Y.; Sun, R.-Q.; Wang, X.-T. Tensile Tests on High Strength Steel Q345 Notched Plates with the Moderate Thickness. In Proceedings of the International Conference on Smart Materials and Intelligent Systems, Chongqing, China, 23–25 December 2011; p. 1450. [Google Scholar]
  9. Xiang, P.; Qing, Z.; Jia, L.-J.; Wu, M.; Xie, J. Damage evaluation and ultra-low-cycle fatigue analysis of high-rise steel frame with mesoscopic fracture models. Soil Dyn. Earthq. Eng. 2020, 139, 106283. [Google Scholar] [CrossRef]
  10. Li, W.; Liao, F.; Zhou, T.; Askes, H. Ductile fracture of Q460 steel: Effects of stress triaxiality and Lode angle. J. Constr. Steel Res. 2016, 123, 1–17. [Google Scholar] [CrossRef]
  11. Kang, L.; Wu, B.; Liu, X.; Ge, H. Experimental study on post-fire mechanical performances of high strength steel Q460. Adv. Struct. Eng. 2021, 24, 2791–2808. [Google Scholar] [CrossRef]
  12. Kang, L.; Suzuki, M.; Ge, H.; Wu, B. Experiment of ductile fracture performances of HSSS Q690 after a fire. J. Constr. Steel Res. 2018, 146, 109–121. [Google Scholar] [CrossRef]
  13. Xin, H.; Veljkovic, M. Evaluation of high strength steels fracture based on uniaxial stress-strain curves. Eng. Fail. Anal. 2021, 120, 105025. [Google Scholar] [CrossRef]
  14. Park, S.-J.; Cerik, B.C.; Choung, J. Comparative study on ductile fracture prediction of high-tensile strength marine structural steels. Ships Offshore Struct. 2020, 15, S208–S219. [Google Scholar] [CrossRef]
  15. Huang, X.; Ge, J.; Zhao, J.; Zhao, W. Experimental and Fracture Model Study of Q690D Steel under Various Stress Conditions. Int. J. Steel Struct. 2021, 21, 561–575. [Google Scholar] [CrossRef]
  16. Wang, Y.-Z.; Li, G.-Q.; Wang, Y.-B.; Lyu, Y.-F.; Li, H. Ductile fracture of high strength steel under multi-axial loading. Eng. Struct. 2020, 210, 110401. [Google Scholar] [CrossRef]
  17. Sajid, H.U.; Kiran, R. Post-fire mechanical behavior of ASTM A572 steels subjected to high stress triaxialities. Eng. Struct. 2019, 191, 323–342. [Google Scholar] [CrossRef]
  18. Kim, M.; Lee, H.; Hong, S. Experimental determination of the failure surface for DP980 high-strength metal sheets considering stress triaxiality and Lode angle. Int. J. Adv. Manuf. Technol. 2018, 100, 2775–2784. [Google Scholar] [CrossRef] [Green Version]
  19. Sajid, H.U.; Kiran, R. Influence of high stress triaxiality on mechanical strength of ASTM A36, ASTM A572 and ASTM A992 steels. Constr. Build. Mater. 2018, 176, 129–134. [Google Scholar] [CrossRef]
  20. Kang, L.; Ge, H.; Kato, T. Experimental and ductile fracture model study of single-groove welded joints under monotonic loading. Eng. Struct. 2015, 85, 36–51. [Google Scholar] [CrossRef]
  21. Miki, C.; Ichikawa, A.; Kusunoki, T.; Kawabata, F. Proposal of New High Performance Steels for Bridges (BHS500, BHS700). Doboku Gakkai Ronbunshu 2003, 2003, 1–10. (In Japanese) [Google Scholar] [CrossRef] [Green Version]
  22. Kang, L.; Suzuki, M.; Ge, H. A study on application of high strength steel SM570 in bridge piers with stiffened box section under cyclic loading. Steel Compos. Struct. 2018, 26, 583–594. [Google Scholar]
  23. Hirohata, M.; Teraguchi, D.; Kitane, Y. Mechanical properties of steels for bridge high performance structure subjected to heating and cooling process simulating fire. Steel Constr. Eng. 2019, 26, 79–86. (In Japanese) [Google Scholar]
  24. JIS G 3140:2011; Higher Yield Strength Steel Plates for Bridges. Japan Industrial Committee: Tokyo, Japan, 2011.
  25. JIS G 3106:2015; Rolled Steels for Welded Structure. Japan Industrial Committee: Tokyo, Japan, 2015.
  26. Nishitani, H. Measure of stress field in a notch corresponding to stress intensity factor in a crack. Trans. JSME 1983, 49, 1353–1359. (In Japanese) [Google Scholar] [CrossRef]
  27. Nishitani, H. Linear notch mechanics as an extension of linear fracture mechanics. In Computational and Experimental Fracture Mechanics; Computational Mechanics Publications: Tokyo, Japan, 1994; Volume 16, pp. 187–211. [Google Scholar]
  28. Rasmussen, K. Full-range stress-strain curves for stainless steel alloys. J. Constr. Steel Res. 2003, 59, 47–61. [Google Scholar] [CrossRef]
  29. Petch, N. The cleavage strength of polycrystals. J. Iron Steel Inst. 1953, 174, 25–31. [Google Scholar]
  30. Donelan, P. Modelling microstructural and mechanical properties of ferritic ductile cast iron. Mater. Sci. Technol. 2000, 16, 261–269. [Google Scholar] [CrossRef]
  31. Osório, W.; Santos, A.C.; Quaresma, J.; Garcia, A. Mechanical properties as a function of thermal parameters and microstructure for Zn-Al castings. J. Mater. Proc. Technol. 2003, 143, 703–709. [Google Scholar] [CrossRef]
  32. Lloyd, D.J.; Court, S.A. Influence of grain size on tensile properties of Al-Mg alloys. Mater. Sci. Technol. 2003, 19, 1349–1354. [Google Scholar] [CrossRef]
  33. Osório, W.R.; Cheung, N.; Spinelli, J.E.; Goulart, P.R.; Garcia, A. The effects of a eutectic modifier on microstructure and surface corrosion behavior of Al-Si hypoeutectic alloys. J. Solid State Electrochem. 2007, 11, 1421–1427. [Google Scholar] [CrossRef]
  34. Rosa, D.M.; Spinelli, J.E.; Osório, W.R.; Garcia, A. Effects of cell size and macrosegregation on the corrosion behavior of a dilute Pb–Sb alloy. J. Power Sources 2006, 162, 696–705. [Google Scholar] [CrossRef]
  35. Kostryzhev, A.; Singh, N.; Chen, L.; Killmore, C.; Pereloma, E. Comparative effect of Mo and Cr on microstructure and mechanical properties in NbV-microalloyed bainitic steels. Metals 2018, 8, 134. [Google Scholar] [CrossRef] [Green Version]
  36. Tesser, E.; Silva, C.; Artigas, A.; Monsalve, A. Effect of Carbon Content and Intercritical Annealing on Microstructure and Mechanical Tensile Properties in FeCMnSiCr TRIP-Assisted Steels. Metals 2021, 11, 1546. [Google Scholar] [CrossRef]
Figure 1. Geometric dimensions of VBS and UBS specimens tested (Unit: mm): (a) VBS (V-notch) specimens; (b) UBS (U-notch) specimens.
Metals 12 00672 g001
Figure 2. Photo of specimens: (a) VBS specimens; (b) UBS specimens.
Metals 12 00672 g002
Figure 3. The test equipment: (a) MTS Material testing machine; (b) Ω extensometer.
Metals 12 00672 g003
Figure 4. Engineering stress–engineering strain curves of SBHS500, SM570, and SM490 structural steels.
Metals 12 00672 g004
Figure 5. Load–displacement curves of VBS and UBS specimens made of various HSS materials: (a) VBS specimens made of SBHS500; (b) UBS specimens made of SBHS500; (c) VBS specimens made of SM570; (d) UBS specimens made of SM570; (e) VBS specimens made of SM490; (f) UBS specimens made of SM490.
Metals 12 00672 g005
Figure 6. Strain–displacement curves of various materials (VBS-V90 specimens).
Metals 12 00672 g006
Figure 7. Crack initiation, propagation and final fracture of Specimen UBS-R1-1: (a) Before crack initiation; (b) crack initiation; (c) crack propagation; (d) final fracture.
Metals 12 00672 g007
Figure 8. Average elongation value of VBS and UBS specimens for ductile fracture tests: (a) Average elongation–V-notch radius relationship; (b) average elongation–U-notch radius relationship.
Metals 12 00672 g008
Figure 9. εcrack/εy-1/K relationship of UBS specimens.
Metals 12 00672 g009
Figure 10. Fracture surface of specimens: (a) UBS-R1 (SBHS500); (b) UBS-R1 (SM570); (c) UBS-R1 (SM490); (d) UBS-R3 (SBHS500); (e) UBS-R5 (SBHS500); (f) VBS-V30 (SM570); (g) VBS-V60 (SM570); (h) VBS-V90 (SM570). Zone A: crack initiation region; Zone B: crack propagation region; Zone C: shear zone.
Metals 12 00672 g010
Figure 11. Effect of notch depth (VBS specimens made of SM490): (a) VBS-V30 specimens; (b) VBS-V60 specimens; (c) VBS-V90 specimens; (d) VBS-V120 specimens.
Metals 12 00672 g011
Figure 12. Effect of notch depth (UBS specimens made of SM490): (a) UBS-R2 specimens; (b) UBS-R3 specimens; (c) UBS-R5 specimens.
Metals 12 00672 g012
Figure 13. Effect of neutral axis change on yield stress: (a) UBS-R2 specimens; (b) before neutral axis change; (c) after neutral axis change.
Metals 12 00672 g013
Figure 14. Effect of U-notch radius and V-notch degree: (a) Yield stress–U-notch radius relationship; (b) yield stress–V-notch degree relationship; (c) ultimate stress–U-notch radius relationship; (d) ultimate stress–V-notch degree relationship.
Metals 12 00672 g014
Table 1. Actual flat bar thickness of VBS and UBS specimens (Unit: mm) *.
VBS-V30-1VBS-V30-2VBS-V60-1VBS-V60-2VBS-V90-1VBS-V90-2VBS-V120-1VBS-V120-2
SBHS50012.1812.2012.2012.1312.1512.1512.1312.20
SM57012.1312.3012.3312.1312.1312.1512.1512.13
SM49012.0512.0012.0512.0812.0012.0012.0312.00
UBS-R1-1UBS-R1-2UBS-R2-1UBS-R2-2UBS-R3-1UBS-R3-2UBS-R5-1UBS-R5-2
SBHS50012.4012.0812.2012.1512.1812.2012.1812.10
SM57012.2312.1312.2012.1512.1512.2312.2312.18
SM49012.0312.0312.0012.0312.0512.0012.0312.00
* The value in this table is measured by a vernier caliper (±0.005 mm).
Table 2. Mechanical properties of SBHS500, SM570 and SM490 structural steels.
E (GPa) 1ν2σy (MPa) 3εy4σu (MPa) 5δ (%) 6
SBHS500208 ± 1.1370.270 ± 0.020578 ± 12.160.0020 ± 0.0000675 ± 15.3416.7 ± 0.01
SM570216 ± 1.5490.278 ± 0.009597 ± 1.8090.0028 ± 0.0013674 ± 0.15315.5 ± 0.04
SM490213 ± 1.4880.273 ± 0.009388 ± 0.1500.0018 ± 0.0057546 ± 2.60326.0 ± 1.30
1 E = Young’s modulus, 2 ν = Poisson’s ratio, 3 σy = yield stress, 4 εy = yield strain, 5 σu = ultimate stress, 6 δ = elongation.
Table 3. Average elongation value of VBS and UBS specimens for ductile fracture tests *.
SBHS500SM570SM490 SBHS500SM570SM490
VBS-V305.8 ± 0.01%9.1 ± 0.07%12.9 ± 0.45%UBS-R15.9 ± 0.30%5.9 ± 0.19%9.6 ± 0.01%
VBS-V606.7 ± 0.07%7.5 ± 0.69%11.7 ± 0.12%UBS-R26.1 ± 0.00%6.5 ± 0.04%10.5 ± 0.04%
VBS-V904.9 ± 0.00%8.1 ± 1.51%12.1 ± 0.15%UBS-R36.4 ± 0.09%6.4 ± 0.30%10.4 ± 0.00%
VBS-V1206.9 ± 0.02%7.3 ± 0.42%12.9 ± 0.13%UBS-R56.6 ± 0.03%6.9 ± 0.01%10.5 ± 0.02%
* The value in this table is the average value of two specimens.
Table 4. Parameters of UBS specimens calculated and obtained from tests.
UBS-R1UBS-R2UBS-R3UBS-R5
d (mm) 25555
R (mm) 31235
K15.4724.1623.5823.000
SBHS500 ε ¯ crack 40.0159 ± 0.00040.0198 ± 0.00020.0268 ± 0.00120.0377 ± 0.0004
ε ¯ crack/εy 57.9509.90013.40018.850
SM570 ε ¯ crack0.0125 ± 0.00100.0228 ± 0.00070.0282 ± 0.00410.0403 ± 0.0008
ε ¯ crack/εy4.4718.15510.07314.395
SM490 ε ¯ crack0.0398 ± 0.00090.0573 ± 0.00180.0610 ± 0.00120.0705 ± 0.0016
ε ¯ crack/εy22.11131.83333.88939.167
1 K = stress concentration factor, 2 d = notch depth, 3 R = notch radius, 4 ͞εcrack = average value of strain at crack initiation for two specimens, 5 εy = yield strain of HSS.
Table 5. Effect of notch depth (UBS specimens made of SM490).
Depthσy (MPa)σu (MPa)
3 mm400550
6 mm450480
Table 6. Chemical composition of SM570 and SBHS500 (%).
BNCSiMnPSCuNiCrMoNbV
SM5700.00120.01600.12000.21001.60000.01100.00200.0100.0200.0100.0000.0200.060
SBHS5000.00100.01530.10000.22001.53000.00900.00200.0100.0100.1400.0000.0230.060
Table 7. Calculated values of PCM and Ceq.
PCMCeq
SM5700.2200.402
SBHS5000.2030.397
Publisher’s Note: MDPI stays neutral with regard to jurisdictional claims in published maps and institutional affiliations.

