Article

Molecular Dynamics Study of Phosphorus Migration in Σ3(111) and Σ5(0-13) Grain Boundaries of α-Iron

Computational Science and e-Systems, Japan Atomic Energy Agency, Tokai-mura, Naka-gun, Ibaraki 319-1195, Japan
*
Author to whom correspondence should be addressed.
Current address: Institute for Materials Research, Tohoku University, Oarai-machi, Higashiibaraki-gun, Ibaraki 311-1313, Japan.
Metals 2022, 12(4), 662; https://doi.org/10.3390/met12040662
Submission received: 4 March 2022 / Revised: 8 April 2022 / Accepted: 11 April 2022 / Published: 13 April 2022

Abstract

:
Phosphorus atoms in steels accumulate at grain boundaries via thermal and irradiation effects and induce grain boundary embrittlement, which is experimentally confirmed by an increase in the ductile-brittle transition temperature. Quantitative prediction of phosphorus segregation at grain boundaries under various temperature and irradiation conditions is essential for preventing embrittlement. To develop a model of grain boundary phosphorus segregation in α -iron, we studied the migration of a phosphorus atom in two types of symmetrical tilt grain boundaries ( Σ 3[1-10](111) and Σ 5[100](0-13) grain boundaries) using molecular dynamics simulations with an embedded atom method potential. The results revealed that, in the Σ 3 grain boundary, phosphorus atoms migrate three-dimensionally mainly in the form of interstitial atoms, whereas in the Σ 5 grain boundary, these atoms migrate one-dimensionally mainly via vacancy-atom exchanges. Moreover, de-trapping of phosphorus atoms and vacancies was investigated.

Graphical Abstract

1. Introduction

Previous studies have shown that phosphorus (P) reduces the cohesive energy of grain boundaries (GBs) in steels [1,2] and leads to GB embrittlement. The segregation of P atoms is promoted by the thermal and irradiation effect [3,4,5]. The resulting embrittlement is referred to as temper embrittlement and irradiation embrittlement [6,7,8,9]. A previous study has reported that the ductile-brittle transition temperature (DBTT) of nuclear reactor pressure vessel (RPV) steels increases during the service period [8]. These steels are exposed to high-temperature and high neutron irradiation environments, and hence the embrittlement is attributed to partly GB P segregation. The GB embrittlement increases the damage risk of RPVs and must be considered during the aging management of the nuclear reactors. Therefore, quantitative prediction of the GB P segregation under various thermal and irradiation conditions is crucial for preventing this embrittlement [10,11].
We have been developing a rate theory model for numerical estimation of the GB P segregation based on the models reported in [12,13]. The model employs reaction-diffusion equations for three types of point defects (vacancies, self-interstitial atoms, and P atoms). P atoms migrate by interacting with vacancies or self-interstitial atoms. The migration of vacancies and self-interstitial atoms is also affected by the P atoms. Consequently, the partial diffusion coefficients in these equations are necessary for modeling the migration process and are evaluated using the kinetic Monte Carlo (kMC) simulation. These simulations incorporate the transition rate between the different states comprising a P atom and a vacancy or a P atom and a self-interstitial atom. The transition rate is evaluated using the barrier energy obtained from first-principles calculations. The diffusion coefficient of each defect is determined analytically or through kMC simulations [14,15]. Moreover, the rate theory model incorporates the model of trapping and de-trapping P atoms at GBs, and therefore, GB P segregation evaluated by the model can be compared with experimental measurement [16]. The trapping process is incorporated into the model based on the result of molecular dynamics (MD) simulations, in which a pair consisting of a P atom and a self-interstitial atom or a P atom and a vacancy dissociates before reaching a GB [17,18]. However, an intuitive, simple model is used for the de-trapping process, and hence a more detailed model is necessary. For a detailed consideration of the physical process of de-trapping, the migration of a P atom in a Σ 3 [1-10](111) symmetrical tilt GB in α -iron (Fe) is examined using MD simulation [19]. However, owing to the abundance and diversity of GB types, obtaining a general understanding of the P migration in GBs and the P de-trapping process by considering only one GB type is difficult.
In this study, we analyzed a Σ 5 [100](0-13) GB and a Σ 3 [1-10](111) GB in α -Fe for MD simulation of P atom migration in these GBs and examined the effect of a vacancy on this migration. The simulation results obtained for the two types of GBs revealed some differences: P atoms migrate mainly via the interstitial mode in the Σ 3 GB and mainly via the vacancy mode in the Σ 5 GB. Moreover, the de-trapping phenomena of a P atom and a vacancy were investigated in these simulations.

2. Methods

The atomic models of the Σ 3 [1-10](111)GB and Σ 5 [100](0-13)GB of α -Fe (hereafter referred to as Σ 3 GB and Σ 5 GB, respectively) are shown in Figure 1. These GBs are symmetrical tilt GBs with comparatively large GB energy and large GB volume, as shown in Table 1. The figure shows a magnified view of the GB region considered in the simulation model (size and number of atoms are 42 Å × 97 Å × 49 Å, 14,689 for Σ 3 GB and 45 Å × 100 Å × 43 Å, 14,400 for Σ 5 GB). The model for the Σ 3 GB has been used in our previous studies [15,19]. The GB was set on the x-z plane at the center of the y-direction, and a vacuum region with a thickness of about 6 Å was set at both edges of the y-direction. The thickness of the vacuum region was chosen based on the cut-off length of the employed potential. In the figure, the light gray particle denotes the Fe atom occurring in the GB region that is detected by the common neighbor analysis [20]. The numbers in the figure show the segregation sites of a P atom used in this simulation. After structural relaxation of the atomic state, a P atom and a vacancy was placed at one of the segregation sites in each GB region. The time development of each system was analyzed using the MD code LAMMPS [21] with the widely used embedded atom method (EAM) potential [22], which is considered the best potential for dilute P–Fe systems [23]. The potential is built by adding the fitting data obtained by the first-principles calculations for more specific atomistic level configurations such as Fe bcc crystal and P-Fe systems with and without an interstitial atom and a vacancy. The atomic image was visualized by a tool called OVITO [24]. In the simulation, the atoms on both edges of x and z directions were fixed to suppress the thermal migration of GBs. The temperatures of 600 K, 700 K, and 800 K were used for observing P migration and 800 K to 1400 K for evaluating the migration barrier energy. The temperature of 600 K is close to the operating temperature of nuclear reactors, and the higher temperatures, at which P migration is more marked, were employed for examining the behavior and the mechanism of P migration in the GBs. Furthermore, a time step of 5 fs for the numerical integration was chosen to allow proper simulation of atomic migration for a long time at the simulation temperature.

3. Results and Discussion

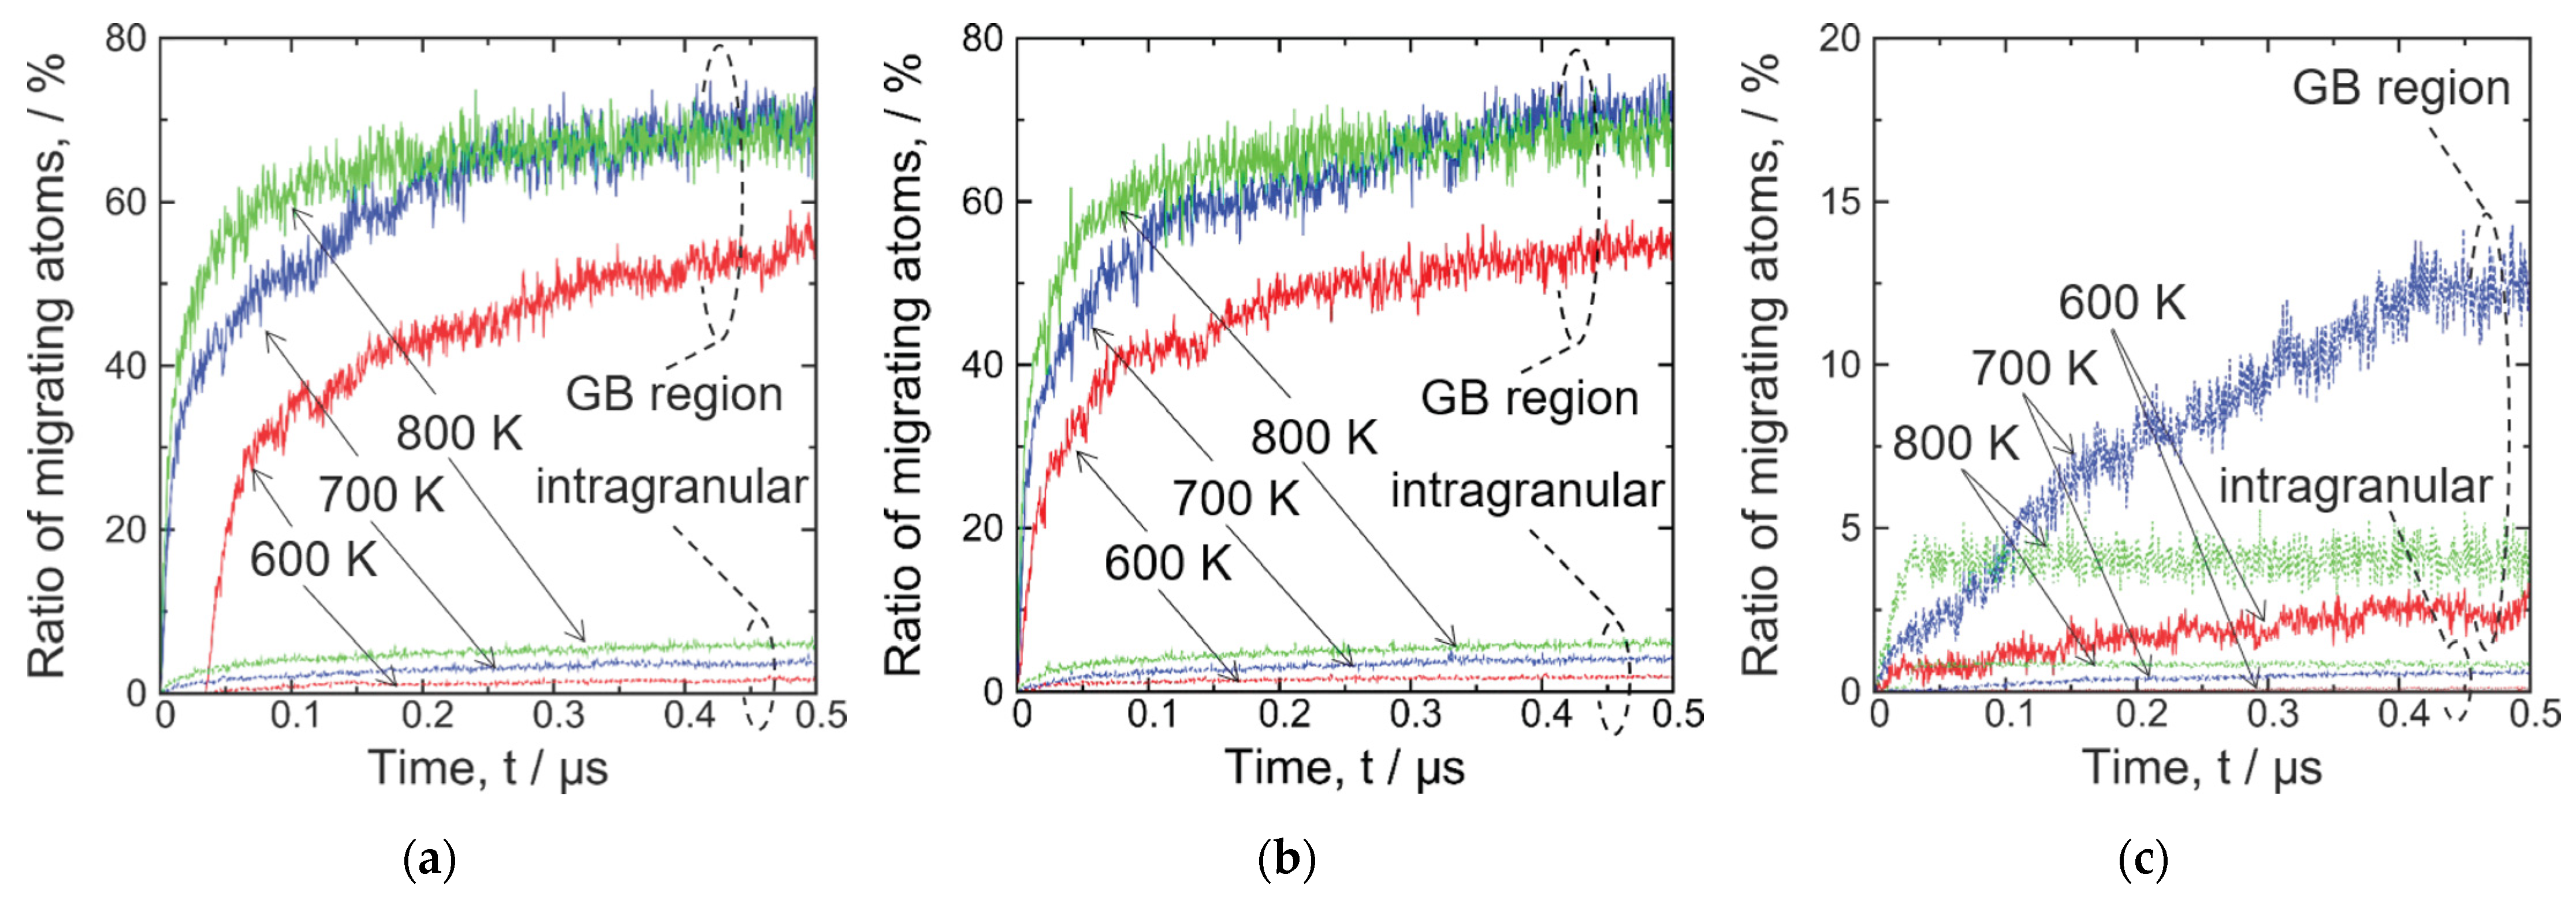
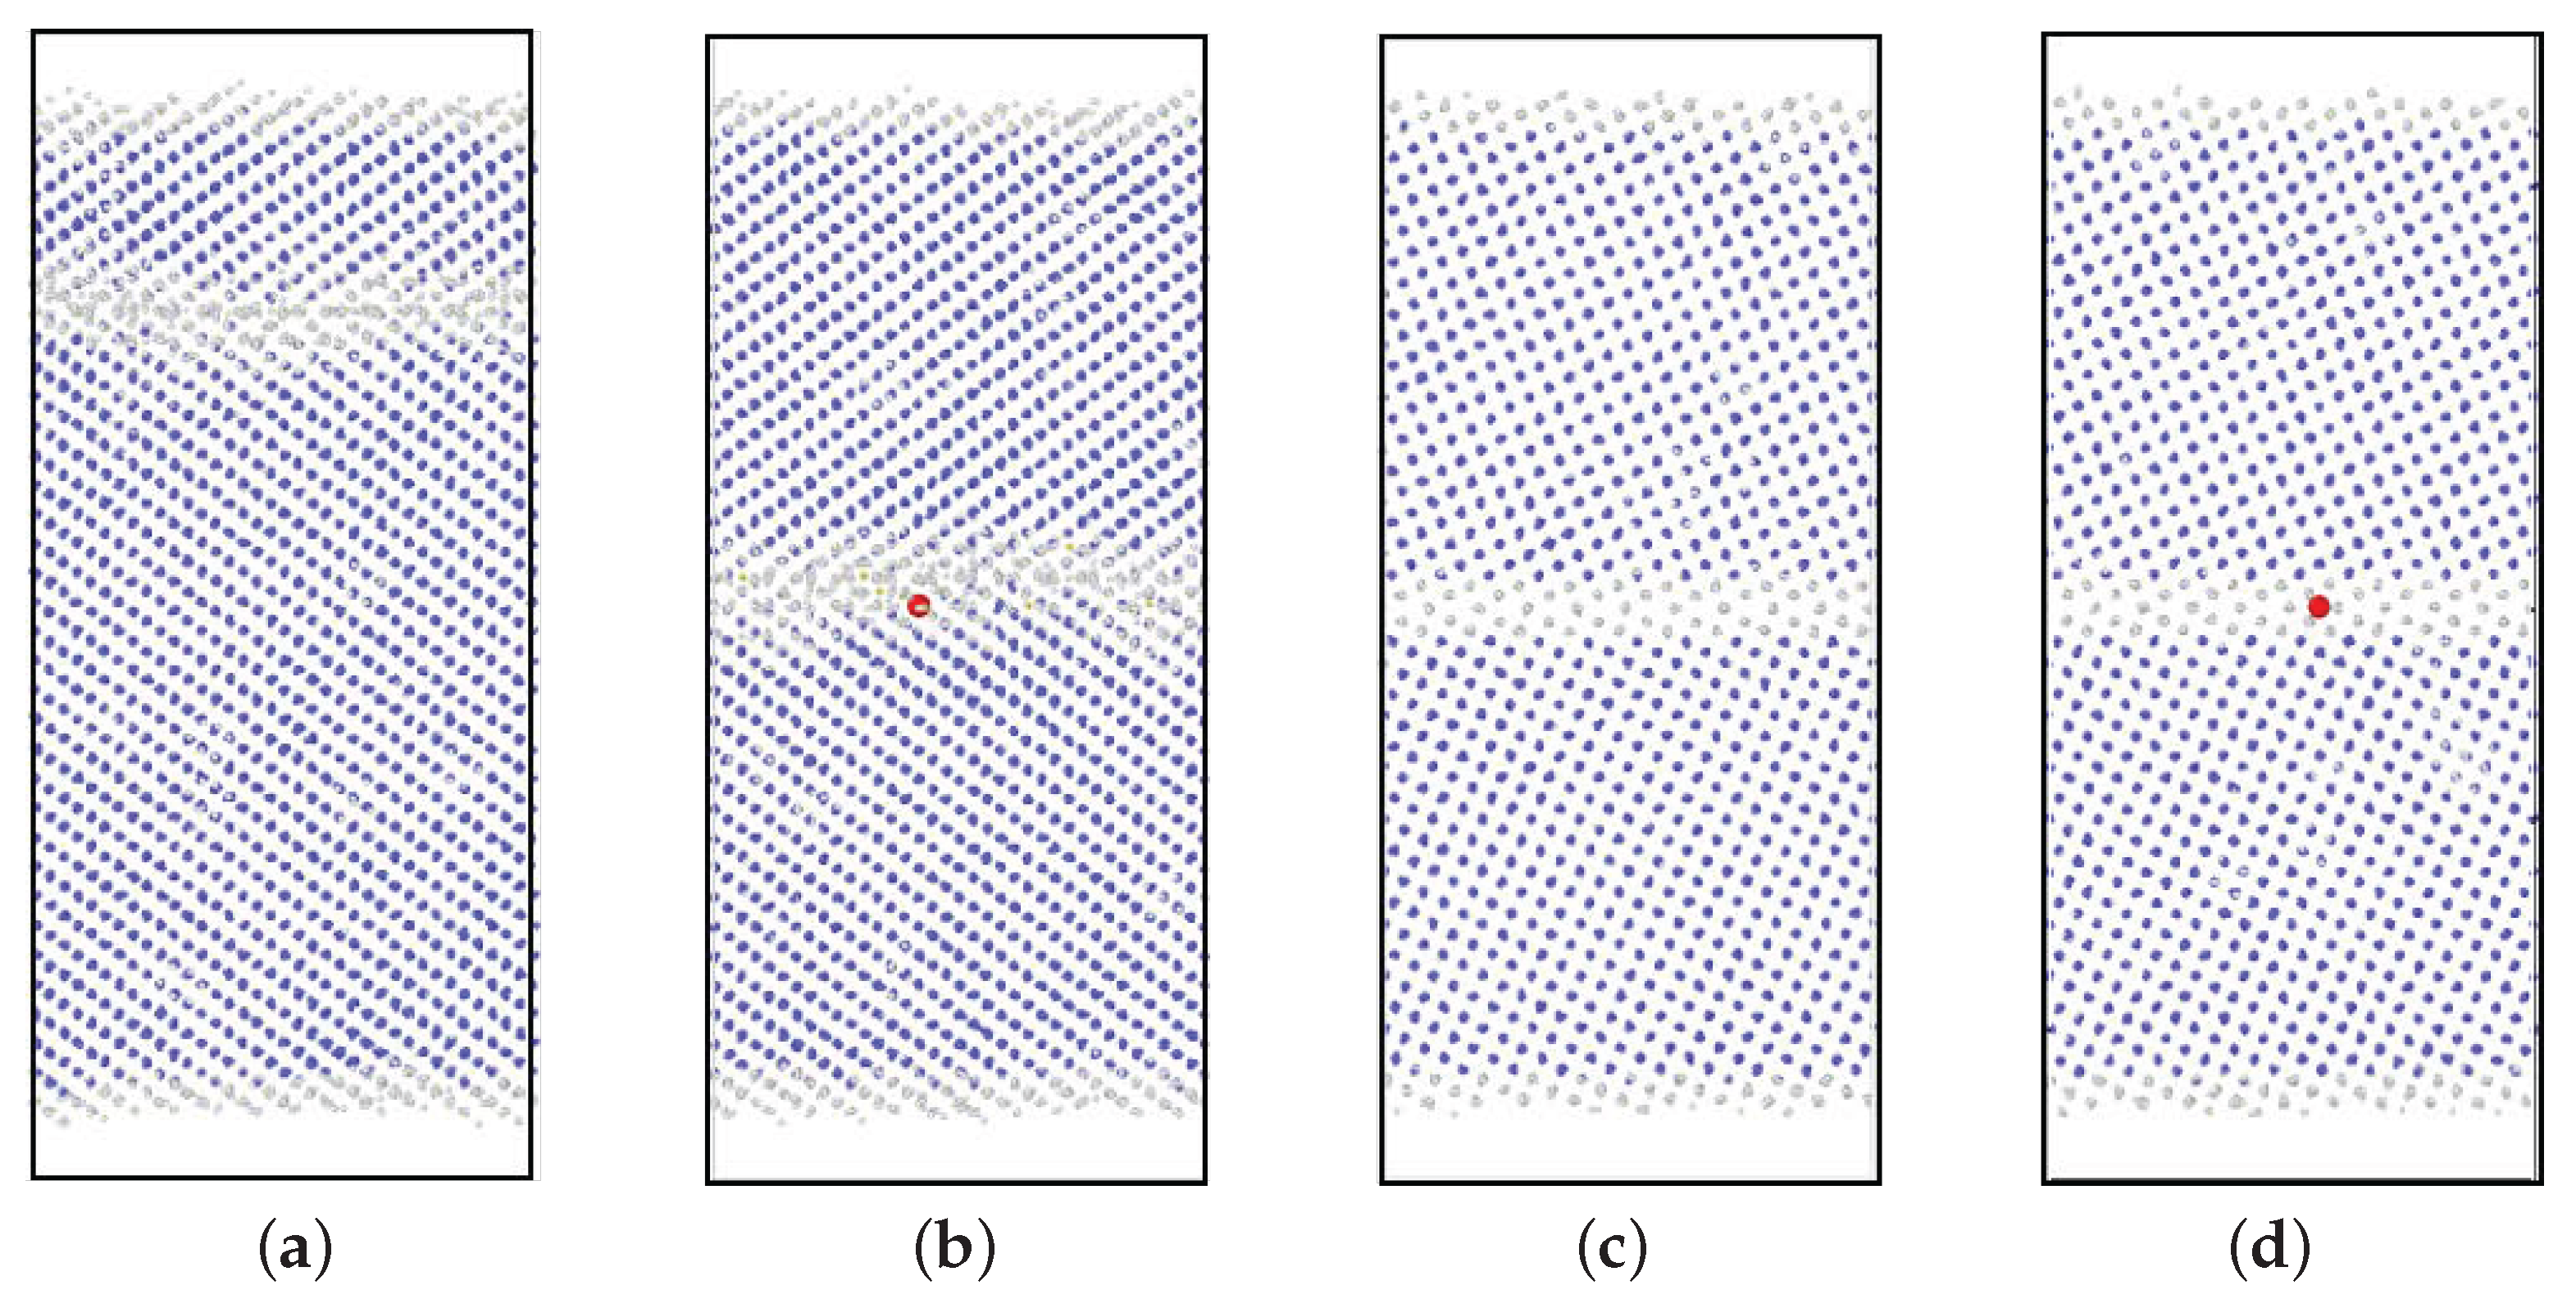
3.1. GBs without P Atoms

First, we examine the behavior of Fe atoms in the GB region without P atoms and take this as the reference scenario. Figure 2 shows the displacement of the Fe atoms. The red particles in the figure are the atoms that migrated more than one lattice unit. As shown in Figure 2a, the Fe atoms in the Σ 3 GB region migrate frequently (those near the GB region also migrate). However, the Fe atoms of the Σ 5 GB undergo only slight migration (Figure 2b). It is confirmed that the situation is the same at 800 K. It can be owing to that the atomic spacing differs between these two GBs: Atomic alignment in the former are loose, while those in the latter tight. We noticed that when a vacancy is added by removing a Fe atom of Site 1 to the Σ 5 GB (Figure 1b), a few Fe atoms around the vacancy migrate as shown in Figure 2c; thus, the vacancy-exchange mode of migration is possible in this GB.
Figure 3 shows the ratios of the number of migrating Fe atoms to the total number of Fe atoms (the GB and intragranular regions are both considered). Here Fe atoms returning to the position of less than one lattice unit from their initial site at a measurement time are not counted as migrating Fe atoms. The cases of Σ 3 GB with and without a vacancy, shown in Figure 3a,b, respectively do not show remarkable differences. The increase in the ratio of the migrating Fe atoms mitigates over time for both cases. The ratios for 700 K and 800 K become almost the same after time passes, but are significantly larger than that obtained for 600 K. Only the diagram with a vacancy is shown for the Σ 5 GB in Figure 3, because Fe atoms in this GB hardly migrate without a vacancy. As shown in Figure 3c, the ratio of migrating Fe atoms for Σ 5 GB with a vacancy is smaller than that of Σ 3 GB in general (note the smaller scale of the vertical axis in Figure 3c for the Σ 5 GB compared with that in Figure 3a,b for the Σ 3 GB). Moreover, for times greater than ∼0.1 μ s the ratio of migrating Fe atoms for 700 K is larger than that obtained for 800 K. This suggests that the increase in the number of migrating Fe atoms at 800 K stopped because of de-trapping of the vacancy from the GB region at about 0.03 μ s. The trajectory of the vacancy (Figure 4) confirms the occurrence of vacancy de-trapping.
These results suggest that in the Σ 3 GB, the added vacancy is absorbed in the GB region through the redistribution of atomic positions in this region. In the Σ 5 GB, the space corresponding to the added vacancy remains as a vacancy and migrates by exchanging the vacancy site with an Fe atom.

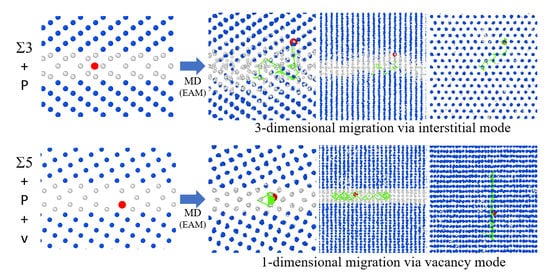
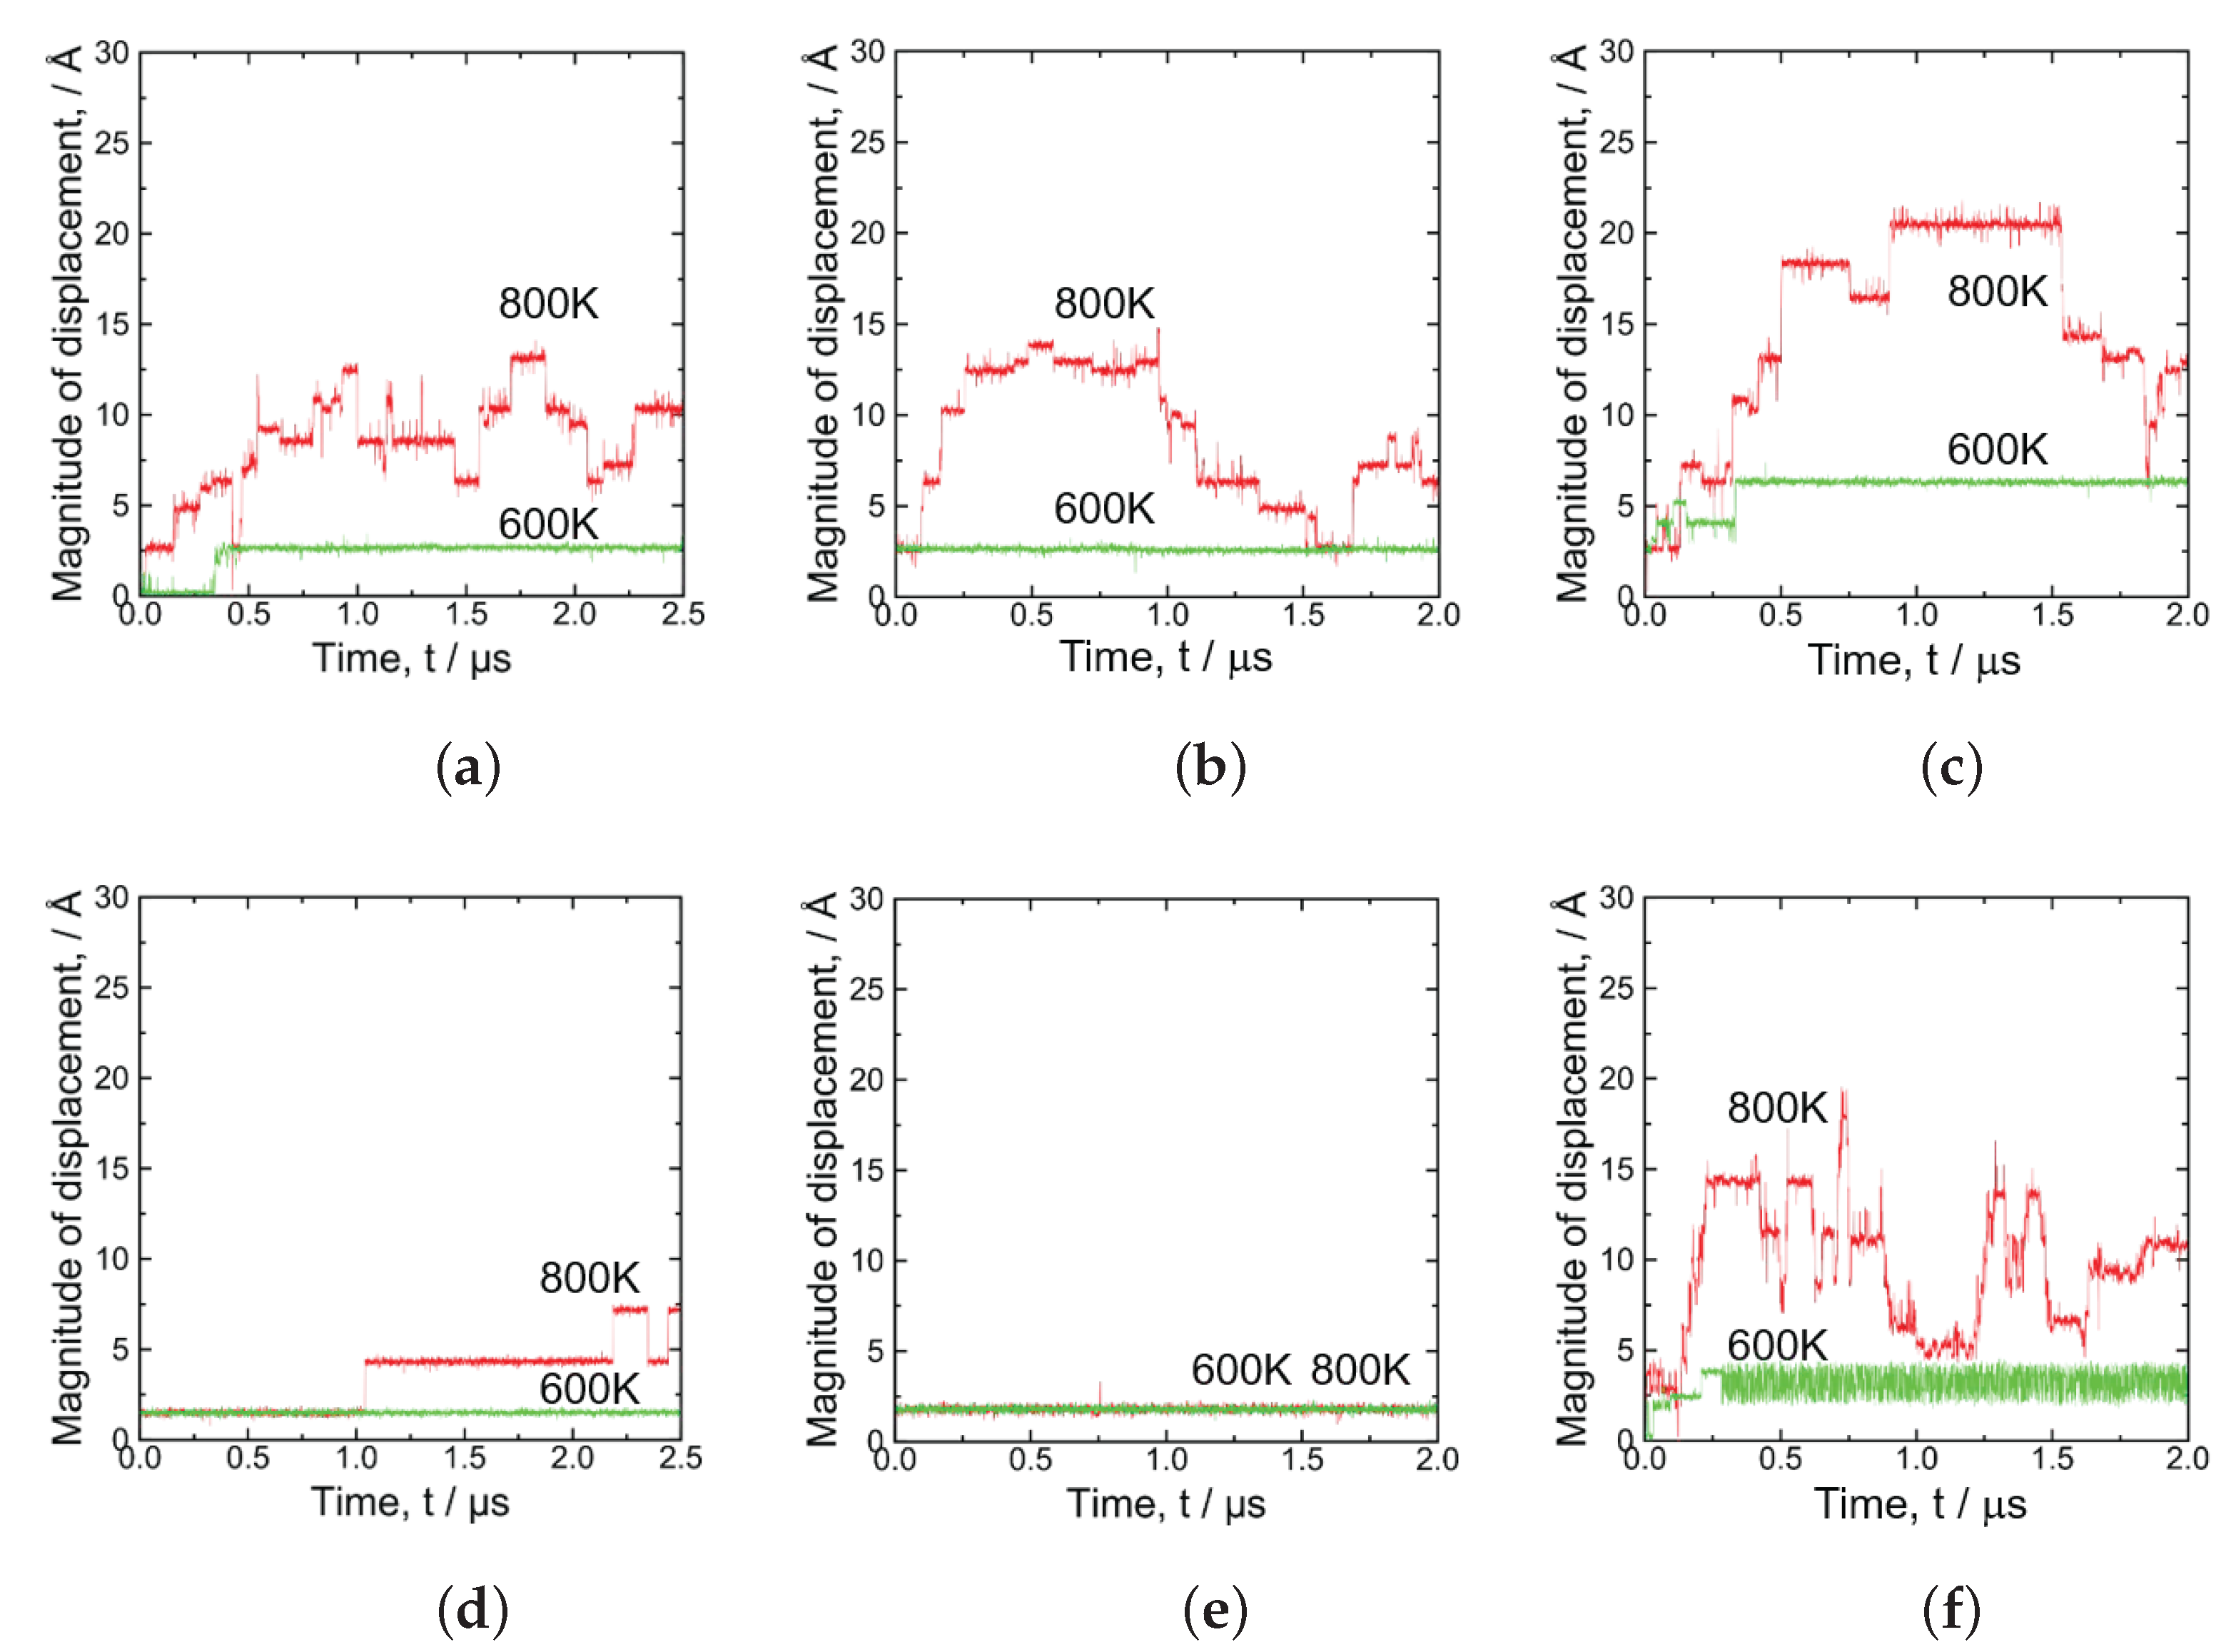
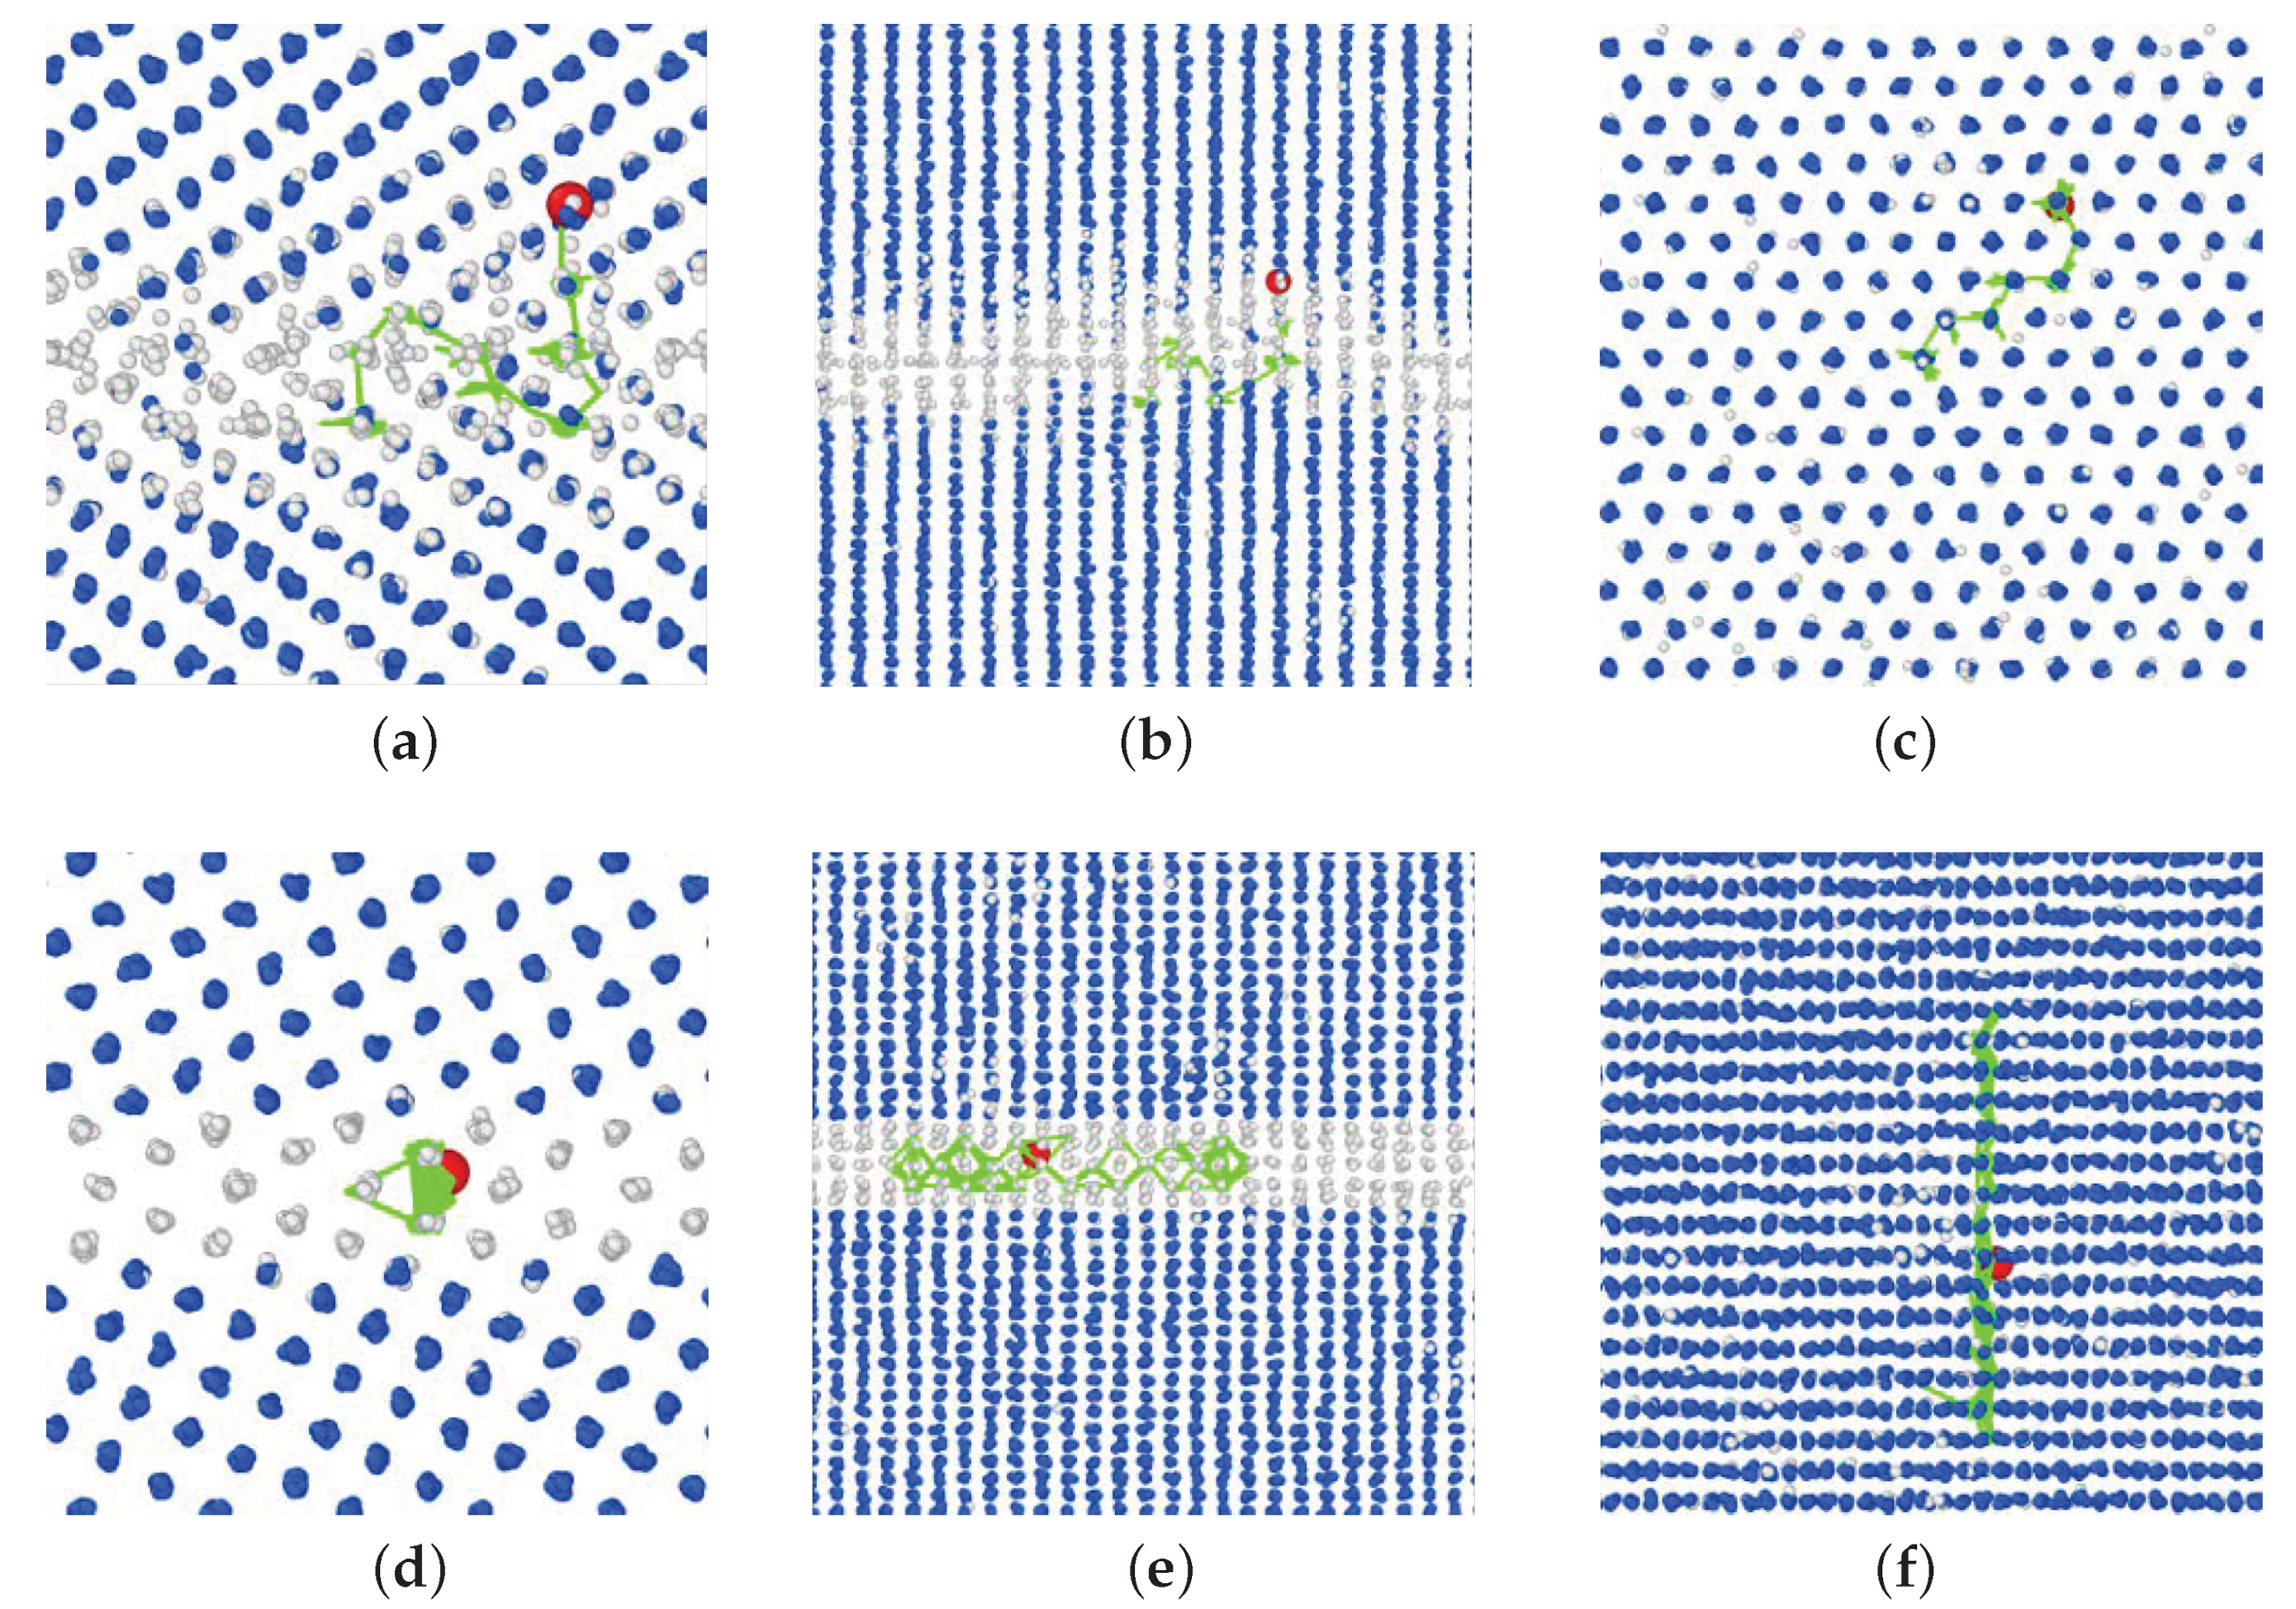
3.2. GBs with a P Atom

Next, we examine the migration of a P atom in the GB regions. According to first-principles calculations [26], the trapping energy of a P atom to GBs depends on segregation sites. In Figure 1, Site 0 is an interstitial site and all the other segregation sites are substitutional. The P trapping energy of each site evaluated from the first-principles calculations is shown in Table 2 for each GB associated with the energy determined from the molecular static (MS) simulations with the EAM potential. Despite certain discrepancies between the results from the first-principles calculation and the MS simulation, both methods reveal the same tendency; namely, the trapping energies of Site 0 and Site 2 are larger than that of Site 3, and the energy of Site 1 is the smallest. Thus, in this study, we focus on the cases where a P atom is placed at Site 0 and at Site 2, which are the most stable segregation sites.
Figure 5 shows the P migration behavior as the magnitude of displacement of a P atom from the initial position. According to the figure, the P atom initially at Site 2 of the case of the Σ 3 GB migrate frequently at a high temperature of 800 K, and barely migrates at a low temperature of 600 K (Figure 5b). When the P atom is inserted at the interstitial site (i.e., Site 0) or a vacancy is inserted at the nearest neighbor site of the substitutional P atom at Site 2, the atom started migrating even at the low temperature; however, the atom stops immediately (Figure 5a,c) in the Σ 3 GB. We observed that the stopped P atom remains at the position of a substitute site in both cases. In the Σ 5 GB without a vacancy, even at the high temperature, the migration of the P atom at Site 0 is less frequent than that in the Σ 3 GB (Figure 5d). No migration of the atom initially placed at Site 2 is observed at either temperature (Figure 5e). However, when a vacancy is initially created at a nearest neighbor site of this atom (Figure 5f), the atom migrates at 800 K and the migration is more frequent than the no vacancy case shown in Figure 5d. At 600 K, the P atom oscillates around the initial position by exchanging the site with a vacancy. The results suggest that P atoms in Σ 3 GB migrate mainly via the interstitial mode, while in the Σ 5 GB they do via the vacancy mode.
Figure 6 shows the trajectory of the P atom at 800 K for the case shown in Figure 5a,f. According to the figure, the P atom migrates through three-dimensional motion in the Σ 3 GB region and via one-dimensional motion (linearly along the z-direction, i.e., normal to the plane of Figure 2) in the Σ 5 GB region. In addition, Figure 6a shows that the P atom migrates outside of the GB region. The difference in P migration behavior between these two GBs can be attributed to the difference in the migration behavior of Fe atoms and of a vacancy described in the previous section.
We also analyzed the effect of a P atom on the migration of the GBs. For this analysis, some particular MD simulations are conducted, in which the atoms on both edges of the x and z directions are not stationary so that the GBs can migrate thermally. The results are shown in Figure 7. According to the figure, in the case without a P atom, the Σ 3 GB migrated in the upper direction whereas the Σ 5 GB migrates only slightly. However, Σ 3 GB region stays in the initial position when a P atom is placed in the GB region, indicating that P atoms suppress the thermal migration of this GB. It is because Fe atoms around the P atom prefer energetically the atomic arrangement of the GB region rather than that of the intragranular region. The results also suggest that the behavior of thermal migration is different even in GBs with similar large GB energy and GB volume.

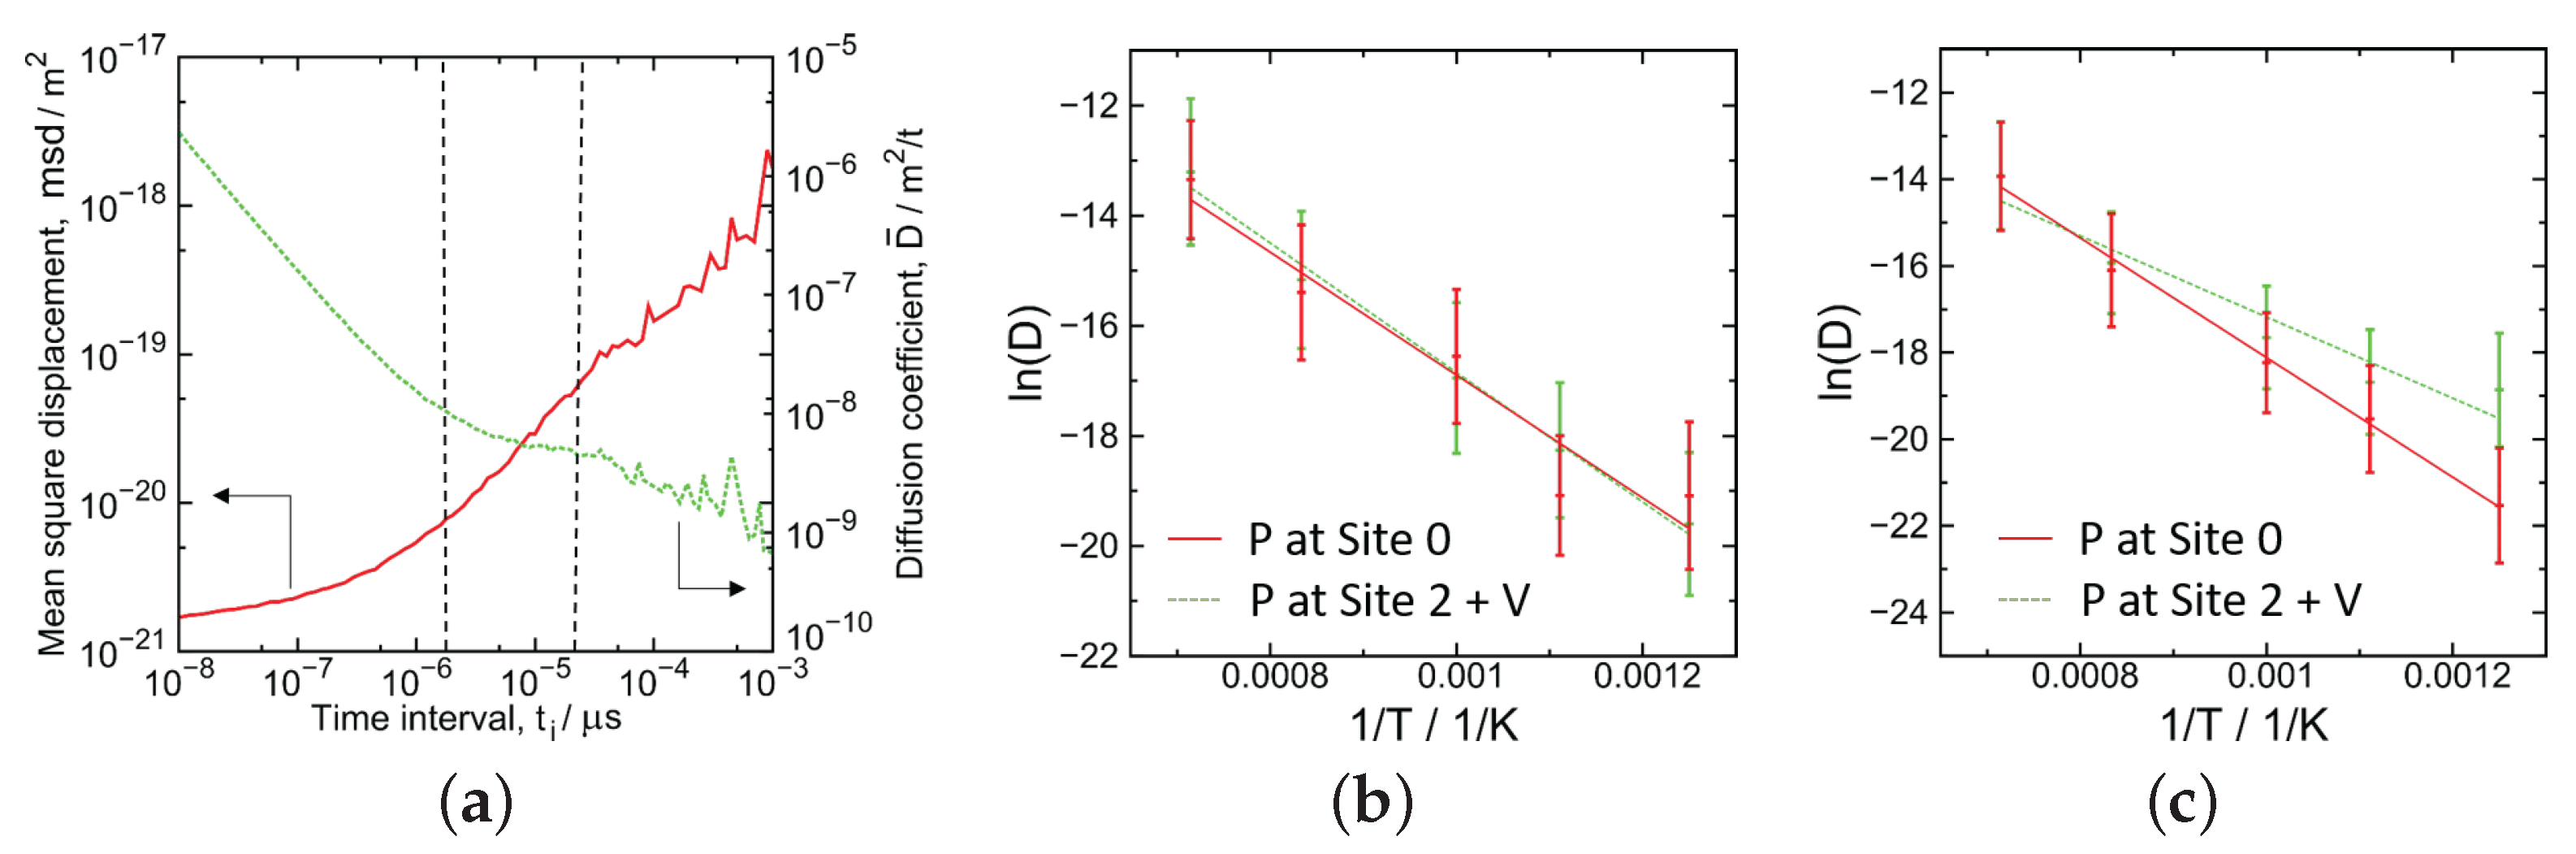
3.3. The Evaluation of Migration Barrier Energy

Based on a previously reported method [27], which is described briefly below, we evaluate the barrier energy for P diffusion in both GBs for the cases without and with a vacancy. The barrier energy is evaluated from the temperature dependence of the diffusion coefficient D. Generally, D can be evaluated from the mean square displacement, m s d as D = m s d / 6 t where t is the time for recording the P atom migration process. The accuracy of evaluation, however, is limited by the length of the MD simulation. Thus, to achieve a certain level of accuracy, one trajectory of a P atom in a simulation is equally divided into many strips indexed by i, and D i = m s d i / 6 t i is evaluated for each strip. We obtain D ¯ as the average of D i . Here, if the t i is too long, then the sample number of D i is not enough; if it is too short, then the value of D i includes too much statistical uncertainty. Thus, as shown in Figure 8a, the value of D ¯ depends on the strip length. However, we observe that D ¯ becomes nearly constant when the relation between t i and m s d i is linear. Therefore, we evaluate the diffusion coefficient in the range of values corresponding to this linear relationship. The barrier energy for the obtained D ¯ is evaluated for temperatures ranging from 800 K to 1400 K in the Arrhenius plot as shown in Figure 8b,c. The evaluated diffusion barrier energy is also shown in Table 3. According to the table, for the Σ 3 GB, the P barrier energy started from a substitutional site (Site 2) with a vacancy is the almost same as that started from the interstitial site (Site 0). The result can indicate that the inserted vacancy disappears through redistribution of atomic positions in the Σ 3 GB region, and P atoms migrate by the interstitial mode, as described in the previous section. For the Σ 5 GB, the barrier energy associated with vacancy insertion at a nearest neighbor sites of a substitutional P atom is smaller than that of the interstitial P atom. Thus, unlike Σ 3 GB, the result can indicate that the added vacancy migrates in the form of a vacancy and P atoms migrate via the vacancy mode in the GB. To recapitulate, the migration barriers derived here reflect the different modes of P migration in the different GBs.

4. Concluding Remarks
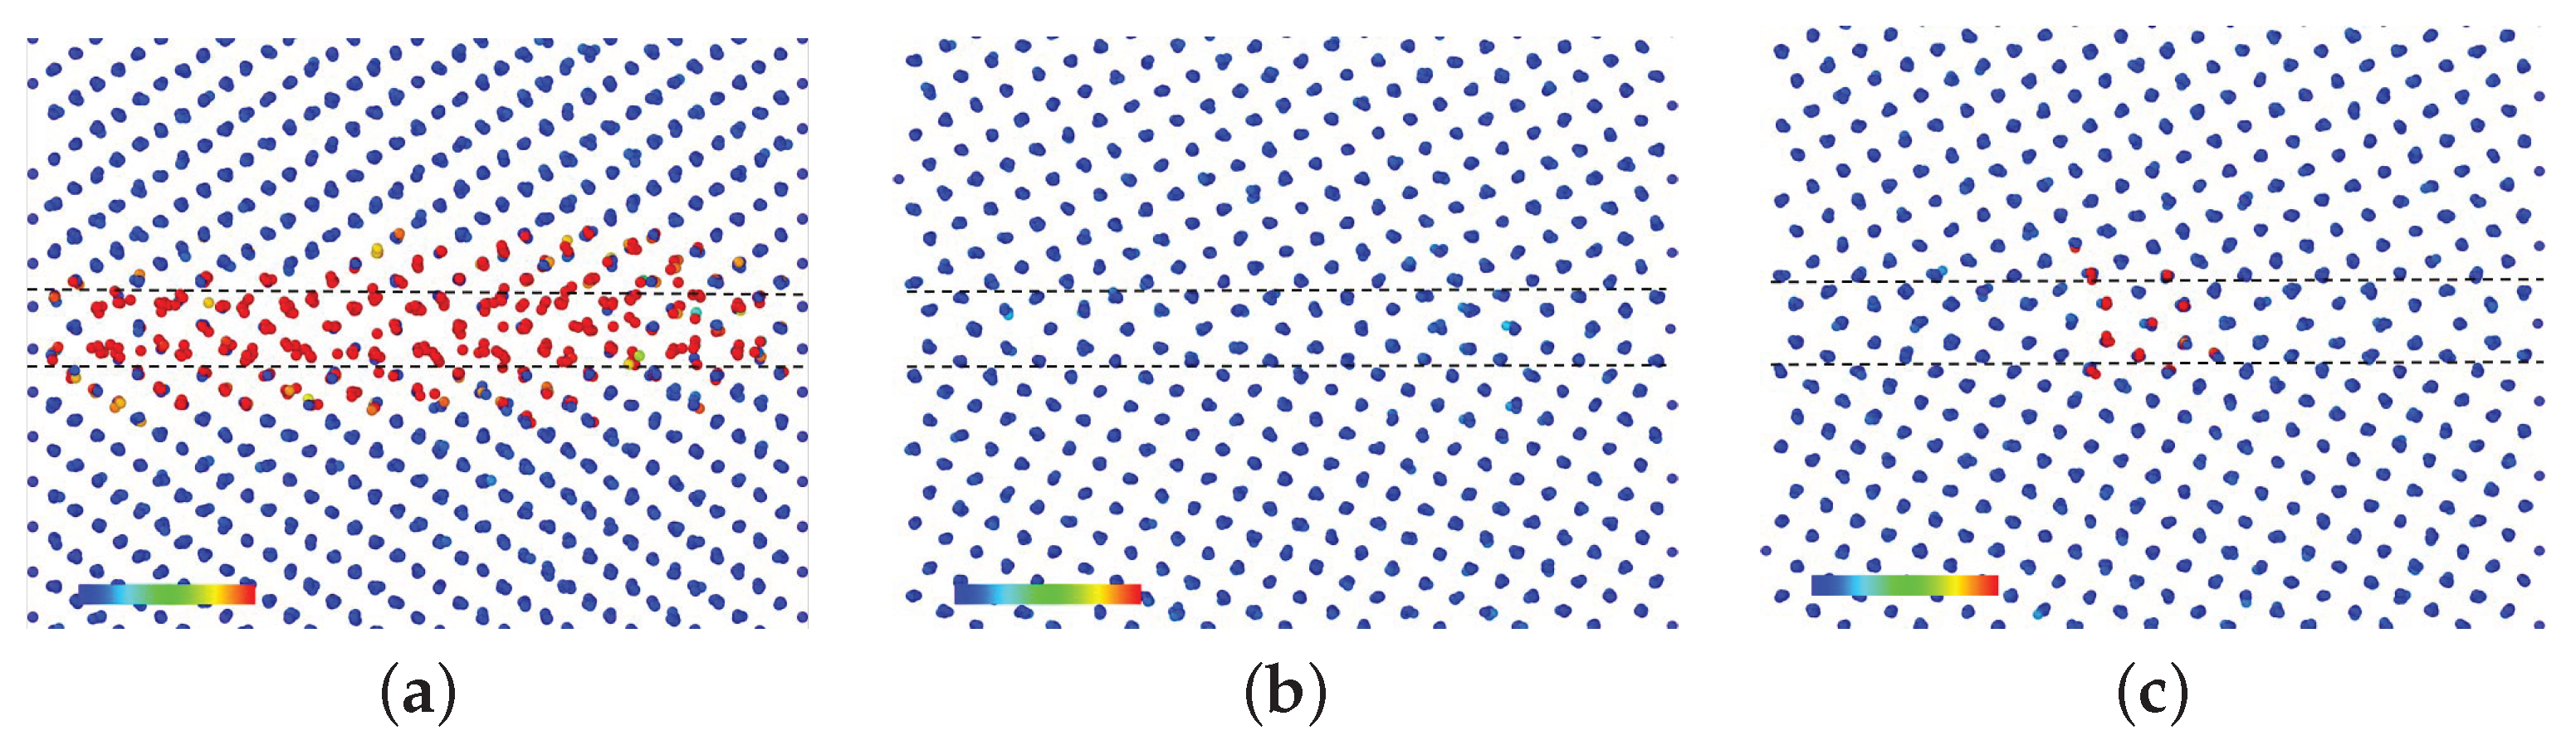
We investigated the P atom migration in two kinds of symmetrical tilt GBs, i.e., Σ 3[1-10](111) GB and Σ 5[100](0-13) GB, of α -Fe using MD simulations with an EAM potential. The effect of vacancy addition on P migration was also examined. In addition, the migration behavior of Fe atoms in the region of these two GBs without P atoms was investigated. The simulation results obtained are summarized as follows:
  • In the Σ 3 GB, Fe atoms migrated at 600 K, 700 K, and 800 K, and the addition of a vacancy has no effect on the migration behavior at these temperatures. Moreover, in the Σ 5 GB, no Fe atom migration was observed even at 800 K; migration occurs when a vacancy was added, but was less frequent than that in the case of Σ 3 GB.
  • The de-trapping of a vacancy from the GB region of the Σ 5 GB was observed at 800 K.
  • The P atom migrated frequently regardless of the initial site, that is substitutional or interstitial, in the Σ 3 GB at 800 K. Moreover, in the Σ 5 GB, the P migration was observed when a vacancy was placed at one of the nearest neighbor sites of the substitutional P atom at 800 K. In addition, the P atom migration was a one-dimensional motion in the Σ 5 GB and a three-dimensional motion in the Σ 3 GB.
  • In the Σ 3 GB, the de-trapping of the P atom from the GB region was observed at 800 K.
  • The Σ 3 GB undergoes significant thermal migration, which is suppressed by a P atom, while the Σ 5 GB undergoes only slight thermal migration.
  • The diffusion barrier energy of a P atom started from the interstitial site was compared with that of a P atom starting from a substitutional site with a vacancy nearby; the evaluated value of both cases was almost the same in the case of Σ 3 GB, while in the case of Σ 5 GB, the value of the former was larger than that of the latter.
From these results, we can consider that vacancies inserted in the Σ 3 GB disappear by redistributing the atomic positions in the GB region and P atoms migrate mainly by the interstitial mode. However, the form of the vacancy in the Σ 5 GB is maintained and the vacancy migrates as a vacancy, and thus P atoms migrate mainly by the vacancy mode. In addition, since the de-trapping of the P atom and of a vacancy was observed, in the rate theory model of GB P segregation, the de-trapping process of P atoms at GBs should be considered, and it is necessary to consider GBs not only as the vacancy sink but also as the vacancy source.

Author Contributions

Conceptualization and funding acquisition, K.-i.E. and T.S.; formal analysis, writing—original draft preparation, K.-i.E.; supervision, writing—review and editing, T.S. All authors have read and agreed to the published version of the manuscript.

Funding

This research was partly funded by JSPS KAKENHI Grant Number JP15K06429 and JP20H00359.

Institutional Review Board Statement

Not applicable.

Informed Consent Statement

Not applicable.

Data Availability Statement

This article has no additional data. All data included in this study are available upon request by contact with the corresponding author.

Acknowledgments

The authors thank T. Tsuru of JAEA for providing GB atomic model. The MD simulations and first-principles calculations were performed on the supercomputer system in Japan Atomic Energy Agency.

Conflicts of Interest

The authors declare no conflict of interest. The funders had no role in the design of the study; in the collection, analyses, or interpretation of data; in the writing of the manuscript, or in the decision to publish the results.

References

  1. Kameda, J.; McMahon, C. The effects of Sb, Sn, and P on the strength of grain boundaries in a Ni-Cr Steel. Metall. Trans. A 1981, 12, 31–37. [Google Scholar] [CrossRef]
  2. Lejček, P.; Šob, M.; Paidar, V. Interfacial segregation and grain boundary embrittlement: An overview and critical assessment of experimental data and calculated results. Prog. Mater. Sci. 2017, 87, 83–139. [Google Scholar] [CrossRef]
  3. Druce, S.; Gage, G.; Jordan, G. Effect of ageing on properties of pressure vessel steels. Acta Metall. 1986, 34, 641–652. [Google Scholar] [CrossRef]
  4. Kameda, J.; Bloomer, T. Kinetics of grain-boundary segregation and desegregation of sulfur and phosphorus during post-irradiation annealing. Acta Mater. 1999, 47, 893–903. [Google Scholar] [CrossRef]
  5. Nishiyama, Y.; Onizawa, K.; Suzuki, M.; Anderegg, J.; Nagai, Y.; Toyama, T.; Hasegawa, M.; Kameda, J. Effects of neutron-irradiation-induced intergranular phosphorus segregation and hardening on embrittlement in reactor pressure vessel steels. Acta Mater. 2008, 56, 4510–4521. [Google Scholar] [CrossRef]
  6. McMahon, C. Temper brittleness—An interpretive review. In Temper Embrittlement in Steel; ASTM International: West Conshohocken, PA, USA, 1968; pp. 127–167. [Google Scholar]
  7. Horn, R.; Ritchie, R.O. Mechanisms of tempered martensite embrittlement in low alloy steels. Metall. Trans. A 1978, 9, 1039–1053. [Google Scholar] [CrossRef]
  8. English, C.A.; Ortner, S.R.; Gage, G.; Server, W.L.; Rosinski, S.T. Review of phosphorus segregation and intergranular embrittlement in reactor pressure vessel steels. In Effects of Radiation on Materials: 20th International Symposium; ASTM International: West Conshohocken, PA, USA, 2001; pp. 151–173. [Google Scholar]
  9. Odette, G.; Lucas, G. Embrittlement of nuclear reactor pressure vessels. Jom 2001, 53, 18–22. [Google Scholar] [CrossRef]
  10. Druce, S.G.; English, C.A.; Foreman, A.J.; McElroy, R.J.; Vatter, I.A.; Bolton, C.J.; Buswell, J.T.; Jones, R.B. The modelling of irradiation-enhanced phosphorus segregation in neutron irradiated reactor pressure vessel submerged-arc welds. In Effects of Radiation on Materials: 17th International Symposium; ASTM International: West Conshohocken, PA, USA, 1996; pp. 119–137. [Google Scholar]
  11. Faulkner, R.G.; Little, E.A. Predictions of Interfacial Phosphorus Segregation in Irradiated Ferritic Steels. In Effects of Radiation on Materials: Sixteenth International Symposium; ASTM International: West Conshohocken, PA, USA, 1994; pp. 54–65. [Google Scholar]
  12. Murphy, S.; Perks, J. Analysis of phosphorus segregation in ion-irradiated nickel. J. Nucl. Mater. 1990, 171, 360–372. [Google Scholar] [CrossRef]
  13. Barashev, A. Segregation of phosphorus atoms to grain boundaries in ferritic steels under neutron irradiation. Philos. Mag. Lett. 2002, 82, 323–332. [Google Scholar] [CrossRef]
  14. Ebihara, K.; Suzudo, T.; Yamaguchi, M.; Nishiyama, Y. Introduction of vacancy drag effect to first-principles-based rate theory model for irradiation-induced grain-boundary phosphorus segregation. J. Nucl. Mater. 2013, 440, 627–632. [Google Scholar] [CrossRef]
  15. Ebihara, K.; Suzudo, T.; Yamaguchi, M. Modeling of Phosphorus Transport by Interstitial Dumbbell in α-Iron Using First-Principles-Based Kinetic Monte Carlo. Mater. Trans. 2017, 58, 26–32. [Google Scholar] [CrossRef] [Green Version]
  16. Hata, K.; Takamizawa, H.; Hojo, T.; Ebihara, K.; Nishiyama, Y.; Nagai, Y. Grain-boundary phosphorus segregation in highly neutron-irradiated reactor pressure vessel steels and its effect on irradiation embrittlement. J. Nucl. Mater. 2021, 543, 152564. [Google Scholar] [CrossRef]
  17. Ebihara, K.; Suzudo, T. Atomistic simulation of phosphorus segregation to Σ3 (111) symmetrical tilt grain boundary in α-iron. Model. Simul. Mater. Sci. Eng. 2018, 26, 065005. [Google Scholar] [CrossRef]
  18. Azeem, M.M.; Wang, Q.; Zhang, Y.; Liu, S.; Zubair, M. Effect of Grain Boundary on Diffusion of P in Alpha-Fe: A Molecular Dynamics Study. Front. Phys. 2019, 7, 97. [Google Scholar] [CrossRef] [Green Version]
  19. Ebihara, K.; Suzudo, T. Molecular Dynamics Simulations of Phosphorus Migration in a Grain Boundary of α-Iron. In TMS 2020 149th Annual Meeting & Exhibition Supplemental Proceedings; Springer: Cham, Switzerland, 2020; pp. 995–1002. [Google Scholar]
  20. Honeycutt, J.D.; Andersen, H.C. Molecular dynamics study of melting and freezing of small Lennard-Jones clusters. J. Phys. Chem. 1987, 91, 4950–4963. [Google Scholar] [CrossRef]
  21. Plimpton, S. Fast Parallel Algorithms for Short-Range Molecular Dynamics. J. Comp. Phys. 1995, 117, 1–19. [Google Scholar] [CrossRef] [Green Version]
  22. Ackland, G.J.; Mendelev, M.I.; Srolovitz, D.J.; Han, S.; Barashev, A. Development of an interatomic potential for phosphorus impurities in α-iron. J. Phys. Condens. Mater. 2004, 16, S2629–S2642. [Google Scholar] [CrossRef]
  23. Malerba, L.; Marinica, M.C.; Anento, N.; Björkas, C.; Nguyen, H.; Domain, C.; Djurabekova, F.; Olsson, P.; Nordlund, K.; Serra, A.; et al. Comparison of empirical interatomic potentials for iron applied to radiation damage studies. J. Nucl. Mater. 2010, 406, 19–38. [Google Scholar] [CrossRef]
  24. Stukowski, A. Visualization and analysis of atomistic simulation data with OVITO—The Open Visualization Tool. Model. Simul. Mater. Sci. Eng. 2010, 18, 015012-1-7. [Google Scholar] [CrossRef]
  25. Suzudo, T.; Yamaguchi, M. Simulation of He embrittlement at grain boundaries in bcc transition metals. J. Nucl. Mater. 2015, 465, 695–701. [Google Scholar] [CrossRef]
  26. Yamaguchi, M.; Nishiyama, Y.; Kaburaki, H. Decohesion of iron grain boundaries by sulfur or phosphorous segregation: First-principles calculations. Phys. Rev. B 2007, 76, 035418. [Google Scholar] [CrossRef]
  27. Gao, F.; Heinisch, H.; Kurtz, R.J. Diffusion of He interstitials in grain boundaries in α-Fe. J. Nucl. Mater. 2006, 351, 133–140. [Google Scholar] [CrossRef]
Figure 1. Magnified view of (a) Σ 3 and (b) Σ 5 GB regions. The horizontal and the vertical direction are the x- and the y-direction, respectively. The direction perpendicular to the paper surface is the z-direction. The light gray particles represent Fe atoms in the GB region and the blue particles are the other Fe atoms. The numbers (0–3) in the figure shows P segregation sites used in the simulation.
Metals 12 00662 g001
Figure 2. The behavior of Fe atoms at 600 K for (a) Σ 3 GB, (b) Σ 5 GB, and (c) the case of Σ 5 GB with a vacancy: Each figure shows the atomic state at 0.5 μ s. The dashed lines are the boundaries of the initial GB region. The color legend represents the migration distance; the red color means the migration of more than one lattice unit.
Metals 12 00662 g002
Figure 3. Time evolution of the ratio of migrating Fe atoms to the total Fe atoms in the GB and intragranular regions (a) for Σ 3 GB, (b) for Σ 3 GB with a vacancy, and (c) for Σ 5 GB with a vacancy: For each GB case, three temperatures, i.e., 600 K, 700 K, and 800 K, were used.
Metals 12 00662 g003
Figure 4. A vacancy de-trapped from Σ 5 GB at 800 K: The vacancy migration is represented by showing the only Fe atoms which migrated more than one lattice unit because these atoms migrate by exchanging a site with a vacancy. The dashed lines represent the boundaries of the initial GB region.
Metals 12 00662 g004
Figure 5. Magnitude of P atom displacement (ac) for Σ 3 GB and (df) for Σ 5 at 600 K and 800 K: The left graphs (a,d) show the cases of placing a P atom at Site 0; the center ones (b,e) are for the cases of placing a P atom at Site 2; the right graphs (c,f) are for the cases of inserting a vacancy at the nearest neighbor site of the P atom at Site 2.
Metals 12 00662 g005
Figure 6. Trajectory of P atom (ac) for the case of a P atom put at Site 0 in Σ 3 GB (Figure 5a) and (df) for the case of a vacancy put at the nearest neighbor site of the P atom at Site 2 in Σ 5 GB (Figure 5f): The case of 800 K is shown for both GBs. The left graphs (a,d) show the front view that is the x-y plane, the centers (b,e) are the side view that is the y-z plane, and the right is the top view that is x-z plane. The large red particle is the P atom at the last step. The color of Fe atoms is the same meaning as Figure 1. The green line shows the trajectory of the P atom.
Metals 12 00662 g006
Figure 7. Effect of a P atom on the thermal migration behavior (a,b) of Σ 3 GB and (c,d) of Σ 5 GB at 800 K: These figures show the atomic state at 2.8 × 10 2 μ s. The meaning of the particle’s color is the same as that in the Figure 6 except the particles in the top and bottom parts. These parts are the surface region because the vacuum region was set at the top and the bottom of the simulation region.
Metals 12 00662 g007
Figure 8. (a) The mean square displacement m s d and D ¯ as a function of the strip length t i in the case of Σ 3 GB with a P atom at Site 0 at 800 K: The vertical dashed lines shows the range where D ¯ is obtained by averaging D i . Arrhenius plot (b) for Σ 3 GB and (c) for Σ 5 GB: The cases of a P atom at Site 0 and of a P atom at Site 2 with a vacancy at its nearest neighbor site are shown. V means vacancy. The error bar is the variance in averaging D i .
Metals 12 00662 g008
Table 1. GB energy and GB volume [25].
GBEnergy [ J / m 3 ]Volume [ 10 11 m 3 /m 2 ]
Σ 3 1.303.08
Σ 5 1.012.87
Table 2. P trapping energy of both GBs: DFT and EAM means the first-principles calculation and the MS simulation with the EAM potential, respectively. The DFT value of Σ 3 GB is cited from the paper [26] and the others were obtained in this work.
[eV]
GBMethodSite 0Site 1Site 2Site 3
Σ 3 DFT0.840.041.090.40
EAM0.550.221.170.44
Σ 5 DFT1.08−0.0750.790.25
EAM0.89−0.0770.690.28
Table 3. The evaluated barrier energy for P diffusion: The values in the parentheses are the fitting error in the Arrhenius plot.
                          [eV]
GBP at Site 0P at Site 2 with a Vacancy
Σ 30.96 (±0.15)0.94 (±0.05)
Σ 51.49 (±0.08)0.99 (±0.26)
Publisher’s Note: MDPI stays neutral with regard to jurisdictional claims in published maps and institutional affiliations.

