1. Introduction
Ductile cast iron alloyed with silicon (
Si) and molybdenum (
Mo), are often referred to as
SiMo ductile irons and are widely used for high-temperature automotive components, such as exhaust manifolds, turbine housing, and furnace applications [
1,
2]. These applications require oxidation resistance during static high temperature exposure in oxidizing environments in addition to resistance to develop cracks during thermal cycling in transient time-temperature-stress conditions [
3].
During extended high temperature service conditions, the physical, chemical, and mechanical properties of
SiMo ductile iron are challenged. Three main factors influence the cast structure of ductile iron, which include chemical composition, melt inoculation, and cooling rate. The cooling rate during solidification is primarily determined by casting section size, pouring temperature, and the ability of the mold material to absorb the heat. Increasing the cooling rate significantly refines the primary precipitated phases, including austenite dendrites and graphite nodules in ductile iron. A “micro-structural dispersity” term is used to describe the heterogeneity of sizes of structural constituencies within the microstructure. For example, increasing the casting wall thickness from 3 to 15 mm can decrease the cooling rate from 80 °C/s to 2–5 °C/s and also reduce the graphite nodule count from 1700 nodules/mm
2 to fewer than 100 nodules/mm
2 [
4]. Such changes in micro-structural dispersity have a significant effect on room temperature mechanical properties, including a decrease in tensile strength decreasefrom 850 MPa to 500 MPa and a drop of elongation from 20% to 5%. The effect of cooling rate on graphite nodule count,
Mo segregation, and amount of pearlite within
SiMo ductile iron castings with wall thicknesses varies from 3 mm to 25 mm has been previously studied [
5]. These studies demonstrated that increasing graphite nodule count simultaneously improved strength and ductility of ductile iron during tensile unidirectional testing; however, the material could have different responses on changing stress triaxiality, which takes place during a typical engine stop/start cycle [
6]. In another study [
7], four ferritic ductile irons with different graphite nodule interparticle spacings were tested, and the results were analyzed in terms of the local triaxiality ratio. They determined that the high local triaxiality ratio lowered ductility in the material.
Although the brittleness of ferritic ductile iron at elevated temperatures has been studied by many authors [
8,
9], it is still not completely understood. The authors of [
8] suggested that the minimum ductility of ferritic ductile iron at 400 °C was a direct result of intergranular fracture influenced by dynamic strain aging in addition to a triaxial stress field. The authors of [
9] also stated that the intermediate temperature embrittlement of ferrite ductile iron depends on the triaxial stress field around the graphite nodules and could be eliminated by decreasing the ferrite grain size. An alternative hypothesis of elevated temperature brittleness considered the effect of impurity segregation on the fracture modes [
10] and revealed that it depended on the
Mg to
P concentration ratio rather than graphite nodule dispersity. Experimental results indicate that the thermal fatigue crack resistance of
SiMo ductile iron decreases with increasing residual magnesium content. The major path of crack propagation is generally along the ferritic grain boundaries, which is the location of
MgO inclusions agglomerating together. However, it has been shown that dynamic recrystallization of the ferrite grains occurs when the thermal cycle exceeds a certain number after testing at 800 °C, which suppresses the initiation and propagation of thermal fatigue cracking [
11]. Local formation of an oxide layer at the tip of the fatigue crack could change the critical cycle number. Recent work [
12] included this phenomenon in lifetime prediction during thermal fatigue considering additional parameters of the structural dispersity.
In addition to graphite nodules dispersity, there are several other structural factors in
SiMo ductile iron related to casting cooling rate and casting technology. Most exhaust manifold wall thicknesses can vary between 4 and 6 mm. The material is processed free of carbide (cementite) structures. To minimize cost, manifolds are primarily used with as-cast surfaces; therefore, it is important to evaluate the effect of the casting skin on mechanical properties and to determine high temperature oxidation resistance. At room temperature, the low cycle fatigue endurance limit depends on the location of as-cast vs. machined surfaces. It has been shown that when the machined surface was exposed to tensile stress under fatigue, a significant increase of the endurance limit was achieved due to the elimination of cast surface defects [
13]. Another study demonstrated the effect of casting skin on room temperature fatigue properties and showed that as-cast surfaces exhibited a significant reduction in fatigue strength because of
Mg depletion [
14]. It was also found that shot blasting improved the fatigue limit because of surface work hardening [
15]. However, the effect of as-cast surface on static high temperature oxidation and thermo-cycling behavior has not been previously investigated.
The sphericity of graphite particles is an important factor in high temperature performance of cast irons, particularly with the effect of graphite shape on the depth of the decarburized (DeC) layer. During decarburization, the resulting pores in the near-surface layer could initiate crack formation during transient thermo-mechanical loading. The authors of [
16] performed time/temperature static oxidation tests of cast irons with flake, compacted, and spherical graphite to determine the depth of the DeC layer. It was found that the rate of formation of porosity in cast iron due to the decomposition of graphite obeyed the diffusion-controlled parabolic law. However, the rate of decarburization in the flake graphite irons was faster than that for the other graphite morphologies. This was primarily because the flake graphite is continuous within the matrix, whereas the spheroidal graphite exists as independent deposits within the microstructure. It has been found that the shape of the graphite has a strong effect on the rate of formation of porosity. Another study [
17] focused on the effect of graphite shape on oxidation. When increasing the part of vermicular particles in the cast iron, the oxidation mass gains increased rapidly because the insulated graphite nodules transformed into interconnected coral-like channels that provided a pathway for oxygen diffusion.
The graphite shape factor in ductile iron can be a function of both ductile iron chemical composition and cooling rate. When alloyed with higher levels of
Si, the ductile iron exhibited a significant degeneration of graphite shape. A researcher evaluated mechanical properties and high-temperature oxidation of two cast ductile irons with
Si levels at 2.04 and 5.21% that were solidified at the same cooling rate [
18]. The alloy with 5.21%
Si contained a significant amount of degenerated graphite, which was identified as chunky graphite. However, there was no negative effect of degenerated graphite in high
Si alloy during the oxidation process, due to a silica protection layer being formed on the scale/matrix boundary. The results show that an effective inoculation improved the nodule graphite shape in high
Si alloyed ductile iron [
19,
20]. Another study showed that increasing
Si from 3.5 to 4.5% in an inoculated ductile iron improved the oxidation resistance at 800 °C; however, there was a minimal effect of casting wall thickness and nodule dispersity on static oxidation [
21].
The authors of studies [
22,
23] showed that the surface degradation during static oxidation of
SiMo ductile iron involved several mechanisms. The first mechanism is related to surface oxidation of metallic components such as those formed on external (mainly
Fe oxide) and internal (mainly
Fe-Si oxide) layers. In addition, an amorphous silica film is formed on the scale/matrix interface. The second mechanism included decarburization with the formation of a thick DeC layer. Two methods, thermogravimetry and
C analysis, were used to decouple these processes. Environmental conditions can also play a role in surface degradation. It was shown in [
24] that temperature and oxidation environments (air vs. water vapor containing combustion gases) affect the kinetics differently. In addition, the kinetics of the multi-layered scale formation and matrix DeC affected each other. Those studies were performed using one solidification condition; the effect of structure diversity on static oxidation and transient thermo-mechanical behavior were not investigated. Due to the complexity of the surface degradation mechanisms during exposure to high temperature oxidation environment, it is important to quantify the performance and understand the effect of structural dispersity in
SiMo ductile irons that was implemented at different solidification conditions.
In this study, which consisted of two parts, the effect of microstructural dispersity of SiMo ductile iron on static high-temperature oxidation (Part I, presented in this article) and thermo-mechanical performance at transient thermo-cycling conditions (Part II, to be presented in a separate article) were investigated. Castings with varied wall thicknesses having different orders of magnitude of graphite nodule structural dispersity were used.
2. Materials and Methods
The SiMo ductile iron was melted in a 100 kg induction furnace using an industrial purity metallic charge consisting of steel, pig iron, and foundry returns. The melt was tapped at 1500 °C into a ladle with a pocket to stabilize magnesium recovery from a Fe-Si based nodulizer with 3.7 wt.% Mg, 0.9 wt.% Ce, and 0.6% wt.% La. The melt was additionally inoculated in ladles by 0.4 wt.% Ce-bearing inoculant (1 wt. % Ce, 2 wt.% Ca, 1 wt.% Al). The concentrations of the main and trace elements were verified using C- combustion and optical spectral emission methods (wt.%): 3.1% C, 4.3% Si, 0.25% Mn, 0.85% Mo, 0.17% Ni, 0.05% Cr, and 0.03% Mg, trace each (<0.05) of Cu, V, Nb.
The castings were produced using no-bake silica sand molds, and three casting geometries were used, which included a 5 mm thickness horizontal plate, 18 mm thickness vertical keel block with top riser, and a 150 mm × 150 mm × 150 mm cube shape, which represents approximately 100 mm wall thickness plate equivalent. In addition, an 18 mm keel block with a bottom 20 mm steel chill was used to prepare chilled specimens with extremely high nodule count, and the extracted specimens will be referred to as Chilled 1 (near chilled surface) and Chilled 2 at 10 mm apart.
To investigate the 2D graphite nodules dispersity and shape, an SEM/EDS automated ASPEX system was used to quantify the phases within the microstructure and an automated feature analysis was additionally performed to evaluate the graphite particles by separation graphite phases from non-metallic inclusions using a special technique. Statistics of nodule count per 1 mm
2 and 2D diameter were taken from approximately 1000 nodules in each specimen. The inverse simulation method based on the Saltikov rule [
25] was used to recalculate the 2D distribution of nodule diameters into 3D
rec diameters. In addition, a 3D shape and possible interconnectivity of graphite particles were determined from the µCT (ZEISS Xradia 510 Versa, Carl Zeiss Microscopy Deutschland GmbH, Oberkochen, Germany). These were taken from 2 mm diameter specimens extracted from 5 mm, 18 mm, and 100 mm wall thicknesses. The graphite nodule structure was analyzed in a central volume, approximately 1 mm
3. The 1000 projections using 1004 × 1024 pixels were collected for each µCT scan (140 kV, 0.4× objective) using 1 µm pixel size. After µCT scan data were acquired, a quantitative analysis of particle dispersity and shape was done accordingly to a method described by the authors [
26,
27].
Static oxidation tests were performed in air at different temperatures (650, 700, 750, and 800 °C) using a tube furnace with +/−1 °C temperature control. The oxidation tests were performed using 7 mm × 16 mm × 80 mm rectangular-shaped specimens, which were milled from the cast plates and subjected to high-quality wet grinding on all sides of the specimens prior to testing. During the oxidation testing, the samples were placed into a shallow rectangular-shaped alumina crucible so that any spalled scale could be collected. To determine oxidation kinetics, these tests were performed at 25 h, and sequential time steps up to 100 h. A procedure to decouple oxidation of metallic components and DeC was adopted from [
22]. The specimens and crucibles were weighed before and after each time step to determine a total weight change. After the 100-h test was completed, a transverse 1 mm thickness section was extracted from the middle of each specimen and used for carbon combustion analysis. The section included the original, exposed to the oxidizing atmosphere DeC external perimeter. The carbon concentration before and after the test was used to calculate weight loss due to DeC. A true oxidation (g/m
2) weight gain was calculated from the measured weight change and adjustments for the weight loss due to DeC during the thermal exposure. In addition, oxygen consumed for DeC was calculated using the DeC data and assuming the formation of
CO gas. The samples for SEM/EDX analysis with the ASPEX system were prepared from a second central section of the oxidized specimens.
Additional oxidation tests were performed for 3D µCT non-destructive measurement of scale topology using the methodology from [
28]. Three specimens, having 3 mm diameter, were cut from 5 mm, 18 mm, and 100 mm wall thicknesses, and subjected to oxidation in air at 800 °C for 100 h. Once the μCT slices were acquired with 3.5 µm pixel size and reconstructed, the oxide layer from each slice was isolated from the rest of the image for further investigation. The resultant collection of binary images was used to determine the dimensional properties of the oxide layer.
3. Results
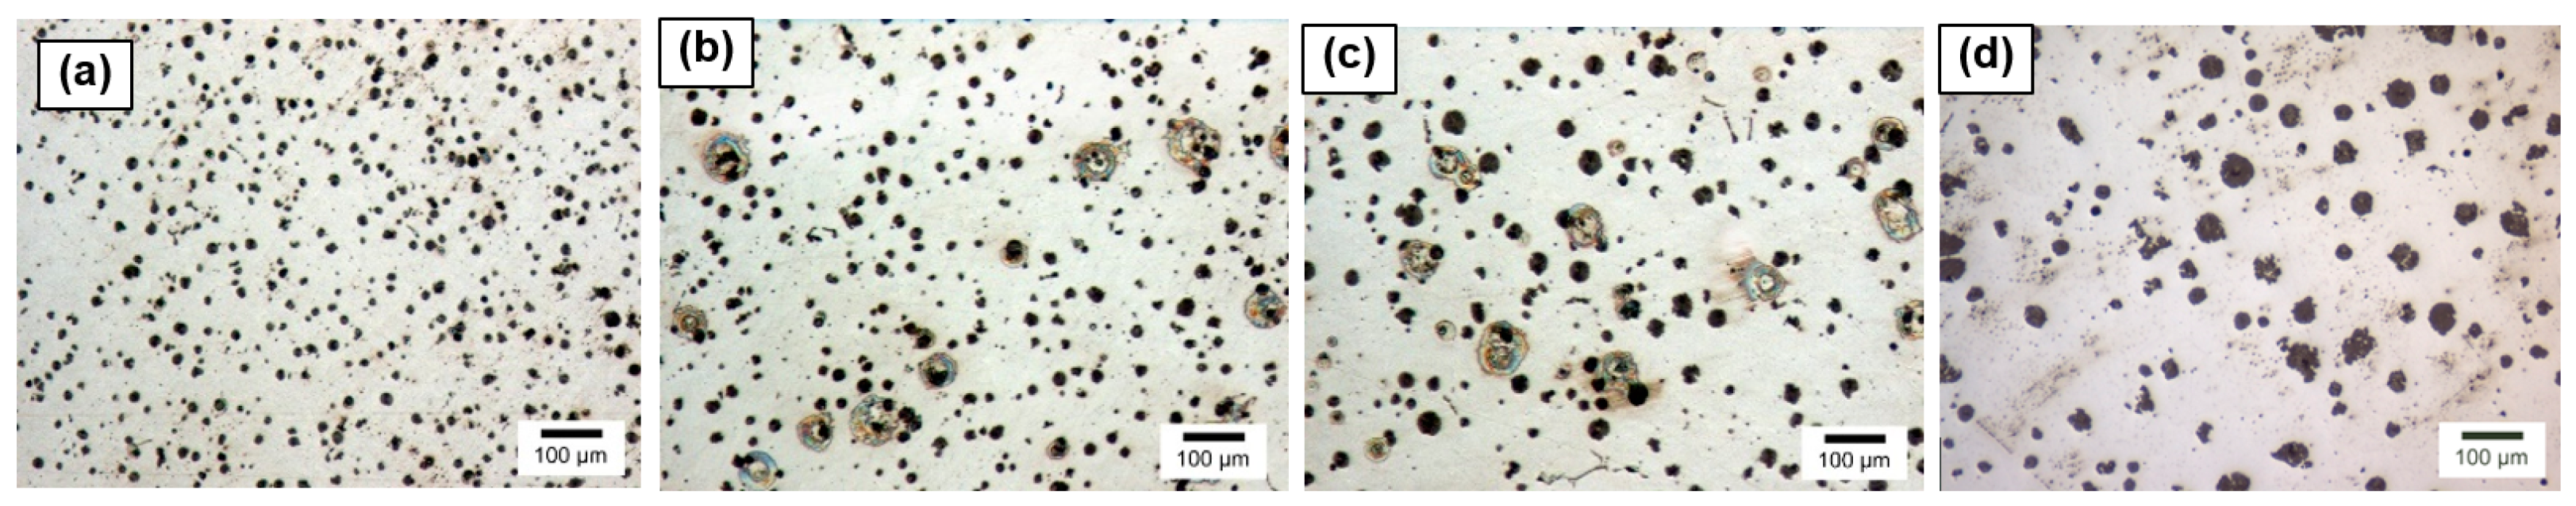
Material characterization. Optical images of studied
SiMo ductile iron shown in
Figure 1 indicate a significant effect of casting wall thickness and cooling rate on dispersity of graphite nodules. Because oxidation and DeC processes take place throughout the thickness (3D space), the graphite phase structure was also characterized using µCT (
Figure 2).
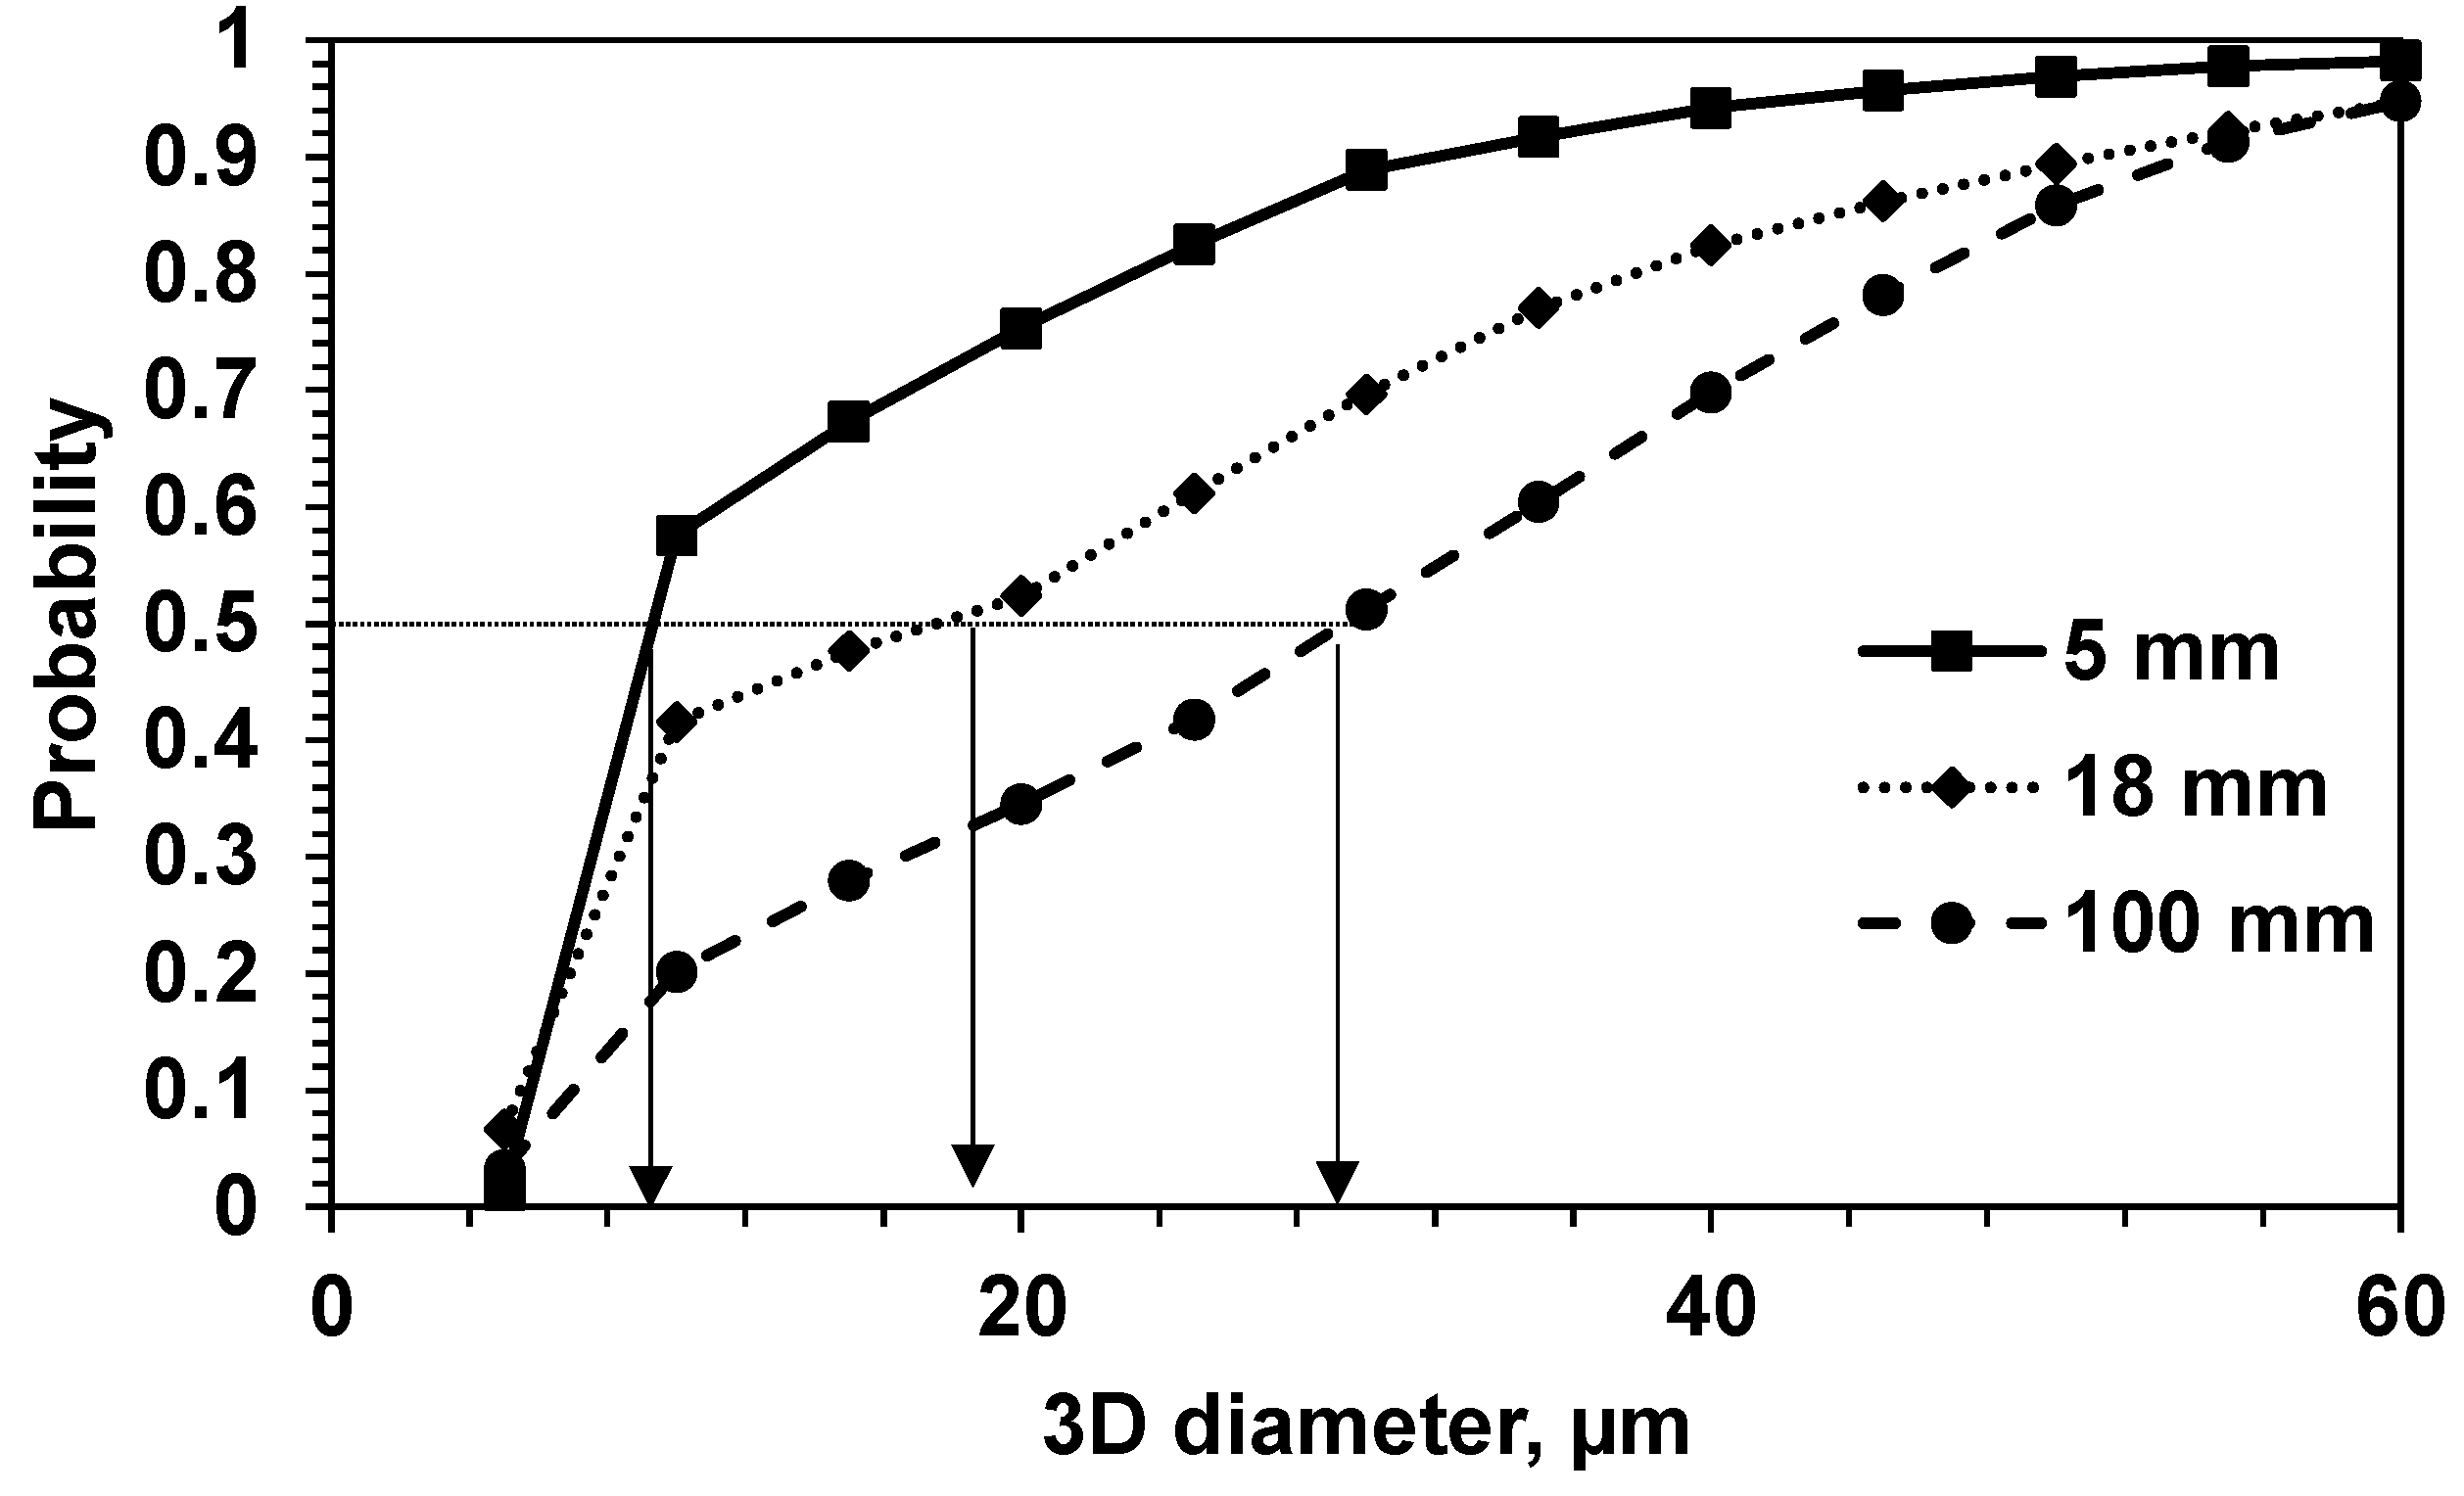
Statistical results for 3D nodule diameter distribution (
Figure 2) obtained from µCT analysis of castings with 5 mm, 18 mm, and 100 mm wall thickness are shown in
Figure 3. The probability curves were used to determine a 0.5 probability diameter when half of the graphite nodules had less of larger diameter. Faster cooling castings with 5 mm and 18 mm wall thickness had significantly dispersed graphite nodules when compared to slow cooling 100 mm wall thickness casting. Graphite nodules in a 100 mm wall thickness also had some number of distorted interconnected particles (insert in
Figure 2c), whereas the majority of graphite particles were separated within the metal matrix.
Statistics of an average 2D graphite nodule number
n per area unit (1/mm
2), 3D nodule number
N per volume unit (1/mm
3), and a total surface
S (mm
2/mm
3) of graphite nodules in unit of alloy volume, shown in
Table 1, illustrate that specimens used in this study had an order of magnitude difference in micro-structural dispersity. The total particle number in the volume and the total graphite/matrix interface are two important structural parameters, which will be used in discussion of oxidation and DeC kinetics.
Static oxidation. Experimental thermo-gravimetrical results of the specimens with different structural dispersity oxidized in air at 650–800 °C temperatures are shown in
Figure 4 in coordinates “oxidation time”–“weight gain per unit area”. A weight gain followed near parabolic law at the two lower test temperatures (650 °C and 700 °C), which is expected for diffusion-controlled oxidation. However, the rate of weight gain followed near linear law at 800 °C, and it was mixed linear/parabolic at the intermediate 750 °C temperature.
Micro-structural dispersity in studied specimens had a minimal effect on the rate of weight gain at lower test temperatures 650 °C and 700 °C after 100 h oxidation (
Figure 5). At 750 °C test temperature, the weight gain decreased as the casting thickness decreased from 100 mm to 5 mm specimens; however, all fast solidified
SiMo ductile iron with fine graphite nodules had significantly larger weight gain at 800 °C. It appeared that the weight gain even drops in cast materials with less structural micro-dispersity (18 mm and 100 mm). Such trends were described in our work [
22] for castings with medium wall thickness and were related to a coupled effect of oxidation (weight gain) and intensive DeC at high temperature. DeC associates with weight loss due escaping gaseous (
CO) reaction products.
To decouple these two processes, the methodology described in [
22,
23] was implemented using weigh gain from thermo-gravimetric tests and calculated weight loss from
C analysis. The DeC results are shown in
Figure 6 for 100 h tests at each temperature. There was minimal DeC observed in all
SiMo ductile irons below 750 °C; however, DeC rate drastically increased for static oxidation tested at 800 °C, and structural micro-dispersity significantly intensifies the DeC process. Simulation results shown by the red curve in
Figure 6 will be compared to experimental data in the Discussion section of this article.
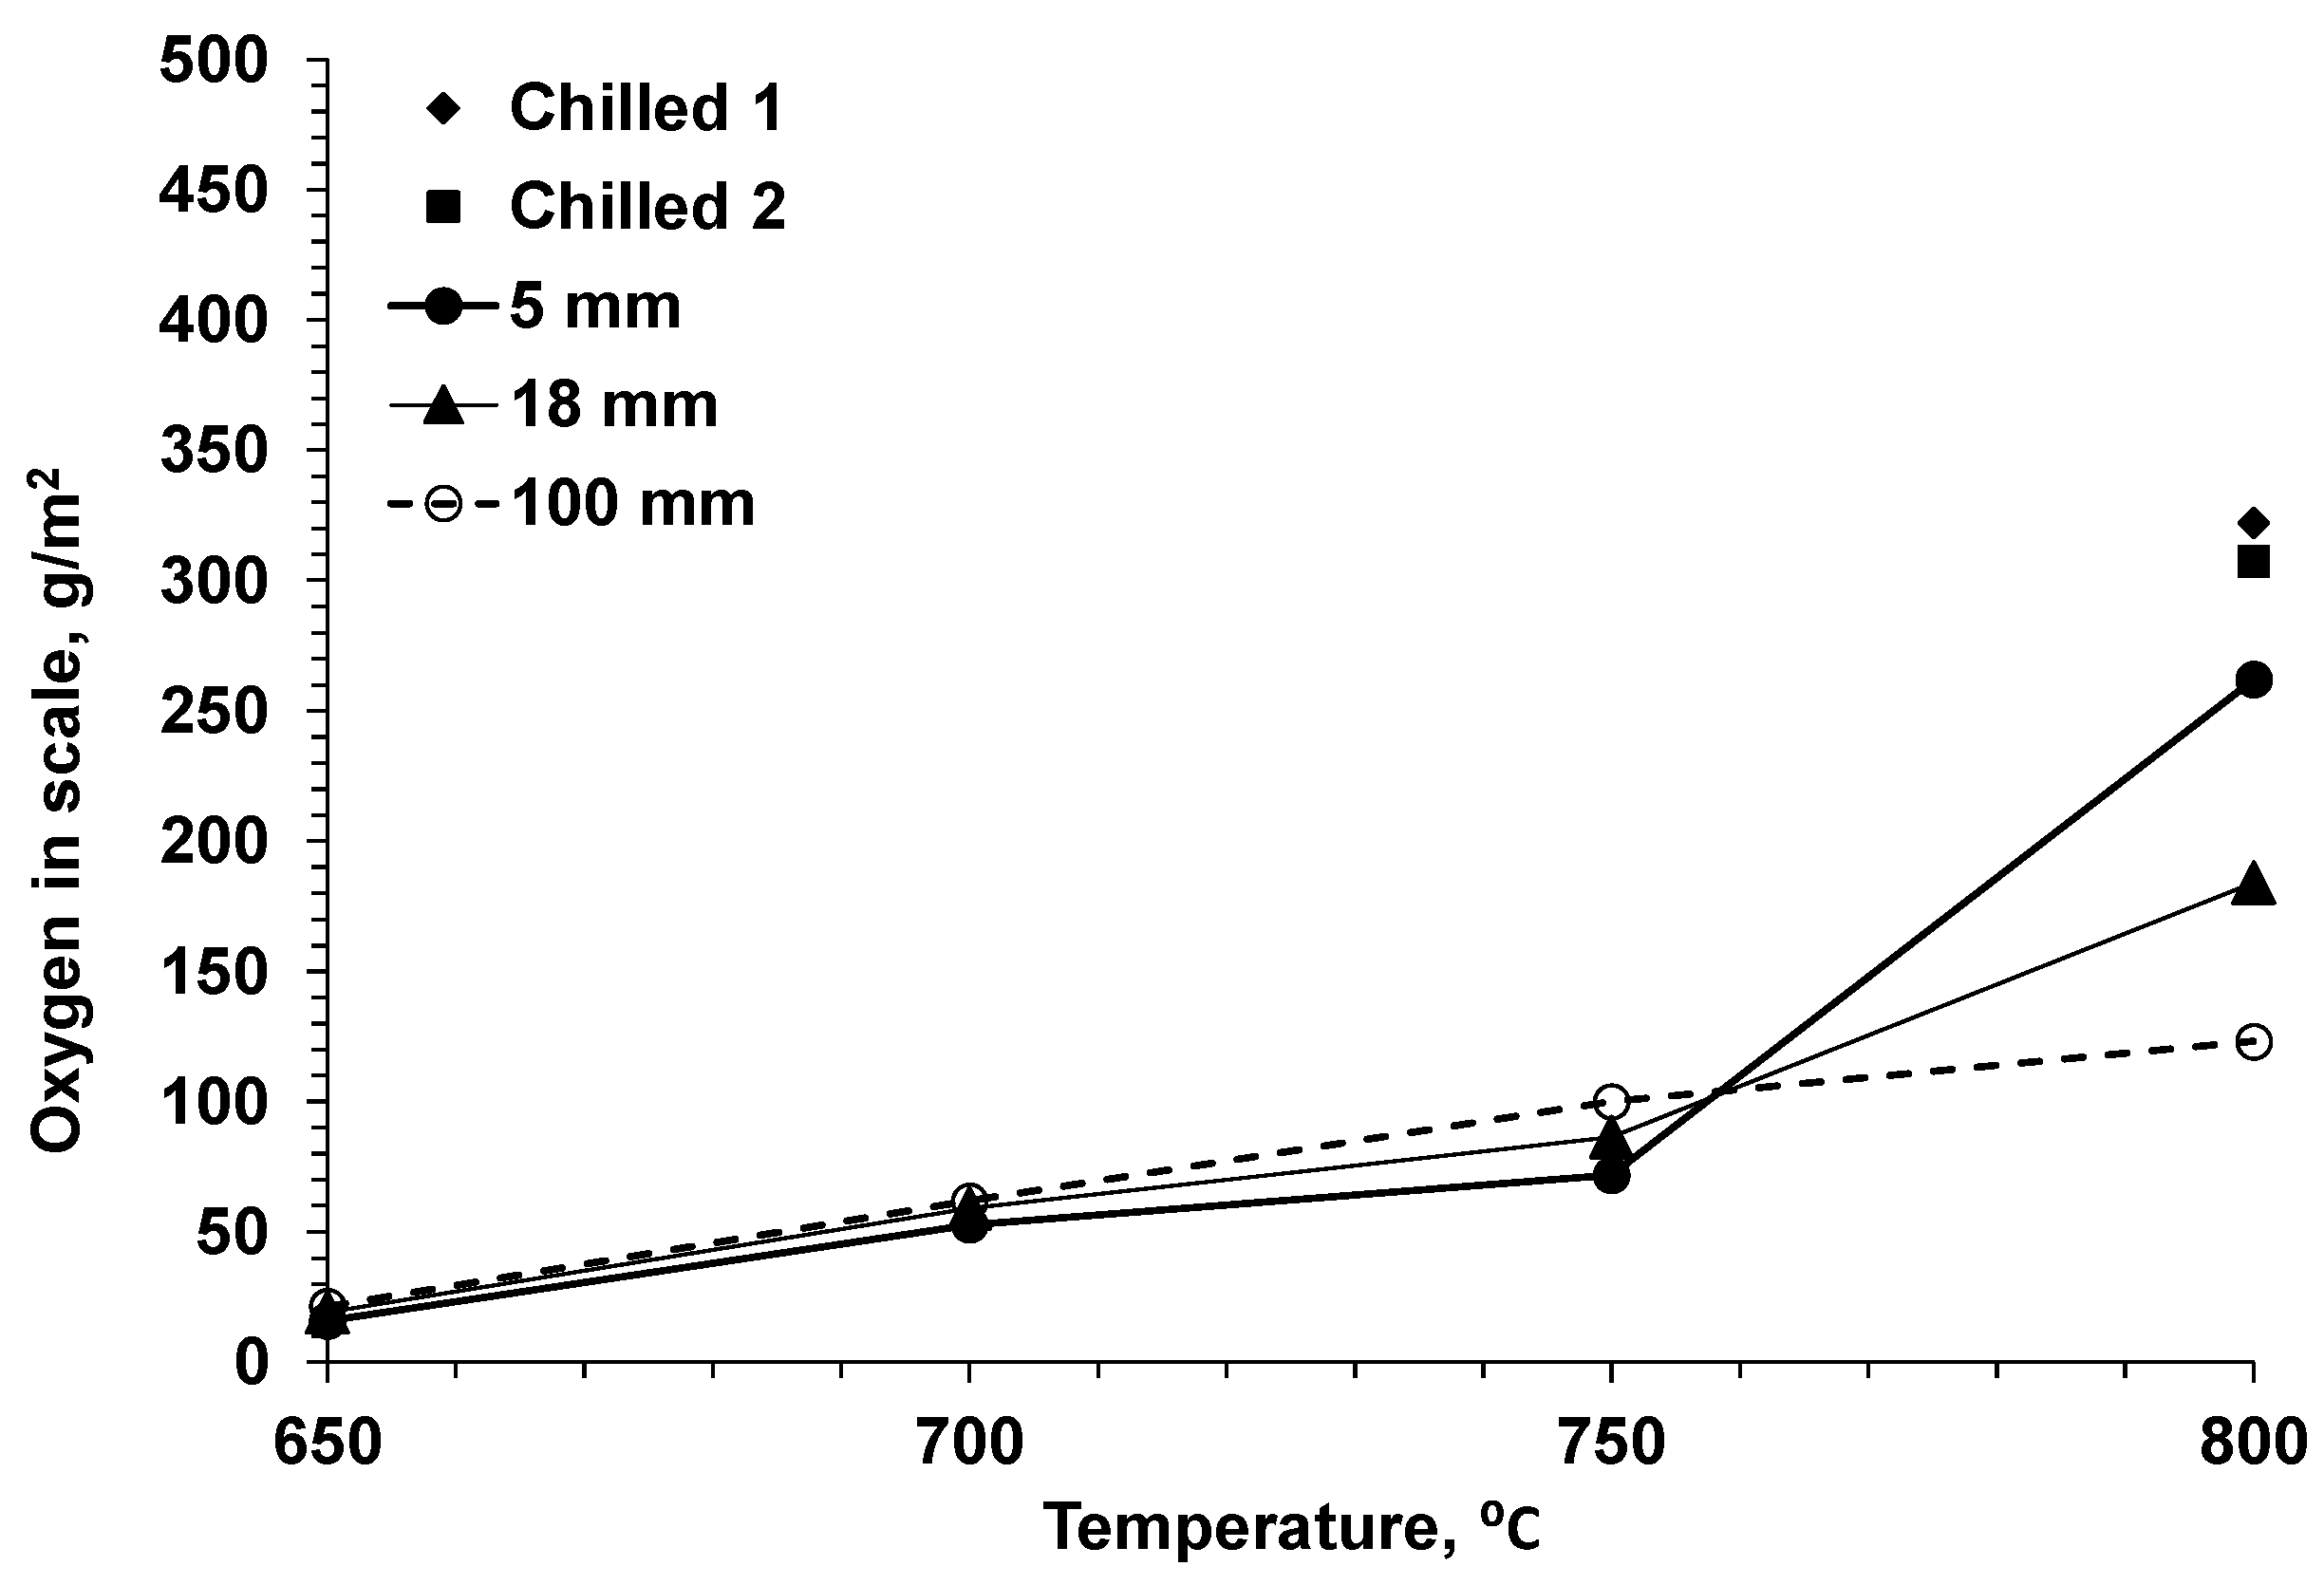
Considering weight gain from oxidation of metallic components while forming an oxide scale on the specimen surface and the weight loss due to DeC, an oxygen that reacted to form scale is shown in
Figure 7. In all cases, increasing temperature intensified the oxidation of the metal matrix, whereas the reaction rate significantly increased at 800 °C in
SiMo ductile iron with fine graphite nodules.
SEM/EDX analysis was performed on cross sections of specimens after 100 h oxidation to determine the degree of surface degradation, including external and internal scales in addition to the DeC layer. At a lower oxidation temperature (650 °C), the scale/matrix boundary amorphous silica film [
23] strongly resisted penetration of oxygen into the matrix, and no DeC was observed in the studied
SiMo ductile iron with different degrees of micro-structural dispersity (
Figure 8). The formed external oxide layer (mainly consisting of pure
Fe oxides) was strongly attached to the internal layer (
Fe-Si oxides) without visible spalled dust in the crucible. At this static oxidation condition, there was a minor effect of micro-structural dispersity. In
SiMo ductile iron with a high nodule count in 5 mm wall thickness, some small graphite nodules were incorporated into the scale (
Figure 8a). These modules were also protected by a very thin silica layer.
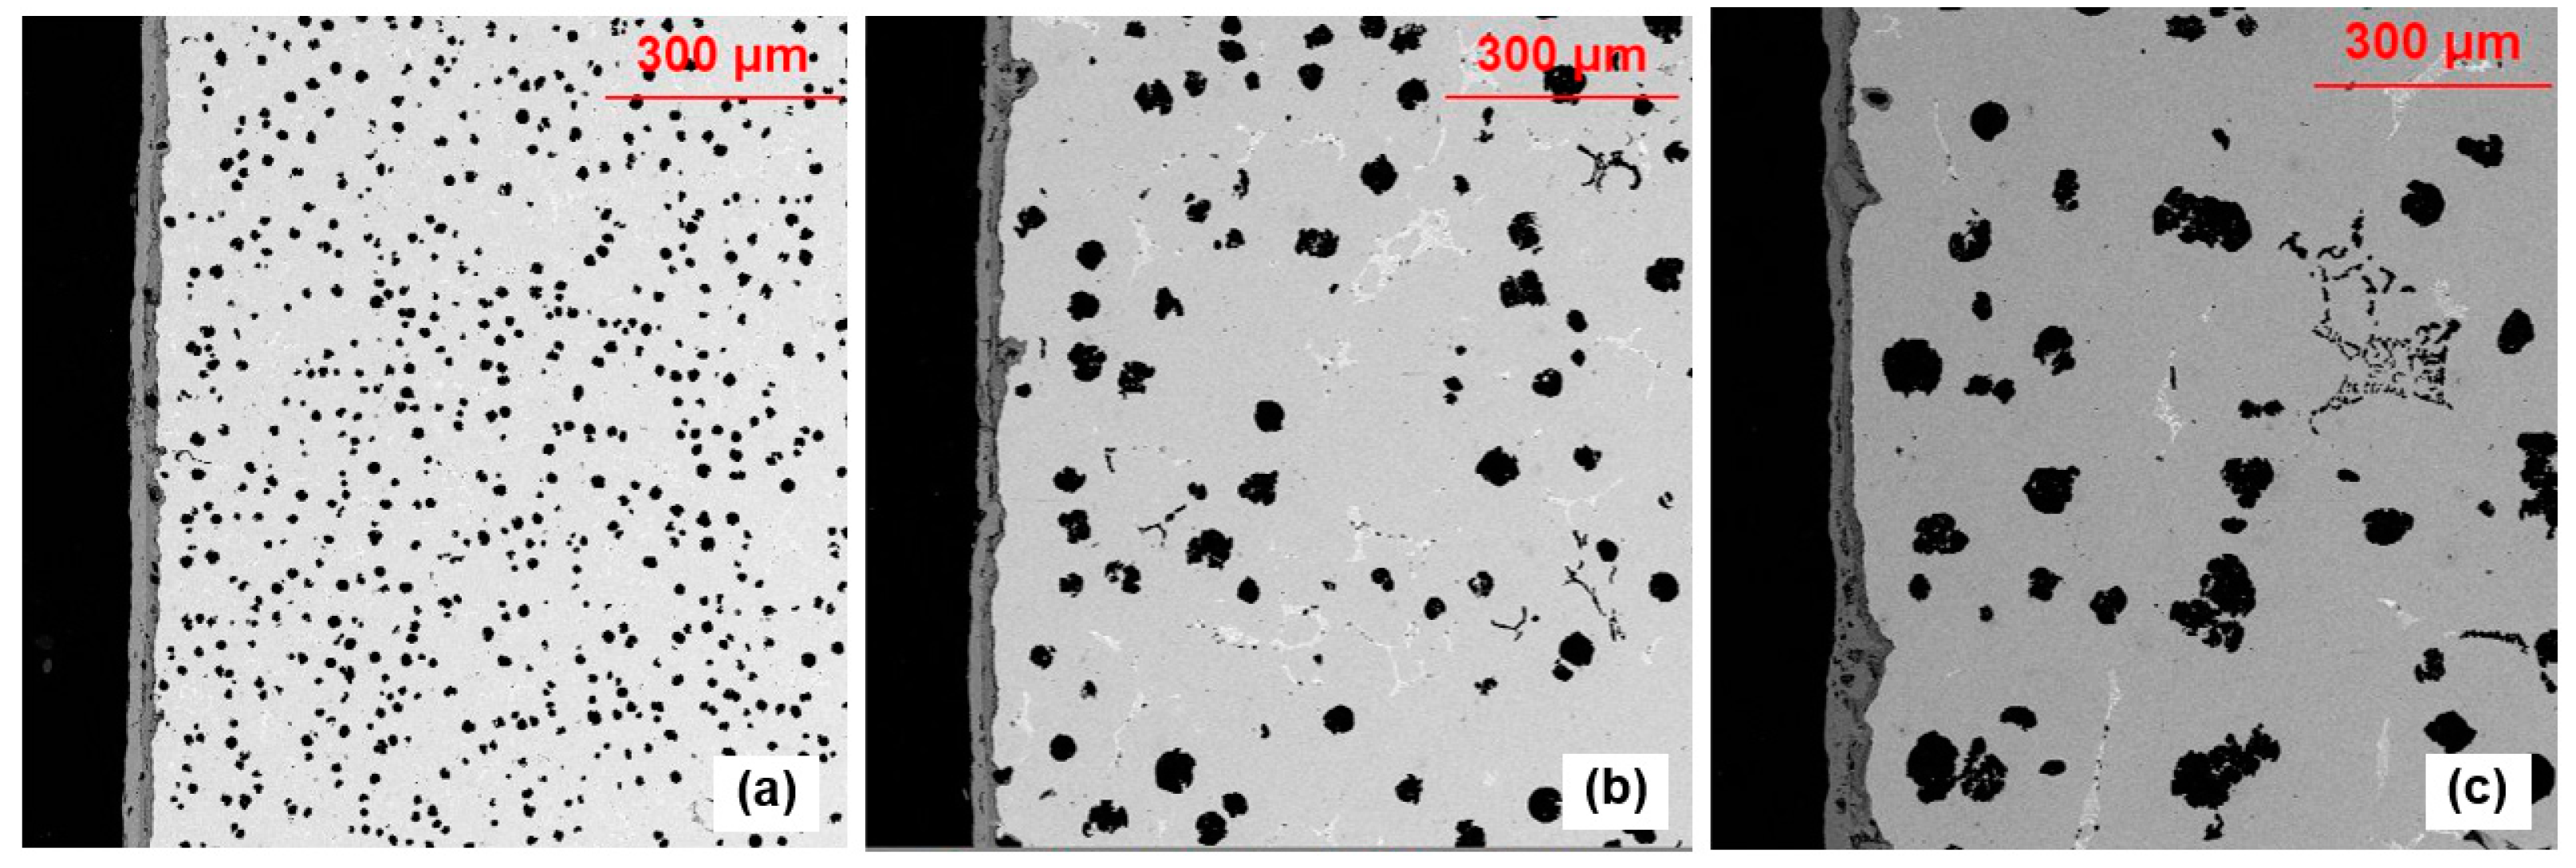
In contrast, surface degradation at 800 °C was more severe and scale formation was accompanied with significant DeC into the matrix. It appears that at high test temperature the oxidation process was affected by a degree of micro-structural dispersity, as shown in
Figure 9. The DeC extended to a significant depth in the fine graphite structure in 5 mm wall thickness. In addition, cracks and delamination of external layers were observed in all samples. The topology of the external surface and internal metal/matrix boundary became uneven in all conditions. The depth of the DeC layer was in the range of 500 microns for fast solidified
SiMo ductile iron and decreased to several hundred microns in slowly solidified casting with heavy section.
These results were confirmed using non-destructive µCT analysis of scale thickness formed on 3 mm diameter pins cut from castings with different wall thicknesses. The specimens were oxidized for 100 h at 800 °C, and examples of 3D scale images are given in (
Figure 10). White rings illustrate an oxide layer in 2D section and extracted 3D scale topology, with visible external (scale/gas) and internal (scale/matrix) interfaces is shown in red. In all cases, those scales formed at high temperatures had a bumpy irregular topology, and the average scale thickness decreased from 102 to 94 and 89 µm for specimens from 5 mm, 18 mm, and 100 mm wall thickness. This data confirmed that increasing microstructural dispersity intensified oxidation at high temperatures.
4. Discussion
The effect of micro-structural dispersity of
SiMo ductile iron on surface degradation during static oxidation was verified using two independent methods: (i) direct observation of cross sections and (ii) thermo-gravimetric data of weight gain combined with
C analysis. Comparison between these two methods were applied to all studied specimens as shown in
Figure 11 for scale thicknesses and depth of DeC layer. Both parameters showed similar trends for two methods, whereas calculated values for DeC layer were 25–30% larger than measured because of arbitrary assessment of lower boundaries in image analysis.
The goal of this study is to evaluate micro-structural dispersity on surface degradation of
SiMo ductile iron during static oxidation. This information has practical applications because metal casting technology has allowed us to control micro-structural dispersity by altering cooling rates using different mold materials and applying effective melt inoculation during the casting process. Therefore, it is necessary to verify which structure can offer enhanced protection during long-time service in high temperature oxidizing atmospheres. It was shown that these two occurred simultaneously and affect each of the surface degradation processes. The suggested methodology was used to decouple these two processes. Our previous studies [
22,
23] demonstrated how multi-layered scale structure affected DeC kinetics in the base and alloyed
SiMo ductile irons. It was also shown that water vapor in a combustion atmosphere decreased the protection efficiency of silica film formed on the metal/scale boundary. In this study, it was experimentally verified that all these processes were influenced by micro-structural dispersity.
Figure 12 summarizes these findings. All the studied
SiMo ductile irons, having different orders of magnitudes in micro-structural diversity, behaved similarly below a critical temperature, which was defined as 750 °C (
Figure 12a). However, at this critical temperature and above, oxidation was suddenly accelerated and assisted intensive subsurface DeC. More importantly, it was discovered that increasing micro-structural dispersity critically intensified deep DeC at temperatures above a critical value (
Figure 12b).
Micro-structural dispersity of studied
SiMo ductile iron solidified with different cooling rates was characterized with 2D and 3D methods, and the structural parameters were correlated to experimentally observed DeC oxidized for 100 h at 800 °C.
Figure 13 demonstrated a linear correlation between DeC intensity and a parameter of the specific surface graphite nodules. This graph was built using relative ratios for DeC and the specific surface to observed in a casting with 100 mm wall thickness, where minimal DeC occurred. This correlation indicated that graphite nodule surface/metal matrix mass transfer of oxidant and reaction product (
CO gas) is a limiting stage for DeC kinetics. Increasing nodule count increased the total reaction surface, and large DeC layers were observed in the fast solidified
SiMo ductile iron with fine graphite. It is important to note that the decreasing sphericity of graphite nodules (
Figure 3) in slowly solidified casting had a minor effect on DeC because there were no significant 3D interconnections between graphite particles (
Figure 2). This study also demonstrated the importance of the application of 3D methods for micro-diversity characterization.
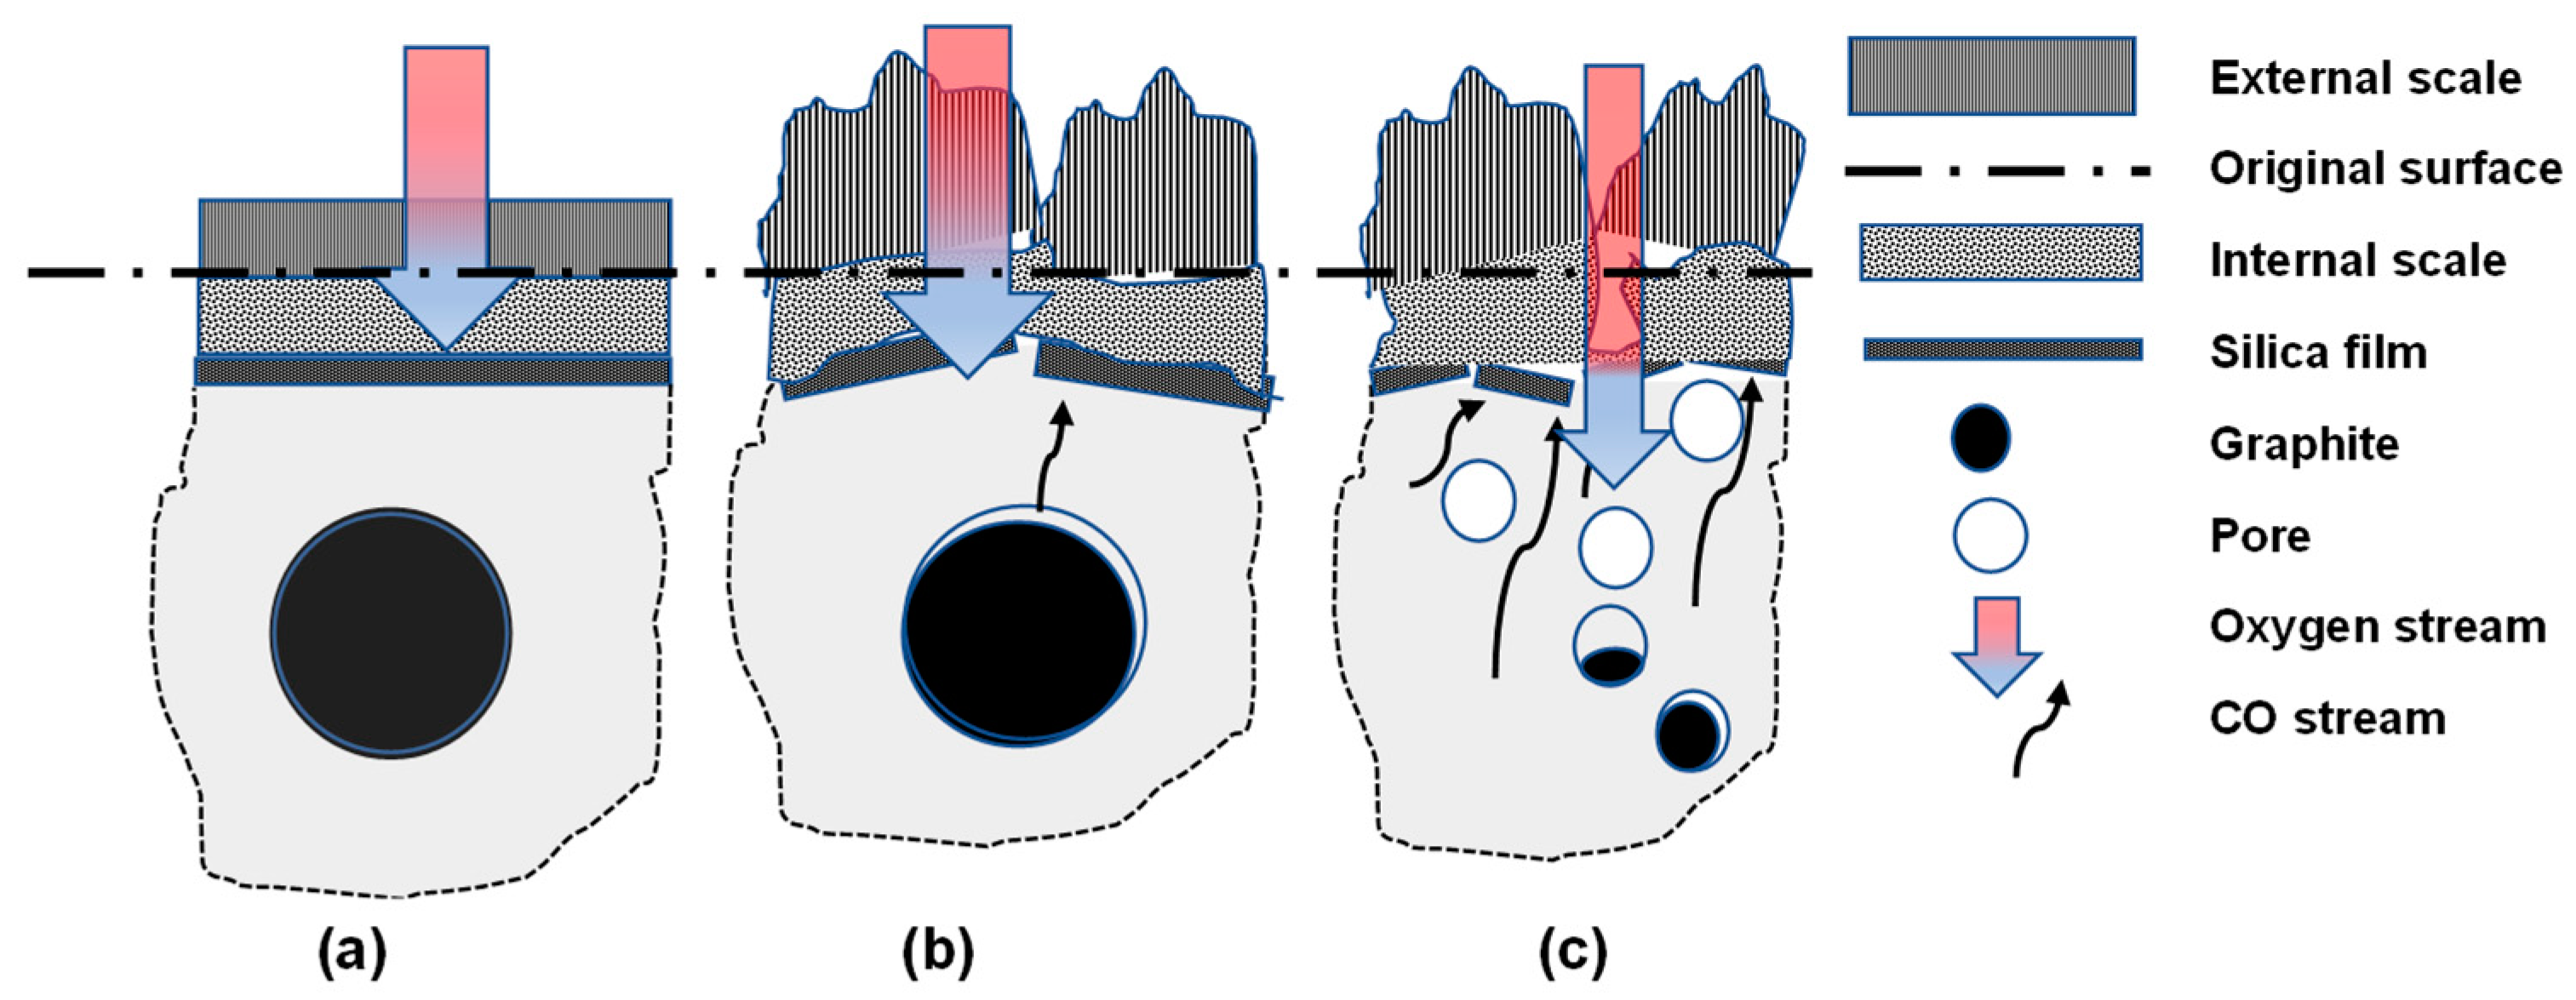
Figure 14 illustrates our understanding of the effect of temperature on surface degradation in
SiMo ductile irons with different micro-structural dispersity. Below a critical temperature, oxidation kinetic rate was mainly limited by oxygen permeability of amorphous silica film (
Figure 14a). Such kinetics could obey parabolic law with process activation energy close to the activation energy of oxygen diffusion. However, above a critical temperature, thermo-mechanical processes affect surface degradation mechanisms, and these processes also depend on micro-structural dispersity. Increasing oxygen permeability of amorphous silica film initiated internal oxidation of carbon in graphite nodules. The resulting gas pressure enables it to plastically deform at the near-surface matrix and develop cracks in protected silica film as well as internal and external scale layers (
Figure 14b,c). The intensity of thermo-mechanical deformation depends on chemical reactivity on the reaction surface, which is a graphite nodule/metal matrix boundary. Therefore, a high micro-structural dispersity intensified DeC reaction and increased
CO pressure, which transformed regular scale topology to be defected with deep crack and delamination. All these transformations open a free pass for oxygen. Because of this complex system, it is difficult to simulate these combined chemical multi-stage processes, which were assisted by thermo-mechanical deformation conditions during static oxidation even without external load. Comparison between experimentally and simulated measured depth of the DeC layer, and assuming a simplified diffusion model without barriers [
22], show (
Figure 6) that the simulated and experimental data fit each other only for
SiMo ductile iron with fine graphite nodules at a temperature above a critical value. At such conditions, a large reaction surface and broken protection layers provide fast diffusion paths without restrictions. In the
SiMo ductile iron with thicker casting wall sections, the smaller graphite nodule/metal matrix interface slowed the lower reaction rate, which decreased the formed
CO pressure and resulted in lower defectivity of protection oxide scale. Combined, all these chemical and thermo-mechanical processes decreased the thickness of the DeC layer as compared to predictions followed from the free diffusion barrier model. It is also important to note that the development of internal porosity (
Figure 10) could affect
SiMo ductile iron behavior during transient thermo-mechanical loading conditions, which will be presented in the separate article.


