Article

In Vitro Corrosion Performance of As-Extruded Mg–Gd–Dy–Zr Alloys for Potential Orthopedic Applications

1
Ningbo Branch of Chinese Academy of Ordnance Science, Ningbo 315103, China
2
School of Materials Science and Engineering, Beijing Institute of Technology, Beijing 100081, China
*
Authors to whom correspondence should be addressed.
Metals 2022, 12(4), 604; https://doi.org/10.3390/met12040604
Submission received: 14 March 2022 / Revised: 26 March 2022 / Accepted: 28 March 2022 / Published: 31 March 2022

Abstract

:
In this study, different contents of rare earth elements with high solid solubility (Gd and Dy) were added into Mg and fabricated through homogenization and hot extrusion processes that enable few second phase formation to efficaciously inhibit the galvanic corrosion. The microstructure and phase characterization of the as-extruded Mg–Gd–Dy–Zr alloys were analyzed by scanning electron microscopy, electron backscattered diffraction, and X-ray diffraction. The in vitro biodegradation behavior of the as-extruded Mg–Gd–Dy–Zr alloys was investigated via the electrochemical measurement and immersion test. The results revealed that all the as-extruded alloys with different RE additions exerted fully recrystallized microstructures. The average grain size was appropriately 20 μm to 30 μm for all alloys and gradually increased by adding more RE. Only a few tiny second-phase particles less than 5 μm dispersed for all the samples and the volume fraction of particles increased slightly with the increase in RE content. The as-extruded Mg–Gd–Dy–Zr alloys with low RE content (GD0.6) allowed for a satisfactory corrosion resistance in Hank’s solution with a controlled corrosion rate less than 0.5 mm/year, which is considered as the tolerance limit for the corrosion rate of orthopedic implants. This study provides a cost-effective choice for promoting biodegradable magnesium alloys for potential orthopedic applications with low rare earth content in Mg alloys.

1. Introduction

Magnesium and its alloys, serving as new generation biodegradable structural materials for bone implantable devices, have been widely documented in the literature and have been promoted by medical device companies due to their characteristics of biodegradability, good bone histocompatibility, and close modulus and density with natural bones [1,2,3,4,5,6]. However, the main drawbacks of magnesium and its alloys are their rapid corrosion rates and localized corrosion mode in the physiological environment, which can lead to premature loss of mechanical integrity of the implant, and to the formation of excessive hydrogen gas cavities that are not conducive to tissue healing, thus seriously deteriorating the therapeutic effect. Hence, the degradation rate control of magnesium alloys in a physiological electrolyte environment is the main bottleneck that hinders the orthopedic applications of magnesium alloys [7,8,9].
In the human body, magnesium alloys are degraded by galvanic corrosion, pitting corrosion, fatigue corrosion, and scour corrosion, among which galvanic corrosion is the main corrosion mode [10,11,12,13,14]. In addition to its natural characteristics, where the magnesium alloy surface cannot spontaneously form a protective surface film, the key reason why magnesium alloys are prone to corrosion is that the stable second phase of the magnesium alloy forms galvanic corrosion with the matrix [15,16]. Moreover, impurity elements such as Fe, Ni, and Cu gather at grain boundaries and the impurity elements such as Al3Fe that are distributed in the matrix have active cathodic properties, which promote the formation of microbatteries on the surface of magnesium alloys [7,17,18]. The second phase in the magnesium alloy shows extremely strong cathode characteristics, generally does not corrode, and it is difficult to form ions in the biodegradation process. The larger size of the second phase particles may form thrombus and other subsequent adverse effects [19,20]. This problem has become another doubt for the application of biological magnesium alloys.
For decades, magnesium alloys have mainly been designed to control the degradation rate by reducing the impurity content and alloying methods while considering biocompatibility to alleviate the limitations as described above. To reduce the impurity content in the alloy, harmful elements such as Fe, Ni, and Cu, with low solid solubility in the magnesium alloy, are mainly reduced to avoid their aggregation at grain boundaries and thus inhibit the microbattery reaction. Alloying can improve the corrosion property of magnesium to a certain extent, but inevitably gives rise to the formation of second phases, which easily form galvanic corrosion with the magnesium matrix [16,21]. Generally, material deformation and heat treatment are used to modify the size, morphology, and distribution of the second phases, and thereby to enhance the corrosion resistance, but the adverse effect of the second phase on the corrosion properties of the alloy cannot be completely eliminated [22,23,24].
Adding an appropriate amount of rare earth into the magnesium alloy can not only purify the melt, refine grain, improve mechanical properties [25,26,27], and corrosion resistance of the alloy [28,29,30], but also because most rare earth elements have no toxicity to the human body [31,32]. Trace rare earth elements can also improve immune function and promote DNA synthesis in liver cells [33,34]. Therefore, rare earth containing Mg alloy (Mg–RE) becomes an important alloy system in the study of biodegradable magnesium alloys. Elmar Willbold et al. conducted a systematic study on the biodegradability and biocompatibility of magnesium alloys with light rare earth alloys La, Ce, and Nd. In vitro and in vivo experiments showed that the alloys had a lower corrosion rate, and Nd showed better biocompatibility than La and Ce [35]. Feyerabend et al. studied the toxic effects of Gd, Y, Nd, Dy, Pr, Gd, La, Ce, Eu, and other rare earth elements on human osteosarcoma cell lines, peripheral cells of human umbilical cord blood vessels, and mouse macrophages and found that La and Ce had certain cytotoxicity, and the others had no toxicity or low toxicity [31]. Liu et al. individually fabricated binary Mg–RE model alloys with 16 kinds of REs into Mg including Sc, Y, La, Ce, Pr, Nd, Sm, Eu, Gd, Tb, Du, Ho, Er, Tm, Yb, and Lu. The results showed that all kinds of Mg–RE model alloys showed no cytotoxic effect on the MC3T3-E1 cells and the hemolysis rates of all experimental Mg–RE model alloys were lower than 5%, except for Mg–Lu alloy model [36]. The German GKSS Light Metal Research Institute has developed high-purity Mg–Y [37], Mg–Gd [38], and other magnesium rare earth alloys that have been applied in degradable magnesium alloy orthopedic implant products developed by the German AAP Company.
Gd and Dy are considered as efficient solid solution strengtheners, grain refiners, and texture modifiers for the Mg matrix [39,40,41]. The maximum solid solubility of Gd and Dy in α-Mg reaches up to 23.5 wt% and 25.3 wt%, respectively, which enables few second phase formation, inhibiting the galvanic corrosion. Although it has been reported that the solid solubility decreases with decreasing temperature, Gd and Dy still maintained a high level in α-Mg compared with other alloying elements. In our previous studies, simultaneous addition of Gd and Dy in Mg alloys was used to weaken the extrusion basal texture of the Mg alloy and improve the mechanical properties [25]. However, the corrosion performance has not been systematically studied. In this study, the in vitro corrosion performance of as-extruded Mg–Gd–Dy–Zr alloys was analyzed and discussed for potential orthopedic applications.

2. Materials and Methods

2.1. Materials Preparation

The experimental Mg–xGd–0.5xDy–0.2Zr (x = 0.6, 1.2, 5.0, and 10.0, hereafter notated as GD0.6, GD1.2, GD5.0, GD10.0, respectively) alloys were fabricated. Pure Mg (99.9%) was molten in a high-purity graphite crucible under the protection of a mixed gas atmosphere of SF6 (1 vol%) and carbon dioxide (CO2). Mg-20 wt% Gd master alloy, pure Dy (99.5%), and Mg-30 wt% Zr master alloy were orderly added to the melt at 720 °C in nominal amounts. The melting was held for 30 min and stirred with a graphite rod. The melt was then poured into a steel mold preheated at 300 °C. After casting, both the tops and bottoms of the ingots were cut away, and the middle parts were then homogenized at 520 °C for 24 h followed by quenching in water. The as-quenched ingots were hot extruded into bars at 400 °C with the extrusion ratio of 64:1 at a ram speed of 10 mm·s−1. The composition of the Mg–Gd–Dy–Zr alloys measured by inductively coupled plasma atomic emission spectrometry (ICP-AES, Optima 7300DV, PerkinElmer, Waltham, MA, USA) is listed in Table 1.

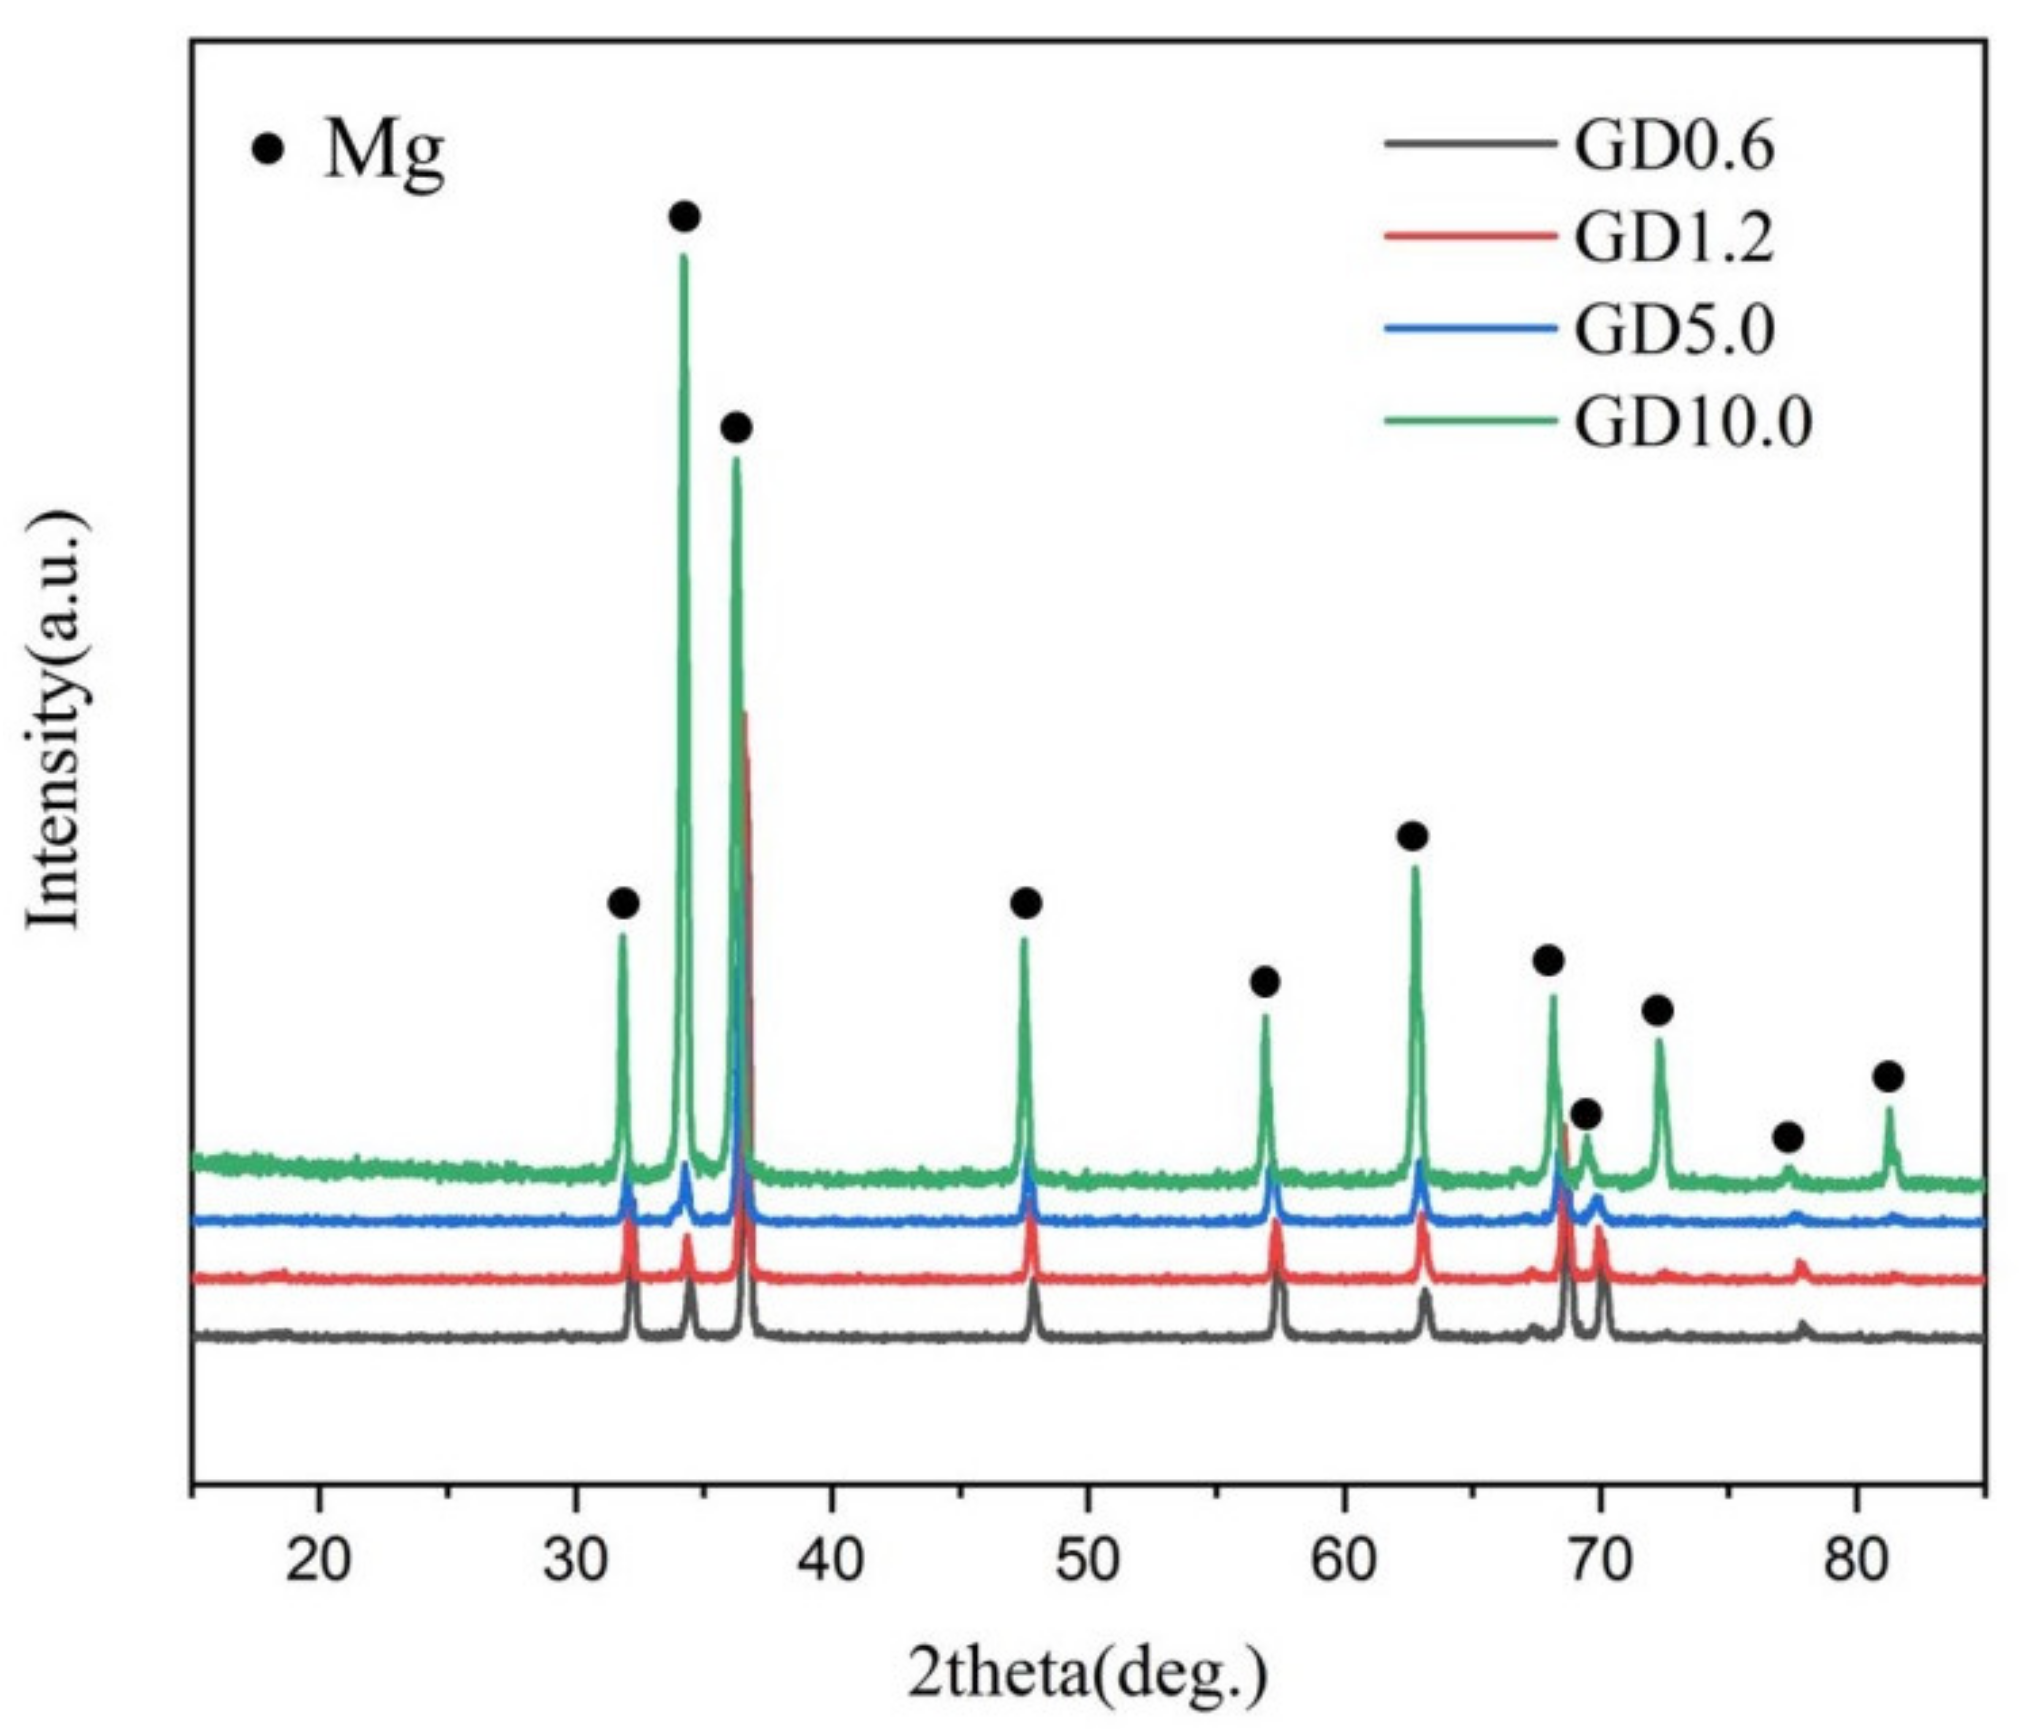
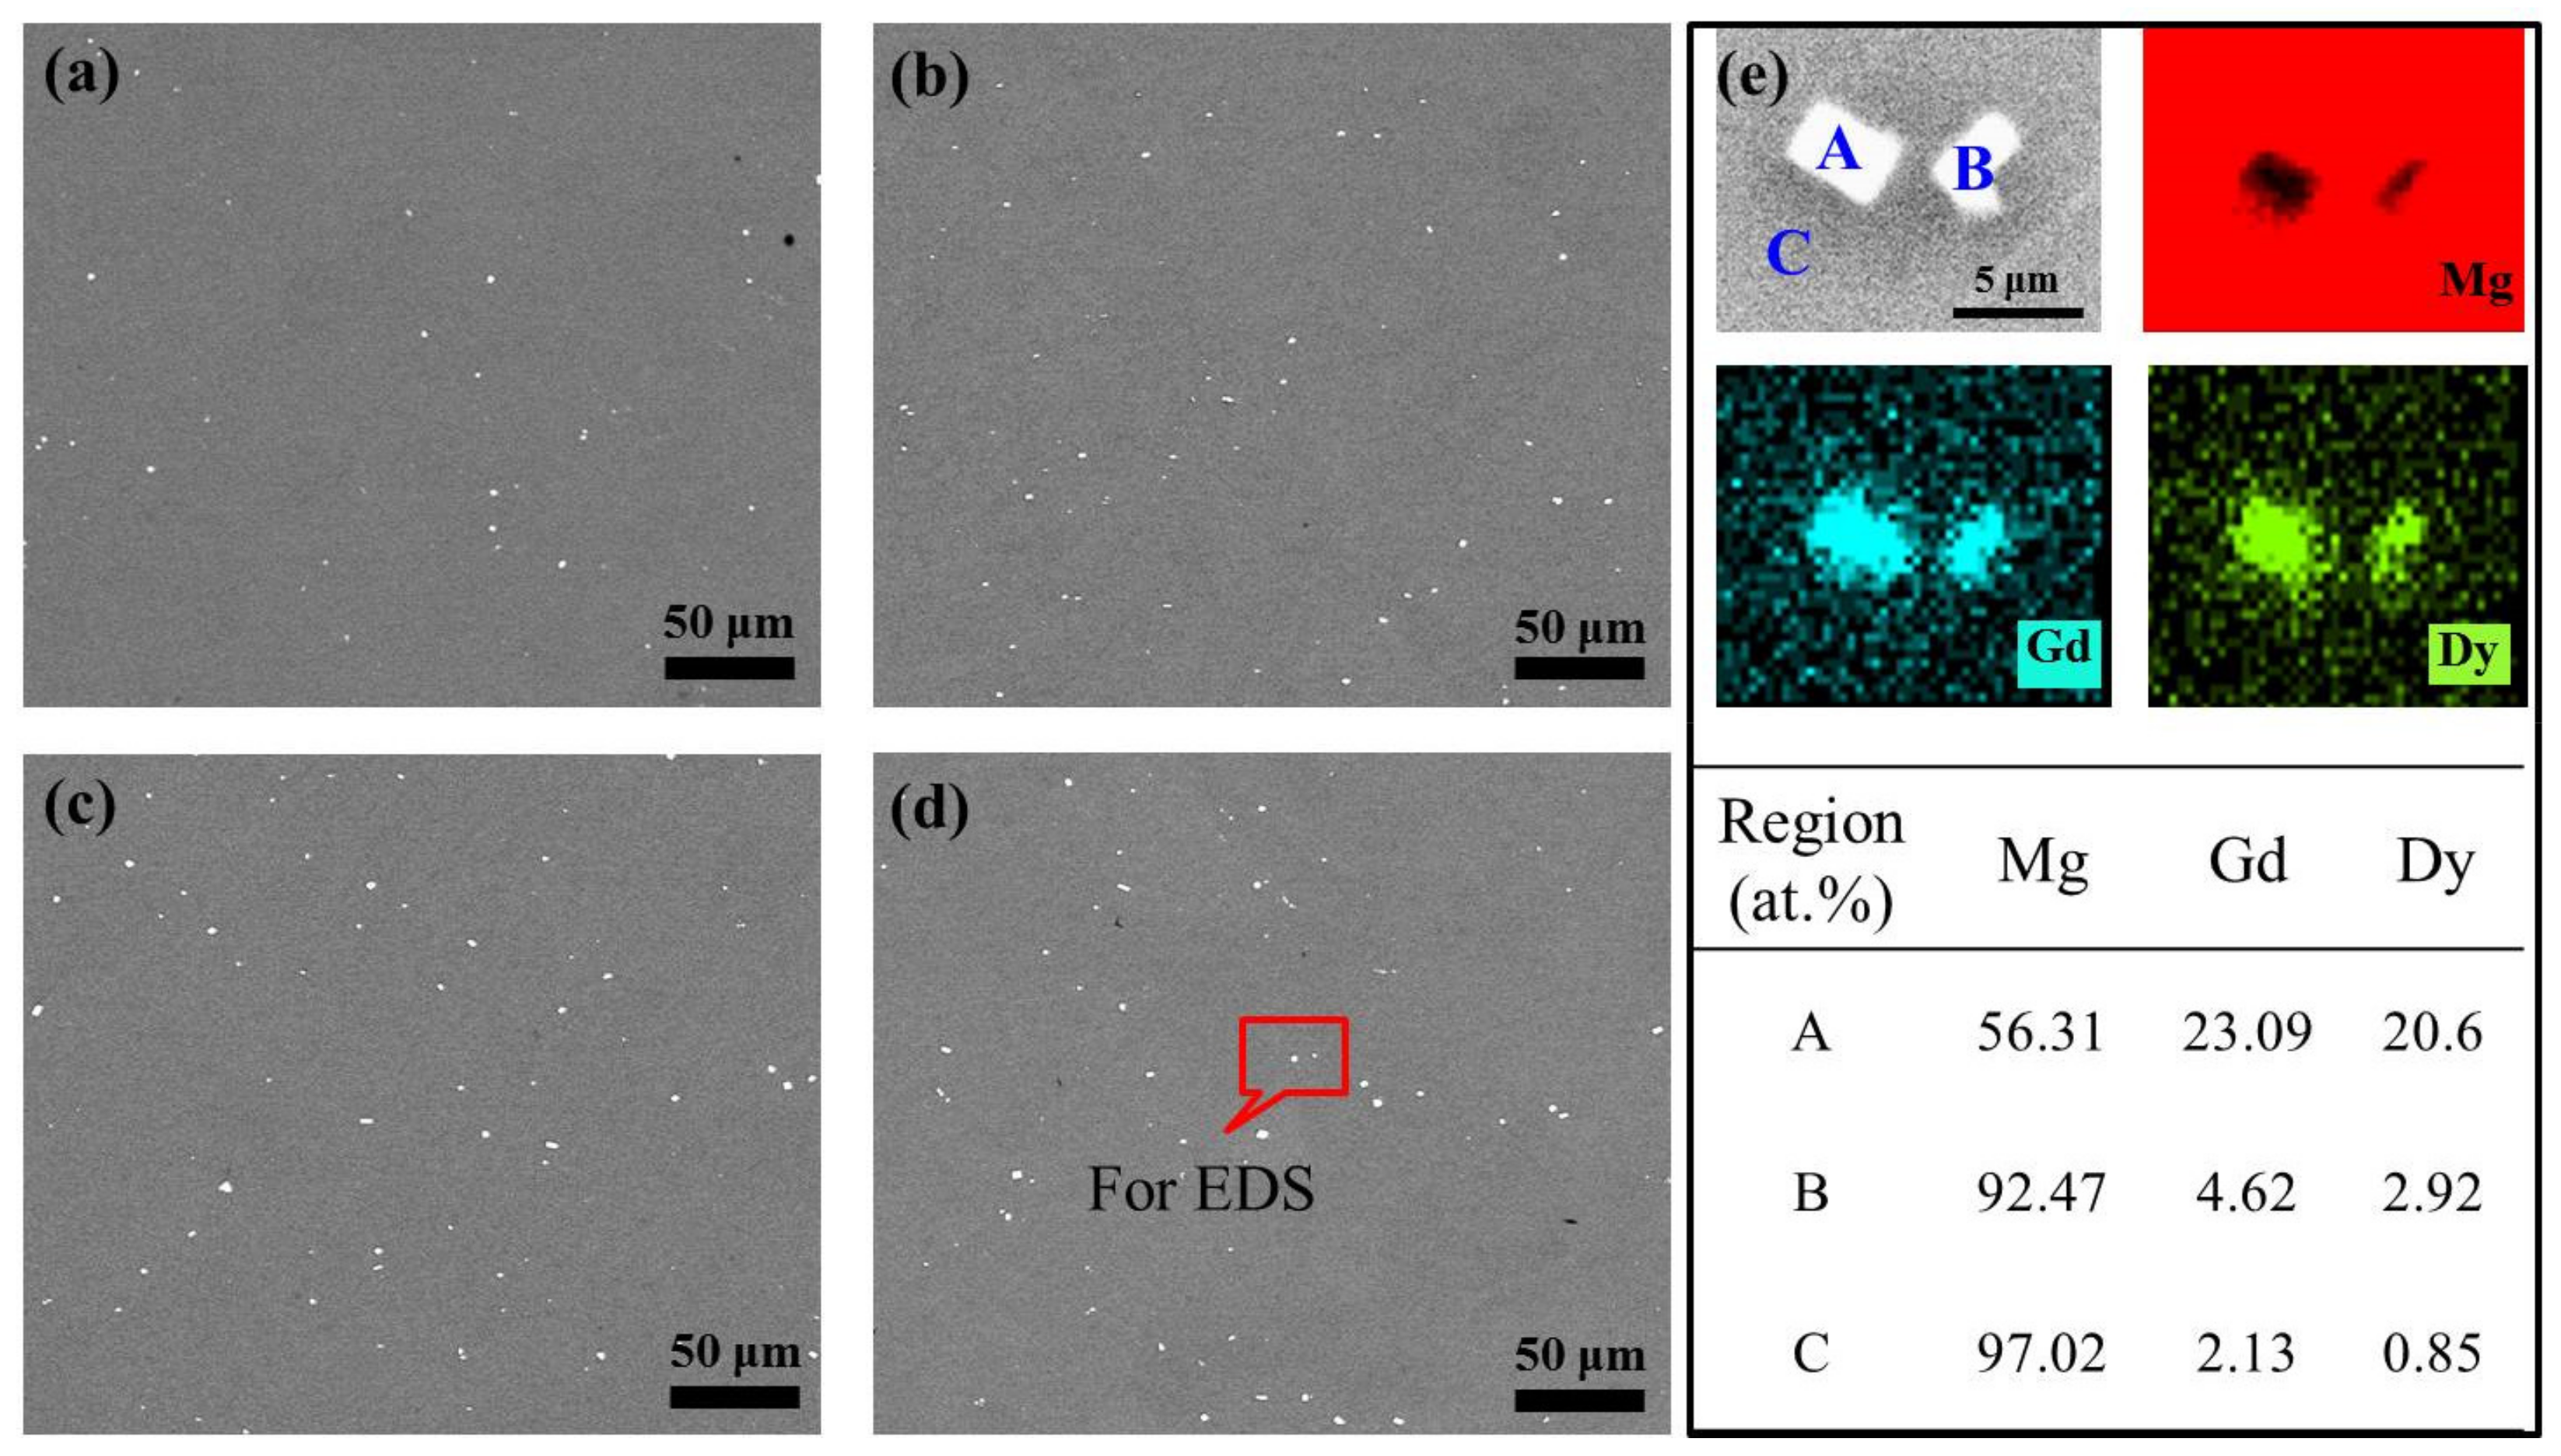
2.2. Microstructure and Phase Characterization

The samples (Φ8 × 3 mm3) for microstructural characterization were etched using acetic picral solution. The microstructure of the prepared samples was investigated using scanning electron microscopy (SEM, Quanta FEG250, FEI, Hillsboro, OR, USA) equipped with an energy dispersive spectrometer (EDS) operating at 20 kV. The electron backscattered diffraction (EBSD) analysis was performed using a FEI Quanta 650F SEM equipped with an HKL Channel 5 system, with a scanning step size of 3 μm. Specimens for EBSD testing were prepared by mechanical grinding and polishing, followed by electro-polishing in a 9:1 solution of ethanol and perchloric acid for 90 s at −20 °C. After electro-polishing, specimens were sonicated for 20 min in absolute ethanol to clean the surface. Figure 1 shows the SEM test region and EBSD imaging reference plane for the as-extruded Mg–Gd–Dy–Zr alloys, which was perpendicular to the extrusion direction. X-ray diffraction (XRD) was performed using an X-ray diffractometer (Rigaku D/Max 2500PC, Tokyo, Japan) with Cu-Kα radiation to identify the crystal structure of the phases. The scanning angle ranged from 10° to 85° with a scanning speed of 4°·min−1. The XRD pattern was made with MDI Jade 5.0 software (Materials Data Inc., Livermore, CA, USA).

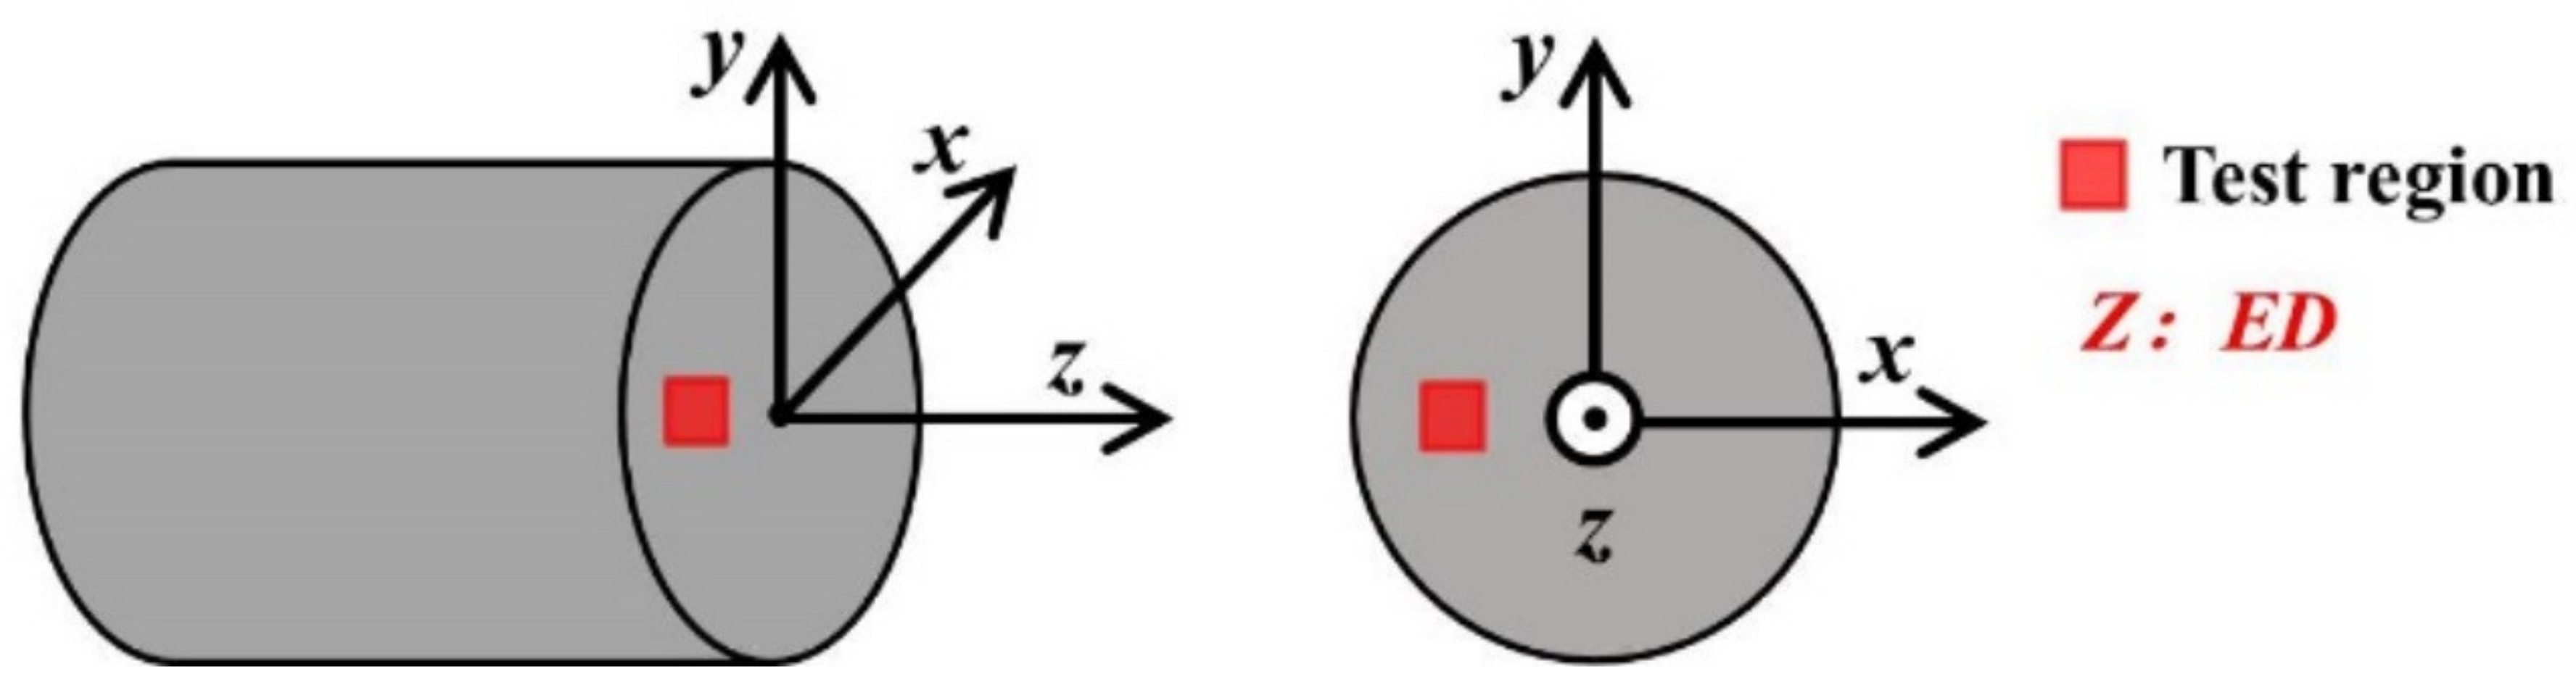
2.3. Electrochemical Measurement

The electrochemical corrosion behavior of the samples was investigated by electrochemical impedance spectroscopy and potentiodynamic polarization using an A Verserstat 3 (Gamry Reference 600+, Philadelphia, PA, USA) electrochemical workstation. Hank’s solution was served as the electrolyte for the electrochemical measurement. The chemical compositions are shown in Table 2. The solution with a pH value of 7.4 was prepared by A.R. grade chemicals. A typical three-electrode electrochemical system was used consisting of a sample as the working electrode, a saturated calomel electrode (SCE) as the reference electrode, and a platinum electrode as the counter electrode. The electrolyte was kept at 37 ± 0.5 °C. All samples were embedded in resin with 1 cm2 area exposed to the solution. The samples were allowed to stabilize at the open circuit potential (OCP) for 30 min before the measurements. Impedance measurements were carried out at the OCP as the initial potential using a 10 mV root-mean-square perturbation from 100 kHz to 10 mHz. Potentiodynamic polarization tests were conducted at a sweep rate of 0.5 mV/s within a scan range of ±0.25 V with reference to OCP. Fitting was performed with ZSimpwin software (Gamry, Philadelphia, PA, USA). Three duplicates were taken for statistical analysis for each group in order to control the experimental scatter for statistics.

2.4. Immersion Test

The samples were immersed in Hank’s solution at 37 ± 0.5 °C for 14 days with an immersion surface demission to liquid volume ratio of 1.25 cm2/mL. The immersion solution was refreshed every day to simulate the in vivo condition. The pH value of the solutions was recorded during the immersion process at intervals. After the immersions for seven days and 14 days, respectively, samples were taken for photos after gently rinsing with distilled water and then dried in air. Weight loss was measured to calculate the corrosion rate of the samples after removal of the corrosion products in chromic acid (200 g/L chromium trioxide and 10 g/L silver nitrate). The corrosion rate was calculated by the following equation:
Corrosion rate = (K × W)/(A × T × D)
where the coefficient K = 8.76 × 10⁴; W is the weight loss (g); A is the sample area exposed to the solution (cm2); T is the exposure time (h); and D is the density of the experimental material (g/cm3).

3. Results and Discussion

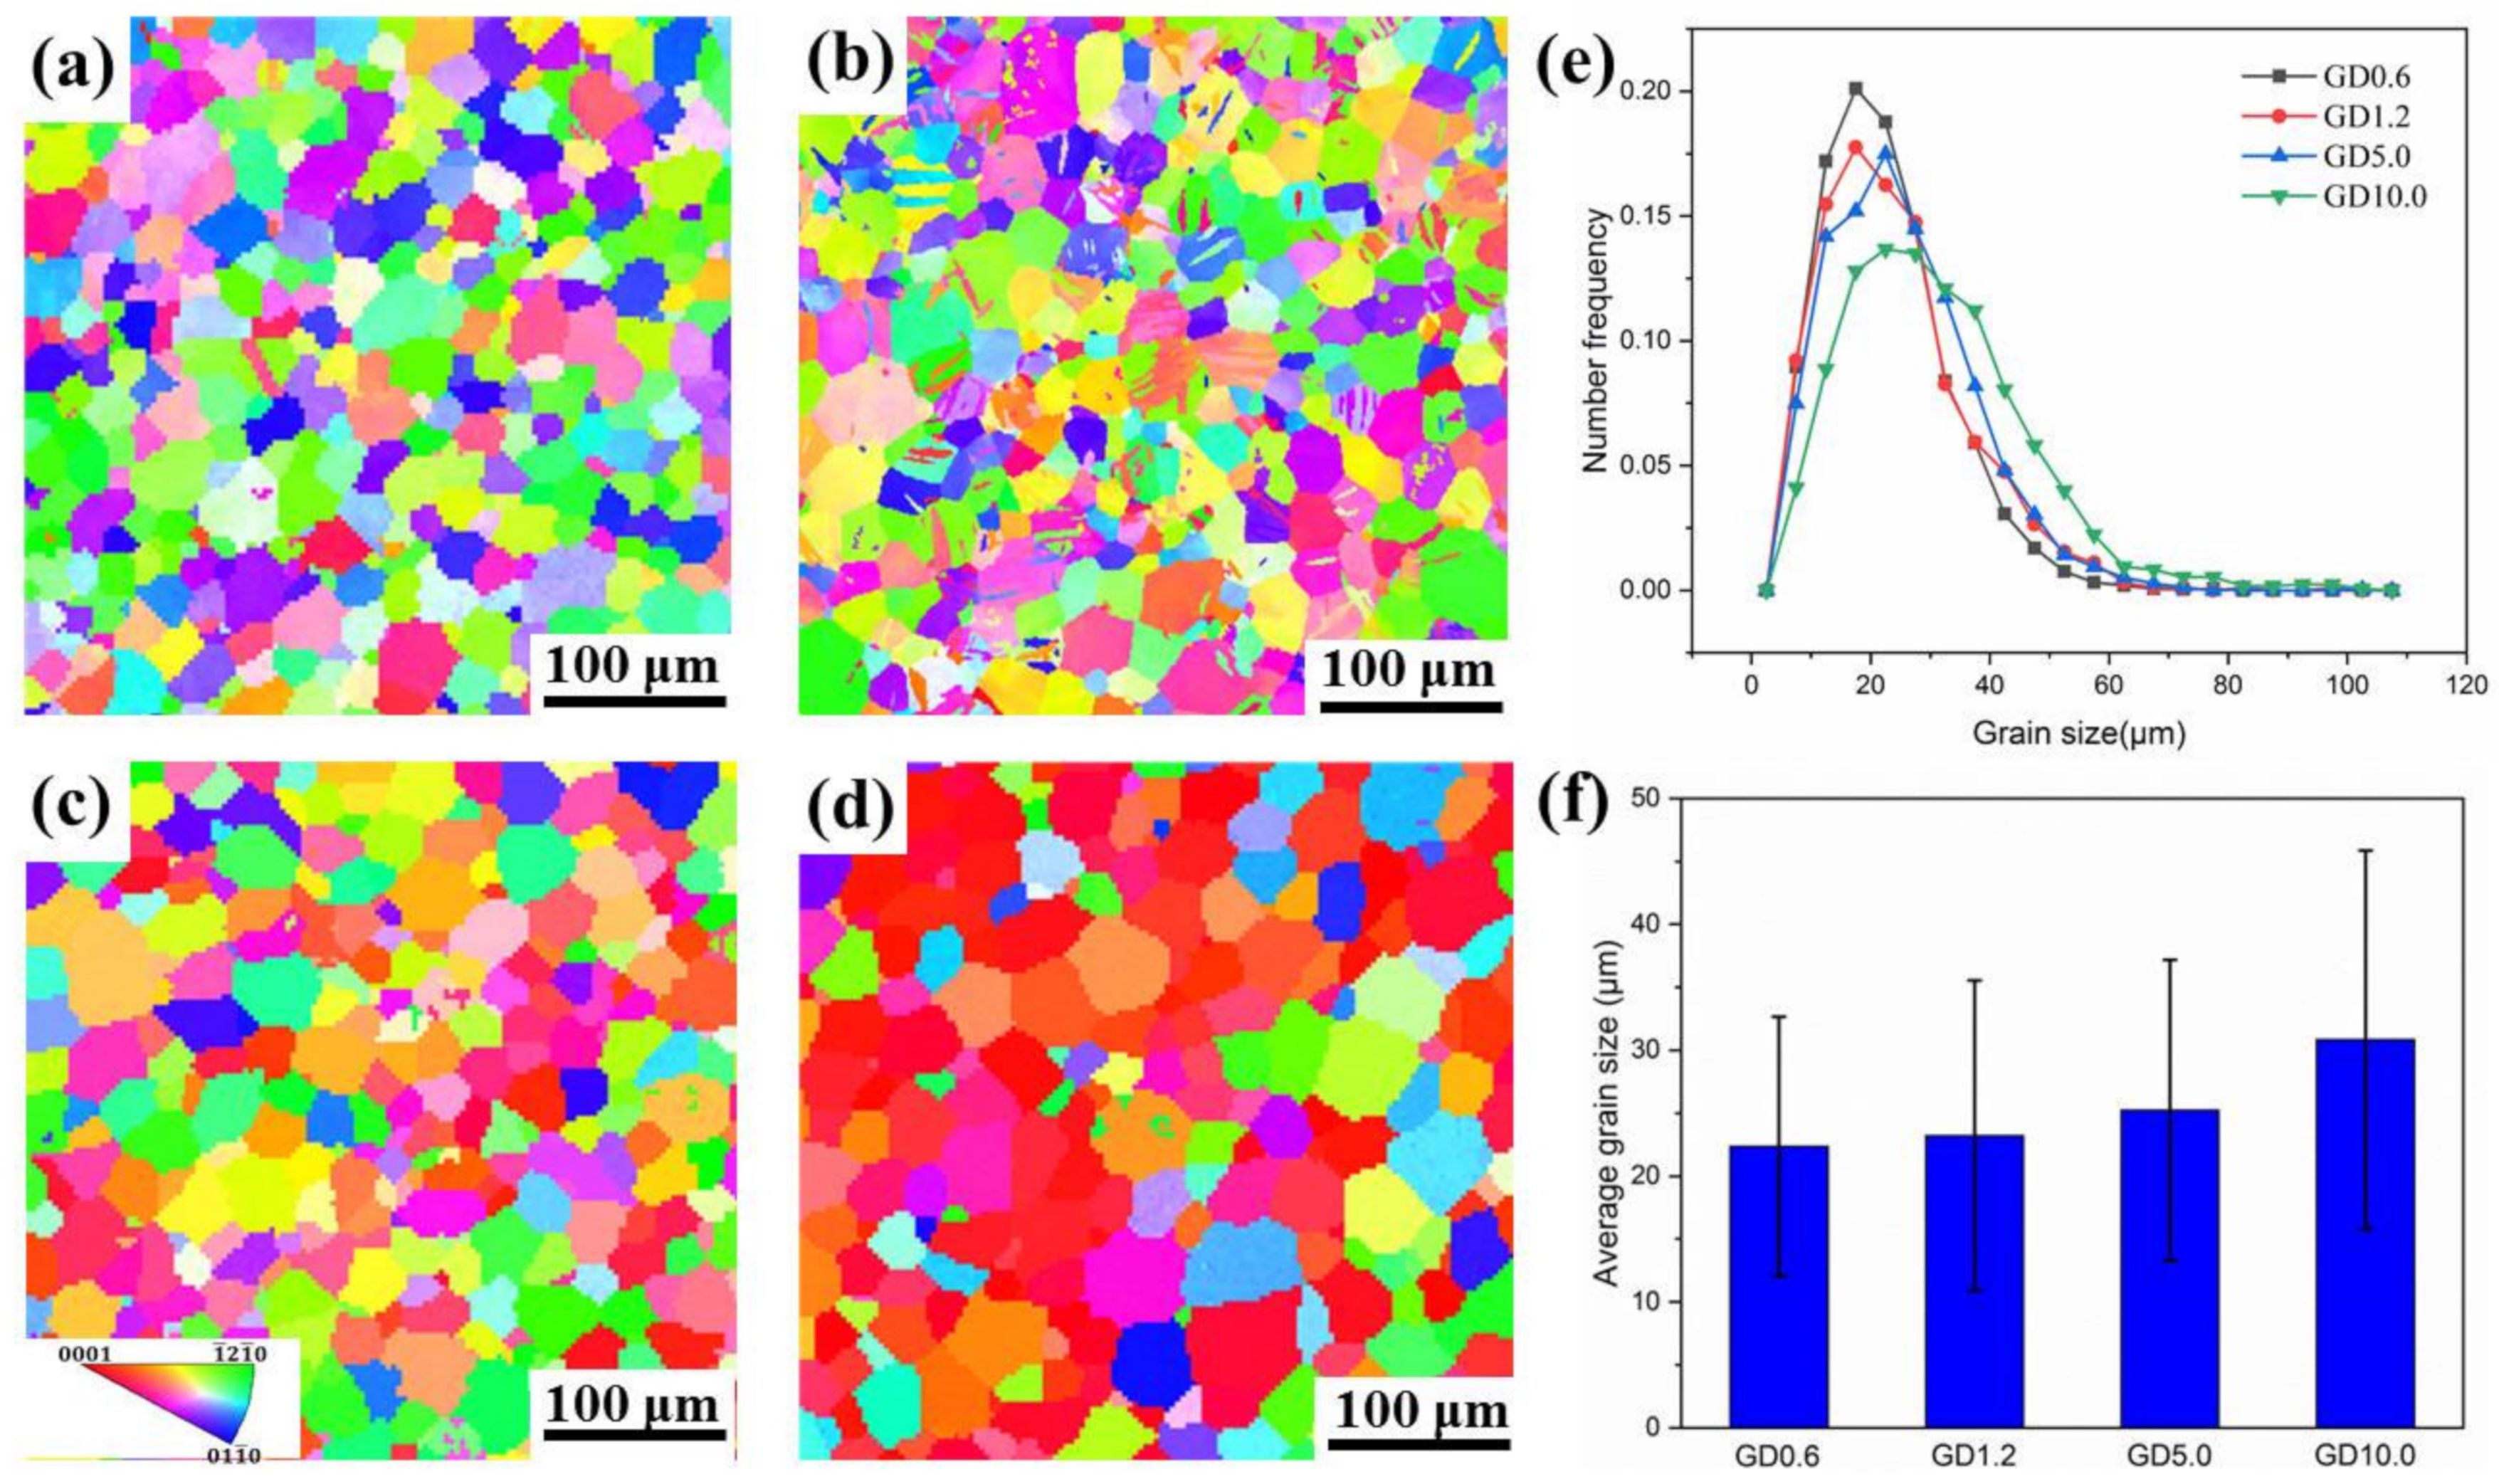
3.1. Microstructure Characterization

The EBSD analysis technique was used to characterize the microstructure characterization of the as-extruded Mg–Gd–Dy–Zr alloys with different RE additions. The EBSD results of each alloy were obtained from 1200 µm× 1200 µm area perpendicular to the extrusion direction. Figure 2a–d shows the EBSD inverse pole figure maps perpendicular to the direction of extrusion for the as-extruded Mg–Gd–Dy–Zr alloys, displaying that all four as-extruded alloys with different RE additions exerted fully recrystallized microstructures. Figure 2e presents the grain size distribution of the as-extruded Mg–Gd–Dy–Zr alloys, which is similar to Gauss distribution for each alloy. The peak area became wider when the RE addition was higher, which demonstrates that the grain size changed to non-uniformity in the high RE addition samples. Figure 2f shows the variation of average grain size with the increase in RE content in the as-extruded Mg–Gd–Dy–Zr alloys. The average grain size was appropriately between 20–30 μm for all the alloys and gradually increased by adding more RE. Such a phenomenon can also be found in other Mg–RE alloys [25,32,36,42]. This resulted from the combination of nucleation and growth for the recrystallization. The nucleation of recrystallization may be retarded when the rare earth element concentration is relatively high. However, once the nucleation formed, these recrystallized grains could grow without impinging by other grains. Eventually, it resulted in the larger grain size in high rare earth element concentration alloys compared with the low concentration alloys.
The main purpose of this paper was to improve the corrosion resistance of magnesium alloys by reducing the second phases to control galvanic corrosion. The XRD analysis was performed to preliminarily verify the presence or absence of the second phases in the as-extruded Mg–Gd–Dy–Zr alloys [25], and the results are shown in Figure 3. No sign of the second phases and only the constitution of α-Mg matrix could be detected in all XRD patterns. This indicates that the second phase can be efficaciously inhibited by adding alloying elements with high solid solubility in a magnesium alloy, in combination with homogenization heat treatment and extrusion deformation [43,44].
As XRD analysis has limited ability to detect the low content intermetallics in magnesium alloys, the SEM test was adopted to observe the second phase of alloys after the homogenization and extrusion process. Figure 4a–d shows the SEM microstructure of the as-extruded Mg–Gd–Dy–Zr alloys. It can be seen that there were a few very small second-phase particles dispersed in the α-Mg matrix and at the grain boundaries, even for the low RE concentration samples. The particles also increased slightly with the increase in RE content. In addition, the EDS analysis was conducted for the red selected area in Figure 4d and the distribution of elements is shown in Figure 4e. The small rectangular white region, irregularly shaped white region, and the matrix are labeled with A, B, and C, respectively. For region A, the Gd and Dy contents were 23.09 at% and 20.6 at%, respectively, which were relatively higher than the stoichiometry of the Mg5RE compound, a typical second phase considered in previous Mg–RE publications [44,45]. For region B, the relative low RE content suggests that it is accompanied by precipitation and segregation. The precipitate size was less than 5 μm. The low Gd and Dy content in region C indicate that RE remained predominately in the solute state in the Mg matrix.

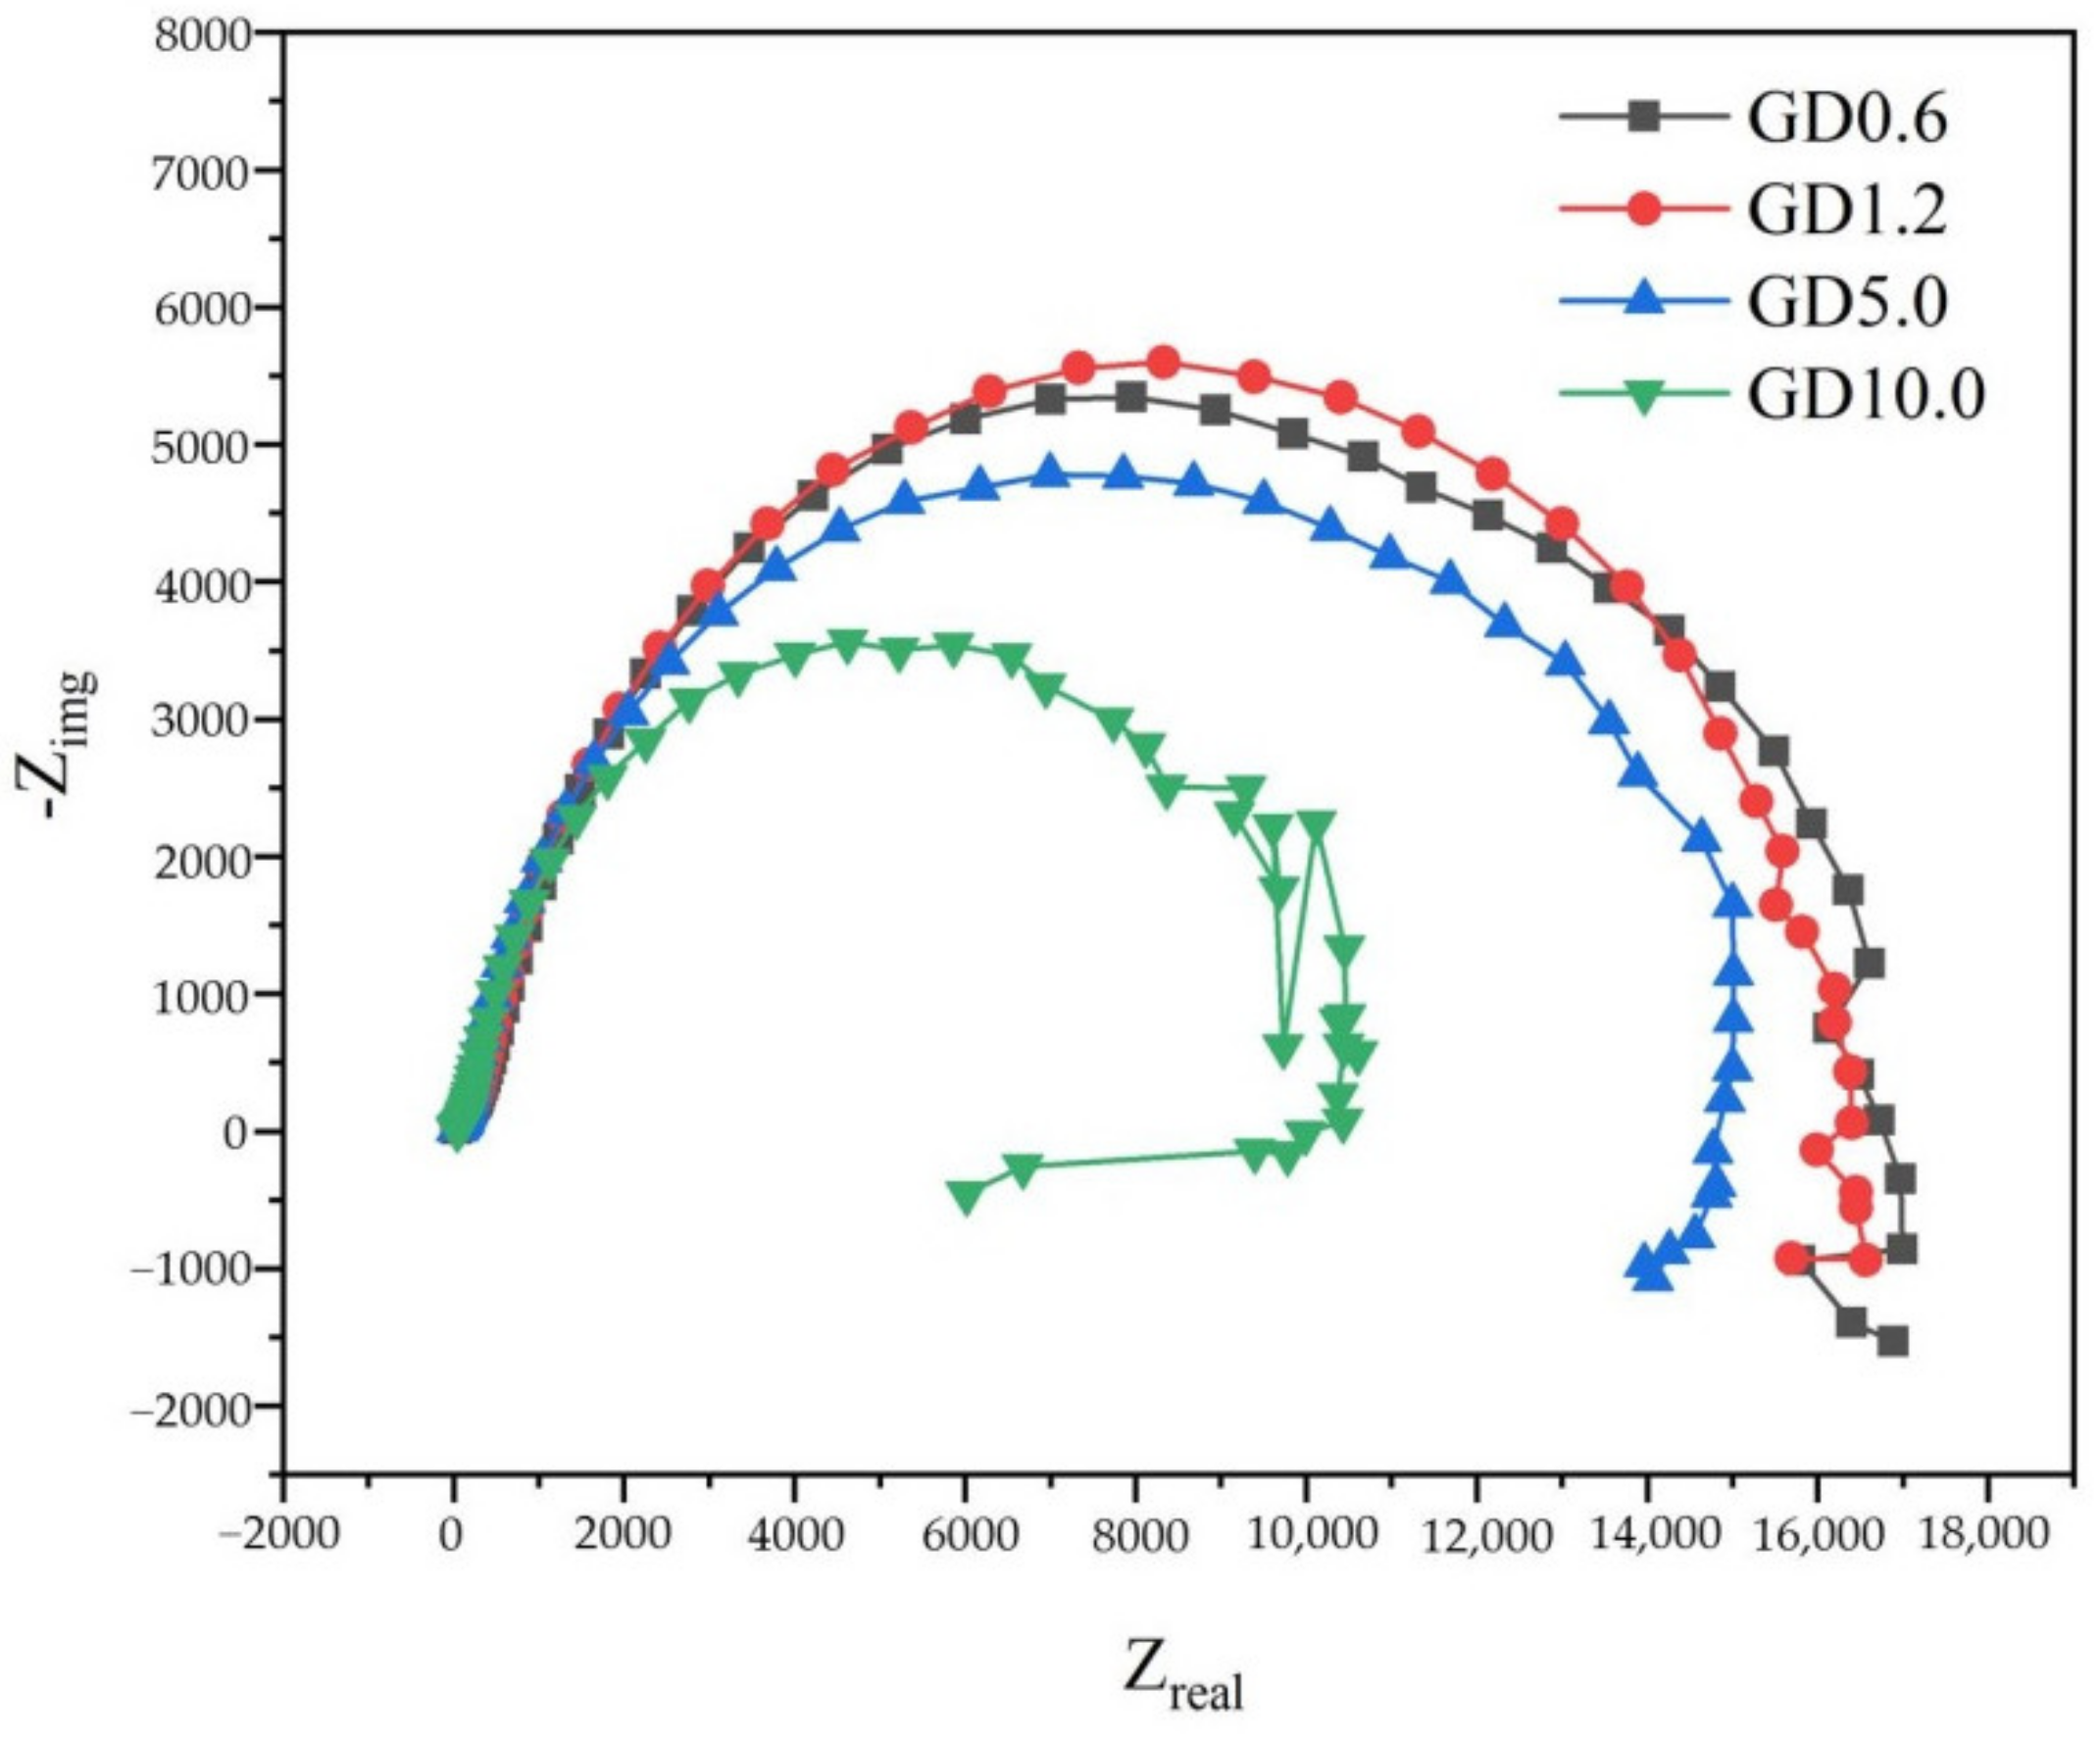
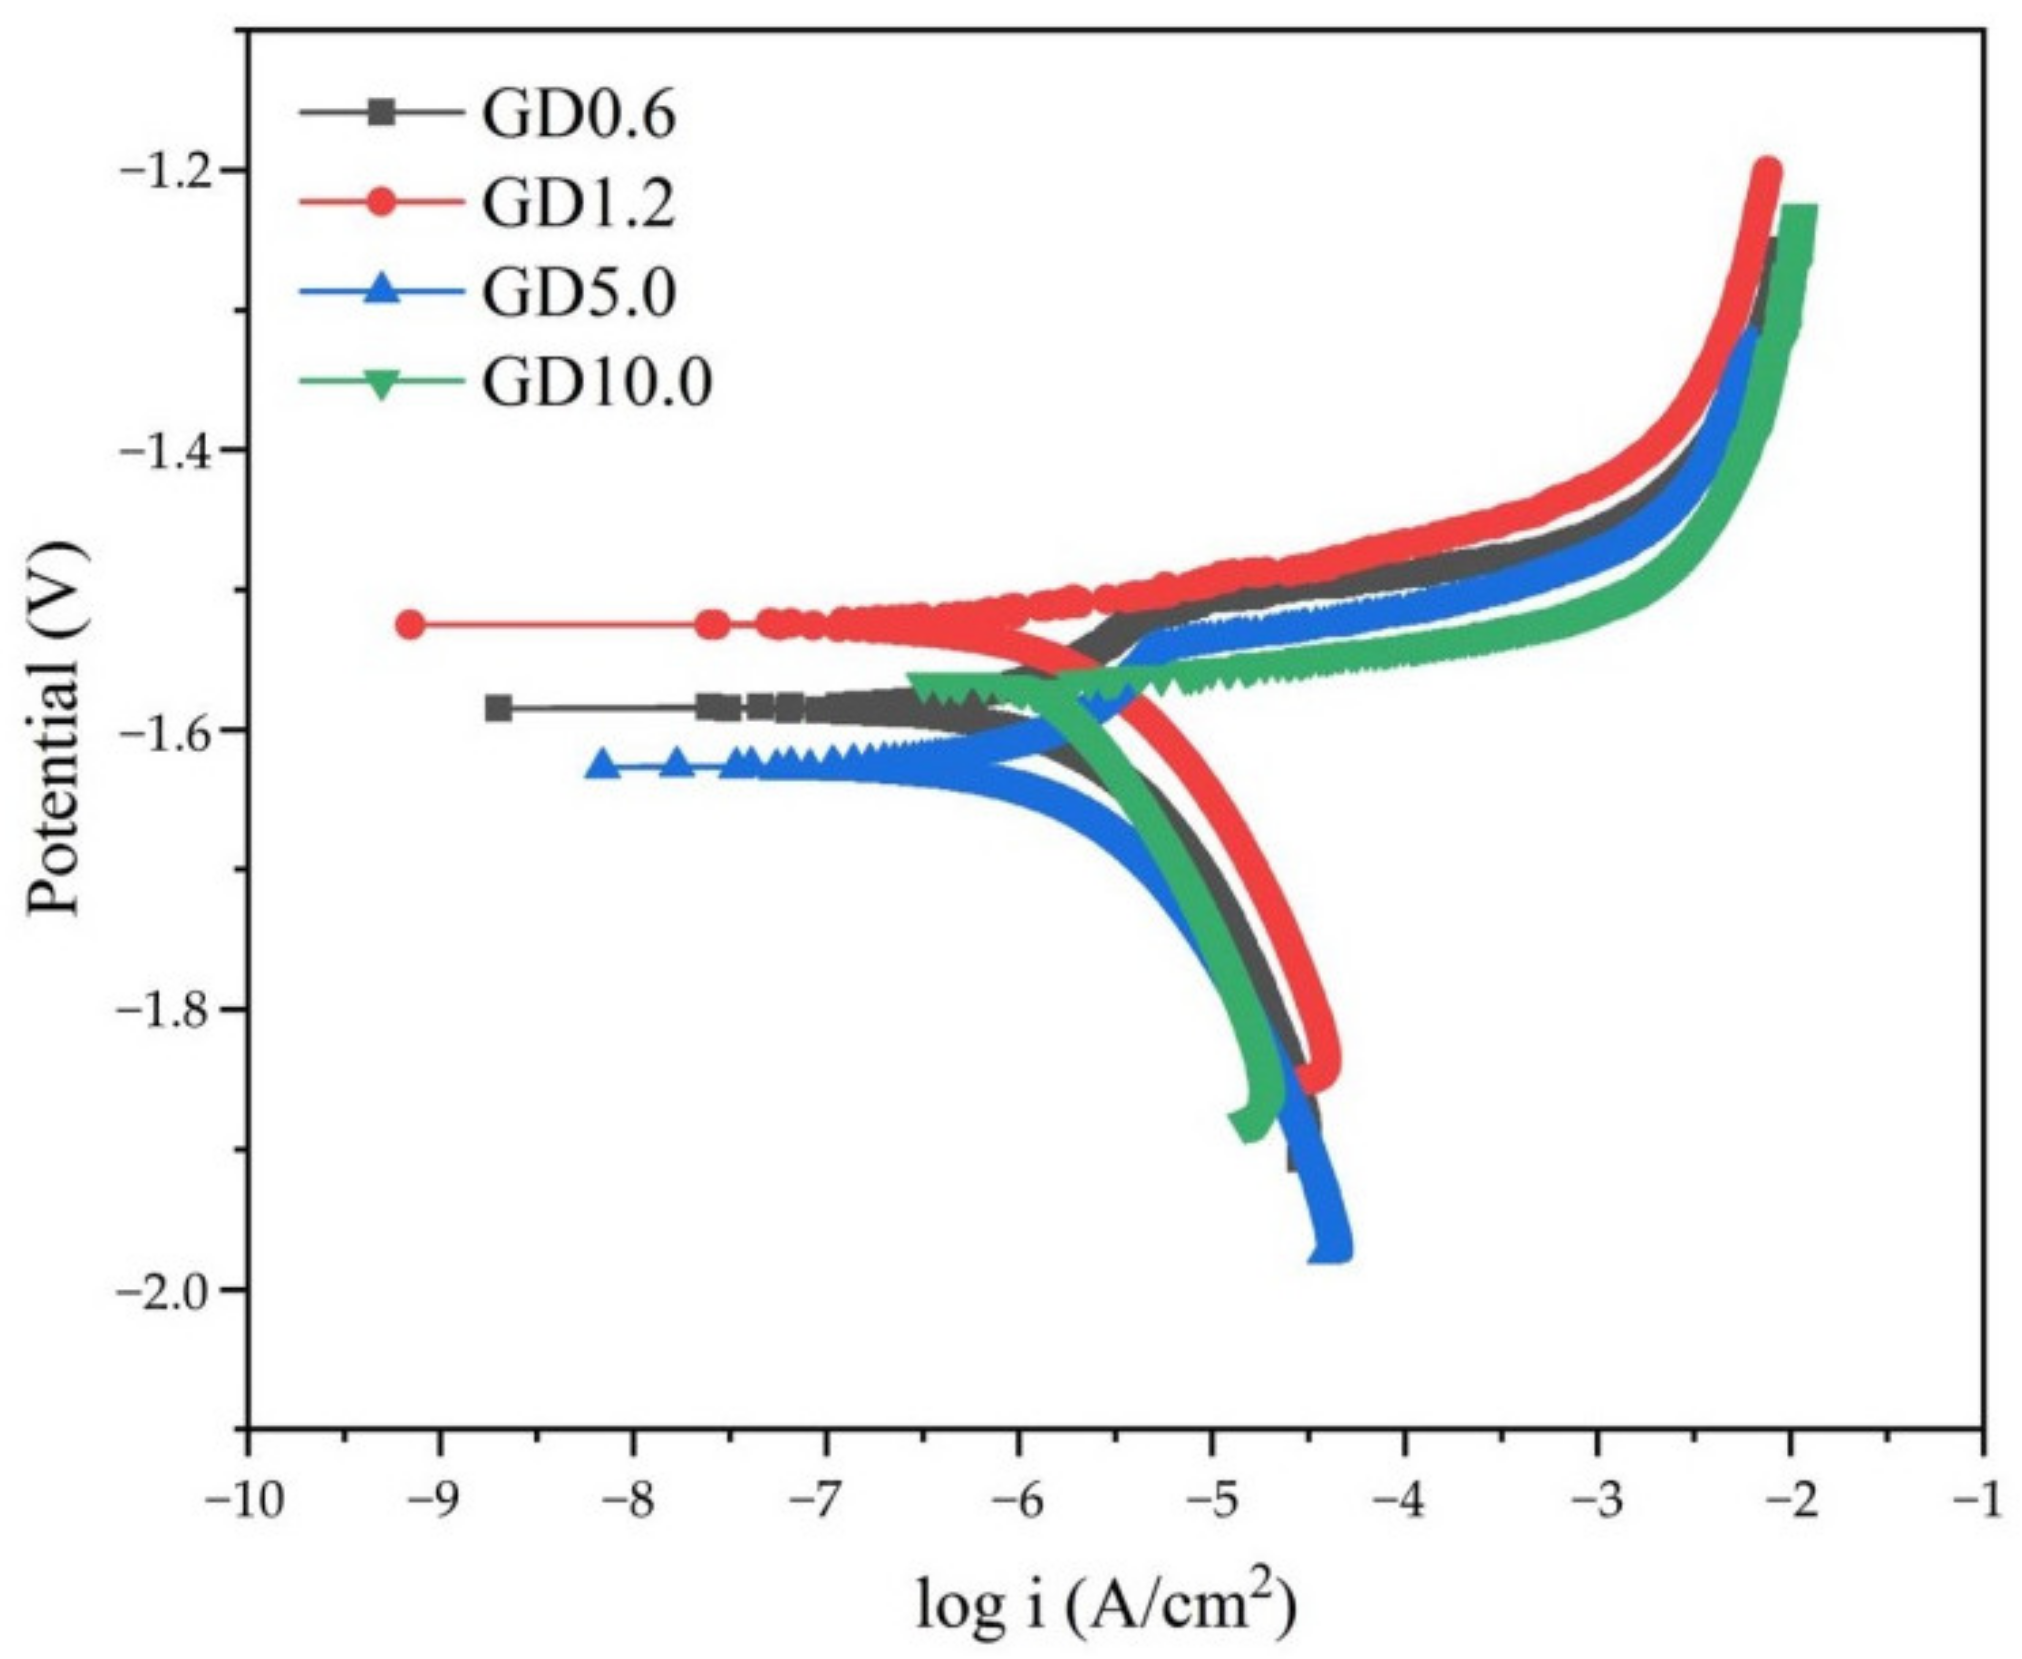
3.2. Electrochemical Behaviors

Electrochemistry measuring analysis was carried out to predict the corrosion resistance of the as-extruded Mg–Gd–Dy–Zr alloys. Electrochemical impedance spectroscopy uses small amplitude sine wave electrical signals to disturb the system. During the test process, it is close to the stable equilibrium state, which can reflect the corrosion behavior of the material in the stable equilibrium state. Impedance spectrum arc is composed of a high frequency region and low frequency region. The capacitive loop at high frequency is ascribed to the charge transfer resistance and that at low frequency is attributed to the diffusion through the outer surface layer [15]. The larger the arc diameter, the better the corrosion resistance of the material. Figure 5 shows the Nyquist plots for the as-extruded Mg–Gd–Dy–Zr alloys in Hank’s solution. It can be seen from Figure 5 that the shape of the impedance spectrum changes with the increase in RE content in the alloys. The sizes of the capacitive loop of GD0.6 and GD1.2 samples were relatively similar and obviously larger in comparison with those of the GD5.0 and GD10.0 samples in the same solution, which demonstrated that GD0.6 and GD1.2 should possess higher corrosion resistance. GD10.0 had the minimum capacitive loop radius and hence the worst corrosion resistance. Furthermore, for the GD5.0 and GD10.0 samples, an inductive loop could be observed, usually associated with adsorption phenomena.
Figure 6 shows the polarization curves of the as-extruded Mg–Gd–Dy–Zr alloy samples immersed in Hank’s solution. The corrosion potential (E0), the current density (I0), polarization resistance (Rp), and corrosion rate (CR) calculated according to the ASTM-G102-89 standard are listed in Table 3. According to the results of Figure 6 and Table 3, there were no significant differences among the PD curve changes for all Mg–Gd–Dy–Zr alloys. The E0 was between −1.63 and −1.52 V and there was little significant difference among all the test samples. I0 and Rp were all intermediate in the same order of magnitude. The corrosion rate was judged under the influence of both anode and cathode reactions. In general, excellent corrosion resistance could be obtained with a more electropositive potential, lower I0, and higher Rp at the same time. If the above conditions cannot be met at once, the corrosion rate should be considered comprehensively. The corrosion rates calculated by the Tafel fitting parameters were all less than 0.5 mm/year, which is considered as the tolerance limit for the corrosion rate of orthopedic implants by the electrochemistry test [46]. The minimum corrosion rate was only 0.05 mm/year, as acquired by GD1.2. However, potentiodynamic polarization is an instantaneous reaction experiment, which represents a corrosion snapshot during the performed time. It can show the early stages of corrosion, but does not necessarily represent all corrosion points in time.

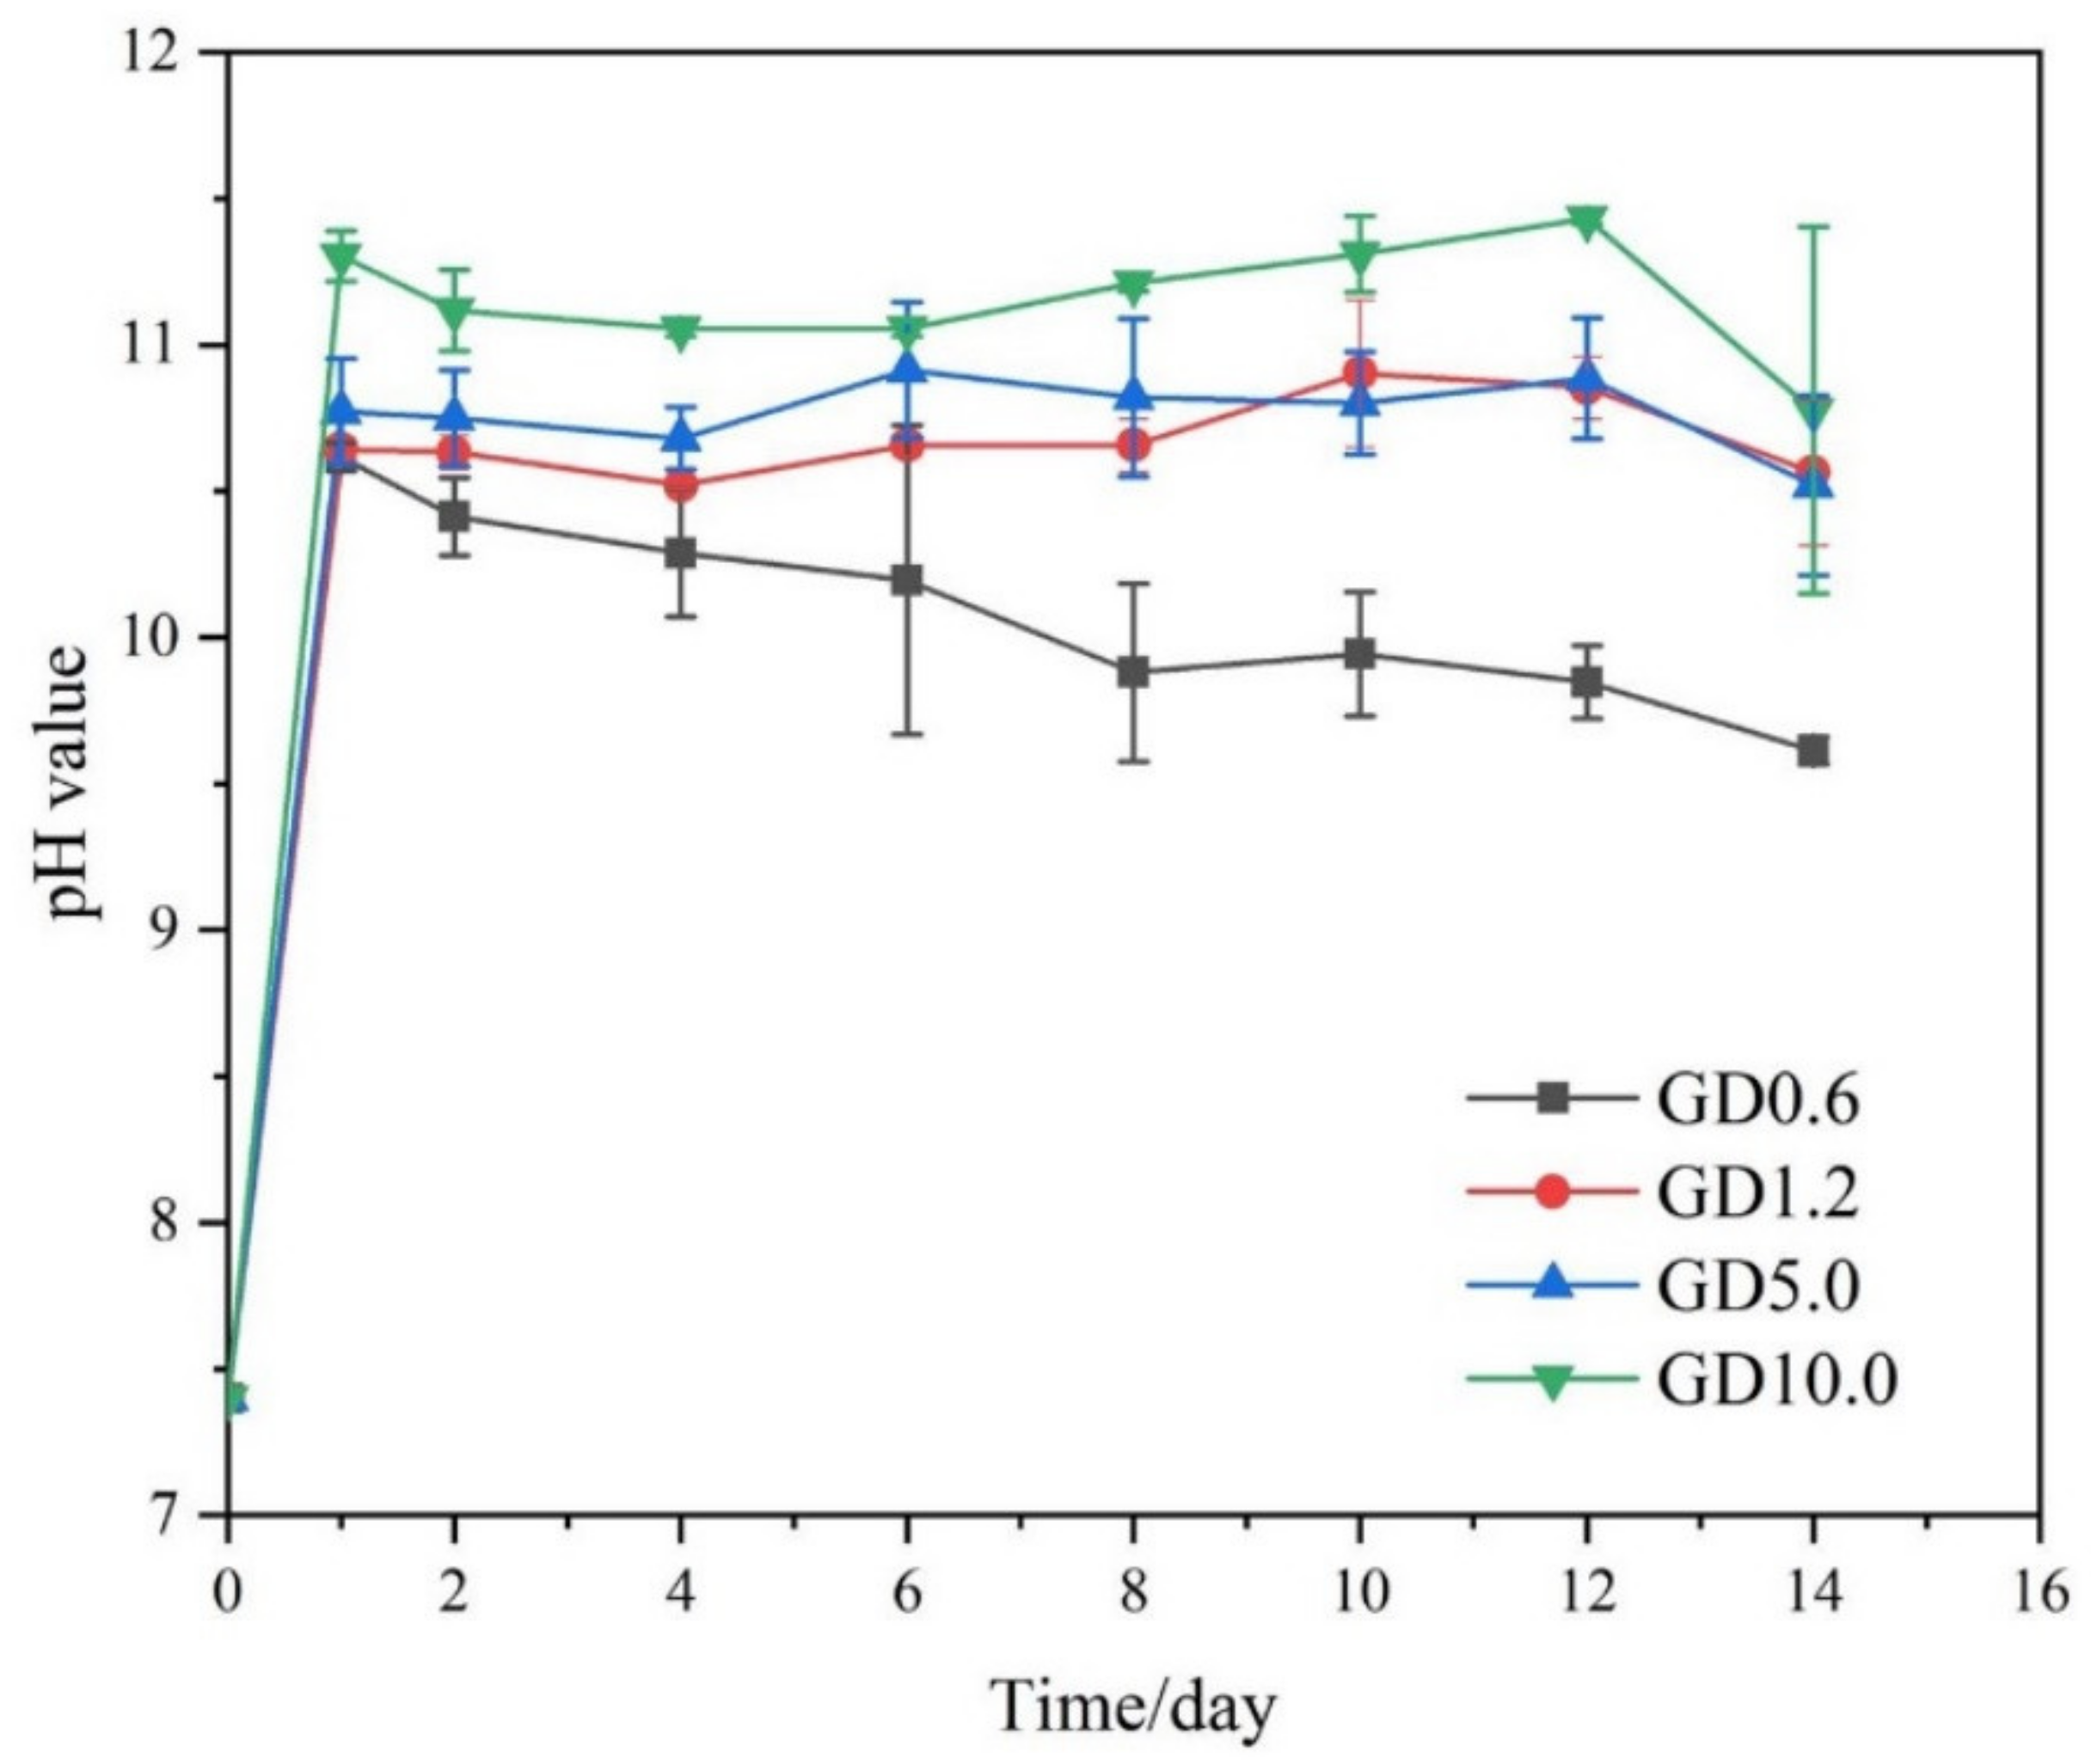
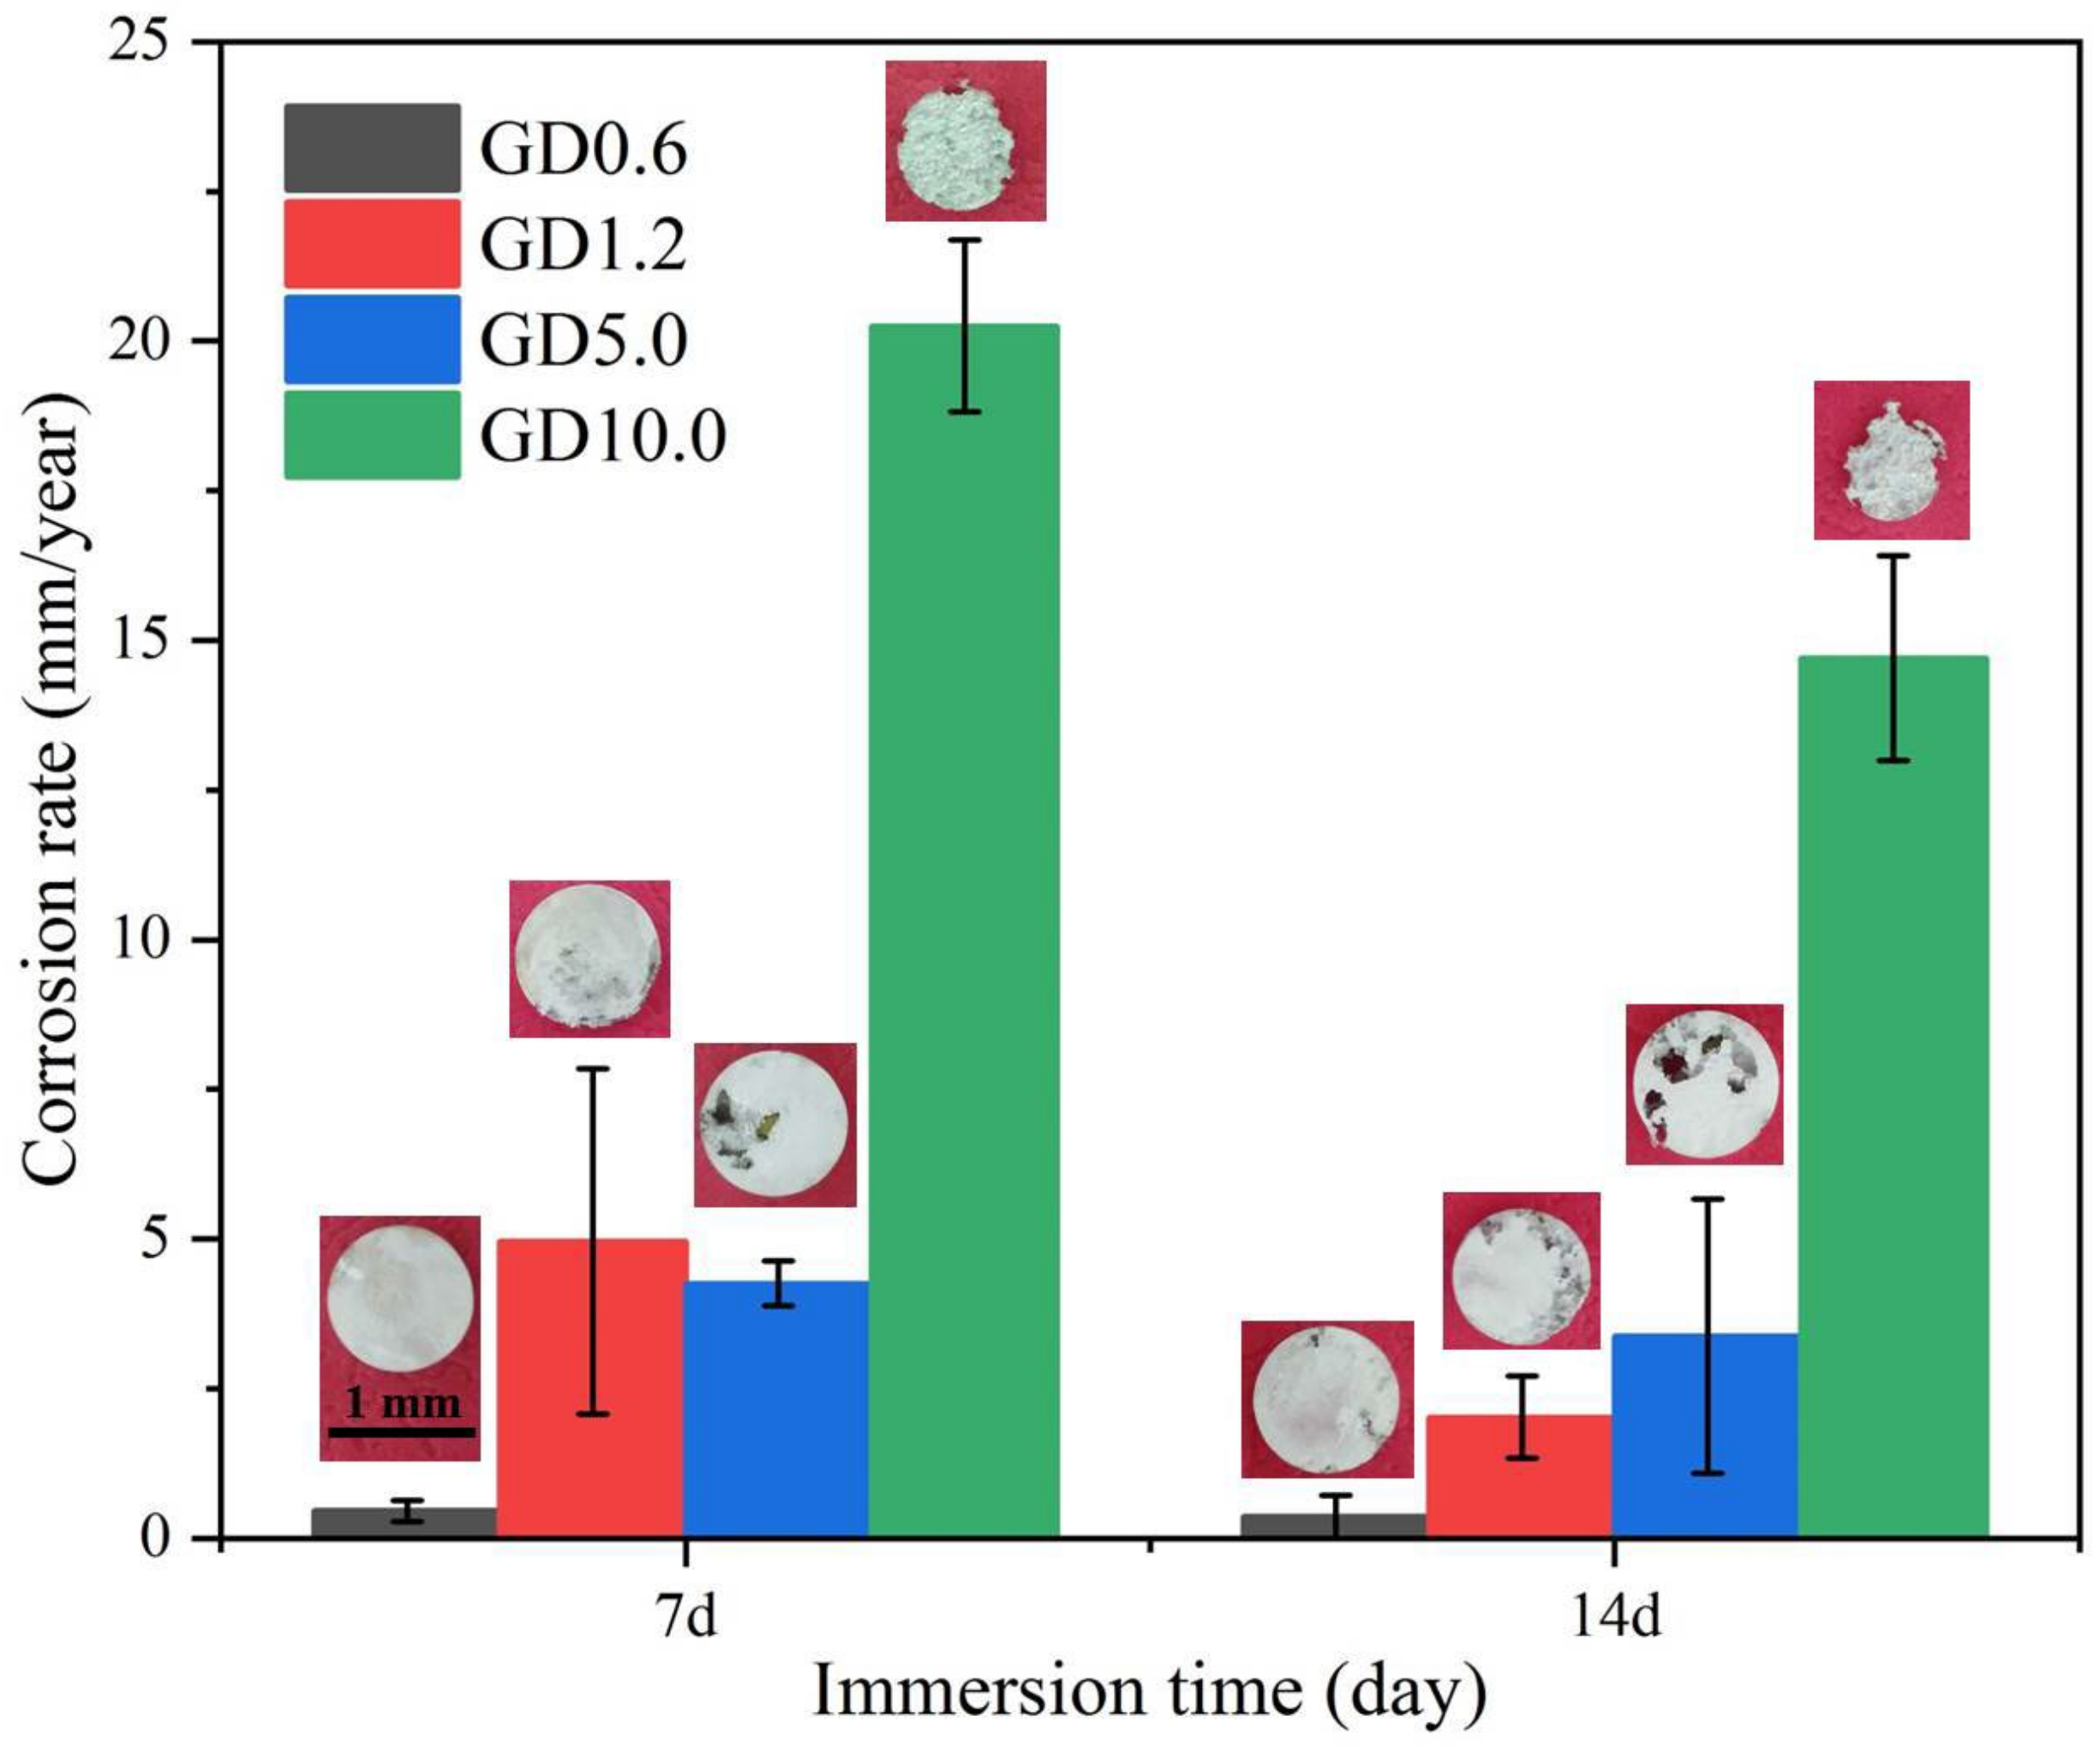
3.3. Immersion Behaviors

Immersion tests were undertaken to evaluate the long-term corrosion resistance of the as-extruded Mg–Gd–Dy–Zr alloys. The changes in pH values of the as-extruded Mg–Gd–Dy–Zr alloys with different amounts of RE elements immersed in Hank’s solutions for 14 days are shown in Figure 7. The pH values of all four alloys increased first and then decreased with prolonged immersion time. This is because the magnesium matrix reacts with Cl, CO32−, PO43−, and HPO32− plasma in Hank’s solution when the sample surface and solution make contact directly at the early stage of immersion, generating a large amount of Mg(OH)2 and releasing a large amount of H2 on the surface of sample. The increase in OH caused the pH value to rise rapidly. With the extension of immersion time, corrosion products are generated on the sample surface, which reduces the direct contact between the material surface and the solution and inhibits the continuous corrosion, so the pH decreases to varying degrees. Comparing the pH values of the as-extruded Mg–Gd–Dy–Zr alloys with different contents of Gd and Dy, it can be found that after one day of immersion, the pH from high to low was GD10.0, GD5.0, GD1.2, and GD0.6, indicating that GD0.6 exhibited the best corrosion resistance at the early stage of corrosion. The pH value of GD0.6 was always the lowest with the immersion time extended. After immersion for 10 days, the pH curves of GD1.2 and after the formation of the product film on the surface of the materials, while the pH value of GD10.0 consistently remained at a high level, implying the worst corrosion resistance.
After cleaning the surface products of the samples with chromic acid, corrosion performance evaluations by weight loss after immersion of seven days and 14 days were analyzed and illustrated graphically as corrosion rates in Figure 8. The results showed that the corrosion rates of all the as-extruded Mg–Gd–Dy–Zr alloys after 14 days of immersion lower than those after seven days. This is mainly because with the progress of corrosion, degradation products produced on the sample surface could slow down the corrosion to a certain extent. These results are consistent with the pH variation shown in Figure 7. The in vitro corrosion rates of the as-extruded Mg–Gd–Dy–Zr alloys displayed an upward trend with increasing amounts of RE contents after both seven days and 14 days of immersion. The minimum corrosion rate of GD0.6 was 0.46 mm/year and 0.36 mm/year after seven days and 14 days, respectively. It was found that with the addition of Gd and Dy, the second phases precipitated in the α-Mg matrix and at grain boundaries. As confirmed by the microstructure and weight loss experimental results, the size and content of the precipitated phase of GD0.6 and GD10.0 were relatively small, but the corrosion rate was an order of magnitude different. It is speculated that more Gd and Dy elements dissolved in the α-Mg matrix have a negative effect on the corrosion resistance. Based on the results of the electrochemical experiment and immersion experiment, it is suggested that the as-extruded Mg–Gd–Dy–Zr alloys with low RE content (GD0.6) exhibited a satisfactory controlled degradation in Hank’s solution. Based on previous reports, despite the numerous positive aspects of RE elements that have been found in Mg alloys, their application is still hindered by the high cost at the commercial level for Mg alloys. Therefore, the magnesium alloy with low rare earth content obtained in this paper provides a choice for promoting biodegradable magnesium alloy for potential orthopedic applications with more cost-effective performance.

4. Conclusions

The microstructure characterization and in vitro degradation behavior of the as-extruded Mg–xGd–0.5xDy–0.2Zr (x = 0.6, 1.2, 5.0, and 10.0, mass fraction) alloys were studied. All four as-extruded alloys with different RE additions exerted fully recrystallized microstructures. The average grain size was from appropriately 20 to 30 μm for all alloys and gradually increased by adding more Gd and Dy. A few very small second-phase particles less than 5 μm dispersed, even for the low RE concentration samples. The volume fraction of particles increased slightly with the increase in RE content. The as-extruded Mg–Gd–Dy–Zr alloys with low RE content (GD0.6) allowed for a satisfactory corrosion resistance in Hank’s solution with a controlled corrosion rate of less than 0.5 mm/year, which is considered as the tolerance limit for the corrosion rate of orthopedic implants.

Author Contributions

Conceptualization, C.L. and J.W.; methodology, Y.F.; software, S.Z.; validation, C.L., J.W. and Y.X.; formal analysis, X.C.; investigation, Z.C.; resources, C.L.; data curation, J.H.; writing—original draft preparation, C.L.; writing—review and editing, C.L. and J.W.; visualization, Y.X.; supervision, J.W.; project administration, X.Z.; funding acquisition, C.L. and J.W. All authors have read and agreed to the published version of the manuscript.

Funding

This work was financially supported by the Major Special Projects of the Plan “Science and Technology Innovation 2025” (Nos. 2019B10105, 2019B10086, 2020Z096), Ningbo Natural Science Foundation (No. 202003N4340), and the National Natural Science Foundation of China (Project No.: 52073030).

Acknowledgments

The authors would like to thank the helps with experiments from all members of the Integrated Computational Materials Engineering lab, Beijing Institute of Technology, especially Xin Li. The assistance with data analysis from all researchers at the Light Metal group of Ningbo Branch of Chinese Academy of Ordnance Science are also greatly appreciated.

Conflicts of Interest

The authors declare no conflict of interest.

References

  1. Chen, J.; Tan, L.; Yu, X.; Etim, I.P.; Muhammad, I.; Ke, Y. Mechanical properties of magnesium alloys for medical application: A review. J. Mech. Behav. Biomed. Mater. 2018, 87, 68–79. [Google Scholar] [CrossRef]
  2. Chen, Y.; Xu, Z.; Smith, C.; Sankar, J. Recent advances on the development of magnesium alloys for biodegradable implants. Acta Biomater. 2014, 10, 4561–4573. [Google Scholar] [CrossRef] [PubMed]
  3. Dong, J.; Tan, L.; Yang, K. Research of Biodegradable Mg-Based Metals as Bone Graft Substitutes. Acta Metall. Sin. 2017, 53, 1197–1206. [Google Scholar]
  4. Han, H.; Jun, I.; Seok, H.; Lee, K.; Edwards, J.R. Biodegradable Magnesium Alloys Promote Angio-steogenesis to Enhance Bone Repair. Adv. Sci. 2020, 7, 202000800. [Google Scholar] [CrossRef]
  5. Chen, L.; Zheng, R.; Yongdong, X.; Song, P.; Xinbing, Z.; Ying, Z. Biodegradable Magnesium Alloys Developed as Bone Repair Materials: A Review. Scanning 2018, 2018, 9216314 . [Google Scholar]
  6. Liu, C.; Fu, X.; Pan, H.; Wan, P.; Wang, L.; Tan, L.; Wang, K.; Zhao, Y.; Yang, K.; Chu, P.K. Biodegradable Mg-Cu alloys with enhanced osteogenesis, angiogenesis, and long-lasting antibacterial effects. Sci. Rep. 2016, 6, 27374. [Google Scholar] [CrossRef] [PubMed] [Green Version]
  7. Ikoma, M.; Morishige, T.; Kikuchi, T.; Yoshida, R.; Takenaka, T. Corrosion Resistance of Mg Alloy with High Zn Concentration Including Impurity Cu. Mater. Sci. Forum 2021, 1016, 592–597. [Google Scholar] [CrossRef]
  8. Chen, J.; Zhu, X.; Etim, I.P.; Siddiqui, M.A.; Su, X. Comparative study of the effects of MAO coating and Ca-P coating on the biodegradation and biocompatibility of Mg69Zn27Ca4 metal glass. Mater. Technol. 2020, 37, 21–27. [Google Scholar] [CrossRef]
  9. Chen, J.X.; Zhu, X.Y.; Tan, L.L.; Yang, K.; Su, X.P. Effects of ECAP Extrusion on the Microstructure, Mechanical Properties and Biodegradability of Mg–2Zn–xGd–0.5Zr Alloys. Acta Metall. Sin. (Engl. Lett.) 2021, 34, 205–216. [Google Scholar] [CrossRef]
  10. Liu, C.; Wan, P.; Tan, L.L.; Wang, K.; Yang, K. Preclinical investigation of an innovative magnesium-based bone graft substitute for potential orthopaedic applications. J. Orthop. Transl. 2014, 2, 139–148. [Google Scholar] [CrossRef] [Green Version]
  11. Atrens, A. Numerical modelling of galvanic corrosion of magnesium (Mg) alloys. In Corrosion of Magnesium Alloys; Elsevier: Amsterdam, The Netherlands, 2011; pp. 455–483. [Google Scholar]
  12. Song, Y.; Shan, D.; Han, E.H. Pitting corrosion of a Rare Earth Mg alloy GW93. J. Mater. Sci. Technol. 2017, 9, 50–56. [Google Scholar] [CrossRef]
  13. Li, L.; Nam, N.D. Effect of yttrium on corrosion behavior of extruded AZ61 Mg alloy. J. Magnes. Alloys 2016, 4, 44–51. [Google Scholar] [CrossRef] [Green Version]
  14. Wang, S.D.; Xu, D.K.; Wang, B.J.; Han, E.H.; Dong, C. Effect of corrosion attack on the fatigue behavior of an as-cast Mg-7%Gd-5%Y-1%Nd-0.5%Zr alloy. Mater. Des. 2015, 84, 185–193. [Google Scholar] [CrossRef]
  15. Liu, C.; Yang, H.; Wan, P.; Wang, K.; Tan, L.; Yang, K. Study on biodegradation of the second phase Mg17Al12 in Mg-Al-Zn Alloys: In vitro experiment and thermodynamic calculation. Mater. Sci. Eng. C 2014, 35, 1–7. [Google Scholar] [CrossRef] [PubMed]
  16. Walter, R.; Kannan, M.B. A mechanistic in vitro study of the microgalvanic degradation of secondary phase particles in magnesium alloys. J. Biomed. Mater. Research. Part A 2015, 103, 990–1000. [Google Scholar] [CrossRef] [PubMed]
  17. Morishige, T.; Ueno, K.; Okano, M.; Goto, T.; Nakamura, E.; Takenaka, T. Effect of Impurity Fe Concentration on the Corrosion Behavior of Mg-14 mass%Li-1 mass%Al Alloy. Mater. Trans. 2014, 55, 1506–1509. [Google Scholar] [CrossRef] [Green Version]
  18. Samaniego, A.; Birbilis, N.; Xia, X.; Frankel, G.S. Hydrogen Evolution During Anodic Polarization of Mg Alloyed with Li, Ca, or Fe. Corrosion 2014, 71, 224–233. [Google Scholar] [CrossRef]
  19. Chen, L.; Peng, H.; Peng, W.; Mei, L.; Wang, K.; Tan, L.; Yu, Z.; Ke, Y. The in vitro biocompatibility and macrophage phagocytosis of Mg17Al12 phase in Mg-Al-Zn alloys. J. Biomed. Mater. Res. Part A 2015, 103, 1–11. [Google Scholar]
  20. Yang, H.; Liu, C.; Wan, P.; Tan, L.; Yang, K. Study of second phase in bioabsorbable magnesium alloys: Phase stability evaluation via Dmol3 calculation. APL Mater. 2013, 1, 1039–1045. [Google Scholar] [CrossRef]
  21. Kannan, M.B.; Koc, E.; Unal, M. Biodegradability of β-Mg17Al12 phase in simulated body fluid. Mater. Lett. 2012, 82, 54–56. [Google Scholar] [CrossRef]
  22. Ding, Z.J. Effect of pre-deformation on aging characteristics and mechanical properties of Mg-Gd-Nd-Zr alloy. Trans. Nonferr. Met. Soc. China 2007, 21, 949–954. [Google Scholar]
  23. Vinogradov, A.; Orlov, D.; Danyuk, A.; Estrin, Y. Effect of grain size on the mechanisms of plastic deformation in wrought Mg–Zn–Zr alloy revealed by acoustic emission measurements. Acta Mater. 2013, 61, 2044–2056. [Google Scholar] [CrossRef]
  24. Chang, J.W.; Fu, P.H.; Guo, X.W.; Peng, L.M.; Ding, W.J. Effect of Heat Treatment on Corrosion and Electrochemical Behaviors of Mg-3Nd-0.2Zn (wt.%) Magnesium Alloy. Mater. Sci. Forum 2007, 546-549, 559–562. [Google Scholar] [CrossRef]
  25. Li, X.; Liu, C.; Wang, J.; Zhang, C. Tailoring the strength and formability of Mg alloys through rare earth element additions (Gd and Dy) and dynamic recrystallizations. Mater. Today Commun. 2021, 28, 102627. [Google Scholar] [CrossRef]
  26. Wang, Q.; Jie, C.; Zhao, Z.; He, S. Microstructure and super high strength of cast Mg-8.5Gd-2.3Y-1.8Ag-0.4Zr alloy. Mater. Sci. Eng. A 2010, 528, 323–328. [Google Scholar] [CrossRef]
  27. Li, G.; Zhang, J.; Wu, R.; Liu, S.; Hou, L. Improving age hardening response and mechanical properties of a new Mg-RE alloy via simple pre-cold rolling. J. Alloys Compd. 2018, 777, 1375–1385. [Google Scholar] [CrossRef]
  28. Wan, Y.; Xu, S.; Liu, C.; Gao, Y.; Jiang, S.; Chen, Z. Enhanced strength and corrosion resistance of Mg-Gd-Y-Zr alloy with ultrafine grains. Mater. Lett. 2017, 213, 274–277. [Google Scholar] [CrossRef]
  29. Wang, J.; Yang, Y.S.; Tong, W.H. Effect of purification treatment on corrosion resistance of Mg-Gd-Y-Zr alloy. Trans. Nonferrous Met. Soc. China 2011, 21, 949–954. [Google Scholar] [CrossRef]
  30. Zhang, Y.; Huang, Y.; Feyerabend, F.; Blawert, C.; Hort, N. Influence of the amount of intermetallics on the degradation of Mg-Nd alloys under physiological conditions. Acta Biomater. 2021, 121, 695–712. [Google Scholar] [CrossRef]
  31. Feyerabend, F.; Fischer, J.; Holtz, J.; Witte, F.; Willumeit, R.; Drücker, H.; Vogt, C.; Hort, N. Evaluation of short-term effects of rare earth and other elements used in magnesium alloys on primary cells and cell lines. Acta Biomater. 2010, 6, 1834–1842. [Google Scholar] [CrossRef] [Green Version]
  32. Kim, S.-H.; Jung, J.-G.; You, B.S.; Park, S.H. Microstructure and texture variation with Gd addition in extruded magnesium. J. Alloys Compd. 2017, 695, 344–350. [Google Scholar] [CrossRef]
  33. Schwabe, A.; Meyer, U.; Grün, M.; Voigt, K.D.; Flachowsky, G.; Dänicke, S. Effect of rare earth elements (REE) supplementation to diets on the carry-over into different organs and tissues of fattening bulls. Livest. Sci. 2012, 143, 5–14. [Google Scholar] [CrossRef]
  34. Duan-Qin, W.U.; Zhi-Xiong, H.E.; Tan, Z.L. The Application of Rare Earth Elements in Animal Nutrition. Acta Ecol. Anim. Domastici 2013, 34, 9–12. [Google Scholar]
  35. Willbold, E.; Gu, X.; Albert, D.; Kalla, K.; Bobe, K.; Brauneis, M.; Janning, C.; Nellesen, J.; Czayka, W.; Tillmann, W. Effect of the addition of low rare earth elements (lanthanum, neodymium, cerium) on the biodegradation and biocompatibility of magnesium. Acta Biomater. 2015, 11, 554–562. [Google Scholar] [CrossRef]
  36. Liu, J.; Bian, D.; Zheng, Y.; Chu, X.; Lin, Y.; Wang, M.; Lin, Z.; Li, M.; Zhang, Y.; Guan, S. Comparative in vitro study on binary Mg-RE (Sc, Y, La, Ce, Pr, Nd, Sm, Eu, Gd, Tb, Dy, Ho, Er, Tm, Yb and Lu) alloy systems. Acta Biomater. 2020, 102, 508–528. [Google Scholar] [CrossRef] [PubMed]
  37. Peng, Q.; Huang, Y.; Zhou, L.; Hort, N.; Kainer, K.U. Preparation and properties of high purity Mg-Y biomaterials. Biomaterials 2010, 31, 398–403. [Google Scholar] [CrossRef] [Green Version]
  38. Lu, Y.; Huang, Y.; Feyerabend, F.; Willumeit-Rmer, R.; Kainer, K.U.; Hort, N. Microstructure and Mechanical Properties of Mg-Gd Alloys as Biodegradable Implant Materials. In TMS 2018 147th Annual Meeting & Exhibition Supplemental Proceedings; Springer: Cham, Switzerland, 2018; pp. 253–262. [Google Scholar]
  39. Zhang, J.; Zhe, L.; Liu, S.; Li, J.; Zhang, M.; Wu, R. Microstructure and mechanical properties of Mg–Gd–Dy–Zn alloy with long period stacking ordered structure or stacking faults. J. Alloys Compd. 2011, 509, 7717–7722. [Google Scholar] [CrossRef]
  40. Stanford, N.; Sha, G.; Xia, J.H.; Ringer, S.P.; Barnett, M.R. Solute segregation and texture modification in an extruded magnesium alloy containing gadolinium. Scr. Mater. 2011, 65, 919–921. [Google Scholar] [CrossRef]
  41. Lei, Y.; Huang, Y.; Peng, Q.; Feyerabend, F.; Hort, N. Mechanical and corrosion properties of binary Mg–Dy alloys for medical applications. Mater. Sci. Eng. B 2011, 176, 1827–1834. [Google Scholar]
  42. Stanford, N.; Atwell, D.; Barnett, M.R. The effect of Gd on the recrystallisation, texture and deformation behaviour of magnesium-based alloys. Acta Mater. 2010, 58, 6773–6783. [Google Scholar] [CrossRef]
  43. Bi, G.L.; Han, Y.X.; Jiang, J.; Jiang, C.H.; Li, Y.D.; Ma, Y. Microstructural evolution and age-hardening behavior of quasicrystal-reinforced Mg-Dy-Zn alloy. Rare Met. 2019, 38, 29–35. [Google Scholar] [CrossRef]
  44. Yang, L.; Huang, Y.; Feyerabend, F.; Willumeit, R.; Mendis, C.; Kainer, K.U.; Hort, N. Microstructure, mechanical and corrosion properties of Mg-Dy-Gd-Zr alloys for medical applications. Acta Biomater. 2013, 9, 8499–8508. [Google Scholar] [CrossRef] [PubMed] [Green Version]
  45. He, S.M.; Zeng, X.Q.; Peng, L.M.; Gao, X.; Nie, J.F.; Ding, W.J. Microstructure and strengthening mechanism of high strength Mg-10Gd-2Y-0.5Zr alloy. J. Alloys Compd. 2007, 427, 316–323. [Google Scholar] [CrossRef]
  46. Erinc, M.; Sillekens, W.H.; Mannens, R.G.T.M.; Werkhoven, R.J. Applicability of existing magnesium alloys as biomedical implant materials. In Proceedings of the Magnesium Technology 2009, San Francisco, CA, USA, 15 –19 February 2009; pp. 209–214. [Google Scholar]
Figure 1. Schematic showing the test region of the as-extruded Mg–Gd–Dy–Zr alloys for microstructure characterization.
Metals 12 00604 g001
Figure 2. EBSD inverse pole figure maps perpendicular to the direction of extrusion for (a) GD0.6, (b) GD1.2, (c) GD5.0, and (d) GD10.0; (e) grain size distribution; and (f) variation of average grain size with the increase in RE contents in the as-extruded Mg–Gd–Dy–Zr alloys.
Metals 12 00604 g002
Figure 3. XRD pattern of the as-extruded Mg–Gd–Dy–Zr alloys.
Metals 12 00604 g003
Figure 4. Microstructure characterization of the as-extruded Mg–Gd–Dy–Zr alloys: SEM images of (a) GD0.6, (b) GD1.2, (c) GD5.0, (d) GD10.0, and (e) EDS analysis of the selected area in (d).
Metals 12 00604 g004
Figure 5. Nyquist plots of as-extruded Mg–Gd–Dy–Zr alloys in Hank’s solution.
Metals 12 00604 g005
Figure 6. Potentiodynamic polarization curves of as-extruded Mg–Gd–Dy–Zr alloys in Hank’s solution.
Metals 12 00604 g006
Figure 7. pH monitoring of as-extruded Mg–Gd–Dy–Zr alloys during the in vitro immersion periods.
Metals 12 00604 g007
Figure 8. Corrosion rates of as-extruded Mg–Gd–Dy–Zr alloys calculated by mass loss after an immersion of seven days and 14 days, respectively.
Metals 12 00604 g008
Table 1. Chemical composition of the Mg–Gd–Dy–Zr alloys (wt%).
AlloyCodeGdDyZrMg
Mg–0.6Gd–0.3Dy–0.2ZrGD0.60.580.340.018Bal.
Mg–1.2Gd–0.6Dy–0.2ZrGD1.21.030.540.19Bal.
Mg–5Gd–2.5Dy–0.2ZrGD5.05.241.730.022Bal.
Mg–10Gd–5Dy–0.2ZrGD10.010.944.980.13Bal.
Mg = magnesium; Gd = gadolinium; Dy = dysprosium; Zr = zirconium.
Table 2. Chemical compositions of Hank’s solution.
Chemical CompositionContent (g/L)
NaCl8.00
KCl0.40
CaCl20.14
NaHCO30.35
Na2HPO40.12
MgSO40.20
KH2PO40.06
Glucose1.00
Table 3. The Tafel fitting parameters obtained from the potentiodynamic polarization curves.
As-Extruded
Alloy
E0
(V)
I0
(μA/cm2)
βa
(mV)
βc
(mV)
Rp
(KΩ/cm2)
Corrosion Rate
(mm/year)
GD0.6−1.584.87410.9327.979.187520.22
GD1.2−1.521.133.2142.911.698150.05
GD5.0−1.634.88491.0300.480.926630.22
GD10.0−1.571.9325.4265.810.067080.09
Publisher’s Note: MDPI stays neutral with regard to jurisdictional claims in published maps and institutional affiliations.

