Article

EIS Investigation of the Corrosion Behavior of Steel Bars Embedded into Modified Concretes with Eggshell Contents

by
Yuri Alexandre Meyer
1,
Izabella Menezes
1,
Rodrigo Silva Bonatti
1,
Ausdinir Danilo Bortolozo
1,2 and
Wislei Riuper Osório
1,2,*
1
School of Technology, Department of Material Science Engineering, Campus I, University of Campinas/UNICAMP, Limeira 13484-332, SP, Brazil
2
School of Applied Sciences, FCA, Research Group in Manufacturing Advanced Materials (CPMMA), Campus II, University of Campinas—UNICAMP, Limeira 3484-350, SP, Brazil
*
Author to whom correspondence should be addressed.
Metals 2022, 12(3), 417; https://doi.org/10.3390/met12030417
Submission received: 28 December 2021 / Revised: 3 February 2022 / Accepted: 18 February 2022 / Published: 26 February 2022

Abstract

:
This investigation is focused on evaluation of the corrosion behavior of embedded steel bars (SB) into concretes. Conventional and modified concretes with eggshell are prepared. Although the effect of calcium carbonate on mechanical behavior is recognized and reported, their effects as eggshell (ES) particles replacing portions of sand and cement contents are reasonably scarce. Corrosion behavior is evaluated by electrochemical impedance spectroscopy (EIS) and the potentiodynamic polarization technique. Equivalent circuit and porous electrode behavior are also considered. The novelty concerns a promising use of concrete with ES content to maintain corrosion resistance concatenated with reasonable structural properties. For this purpose, three distinct concrete mixtures are proposed, i.e., a reference and two modified concretes. One replaces 10 wt.% with cement and another 10 wt.% with sand content. It is found that porous electrode behavior helps to predict the corrosion mechanism. Finer ES particles in concrete mixture provides a rapidly passivation on rebar. This reflects positively in corrosion current density after long-term immersion. Additionally, an environmentally friendly aspect associated with economical factor constitutes a promise use of the concrete.

1. Introduction

Both aviculture and aquaculture demonstrated growth in recent years [1,2,3]. Associated with this, an ecological pressure to dispose millions of tons of shell wastes and other skeletal wastes is provoked [3]. These residues are dumped in landfills or deposited along coastal regions that create environmental hazards and serious health risks [1].
In order to contribute to the disposal of these wastes and to establish a bridge between ecological and economic interests, it is essential to convert the wastes into products with some additional added value that are utilizable. Jinshan et al. [3] and Islam et al. [4] have reported that shells are calcium carbonate-rich sources. Investigations demonstrating the conversion of shells into limestone content to be used as promising building materials have been reported [5,6].
Limestone from grinding calcitic rocks obtained from quarries is used as a filler in concrete [7]. It acts in hydration cement improving early age hydration and strength cement [7]. In particular, eggshell powder has also been used in orthopedic cements [8] and also to increase the strength of natural rubber [9] and polymer-rich composites [10]. It was also reported that lime powder obtained from eggshells is an alternative material to natural lime [11]. Their utilization as filler in cement mortar is also reported [12]. Shih-Ching et al. [13] reported eggshells in synthesized hydroxyapatite powders with biomaterial applications. There exists a great amount of utilization of eggshells in distinctive fields.
Considering civil engineering applications, Matschei et al. [14] have reported that calcium carbonate has two interesting and distinct roles in cement hydration. The first is to participate as an active agent in hydration and the other is as an inert load. Based on this, it is assumed that mechanical properties can be modified when eggshells are added or replacing with sand and cement. In the last decade, calcium carbonate processed as nano-particle CaCO3 has widely been reported [15,16,17,18,19,20]. Wang et al. [21] recently reported that limestone replaced with cement improved certain properties (e.g., the workability, compressive and flexural strengths, and water permeability). Research showed that workability is improved due to limestone filling the voids of cement, and porosity is decreased [21].
Concerning the mechanical properties, when fine aggregate is used and a fine limestone as filler is used, the mechanical behavior is improved [21,22]. However, depending on the particle size, some properties can be differently affected. For instance, the workability is affected when a particle size varying from 0.7 μm to 15 μm is used. Bosiljkov [23] demonstrated that a finer CaCO3 fill avoids cement particles, and the compressive strength is increased. Ghafoori et al. [24] also demonstrated that the compressive behavior is improved when finer CaCO3 particles (~5 μm) are used compared with coarser particles (between 10 μm and 20 μm).
Additionally, Shaikh and Supit [25] have reported that the highest compressive strength investigated is that of the 1 wt.% of CaCO3 nano-like particles (between 40 and 50 nm) when replacing cement content (ordinary Portland cement, Type I, ASTM C150). They also reported improvements in water adsorption and chloride penetration resistance (~22% higher than cement paste) [25]. They clarified that both the size and content percentages of CaCO3 have important roles regarding both the fresh and hardened properties. Meddah et al. [26] verified that when cement is replaced with CaCO3 particles more than 15 wt.%, the compressive strength is drastically decreased [26].
Investigations concerning to corrosion of reinforcing steel bars (rebar) in concrete with calcium carbonate particles as additional or replacing the cement are scarce. The corrosion of rebar is a major cause of civil infrastructure degradation in worldwide [21]. Wang et al. [21] demonstrated that chloride permeability decreases substantially when limestone replaces the cement and when the limestone particle size is increased. This is associated with filler effect since a finer limestone replaces cement [21]. Wang et al. [21] also stated that the corrosion resistance of concrete is affected by the electrical resistivity.
When this is increased, the movement of electrons is hindered, and the corrosion resistance is also increased. Ramezanianpour et al. [27] reported the effect of limestone powder on corrosion behavior of concrete. They demonstrated that electrical resistivity decreased with the increase of the fine limestone content. This is associated with nano-particle of limestone filling capillary pores and modifying C-S-H gels of concrete [28,29]. It was also reported that eggshell, calcite, and marble decreased the porosity of concrete around the steel surface [30,31].
For instance, CaCO3 reacts with cement in the hydration process provoking certain roughness around the rebar. This blocks the way of the chloride ions to the steel surface rendering a coat with higher resistance [30,31]. Although CaCO3 was considered as filler, it was also suggested that CaCO3 commonly accelerates chemical reactions with tricalcium aluminate to constitute the carboaluminate compound, mainly when nano- or fine-like CaCO3 particles are used [19].
Diab et al. [32] stated that the corrosion behavior of reinforced steel in concrete with limestone partially replacing cement is increased. They also stated that the compressive strength is strongly dependent of the fineness of CaCO3 particles with respect to cement. Research found [32] that the corrosion resistance (by analyzing potentiodynamic polarization curves) increases with the increase of CaCO3 fineness level. The water/cement ratio, and kind and content of cement are parameters to be carefully adopted and controlled [32].
Pech-Canul and Castro [33] also reported that higher water/cement ratios displace the more active potential region suggesting a decrease corrosion resistance. Due to the alkalinity of concrete (pH ~13), a passive protection is commonly prevalent [34,35]. Summarizing, it is consensually reported [14,21,27,28,29,32] that finer CaCO3 particles replacing cement increases corrosion resistance. Essentially, due to CaCO3 acts as filler agent and its participation in hydration will block the sites for chloride penetration or modifying the electrical resistivity.
Electrochemical impedance spectroscopy (EIS) has been used to predict and understand the corrosion behavior of reinforced steel concrete [36]. Due to the heterogeneous characteristic of cement, water/cement ratio, cell kit construction (kind of counter electrode), characteristics of rebars and other parameters, the interpretation of EIS results is a laborious task, and this technique still requires in-depth investigations [36,37].
Ghorbani et al. [38] recently used EIS measurements to evaluate the corrosion resistances of steel rebar in concrete containing fine (between 1 μm and 10 μm) marble/granite powder contents (CaO- and SiO2-rich compounds, respectively). They concluded that the 10% and 20% (wt.%) of cement partially replacing with granite waste indicated improvements in corrosion resistances. Similar interpretations were also utilized when Sohail et al. [39] investigated the corrosion performance of distinct steel reinforcing bars with Portland (CEM type I).
They schematically depicted the physical interpretation of the interfaces constituted when a steel reinforced concrete is considered, i.e., bulk concrete with solution, concrete with steel rebar and the double layer-electrode interfaces. Three capacitive semi-arcs were proposed at different frequency ranges, i.e., at high and low frequencies, and the bulk concrete and rebar conditions (double layer and interfacial reactions) were characterized [37,38,39]. In some conditions, a Warburg element can be constituted due to ions diffusion throughout an oxide layer [37].
However, the equivalent circuit (EC) interpretation also constitutes a difficult to prescribe real rebar application and in some cases, there exists a great difficulty in comparing with other previous investigations. This due to the different size samples, types of counter electrodes, construction and configurations of corrosion cells, and the nature/characteristics of the examined concrete mixtures.
Some drawbacks are also constituted when laboratory measurements and field applications are not compared. Review papers [40,41] have been recently published detailing the corrosion mechanisms of rebar in both chloride and carbonated media. Some drawbacks concerning the electrical method for monitoring corrosion have also been reported (e.g., perturbation due to a counter electrode area lower than the rebar arrangement) [40,41].
Few studies report the EIS to predict the corrosion behavior of concrete containing CaCO3, such as eggshell-like particles. Matschei et al. [14] reported that calcite (CaCO3) reacts with cement, and two functions were reported. One showed that it participated as an active agent in the hydration and another as inert filler [14]. It has been reported that corrosion products are located not only on steel rebar’s surfaces but also penetrate throughout the cement paste [40,41,42]. When measuring and analyzing (EDX element maps) the corrosion layer at the rebar/concrete interface [42,43], both Fe and Ca ions interacting with and constituting the corrosion layer were identified [42,43,44]. This indicates that complex by-products constitute the corrosion layer, mainly when Ca+2, OH and Cl species are participating.
These species constitute a complex corrosion layer, and a porous electrode behavior seems to potentially be associated. Distinct equivalent circuits (EC) to predict the phenomenological reactions were proposed. Although a physical interpretation and configuration considering EC were proposed, due to the nature and characteristic of cement, sizes and morphologies of the aggregates, immersion solution, and other parameters, the empirical EIS plots are considerably different to the theoretical preposition.
Additionally, comparisons among distinct investigations are scarce. The experimental investigations conducted in the rebar corrosion with interpretation of initial phenomena (e.g., double layer and porous electrode behavior) provided by EIS plots are also scarce or absent. The porous electrode is reasonably similar to a Warburg-like behavior as stated in Levie’s theory [45]. MacDonald and collaborators [46,47] reported a study of penetration of the porous concrete by chloride describing corrosion behavior.
Bastidas [48] also reported Warburg impedance elements in order to provide interpretation of impedance with porous electrode behavior and diffusional process. This phenomenon will be discussed and detailed. Both the cylindrical and irregularly-shaped non cylindrical pores were modeled and investigated by Bastidas [48]. This study provides a systematic report concern to the porous electrode modeling using distinctive and previously methods reported (e.g., De Levie theory) [48].
The main aim of this proposed investigation concerns the evaluation of both the mechanical and corrosion behavior when eggshell (ES) from chicken origin is used. With this, it is expected that the mineralogy of concrete is not substantially affected. However, the economical aspect is an interesting characteristic since no decreasing in corrosion is attained. Associated with this, the novelty of this contribution concerns the evaluation of the corrosion behavior concatenated with mechanical properties. In addition, both porous and planar behaviors are involved in predicting the resulting corrosion behavior. In this investigation, three distinct concrete mixtures are prepared, i.e., a reference (control) and two modified concretes.
When cement content is replaced with eggshell particles, a percentage of about 10 wt.% of finer CaCO3 (size close to cement fineness) is utilized. On the other hand, when sand content is partially (~10 wt.%) replaced with CaCO3 particles, coarser eggshell particles (between 2 and 4 mm) with a 10 wt.% are used. These selection mixes are based on studies when the compressive strengths in concretes with eggshell contents were previously reported [14,15,16,17,18,19,20,21,22,23,24,25,26]. The concatenated mechanical behavior and corrosion resistance associated with lightweight effect are also examined.

2. Materials and Methods

2.1. Materials

A high early strength (HES) Portland cement was used in order to prepare all concrete mixtures. This cement has finer characteristics and higher hydration (rapid) than other cements. The specific mass and unit mass were 3.12 g/cm3 and 1.03 g/cm3 as also previously reported [49,50]. Fine and coarse aggregates were natural quartzite sand and basalt gravel #0 (size between 4.75 and 9.5 mm). This was adopted based on previous investigations [49,50] considering the cover area between particles and steel rebar embedded. The sand proportions were kept at 100 (±5) °C for 24 h before the mixture procedure.
No superplasticizer additive was used. This point constitutes a limitation of this study. Although a superplasticizer could be used as well as other water-to-cement (w/c) ratios, a w/c ratio of 0.6 was adopted. This is based on the fact that other modified concrete mixtures have not reached the minimal workability (slump) results. For instance, when a low w/c ratio (e.g., ~0.5) is used, no workability is reached. It is recognized that w/c ratios between 0.55 and 0.6 are commonly utilized [11,29].
Eggshell (ES) particle contents were used to partially replace with sand and cement portions. The ES particles (CaCO3) from aviculture were cleaned, dried (100 ± 5 °C for 24 h) and ground. Two distinct ES sizes were utilized. One ES portion was designated as coarser ES (CES) particles, which were ranging between 2 and 4 mm. These ES particles were partially replacing 10 wt.% of the sand content. Another portion was designated as the finer eggshell portion, which replaced 10 wt.% of the cement content. These replacements were adopted based on the magnitude of the particle sizes. The CES particles were used to obtain those fine ES particles. For this purpose, an agate mortar/pestle (ceramic material) was utilized.
A mechanical grinding (~5 min.) inside a mortar/pestle assemble was conducted [48]. These sizes and portions were adopted based on previous studies when CaCO3 particles replace the cement content; and mechanical strength is commonly increased [14,21,23,24,25,26]. Research has consensually reported [14,21,27,28,29,32] that finer CaCO3 particles replacing cement, the resulting corrosion resistance is increased as previously mentioned. It was also reported that mechanical behavior is improved with CaCO3 particle inclusion. However, consideration of these particle effects upon the corrosion behavior evaluated using EIS technique is absent.
The steel bars (SB) or rebars used to be embedded into the distinct concrete mixtures are chemically similar to SAE 1020 steel (composition, in wt.%, C is 0.18–0.25, Mn is 0.3–0.5, Cr and Ni are lower than 0.01%, Cu and Mo are lower than 0.2 and 0.01, respectively, with Fe in balance). These are hot-rolled, and a mill-scale is commonly formed in the surface of the final reinforcing steel bar [40,41,42,51,52]. Steel bars (rebars) have non-uniform microstructures and microconstituents. A mill-scale (sizing between 50 and 100 μm), a tempered martensite layer (~500 μm) and a ferrite/pearlite constitute the composition of the rebar. These layers depend on the rebar diameters and the manufacturers considered [40,41,42,51].

2.2. Concrete Mixtures

The constituents of concretes are parameterized, such as a 0.6 w/c ratio, coarse aggregate (gravel #0) and steel bar. Table 1 shows the mix proportions used in each one of the proposed concrete mixtures. The samples were designated as CC (conventional concrete), and SAND was the concrete sample with 10 wt.% sand is replaced with coarser ES particles. Finally, a sample designated as the CEM sample was that of with 10 wt.% cement content being replaced with finer ES particles. Triplicate molded concrete specimens for the compressive strength determination were considered. Similarly, triplicates were used to produce specimens to determine the tensile strength using an indirect relation with cylindrical samples [53,54]. Duplicates were considered for EIS and potentiodynamic polarization test measurements.

2.3. Fresh and Hardened Properties Determinations

The fresh state properties of the distinct SCC samples were determined using a Brazilian standard ABNT NBR 15823:2017 [49,50]. According to ASTM C1611-18 [49,50], the traditional slump measurements were performed. These procedures were conducted in order to measure the ability of the concrete to pass through obstacles and to flow under certain conditions [11].
The hardened conditions of the proposed SCC samples are represented by both the compressive strengths and tensile (diametrical compression) strengths over 7 and 28 days, according to ABNT NBR 5739:2007 [55] and NBR 7222:2011 [56], respectively [55,56,57]. For this purpose, a loading speed of about 0.05 (±0.015) MPa/s was adopted. As also previously reported [57], the tensile strength was determined using Equation (1).
Ft = 2P/πDh
where Ft is the tensile strength (N/mm2), P is the maximum load of rupture (N) and D and h are the diameter height of the sample (mm) used.

2.4. EIS and Potentiodynamic Polarization Measurements

In order to perform the electrochemical measurements, a conventional three-electrode cell kit was used. The embedded steel bars (diameter ~5.5 (±0.2) mm) constitute the working electrodes (WE) with a total area of about 900 (±20) mm2. A conventional Ag/AgCl, SCE (saturated calomel electrode) as the reference electrode was adopted. Four graphite bars (of about 4500 ± 100 mm2) as counter electrodes were selected. These are displaced at 120°around the concrete sample. This constitutes an experimental arrangement similar to those previously reported [38,40,58].
Figure 1a depicts the experimental arrangement of the embedded steel bar for the electrochemical corrosion behavior of the proposed concretes.
Figure 1b shows a typical steel bar with epoxy coating at bottom and top of the steel bars before being embedded into concrete. A similar arrangement was previously reported [57]. Before all experiments, the samples were immersed in stagnant and naturally aerated 0.5 M NaCl solution for 7 days. The samples were displaced in recipient containing NaCl with concrete bulk completely immersed (i.e., of about 100 mm considering the height of the cylindrical concrete sample.
The top of the steel bar (i.e., ~30 mm) was not immersed in NaCl solution. After this period (stationary stage), in order to procedure both EIS and polarization tests, a volume of about 450 (±15) mL of a stagnant and naturally aerated 0.5 M NaCl at 25 (±2) °C with an initial pH of about 6.5 (±0.5) was adopted. For each new experiment, the electrolyte was replaced. The concrete specimens prepared for electrochemical tests were kept immersed in NaCl solution at room temperature during all curing periods.
Before initiating all electrochemical measurements, the concrete specimens were kept immersed in NaCl solution for 10 min with all electrodes connected. EIS measurements were conducted after about 15 min, due to a quasi steady state being attained. This is commonly practiced intending to standard all measures and to stabilize distortions and oscillations affecting the resulting measurements [38,48,59,60,61]. EIS experiments were conducted (~40 min) before the potentiodynamic polarization techniques were conducted (~1 h).
A VersaStat 4, Princeton Applied Research® (PAR) supplied by “Interprise Analytical Instruments” (Paulínia, SP, Brazil) was used. EIS tests were conducted using 10 points per decade with potential amplitude ~10 mV, peak-to-peak (AC signal) in open-circuit. A frequency range between 105 and 10−2 Hz was adopted as previously reported [59,60,61,62,63]. Complex non-linear least squares (CNLS) simulations were performed and compared with the experimented impedance data. For this purpose, a ZView® software (version 2.1b) and Microcal Origin® were used. Considering the potentiodynamic polarization measurements, these were performed after EIS measurements using the same potentiostat described.
A scan rate of 0.167 mV/s scanning from −200 to −900 mV was adopted. The corrosion current densities (icorr) were determined by using the concept of Tafel’s extrapolation method. Both the cathodic and anodic branches were considered. The averages of corrosion potential (Ecorr) and icorr were considered, and at least duplicates were considered. Potentiodynamic polarization measurements did not substantially affect or damage the steel bars (SB). Although it is recognized that EIS is non-destructive testing also no substantial damages on steel bar surfaces (covered by concrete bulk) were observed when polarization tests were performed. Although the top SB (portion out of the bulk concrete) depicts a red rust portion, this was cleaned (grounding) before each one of the experiments. This is made to connect with potentiostat by using a jack connection as shown in Figure 1b. After ~365 days, no substantial damages were observed.

3. Results and Discussion

3.1. Hardened and Fresh States

Figure 2a,b show the obtained ES particles utilized to the sand replaced with coarse ES particles. Figure 2c depicts the fine ES particles that replace cement content. Figure 2d,e demonstrate typical samples subjected to compressive and tensile (diametrical compression) tests, respectively. A typical fractured sample with ES replacing sand content (after compressive testing) is shown in Figure 2f. Considering hardened and fresh properties, these states were evaluated in order to verify the minimal conditions of workability and mechanical properties of the structural concretes proposed. Table 2 shows the experimental results of the slump and the compressive strength (CS) and tensile strength (TS) after 7 and 28 days of curing.
The slump results suggest that all examined concretes reached their workability levels (i.e., higher than 70 mm). A 0.6 w/c ratio was considered. These results are similar to those previously published when conventional and modified concretes were examined [57,64,65,66].
Considering the CS and TS results over 7 and 28 days, we confirmed that the proposed concretes with sand and cement contents replaced with 10 wt.% ES particles reached the minimal structural application.
The experimental correlations between the tensile (TS) and compressive strengths (CS) at 7 and 28 days of curing are shown in Figure 3. Although distinct modified concretes and cementitious materials were reported in previous studies [50,65,66], the obtained equations describing TS = k CS0.5 are similar to those previously reported. When the ES portions (10 wt.%) replace cement and sand contents, slight decreasing trends were provided when compared with the CC sample. This is more noticeable in the CS results. Since the mechanical behavior and fresh states of the proposed concretes are acceptable, the corrosion resistances by using EIS and polarization curves were analyzed as discussed in the next section.

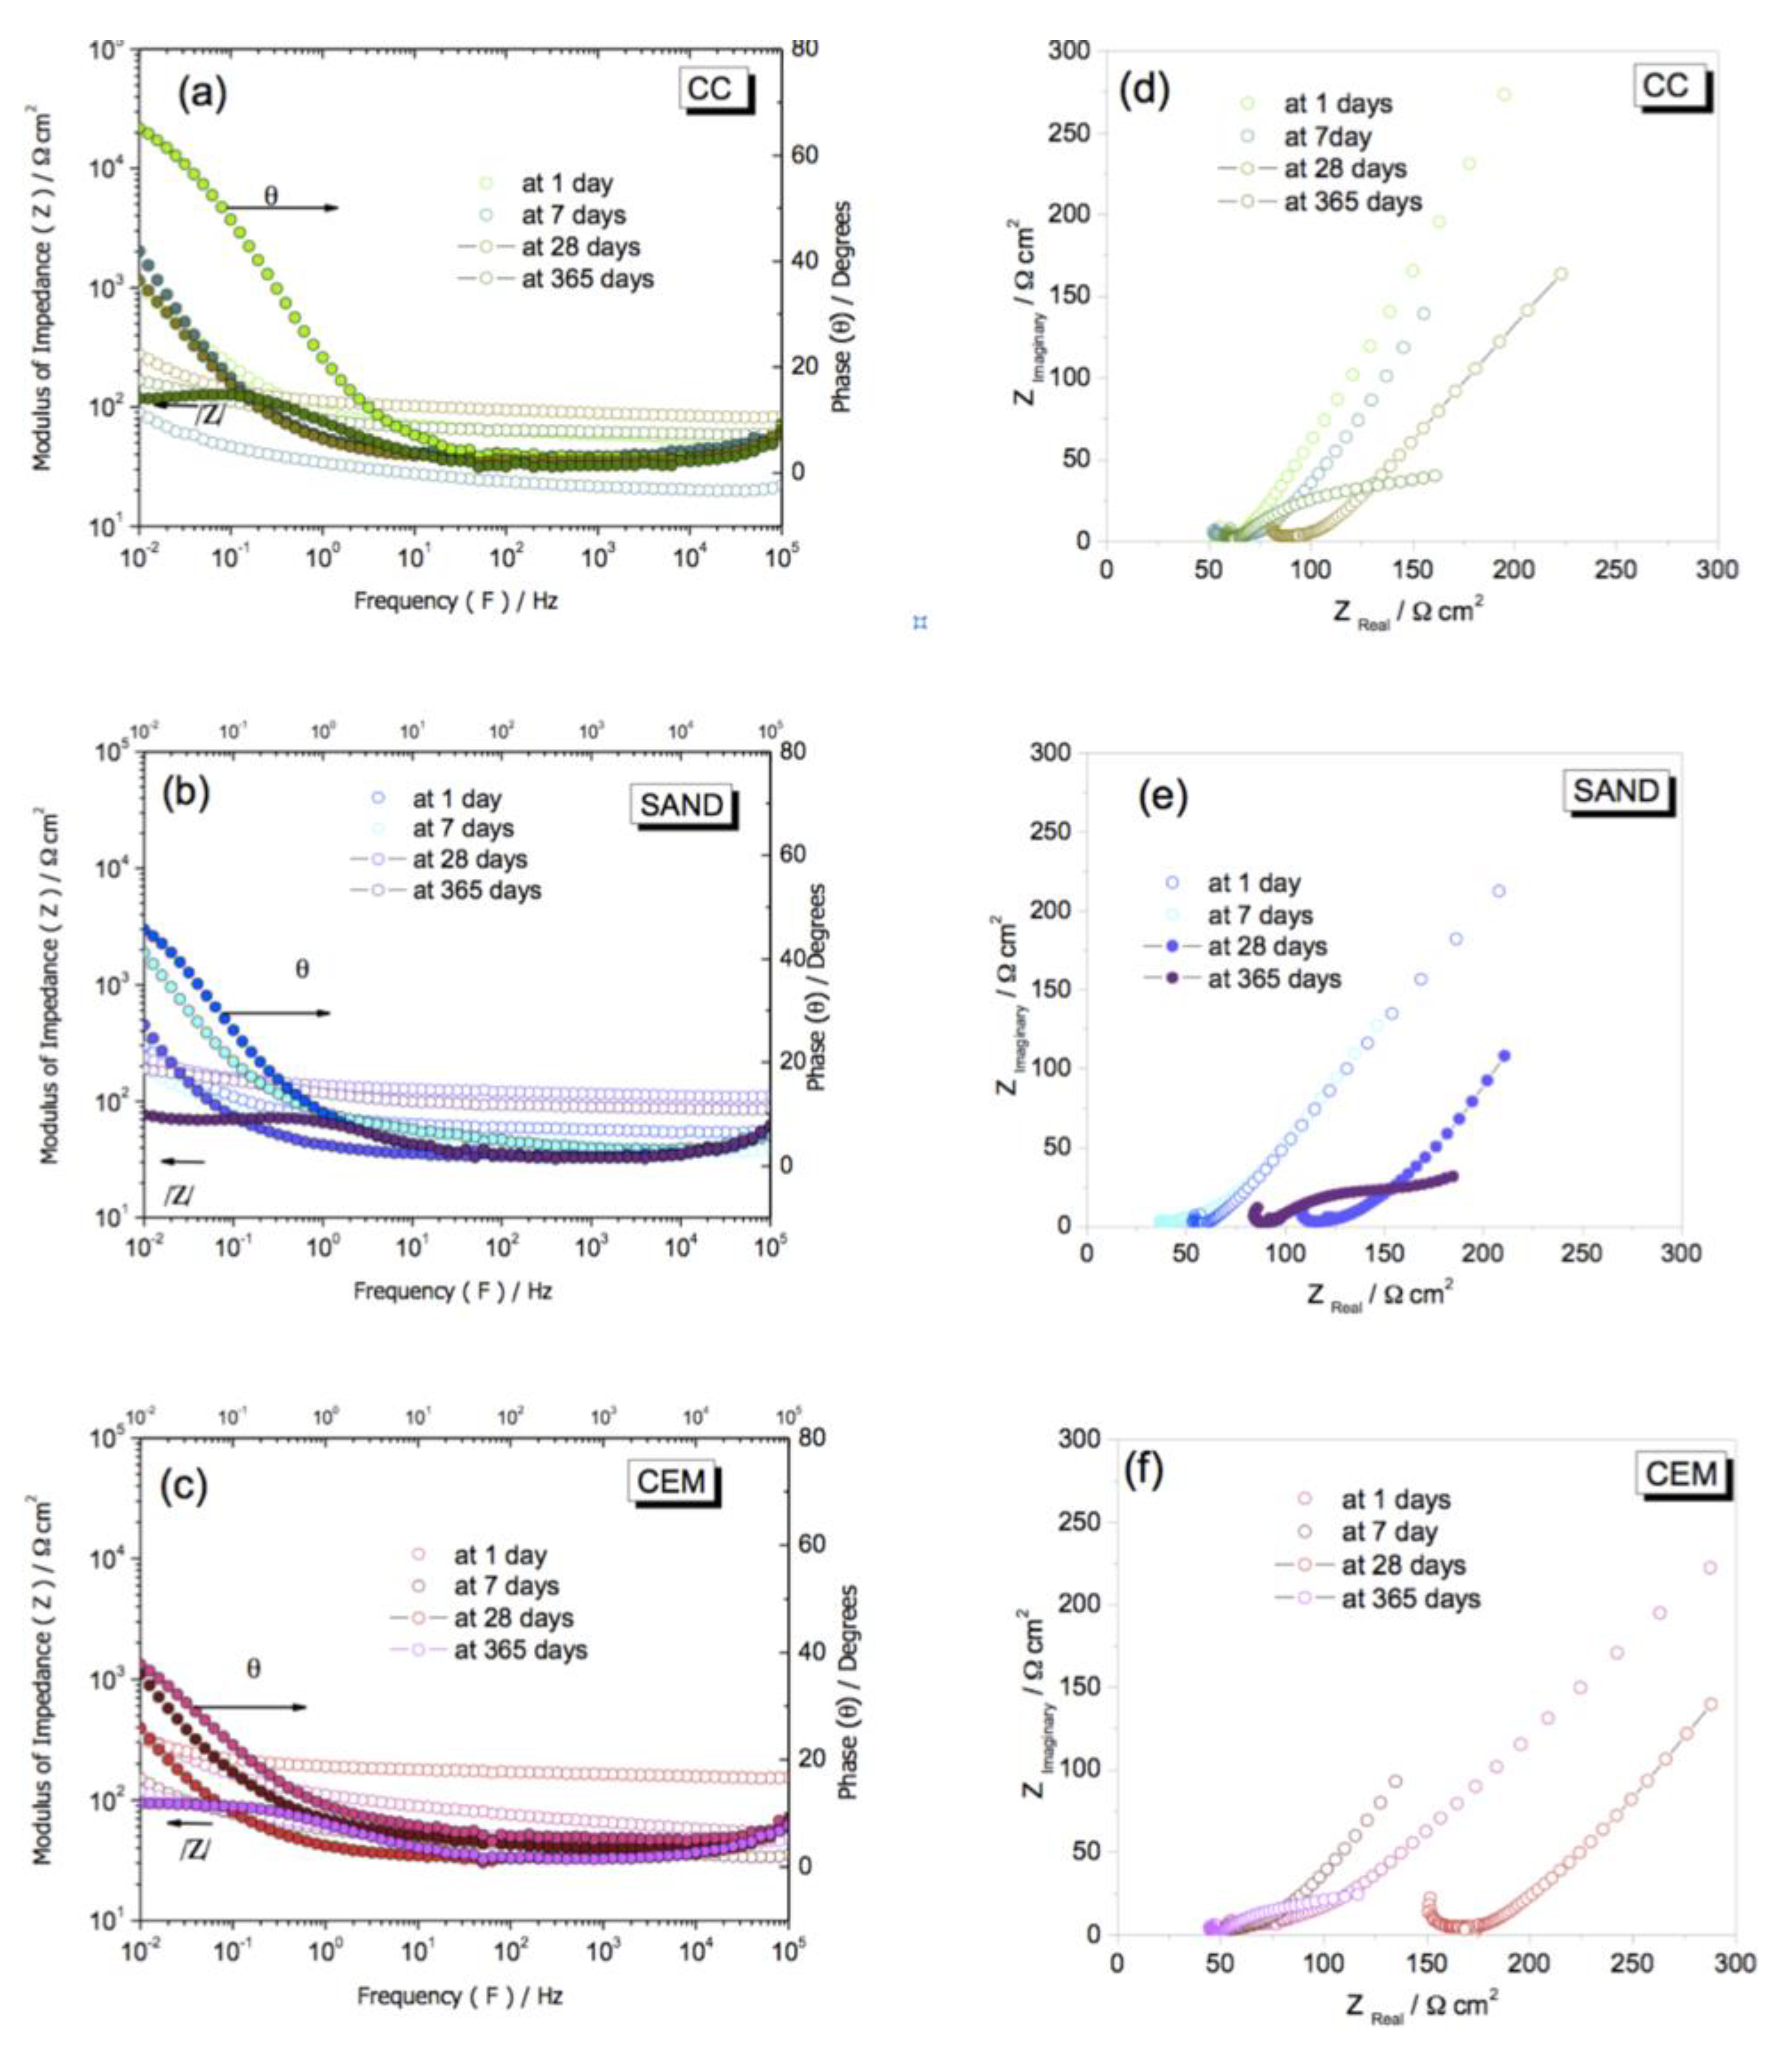
3.2. EIS Analyses: Numbers of Time Constants

In order to analyze the corrosion behavior of the examined samples, firstly, it is intrinsically demanded to determine the numbers of time constants to correlate with each reaction occurring. In order to understand the corrosion mechanism, it is important to recognize the numbers of the time constants prevalent in the system examined. Firstly, this helps to determine the reactions occurring in an electrochemical system and to select an adequate equivalent circuit to simulate the experimental results and to evaluate the impedance parameters. These contribute to a quantitative analyses and permit the participation of each element in the corrosion mechanism. This task also constitutes a novelty and will be useful for the future researchers.
Considering EIS plots, there are distinctive regions defining the electrochemical behavior of the examined concretes [32,36,37,38,59,60,61,62]. At 105 Hz and ~103 Hz is the high frequency (HF) describing the electrolyte resistance in the bulk of the concrete [32,36,37,38]. Between frequencies ~103 Hz and ~100 Hz, the double layer formation is represented. A third region is characterized at lower frequency (LF), commonly lower than 100 Hz (up to 10−2 Hz), which describes the interface reactions [36,37,38,59,60] between the surface of the steel bar with the electrolyte penetrated into concrete (paste) with its characteristics (porous, aggregates and intermediates ions).
Considering Bode diagrams, it is briefly stated that these diagrams are a semi-logarithmic coordinate plot of the transfer function of a linear time-invariant system versus frequency. The frequency at the horizontal axis is a logarithmic scale, and the frequency response of the system is depicted using a Bode plot. Additionally, it is generally composed of two diagrams, one amplitude-frequency diagram represents the change of the decibel value of the frequency response gain against frequency, and another phase-frequency diagram is the change of the phase of the frequency response against the frequency.
When Nyquist plots are considered, these are for continuous-time linear time-invariant system; the gain and phase of its frequency response are plotted in the complex plane in polar coordinates. These often used in control systems or signal processing, commonly used to determine feedback whether the system is stable. Each point on the Nyquist plot corresponds to the frequency response at a specific frequency. The angle of the point relative to the origin represents the phase, and the distance from the origin represents the gain. Therefore, the Nyquist plot combines the amplitude and the Bode plots of the phases are combined in one graph.
Figure 4a–c shows the experimental results of the EIS in Bode and Bode-phase representations of the modified concretes considering period cure of 1, 7, 28 and 365 days.
Although Nyquist plots will forwardly be discussed, Figure 4d–f depict results in Nyquist representation of the examined sample (CC, SAND and CEM) after 1, 7, 28 and 365 days of immersion. The doted red lines mean the straight lines at 45° with ZReal axis (component), which induces porous electrode behavior as will be detailed. However, from this point, it can be said that the same trends are observed when Bode and Bode-phase are also indicated.
Remembering the CC sample is designated as that of the sample with conventional mixture (cement content of 368 kg/m3) as shown in Table 1. The results of 1 day and 365 days were also evaluated (not included in mechanical analyses). The period of 1 day was included in EIS analyses due to it being expected that ions are forming double layers at the initial immersion period, constituting intermediates species. The oxide films were formed and possibly penetrated into the cement paste.
The period of 365 days was analyzed in order to verify the corrosion behavior trend after a long-term immersion period. Duplicates (i.e., sample #1 and #2) were provided for all examined samples considering all experimented periods of immersion. Examples of duplicates for the CC and CEM sample at 1 and 7 days are depicted in Figure 5. Duplicates were performed with twice experiments in a same sample examined; and also considering a same mixture in two distinctive specimens, i.e., in a different batch using same mixture.
Although few slight variations were observed, no modifications in the trends of the evaluated corrosion behavior are provided. Based on those experimented Bode-phase diagrams (Figure 4), it seems that only two time constants were prevalent. The first constant is characterized from high frequency domain up to an intermediate frequency domain (~1 Hz). Another time constant seems to be constituted at low frequency region (between 100 Hz and 10−2 Hz) as depicted in Figure 4 and Figure 5. However, these observations are simply speculative.
A technique to consolidate this hypothesis is adopting De Levie’s theory. Based on this, the number of time constants involved in a corrosive mechanism is characterized by a method proposed by Hirschorn and colleagues [67,68] and also other previously reported distinctive studies [59,69,70,71,72]. For this purpose, the moduli of the imaginary parts of the impedances vs. frequencies were analyzed as shown in Figure 6. Although only results corresponding with periods of 7 days are shown, all examined samples in all investigated immersion periods, only two time constants were characterized.
Figure 6a shows the results of modulus of the imaginary part of the impedance vs. frequency of the CC sample (conventional/reference or control concrete sample). Duplicate results are shown for each examined sample. Figure 6b,c shows the results corresponding with the SAND and CEM samples, respectively. Considering the slopes constituted between log (−ZImaginary) and log (frequency), between frequencies of about 103 and 100 Hz, all examined samples clearly exhibit slopes approximately −1/4 and at frequency domains lower than 10° Hz. The slopes approximately of −1/2 were characterized. This demonstrates the participation of the electrode behavior in the corrosion process [45,46,47,48].
Considering distinctive materials, the aforementioned slopes corresponding with porous electrode behavior were previously reported in the literature [67,68,69,70,71,72,73,74]. When a planar electrode behavior is involved, the resulting slope is close to −1 [74], while a porous behavior can be associated with slopes of about −1/4 and −1/8, in some cases [74].
The porous electrode behavior electrode was demonstrated by Levie [45] and widely confirmed for distinctive systems [67,68,69,70,71,72,73,74]. Analyzing the Nyquist plot, this behavior occurred at a high frequency domain, and it was characterized by a Warburg-like behavior [45,67,68,69,70,71,72,73]. In a very simplified term [45,71,72,73], a porous electrode is shown in Equation (2) [45,46,47,48,67,68]:
Z = (R0Z0) 1/2 coth (L √ (R0/Z0))
where R0 and Z0 are the electrolyte resistance (Ω/cm) and the interfacial impedance for one-unit length, and L means the length of each pore in cm [73]. Based on this aforementioned formulation, independently of the frequency, De Levie demonstrated that the angle with the real axis of Warburg impedance tends to 45° when L tends to a semi-infinite condition, and the coth term reaches 1. This indicates that Warburg impedance is half that reached by a flat electrode [45]. Macdonald [46] also discussed porous electrode behavior mainly describing equation and diffusion control in a semi-infinite pore, which clearly depicts a phase angle of π/8 with 22.5° defined.
Similarly, Bastidas [48] also reported a detailed study including interpretation of impedance data, which involves both porous electrode and diffusional phenomenon throughout a porous material. Interesting the distinct method of porous using De Levie, Park and Macdonald methods were compared and reported by Bastidas [48]. Murray [74] reported that when the ionic reaction is controlled, Bode magnitude versus frequency slopes of −1/2, −1/4 and −1/8 can also be observed. With these assertions, at high frequency domains in the Nyquist plots of the examined concrete samples, it is clearly characterized at 45° as depicted in Figure 4c–e.
These ranges forming 45° increase with the increase of the immersion periods for all examined concrete samples as also depicted in Figure 4d–f. The CC samples at 1 day of immersion characterized a minimal branch at 45° (in Nyquist plot, Figure 4d–f). This suggest that both the planar (conventional) and porous electrode behaviors were prevalent. When 45° is observed in Nyquist plots at low frequencies, the maximum angle θ reached about 40 degrees as shown in Figure 4.
During the last 20 years, similar behavior (porous behavior) has also been detected (in Nyquist plots, but not reported and discussed) in a great number of previous investigations considering corrosion of the steel bars embedded in concretes [33,38,39,46,58,75,76,77,78]. These referenced studies work distinct equivalent circuits and report adequately the resulting corrosion mechanisms containing various intermediates products (e.g., chlorides, oxygen and CO2) and also demonstrating the coating interactions [78].
In a recent article, Kamde and Pillai [78] reported that at Nyquist plots; planar electrode behavior is characterized when coating (protecting steel bar) is not degraded. On the other hand, when the moisture penetrates throughout coating layer attacking steel bar, at a high frequency domain, the Nyquist plot clearly demonstrates an angle of 45° with Zreal (x-axis). Additionally, when a steel bar promotes a rust layer formation, at a low frequency region, a Warburg component is characterized but forming a 22.5° with ZReal also confirming the porous behavior controls the corrosion mechanism as also reported by Macdonald and collaborators [46,47] and Bastidas [48]. Bastidas [48] also stated that a constant phase behavior of 22.5° with the real axis was constituted.
Figure 7a–c show the schematic representations of Nyquist plots with planar, porous and porous with Warburg component (transport and diffusion), respectively. These Figures are proposed based on previous reported investigations [37,38,59,60,61] and associated with corrosion mechanism phenomena proposed to occur. At high frequency domains, a small branch of Nyquist plot at 45° is characterized as demonstrated in Figure 7a. This indicates a predominant planar electrode behavior with a degradation of the embedded bar represented by a higher resistance RBar as will be discussed. On the other hand, the predominant porous electrode behavior is depicted in Figure 7b,c.
A rust layer is also formed and, depending the constituents, a reasonable protective layer is constituted. Commonly, when the polarization curves are analyzed, a trend to passive behavior is observed. With increasing the immersion period, the ions migrate to concrete paste and regions designated as corrosion-filled paste (CFP) are formed as shown in Figure 7b. With the increase of the immersion period or aggressiveness level of corrosion, the rust layer is damaged and the CFP region is increased.
Thus, the steel bar seems to be locally degraded, and corrosion by-products are formed. With the corrosion evolution and depending on the imposed conditions, a CFP formation is constituted. Depending on the corrosion layer formed, a reasonable protection is constituted. At high frequency domain, a 22.5° is formed, and a trending to straight line at 45° (Warburg) is also characterized as also previously reported [45,46,47,48,74] and depicted in Figure 7c.
Concerning to these aforementioned assertions, it is demonstrated that a porous electrode behavior domains the corrosion mechanism of the rebar embedded in the distinctive concrete. Based on Nyquist diagrams, it is qualitatively confirmed the corrosion behavior is intimately associated with interactions between rebar surface and electrolyte, electrolyte with cement paste and cement paste with rebar. This considering distinctive ions associated with chloride (electrolyte) penetrating throughout corrosion layer interacting with the rebar surface. This discussion will be provided. In the next section, the results of EIS measurements are analyzed.

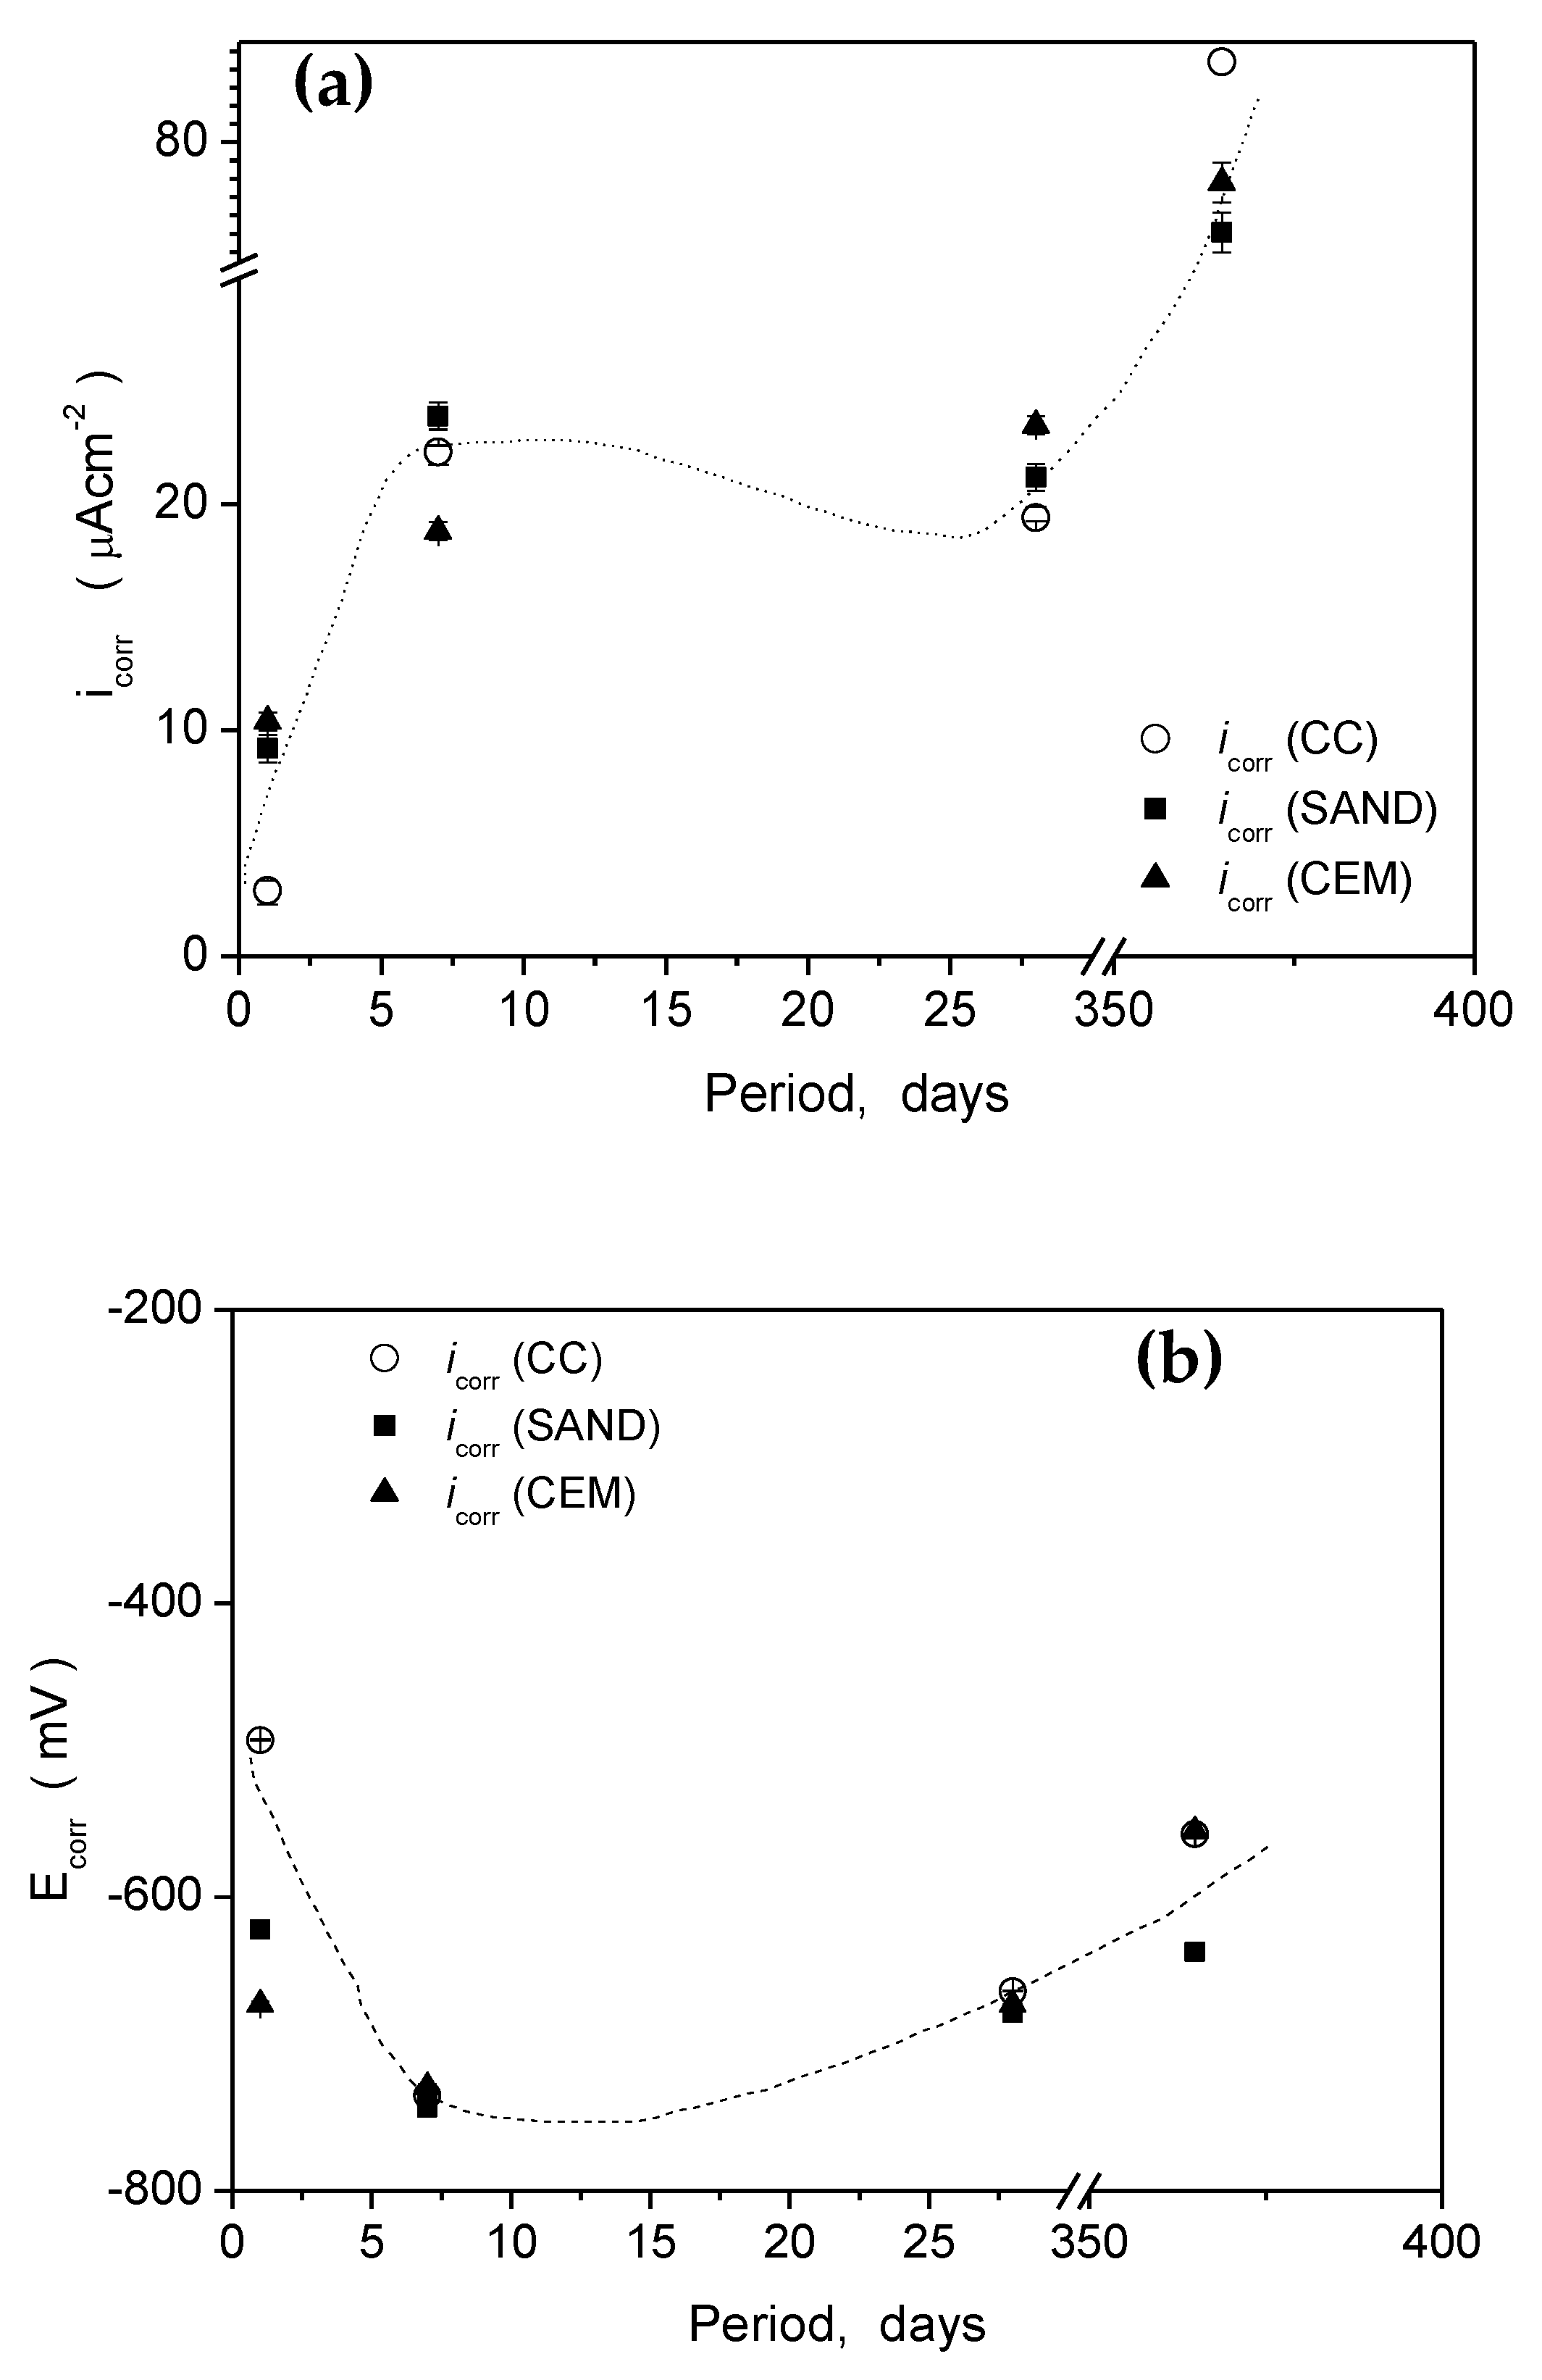
3.3. EIS Analyses: Corrosion Performance among Distinctive Concrete Samples

When a qualitative analysis is provided, a comparison among EIS diagrams has not indicated a trend or an assertive conclusion based on both the moduli of impedance and sizes of semi arcs observed in Nyquist diagrams. These parameters seems to be relatively similar for all examined samples. When the immersion periods are considered, it seems that the increase of the immersion periods, the semi arcs of Nyquist are decreased and displaced to right side. This suggests that the increase of the immersion period, the rebar corrosion resistance is decreased as also previously reported [38]. We observed that semi arcs corresponding with 1 day of immersion were higher than 7 days.
The semi arcs related with 28 days were lower and were displaced when compared with 7 days. However, this has a rather and poor contribution to predict both corrosion mechanism and performance of rebar in distinct mixture of concrete. No conclusion can be attained concerning to replacements provided (i.e., sand and cement portions with EG particles). Based on this, two actions are required. A first is to determine the quantitative parameters of EIS results using an equivalent circuit.
Another is to analyze the potentiodynamic polarization curves of each one of the examined rebars embedded in distinctive concretes. This latter analysis contributes prior information obtained from EIS analysis by using their impedance parameters and distinctive mixture concretes. Initiating by the impedance parameters analyses, an equivalent circuit (EC) is adopted. This EC is written in a ZView software®, Scribner Ass. Inc., Southern Pines, NC, USA (version 2.1b) and a CNLS (complex non-linear least squares) simulation is performed. The selected EC is widely utilized in literature to prescribe steel bar corrosion in concrete [37,38,39,75,76,77,78]. In this present investigation, the element significances are assumed similarly to that recently reported (at 2020) by Sohail et al. [39] and also other investigations [76,78].
It is usual and accepted that, between concrete and rebar, the interfacial film and double layer are constituted [37,38,39,76,78]. Associated with these three physical characteristics, there are corresponding elements in EC. A resistance associated with a capacitance CPE (constant phase element) are related to the concrete bulk + electrolyte (NaCl penetrated), other resistance and capacitance associated with interface (between concrete and double layer). Additionally associated with steel bars are their corresponding resistance and capacitance (CPE). In addition, a Warburg element in series with resistance corresponding with charge transfer of the bar is attributed.
A schematic representation of the proposed EC considering concrete with distinctive mixture elements, interface (forming corrosion by-products) and steel bar is shown Figure 8. This is proposed based on previously reported circuits and adapting with proposed corrosion mechanism. RConcr is resistance of concrete associated with their capacitance QConcr. At interface between concrete and bar, there exists RInterf and their capacitance QInterf, corresponding with oxide layer. RBar and QBar are the resistance and capacitance associated with charge transfer and double layer of the embedded steel bar. Finally, a Warburg element interfacing bar and oxide layer is proposed. This is associated with a possible diffusion and transport occurring at this interface. No additional resistance R0 (commonly at frequency range 106 and 108 Hz) is considered as also reported by Sohail et al. [39].
Based on the consolidate fact that a porous electrode behavior is prevalent to predict the corrosion mechanisms of the embedded bars in the three distinct concretes, a schematic representation of initial and evolution of corrosion process associated with the three concrete mixtures is proposed. The representations for an initial immersion period of the three concretes are shown in Figure 9a–c. This is proposed based on phenomena typically occurring in corrosion systems and adapting with proposed mechanism for this investigation considering ES particles additions.
The penetrated water, oxygen and Cl ions (from NaCl solution) interact with elements of concrete (constituents and phases, e.g., tricalcium aluminate C3A and calcium silicate hydrate C-S-H) and electrolyte (NaCl) and these with steel bar. Coarse and fine aggregates are also depicted. Although initial stage of immersion is designated, it is important to remember that concrete samples were immersed over 7 days in the curing period. Thus, the immersion period of 1 day corresponds with 1 day after their curing period. Similar occurs with immersion 28 days corresponding with 28 days after curing of 7 days.
Considering the initial immersion period, all samples formed double layers. Due to CaCO3 additions and their interactions with cement paste, the cement hydration is slightly modified as previously reported [7,15,16,17,18,21]. This modification affects both pH and nature of double layer constituted. Matschei et al. [14] demonstrated that CaCO3 particles affected the amount of free calcium hydroxide (C-H, Ca(OH2)) and C-S-H is unmodified.
They also stated that CaCO3 acts with cement paste as filler or inert additional element. These interactions depend on the CaCO3 size particles. Guo et al. [79] recently reported that C3A hydrated (e.g., 3CaO.Al2O3.6H2O) reacts with both chloride ions and CaCO3 acidifying local limited cement paste and the chloride binding capacity decreased [79,80,81]. This can be simplified by Equations (3) and (4) (not stoichiometric balanced), respectively [79]:
4/3 C3A + 2Cl + 4H2O → 3CaO·Al2O3·CaCl2·10H2O + 2/3 Al(OH)3 + 2OH
3CaO·Al2O3·CaCl2·xH2O + Al(OH)3 + CaCO3 → C3A·CaCO3·xH2O + Cl
In this initial stage, the CaCO3 content modifies pH-neighboring rebar and different species to constitute the double layer are formed. With this, a passivation and resistance to chloride penetration is provided [79]. Considering a simplified Fe/water Pourbaix diagram, the corrosion and passivation domains corresponding to the CC sample and the SAND and the CEM samples were relatively different when compared. Considering that a pH of about 8 [40,75,80] is attained when CaCO3 content is involved (instead pH ~12.5 [75,80]), at 1 day of immersion, the open circuit potentials (OCP) indicate that the CC samples has a potential of about −500mV (SCE). The SAND and CEM were of about −700mV (SCE). Their corresponding potentiodynamic polarization curves are shown and discussed. Based on a Pourbaix diagram, it is suggested that the CC sample locates in a corrosion domain (pH ~12.5), while, at −700 mV(SCE) with pH = ~8, both the SAND and CEM samples were in the passivation domain as depicted in Figure 10.
It is recognized that distinct species (solid, ionic and soluble) are involved when concrete paste is considered. With this, a potential-pH system of Fe-H2O [40,75] no correctly represents possible reactions. It is remarked that pH values neighboring rebar is extremely difficult since pH drop locally or punctually occurs. Due to this, no experimental measurements were conducted. A pH bulk measurement was not detected.
Considering all assertions previously provided, it is remembered that the proposed EC is used to impedance parameters be determined. With this, it is possible to compare the corrosion resistance behavior of the steel bars embedded. Since it is understood that CaCO3 content provokes a local drops in pH and possibly a passivation is attained, the impedance parameters using an EC (shown in Figure 8) over 1 and 7 days and 28 and 365 days of immersion periods are organized in Table 3 and Table 4, respectively. Potentiodynamic polarization curves associated with these distinct immersion periods are also discussed. In a general way, considering Table 3 and Table 4, we observed that all examined samples have capacitances QBar higher than QInterf for all immersion periods examined.
Additionally, over 1 day and 7 days, the values of RBar were also higher than RInterf for all samples examined. This indicates that RBar predominantly dominates the corrosion mechanism. This is mainly when the resistances and capacitances were concomitantly evaluated. Concerning to those values reported in Table 3, when values corresponding with 1 day of immersion for all examined samples were observed, the RConcr values have the same order of magnitudes as expected. The highest RBar is that of the reference (CC) sample (~130 Ωcm2). The same orders of magnitudes were observed when both the SAND and CEM samples were analyzed.
When the RInterf values were compared, the CC and SAND samples are ~14 Ωcm2, while the CEM sample is ~45 Ωcm2. The CEM sample has similar values for RInterf and RBar (~45 Ωcm2). This induces that at initial immersion period, at interface between bar and concrete + electrolyte of the CEM sample, a different reaction occurs when compared with other two concrete samples. Associating these impedance parameters with those potentiodynamic polarization curves, we observed that a passivation occurs for the CEM sample as depicted in Figure 11.
When the results for 7 days of immersion period were analyzed, we observed that RBar of the CC sample has not substantially modified (~130 Ωcm2). However, the corresponding RBar values of the SAND and CEM samples decreased, while RInterf were similar for all samples examined (between 20 and 25 Ωcm2). Ghorbani et al. [38] also attained similar observation when steel bars embedded in modified concretes (with marble and granite) over 14, 28 and 90 days were evaluated. Comparing the results for 1 day and 7 days, at 1 day the CEM sample has higher RInterf than the CC and SAND samples. This seems to be associated with finer ES particles replacing with 10% wt.% cement content.
The potentiodynamic polarization curve of the CEM sample also reveals a distinctive behavior when compared to other two samples examined. A primary passive current density (ipp) at 1 day is clearly characterized for both the sample #1 and #2 (duplicate) for the CEM sample. This ipp (of about 10−4 A cm−2) occurs between at potential of about −700 and −550 mV (SCE). This behavior did not occur in other examined samples, which corroborates with those values of both the RInterf and RBar corresponding with the CEM sample.
The passivation behavior occurs for both the CC and SAND samples only at 7 days of immersion. The CEM sample retains its passivation behavior, with a lower ipp than other samples as also observed in Figure 11. The experimental results for all examined samples at 28 days are shown in Table 4. We verified that RInterf values were higher than RBar. Concerning to capacitances QInterf, these were still lower than QBar.
The fact that RBar is lower than RInterf seems to be associated with initial condition verified for each one of the examined samples. At 28 days, the CC sample has its RBar decreased of about 10 times when compared with 7 days. The values of RBar corresponding with the CEM and SAND samples were not substantially modified when compared at 7 days. Interestingly, the CEM sample shows higher RBar (of about 30 Ωcm2 against ~16 and 20 Ωcm2) and RInterf (of about 100 Ωcm2 against ~60 Ωcm2) than the CC and SAND samples. This indicates that at this period (28 days), the CEM sample has better corrosion resistance.
When the EIS results of the period of 365 days were analyzed, similar observations at 1 day and 7 days were also verified for 365 days, i.e., QBar lower than QInterf and majority RBar higher RInterf. Evidently, not only one immersion period should be considered to predict the resulting corrosion behavior. Additionally, not only the impedance parameters obtained from EIS measurements should also be taken in account. Some parameters obtained from the potentiodynamic polarization curves also have important roles in predicting the corrosion behavior and their evolution throughout distinctive immersion periods. Based on this, the corrosion current density (icorr), their corresponding corrosion potential (Ecorr) and ipp values were determined as shown in Table 5.
Although distinctive magnitude values of both icorr and Ecorr were reached during distinct immersion periods, when these values were analyzed, trends were attained as shown in Figure 12. At initial immersion (1 day), the icorr rapidly increases with a trend to stabilize (up to 28 days) and finally, at more long-term immersion period, the measured icorr values were considerably increased as depicted in Figure 12a.
Associated with the observed icorr trend during the immersion period, the Ecorr with immersion period similarly varies for all samples examined. At initial immersion, the Ecorr decreased (i.e., displaced to a more active potential region) with the increase of the immersion period, while icorr considerably increased as shown in Figure 12b.

3.4. SEM Micrograph Observations

Based on the aforementioned assertions, EIS and polarization are useful to predict the corrosion behavior considering both initial (short-term) and long-term immersion periods. Although these measurements induce to a selective concrete, there are other parameters to be considered. These will be discussed. Before, the resulting micrographs of the three samples were analyzed. Figure 13a,b show the longitudinal images of the CC, CEM and SAND samples and detailed image of the SAND sample demonstrating the ES particles homogeneously distributed throughout the concrete paste.
These samples were obtained after 365 days of immersion in NaCl solution. Figure 13c reveals a typical location at interface between steel bar and cement paste. Figure 13d,e show typical SEM images of the sample at interface steel/cement in distinct magnifications. The ES and sand particles were clearly characterized. Figure 13f shows EDX characterization and it helps to identify the sand particles and C-S-H and C3A phases.
The distinctive energy peaks of EDX patterns indicate (duplicate: Samples #1 and #2) that both Fe and Cl ions migrated in cement paste to constitute the corrosion-filled (CFP) paste region. Figure 14a,b are presented to demonstrate the resulting micrograph of the CEM sample. Both SE-secondary electrons and BSE-back scattering electron techniques are depicted. This sample has a portion of cement (10 wt.%) replaced with the fine ES particle content. These fine ES particles (10 wt.%) have a fineness modulus close to cement.
It appears that fine ES content reacts as filler as previously reported [12,14,21,27,28,29,32]. The phases C-S-H and C3A were also characterized as depicted in Figure 14c. It seems that the C3A particles were relatively lower (~60 μm) than those characterized when the SAND sample is analyzed (~300 μm). This observation seems to be also correlated with mechanical behavior reached. Although the cement content is decreased, the resulting mechanical behavior did not substantially decrease as aforementioned. As also expected, both Fe and Cl ions were also identified. However, its corresponding intensity peaks were lower than the SAND sample. This induces that ions penetrated the cement constituting CFP but showing a lower quantity when compared with the SAND sample.
Figure 15a–d show SEM images in two magnifications, the elemental map image and the resulting EDX patterns of the CC (reference or control) sample, respectively. We observed that main elements of the examined concrete were characterized, i.e., sand particle, and C-S-H and C3A phases. The C3A phase has resulting size similar to the CEM sample. Both Fe and chloride ions were also identified. These were similar to the CEM sample, which seems to be lower than the examined SAND sample.
Ming and Shi [82] recently demonstrated the corrosion layer and corrosion-filled paste after long-term immersion at steel/concrete interface. We found that an excessive corrosion products formation provokes crack propagation from steel bar to paste. These corrosion products penetrate through the cracks formed and CFP regions were increased and/or enlarged. They [82] also demonstrated that distinctive steel bar protections were provided with different corrosion products, when ions were involved due to different steel (Cr-rich) were investigated [39,42,82].
The corrosion layer thick depends mainly of the ions involved, immersion period and aggressive of electrolyte. Commonly, the corrosion layer thick varies between some few micrometers to some hundred micrometers as previously investigated [38,39,42,43,82]. As also previously reported [38,39,40,42,43,44,82], Ca and Fe contents at steel/concrete interface to CFP region were varied. Fe content increases at CFP region indicating their migration and resulting crack propagation.
Distinct species FeOOH (goethite, akageneite and lepidocrocite, α, β and γ respectively.) and Fe2O3 and/or Fe3O4 were detected [40,42]. Other species can also be involved, such as FexOy and FexCly as reported by Kamde and Pillai [78]. A schematic representation at interface steel bar/concrete, showing corrosion layer and Fe and Ca concentrations variations is shown in Figure 16a. A representation with coarse ES particles distributed throughout the cement paste is shown in Figure 16b.
We concluded that the corrosion responses of the three embedded steel bars in distinct concretes were modified with immersion period and concrete composition. In order to predict the corrosion behavior of rebar for each one of the examined periods, EIS and polarizations results must be analyzed. The water-to-cement for all examined concretes were parameterized. This parameter associated with the consumption of cement (Co) constitutes a limiting factor of the present investigation. Modification in the “Co”, the compressive strength (CS) can slightly be modified. Based on this, the Co per CS ratios for the three examined concretes were determined as demonstrated in Table 6.
As previously reported [50], the values of Co/CS per CS indicate adequate results, i.e., the Co/CS decreases with the curing period and CS is increased. The lowest Co/CS is that of the CC sample followed by the CEM sample. Other two important parameters analyzed were the specific strength (SS) [49,50,51,54] and SS/icorr. The latter represents the attained CS concatenated with their specific mass. This induces a strength associated with a lightweight effect. The former means the strength/lightweight of the concrete paste concatenated with corrosion behavior of the embedded steel bar. The highest values were those of the CC sample followed by the CEM sample. This induces that the CEM sample, which has lower cement content (~10 wt.%) than other two concretes examined, is a competitive mixture to be considered.
Additionally, it is worth noted that, at initial period, the CEM sample (containing fine EG particles) reveals that a passive layer is rapidly formed, when compared to other two examined concrete samples. This seems to imply a slight better corrosion behavior for a long-term immersion period.
Based on the aforementioned assertions, eggshell waste (independently of their origin; due to possess similar compositions [83,84]) or similar material (e.g., limestone [4,5,6,7,8,9]) is a promise material to be used in civil construction, replacing cement portion and a decrease of about 10% in cement consumption is reached. With this, incommensurable economical and environmentally friendly gains can be attained. On the one hand, it is recognized that the worldwide cement consumption is more than 4 billion tons (in 2020) [84] and eggshell can also be applied in other distinctive industrial applications [85,86]. On the other hand, it is believed that there exists feasible accountability to propose and adequate planning of the certain portion of the global chicken egg production (~80 million metric tons [86,87]) to be utilized in civil engineering (replacing structural concrete or cement paste applications since minimal compressive strength is attained).

4. Conclusions

From the experimental results, the following conclusions can be drawn:
  • EIS technique and potentiodynamic polarization curves are useful to predict the corrosion behavior of the embedded steel bars. EIS technique permits to analyze double layer condition and concatenated planar and porous electrode behaviors were described.
  • It is also found that ES particles in two distinct sizes provide different corrosion aspects. Coarser ES particles did not substantially affect the initial rebar passivation as observed in the CC (control/reference) sample. On the other hand, when finer ES particles were utilized, the resulting passive layer is formed at initial period of immersion. This seems to positively reflect on the corrosion behavior in a long-term immersion period. These conclusions are based on both EIS and polarization results.
  • The eggshell content has no deleterious effect up on the fresh state properties. The resulting mechanical behavior is not substantially decreased. The concrete with 10 wt.% finer ES particles has their corresponding mechanical behavior decreased between ~10% and 12% when the CC (reference) mixture is compared.
  • Concatenating both mechanical strength and lightweight effect, and associating with corrosion behavior, it is induced that the proposed mixture containing 10 wt.% finer eggshell (ES) particles, demonstrates interesting and competitive results. An incommensurable environmentally friendly aspect can also be associated.
  • Since no substantial decreases in corrosion resistance is observed when eggshell is used, its replacement with cement portion (~10wt.%) represents significant economical gain in potential civil engineering application.

Author Contributions

Y.A.M. and I.M. developed the mixture and fresh and hardneded measurements and EIS/polarization analyses. R.S.B. and A.D.B. developed SEM observations and also helped with the mixture calculations and designing as well as with the general organization and English written; W.R.O. provided the general organization of the experiments and analyses of the correlation between microstructure and resulting properties. He has also written and organized the proposed manuscript. All authors have read and agreed to the published version of the manuscript.

Funding

Acknowledgments are also guided to the financial support provided by FAEPEX-UNICAMP (#2407/21 and # 2120/21), CAPES (Coordination for the Improvement of Higher Education Personnel, Ministry of Education, Brazil, Grant #1), CNPq (The Brazilian Research Council) Grants, #405602/2018-9 and #304950/2017-3.

Institutional Review Board Statement

Not applicable.

Informed Consent Statement

Not applicable.

Data Availability Statement

The authors also declare that all research data supporting this publication are directly available within this publication.

Acknowledgments

An anonymous colleague whom is a native speaker has significantly contributed with English writing revision. The authors acknowledge this mentioned colleague. Authors also acknowledge Luiz Antonio Garcia and Rosa C Ceche Lintz by important technical contributions.

Conflicts of Interest

The authors declare no conflict of interest.

References

  1. Sophia, M.; Sakthieswaran, N. Waste shell powders as valuable bio- filler in gypsum plaster—Efficient waste management technique by effective utilization. J. Clean. Prod. 2019, 220, 74–86. [Google Scholar] [CrossRef]
  2. Yao, Z.; Chen, T.; Li, H.; Xia, M.; Ye, Y.; Zheng, H. Mechanical and thermal properties of polypropylene (PP) composites filled with modified shell waste. J. Hazard. Mater. 2013, 262, 212–217. [Google Scholar] [CrossRef] [PubMed]
  3. Lu, J.; Cong, X.; Li, Y.; Hao, Y.; Wang, C. Scalable recycling of oyster shells into high purity calcite powders by the mechanochemical and hydrothermal treatments. J. Clean. Prod. 2018, 172, 1978–1985. [Google Scholar] [CrossRef]
  4. Islam, K.N.; Bin Abu Bakar, M.Z.; Ali, M.E.; Bin Hussein, M.Z.; Noordin, M.M.; Loqman, M.Y.; Miah, G.; Wahid, H.; Hashim, U. A novel method for the synthesis of calcium carbonate (aragonite) nanoparticles from cockle shells. Powder Technol. 2013, 235, 70–75. [Google Scholar] [CrossRef]
  5. Yoon, G.-L.; Kim, B.-T.; Kim, B.-O.; Han, S.-H. Chemical–mechanical characteristics of crushed oyster-shell. J. Clean. Prod. 2003, 23, 825–834. [Google Scholar] [CrossRef]
  6. Florek, M.; Fornal, E.; Gómez-Romero, P.; Zieba, E.; Paszkowicz, W.; Lekki, J.; Nowak, J.; Kuczumow, A. Complementary microstructural and chemical analyses of Sepia officinalis endoskeleton. Mater. Sci. Eng. C 2009, 29, 1220–1226. [Google Scholar] [CrossRef]
  7. Aqel, M.; Panesar, D. Hydration kinetics and compressive strength of steam-cured cement pastes and mortars containing limestone filler. Constr. Build. Mater. 2016, 113, 359–368. [Google Scholar] [CrossRef]
  8. Zhou, H.; Luchini, T.J.; Boroujeni, N.M.; Agarwal, A.K.; Goel, V.K.; Bhaduri, S.B. Development of nano silica bonded monetite cement from egg shells. Mater. Sci. Eng. C 2020, 23, 45–51. [Google Scholar] [CrossRef]
  9. Somdee, P.; Hasook, A. Effect of modified eggshell powder on physical properties of poly(lactic acid) and natural rubber composites. Mater. Today Proc. 2017, 4, 6502–6511. [Google Scholar] [CrossRef]
  10. Pavan, H.; Shettar, M.; Gowri, S.M.C.; Mohan, N.S. Investigation on effect of egg shell powder on mechanical properties of GFRP composites. Mater. Today Proc. 2018, 5, 3014–3018. [Google Scholar] [CrossRef]
  11. Cree, D.; Rutter, A. Sustainable Bio-Inspired Limestone Eggshell Powder for Potential Industrialized Applications. ACS Sustain. Chem. Eng. 2015, 3, 941–949. [Google Scholar] [CrossRef]
  12. Pliya, P.; Cree, D. Limestone derived eggshell powder as a replacement in Portland cement mortar. Constr. Build. Mater. 2015, 95, 1–9. [Google Scholar] [CrossRef]
  13. Wu, S.-C.; Hsu, H.-C.; Hsu, S.-K.; Tseng, C.-P.; Ho, W.-F. Preparation and characterization of hydroxyapatite synthesized from oyster shell powders. Adv. Powder Technol. 2017, 28, 1154–1158. [Google Scholar] [CrossRef]
  14. Matschei, T.; Lothenbach, B.; Glasser, F.P. The role of calcium carbonate in cement hydration. Cem. Concr. Res. 2007, 37, 551–558. [Google Scholar] [CrossRef]
  15. Liu, X.; Chen, L.; Liu, A.; Wang, X. Effect of Nano-CaCO3 on Properties of Cement Paste. Energy Procedia 2012, 16, 991–996. [Google Scholar] [CrossRef] [Green Version]
  16. Xu, Q.L.; Meng, T.; Huang, M.Z. Effects of Nano-CaCO3 on the Compressive Strength and Microstructure of High Strength Concrete in Different Curing Temperature. Appl. Mech. Mater. 2011, 121, 126–131. [Google Scholar] [CrossRef]
  17. Li, L.G.; Kwan, A.K. Adding limestone fines as cementitious paste replacement to improve tensile strength, stiffness and durability of concrete. Cem. Concr. Compos. 2015, 60, 17–24. [Google Scholar] [CrossRef]
  18. Meng, T.; Yu, Y.; Wang, Z. Effect of nano-CaCO3 slurry on the mechanical properties and micro-structure of concrete with and without fly ash. Compos. Part B Eng. 2017, 117, 124–129. [Google Scholar] [CrossRef]
  19. Wu, Z.; Shi, C.; Khayat, K. Multi-scale investigation of microstructure, fiber pullout behavior, and mechanical properties of ultra-high performance concrete with nano-CaCO3 particles. Cem. Concr. Compos. 2018, 86, 255–265. [Google Scholar] [CrossRef]
  20. Cao, M.; Xie, C.; Guan, J. Fracture behavior of cement mortar reinforced by hybrid composite fiber consisting of CaCO3 whiskers and PVA-steel hybrid fibers. Compos. Part A Appl. Sci. Manuf. 2019, 120, 172–187. [Google Scholar] [CrossRef]
  21. Wang, D.; Shi, C.; Farzadnia, N.; Shi, Z.; Jia, H. A review on effects of limestone powder on the properties of concrete. Constr. Build. Mater. 2018, 192, 153–166. [Google Scholar] [CrossRef]
  22. Vance, K.; Kumar, A.; Sant, G.; Neithalath, N. The rheological properties of ternary binders containing Portland cement, limestone, and metakaolin or fly ash. Cem. Concr. Res. 2013, 52, 196–207. [Google Scholar] [CrossRef]
  23. Bosiljkov, V.B. SCC mixes with poorly graded aggregate and high volume of limestone filler. Cem. Concr. Res. 2003, 33, 1279–1286. [Google Scholar] [CrossRef]
  24. Ghafoori, N.; Spitek, R.; Najimi, M. Influence of limestone size and content on transport properties of self-consolidating concrete. Constr. Build. Mater. 2016, 127, 588–595. [Google Scholar] [CrossRef]
  25. Shaikh, F.U.; Supit, S.W. Mechanical and durability properties of high volume fly ash (HVFA) concrete containing calcium carbonate (CaCO3) nanoparticles. Constr. Build. Mater. 2014, 70, 309–321. [Google Scholar] [CrossRef]
  26. Meddah, M.S.; Lmbachiya, M.C.; Dhir, R.K. Potential use of binary and composite limestone cements in concrete production. Constr. Build. Mater. 2014, 58, 193–205. [Google Scholar] [CrossRef]
  27. Ramezanianpour, A.A.; Ghiasvand, E.; Nickseresht, I.; Mahdikhani, M.; Moodi, F. Influence of various amounts of limestone powder on performance of Portland limestone cement concretes. Cem. Concr. Compos. 2009, 31, 715–720. [Google Scholar] [CrossRef]
  28. Ahmad, S.; Adekunle, S.; Maslehuddin, M.; Azad, A.K. Properties of self-consolidating concrete made utilizing alternative mineral fillers. Constr. Build. Mater. 2014, 68, 268–276. [Google Scholar] [CrossRef]
  29. Shaikh, F.U.A.; Supit, S.W.M. Chloride induced corrosion durability of high volume fly ash concretes containing nano particles. Constr. Build. Mater. 2015, 99, 208–225. [Google Scholar] [CrossRef]
  30. Khodabakhshian, A.; Ghalehnovi, M.; de Brito, J.; Shamsabadi, E.A. Durability performance of structural concrete containing silica fume and marble industry waste powder. J. Clean. Prod. 2018, 170, 42–60. [Google Scholar] [CrossRef]
  31. Ahmed, N.; Fathi, A.M.; Mohamed, M.; El-Gawad, W.A. Evaluation of new core-shell pigments on the anticorrosive performance of coated reinforced concrete steel. Prog. Org. Coat. 2020, 140, 105530. [Google Scholar] [CrossRef]
  32. Diab, A.M.; Aliabdo, A.A.; Mohamed, I.A. Corrosion behaviour of reinforced steel in concrete with ground limestone partial cement replacement. Mag. Concr. Res. 2015, 67, 747–761. [Google Scholar] [CrossRef]
  33. Pech-Canul, M.; Castro, P. Corrosion measurements of steel reinforcement in concrete exposed to a tropical marine atmosphere. Cem. Concr. Res. 2002, 32, 491–498. [Google Scholar] [CrossRef]
  34. Xizhen, Y.; Wu, Y. Thermodynamics of Metal Corrosion; Chemical Industry Press: Beijing, China, 1996; Chapter 3. [Google Scholar]
  35. Azoulay, I.; Rémazeilles, C.; Refait, P. Determination of standard Gibbs free energy of formation of chukanovite and Pourbaix diagrams of iron in carbonated media. Corros. Sci. 2012, 58, 229–236. [Google Scholar] [CrossRef]
  36. Montemor, F.; Simoes, A.; Ferreira, M. Chloride-induced corrosion on reinforcing steel: From the fundamentals to the monitoring techniques. Cem. Concr. Compos. 2003, 25, 491–502. [Google Scholar] [CrossRef] [Green Version]
  37. Ribeiro, D.; Abrantes, J. Application of electrochemical impedance spectroscopy (EIS) to monitor the corrosion of reinforced concrete: A new approach. Constr. Build. Mater. 2016, 111, 98–104. [Google Scholar] [CrossRef]
  38. Ghorbani, S.; Taji, I.; Tavakkolizadeh, M.; Davodi, A.; de Brito, J. Improving corrosion resistance of steel rebars in concrete with marble and granite waste dust as partial cement replacement. Constr. Build. Mater. 2018, 185, 110–119. [Google Scholar] [CrossRef]
  39. Sohail, M.G.; Kahraman, R.; Alnuaimi, N.A.; Gencturk, B.; Alnahhal, W.; Dawood, M.; Belarbi, A. Electrochemical behavior of mild and corrosion resistant concrete reinforcing steels. Constr. Build. Mater. 2020, 232, 117205. [Google Scholar] [CrossRef]
  40. Rodrigues, R.; Gaboreau, S.; Gance, J.; Ignatiadis, I.; Betelu, S. Reinforced concrete structures: A review of corrosion mechanisms and advances in electrical methods for corrosion monitoring. Constr. Build. Mater. 2021, 269, 121240. [Google Scholar] [CrossRef]
  41. Li, Z.; Jin, Z.; Wang, P.; Zhao, T. Corrosion mechanism of reinforced bars inside concrete and relevant monitoring or detection apparatus: A review. Constr. Build. Mater. 2021, 279, 122432. [Google Scholar] [CrossRef]
  42. Wong, H.S.; Zhao, Y.X.; Karimi, A.R.; Buenfeld, N.R.; Jin, W.L. On the penetration of corrosion products from reinforcing steel into concrete due to chloride-induced corrosion. Corros. Sci. 2010, 52, 2469–2480. [Google Scholar] [CrossRef] [Green Version]
  43. Yuan, Y.; Ji, Y. Modeling corroded section configuration of steel bar in concrete structure. Constr. Build. Mater. 2009, 23, 2461–2466. [Google Scholar] [CrossRef]
  44. Zhao, Y.; Karimi, A.R.; Wong, H.S.; Hu, B.; Buenfeld, N.R.; Jin, W. Comparison of uniform and non-uniform corrosion induced damage in reinforced concrete based on a Gaussian description of the corrosion layer. Corros. Sci. 2011, 53, 2803–2814. [Google Scholar] [CrossRef] [Green Version]
  45. De Levie, R. Advances in Electrochemistry and Electrochemical Engineering; Delahay, P., Ed.; Interscience: New York, NY, USA, 1967; Volume 6, pp. 329–397. [Google Scholar]
  46. Macdonald, D.D. Reflections on the history of electrochemical impedance spectroscopy. Electrochim. Acta 2006, 51, 1376–1388. [Google Scholar] [CrossRef]
  47. Macdonald, D.D.; McKubre, M.C.H.; Urquidi-Macdonald, M. Theoretical Assessment of AC Impedance Spectroscopy for Detecting Corrosion of Rebar in Reinforced Concrete. Corrosion 1988, 44, 2–7. [Google Scholar] [CrossRef]
  48. Bastidas, D.M. Interpretation of Impedance Data for Porous Electrodes and Diffusion Processes. Corrosion 2007, 63, 515–521. [Google Scholar] [CrossRef]
  49. Xavier, B.C.; Verzegnassi, E.; Bortolozo, A.D.; Alves, S.M.; Lintz, R.C.C.; Gachet, L.A.; Osório, W.R. Fresh and Hardened States of Distinctive Self-Compacting Concrete with Marble- and Phyllite-Powder Aggregate Contents. J. Mater. Civ. Eng. 2020, 32, 04020065. [Google Scholar] [CrossRef]
  50. Xavier, B.C.; Gomes, A.E.; Melo, M.L.; Lintz, R.C.C.; Gachet, L.A.; Osório, W.R. Study of three distinct self-compacting concretes containing marble/granite powder and hooked-end steel fiber contents. J. Compos. Mater. 2021, 55, 2823–2838. [Google Scholar] [CrossRef]
  51. Meyer, Y.A.; Bonatti, R.S.; Costa, D.; Bortolozo, A.D.; Osório, W.R. Compaction pressure and Si content effects on compressive strengths of Al/Si/Cu alloy composites. Mater. Sci. Eng. A 2020, 770, 138547. [Google Scholar] [CrossRef]
  52. Angst, U.M.; Geiker, M.R.; Michel, A.; Gehlen, C.; Wong, H.; Isgor, O.B.; Elsener, B.; Hansson, C.M.; François, R.; Hornbostel, K.; et al. The steel–concrete interface. Mater. Struct. 2017, 50, 143. [Google Scholar] [CrossRef]
  53. ASTM Standard C496M-04; Standard Test Method for Splitting Tensile Strength of Cylindrical Concrete Specimens. American Society for Testing and Materials: Philadelphia, PA, USA, 2004.
  54. Balbo, J.T. Relations between indirect tensile and flexural strengths for dry and plastic concretes. Rev. IBRACON Estrut. Mater. 2013, 6, 854–874. [Google Scholar] [CrossRef] [Green Version]
  55. ABNT, NBR 5739; Norma Concreto—Ensaios de Compressão de Corpos-de-Prova Cilíndricos (Standard Concrete—Compression test of Cylindric Specimens—Method of Test). Associação Brasileira de Normas Técnicas: São Paulo, Brazil, 2007. (In Portuguese)
  56. ABNT, NBR 7222; Argamassa e Concreto—Determinação da Resistência à Tração por Compressão Diametral de Corpos-de-Prova Cilíndricos (Mortar and Concrete—Determination of the Tensile Stregth of Cylindrical Specimens Subjected to Diametrical Compression). Associação Brasileira de Normas Técnicas: São Paulo, Brazil, 2011. (In Portuguese)
  57. Almeida, F.C.; Sales, A.; Moretti, J.P.; Mendes, P.C. Use of sugarcane bagasse ash sand (SBAS) as corrosion retardant for reinforced Portland slag cement concrete. Constr. Build. Mater. 2019, 226, 72–82. [Google Scholar] [CrossRef]
  58. Ismail, M.; Ohtsu, M. Corrosion rate of ordinary and high-performance concrete subjected to chloride attack by AC impedance spectroscopy. Constr. Build. Mater. 2006, 20, 458–469. [Google Scholar] [CrossRef]
  59. Meyer, Y.A.; Bonatti, R.S.; Bortolozo, A.D.; Osório, W.R. Electrochemical behavior and compressive strength of Al-Cu/xCu composites in NaCl solution. J. Solid State Electrochem. 2021, 25, 1303–1317. [Google Scholar] [CrossRef]
  60. Osório, W.R.; Peixoto, L.C.; Garcia, A. Electrochemical corrosion behaviour of a Ti-IF steel and a SAE 1020 steel in a 0.5 M NaCl solution. Mater. Corros. 2010, 61, 407–411. [Google Scholar] [CrossRef]
  61. Osório, W.R.; Peixoto, L.C.; Garcia, L.R.; Garcia, A. Electrochemical corrosion response of a low carbon heat treated steel in a NaCl solution. Mater. Corros. 2009, 60, 804–812. [Google Scholar] [CrossRef]
  62. Satizabal, L.M.; Costa, D.; Moraes, P.B.; Bortolozo, A.D.; Osório, W.R. Microstructural array and solute content affecting electrochemical behavior of Sn Ag and Sn Bi alloys compared with a traditional Sn Pb alloy. Mater. Chem. Phys. 2019, 223, 410–425. [Google Scholar] [CrossRef]
  63. Bonatti, R.S.; Meyer, Y.A.; Padilha, P.G.; Bortolozo, P.A.; Osório, W.R. Silicon Content Affecting Corrosion Behavior of Alp/Sip Composites in a Biodiesel Blend. Corrosion 2020, 76, 1109–1121. [Google Scholar] [CrossRef]
  64. Awoyera, P.O.; Olalusi, O.B.; Iweriebo, N. Physical, strength, and microscale properties of plastic fiber-reinforced concrete containing fine ceramics particles. Materialia 2021, 15, 100970. [Google Scholar] [CrossRef]
  65. Ramli, M.; Dawood, E.T. Comparative study between flowable high strength mortar and flowing high strength concrete. Concr. Res. Lett. 2011, 2, 249–261. [Google Scholar]
  66. Khatri, R.; Sirivivatnanon, V.; Gross, W. Effect of different supplementary cementitious materials on mechanical properties of high performance concrete. Cem. Concr. Res. 1995, 25, 209–220. [Google Scholar] [CrossRef]
  67. Hirschorn, B.; Orazem, M.E.; Tribollet, B.; Vivier, V.; Frateur, I.; Musiani, M. Determination of effective capacitance and film thickness from constant-phase-element parameters. Electrochim. Acta 2010, 55, 6218–6227. [Google Scholar] [CrossRef]
  68. Orazem, M.; Pébère, N.; Tribollet, B. Enhanced Graphical Representation of Electrochemical Impedance Data. J. Electrochem. Soc. 2006, 153, B129–B136. [Google Scholar] [CrossRef]
  69. Vida, T. Electrochemical Corrosion Behavior of as-cast Zn-rich Zn-Mg Alloys in a 0.06M NaCl Solution. Int. J. Electrochem. Sci. 2017, 12, 5264–5283. [Google Scholar] [CrossRef]
  70. Sunde, S.; Lervik, I.A.; Owe, L.-E.; Tsypkin, M. An Impedance Model for a Porous Intercalation Electrode with Mixed Conductivity. J. Electrochem. Soc. 2009, 156, B927–B937. [Google Scholar] [CrossRef]
  71. Hansen, J.E.M. Analysis of an Impedance Model for Porous Semiconductor Electrodes. Master’s Thesis, Norwegina University of Science and Technlogy, Trondhein, Norway, June 2012; p. 64. [Google Scholar]
  72. Schlesinger, M.; Lasia, A. Modeling of Impedance of Porous Electrodes, Modeling and Numerical Simulations; Springer: New York, NY, USA, 2009; Volume 209, pp. 67–137. [Google Scholar]
  73. Travassos, S.; Tomachuk, C.; de Melo, H. EIS investigation and patina characterization of weathering steel exposed to each of the four seasons in the São Paulo metropolitan area. Electrochim. Acta 2019, 325, 134885. [Google Scholar] [CrossRef]
  74. Murray, J.N. Electrochemical test methods for evaluating organic coatings on metals: An update Part III: Multiple tet parameter measurements. Prog. Org. Coat. 1997, 31, 375–391. [Google Scholar] [CrossRef]
  75. Qiao, G.; Ou, J. Corrosion monitoring of reinforcing steel in cement mortar by EIS and ENA. Electrochim. Acta 2007, 52, 8008–8019. [Google Scholar] [CrossRef]
  76. Shi, J.; Sun, W. Effects of phosphate on the chloride-induced corrosion behavior of reinforcing steel in mortars. Cem. Concr. Compos. 2014, 45, 166–175. [Google Scholar] [CrossRef]
  77. Sun, H.; Ren, Z.; Memon, S.A.; Zhao, D.; Zhang, X.; Li, D.; Xing, F. Investigating drying behavior of cement mortar through electrochemical impedance spectroscopy analysis. Constr. Build. Mater. 2017, 135, 361–368. [Google Scholar] [CrossRef]
  78. Kamde, D.K.; Pillai, R.G. Corrosion initiation mechanisms and service life estimation of concrete systems with fusion-bonded-epoxy (FBE) coated steel exposed to chlorides. Constr. Build. Mater. 2021, 277, 122314. [Google Scholar] [CrossRef]
  79. Guo, M.; Xiao, J.; Wang, J. Impact of the coupled substitution of CaCO3 and CaSO4·2H2O on chloride binding behavior in hydrated C3A pastes. Constr. Build. Mater. 2019, 217, 638–650. [Google Scholar] [CrossRef]
  80. Koleva, D.A. An Innovative Approach to Control Steel Reinforcement Corrosion by Self-Healing. Materials 2018, 11, 309. [Google Scholar] [CrossRef] [Green Version]
  81. Xue, F.; Wei, X.; Dong, J.; Etim, I.-I.N.; Wang, C.; Ke, W. Effect of residual dissolved oxygen on the corrosion behavior of low carbon steel in 0.1 M NaHCO3 solution. J. Mater. Sci. Technol. 2018, 34, 1349–1358. [Google Scholar] [CrossRef]
  82. Pourbaix, M. Lectures on Electrochemical Corrosion; Plenum Press: New York, NY, USA, 1973. [Google Scholar]
  83. Ming, J.; Shi, J. Distribution of corrosion products at the steel-concrete interface: Influence of mill scale properties, reinforcing steel type and corrosion inducing method. Constr. Build. Mater. 2019, 229, 116854. [Google Scholar] [CrossRef]
  84. Adeyeye, E. Comparative study on the characteristics of egg shells of some bird species. Bull. Chem. Soc. Ethiop. 2009, 23, 159–166. [Google Scholar] [CrossRef]
  85. Garside, M. Global Cement Production 1995–2020. Chem. Res. 2021. Available online: https://www.statista.com/statistics/1087115/global-cement-production-volume (accessed on 23 December 2021).
  86. Hamideh, F.; Akbar, A. Application of eggshell wastes as valuable and utilizable products: A review. Res. Agric. Eng. 2018, 64, 104–114. [Google Scholar] [CrossRef] [Green Version]
  87. Ahmed, T.A.E.; Wu, L.; Younes, M.; Hincke, M. Biotechnological Applications of Eggshell: Recent Advances. Front. Bioeng. Biotechnol. 2021, 9, 675364. [Google Scholar] [CrossRef]
Figure 1. (a) Experimental representation of the embedded steel bar for electrochemical corrosion behavior in stagnant and naturally aerated 0.5 M NaCl at 25 (±3) °C. Dimensions are in millimeters. (b) A typical steel bar coated with epoxy before embedding into the concrete used in experiments.
Metals 12 00417 g001
Figure 2. (a) The obtained eggshell (ES) portion, and (b) stereoscopic image showing the dimensions of coarser ES particles used to replaced with sand content, (c) finer ES particles inside agate mortar, (d,e) typical specimens subjected to compression and diametrical compression (indirect tensile behavior) and (f) typical fractured sample with sand content replaced with the coarse ES portion.
Metals 12 00417 g002
Figure 3. Correlation between tensile and compressive strengths demonstrating TS = k CS0.5, considering 7 and 28 days of curing.
Metals 12 00417 g003
Figure 4. Experimental results of EIS of the CC, SAND and CEM samples at distinct curing/immersion curing periods (1, 7, 28 and 365 days) in a stagnant/naturally aerated 0.5 M NaCl solution. (ac) depicts Bode and Bode-phase plots and (df) show Nyquist plots in different examined days.
Metals 12 00417 g004
Figure 5. Duplicate of the results for the CC and CEM for 1 and 7 days in Bode/bode-phase (a) and (b), (c) and (d); respectively; and Nyquist plots in same periods for the CC and CEM samples for 1 day (e) and (g); and during 7 days during 1 and 7 days; (f) and (h), respectively.
Metals 12 00417 g005
Figure 6. Moduli of the imaginary parts of the impedances vs. frequencies of: (a) the CC, (b) the SAND and (c) the CEM samples (Figure 6a–c, respectively) samples over 7 days of immersion in NaCl solution. Porous behavior is characterized when slopes are about −1/2 or lower (−1/4), while the planar electrode behavior has a slope of about −1.
Metals 12 00417 g006
Figure 7. Schematic representations of the Nyquist plots and corresponding corrosion layer formation with predominant: (a) planar electrode behavior, (b) porous behavior and (c) porous with Warburg component formation.
Metals 12 00417 g007
Figure 8. Proposed equivalent circuit (EC) utilized to simulate the EIS parameters.
Metals 12 00417 g008
Figure 9. Schematic representation involving of the three distinct concretes: (a) the conventional concrete sample (CC), (b,c) the SAND and the CEM samples the SAND sample containing 10 wt.% EG particles, respectively, at initial stages of immersion. (df) sequential stages of immersion (e.g., 7 days) with evolution of double layer to corrosion (film) layer and interaction with bar, and (gi) the relative long-term (~365 days) immersion with possible damaged oxide layer and corresponding corrosion-filled (CFP) paste.
Metals 12 00417 g009aMetals 12 00417 g009b
Figure 10. Pourbaix diagram of Fe-H2O-CO2 system adapted from Pourbaix, 1973, [81].
Metals 12 00417 g010
Figure 11. Experimental results of potentiodynamic polarization curves in NaCl for all examined samples in NaCl solution considering distinctive immersion periods (1 days, 7, 28 and 365 days).
Metals 12 00417 g011
Figure 12. Variation of experimental values of: (a) icorr and (b) Ecorr with immersion periods of the three examined samples in NaCl solution.
Metals 12 00417 g012
Figure 13. (a) The CC, CEM and SAND sample depicting the concrete microstructure, (b) showing elements constituting concrete including ES (egg-shell) particles, (c) demonstrating the local at interface bar/concrete where the samples were withdrawn, (d,e) SEM images obtained at interface bar/concrete, and (f,g) elemental map and EDX diagrams of the SAND sample.
Metals 12 00417 g013
Figure 14. (a,b) typical SEM micrographs of the CEM sample and (ce) elemental map and EDX diagrams (duplicate) of the CEM sample, respectively. Eggshell particles are identified by white arrows inside (b).
Metals 12 00417 g014
Figure 15. (a,b) typical SEM micrographs of the CEM sample and (c,d) elemental map and EDX diagram of the CC (reference/control) sample, respectively.
Metals 12 00417 g015
Figure 16. Schematic representation of Fe and Ca ions at transversal section between bar and concrete containing: (a) corrosion layer and corrosion-filled paste and (b) containing ES particle. Points #1, 2, 3 and 4 inside (a,b) corresponding with points of the right part of the figure.
Metals 12 00417 g016
Table 1. The concrete mix proportions (CC = 1:2.4:2.57) using distinct ES particle contents replacing the sand and cement portions.
MixCement
(kg/m3)
Sand
(kg/m3)
CA
(kg/m3)
Water (kg/m3)ES
Content (kg)
w/c RatioES
Average Size
(μm)
CC368884946221---0.6---
SAND37079995022280
(10%)
0.6Between
2000 and 4000
CEM33990396720434
(10%)
0.6<20
Table 2. Experimental results of slump, compressive and tensile (cylindrical compression) strengths at 7 and 28 days for the three distinctive concrete specimens examined.
MixtureCS at 7 Days
(MPa)
CS at 28 Days
(MPa)
TS at 7 Days
(MPa)
TS at 28 Days
(MPa)
Slump
(mm)
CC18 (±2)23 (±2)2.5 (±0.3)3.1 (±0.3)88 (±3)
SAND14 (±2)15 (±2)2.4 (±0.2)2.8 (±0.4)76 (±4)
CEM16 (±2)18 (±2)2.7 (±0.3)4.9 (±0.3)77 (±3)
Table 3. Impedance parameters determined using equivalent circuit (EC) shown in Figure 8 with steel bars embedded in distinct concretes over 1 and 7 days.
ParametersCC
1 Day
CEM
1 Day
SAND
1 Day
QConcr (10−12 F/cm2)3228 (±64)11.2 (±2.7)5.4 (±0.2)
RConcr (Ω cm2)54 (±0.2)42.3 (± 1)46.9 (±0.1)
QInterf (10−3 F/cm2)0.6(±0.02)1.5 (±0.02)1.1 (±0.03)
RInterf (Ω cm2)14.2 (±0.5)45.4 (±7)14 (±0.1)
n20.63 0.330.38
QBar (10−3 F/cm2)4.9 (±0.5)3.9 (±0.2)12.1 (±0.1)
Rbar (Ω cm2)130 (±18)47.3 (±1.2)32.6 (±3)
n30.750.540.61
W (Ω cm2)7543 (±145)2938 (±20)1332 (±11)
χ28.2 × 10−41.5 × 10−45.5 × 10⁻⁴
Σ Sqr.0.090.020.08
ParametersCC
7 Days
CEM
7 Days
SAND
7 Days
QConcr (10−12 F/cm2)3.8 (±0.8)0.5 (±0.08)0.3 (±0.08)
RConcr (Ω cm2)42.9 (±0.1)15.7 (±0.02)16.9(±0.03)
QInterf (10−3 F/cm2)3.0 (±0.03)4.1(±0.02)3.8 (±0.03)
RInterf (Ω cm2)20.8(±0.1)25.6 (±0.08)25.8 (±0.13)
n20.35 0.320.30
QBar (10−3 F/cm2)16.5 (±0.1)10.6 (±0.07)6.9 (±0.6)
Rbar (Ω cm2)132 (±1.5)24.4(±0.2)34.7 (±0.4)
n30.540.480.48
W (Ω cm2)44.5 (±5)382 (±7)546 (±11)
χ22.3 × 10−41.4 × 10−43.3 × 10⁻⁴
Σ Sqr.0.030.020.05
Table 4. Impedance parameters determined using equivalent circuit (EC) shown in Figure 8 with steel bars embedded in distinct concretes over 28 and 365 days.
ParametersCC
28 Days
CEM
28 Days
SAND
28 Days
QConcr (10−12 F/cm2)10.5 (±2.3)48.5 (±9)12.1 (±3)
RConcrete (Ω cm2)39.2 (±0.1)79.6 (±0.08)63.5 (±0.08)
QInterf (10−6 F/cm2)6.2 (±0.02)2.9 (±0.04)3.2 (±0.03)
RInterf (Ω cm2)60.8 (±0.2)99.4 (±0.3)59.3 (±0.3)
n20.21 0.220.24
QBar (10−3 F/cm2)6.4 (±0.1)9.4 (±0.1)9.3 (±0.1)
RBar (Ω cm2)16.3 (±0.6)27.2 (±1.3)23.2 (±0.7)
n30.600.580.52
W (Ω cm2)721.7 (±14)831.5 (±4)451 (±3)
χ22.5 × 10−42.3 × 10−43.7 × 10⁻⁴
Σ Sqr.0.040.030.05
ParametersCC
365 Days
CEM
365 Days
SAND
365 Days
QConcr (10−12 F/cm2)0.47 (±0.4)0.71 (±0.2)0.79 (±0.3)
RConcr (Ω cm2)27.9 (±0.04)21.3 (±0.05)40.2 (±0.1)
QInterf (10−3 F/cm2)0.021 (±0.003)0.053 (±0.001)0.006 (±0.001)
RInterf (Ω cm2)34.5 (±0.2)27.9 (±0.08)48.3 (±0.2)
n20.450.420.52
QBar (10−3 F/cm2)18.1 (±0.8)24.3 (±0.3)12.2 (±0.1)
RBar (Ω cm2)67.9 (±1.5)78.5 (±2)6.4 (±3)
n30.490.510.41
W (Ω cm2)113 (±3)21.3 (±2)147 (±15)
χ22.4 × 10−46.6 × 10−46.5 × 10⁻⁴
Σ Sqr.0.030.090.09
Table 5. Polarization and impedance parameters of the CC, SAND and CEM samples in distinctive immersion periods.
MixtureParameterPeriod (in Days)
1728365
CCicorr/μAcm−22.9 (±0.3)22.3 (±0.4)19.4 (±0.5)88.0 (±2)
Ecorr/mV−493 (±2)−735 (±2)−664 (±2)−557 (±1)
ipp/μAcm−2---8145---
Rbar/Ω cm2130 (±18)132 (±1.5)16.3 (±0.6)67.9 (±1.5)
Rint/Ω cm214 (±0.5)21 (±0.1)61 (±0.2)35 (±0.2)
W/Ω cm27.5k (±0.14k)44.5 (±5)721.7 (±14)113 (±3)
SANDicorr/μAcm−210.4 (±0.4)18.8 (±0.4)23.5 (±0.4)76.0 (±2)
Ecorr/mV−622 (±2)−743 (±2)−679 (±2)−637 (±1)
ipp/μAcm−2---6571---
Rbar/Ω cm232.6 (±3)34.7 (±0.4)23.2(±0.7)6.4 (±3)
Rint/Ω cm214 (±0.1)26 (±0.1)60 (±0.5)48 (±0.2)
W/Ω cm21.3k (±0.01k)546 (±11)451(±3)147 (±15)
CEMicorr/μAcm−29.2 (±0.5)23.9 (±0.5)21.2 (±0.5)71 (±2)
Ecorr/mV−673 (±2)−729 (±2)−673 (±2)−555 (±1)
ipp/μAcm−23996.6 54---
Rbar/Ω cm247.3 (±1.2)24.4 (±0.2)27.2(±1.3)78.5 (±2)
Rint/Ω cm245 (±7)26 (±0.1)99 (±0.3)28 (±0.1)
W/Ω cm22.9k (±0.02k)382 (±7)831.5(±4)21.3 (±2)
Table 6. The values of the consumption of cement (Co), the Co per compressive strength (CS), the specific mass (d), the determined specific strength (SS) per (d) and SS per icorr at 7 and 28 days for the CC, SAND and CEM samples examined.
MixCo
(kg/m3)
Co/CS (*)
(kg·m−3·MPa−1)
d
(kg/m3)
SS (**)
(103 × m2/s2)
SS/icorr ()
(105 × N·m3/A·kg)
CC3687d20 (±3)21438.4 (±0.2)0.38
28d 16 (±1)10.7 (±0.2)0.55
SAND370 7d26 (±3)21376.5 (±0.2)0.36
28d25 (±3)7.0 (±0.1)0.30
CEM339 7d23 (±1)21287.5 (±0.1)0.31
28d21 (±3)8.5 (±0.1)0.40
(*) Co per CS represents the consumption of cement per compressive strength (CS); (**) SS means specific strength being CS per density (d, or specific mass) as a function of mixture elements; () SS per icorr is ratio between SS and corrosion current density (icorr) obtained from Table 2.
Publisher’s Note: MDPI stays neutral with regard to jurisdictional claims in published maps and institutional affiliations.

