Article

The Effect of Symmetrically Tilt Grain Boundary of Aluminum on Hydrogen Diffusion

1
National Engineering Research Center for Equipment and Technology of Cold Strip Rolling, Yanshan University, Qinhuangdao 066004, China
2
Department of Chemistry, University of Warwick, Coventry CV4 7AL, UK
*
Author to whom correspondence should be addressed.
Metals 2022, 12(2), 345; https://doi.org/10.3390/met12020345
Submission received: 18 November 2021 / Revised: 24 December 2021 / Accepted: 2 February 2022 / Published: 16 February 2022
(This article belongs to the Special Issue Review of Hydrogen Embrittlement in Metals)

Abstract

:
High-strength aluminum alloys are widely used in industry. Hydrogen embrittlement greatly reduces the performance and service safety of aluminum alloys. The hydrogen traps in alumi-num profoundly affect the hydrogen embrittlement of aluminum. Here, we took a coinci-dence-site lattice (CSL) symmetrically tilted grain boundary (STGB) Σ5(120)[001] as an example to carry out molecular dynamics (MD) simulations of hydrogen diffusion in aluminum at dif-ferent temperatures, and to obtain results and rules consistent with the experiment. At 700 K, three groups of MD simulations with concentrations of 0.5, 2.5 and 5 atomic % hydrogen (at. % H) were carried out for STGB models at different angles. By analyzing the simulation results and the MSD curves of hydrogen atoms, we found that, in the low hydrogen concentration of STGB models, the grain boundaries captured hydrogen atoms and hindered their movement. In high-hydrogen-concentration models, the diffusion rate of hydrogen atoms was not affected by the grain boundaries. The analysis of the simulation results showed that the diffusion of hydro-gen atoms at the grain boundary is anisotropic.

1. Introduction

Hydrogen is one of the important factors that causes the performance degradation of metal parts, reducing service life and endangering service safety [1,2,3]. High-strength aluminum alloys are widely used in aerospace and other fields due to their high strength–mass ratio. The hydrogen embrittlement of aluminum alloys has a great impact on the development of industry, which is specifically manifested in the reduction in the mechanical properties of the material and the fracture of aluminum alloy parts. The hydrogen embrittlement of aluminum alloys and the hydrogen embrittlement mechanism have received extensive attention from scholars.
The diffusion of hydrogen in metals is an important issue in the study of the hydrogen embrittlement of metals. According to the diffusion mechanism, Fick’s law can be used to describe the diffusion of hydrogen in metals [4,5]:
C ( z , t ) t = D 2 C ( z , t ) z 2
where C ( z , t ) is the concentration and D is the diffusion rate. In an ideal environment, diffusion is the transfer of material molecules from the region with a high concentration to the region with a low concentration in the process of irregular movement [6,7]. However, hydrogen atoms are affected by hydrogen traps and will aggregate during the diffusion process. The accumulated hydrogen atoms will cause the local pressure to increase and become the source of cracks after the formation of hydrogen molecules, which will lead to hydrogen-induced material damage [8,9,10]. The defects of metal microstructures such as vacancies, dislocations, microcracks, and grain boundaries, which could all pin hydrogen, are called hydrogen traps. The number and density of hydrogen traps will affect the diffusion of hydrogen and profoundly affect the hydrogen embrittlement of metal materials [11,12,13]. An analysis of the influence of microstructure defects in aluminum alloys on hydrogen diffusion is of great significance to the study of the hydrogen embrittlement mechanism of aluminum alloys.
As a common hydrogen trap, the grain boundary had a larger effect on the hydrogen embrittlement sensitivity of the metal [14,15]. In the study of the grain boundary on hydrogen embrittlement, the same material with different grain sizes had a different hydrogen embrittlement, and the different grain sizes indicated that the grain boundary density was different. Fuchigami et al. [16] studied martensite steel, Takasawa et al. [17] researched high-intensity low-alloy (HSLA) steel and Yazdipour et al. [18] studied pipeline steels; all of these authors showed that refining grains and increasing the density of grain boundary could improve the hydrogen embrittlement resistance of materials. The simulation of Pedersen et al. [19] on the low concentration hydrogen diffusion of aluminum showed that the diffusion rate of hydrogen atoms at the grain boundary was lower than that in the crystal, and the trapping of hydrogen atoms at the grain boundaries hindered the diffusion of hydrogen atoms.
However, the study of hydrogen diffusion at nickel grain boundaries by Harris et al. showed that the difference in the H diffusion rate at the grain boundaries was related to the concentration of hydrogen. The grain boundaries captured the hydrogen atoms when the hydrogen concentration was low. When the hydrogen at the grain boundary reached a certain concentration, the grain boundaries could be used as a channel for the rapid diffusion of hydrogen atoms, and the diffusion rate of H increased [20]. Ichimura et al. also proved this idea by investigating the hydrogen diffusion rate and solubility of pure aluminum with different grain sizes via a high-temperature thermal desorption experiment [21]. Brass et al. conducted an electrochemical diffusion experiment of different grain sizes of nickel. The diffusion rate of hydrogen in nickel increased due to the diffusion of high concentration of hydrogen on the grain boundaries [22]. The electrocatalytic behavior of nickel with different grain sizes in alkaline media was studied by Doyle et al. [23]; the higher diffusion rate of hydrogen at the grain boundaries was confirmed by this study. Although the diffusion rate of hydrogen in the grain boundary can be measured and calculated by clever experiments, there are many grain boundaries with different types and angles. This is a huge project that measures the hydrogen diffusion rate at different grain boundaries. These problems lead to the inability to test the diffusion rate of hydrogen for each kind of grain boundaries.
Page et al. used molecular dynamics (MD) to simulate the diffusion of hydrogen in nickel. The study carried out a plethora of calculations, where the diffusion rates of hydrogen in the grain boundaries at various angles were calculated. The results showed that the diffusion rate of hydrogen at the grain boundaries was higher than that in the crystals in the environment of higher hydrogen concentration [24]. The workload was greatly reduced by the MD simulation where the grain boundaries’ information was obtained. The measurement of hydrogen diffusion through MD simulation also faced new challenges. Due to the computational power of computer, the MD simulation system is usually small, and the established model is usually different from the actual situation. The diffusion rate may be affected by the size of the models.
In this study, the diffusion simulation of the hydrogen in STGB and bulk of aluminum at different temperatures was carried out, and the accuracy of the models was judged by comparison with experimental values. MD simulations of different hydrogen concentrations were carried out in STGB models with different angles, and the influence of grain boundaries on the hydrogen diffusion rate under different angles and different hydrogen concentrations was discussed.

2. Method

2.1. Grain Boundary Model

In this study, the MD simulation was carried out on the open-source software LAMMPS developed by Sandia National Laboratory [25]. The models were built by commercial software Materials Studio, and the visualization of the calculation results was realized on the commercial software OVITO. STGBs of aluminum were constructed by establishing standard bicrystal models [26]. The models adopted periodic boundaries in the calculation process. The established bicrystal model contained two identical STGBs under periodic boundary conditions, which were located in the middle and at the end of the model. The two grains in the bicrystal model also needed to maintain their periodicity. In order to explore the effect of grain boundaries with different angles on hydrogen diffusion, we selected 7 coincidence-site lattice (CSL) grain boundaries with different tilt angles of aluminum as the research object. These bicrystal models with STGBs took [001] crystal direction as the rotation axis. Table 1 listed the CSL parameters, grain boundary planes and tilt angles of the 7 STGBs.
The models were calculated under periodic boundary conditions and the average size of the model with STGB is 32 Å × 40 Å × 70 Å. The models became the correct configuration by removing the overlapping aluminum atoms at the grain boundaries. On average, there were 6000 aluminum atoms in each model. Hydrogen atoms with randomly distributed positions were added to all STGB models of aluminum, and different numbers of hydrogen atoms were added to enable concentrations of 0.5, 2.5 and 5 at. % H in the model, respectively. One group of STGB models with 5 at. % hydrogen in different misorientation angles is shown in Figure 1. For convenience of observation, aluminum atoms and hydrogen atoms in all models were not displayed in accordance with the real proportion.
In order to ensure the accuracy of hydrogen diffusion in the constructed bicrystal model, and consider the difference of hydrogen diffusion in the model with different tilt angles, one group of corresponding single-grain bulk models without grain boundaries were constructed as the control groups for each STGB model. The rotation axes of the grains in the control models were the same as those in the bicrystal model, and the tilt angle was the same as that of a single grain in the bicrystal model. The control groups also ensured the periodicity of aluminum grains and added the same proportion of hydrogen atoms. The models of the control groups are shown in Figure 2. All simulations of hydrogen diffusion in STGBs were carried out in LAMMPS, including the simulations of control groups. The bond sequence potential (BOP), developed by Zhou to describe the Al-Cu-H system, was used as the interaction between Al-H atoms [27], the Nosé–Hoover thermostat and Isothermal–isobaric (NPT) ensemble barostat were used in the whole simulation process [28,29]. The step of MD simulation was 0.001 ps. Before simulation, models required a relaxation of 20 ps to ensure that the whole model reached the required temperature and the temperature fluctuation range was within 10 K. All models were simulated for 1200 ps after relaxation to observe the diffusion process of hydrogen atoms and obtained the mean square displacement (MSD) of hydrogen atoms in the MD simulations.

2.2. Calculation of Hydrogen Diffusion

In molecular dynamics, the average of the squares of atomic displacements was called the mean square displacement (MSD). The MSD was used to measure the average moving distance of the atom. The relationship between the MSD and time can reflect the diffusion intensity of the atom. The atomic diffusion rate was calculated by counting the average displacement of atoms in the system. The MSD of hydrogen atoms was calculated using Formula (2):
MSD = | r i ( t ) r i ( 0 ) | 2
where r i ( 0 ) is the three-dimensional position vector of the ith hydrogen atom at time 0, and r i ( t ) is the three-dimensional position vector of the ith hydrogen atom at time t. In all simulations in this study, MSD data were recorded every 100 steps. For the hydrogen diffusion rate, according to the Einstein formula of diffusion rate, the diffusion rate D in the system can be calculated by MSD. The relationship between diffusion rate and MSD is as follows:
D = lim t 1 6 t | r i ( t ) r i ( 0 ) | 2 = lim t MSD 6 t

3. Results

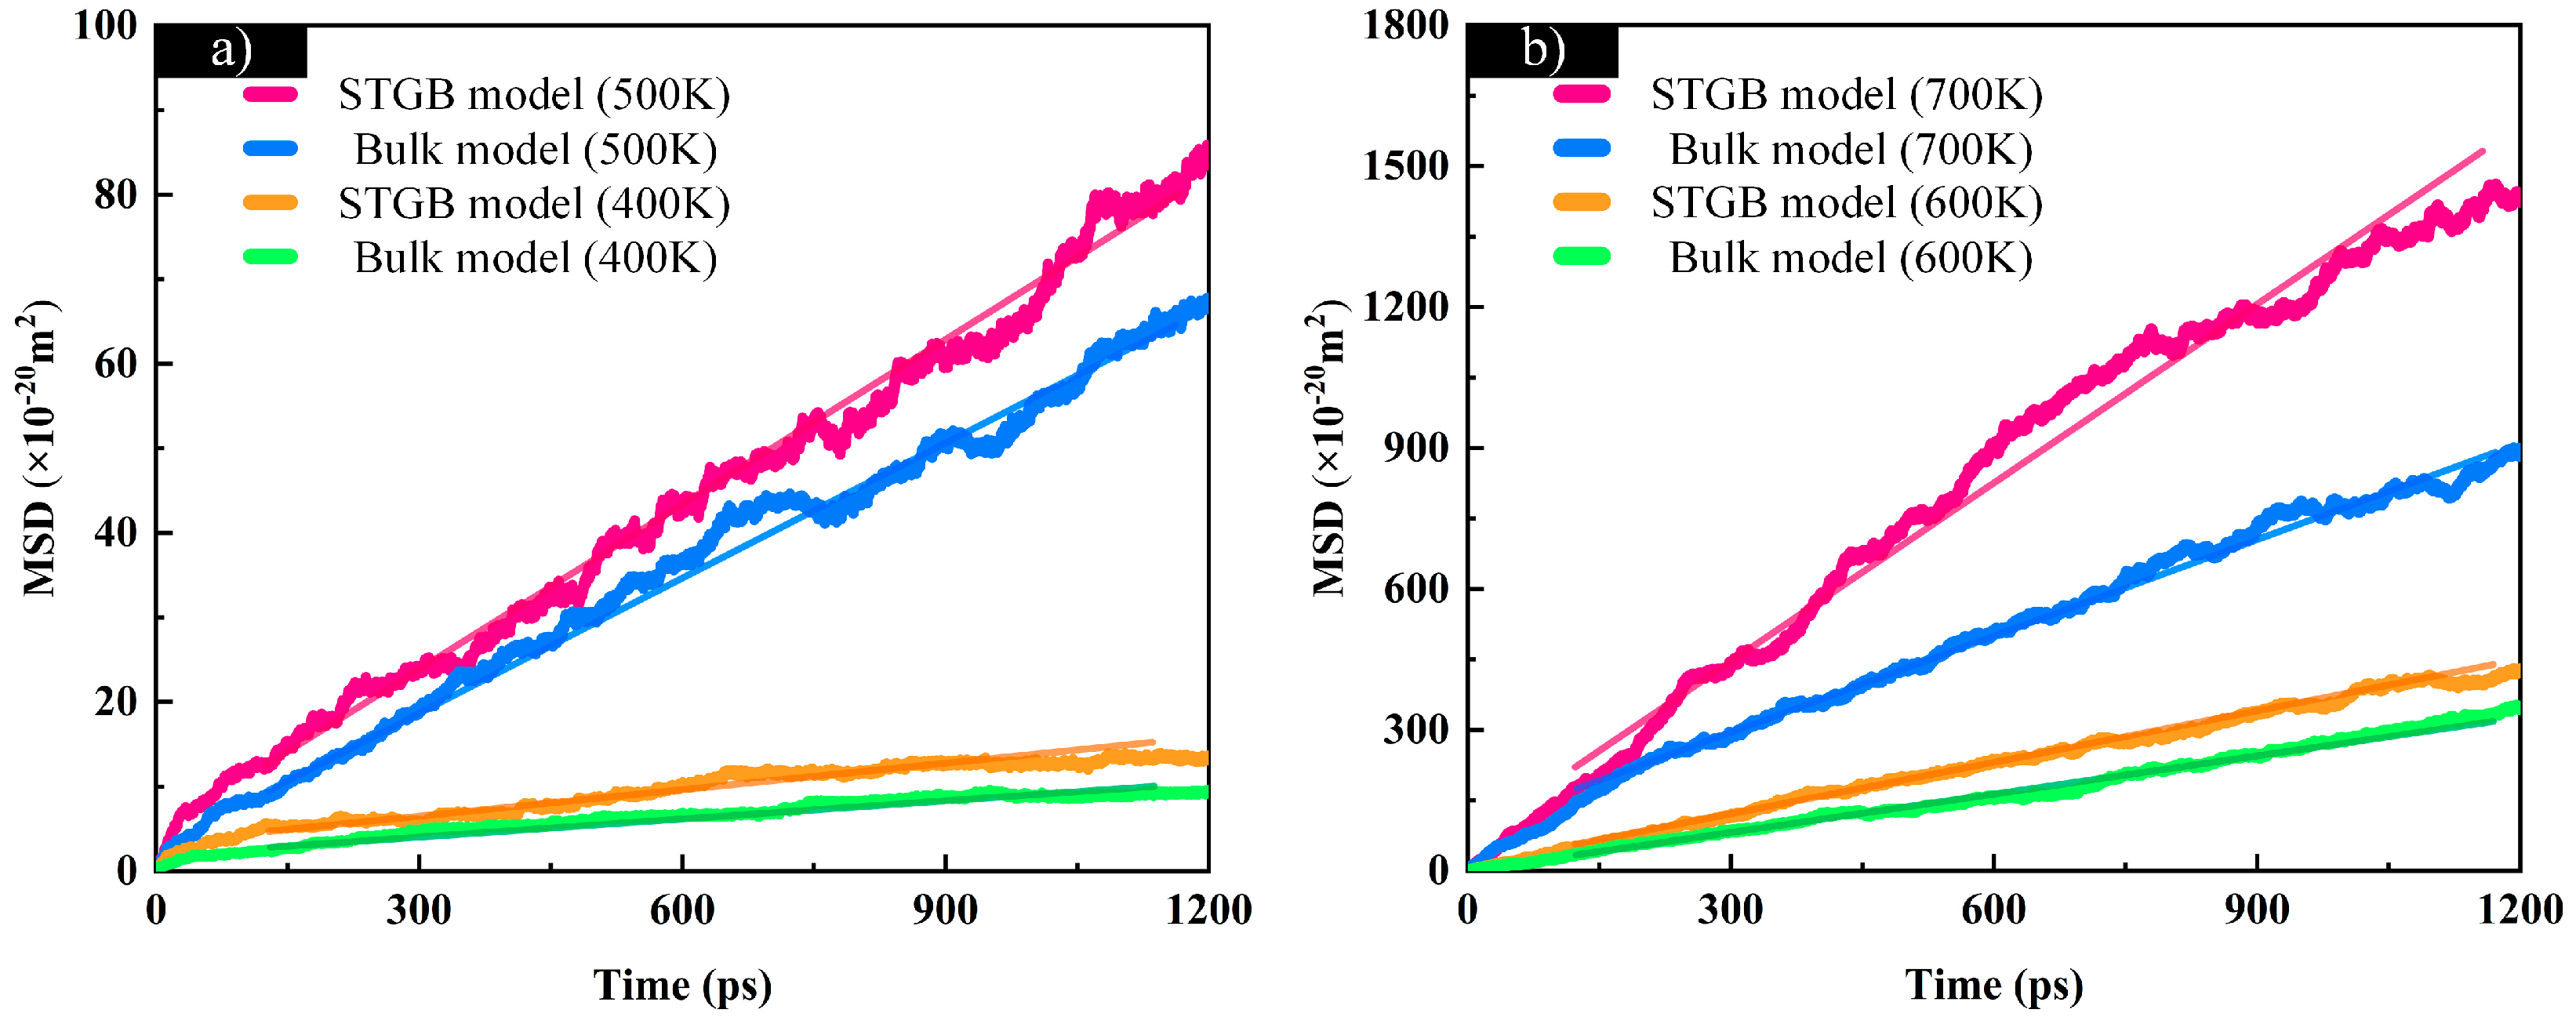
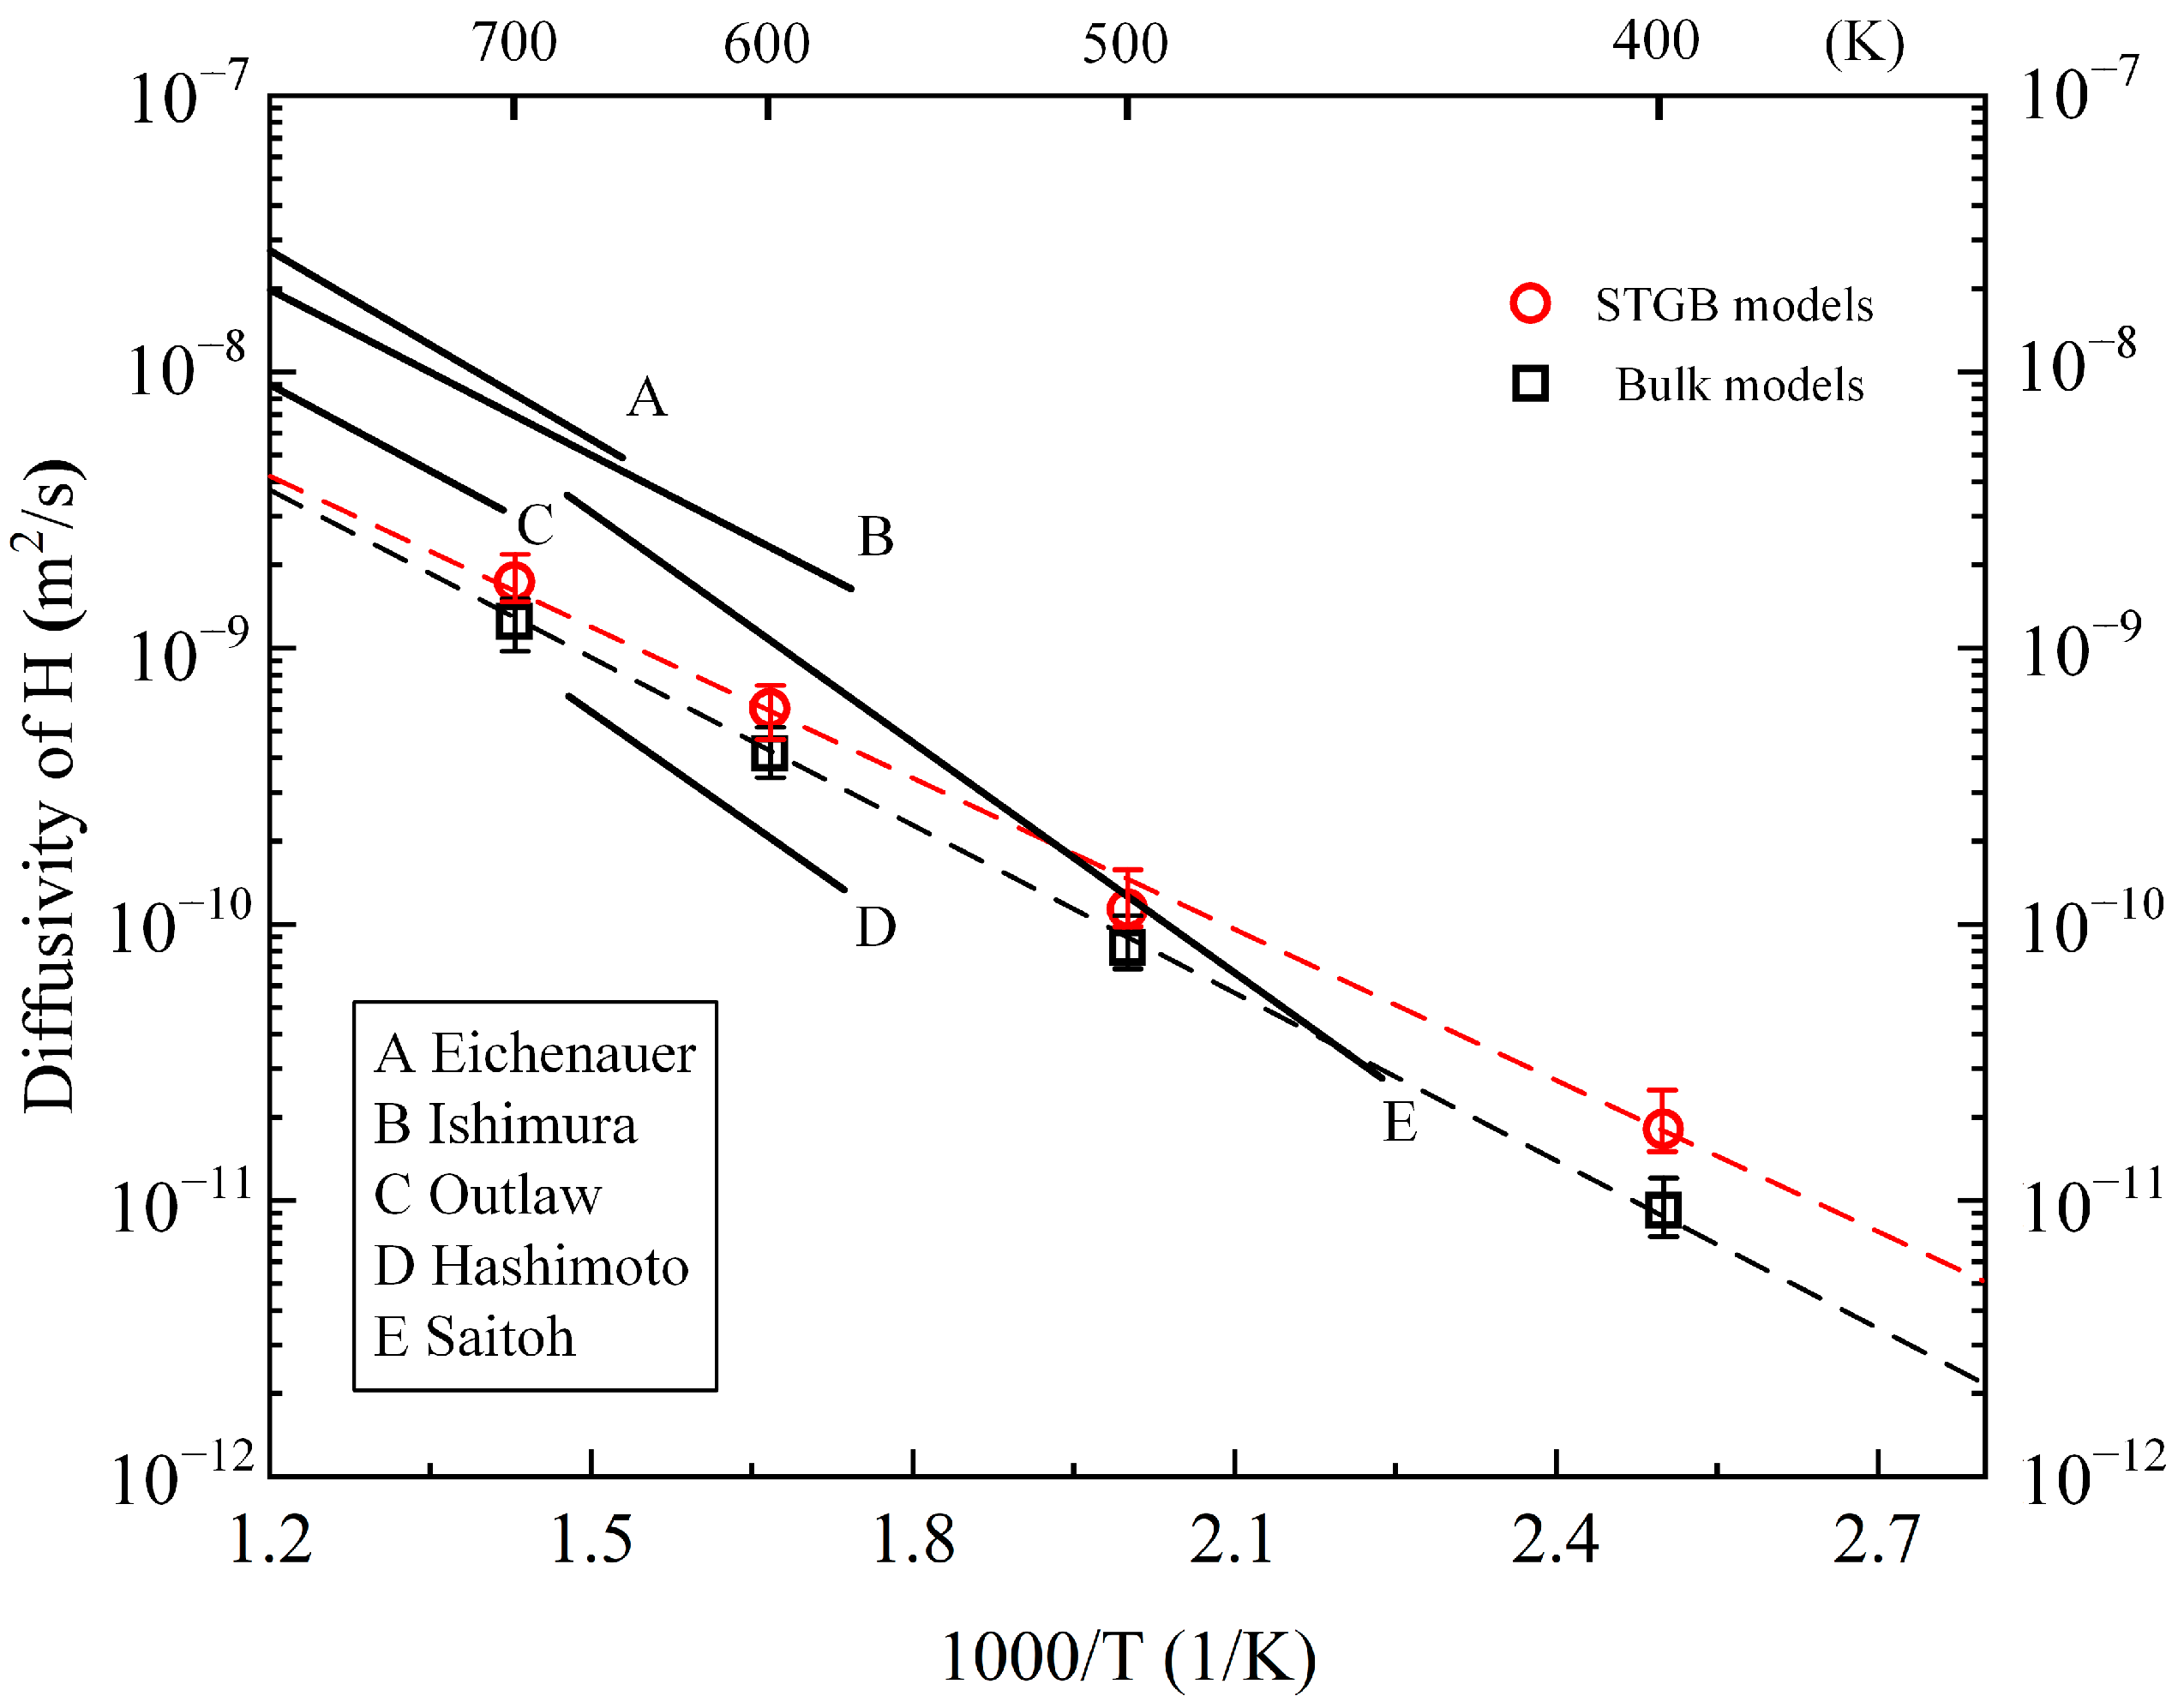
3.1. Diffusion Rate of Hydrogen Atoms at Different Temperatures

We simulated the diffusion of hydrogen atoms at different temperatures and chose Σ5(120)[001] STGB models with 5 at. % H as the research object. The STGB models and their corresponding bulk models were simulated at temperatures of 400 K, 500 K, 600 K and 700 K, respectively, to explore the effect of temperature on hydrogen diffusion in aluminum grain boundaries and the bulk of aluminum. The simulation time of all models after relaxation was 1200 ps. The MSD of hydrogen atoms in the models at different temperatures is shown in Figure 3a,b, respectively. In the figure, the “STGB model” was the MSD of hydrogen atom diffusion in the symmetrically tilted aluminum grain boundary model, and “Bulk model” was the aluminum single-grain bulk model. Each straight line corresponding to an MSD curve was a linear fitting carried out on the data analysis software Origin using the least square method. Table 2 shows the slope value of the linear-fitting straight line of MSD curves of hydrogen atoms at different temperatures, as well as the goodness of fit (R2) and error of linear fitting for each curve. The linear fitting of hydrogen diffusion means that the displacement curves at different temperatures in Table 2 have small error values and a high goodness of fit, indicating that the hydrogen diffusion MSD curve in the simulation had a strong linear relationship, and the slope obtained by fitting from the MSD curve had a high reliability. It can be seen from the data in Table 2 that the slope of the hydrogen diffusion MSD curve varies greatly at different temperatures, and the slope value obtained by the linear fitting of MSD in the STGB model was always greater than that in a single grain bulk model, which showed that the diffusion rate of hydrogen atoms in STGB models was higher than that in bulk models, and grain boundaries have an effect on the rate of hydrogen diffusion.
The diffusion rates D of hydrogen atoms in STGB models and bulk models at different temperatures, calculated according to the slope fitting value of MSD curves, are shown in Figure 4. The diffusion rate D, obtained by the Σ5(120)[001] STGB models and their control groups and temperature, follow the Arrhenius relationship D = D 0 exp ( Q / R T ) . As can be seen from the figure, at different temperatures, the diffusion rates of hydrogen atoms in the STGB models were always higher than those in the bulk models. With the increase in temperature, the diffusion rates of hydrogen atoms in the models containing grain boundaries were almost equal to those in the bulk models, which is consistent with the law simulated by Page et al. [24].
Many scholars measured the hydrogen diffusion rate in aluminum through experiments, but there were differences between the measured hydrogen diffusion rates. Some experimental measurements of hydrogen diffusion in aluminum are also listed in Figure 4. Comparing the MD simulation results with the experimental hydrogen diffusion results, the diffusion rates measured by Outlaw, Hashimoto and Saitoh were similar to the simulation results [30,31,32], and there was a certain deviation between the measurement and simulation results of Eichenauer and Ishikawa [33,34]. In the process of experimental measurement, many factors such as the purity of aluminum, aluminum crystal micro defects and experimental system errors affect the experimental results. To some extent, the difference between the simulation results and the experimental measurements may also be related to the selection of the potential function and the size of model. The small difference in the potential function affects the interaction between Al-H atoms in the system, and the diffusion rate of hydrogen atoms changes. The problem of model size also affects the motion of hydrogen atoms. When comparing the experimental measurements, it can be determined that the simulation results have a high accuracy.

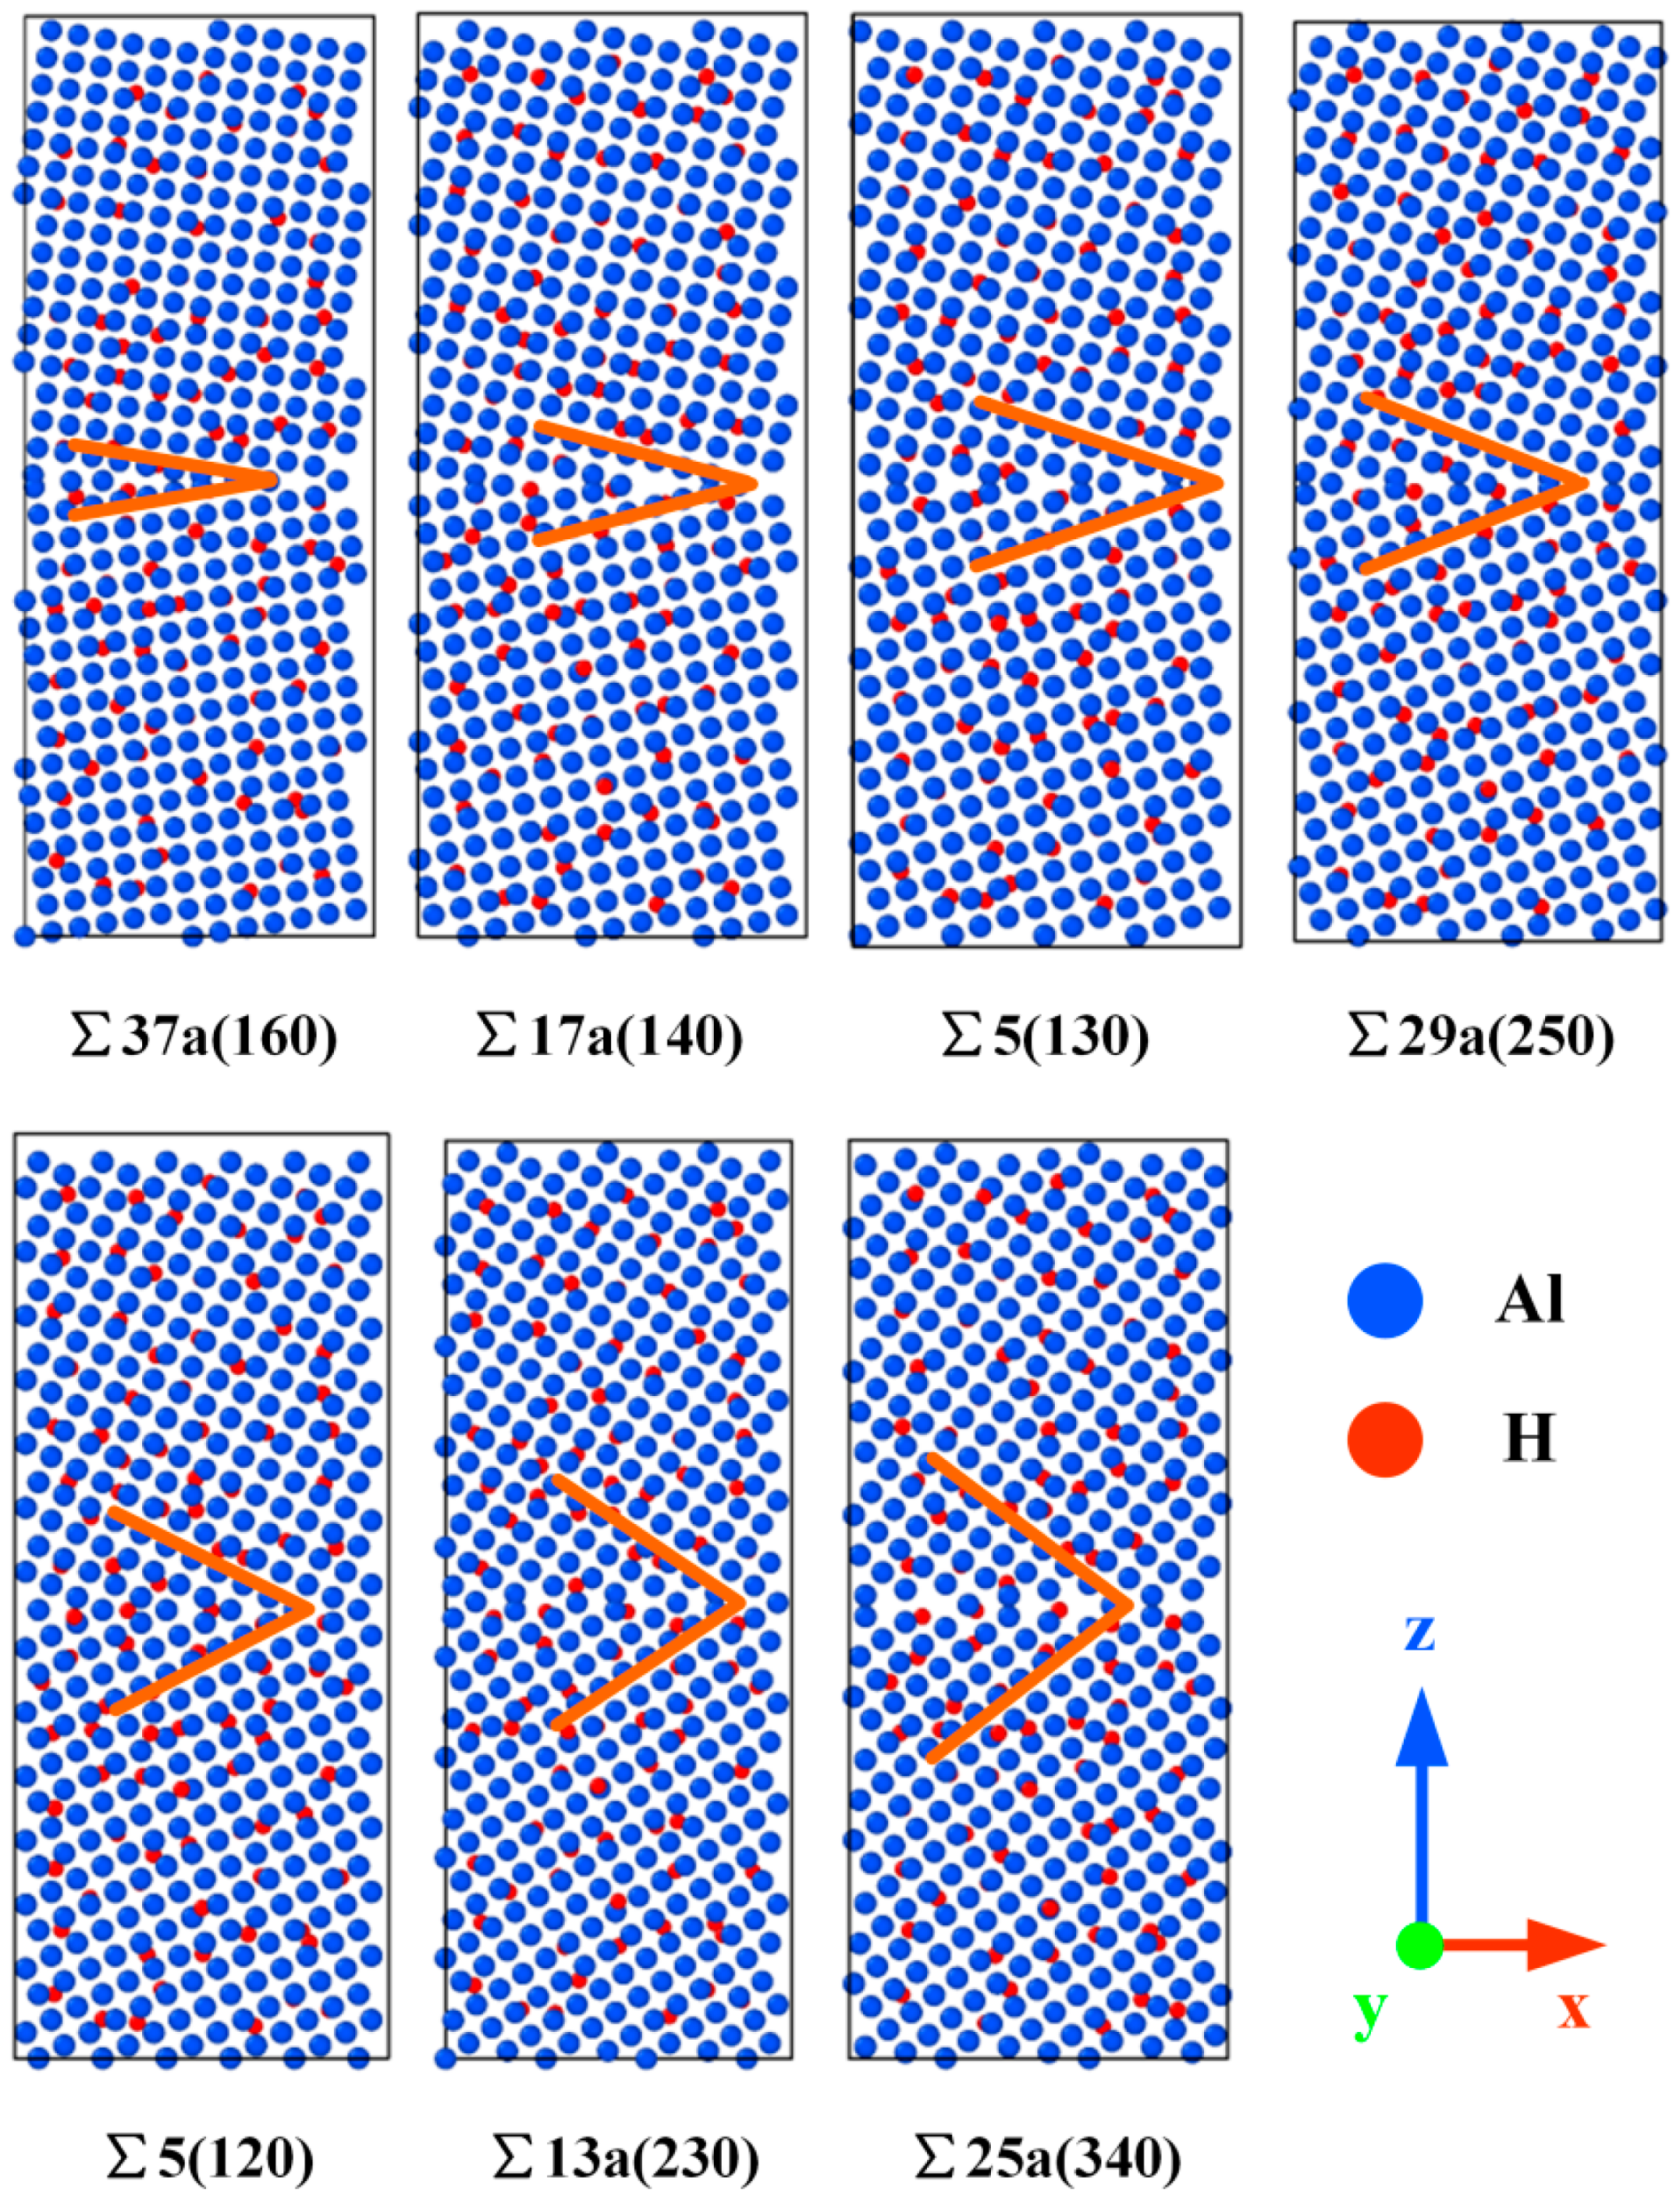
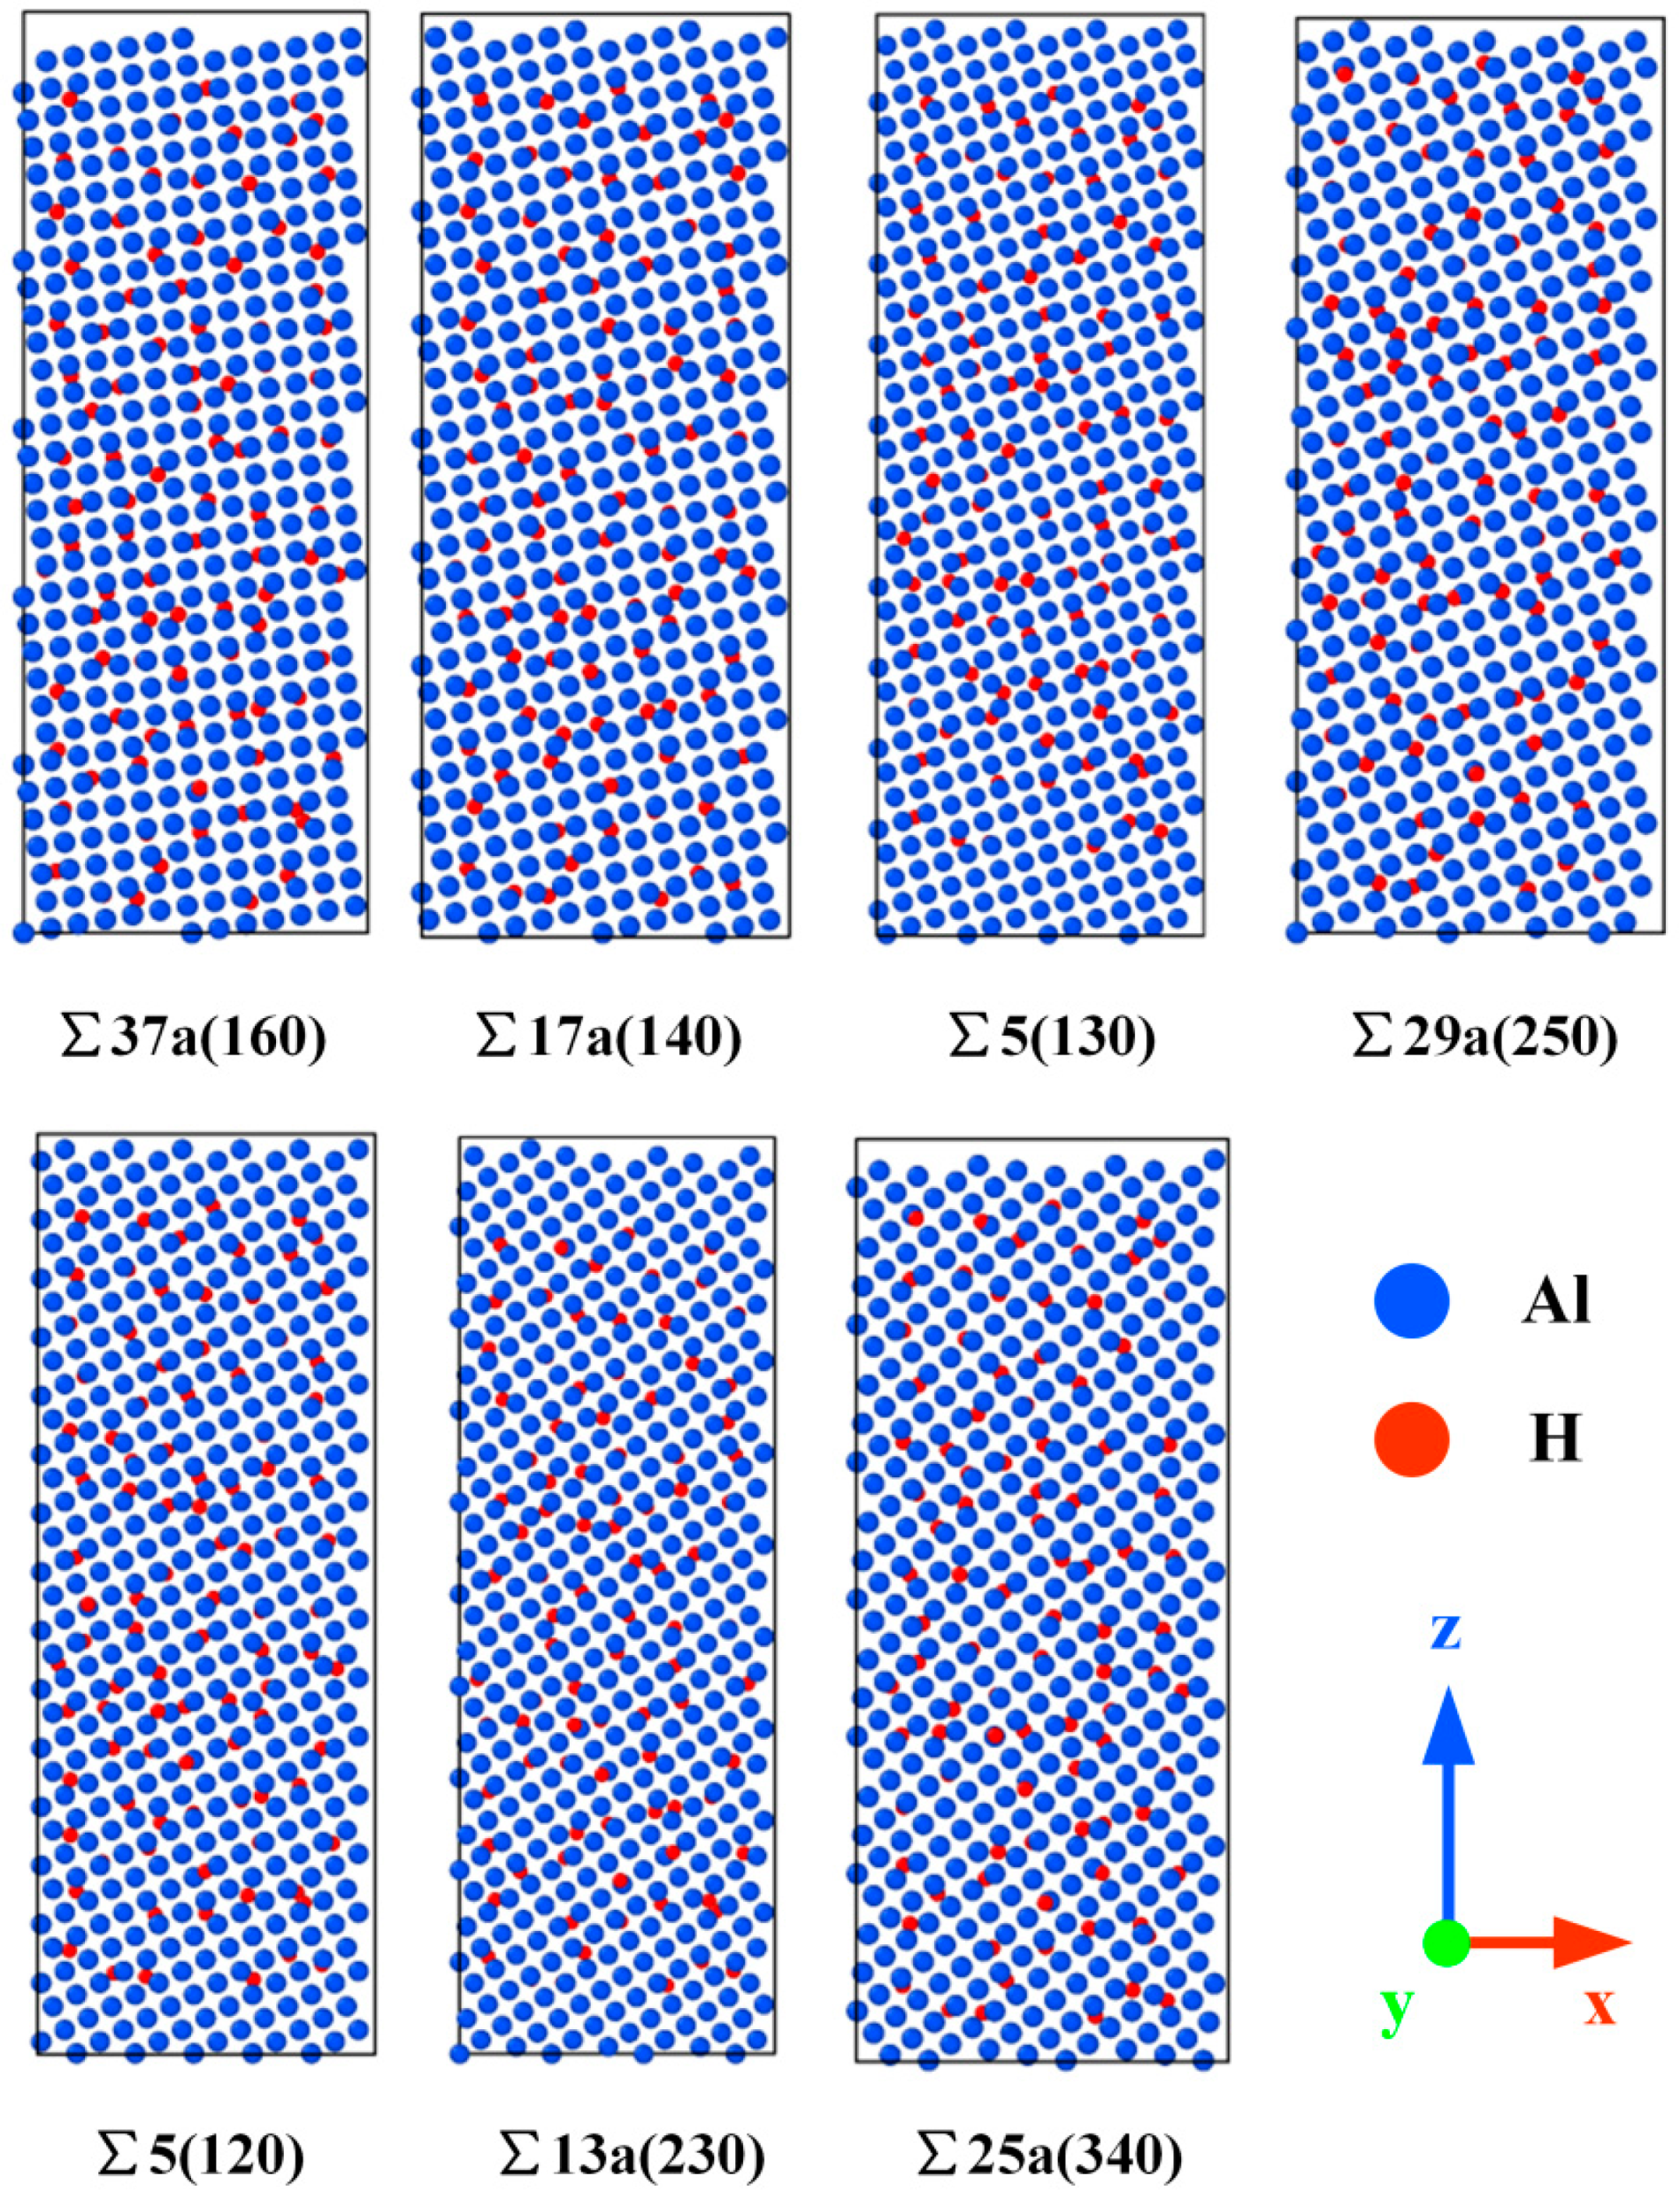
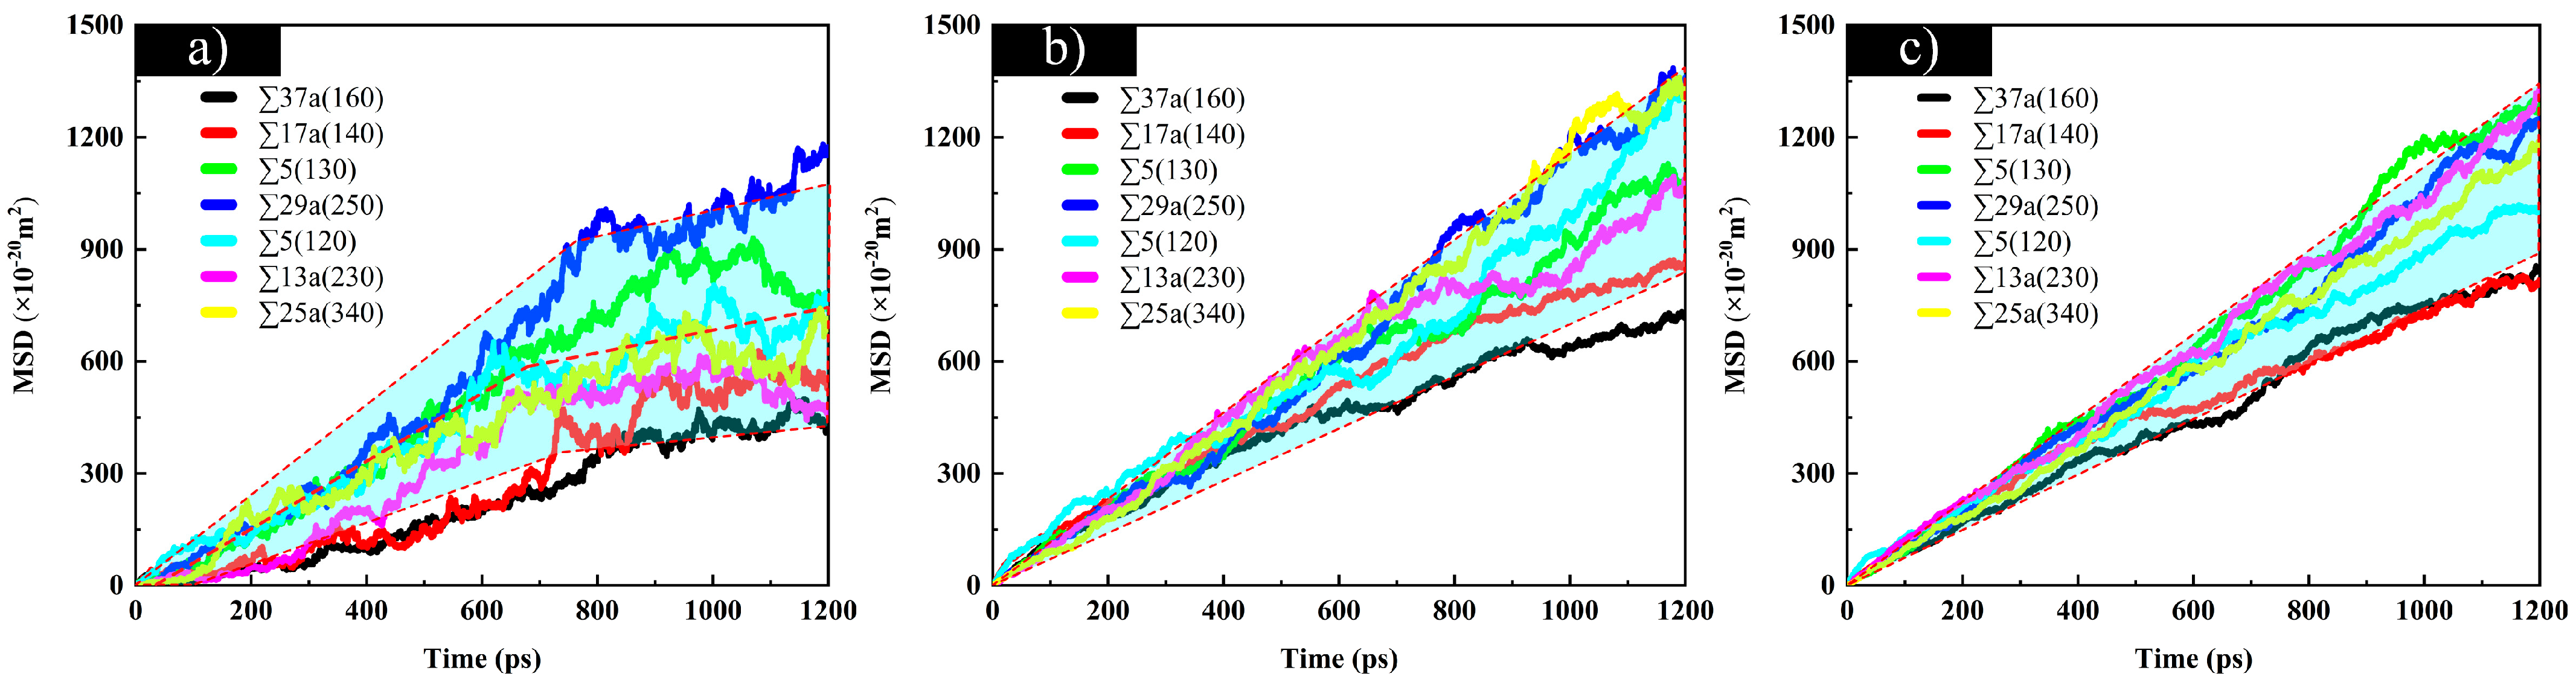
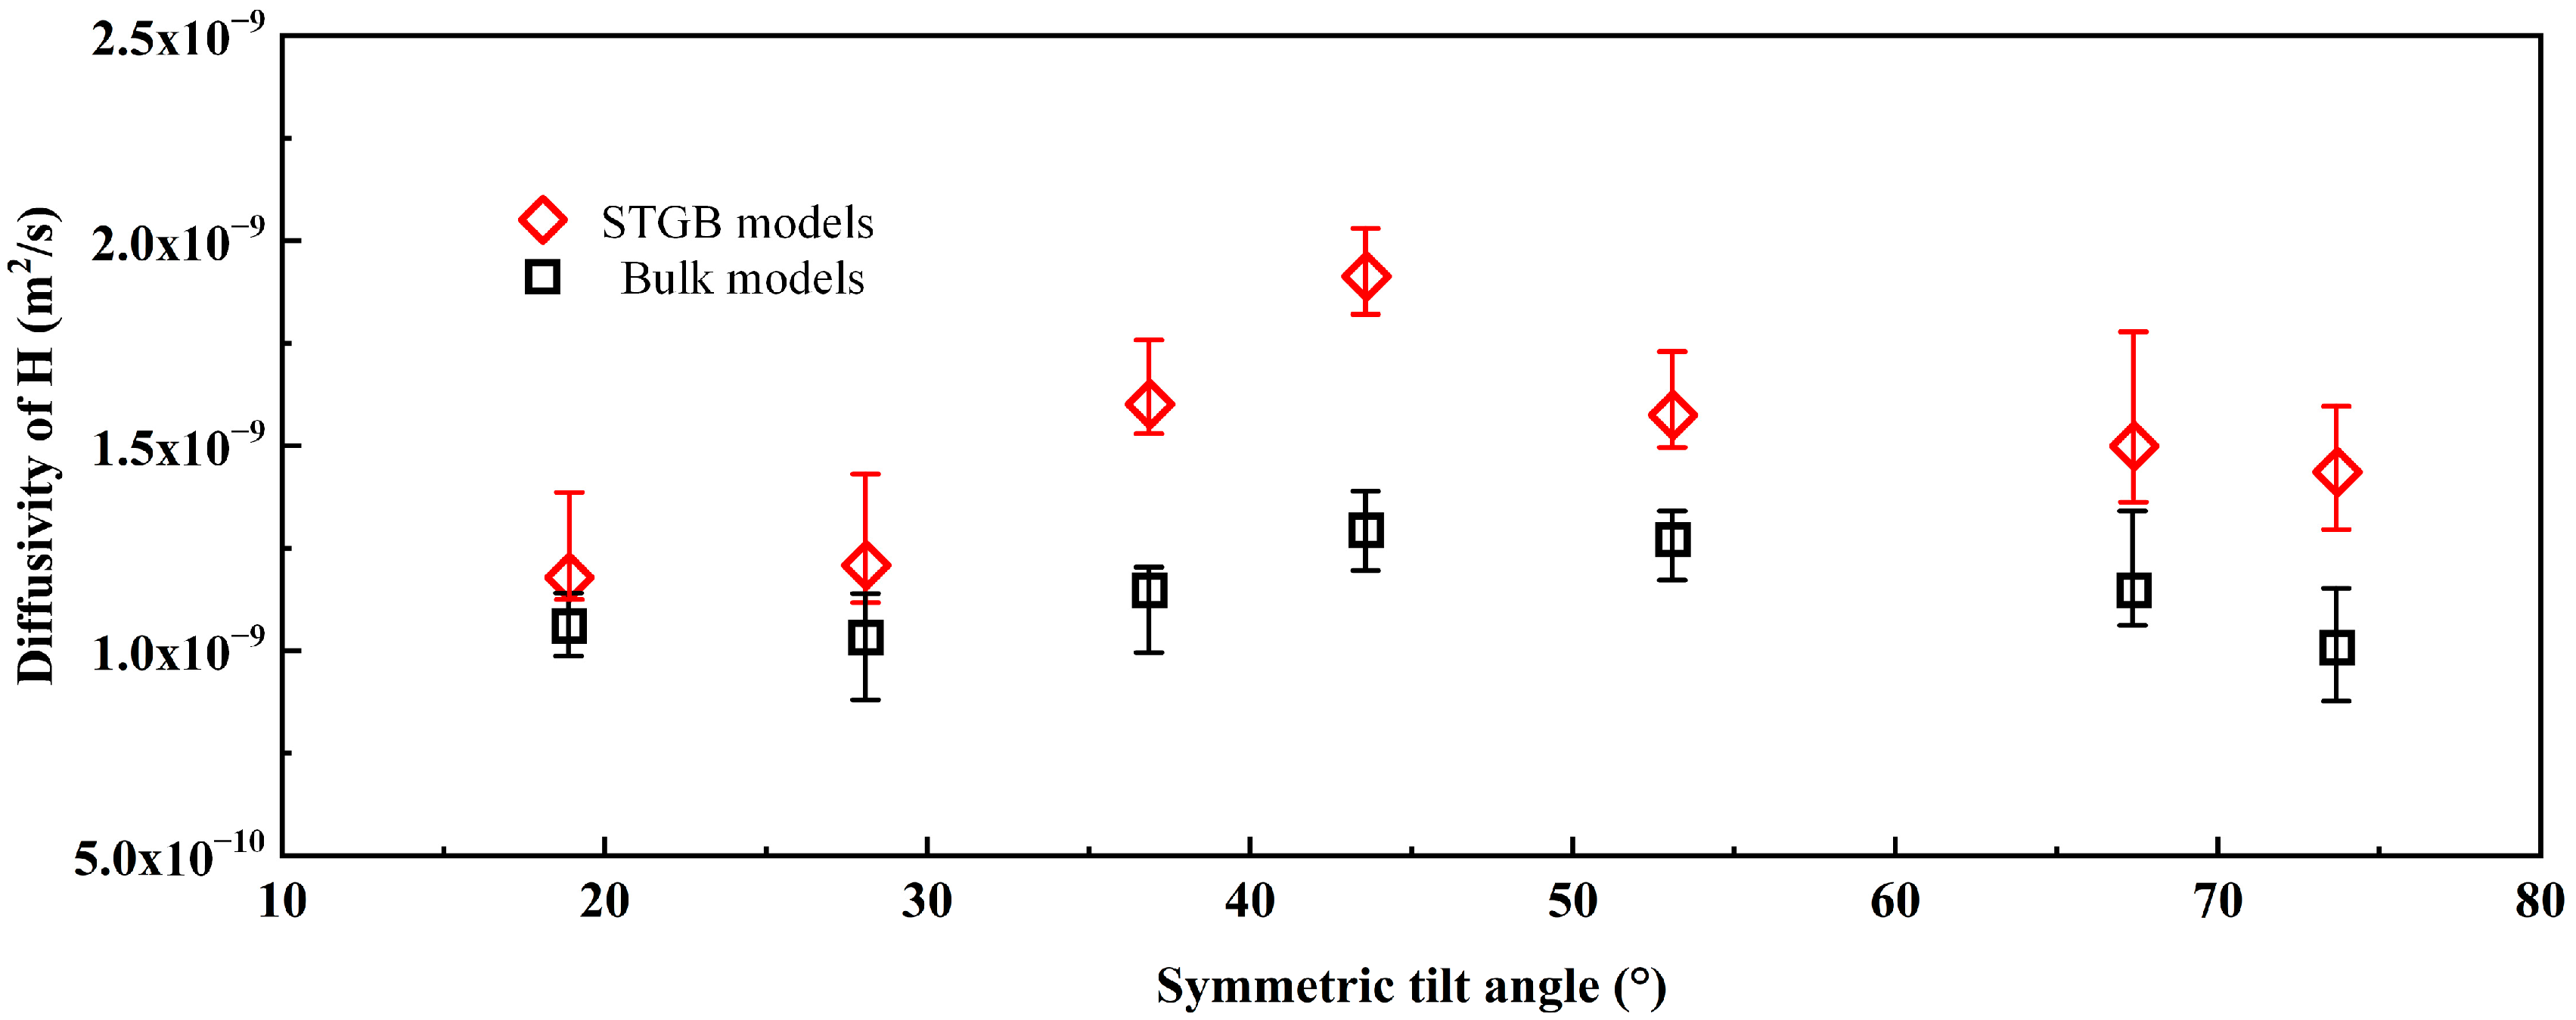
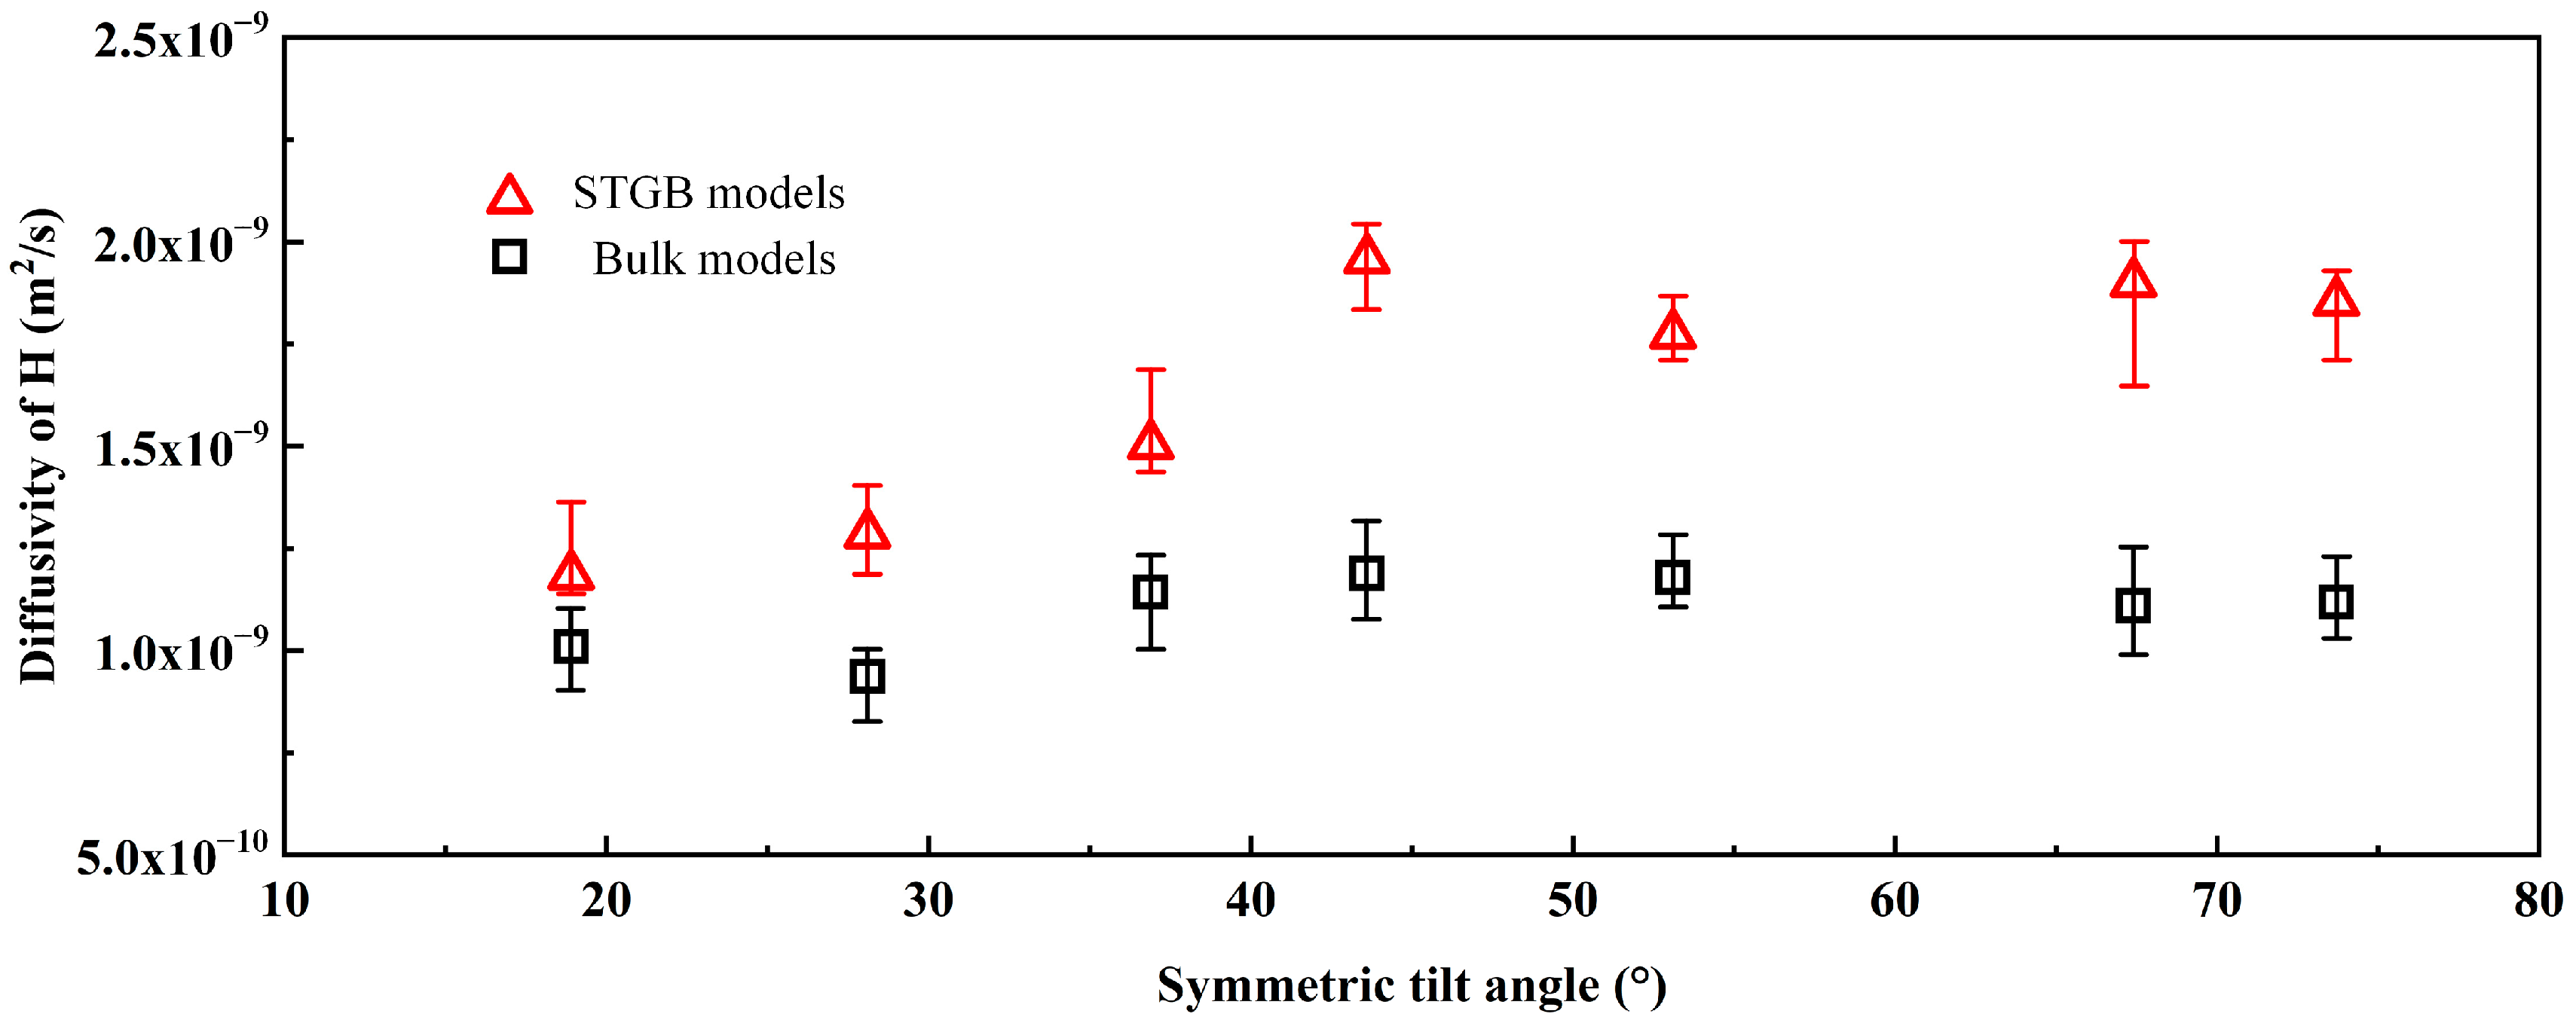
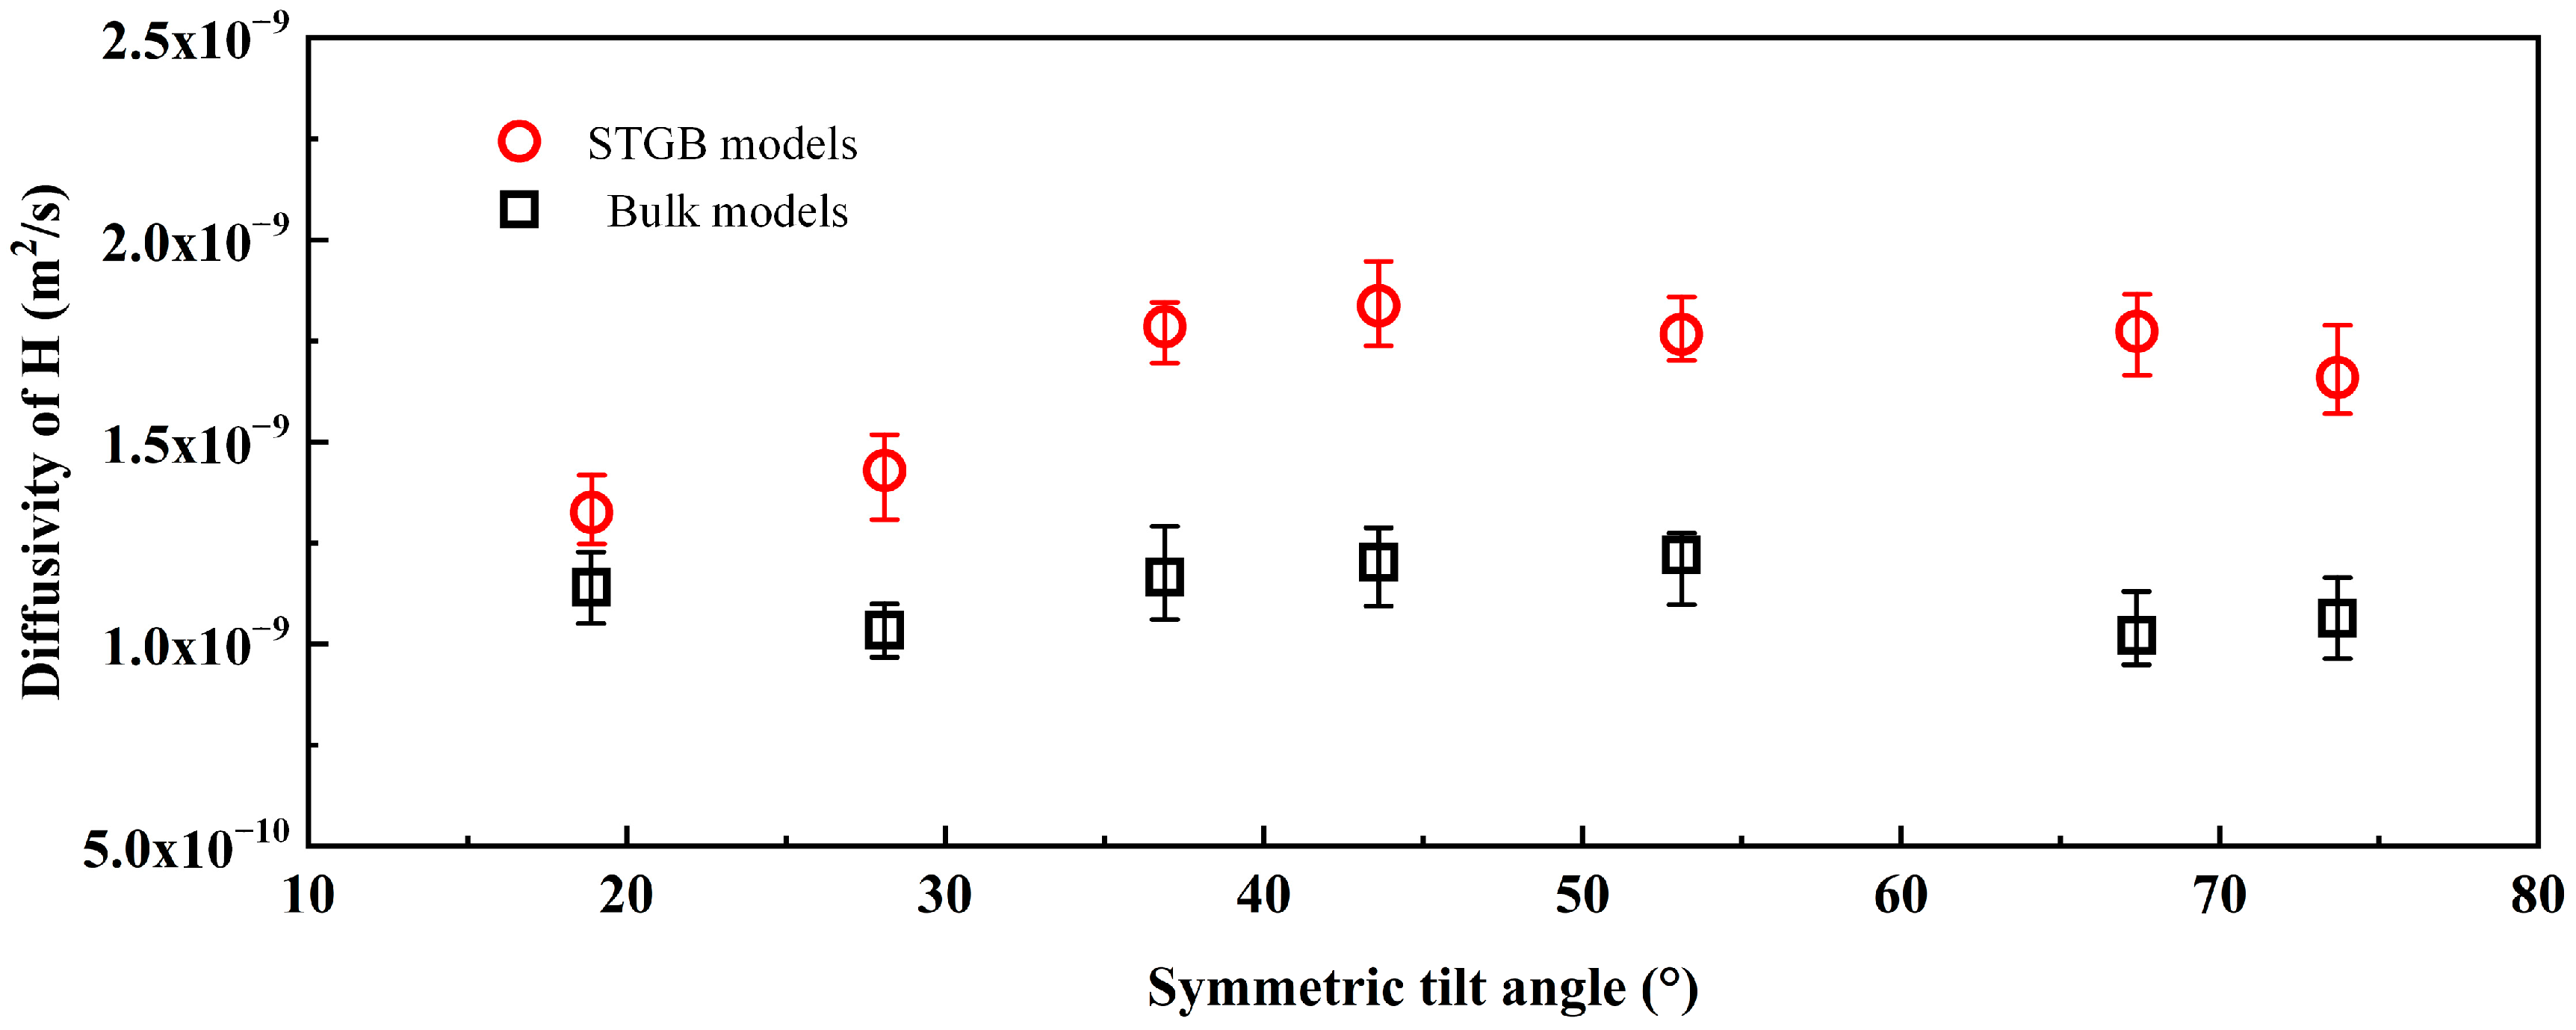
3.2. Diffusion of Hydrogen Atoms in Different STGBs of Aluminum

In order to explore the effects of different angles of STGB and different hydrogen concentrations on hydrogen diffusion at the grain boundaries in aluminum, three groups of STGB models and bulk models with different hydrogen concentrations were established, respectively. All molecular dynamics simulations were completed at 700 K. The MSD curves in STGB models with concentrations of 0.5, 2.5 and 5 at. % H are shown in Figure 5a–c, respectively. It can be seen from the figure that the MSD curves of the STGB models with 0.5 at. % H are significantly different from those of the models with 2.5 and 5 at. % H. At 600 ps, the MSD curves of STGB models with 0.5 at. % H have an inflection point, and the hydrogen diffusion rate before and after the inflection point was significantly different. In contrast, the slope of the MSD curves of STGB models with 2.5 at. % H decreases after 600 ps, but the MSD curve of model with 5 at. % H hardly changed after 600 ps. Comparing the MSD curves of different hydrogen concentrations, the diffusion rate of hydrogen atoms in STGB models had a great relationship with hydrogen concentration. At the lower concentration of 0.5 at. % H, the decrease in the slopes of the MSD curves showed that the capture of hydrogen atoms by grain boundaries hinders the diffusion of hydrogen atoms. This does not happen in the concentration of 5 at. % H models, indicating that the barrier ability of the grain boundary to hydrogen atom diffusion decreases.
Using the same method as the MSD curves at different temperatures, the MSD curves of STGB models and their control models at different angles were linearly fitted. The model with a concentration of 0.5 at. % H only fitted the MSD curves before 600 ps. The slope value obtained by fitting was calculated to obtain the hydrogen diffusion rate in different models. The hydrogen diffusion rate of STGB models with concentrations of 0.5, 2.5 and 5 at. % H and the control bulk models at 700 K are shown in Figure 6, Figure 7 and Figure 8, respectively. In the bulk models with three groups of different hydrogen concentrations, the diffusion rate of hydrogen atoms fluctuates slightly due to different inclination angles, and the diffusion rate of hydrogen atoms in the bulk models is 1.0 × 10⁻⁹ m2/s to 1.25 × 10⁻⁹ m2/s. In the STGB models, the existence of grain boundaries affects the diffusion rate of hydrogen atoms. Under different hydrogen concentrations, the diffusion rates of hydrogen atoms in the STGB models were greater than those in the bulk models, and the difference of diffusion rate was clearer with the increase in hydrogen concentration.
The grain boundaries of the aluminum captured hydrogen atoms in the process of hydrogen atom movement, and the diffusion process of hydrogen atoms was affected by factors such as grain boundaries. Figure 9, Figure 10 and Figure 11 are hydrogen diffusion diagrams of Σ29a (250) STGB models at 700 K with concentrations of 0.5, 2.5 and 5 at. % H, respectively. Figure 9a, Figure 10a and Figure 11a are the MSD curves and the MSD curves of the X, Y and Z directions of hydrogen atoms in Σ29a (250) STGB models with concentrations of 0.5, 2.5 and 5 at. % H, respectively. Figure 9b, Figure 10b and Figure 11b are the diffusion rates of hydrogen atoms at 0–600 ps and 600–1200 ps in Σ29a (250) STGB models with concentrations of 0.5, 2.5 and 5 at. % H, respectively. Figure 9c, Figure 10c and Figure 11c are the distribution diagrams of hydrogen atoms in Σ29a (250) STGB models with concentrations of 0.5, 2.5 and 5 at. % H, respectively. Comparing the MSD curves in the coordinate axis direction of different concentrations, the diffusion rates of hydrogen atoms in the three directions were almost the same before 600 ps. However, after 600 ps, more hydrogen atoms gathered at the grain boundaries. In the STGB model with a hydrogen concentration of 0.5%, the diffusion rates of hydrogen atoms in three directions became very small. In the model with hydrogen concentrations of 2.5% and 5%, the diffusion rates of hydrogen atoms in the three directions were different. The diffusion rates of hydrogen atoms in the Z direction were less than those in the X and Y directions, and the plane of grain boundary was perpendicular to the Z axis. It showed that after the hydrogen concentration at the grain boundaries increases, the diffusion of hydrogen atoms at the grain boundaries was anisotropic, and hydrogen atoms have a rapid diffusion along the grain boundary.
Figure 12 shows the hydrogen distribution diagram of the STGB model with a hydrogen content of 5% at 1200 ps. Hydrogen atoms were enriched at the grain boundary in STGB models with different angles. The orange elliptical regions in the figures are the enrichment regions formed after hydrogen atoms gather. The accumulation of too many hydrogen atoms made it possible for hydrogen atoms to combine to form hydrogen molecules. The increase in internal pressure at the grain boundaries distorted the lattice of the nearby aluminum. In some STGB models, small aluminum denuded zones can even appear, which become the starting point of microcrack initiation.
The research conducted in this paper selected seven kinds of STGB as the research object for simulation, covering different angles of grain boundaries. The simulation result was very close to the experimental value when compared with the hydrogen diffusion rate measured by the experiment; therefore, the simulation results were reliable. The current simulation proves that the selected grain boundary meets the above-mentioned predicted law, but it cannot represent other types of grain boundaries. The influence of other types of grain boundaries on hydrogen diffusion requires further research. Unfortunately, this study cannot extract MSD data by region, which is a problem that we need to overcome in future research.

4. Conclusions

(1)
Grain boundaries have a great influence on the diffusion rate of hydrogen atoms in aluminum. The diffusion rate of hydrogen in the model with a grain boundary is higher than that in the block model.
(2)
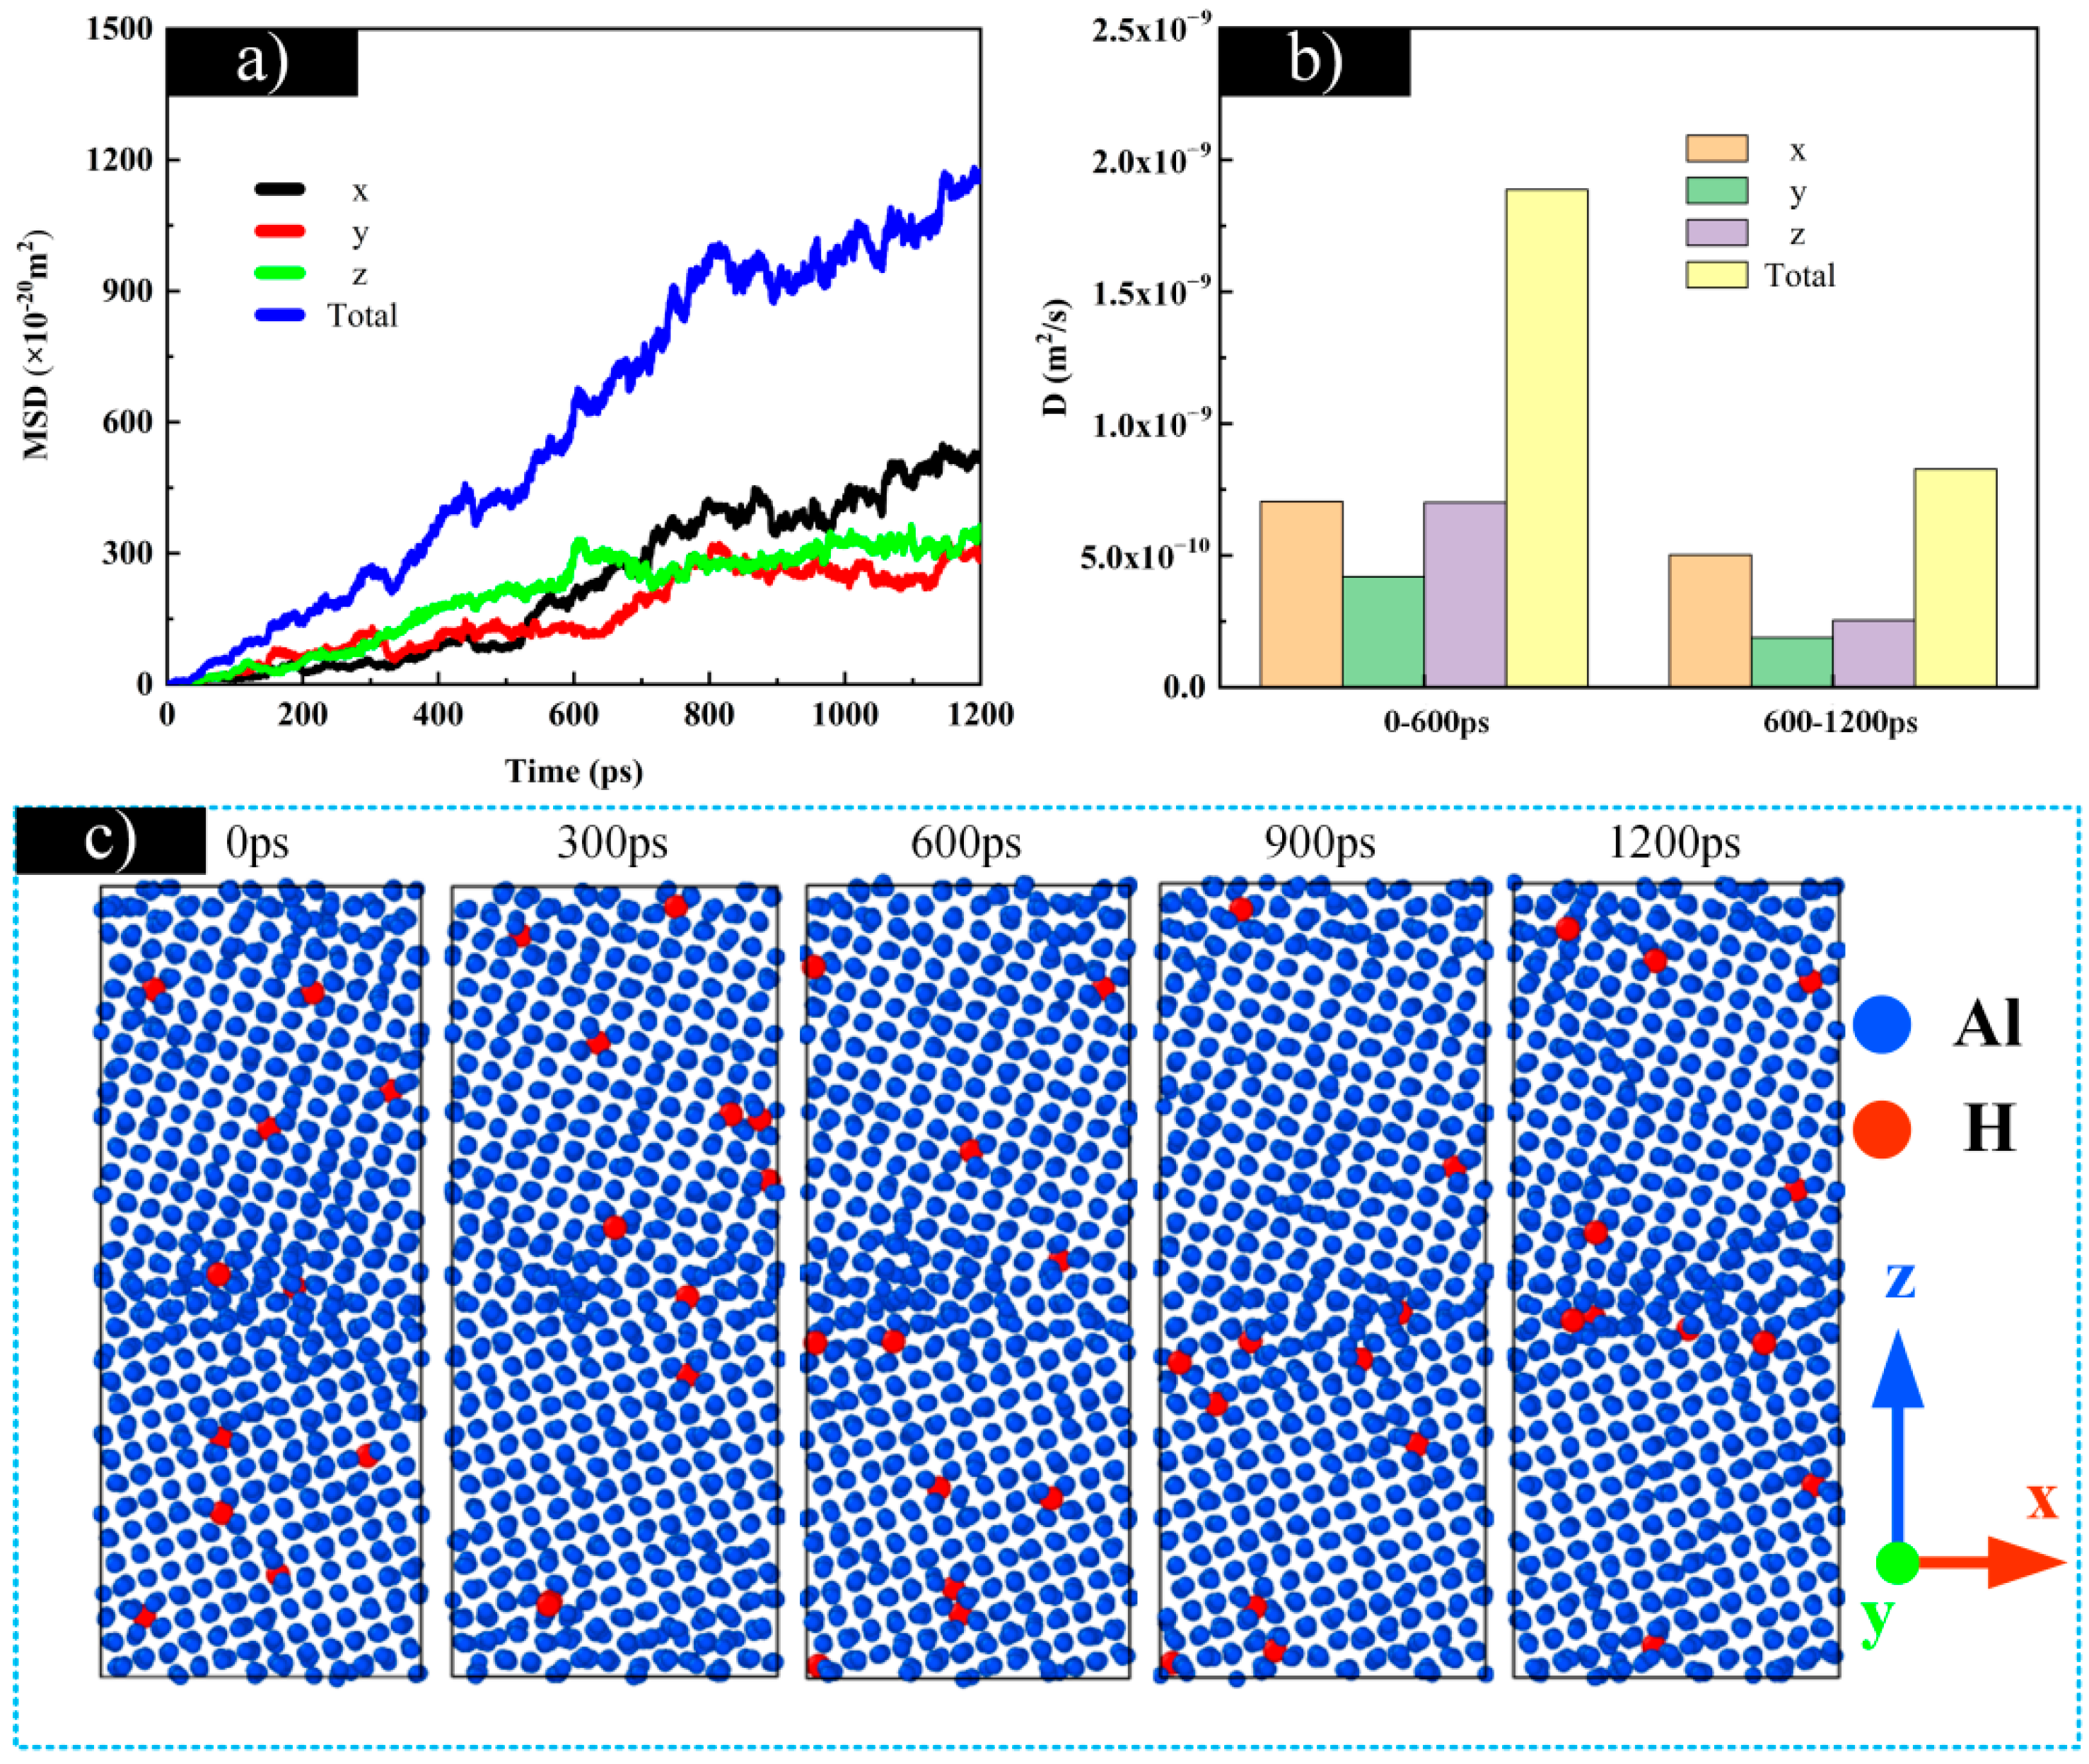
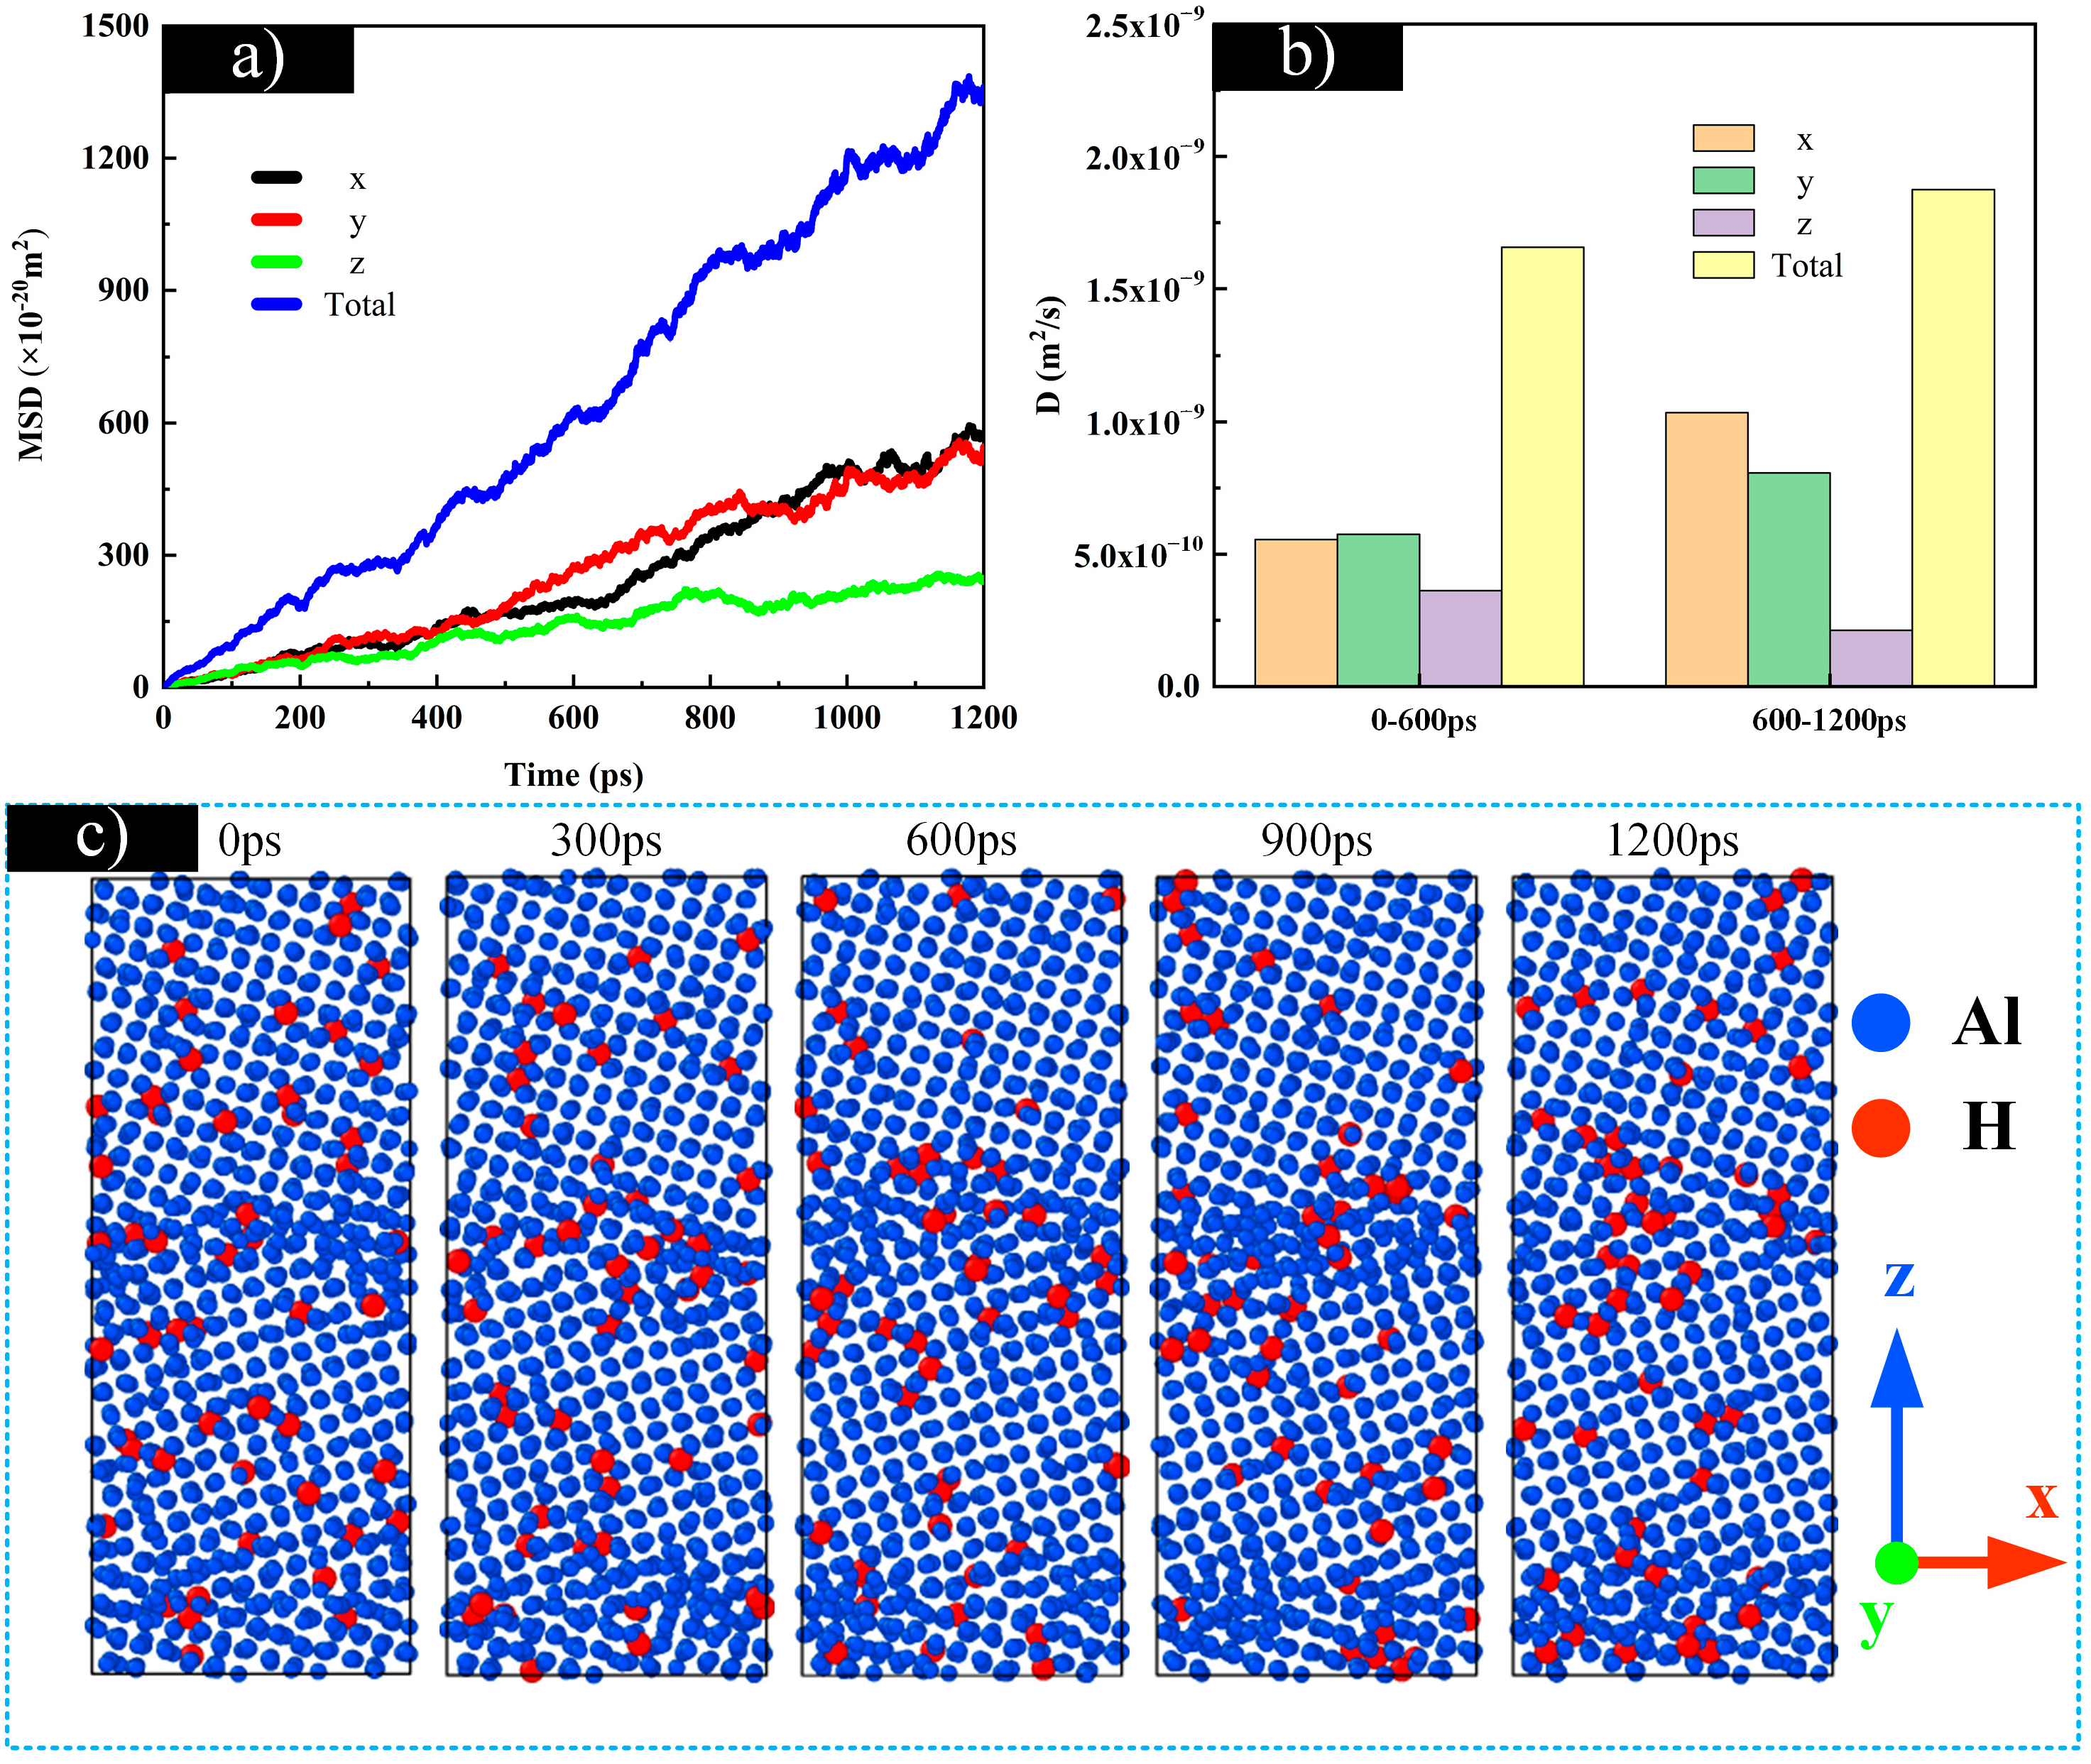
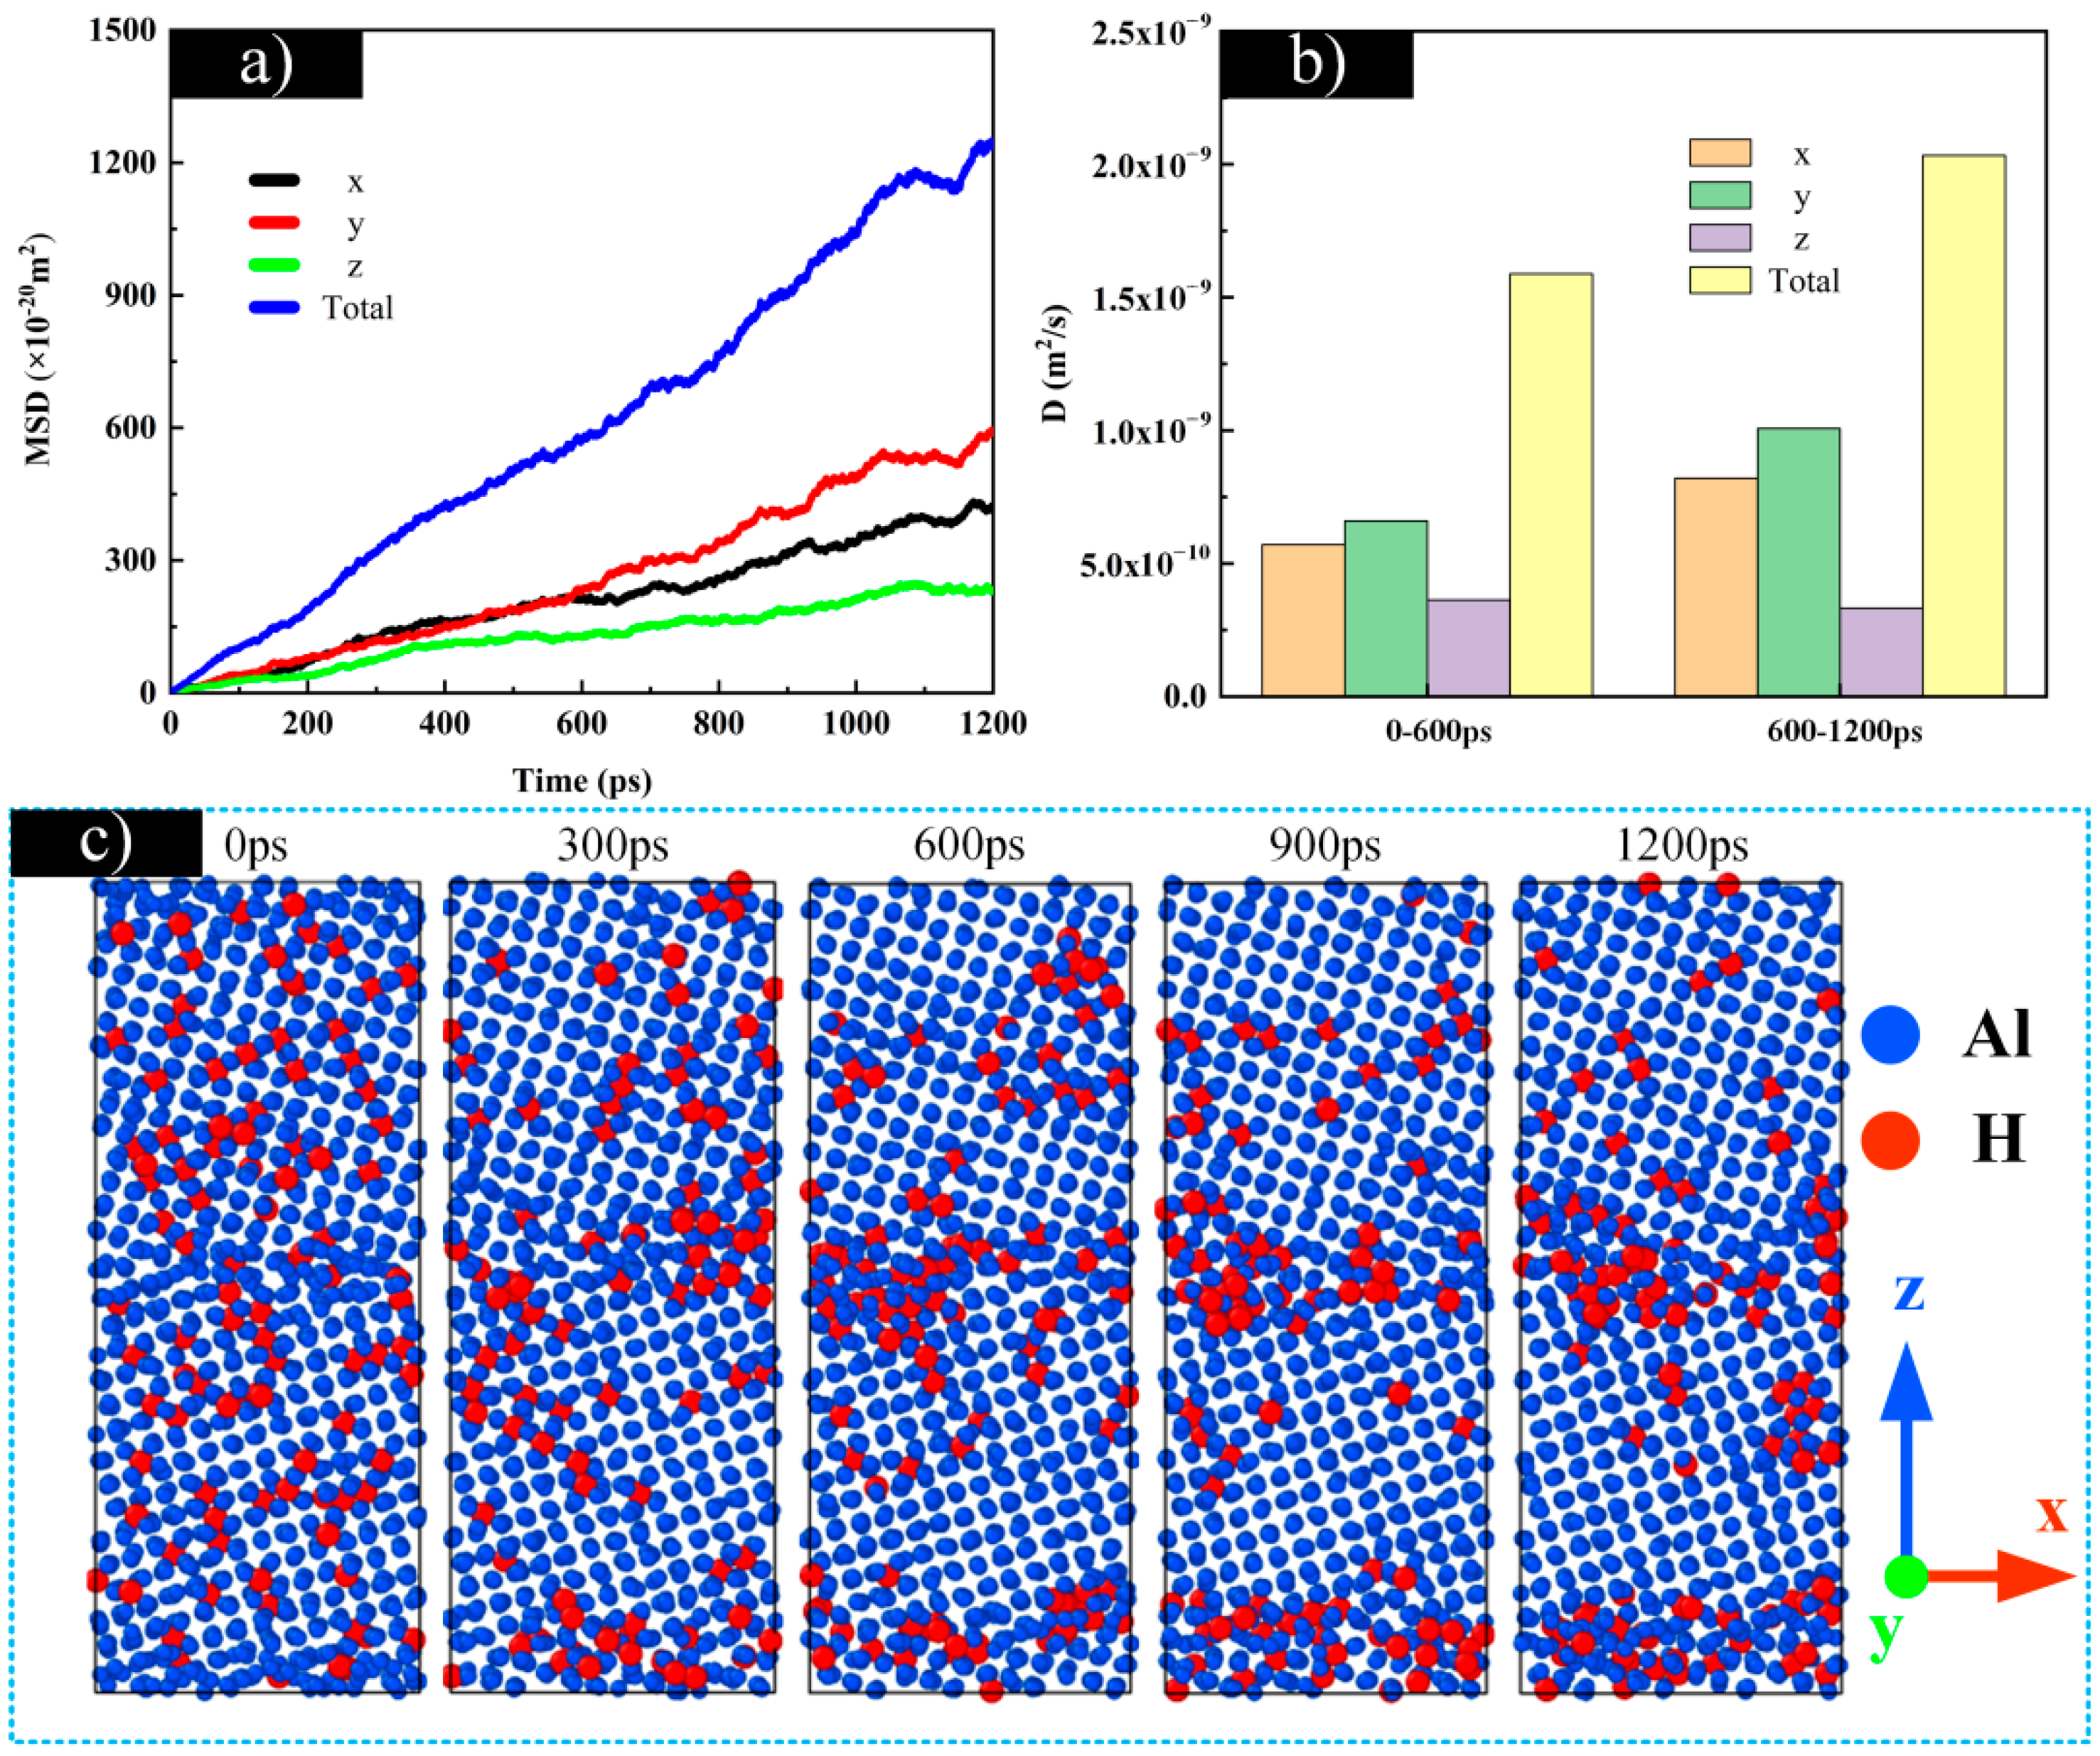
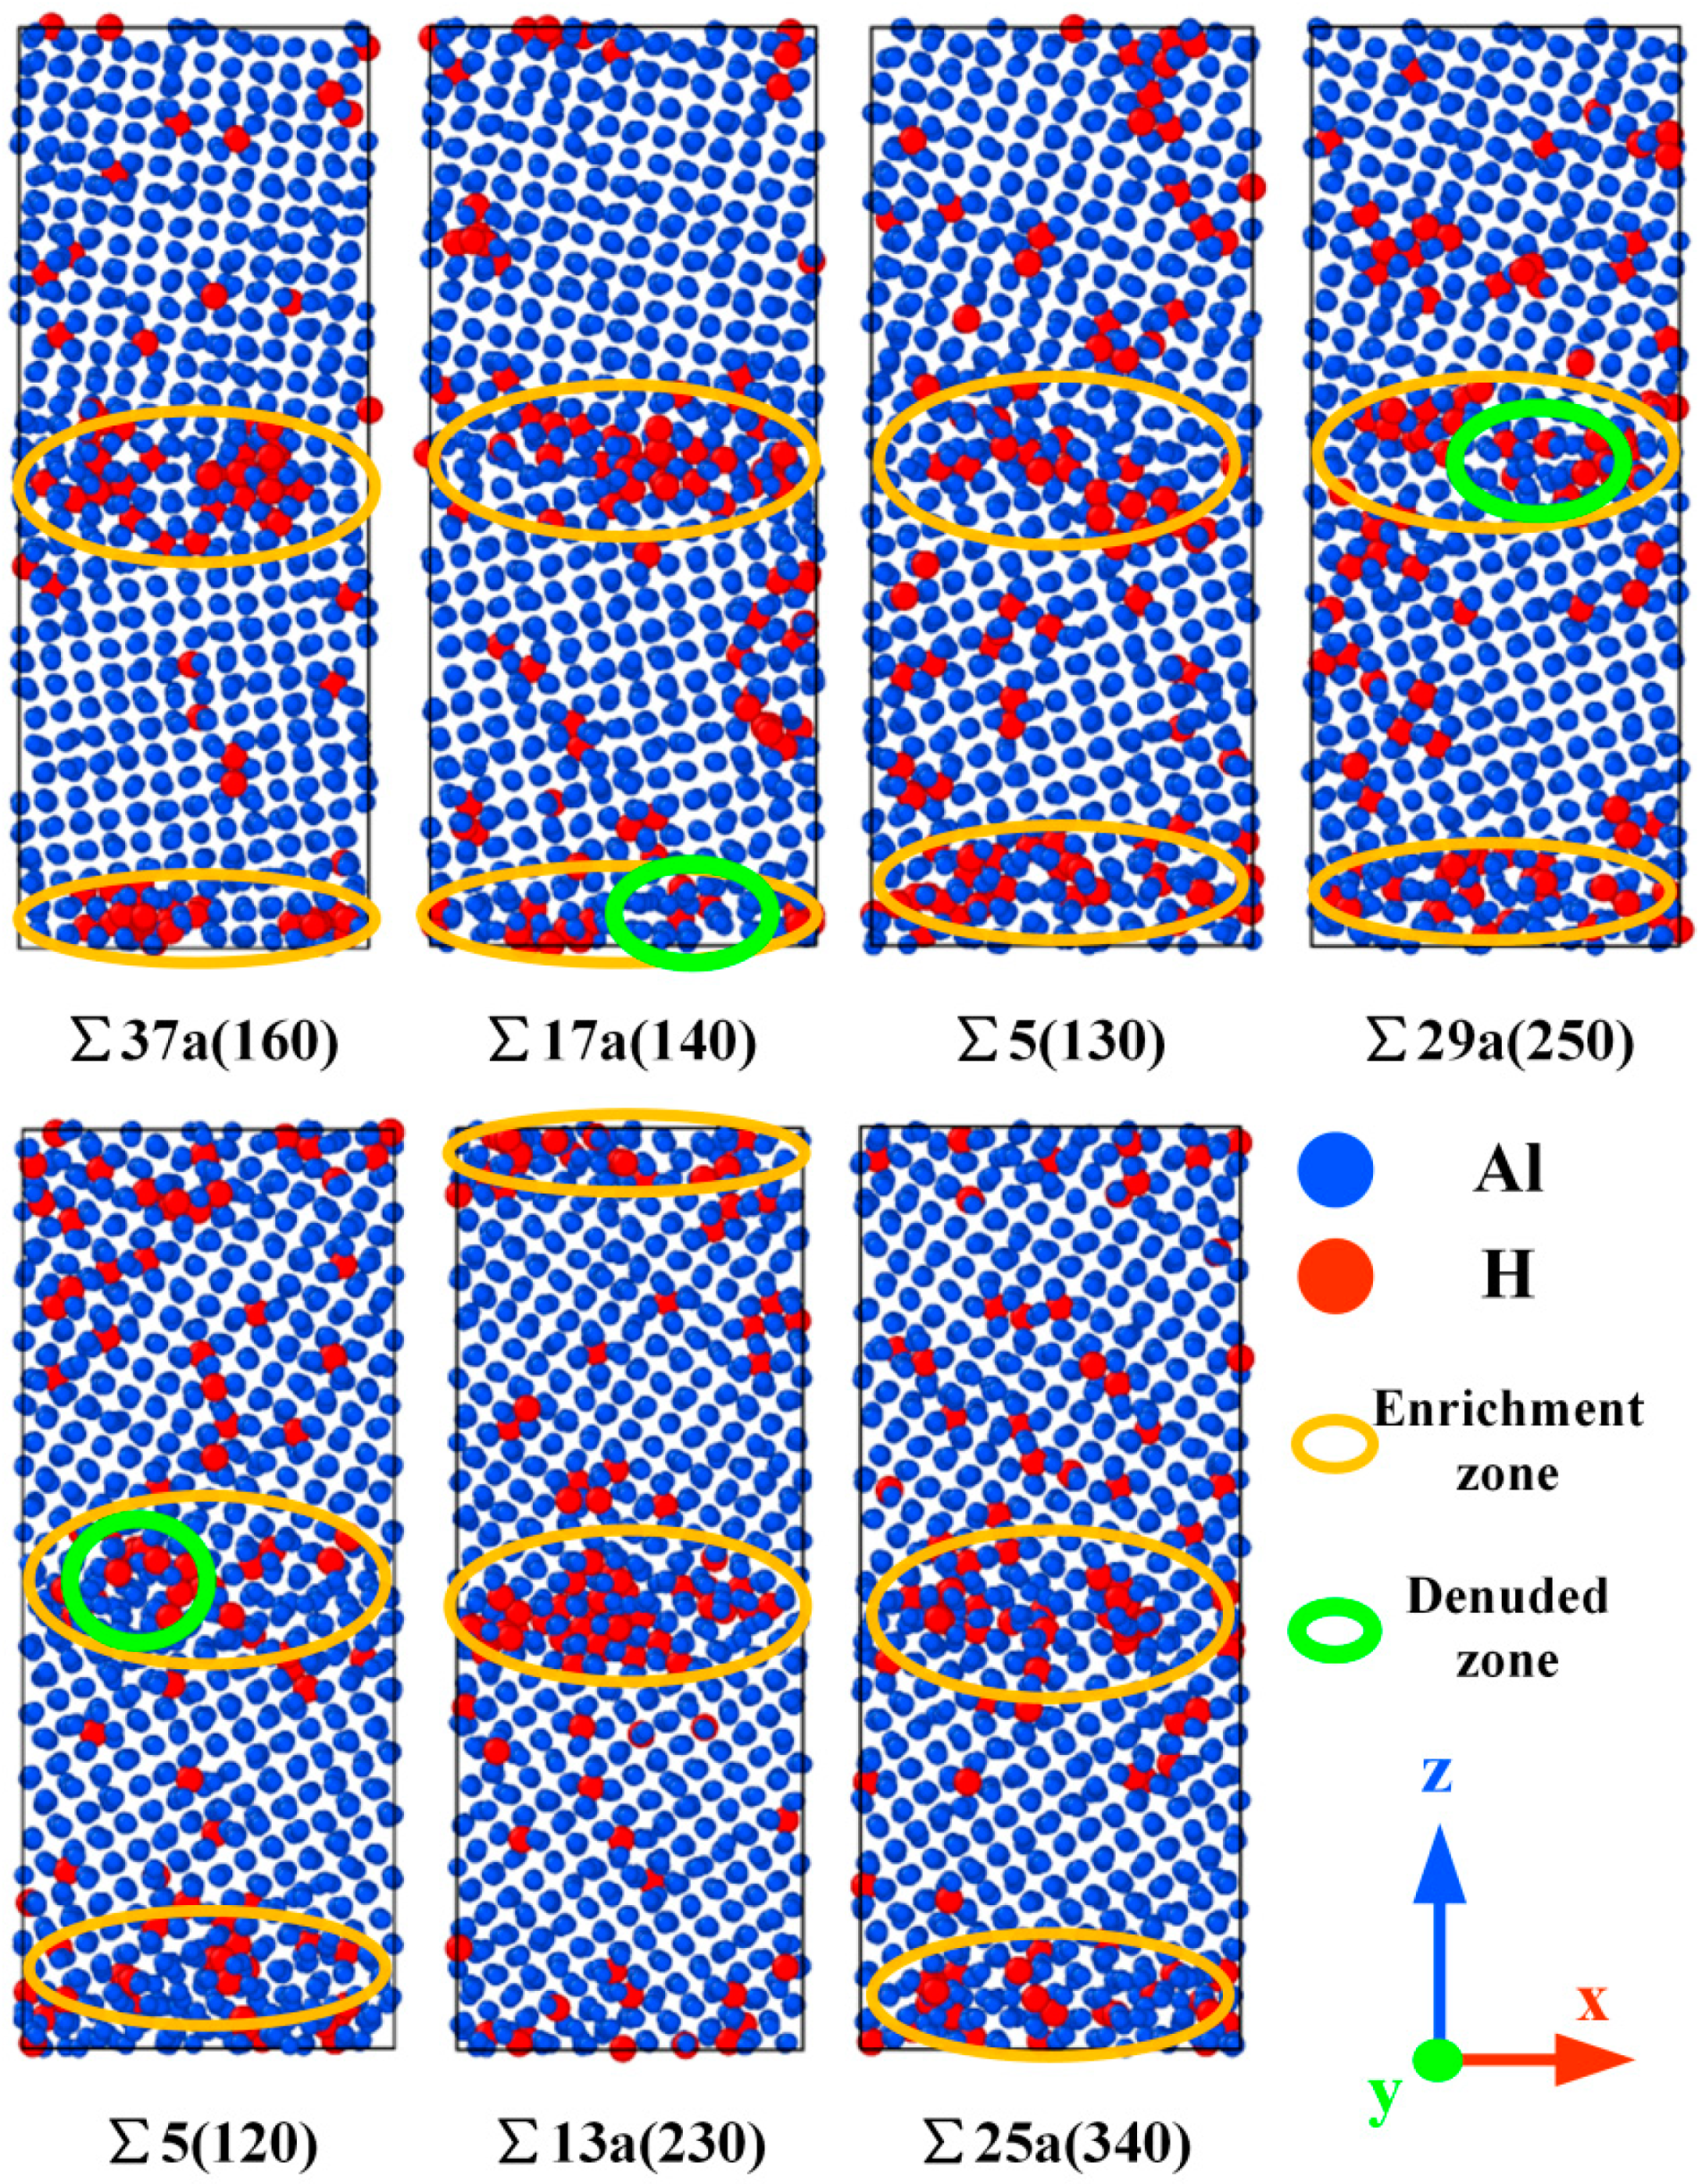
In the 0.5 at. % H STGB models, the grain boundaries capture hydrogen atoms and hinder the diffusion of hydrogen. In the 2.5 and 5 at. % H STGB models, the barrier effect of grain boundaries on hydrogen is weakened, and the overall hydrogen diffusion rate increases after the aggregation of hydrogen atoms at the grain boundaries.
(3)
In the STGB models with 2.5 and 5 at. % H, the anisotropy of diffusion rate is clearer after hydrogen atoms accumulated at the grain boundaries, which shows that the diffusion rate along the grain boundaries interface increases. MD simulation is a feasible and effective method for studying the effect of complex grain boundaries in hydrogen diffusion, which provides a new research idea for studying other microstructure defects and hydrogen diffusion in metals.

Author Contributions

Y.W. participated in data collection, model calculation and manuscript writing; H.W. contributed new ideas in the writing and revision of the paper and provided financial support for this study; L.L. participated in the formulation of the outline of the paper and the revision of the paper; J.L. translated the manuscript and made the figures; P.Z. carried out data analysis; Z.X. assisted in editing and reviewing the manuscript; H.W. provided financial support for this study. All authors have read and agreed to the published version of the manuscript.

Funding

This work was financially supported by the National Natural Science Foundation of China (51975510).

Data Availability Statement

The datasets generated during and/or analyzed during the current study are available from the first authors on reasonable request.

Conflicts of Interest

The authors report no competing interests. The authors are responsible for the content and writing of this paper.

References

  1. Johnson, W.H. On some remarkable changes produced in iron and steel by the action of hydrogen and acids. Nature 1875, 11, 393. [Google Scholar] [CrossRef]
  2. Ozdirik, B.; Baert, K.; Depover, T.; Vereecken, J.; Verbeken, K.; Terryn, H.; De Graeve, I. Development of an electrochemical procedure for monitoring hydrogen sorption/desorption in steel. J. Electrochem. Soc. 2017, 164, 747–775. [Google Scholar] [CrossRef]
  3. Zafra, A.; Peral, L.B.; Belzunce, J.; Rodriguez, C. Effect of hydrogen on the tensile properties of 42CrMo4 steel quenched and tempered at different temperatures. Int. J. Hydrogen Energy 2018, 43, 9068–9082. [Google Scholar] [CrossRef]
  4. Urosevic, V.; Nikezic, D. Radon transport through concrete and determination of its diffusion coefficient. Radiat. Prot. Dosim. 2003, 104, 65–70. [Google Scholar] [CrossRef] [PubMed]
  5. Savovic, S.; Djordjevich, A.; Tse, P.W.; Krstic, D. Radon diffusion in an anhydrous andesitic melt: A finite difference solution. J. Environ. Radioact. 2011, 102, 103–106. [Google Scholar] [CrossRef] [PubMed]
  6. Risken, H. The Fokker-Planck Equation, 1st ed.; Springer: Berlin, Germany, 1984; pp. 276–373. [Google Scholar]
  7. Savovi, S.; Djordjevich, A. Investigation of mode coupling in graded index plastic optical fibers using the Langevin equation. J. Lightwave Technol. 2020, 38, 6644–6647. [Google Scholar] [CrossRef]
  8. Zhang, T.; Zhao, W.; Deng, Q.; Jiang, W.; Wang, Y.; Jiang, W. Effect of microstructure inhomogeneity on hydrogen embrittlement susceptibility of X80 welding HAZ under pressurized gaseous hydrogen. Int. J. Hydrogen Energy 2017, 42, 25102–25113. [Google Scholar] [CrossRef]
  9. Meng, G.; Sun, F.; Wang, S.; Shao, Y.; Tao, Z.; Wang, F. Effect of electrodeposition parameters on the hydrogen permeation during Cu–Sn alloy electrodeposition. Electrochim. Acta 2010, 55, 2238–2245. [Google Scholar] [CrossRef]
  10. Silverstein, R.; Eliezer, D.; Tal-Gutelmacher, E. Hydrogen trapping in alloys studied by thermal desorption spectrometry. J. Alloy. Compd. 2018, 747, 511–522. [Google Scholar] [CrossRef]
  11. Takagi, S.; Toji, Y.; Yoshino, M.; Hasegawa, K. Hydrogen embrittlement resistance evaluation of ultra high strength steel sheets for automobiles. ISIJ Int. 2012, 52, 316–322. [Google Scholar] [CrossRef] [Green Version]
  12. Pressouyre, G.M.; Bernstein, I.M. A Quantitative Analysis of Hydrogen Trapping. Metall. Trans. A 1978, 9, 1571–1580. [Google Scholar] [CrossRef]
  13. Li, L.X.; Wang, Y.H.; Wang, W.J.; Liu, J.Y.; Xu, Z.Q.; Du, F.S. Mechanism and prediction of hydrogen embrittlement based on complex phase structure of chromium alloy steel. Mater. Sci. Eng. A 2021, 822, 141546. [Google Scholar] [CrossRef]
  14. Koyama, M.; Akiyama, E.; Sawaguchi, T.; Raabe, D.; Tsuzaki, K. Hydrogen-induced cracking at grain and twin boundaries in an Fe–Mn–C austenitic steel. Scr. Mater. 2012, 66, 459–462. [Google Scholar] [CrossRef]
  15. Louthan, M.R. Hydrogen embrittlement of metals: A primer for the failure analyst. J. Fail. Anal. Prev. 2008, 8, 289–307. [Google Scholar] [CrossRef] [Green Version]
  16. Fuchigami, H.; Minami, H.; Nagumo, M. Effect of grain size on the susceptibility of martensitic steel to hydrogen-related failure. Philos. Mag. Lett. 2006, 86, 21–29. [Google Scholar] [CrossRef]
  17. Takasawa, K.; Wada, Y.; Ishigaki, R.; Kayano, R. Effects of grain size on hydrogen environment embrittlement of high strength low alloy steel in 45 MPa gaseous hydrogen. J. Jpn. Inst. Met. 2011, 74, 520–526. [Google Scholar] [CrossRef] [Green Version]
  18. Yazdipour, N.; Dunne, D.P.; Pereloma, E.V. Effect of Grain Size on the Hydrogen Diffusion Process in Steel Using Cellular Automaton Approach. Mater. Sci. Forum 2012, 706, 1568–1573. [Google Scholar] [CrossRef] [Green Version]
  19. Pedersen, A.; Jónsson, H. Simulations of hydrogen diffusion at grain boundaries in aluminum. Acta Mater. 2009, 57, 4036–4045. [Google Scholar] [CrossRef]
  20. Harris, T.M.; Latanision, M. Grain boundary diffusion of hydrogen in nickel. Metall. Trans. A 1991, 22, 351–355. [Google Scholar] [CrossRef]
  21. Ichimura, M.; Sasajima, Y. Diffusivity and Solubility of Hydrogen in Grain-Refined Aluminum. Mater. Trans. JIM 1993, 34, 404–409. [Google Scholar] [CrossRef] [Green Version]
  22. Brass, A.M.; Chanfreau, A. Accelerated diffusion of hydrogen along grain boundaries in nickel. Acta Mater. 1996, 44, 3823–3831. [Google Scholar] [CrossRef]
  23. Doyle, D.M.; Palumbo, G.; Aust, K.T.; El-Sherik, A.M.; Erb, U. The influence of intercrystalline defects on hydrogen activity and transport in nickel. Acta Metall. Mater. 1995, 43, 3027–3033. [Google Scholar] [CrossRef]
  24. Page, D.E.; Varela, K.F.; Johnson, O.K.; Fullwood, D.T.; Homer, E.R. Measuring simulated hydrogen diffusion in symACmetric tilt nickel grain boundaries and examining the relevance of the Borisov relationship for individual boundary diffusion. Acta Mater. 2021, 212, 116882. [Google Scholar] [CrossRef]
  25. Plimpton, S. Fast Parallel Algorithms for Short-Range Molecular Dynamics. J. Comput. Phys. 1995, 117, 1–19. [Google Scholar] [CrossRef] [Green Version]
  26. Hickman, J.; Mishin, Y. Extra variable in grain boundary description. Phys. Rev. Mater. 2017, 1, 010601. [Google Scholar] [CrossRef]
  27. Zhou, X.W.; Ward, D.K.; Foster, M.E. A bond-order potential for the Al-Cu-H ternary system. New J. Chem. 2018, 42, 5215–5228. [Google Scholar] [CrossRef]
  28. Nos’E, S. A unified formulation of the constant temperature molecular dynamics methods. J. Chem. Phys. 1984, 81, 511–519. [Google Scholar] [CrossRef] [Green Version]
  29. Hoover, W.G. Canonical dynamics: Equilibrium phase-space distributions. Phys. Rev. A 1985, 31, 1695–1697. [Google Scholar] [CrossRef] [Green Version]
  30. Outlaw, R.A.; Peterson, D.T.; Schmidt, F.A. Diffusion of hydrogen in pure large grain aluminum. Scr. Metall. 1982, 16, 287–292. [Google Scholar] [CrossRef]
  31. Hashimoto, E.; Kino, T. Hydrogen diffusion in aluminium at high temperatures. J. Phys. F Met. Phys. 1983, 13, 1157. [Google Scholar] [CrossRef]
  32. Saitoh, H.; Iijima, Y.; Tanaka, H. Hydrogen diffusivity in aluminium measured by a glow discharge permeation method. Acta Metall. Mater. 1994, 42, 2493–2498. [Google Scholar] [CrossRef]
  33. Eichenauer, W.; Hattenbach, K.; Pebler, A. The solubility of hydrogen in solid and liquid aluminum. Z. Metallk. 1961, 52, 682–684. [Google Scholar]
  34. Ishikawa, T.; McLellan, R.B. The diffusivity of hydrogen in aluminum. Acta Metall. 1986, 34, 1091–1095. [Google Scholar] [CrossRef]
Figure 1. STGB models with 5 at. % H in aluminum.
Metals 12 00345 g001
Figure 2. Bulk models with 5 at. % H in aluminum.
Metals 12 00345 g002
Figure 3. MSD curves of hydrogen atoms in Σ5(120)[001] STGB models and bulk models with 5 at. % H at different temperatures. (a) MSD curves of hydrogen atoms at 400 K and 500 K; (b) MSD curves of hydrogen atoms at 600 K and 700 K.
Metals 12 00345 g003
Figure 4. Diffusion rates of hydrogen atoms at Σ5(120)[001] STGB models and bulk models with 5 at. % H at different temperatures.
Metals 12 00345 g004
Figure 5. MSD curves of H in STGB models at different angles under different concentrations. (a) MSD curves of H in STGB models at different angles at 0.5 at. % H; (b) MSD curves of H in STGB models at different angles at 2.5 at. % H; (c) MSD curves of H in STGB models at different angles at 5 at. % H.
Metals 12 00345 g005
Figure 6. Diffusion rates of 0.5 at. % H at STGB models with different tilt angles and bulk models.
Metals 12 00345 g006
Figure 7. Diffusion rates of 2.5 at. % H at STGB models with different tilt angles and bulk models.
Metals 12 00345 g007
Figure 8. Diffusion rates of 5 at. % H at STGB models with different tilt angles and bulk models.
Metals 12 00345 g008
Figure 9. Hydrogen diffusion diagram of Σ29a(250) STGB model with 0.5 at. % H. (a) MSD of H and MSD in X, Y and Z direction; (b) Hydrogen diffusion rate of 0–600 ps and 600–1200 ps; (c) Distribution diagrams of H in Σ29a(250) STGB model at 0 ps, 300 ps, 600 ps, 900 ps and 1200 ps.
Metals 12 00345 g009
Figure 10. Hydrogen diffusion diagram of Σ29a(250) STGB model with 2.5 at. % H. (a) MSD of H and MSD in X, Y and Z direction; (b) Hydrogen diffusion rate of 0–600 ps and 600–1200 ps; (c) Distribution diagrams of H in Σ29a(250) STGB model at 0 ps, 300 ps, 600 ps, 900 ps and 1200 ps.
Metals 12 00345 g010
Figure 11. Hydrogen diffusion diagram of Σ29a(250) STGB model with 5 at. % H. (a) MSD of H and MSD in X, Y and Z direction; (b) Hydrogen diffusion rate of 0–600 ps and 600–1200 ps; (c) Distribution diagrams of H in Σ29a(250) STGB model at 0 ps, 300 ps, 600 ps, 900 ps and 1200 ps.
Metals 12 00345 g011
Figure 12. Hydrogen diffusion process in STGB models with different angles at 1200 ps.
Metals 12 00345 g012
Table 1. Model parameters of STGB along [001] tilt axis.
Parameters for CSL of STGB∑37a
(160)
∑17a
(140)
∑5
(130)
∑29a
(250)
∑5
(120)
∑13a
(230)
∑25a
(340)
Tilt Angle (°)18.928.136.943.653.167.473.7
Table 2. Linear fitting slope value of MSD curve in Σ5(120)[001] STGB model and bulk model.
Temperature (K)Slope of Bulk Model (Å2/ps)ErrorR2Slope of GB Model (Å2/ps)ErrorR2
4005.53 × 10−31.47 × 10−50.9411.09 × 10−22.21 × 10−50.966
5004.94 × 10−27.90 × 10−50.9806.80 × 10−28.57 × 10−50.987
6000.2492.60 × 10−40.9910.3622.54 × 10−40.996
7000.7504.39 × 10−40.9971.041.85 × 10−40.976
Publisher’s Note: MDPI stays neutral with regard to jurisdictional claims in published maps and institutional affiliations.

