
Numerical Simulation on the Influence of Submerged Combustion on Splashing and Heat Transfer in TSL Furnace

Abstract
:1. Introduction
2. Numerical model
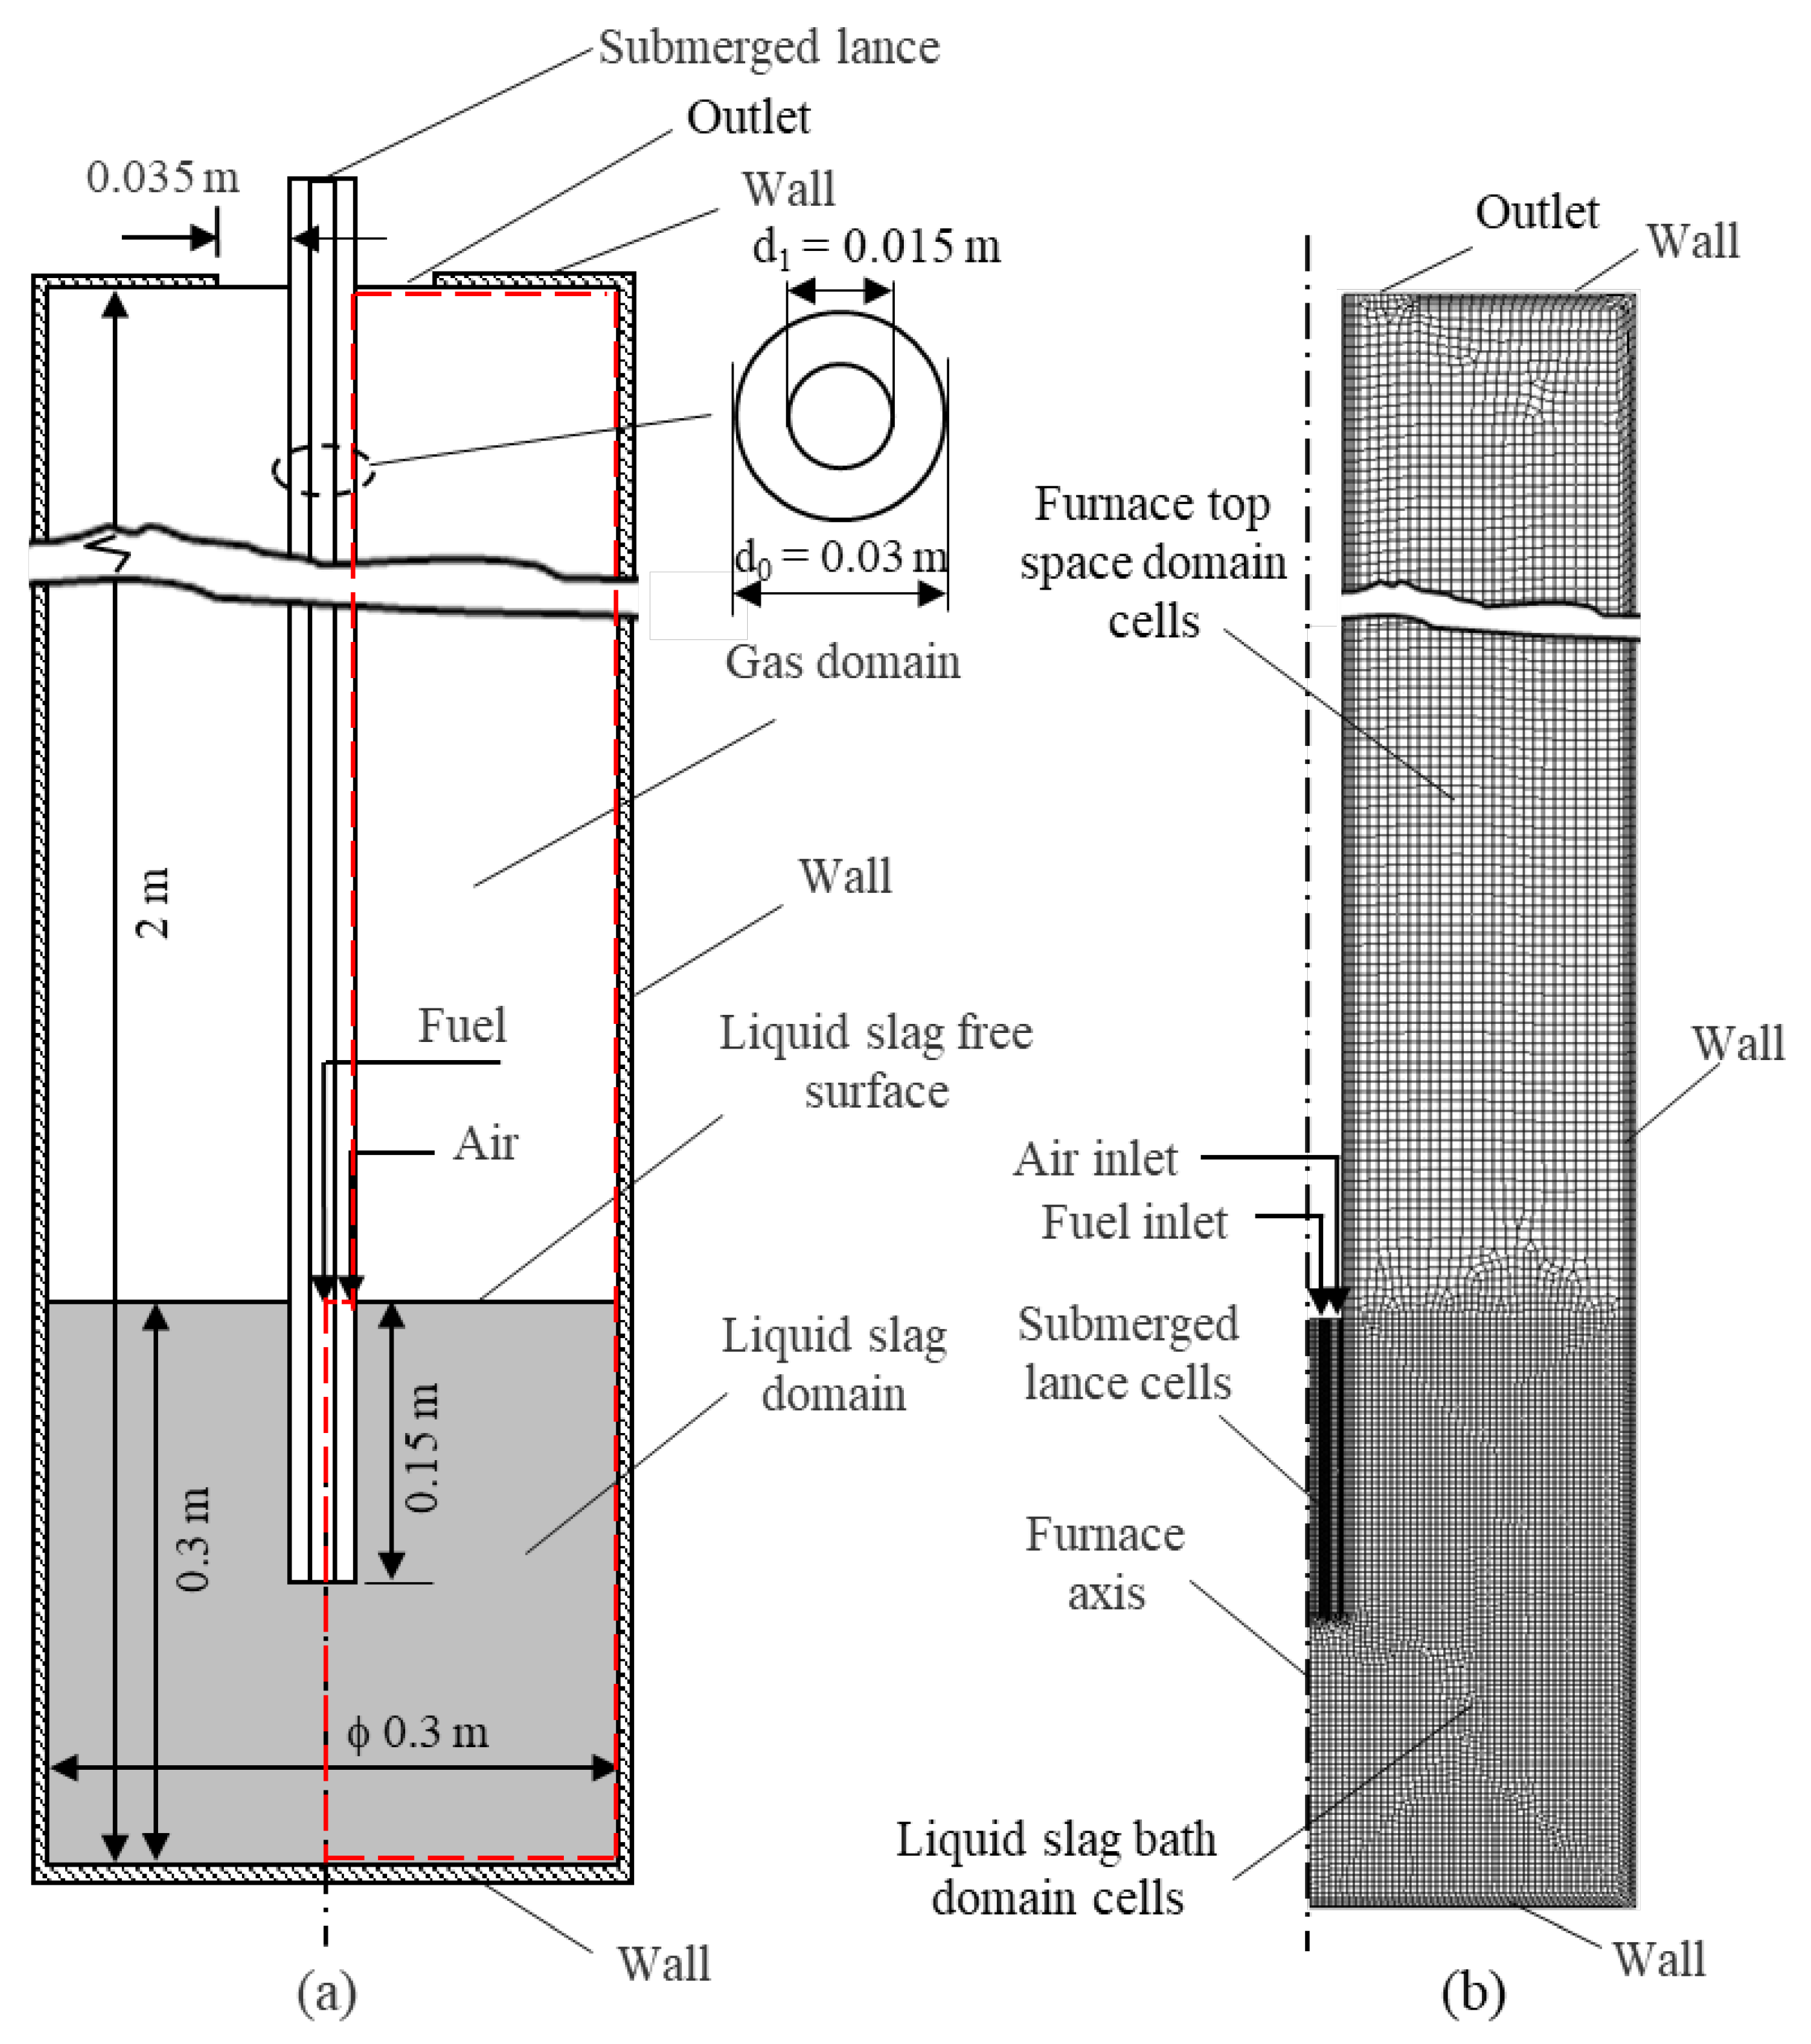
2.1. Model Geometry
2.2. Numerical Model
2.2.1. Model Assumptions
- The furnace sidewall, bottom and roof are non-slip walls without thickness and heat loss to the external environment;
- The lance is inserted from the top along the furnace geometric centerline, and the flow phenomenon is regarded as an axisymmetric two-dimensional flow;
- The thickness of inner and outer pipes of the lance, which is actually 0.0015 m, is neglected in the computation domain but the thermal resistance of the pipe wall is implicitly considered in the CFD model;
- The variation in the depth of the molten bath due to charging and de-slagging operations are neglected; and
- The phenomenon of possible slag foaming in the TSL furnace during operation is not considered.
2.2.2. Governing Equations
- Continuity Equation
- 2.
- Momentum Equation
- 3.
- Energy Equation
- 4.
- Turbulence Equations
- 5.
- Species Transport Model
2.2.3. Boundary and Initial Conditions
2.2.4. Model Parameter Conditions
3. Results and Discussion
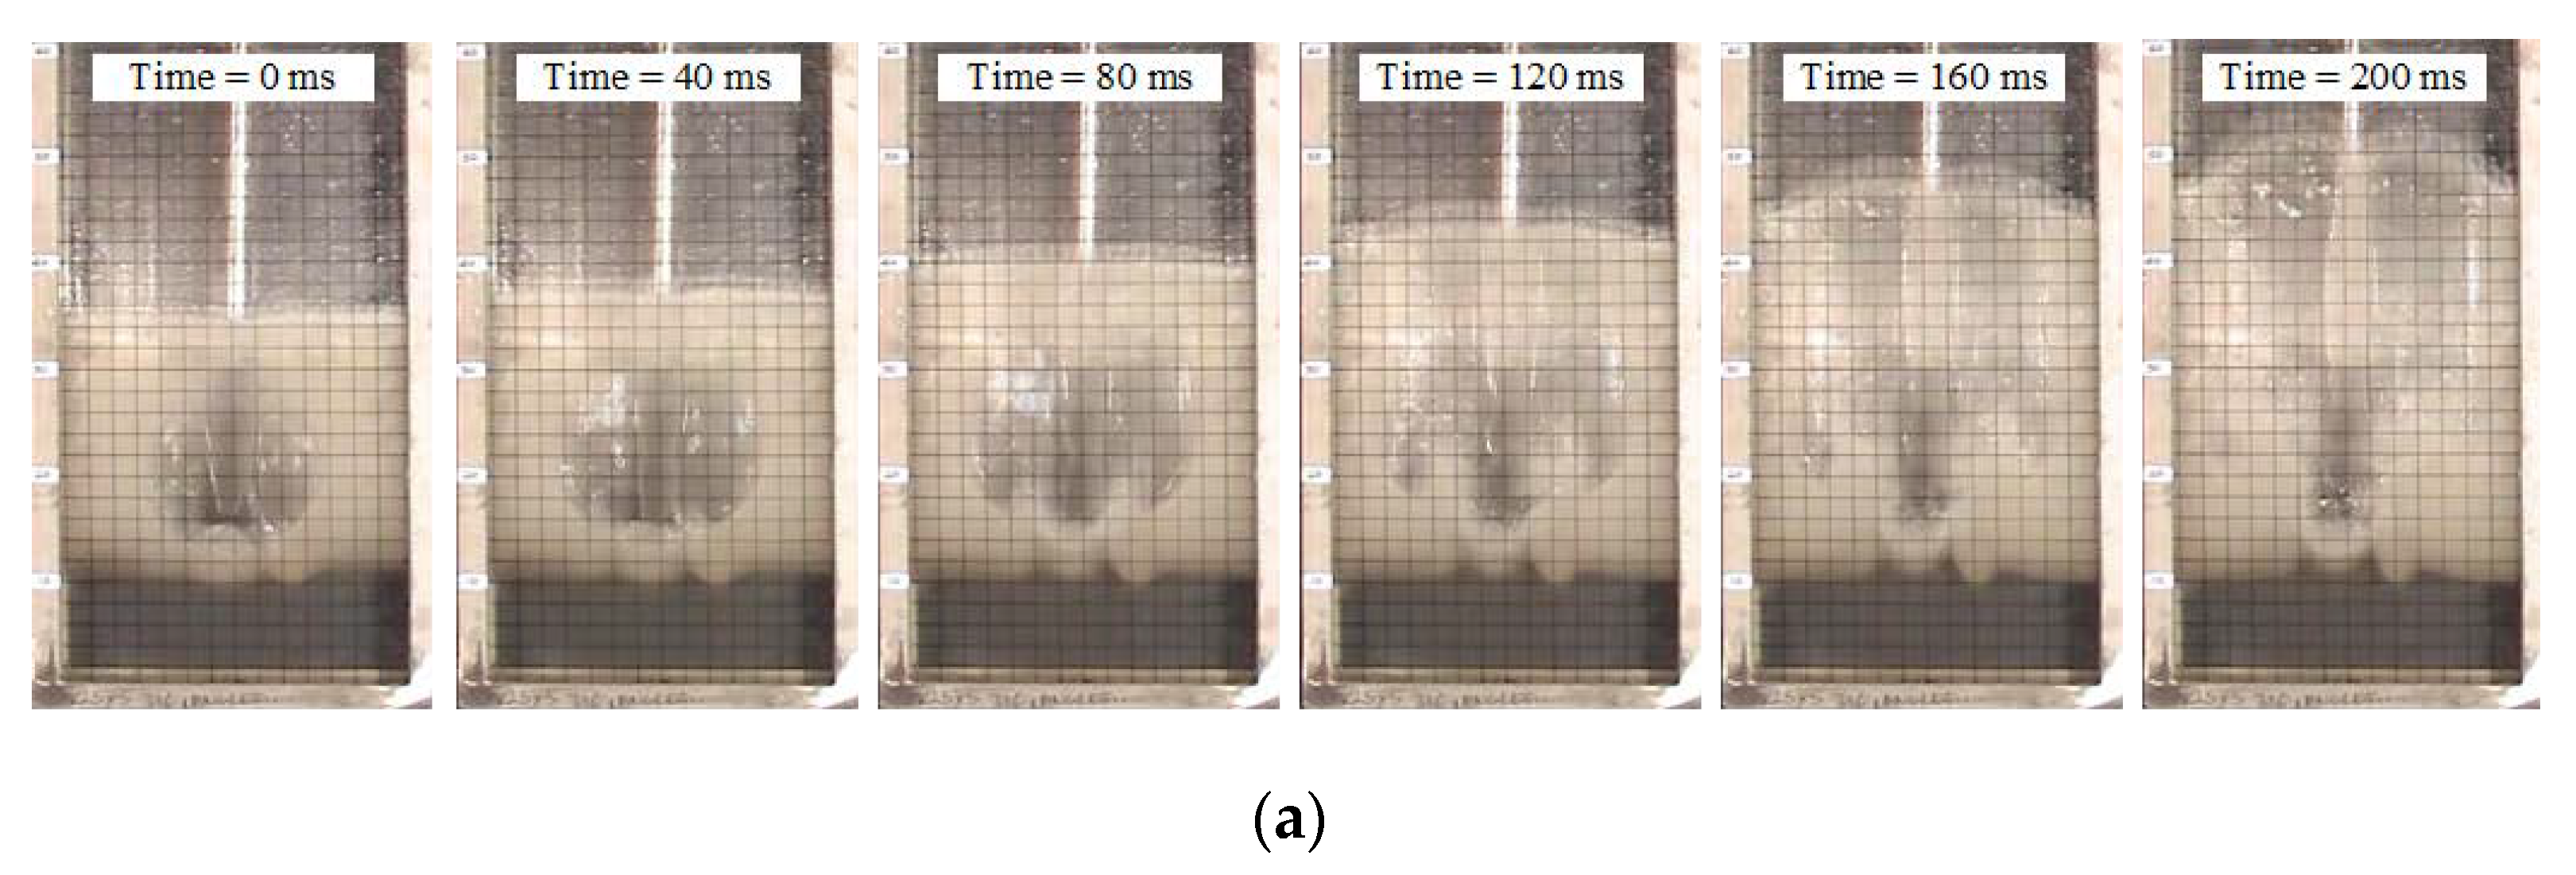
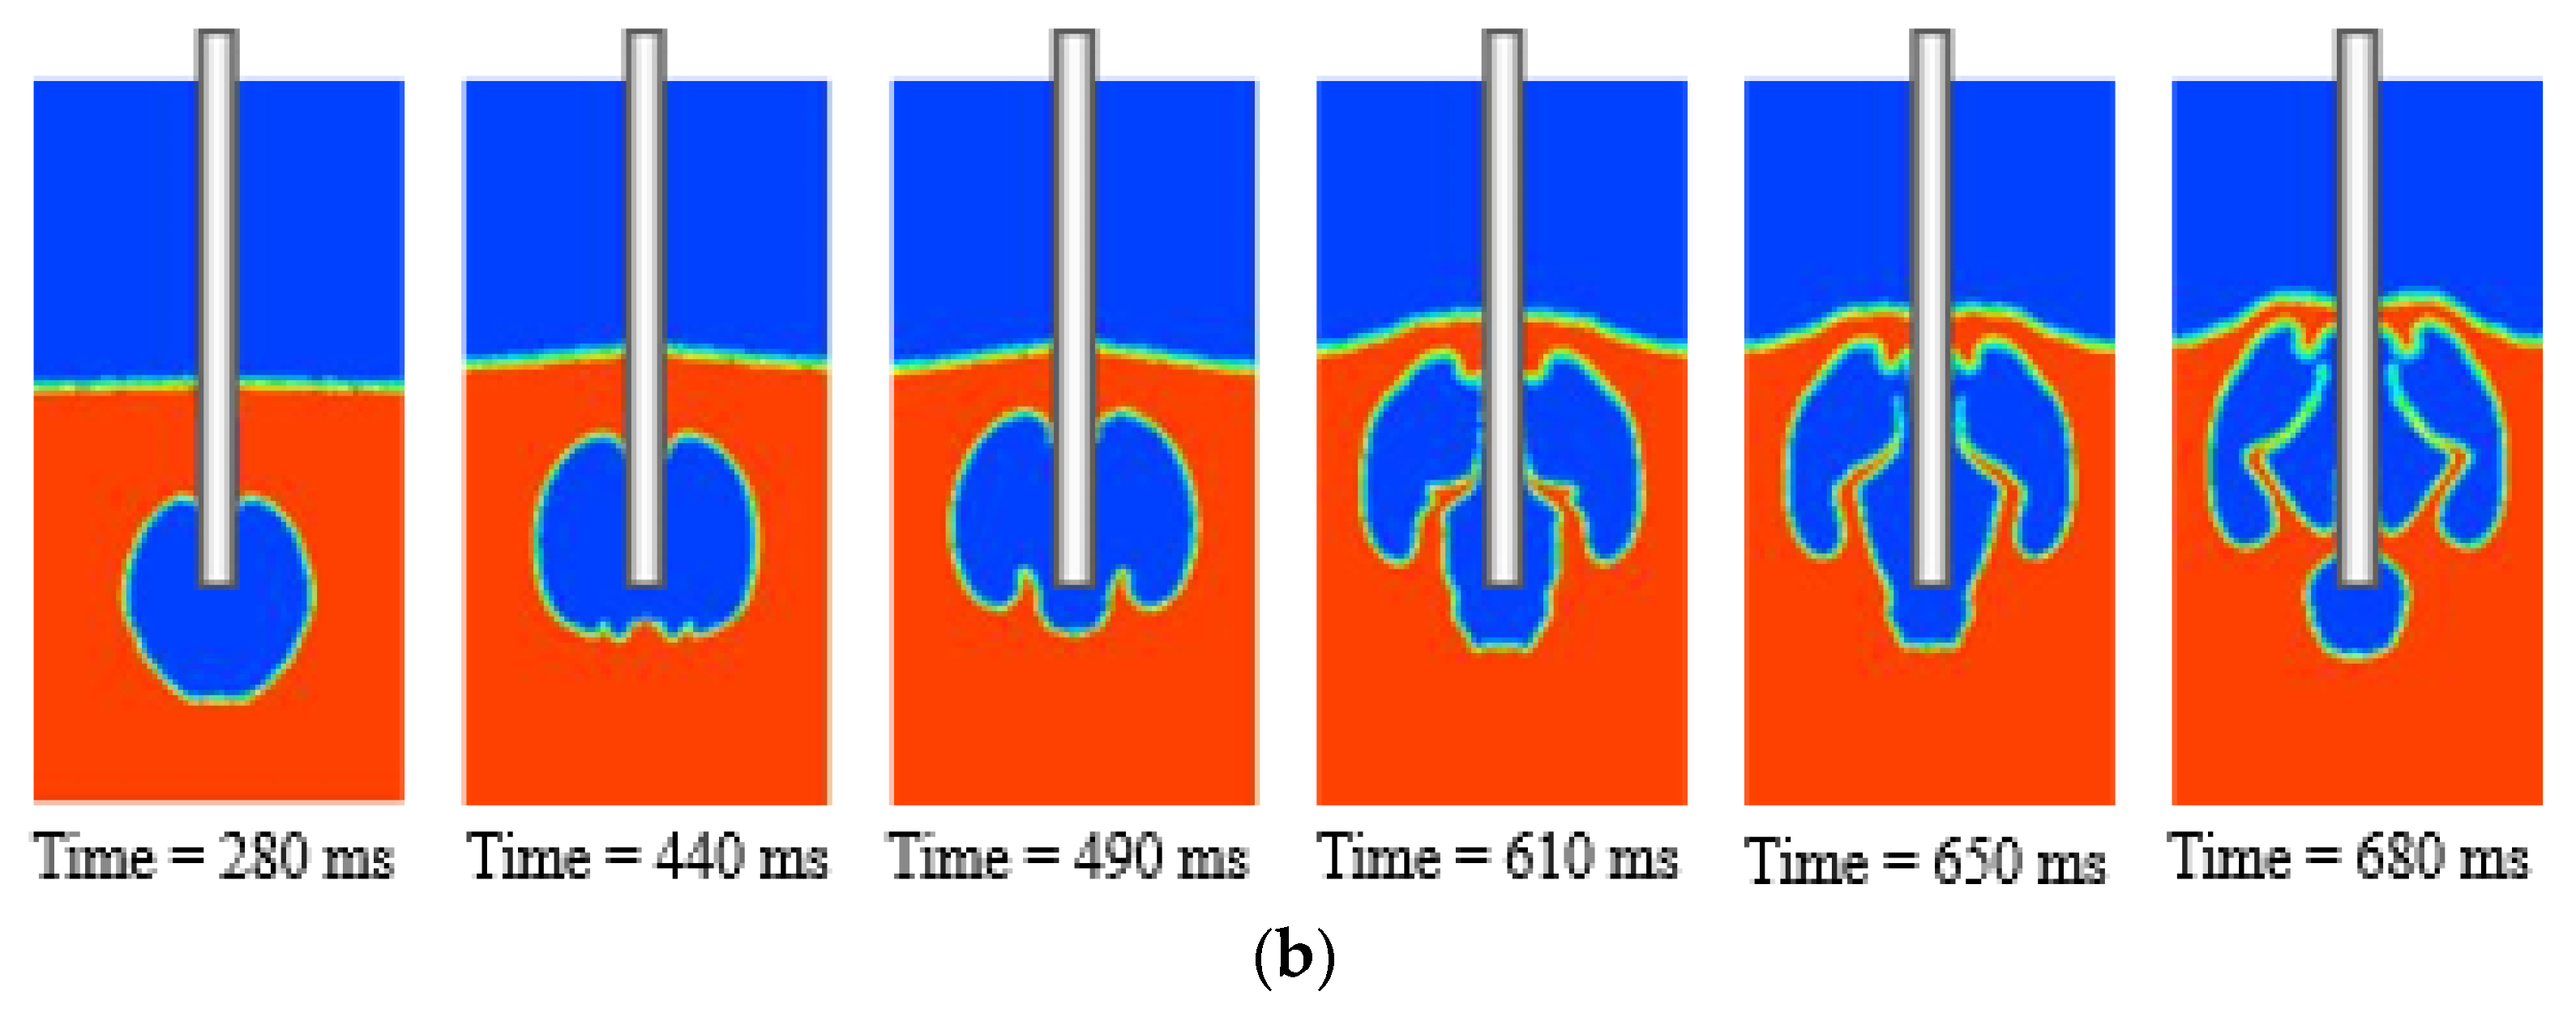
3.1. Model Validation
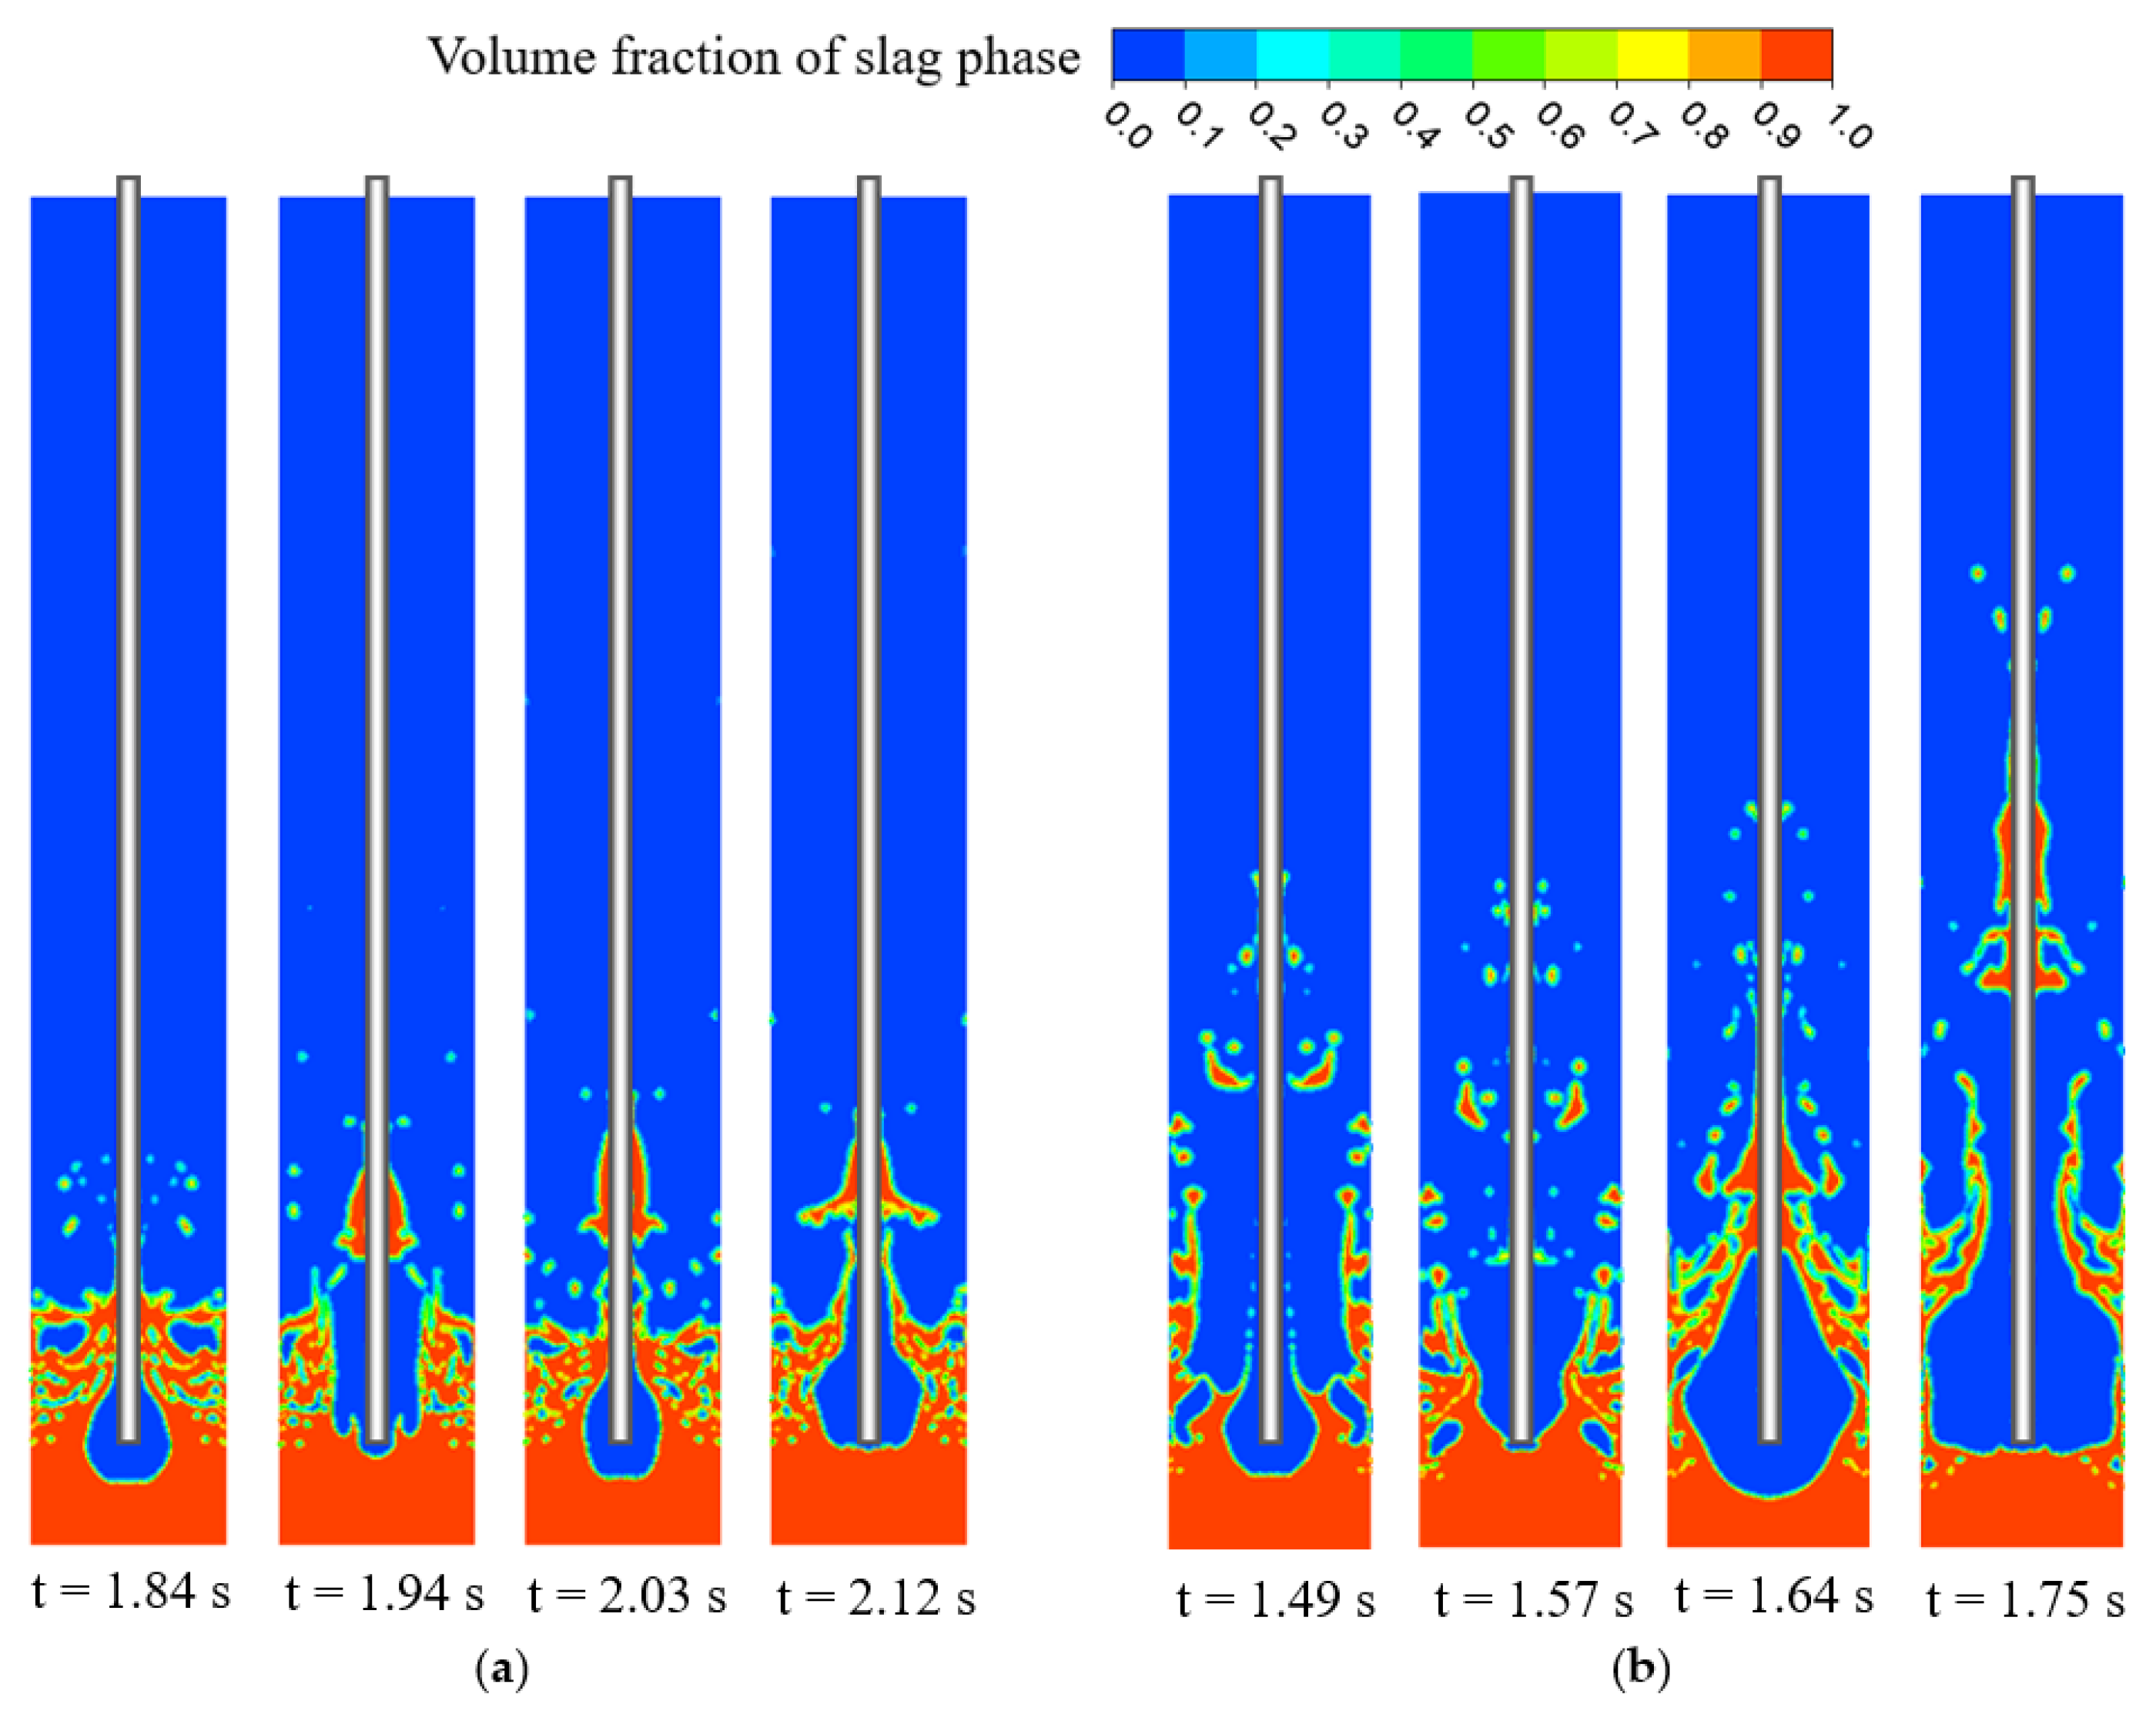
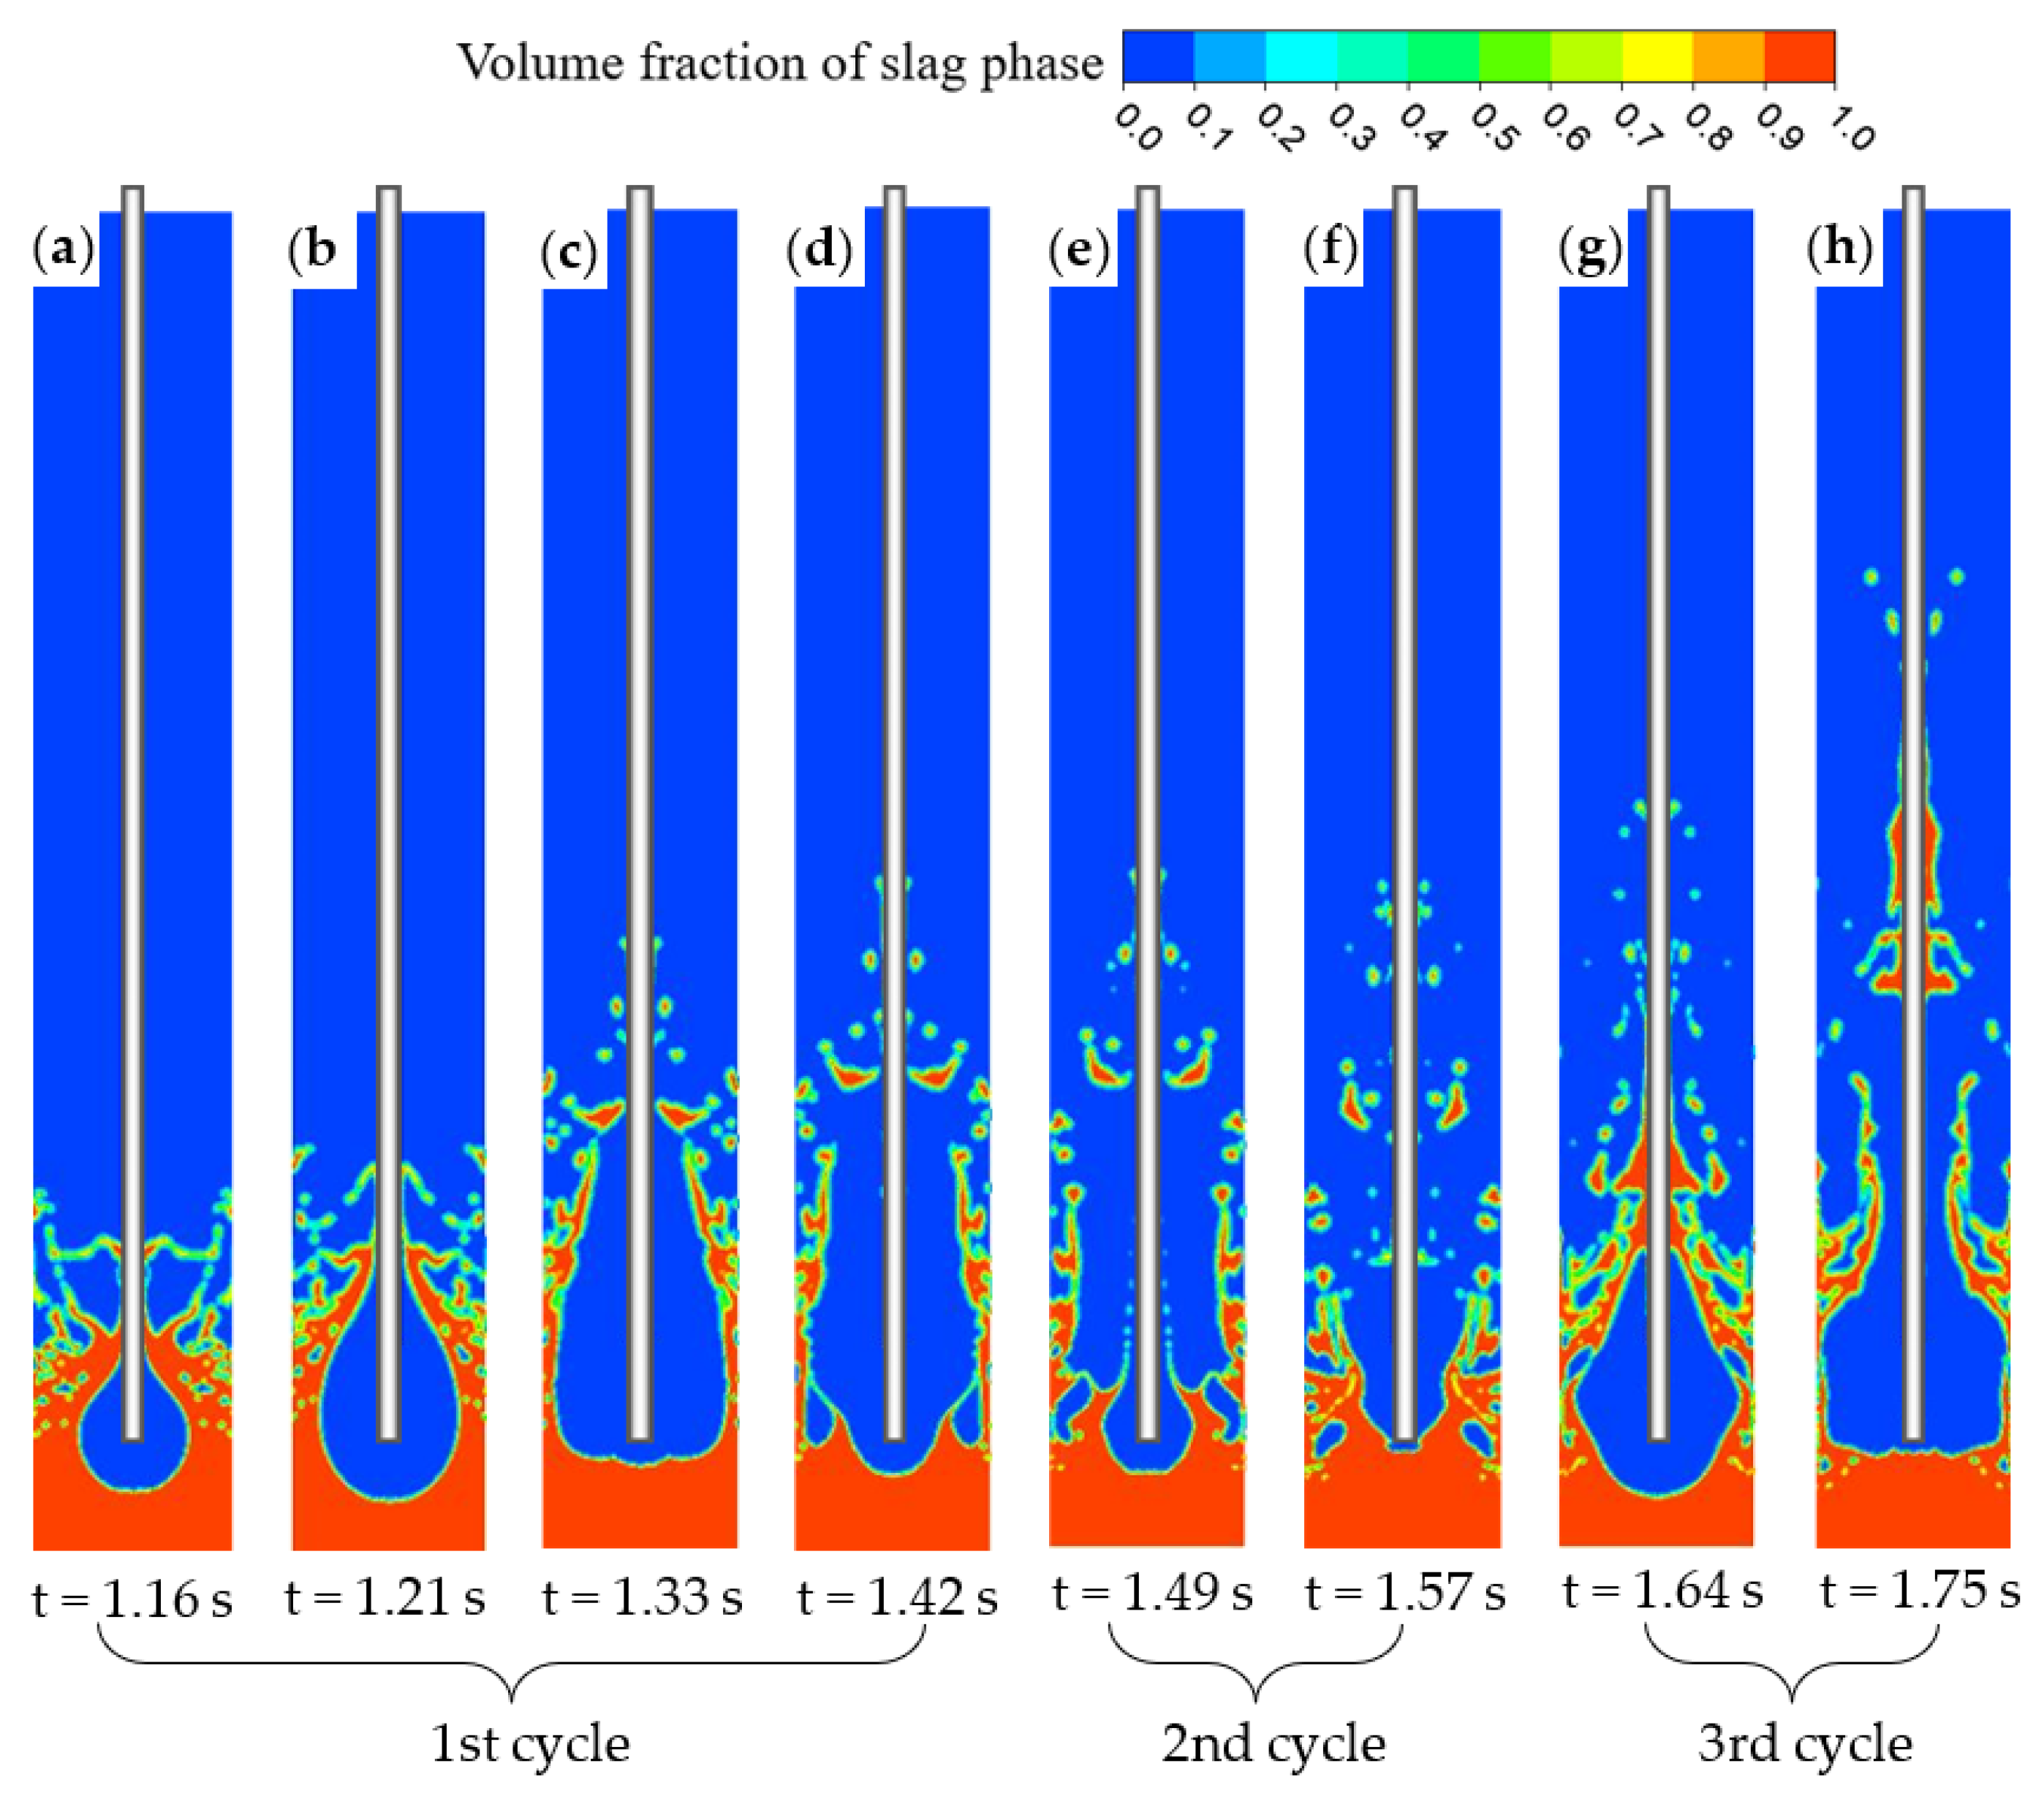
3.2. Splash Formation and Distribution
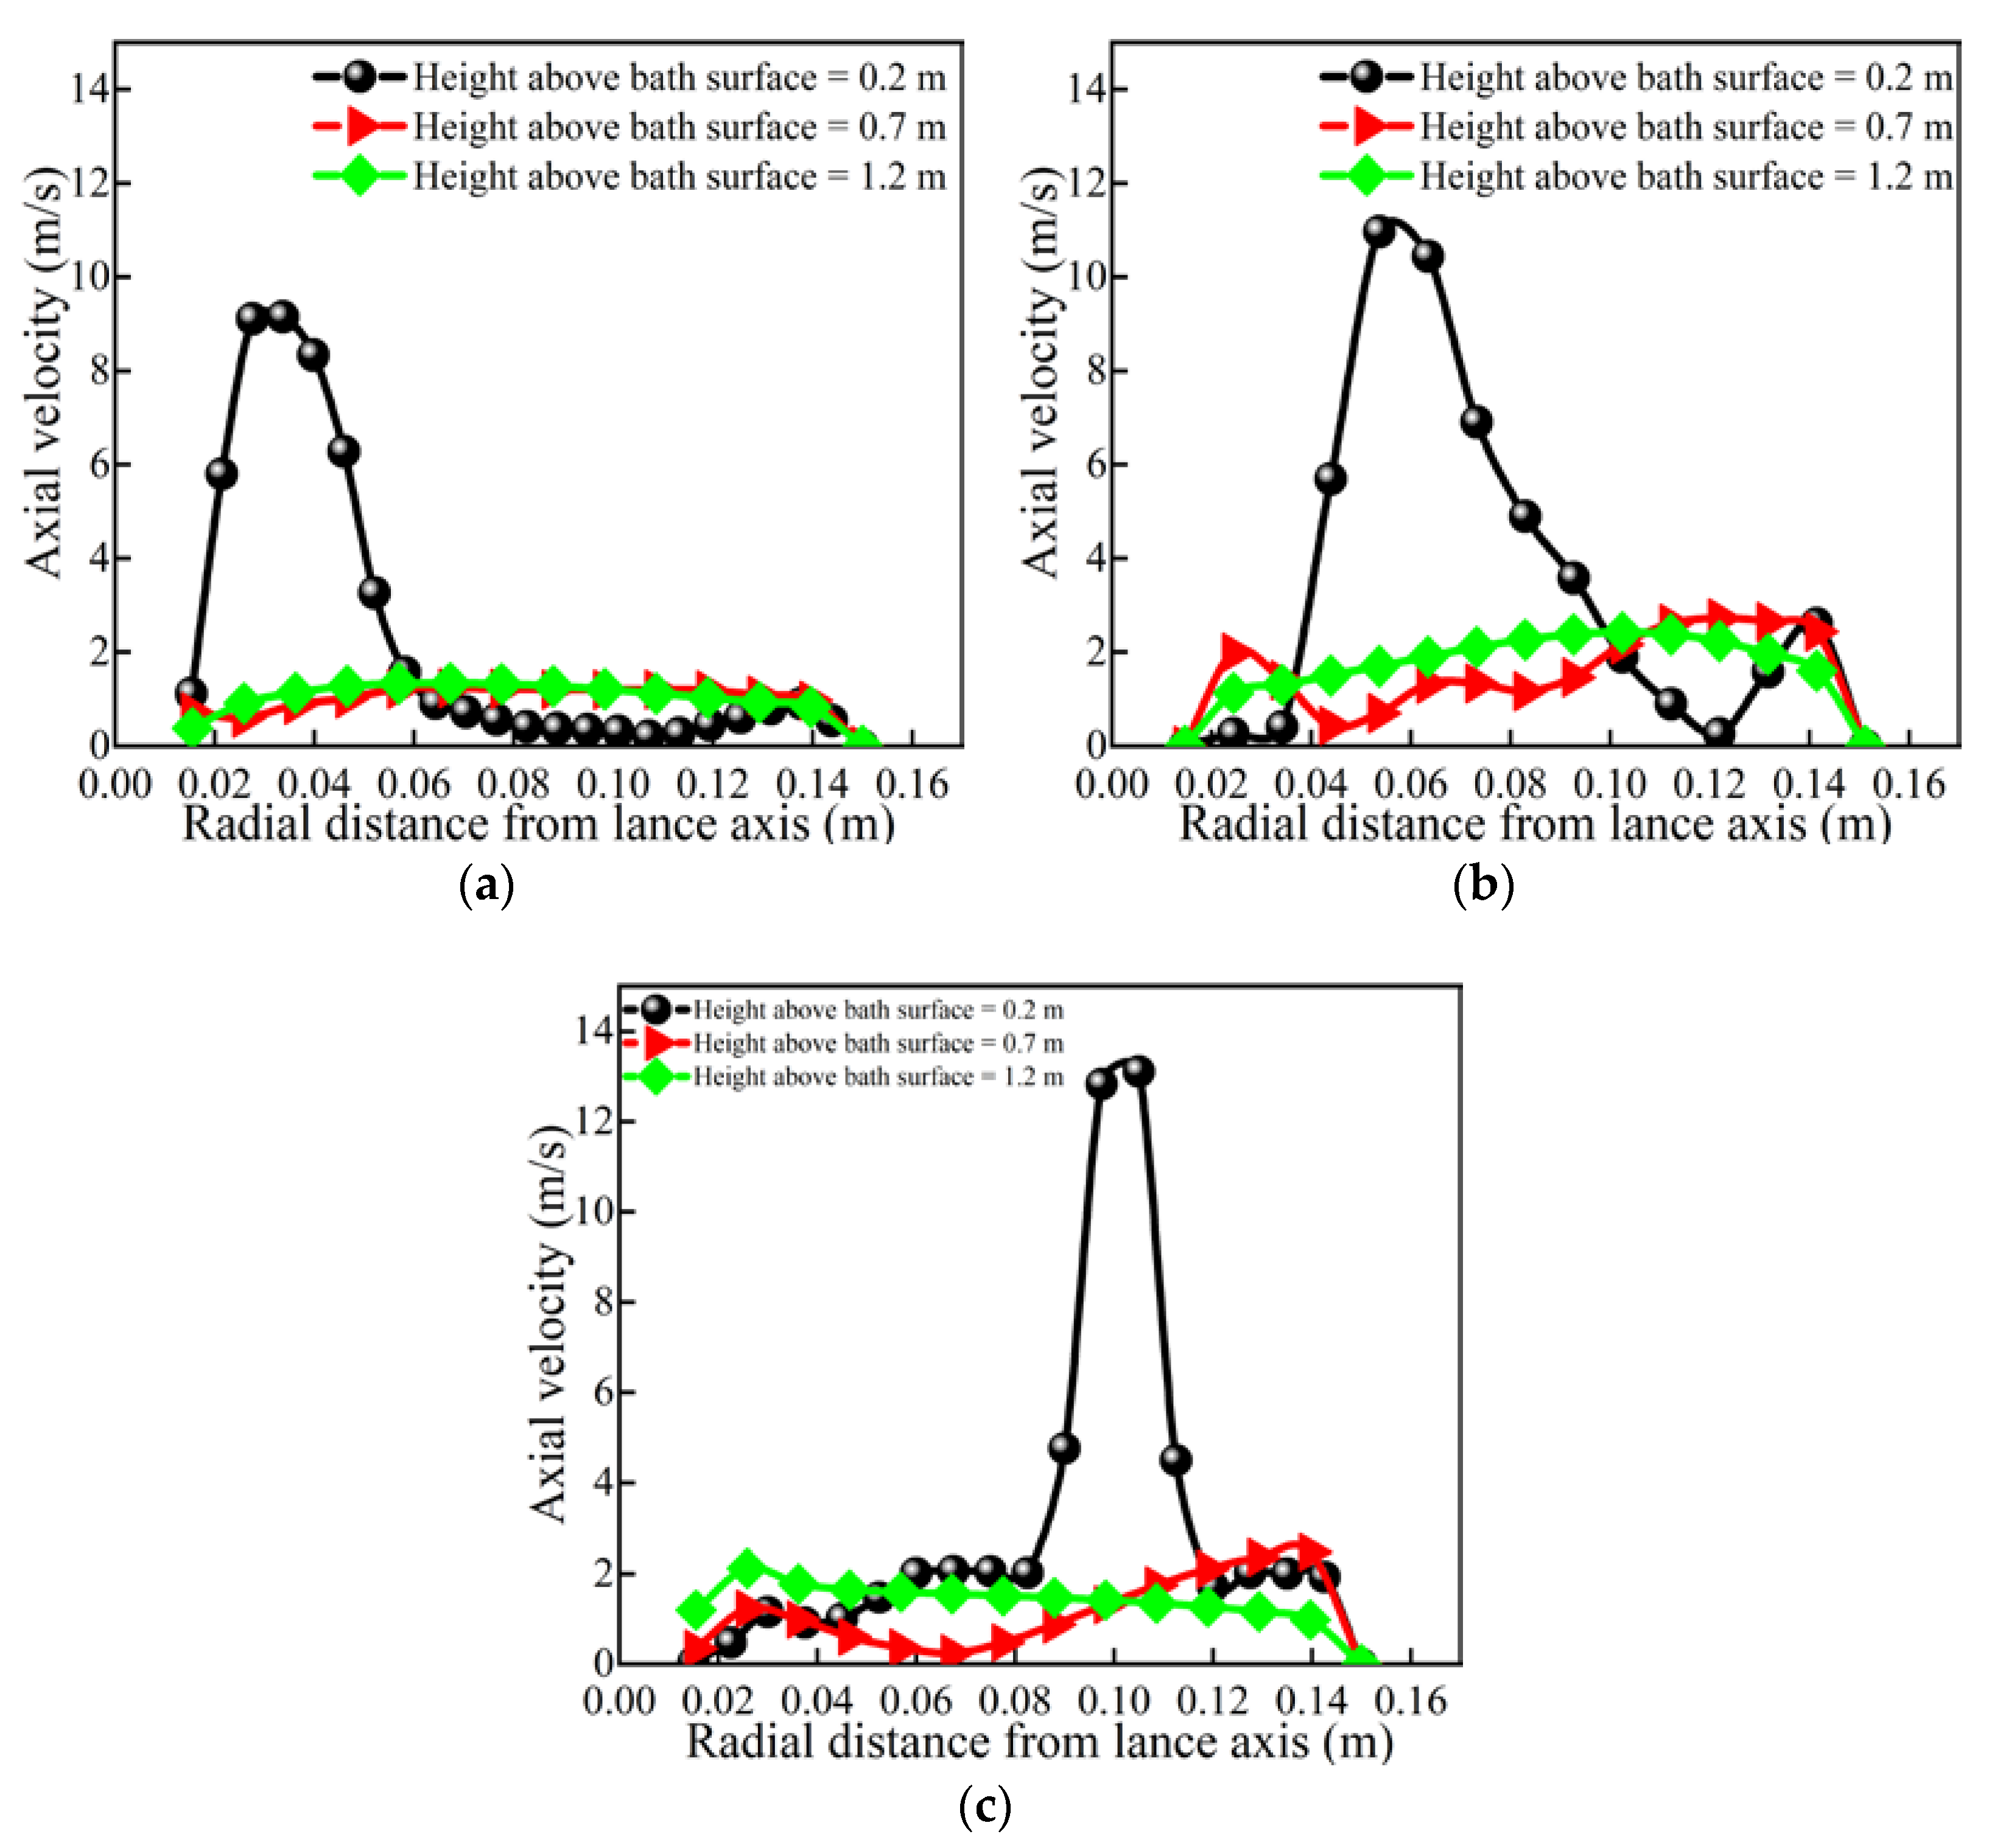
3.3. Influence of Operation Parameters on Slag Splashing
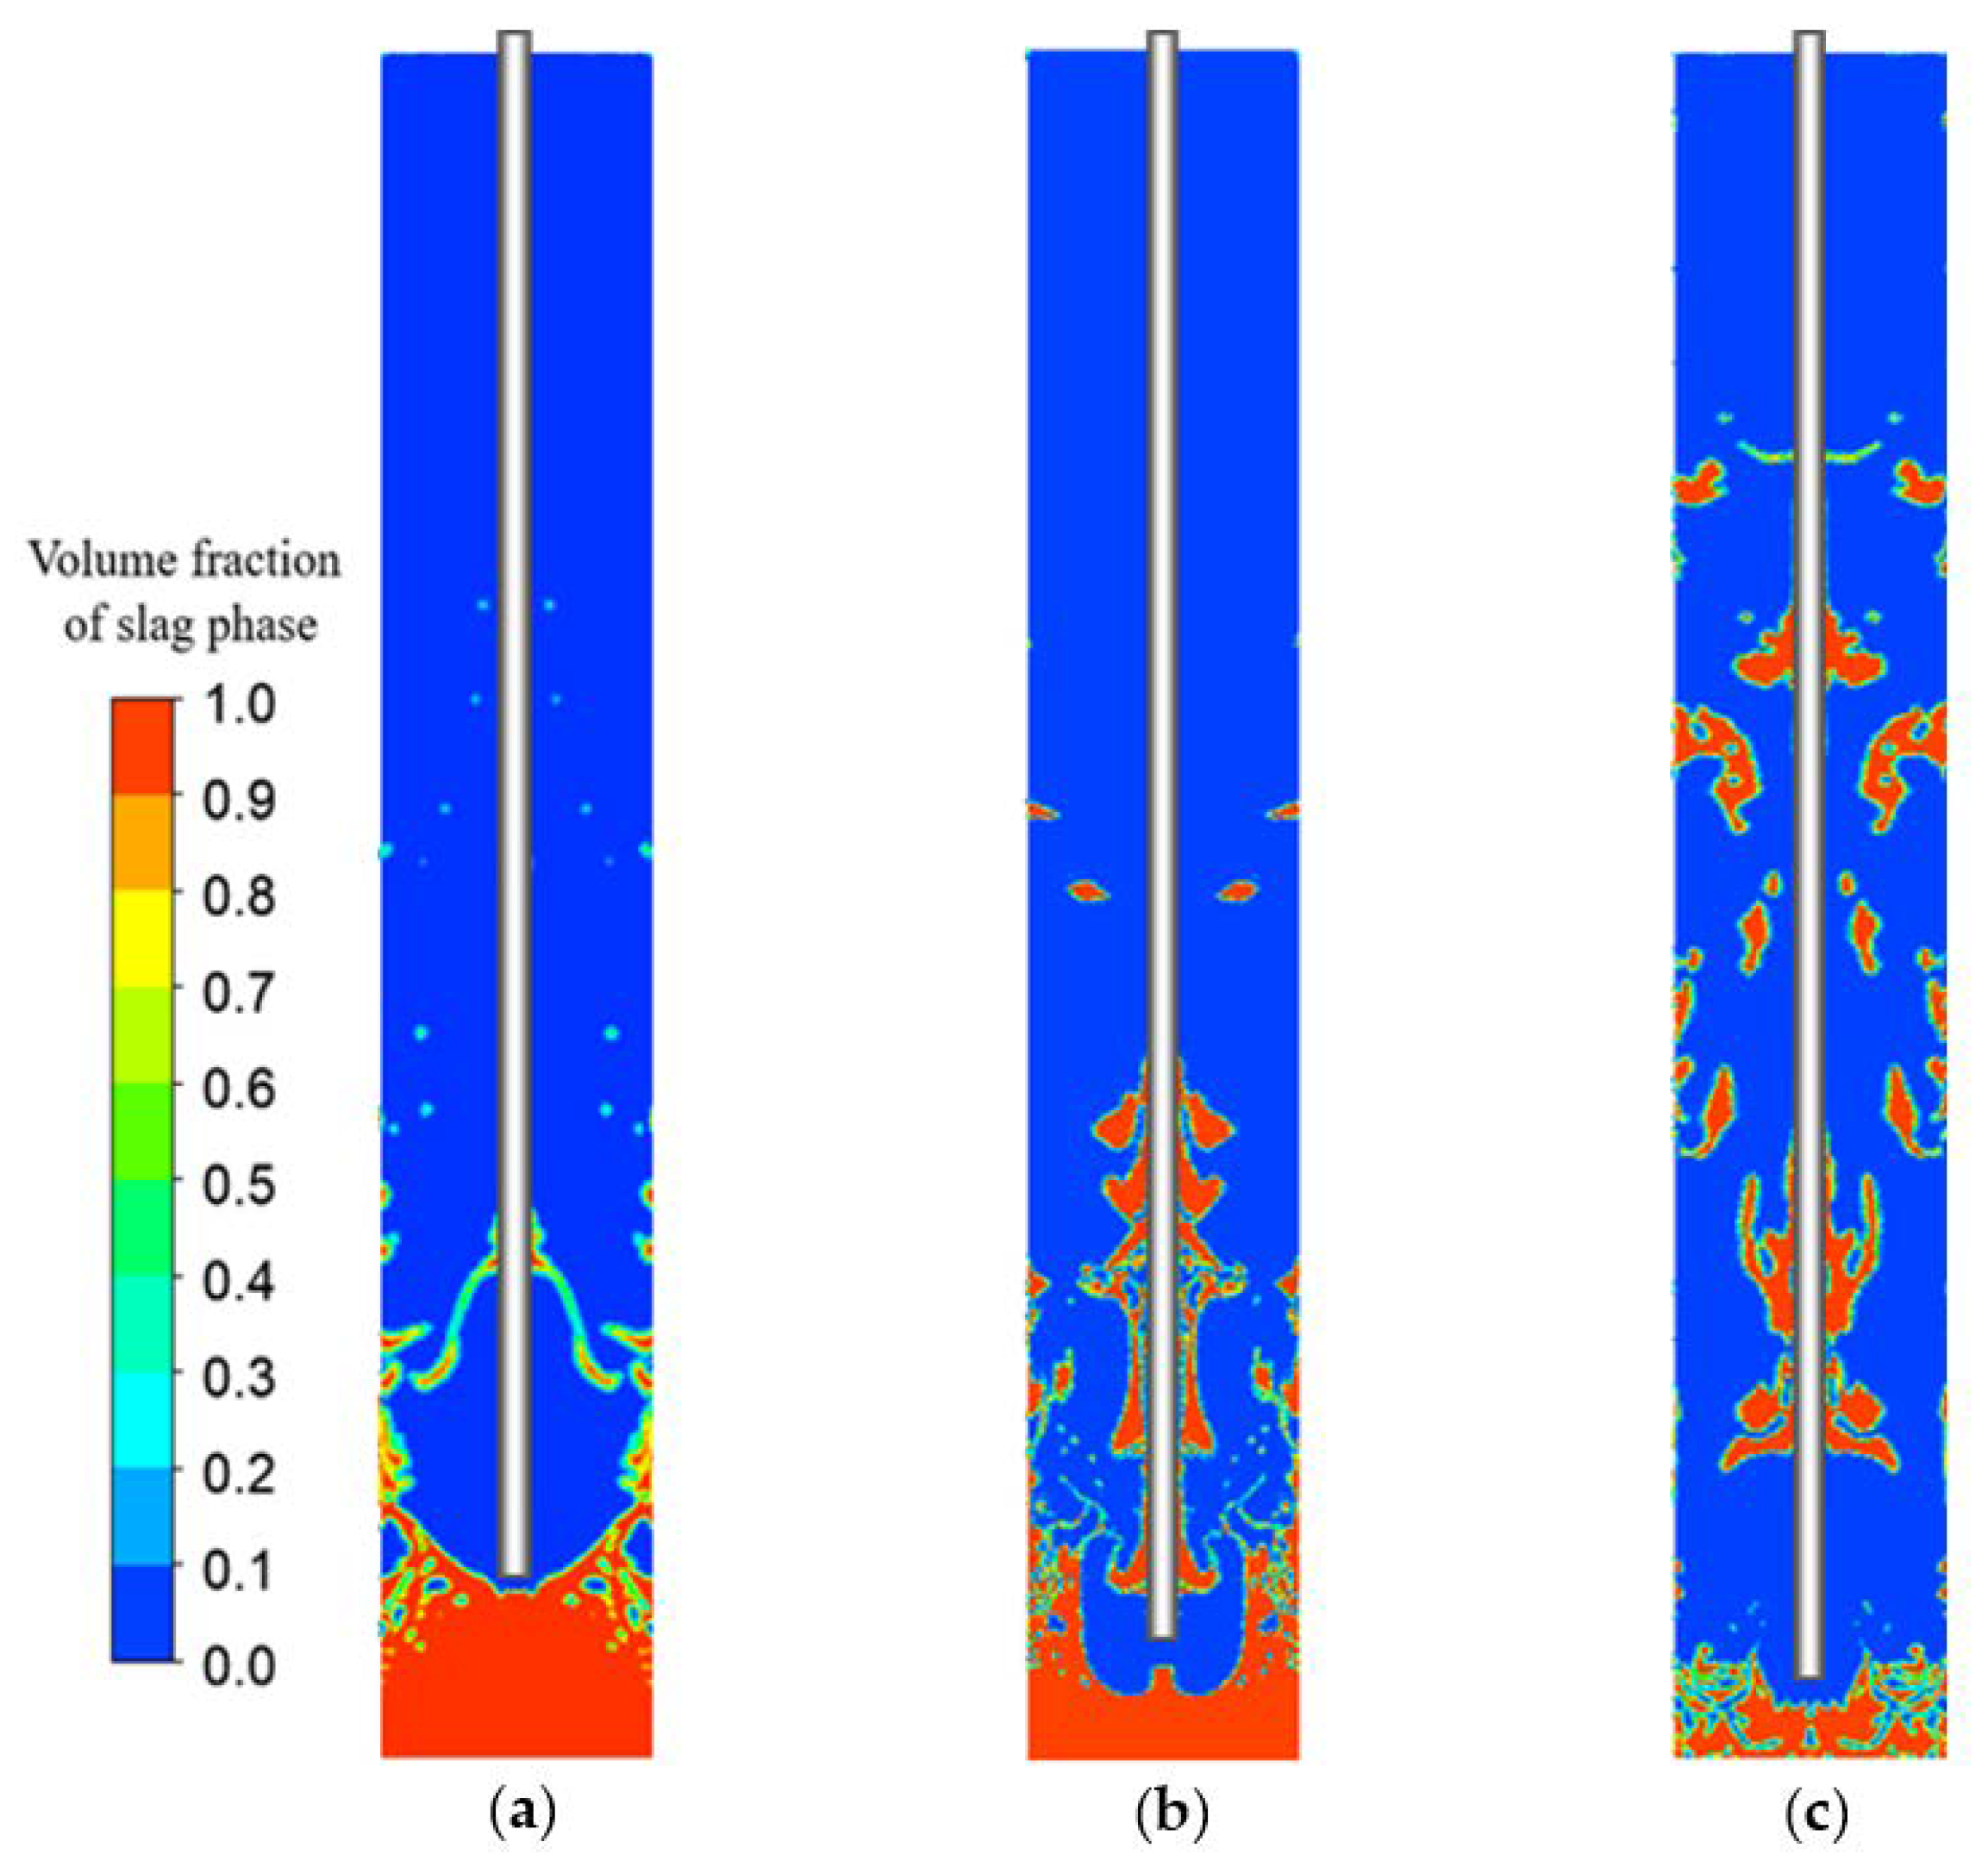
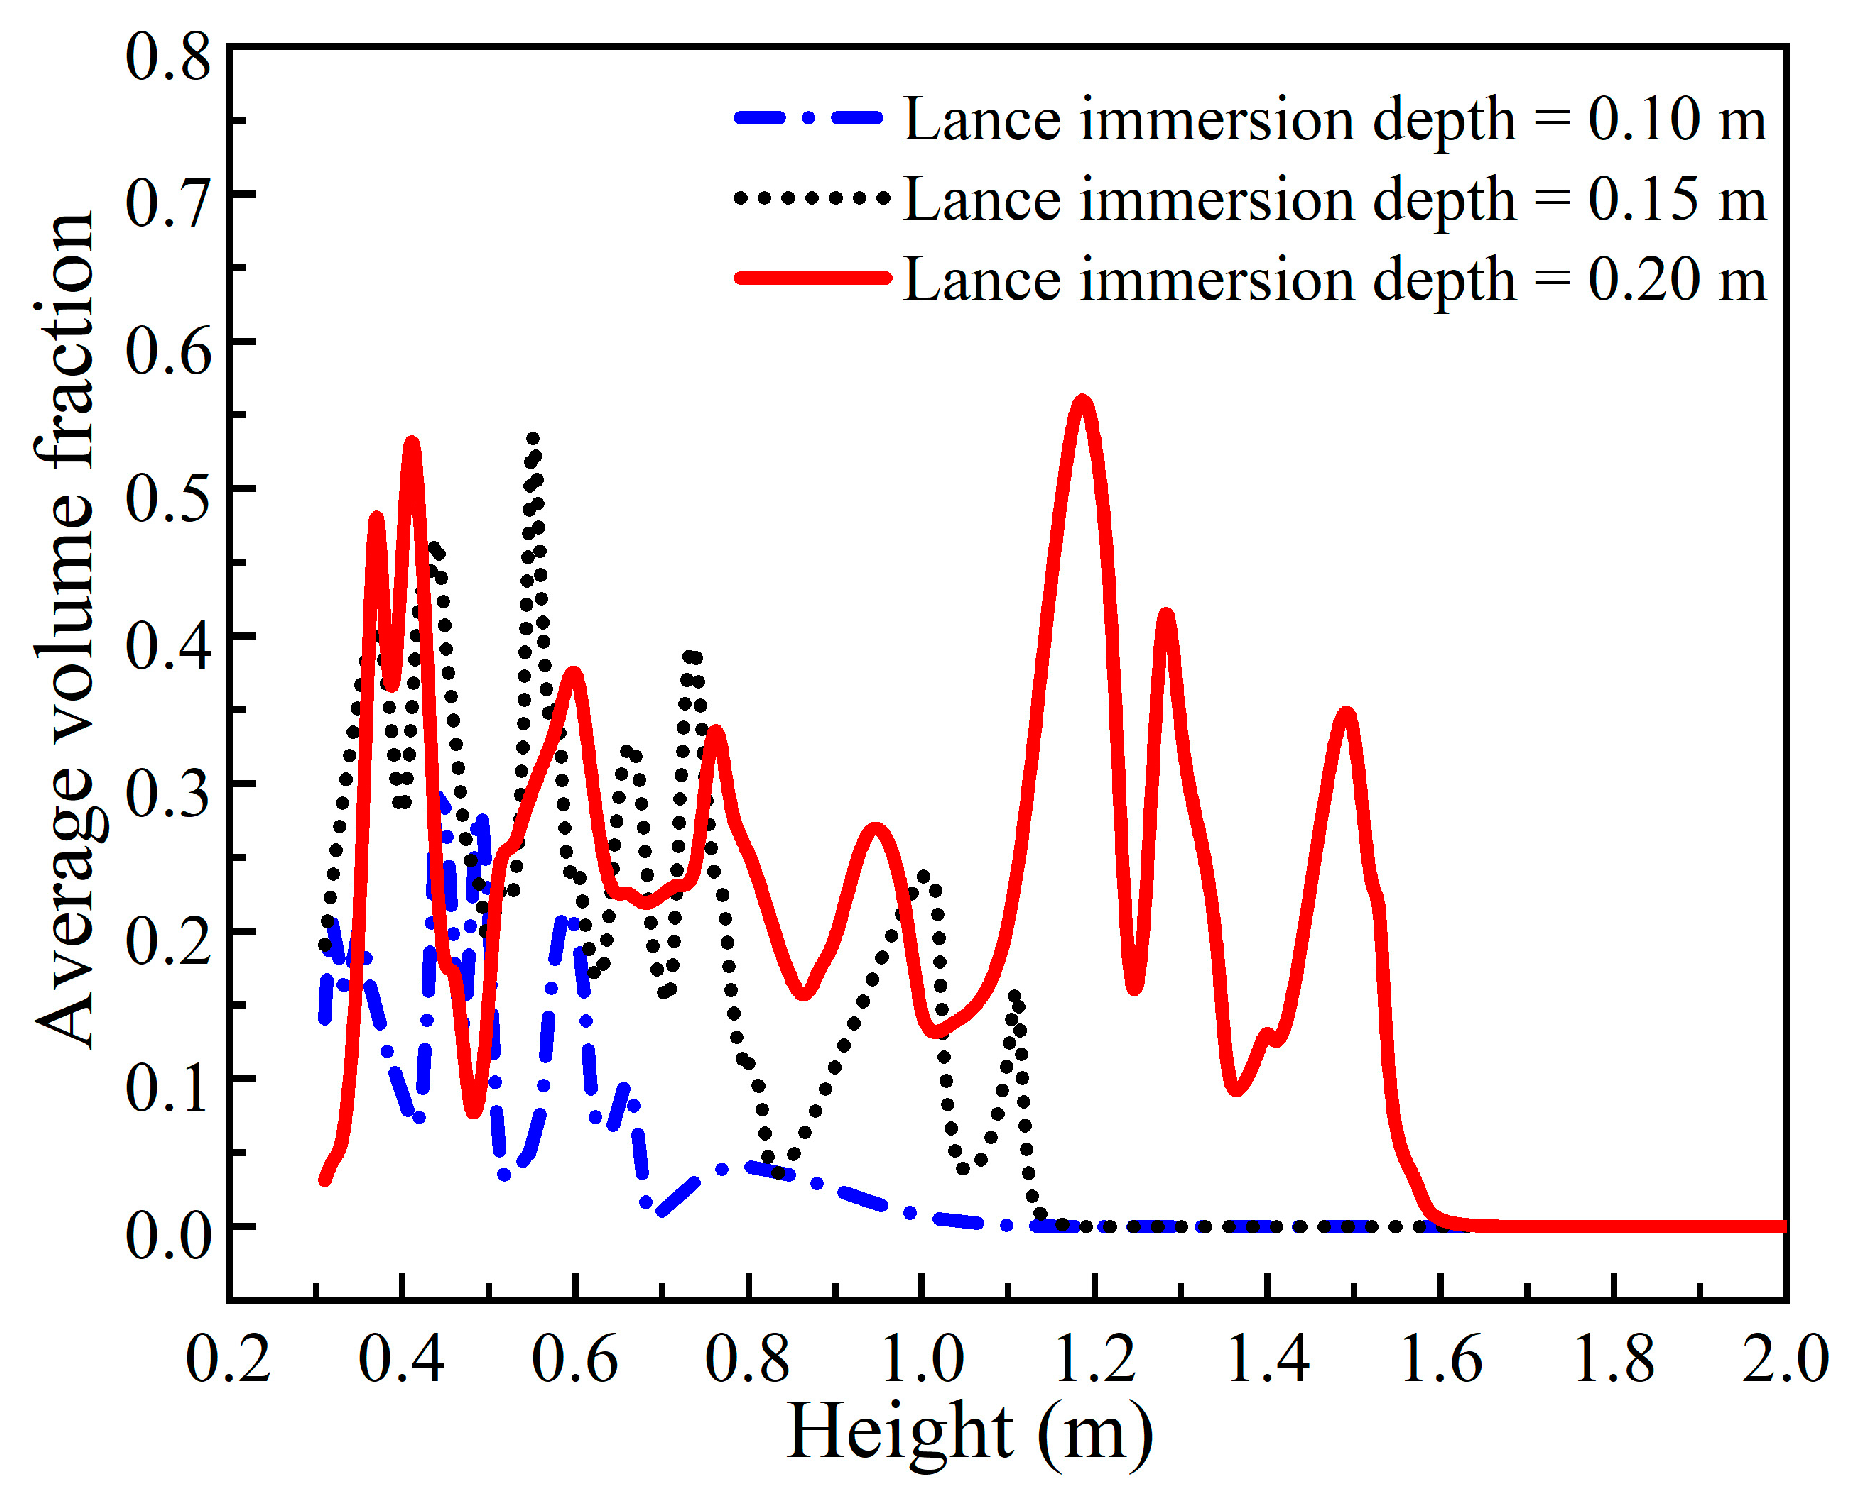
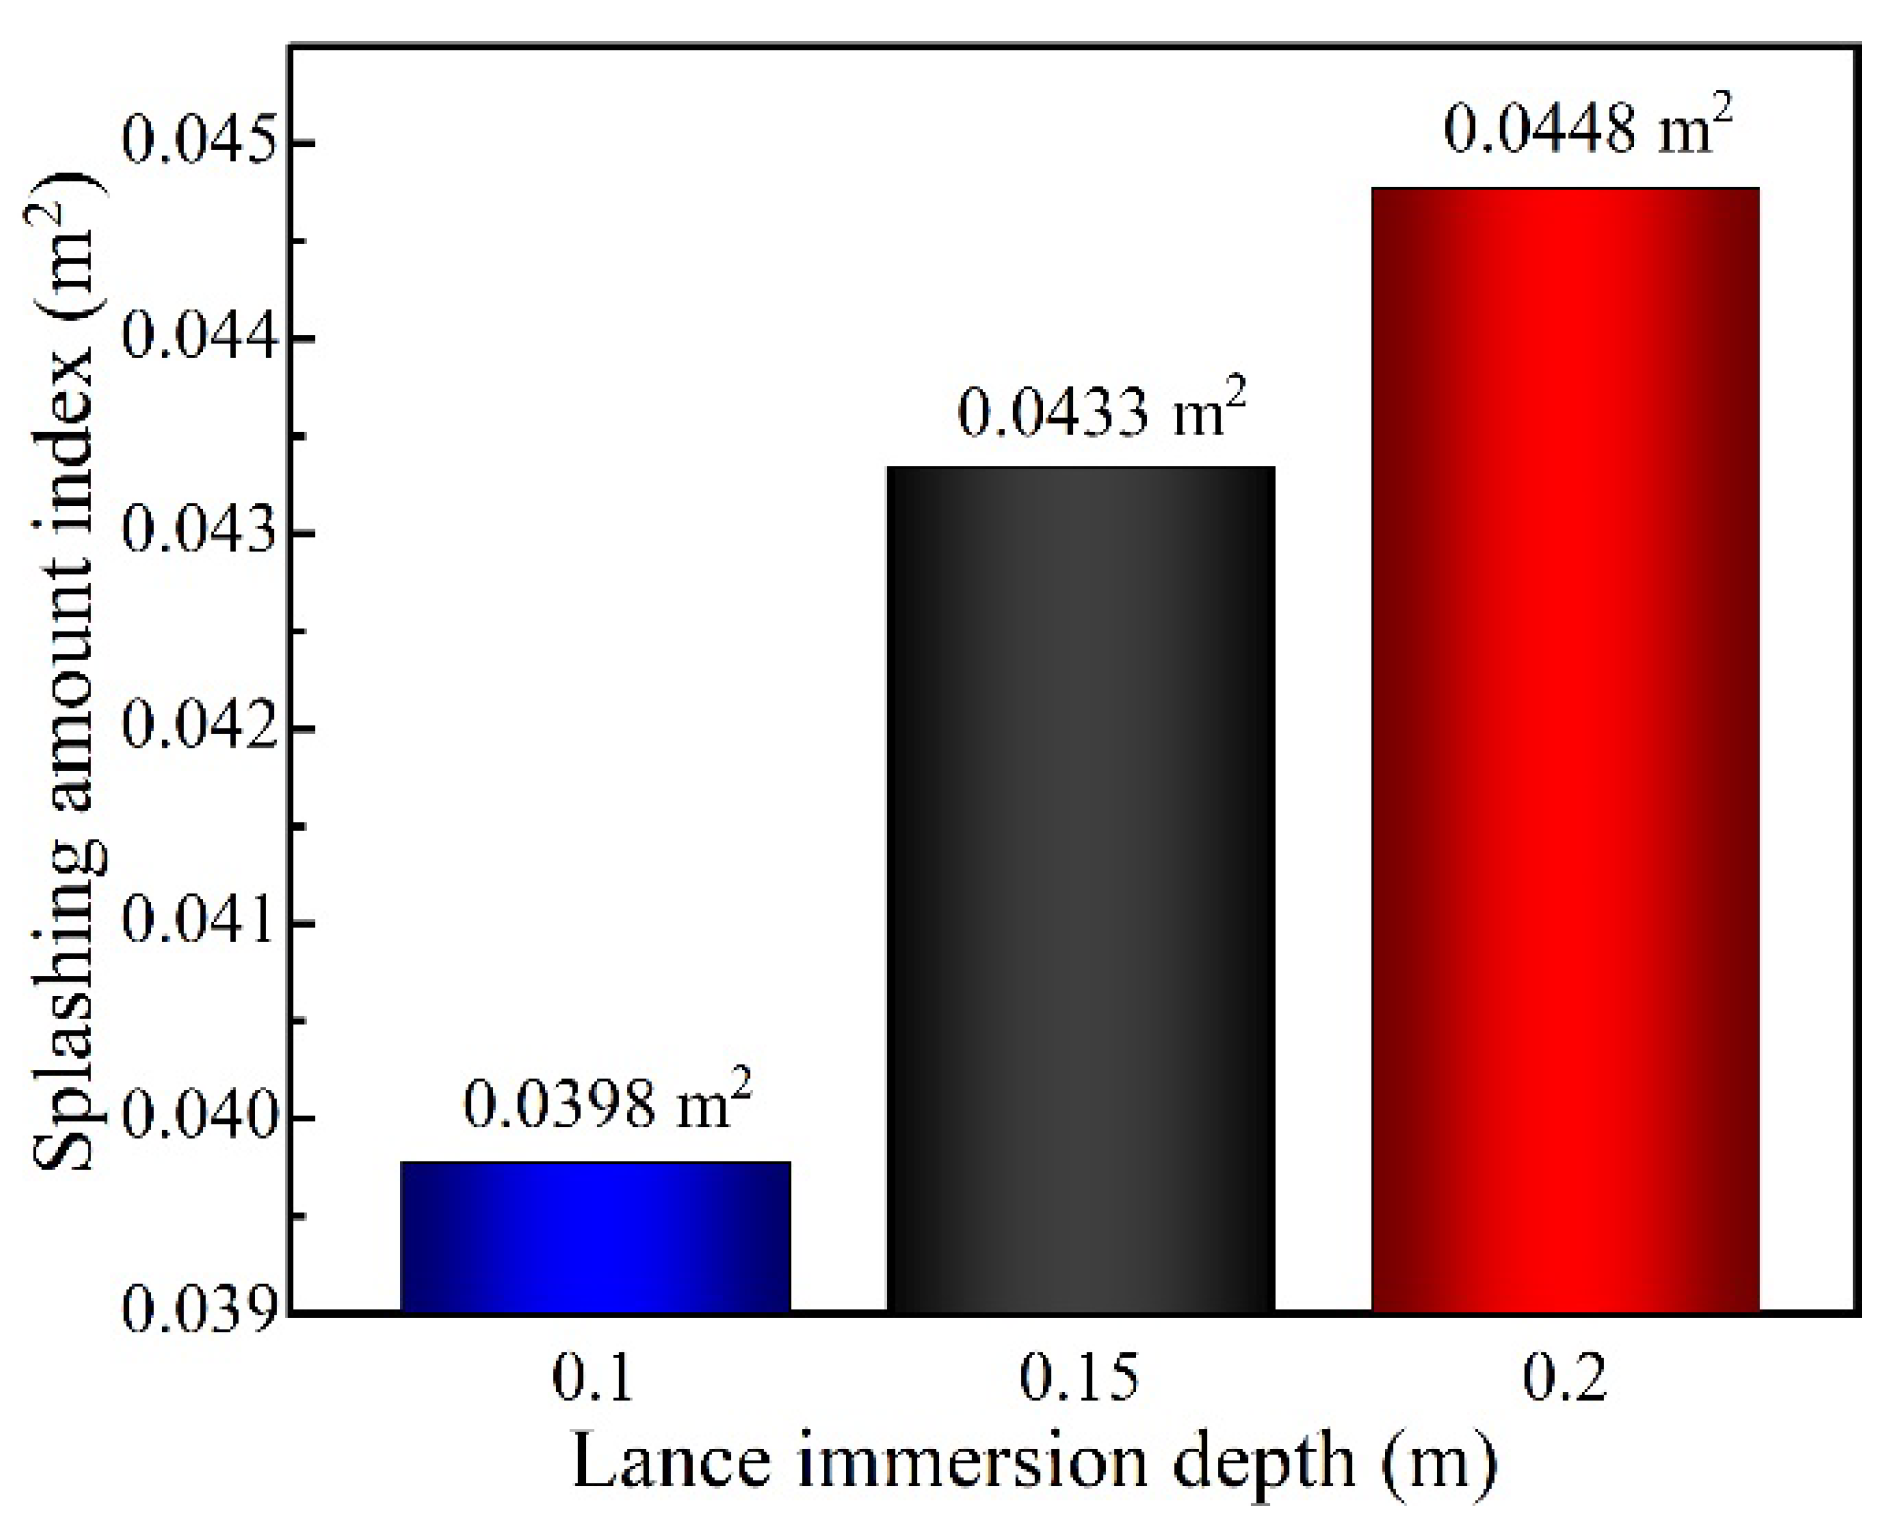
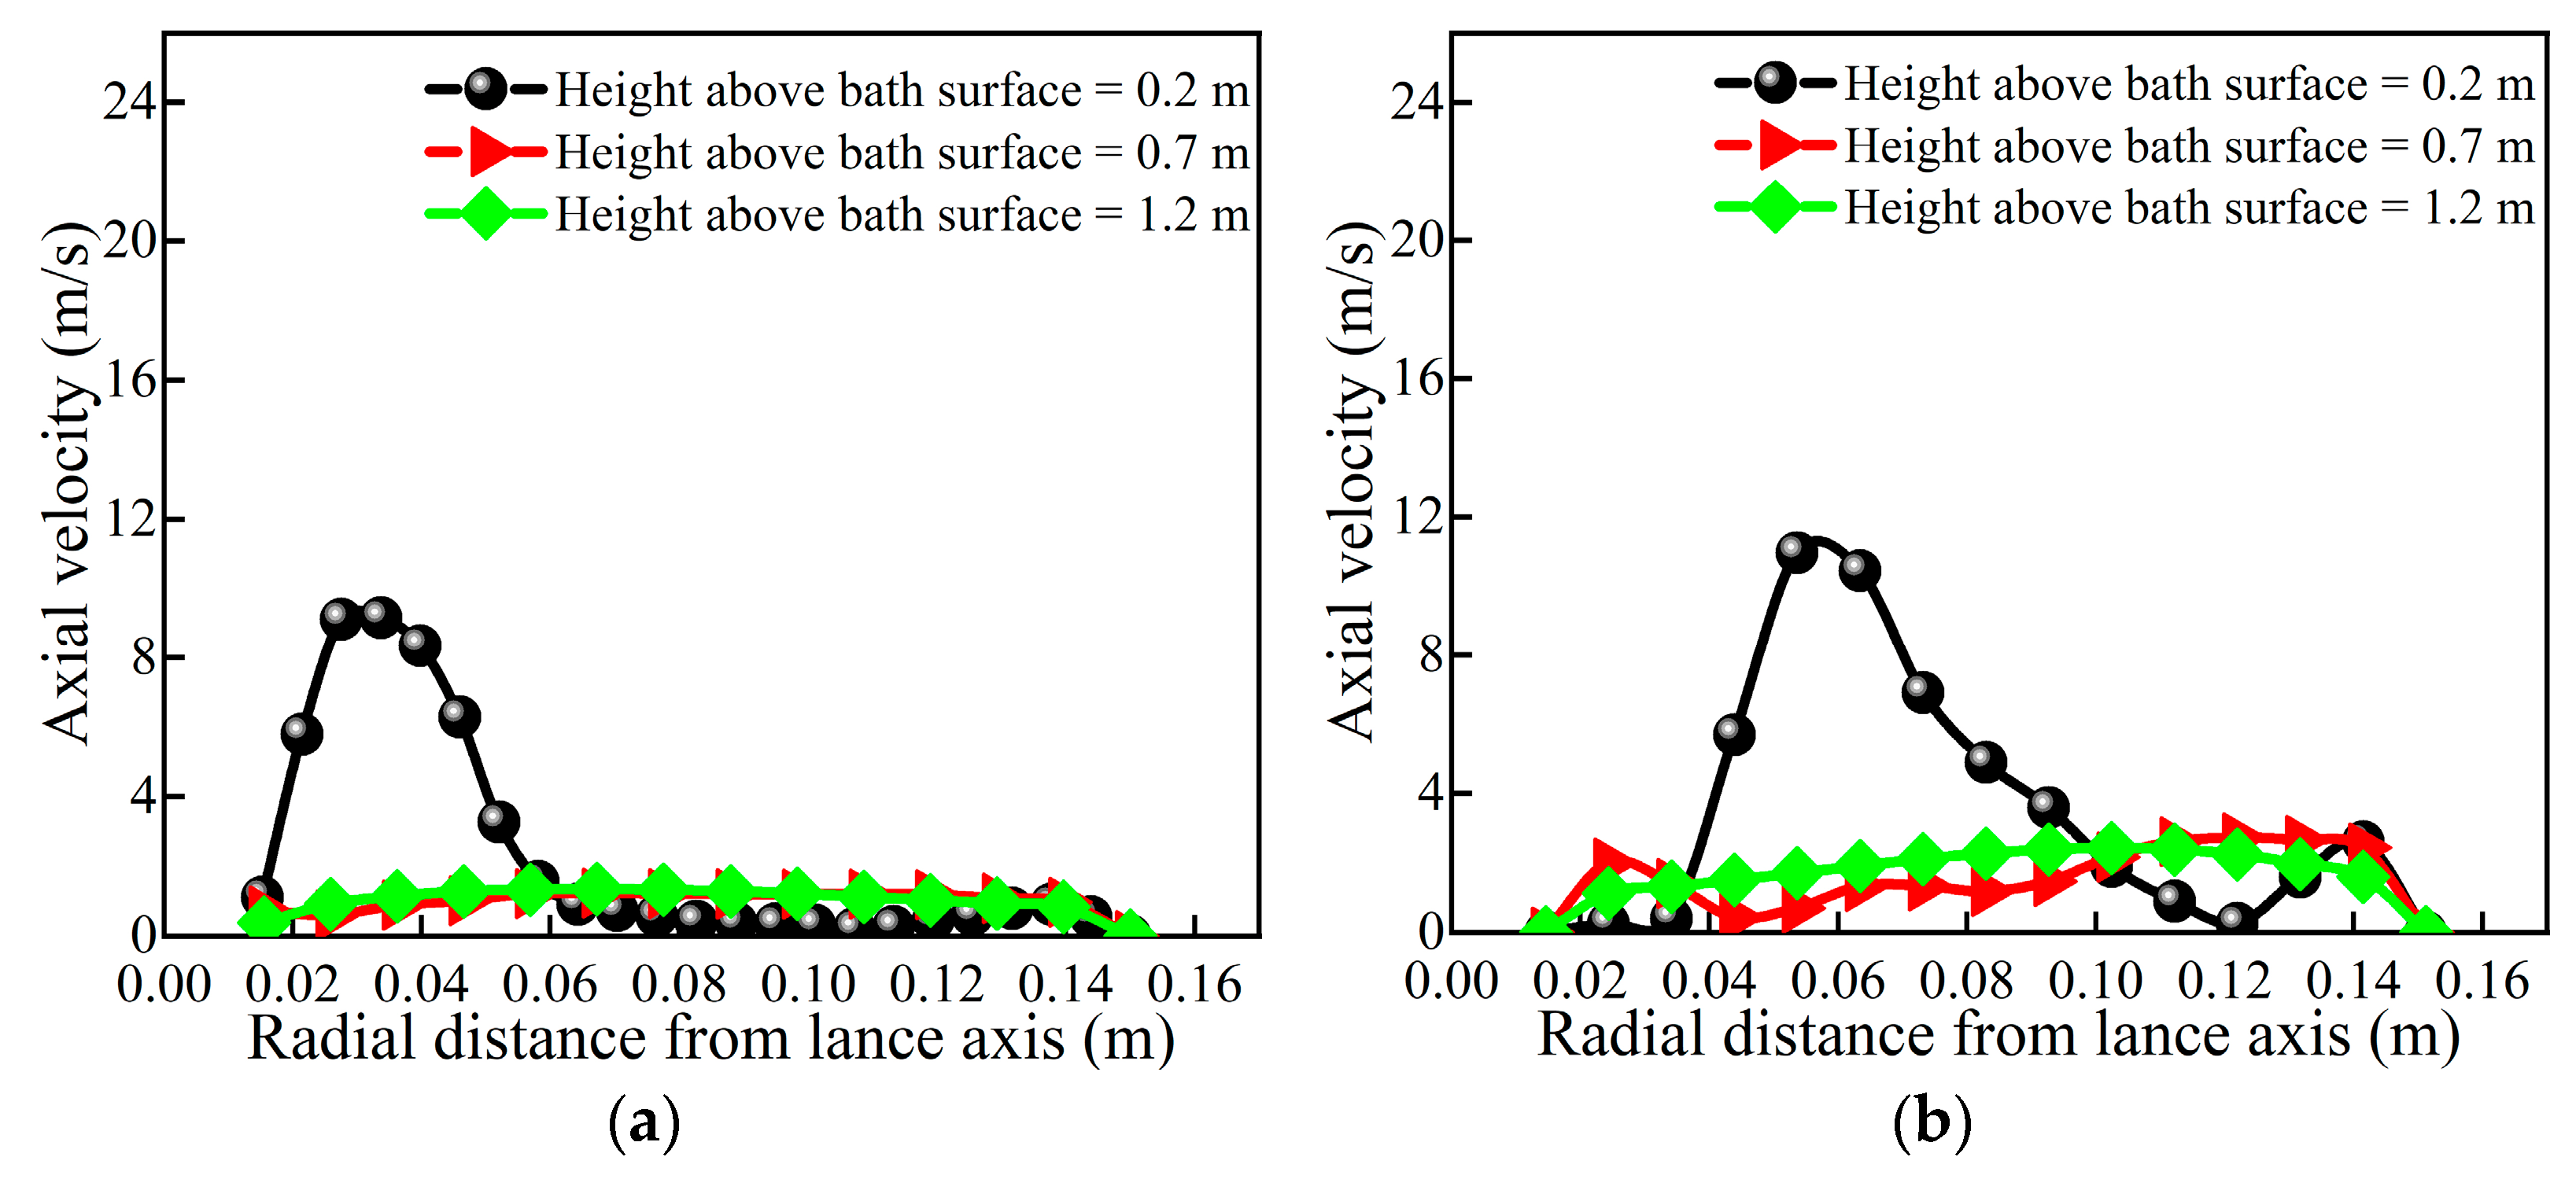
3.3.1. Influence of Lance Immersion Depth on Splash Amount and Distribution
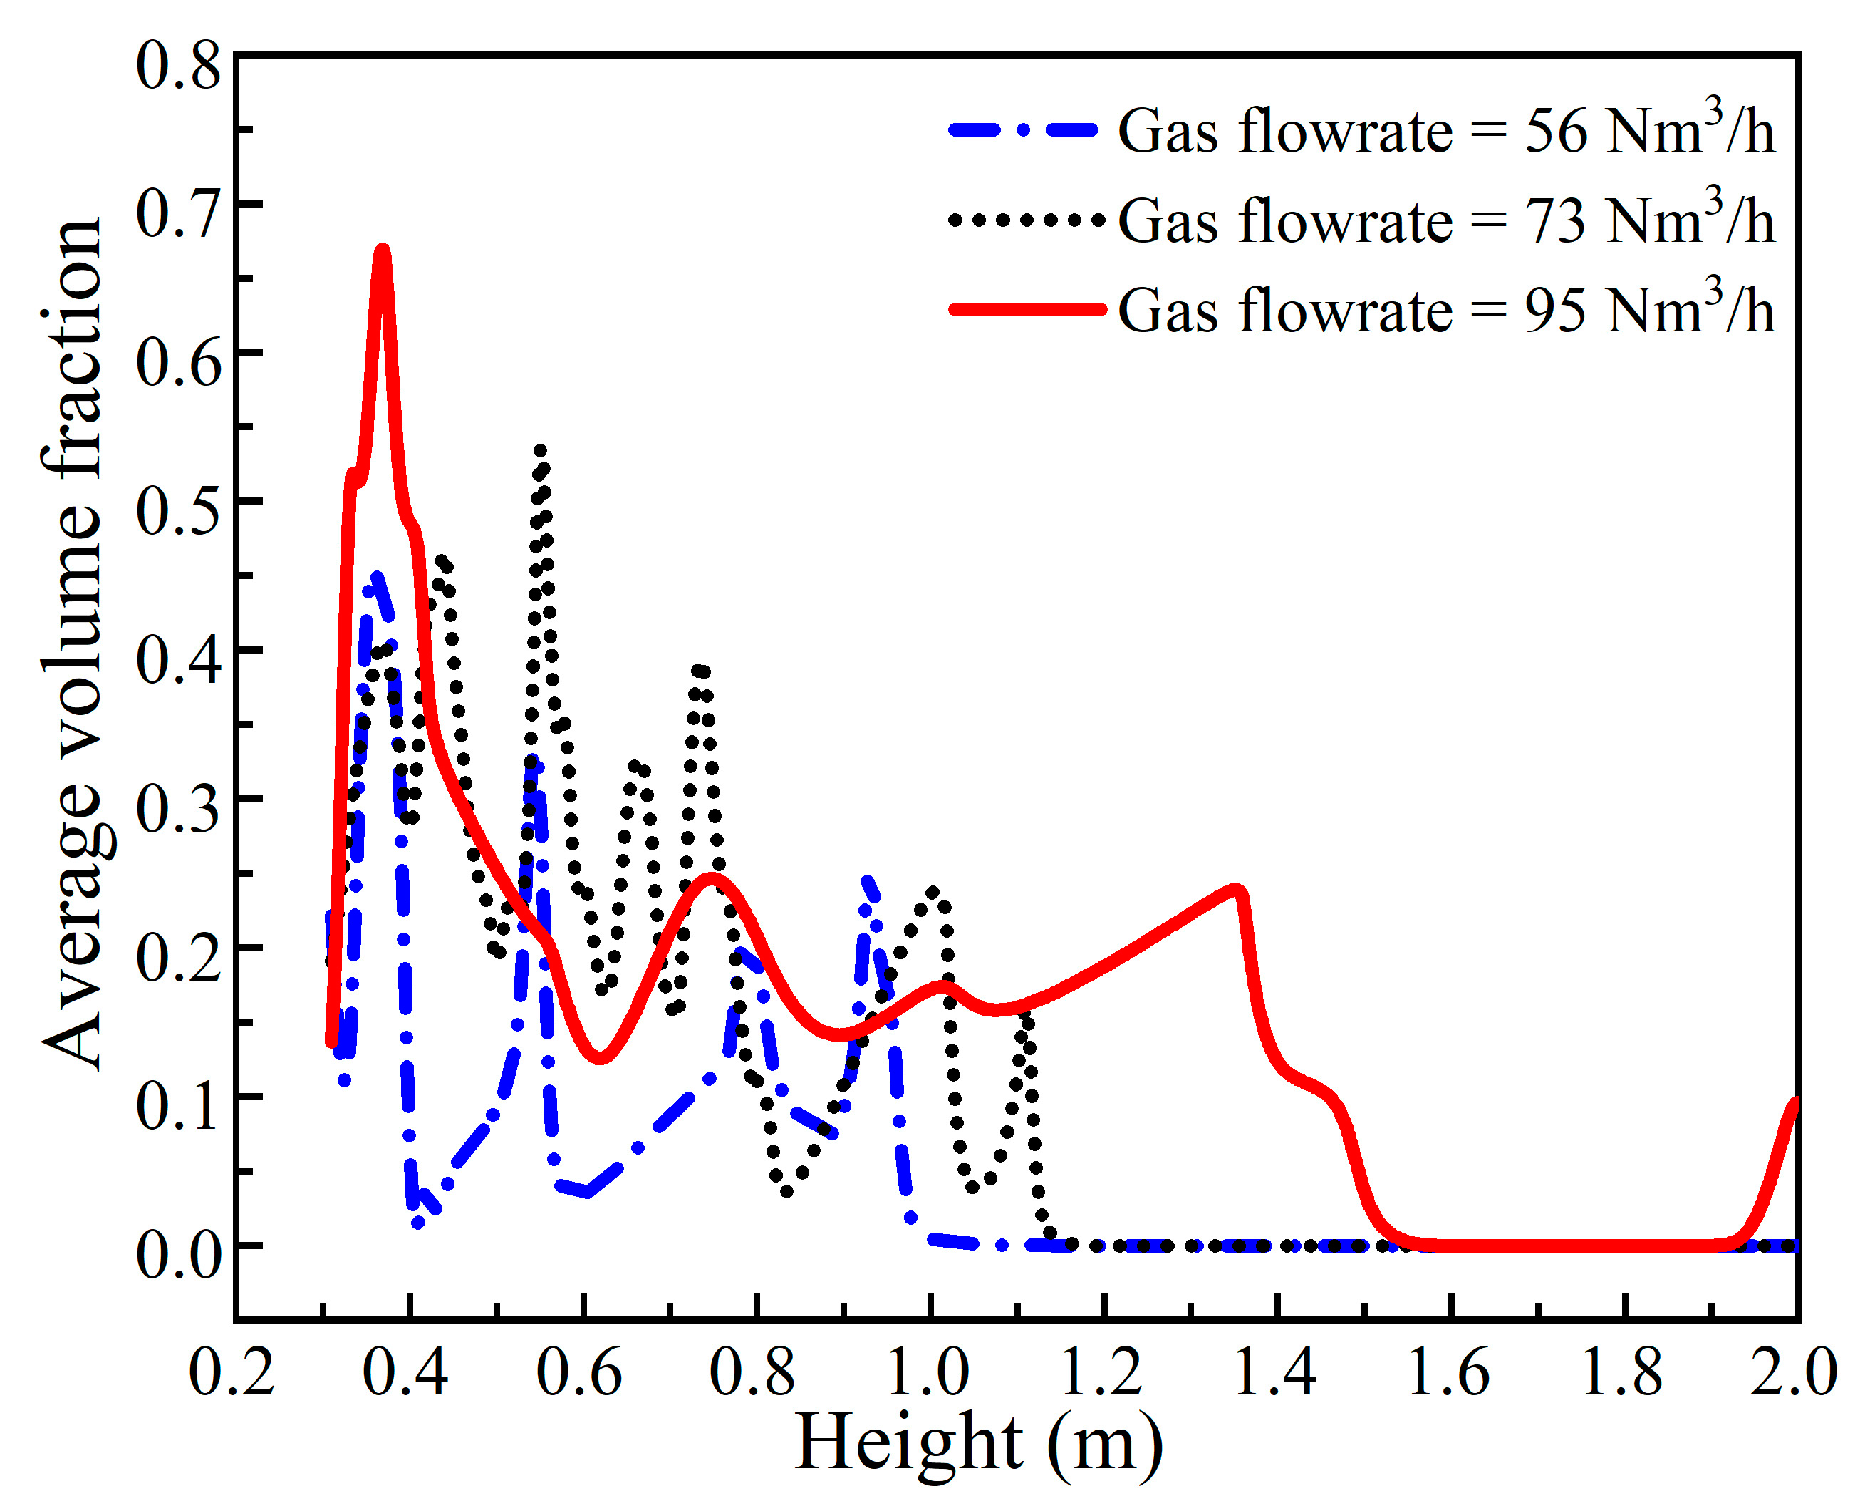
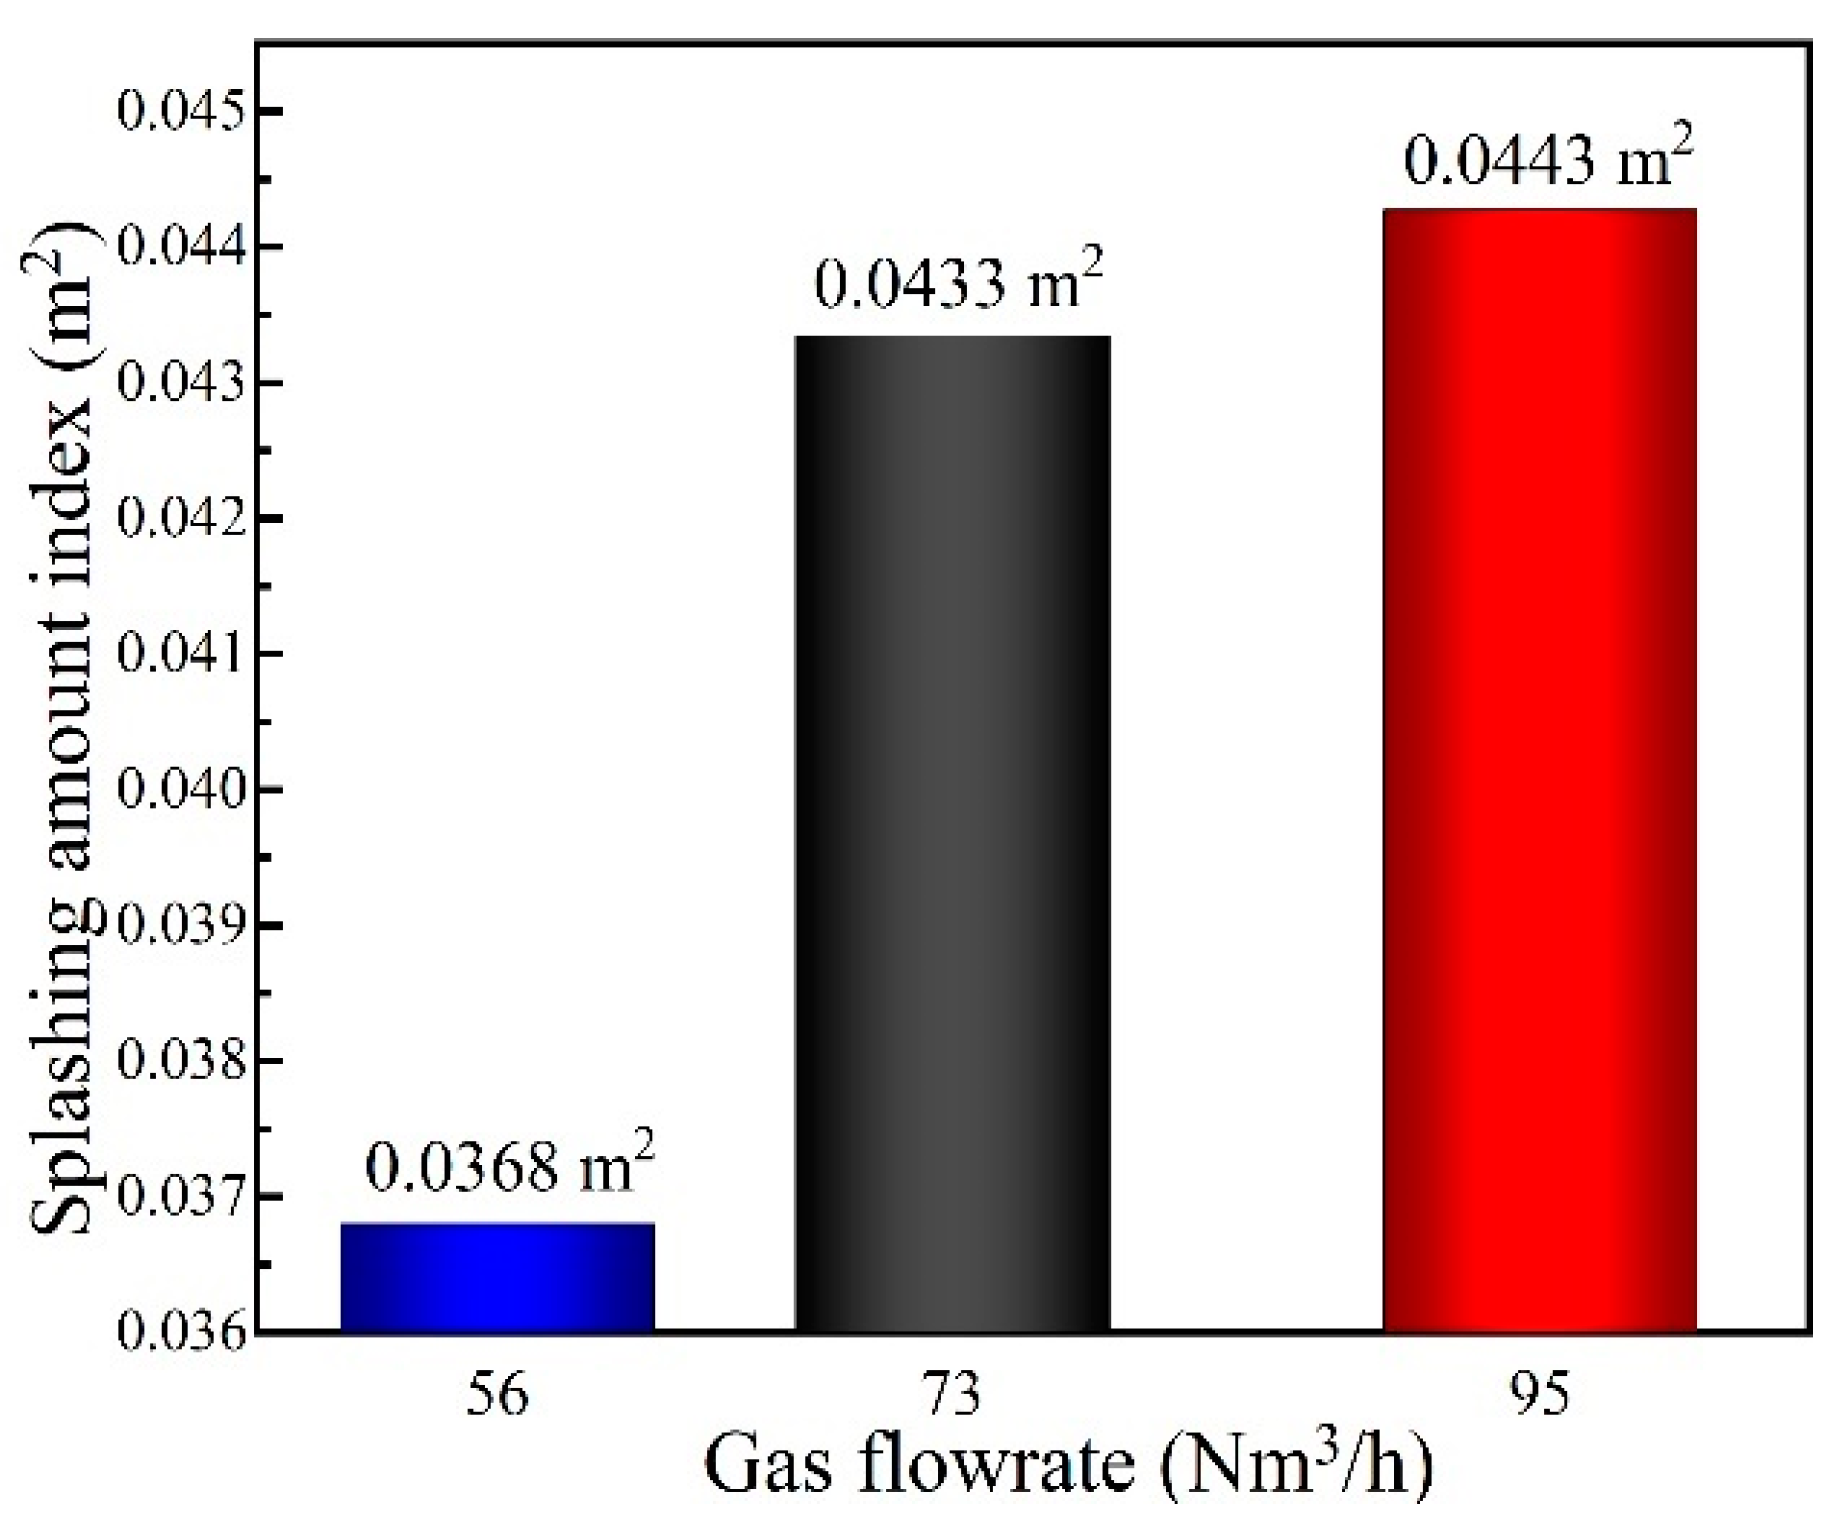
3.3.2. Influence of Injection Gas Flowrate on Splash Amount and Distribution
3.4. Influence of Operation Parameters on Heat Transfer
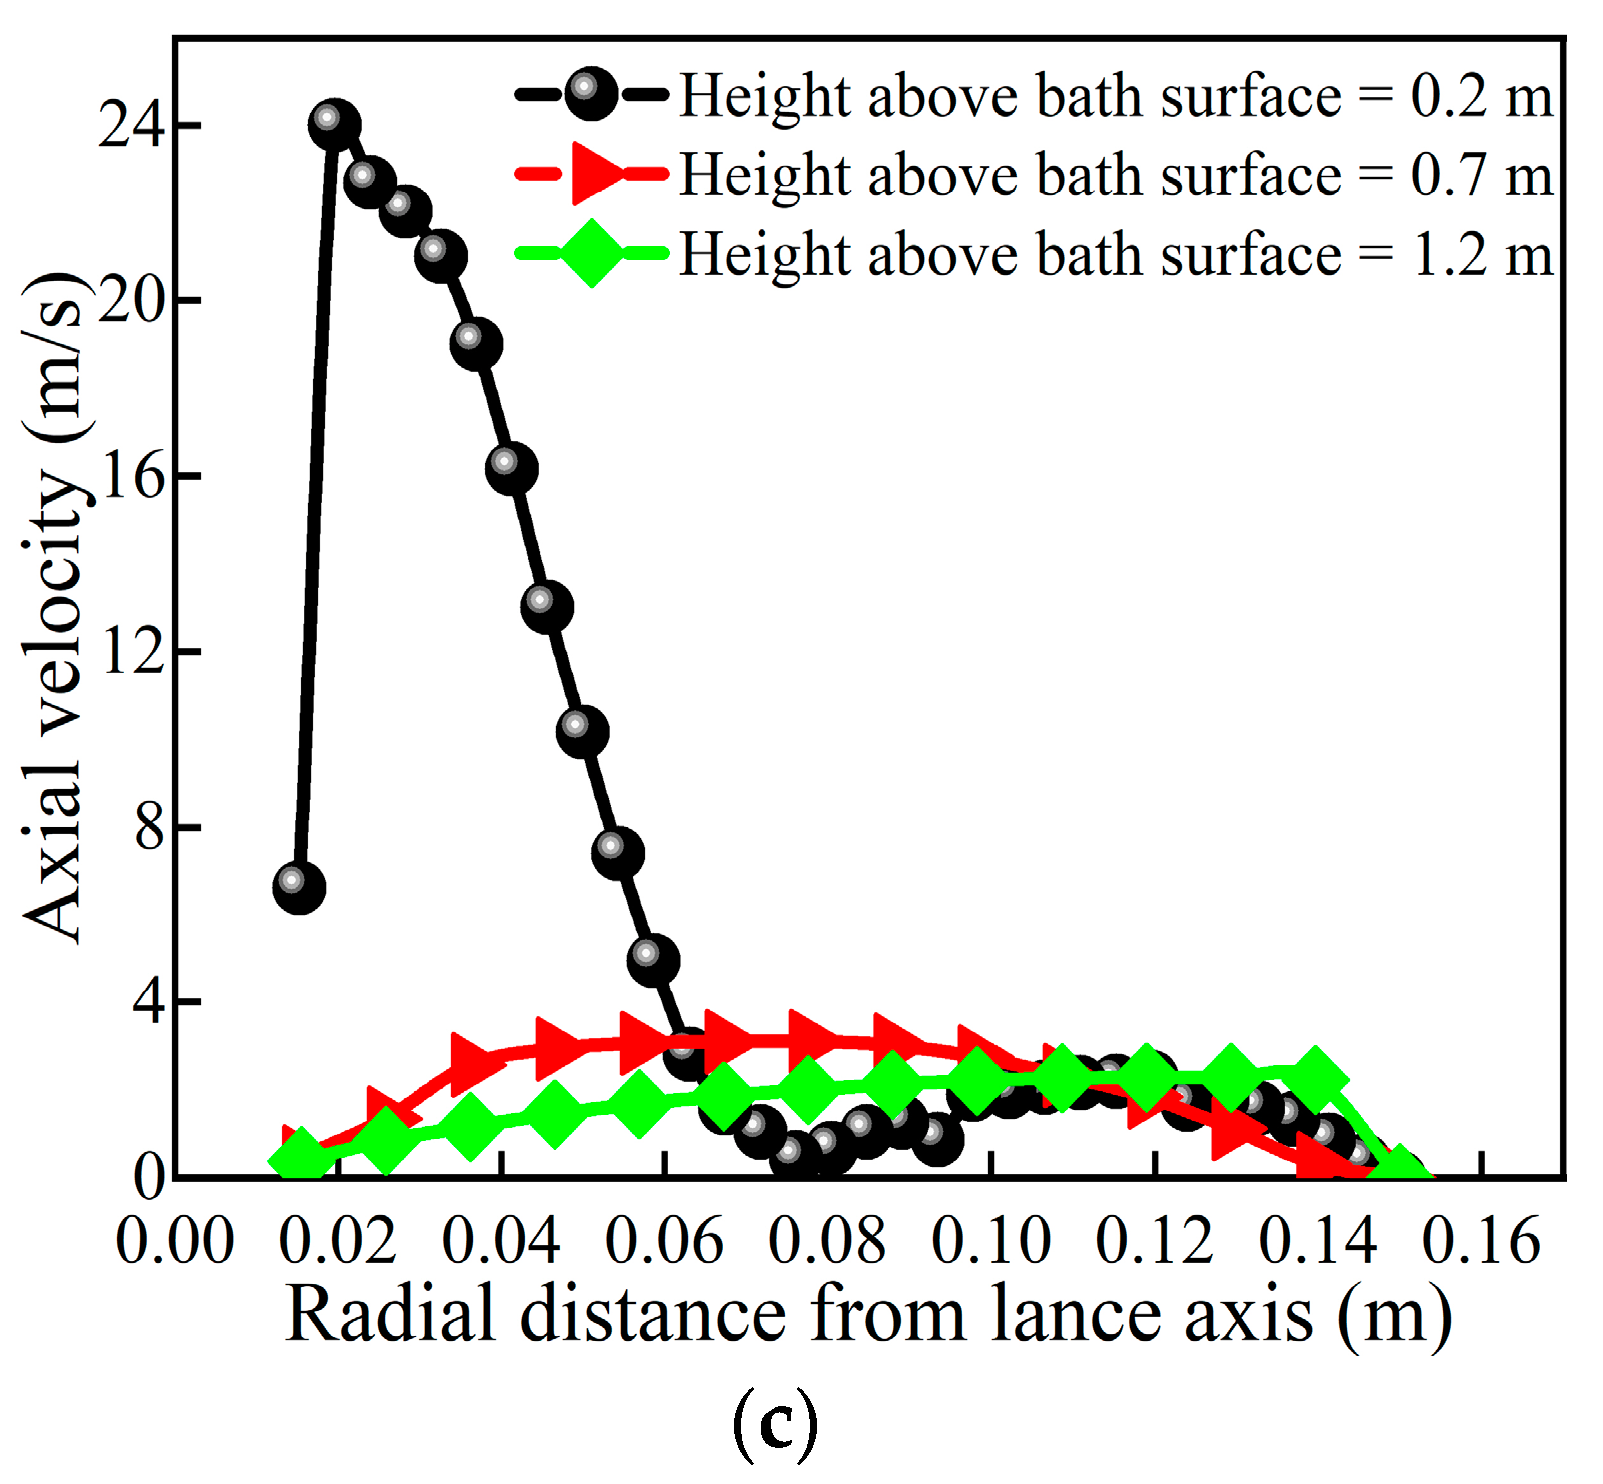
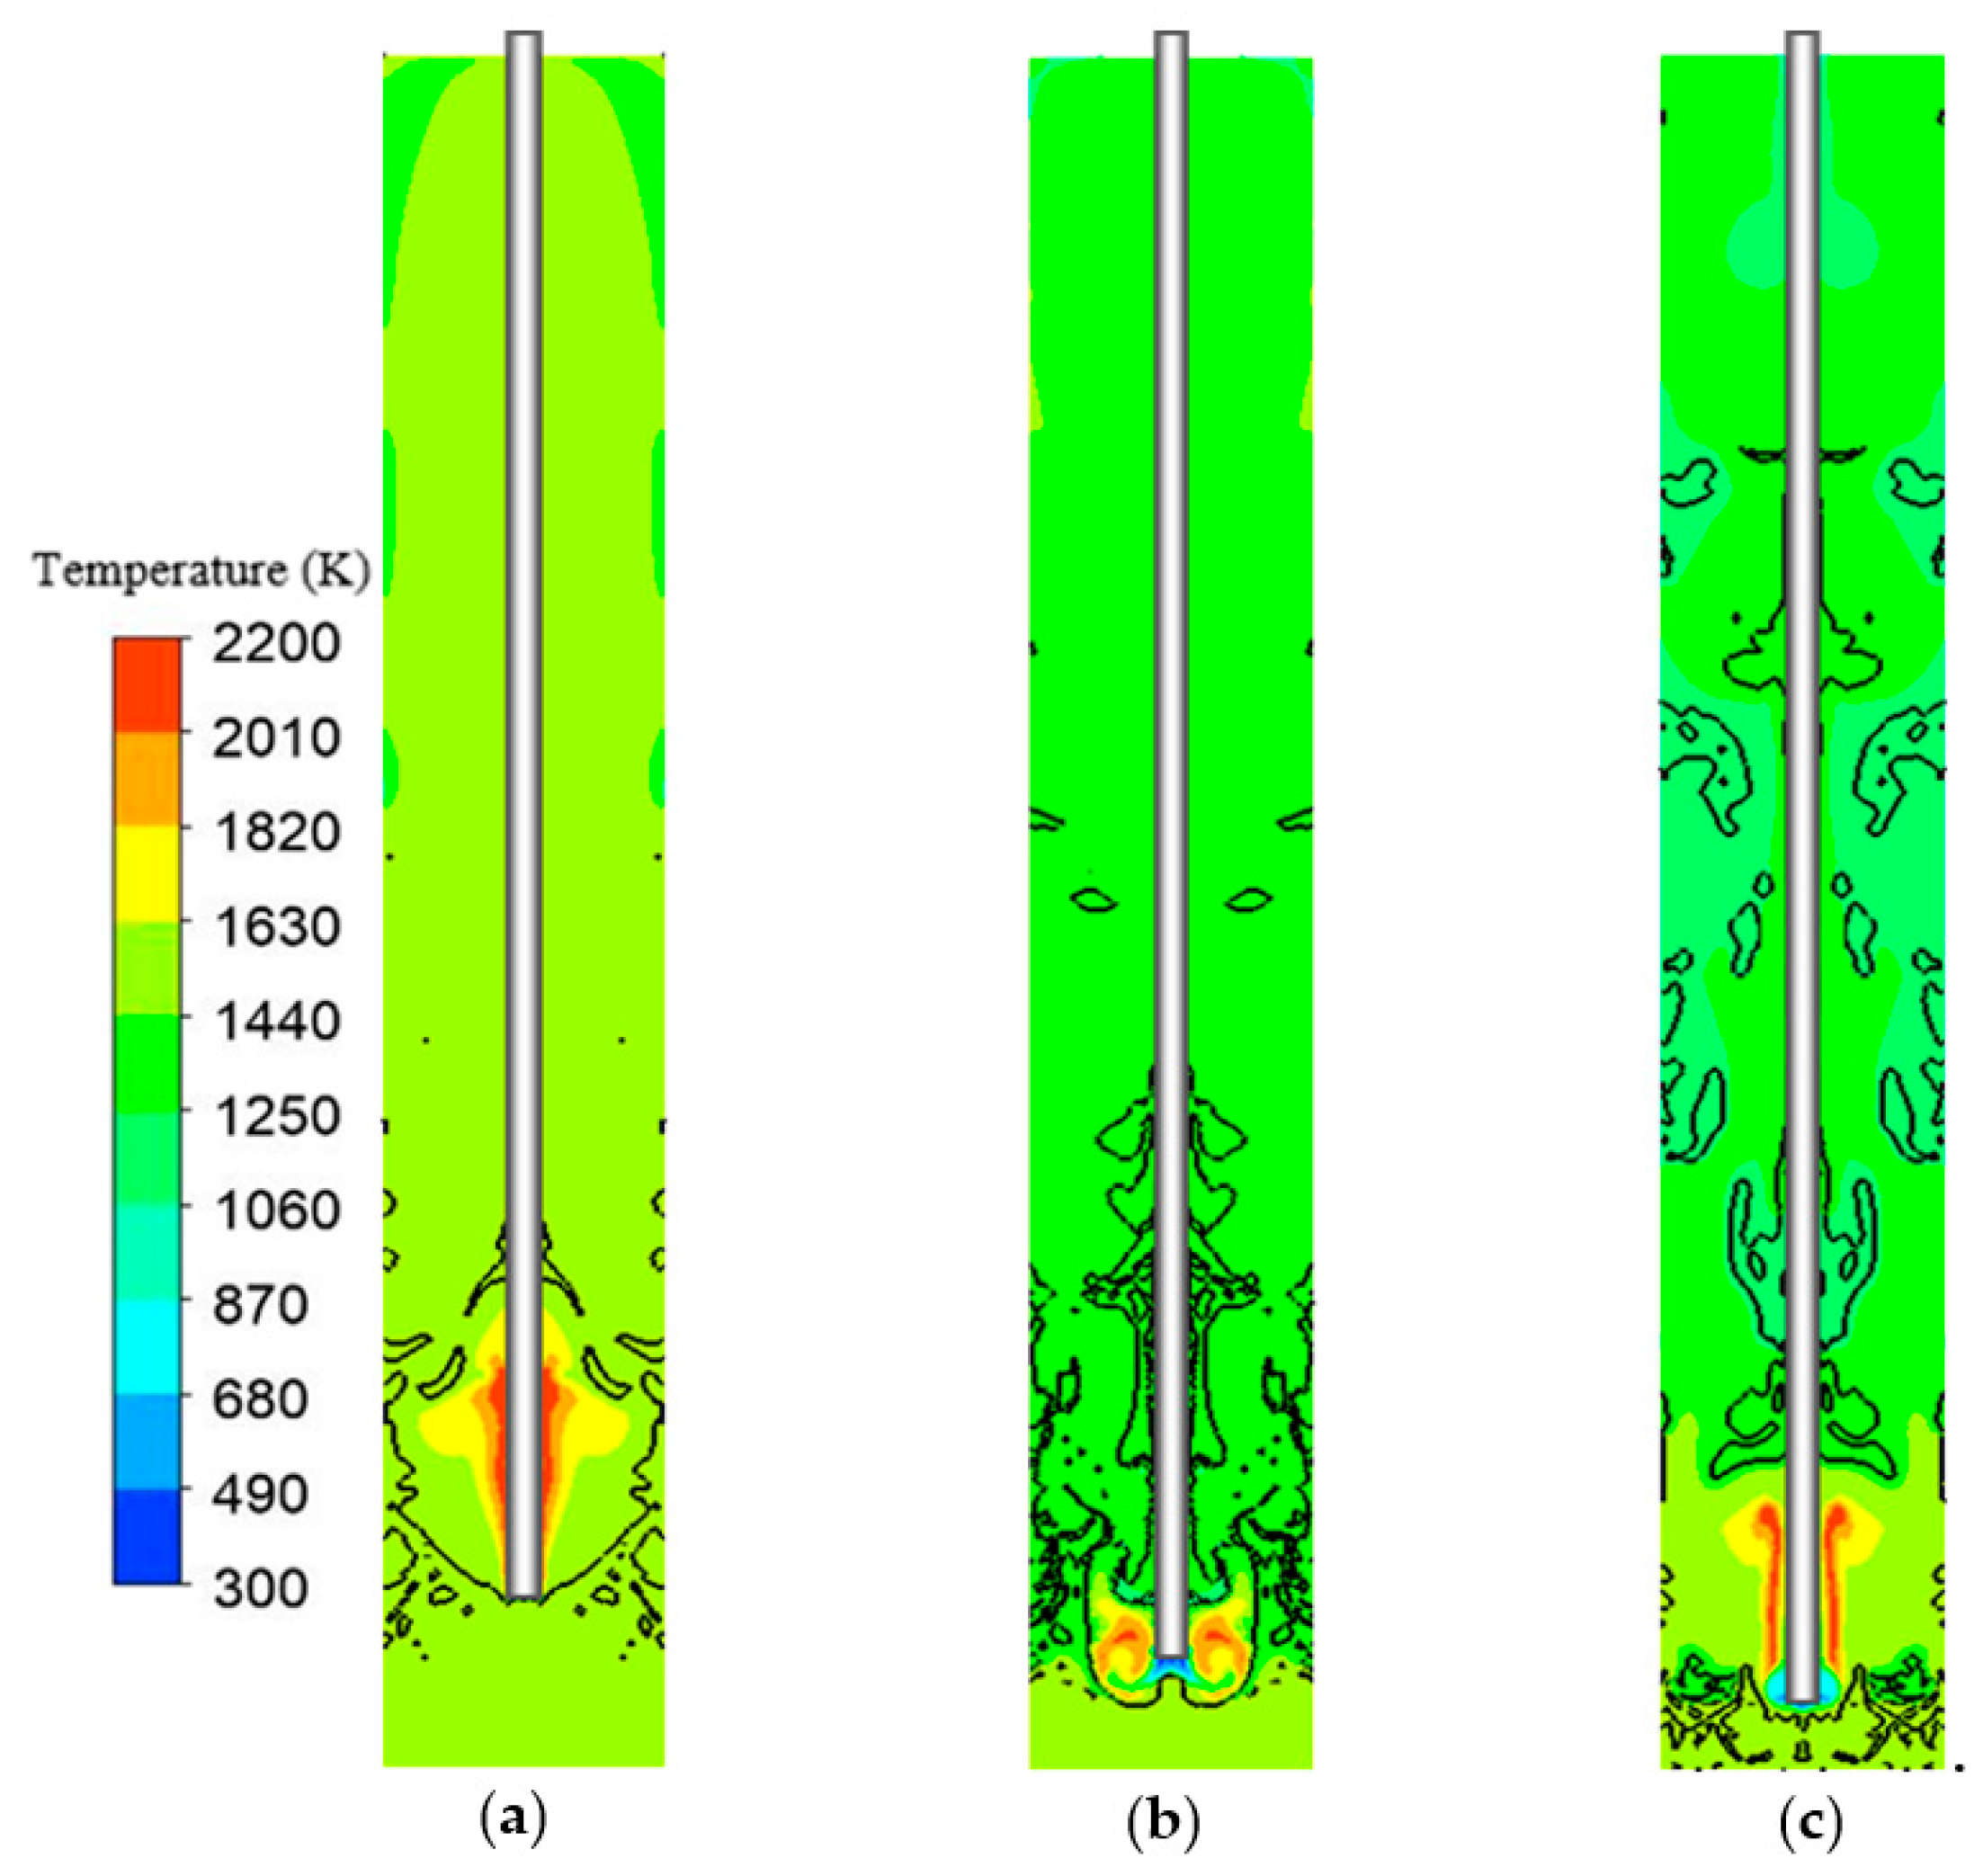
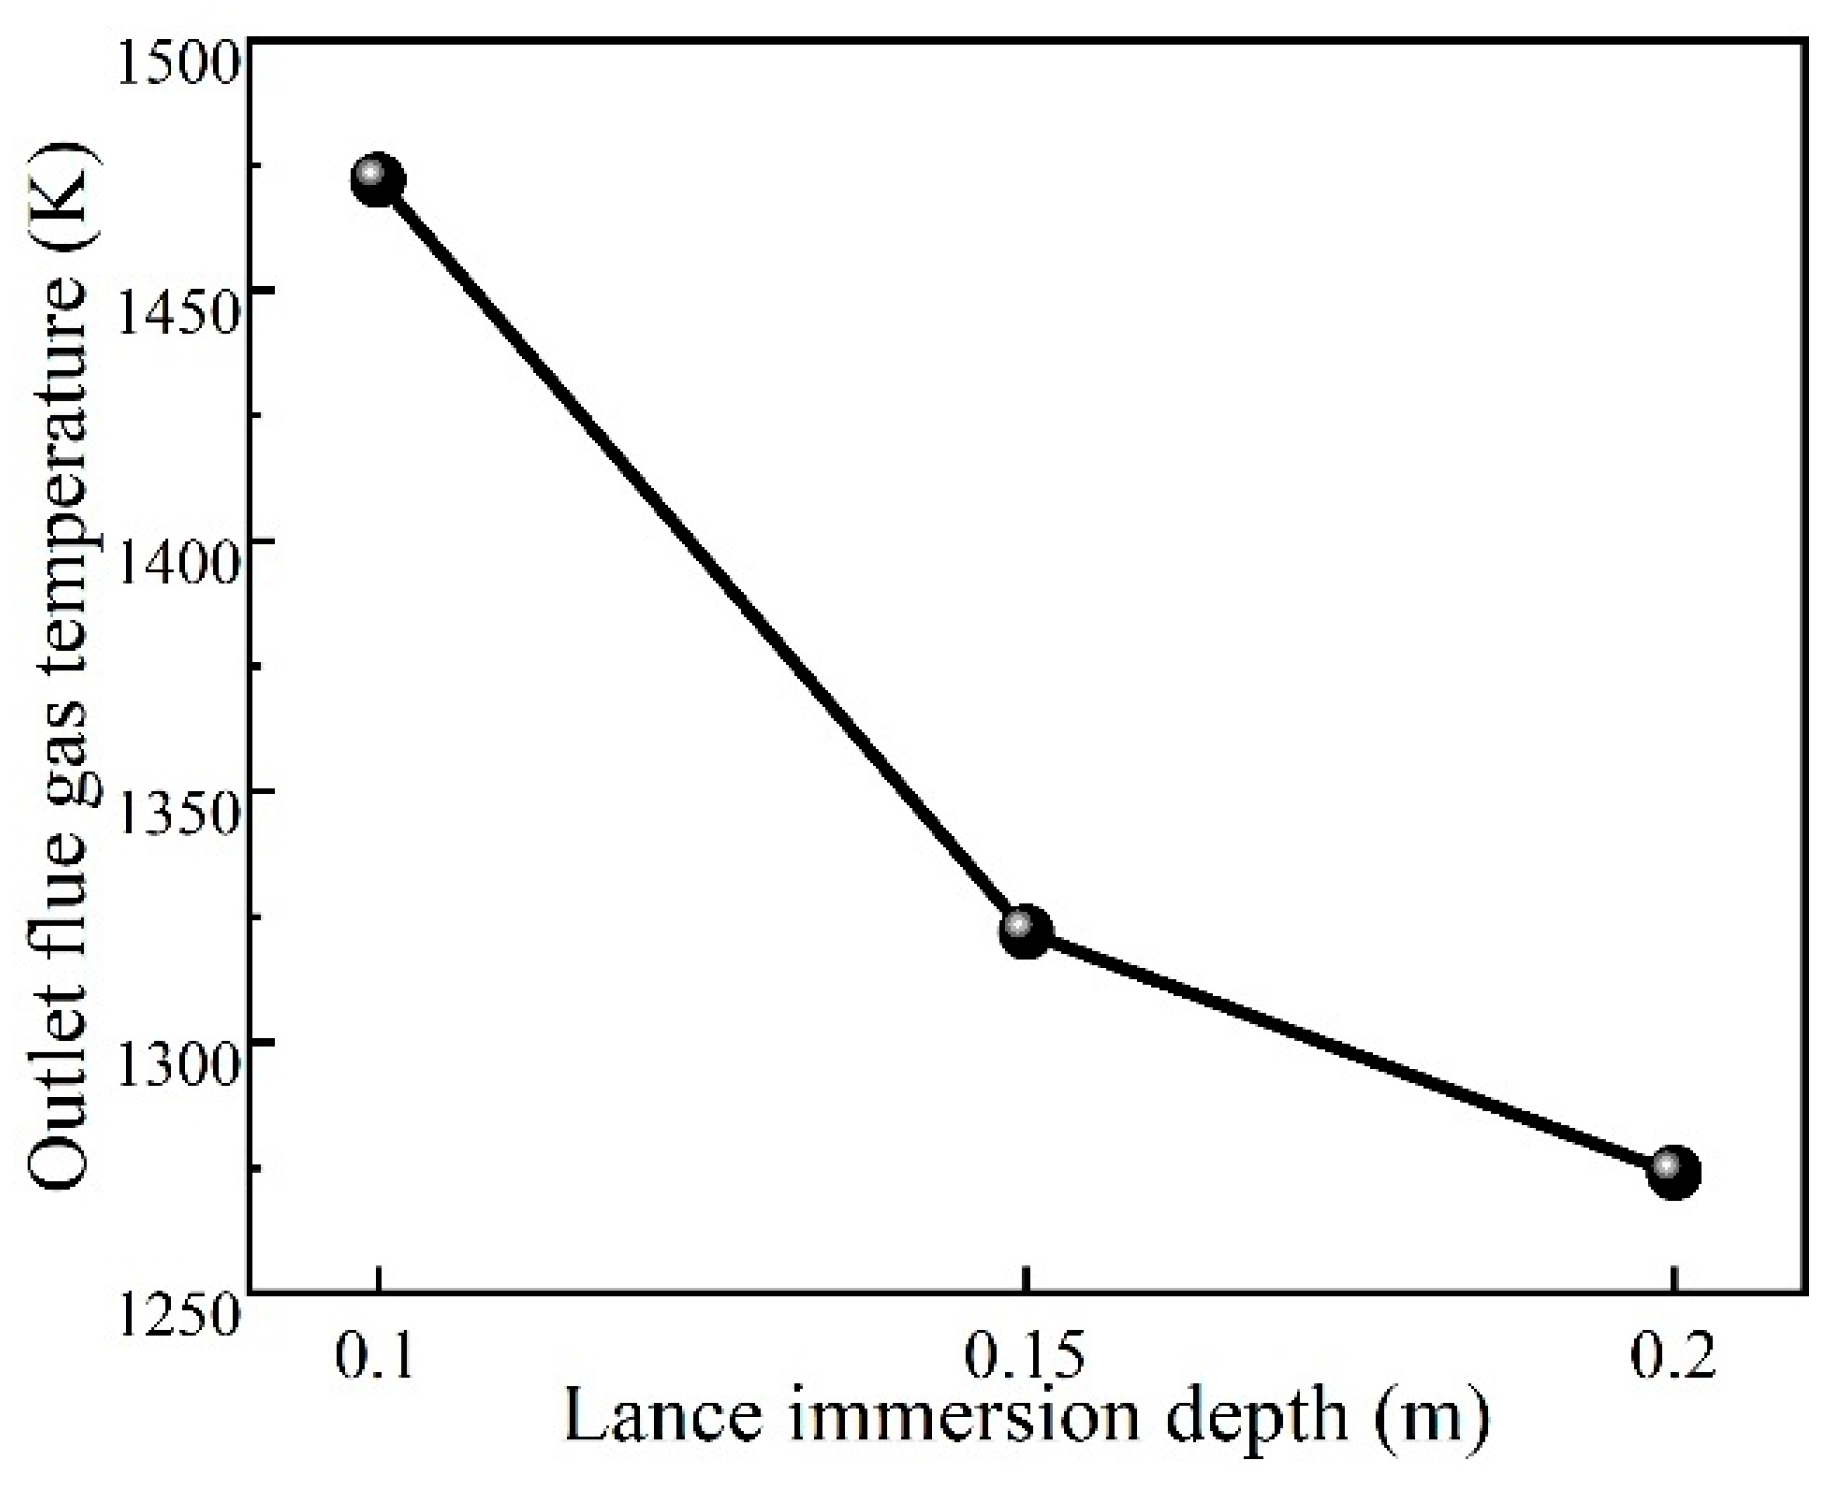
3.4.1. Influence of Lance Immersion Depth on Temperature Field
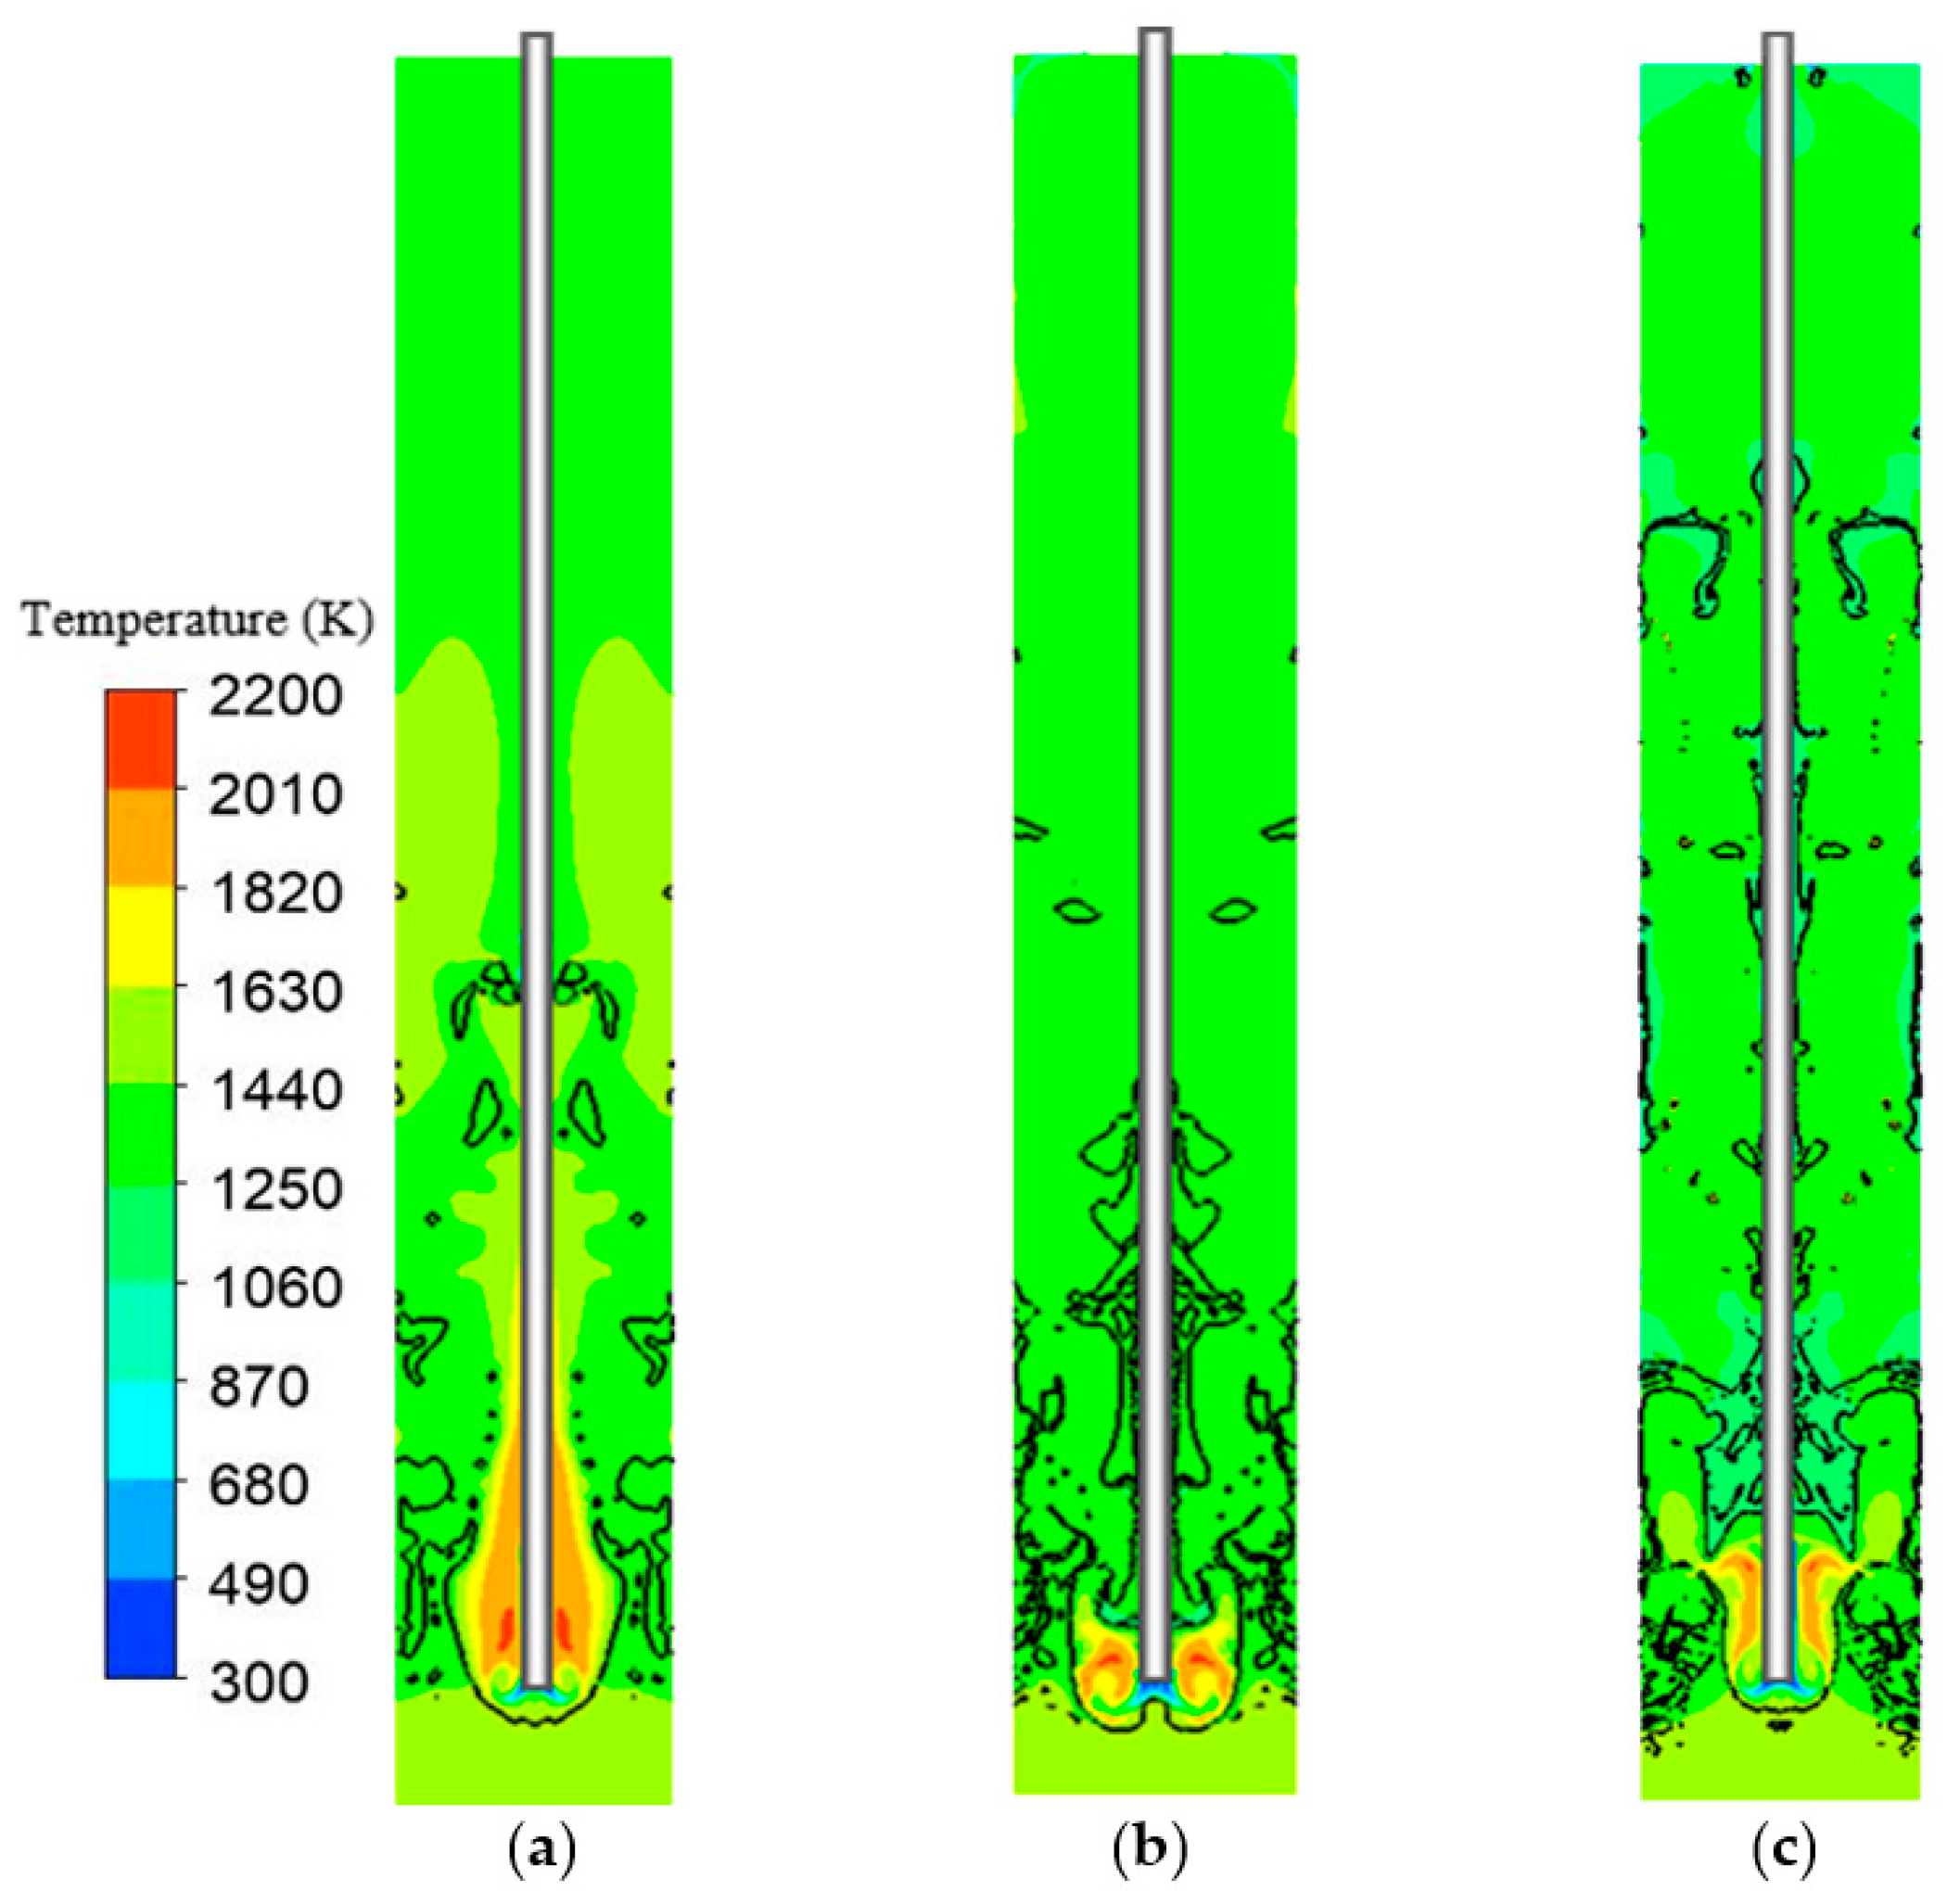
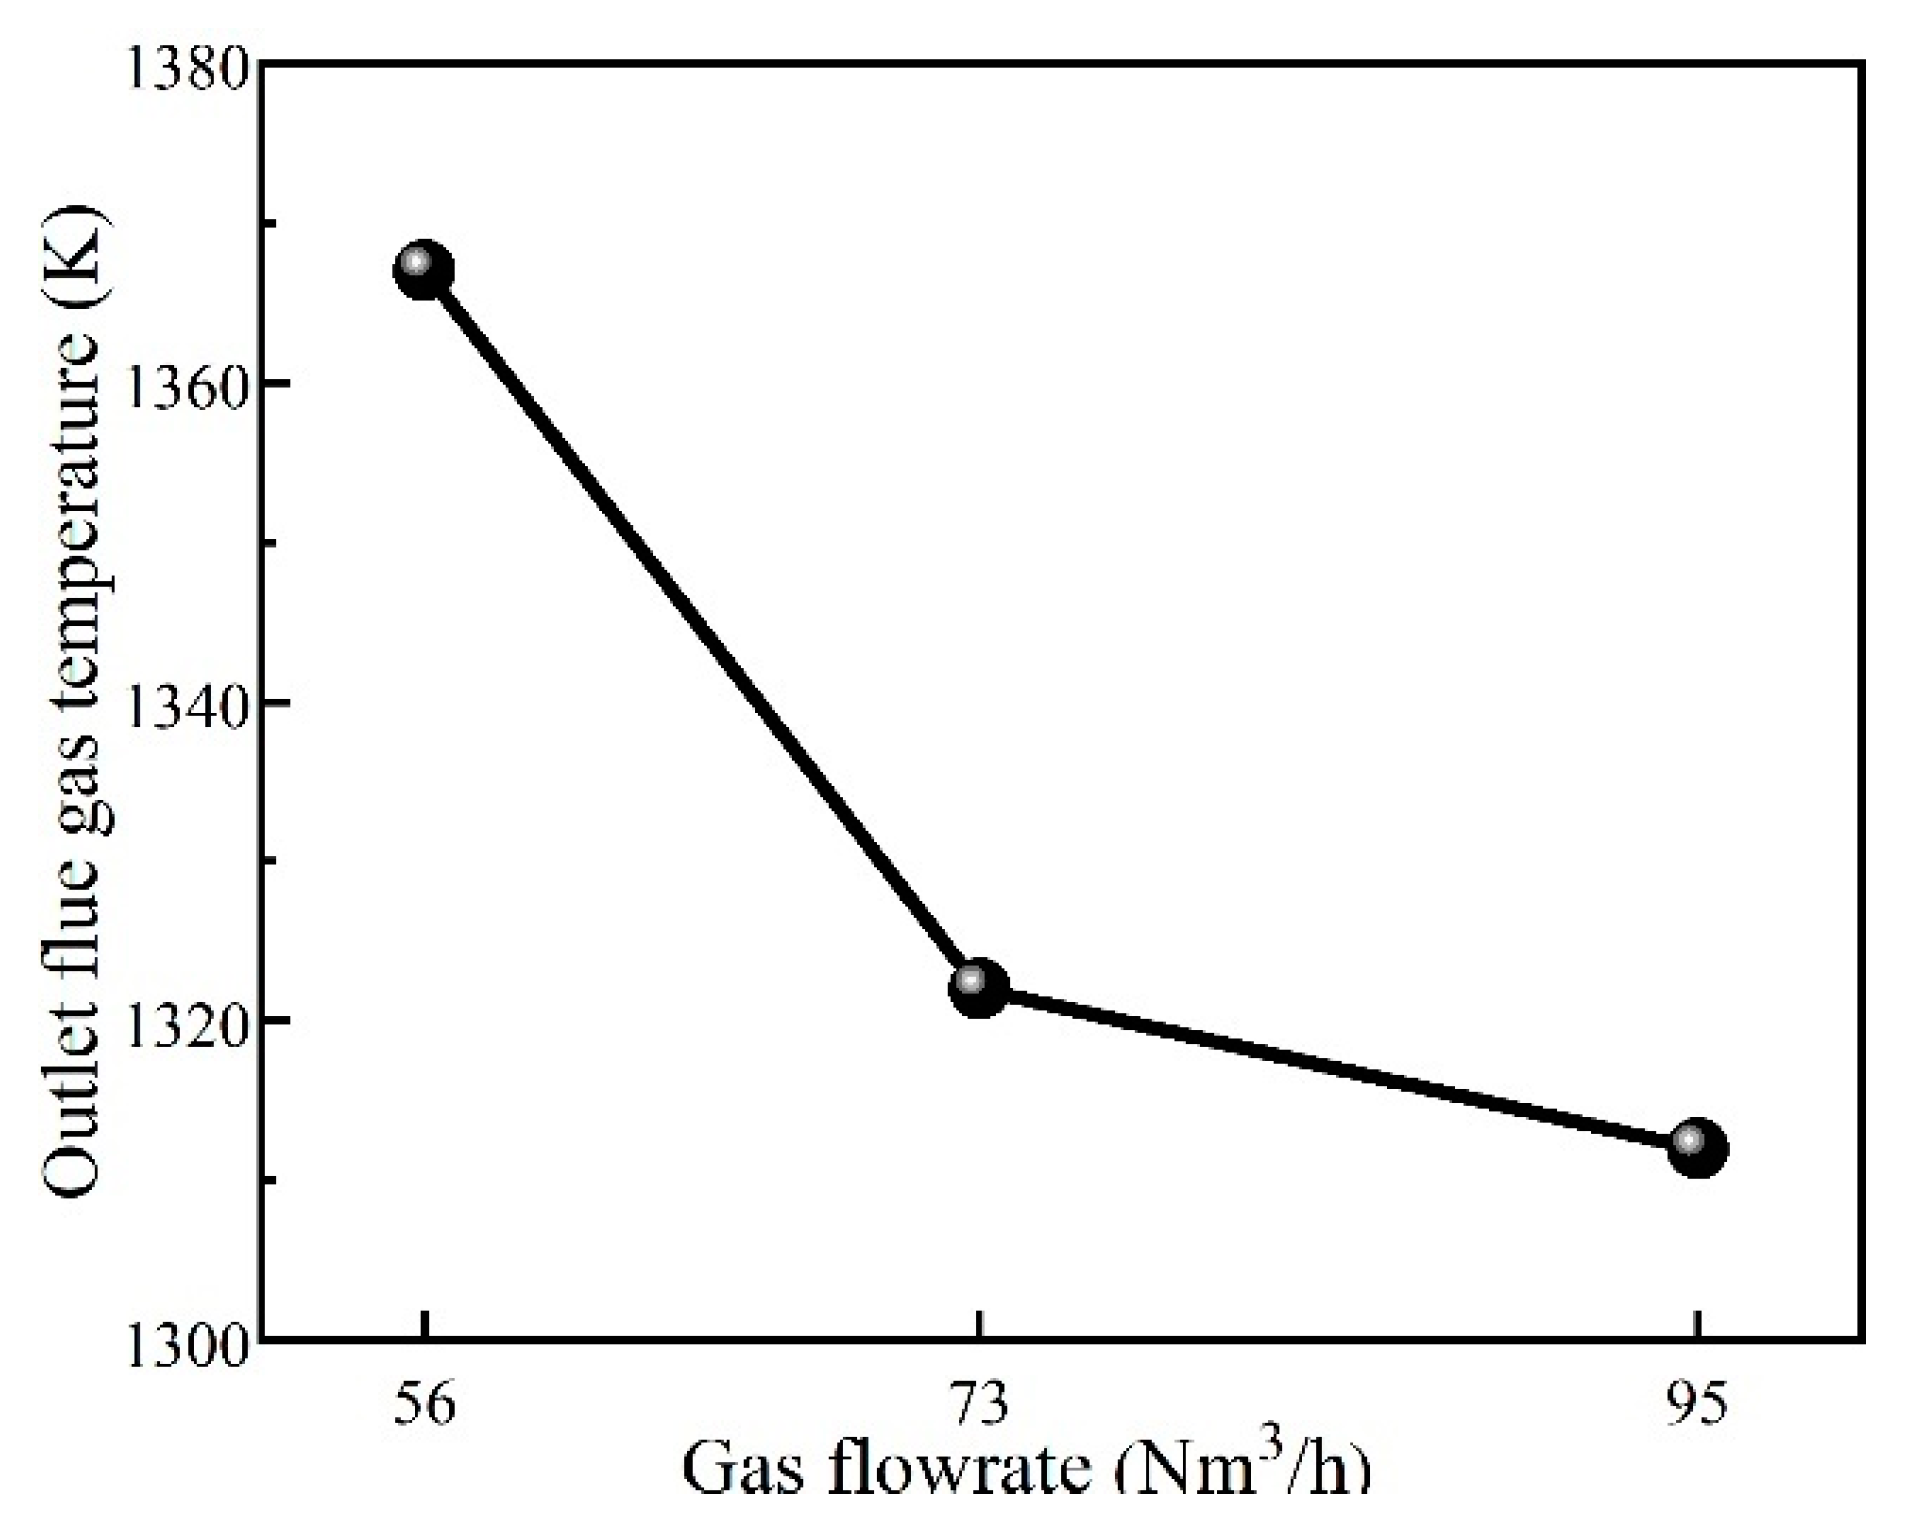
3.4.2. Influence of Injection Gas Flowrate on Temperature Field
3.5. Model Limitations
4. Conclusions
- Compared with cold simulation systems of TSL furnaces, the bubbles generated in high temperature systems due to combustion are much larger and the splash height when the bubbles break is much higher than that of the cold system under the same operating conditions.
- With the increase of the lance immersion depth, the gas injection and combustion impacts on larger volumes of the slag bath and thus intensifies bath agitation, leaving less dead zone. Accordingly, more slag splashes can be generated with more uniform distribution in the furnace top space above the bath; this will lead to more efficient heat transfer between the splashed slag and the high-temperature flue gas, so that heat transfer efficiency in the furnace is improved.
- With the increase of injection gas flowrate, the slag splash amount first increases significantly and then its effect on the splash amount becomes weak. When the injection gas flowrate is larger than a critical level, its effect on bath stirring becomes limited, leaving a relatively larger dead zone in the bath.
- Too low injection gas flowrate leads to too weak and nonuniform splash generation, whereas too high injection gas flowrate allows short residence time for the flue gas to exchange heat with the splashed slag inside the furnace, both of which result in poor heat transfer efficiency of the furnace. Therefore, there exists an appropriate range in injection gas flowrate for achieving sufficiently high heat transfer efficiency in a TSL furnace.
- The splash amount and distribution inside the furnace top space can be strongly influenced by the lance immersion depth and, to a lesser degree, by the injection gas flowrate, and the maximum splash height and heat transfer can be controlled by adjusting the lance immersion depth and the injection gas flowrate.
Author Contributions
Funding
Data Availability Statement
Acknowledgments
Conflicts of Interest
Nomenclature
| Alphabetic Symbols | |
| A | 4.0 |
| A0 | 4.04 |
| B | 0.5 |
| C1 | model coefficient |
| C2 | model constant |
| C1ε | model constant |
| Dm,i | mass diffusion coefficient for species i in the mixture (m2/s) |
| DT,i | thermal diffusion coefficient for species i in the mixture (m2/s) |
| E | specific internal energy (J/kg) |
| F | volumetric force due to surface tension (N/m3) |
| g | acceleration due to gravity (m/s2) |
| Gk | turbulent kinetic energy generation rate (W/m3) |
| Gb | turbulent kinetic energy generation rate due to buoyancy (W/m3) |
| diffusion flux of species i (kg/(m2·s)) | |
| k | turbulent kinetic energy (m2/s2) |
| Mw,I | molecular weight of species i (kg/kmol) |
| Mw,j | molecular weight of species j (kg/kmol) |
| N | total number of chemical species in the system |
| p | pressure (Pa) |
| Ri | net rate of production of species i by chemical reaction (kg/(m3·s)) |
| Ri,r | rate of production of species i limited by turbulent diffusion of reactants (kg/(m3·s)) |
| Ri,p | rate of production of species i limited by turbulent diffusion of products (kg/(m3·s)) |
| Sh | source term (W/m3) |
| Si | rate of creation by addition from the dispersed phase (kg/(m3·s)) |
| Sct | turbulent Schmidt number, whose default value is 0.7 |
| t | time (s) |
| v | velocity vector (m/s) |
| YM | rate of sink of turbulent kinetic energy due to the fluctuating dilatation in compressible turbulence (W/m3) |
| Yi | mass faction of species i |
| YR | mass fraction of a reactant species |
| YP | mass fraction of a product species |
| Greek Symbols | |
| αq | volume fraction of phase q |
| ε | dissipation rate of turbulent kinetic energy (m2/s3) |
| λeff | effective thermal conductivity (W/(m·K)) |
| μ | molecular viscosity (Pa·s) |
| μt | turbulent viscosity (Pa·s) |
| stoichiometric coefficient for reactant i in reaction r | |
| stoichiometric coefficient for product j in reaction r | |
| stoichiometric coefficient for reactant R in reaction r | |
| σk | Prandtl number of turbulent kinetic energy |
| σε | Prandtl number of dissipation rate of turbulent kinetic energy |
| ρq | density of phase q (kg/m3) |
| ρ | density of fluid mixture (kg/m3) |
References
- Zhang, J.P. Status and development of metallurgical solid waste resource utilization. Nonferrous Met. Eng. Res. 2020, 41, 39–42. (In Chinese) [Google Scholar]
- Floyd, J.M. Converting an idea into a worldwide business commercializing smelting technology. Met. Mater. Trans. B. 2005, 36, 557–575. [Google Scholar] [CrossRef]
- Hoang, J.; Reuter, M.; Matusewicz, R.; Hughes, S.; Piret, N. Top submerged lance direct zinc smelting. Miner. Eng. 2009, 22, 742–751. [Google Scholar] [CrossRef]
- Bakker, M.L.; Nikolic, S.; Mackey, P.J. ISASMELT™ TSL—Applications for nickel. Min. Eng. 2011, 24, 610–619. [Google Scholar] [CrossRef]
- Degterov, S.A.; Pelton, A.D. A thermodynamic database for copper smelting and converting. Met. Mater. Trans. B. 1999, 30, 661–669. [Google Scholar] [CrossRef]
- Wang, X.; Cao, H. Exploration on industrialization development path of comprehensive utilization of solid waste in iron and steel industry. China Resour. Compr. Util. 2019, 37, 60–62. (In Chinese) [Google Scholar]
- Liovic, P.; Liow, J.L.; Rudman, M.A. Volume of Fluid (VOF) method for the simulation of metallurgical flows. ISIJ Int. 2001, 41, 225–233. [Google Scholar] [CrossRef] [Green Version]
- Liovic, P.; Rudman, M.; Liow, J.L. Numerical modelling of free surface flows in metallurgical vessels. Appl. Math. Model. 2002, 26, 113–140. [Google Scholar] [CrossRef]
- Pan, Y.; Langberg, D. Two-dimensional physical and CFD modelling of large gas bubble behaviour in bath smelting furnaces. J. Comput. Multip. Flows. 2010, 2, 151–164. [Google Scholar] [CrossRef]
- Wang, S.B.; Wang, H.; Xu, J.X.; Zhu, D.F.; Sun, H.; Li, H.J. Hot-state numerical simulation study on top-blown bath in Isa furnace. Adv. Mater. Res. 2011, 383–390, 7406–7412. [Google Scholar] [CrossRef]
- Huda, N.; Naser, J.; Brooks, G.; Reuter, M.; Matusewicz, R. CFD modeling of swirl and nonswirl gas injections into liquid baths using top submerged lances. Met. Mater. Trans. B 2009, 41, 35–50. [Google Scholar] [CrossRef]
- Huda, N.; Naser, J.; Brooks, G.; Reuter, M.A.; Matusewicz, R.W. Computational fluid dynamic modeling of zinc slag fuming process in top-submerged lance smelting furnace. Met. Mater. Trans. B. 2011, 43, 39–55. [Google Scholar] [CrossRef]
- Kolczyk, E.; Miczkowski, Z.; Czernecki, J. Influence of selected parameters on phenomena of two-phase flow and heat ex-change in TSL furnace—numerical investigation. Int. J. Numer. Methods Heat Fluid Flow. 2017, 27, 2799–2815. [Google Scholar] [CrossRef]
- Yin, P.; Zhao, H.L.; Zhang, L.; Wang, S.; Zhang, J.; Fan, W. Numerical simulation of Isa smelting process with top swirl blowing. J. Mater. Metall. 2017, 16, 104–109. (In Chinese) [Google Scholar]
- Zhao, H.; Lu, T.; Yin, P.; Mu, L.; Liu, F. An experimental and simulated study on gas-liquid flow and mixing behavior in an ISASMELT furnace. Metals 2019, 9, 565. [Google Scholar] [CrossRef] [Green Version]
- Zhao, H.; Xiao, Y.; Liu, F.; Sohn, H.Y. Computational fluid dynamics simulation of gas–matte–slag three-phase flow in an ISASMELT furnace. Met. Mater. Trans. B. 2021, 52, 3767–3776. [Google Scholar] [CrossRef]
- Obiso, D.; Kriebitzsch, S.; Reuter, M.; Meyer, B. The importance of viscous and interfacial forces in the hydrodynamics of the top-submerged-lance furnace. Met. Mater. Trans. B. 2019, 50, 2403–2420. [Google Scholar] [CrossRef] [Green Version]
- Obiso, D.; Akashi, M.; Kriebitzsch, S.; Meyer, B.; Reuter, M.; Eckert, S.; Richter, A. CFD modeling and experimental validation of top-submerged-lance gas injection in liquid metal. Met. Mater. Trans. B. 2020, 51, 1509–1525. [Google Scholar] [CrossRef]
- Sabah, S.; Brooks, G. Splash distribution in oxygen steelmaking. Met. Mater. Trans. B. 2014, 46, 863–872. [Google Scholar] [CrossRef]
- Hirt, C.W.; Nichols, B.D. Volume of fluid (VOF) method for the dynamics of free boundaries. J. Comput. Phys. 1981, 39, 201–225. [Google Scholar] [CrossRef]
- Brackbill, J.U.; Kothe, D.B.; Zemach, C. A continuum method for modeling surface tension. J. Comput. Phys. 1992, 100, 335–354. [Google Scholar] [CrossRef]
- Shih, T.H.; Liou, W.W.; Shabbir, A.; Yang, Z.; Zhu, J. A new k-ε eddy-viscosity model for high Reynolds number turbulent flows. Comput. Fluids. 1995, 24, 227–238. [Google Scholar] [CrossRef]
- ANSYS Inc. ANSYS CFD User’s Manual; ANSYS Inc.: Canonsburg, PA, USA, 2013. [Google Scholar]


| Calculation Case No. | Lance Immersion Depth (m) | Natural Gas Flowrate (Nm3/h) | Air Flowrate (Nm3/h) | Total Gas Flowrate (Nm3/h) |
|---|---|---|---|---|
| 1 | 0.15 | 6 | 50 | 56 |
| 2 | 0.15 | 8 | 65 | 73 |
| 3 | 0.15 | 10 | 85 | 95 |
| 4 | 0.10 | 8 | 65 | 73 |
| 5 | 0.20 | 8 | 65 | 73 |
| Material | Unit | Liquid-Slag | Air | Natural Gas |
|---|---|---|---|---|
| Density ρ | kg/m3 | 2590 | Compressible | Compressible |
| Viscosity μ | Pa·s | 0.269 | 1.79 × 10⁻⁵ | 1.72 × 10⁻⁵ |
| Specific heat capacity Cp | J/(kg·K) | 1945 | 1006.43 | f(T) |
| Thermal conductivity λ | W/(m·K) | 0.269 | 0.0242 | 0.0454 |
Publisher’s Note: MDPI stays neutral with regard to jurisdictional claims in published maps and institutional affiliations. |
© 2022 by the authors. Licensee MDPI, Basel, Switzerland. This article is an open access article distributed under the terms and conditions of the Creative Commons Attribution (CC BY) license (https://creativecommons.org/licenses/by/4.0/).
Share and Cite
Song, C.; Pan, Y.; Ma, P.; Zhao, M.; Liu, T. Numerical Simulation on the Influence of Submerged Combustion on Splashing and Heat Transfer in TSL Furnace. Metals 2022, 12, 328. https://doi.org/10.3390/met12020328
Song C, Pan Y, Ma P, Zhao M, Liu T. Numerical Simulation on the Influence of Submerged Combustion on Splashing and Heat Transfer in TSL Furnace. Metals. 2022; 12(2):328. https://doi.org/10.3390/met12020328
Chicago/Turabian StyleSong, Chen, Yuhua Pan, Ping Ma, Ming Zhao, and Tiancai Liu. 2022. "Numerical Simulation on the Influence of Submerged Combustion on Splashing and Heat Transfer in TSL Furnace" Metals 12, no. 2: 328. https://doi.org/10.3390/met12020328