Article

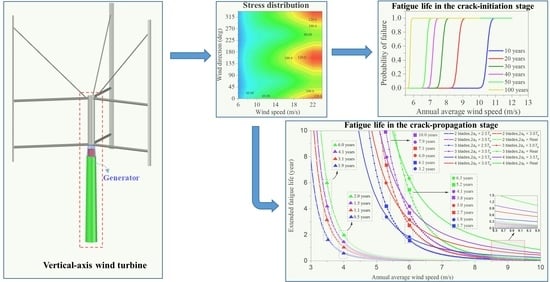
Effects of Blade Numbers on Wind-Induced Fatigue Lives of Straight-Bladed Vertical-Axis Wind-Turbine Tower Bases

1
School of Civil Engineering and Architecture, Wuhan University of Technology, Wuhan 430074, China
2
Changjiang Survey, Planning, Design and Research Co., Ltd., Wuhan 430074, China
3
Department of Civil Engineering, The University of Hong Kong, Hong Kong 999077, China
*
Author to whom correspondence should be addressed.
Metals 2022, 12(2), 321; https://doi.org/10.3390/met12020321
Submission received: 18 December 2021 / Revised: 30 January 2022 / Accepted: 4 February 2022 / Published: 11 February 2022

Abstract

:
Vertical-axis wind turbines (VAWTs) are being reconsidered as a complementary technology to the more commercially used horizontal-axis wind turbines (HAWTs) because of their economical installation and maintenance. The selection of the blade numbers is one of the crucial concerns for VAWTs. This study focuses on the effects of the blade numbers on the fatigue lives of VAWT tower bases subjected to wind loading. Three straight-bladed VAWTs, with the same solidity ratios but different blade numbers, varying from two to four, were designed. The aerodynamic loading incurred by the VAWTs was computed using the corrected double-disk multistreamtube (DMS) model. The dynamic equations of the turbine systems were solved using the explicit central difference method. Then, a fatigue assessment model, including the crack-initiation and crack-propagation stages, was developed for the turbine tower bases. The results indicate that the three- and four-bladed VAWTs always presented better performances than the two-bladed VAWT in terms of the fatigue life. Moreover, increasing the number of blades from two to three improves the fatigue life of the tower base more than increasing it from three to four at lower wind speeds, while the latter is the more effective way to improve the tower-base fatigue life at higher wind speeds.

Graphical Abstract

1. Introduction

Wind energy is the fastest growing renewable clean energy source. At the end of 2019, the global wind capacity was already up to 651 GW, which provided the world with 5.3% [1] of its electric energy needs. In 2020, the new global wind power installations were at 90 GW, which brought the total wind capacity to 743 GW [2]. With the increasing development of wind energy projects, there has been much research on novel solutions and, in some cases, reviews of previous work in order to revitalize these solutions using new techniques. Vertical-axis wind turbines (VAWTs) belong to the latter category. VAWTs peaked during the 1970s and 1990s, and then gradually faded out after that period because horizontal-axis wind turbines (HAWTs) were thought to have higher power coefficients [3]; however, there has recently been renewed interest in VAWTs, beginning in the 2010s. The reason is that VAWTs have several unique advantages, such as much lower noise levels, simpler power generation systems, and much higher structural stabilities compared to HAWTs [4].
A typical VAWT consists of a steel tower and a rotor with several blades. When wind travels through turbines, the rotors rotate in order to harvest wind energy. In this process, the aerodynamic loading incurred by the rotors periodically acts on VAWTs, which greatly affects the fatigue lives of the structures. In order to accurately assess the fatigue damage, it is necessary to perform time-domain simulations for the dynamic responses of VAWTs. Although there are several commercially available software packages that are able to achieve the dynamic simulations of turbines, such as FAST [5], Bladed [6], OrcaFlex [7], and HAWC 2 [8], these were originally developed for HAWTs. These packages lack the module for calculating the aerodynamic loading of VAWTs and, therefore, the relevant module needs to be additionally programmed by researchers. Currently, five models are popular for calculating the aerodynamic loading of VAWTs: the detailed computational fluid dynamics (CFD) model [9,10]; the vortex model [11]; the cascade model [12,13]; the actuator cylinder model (AC) [14]; and the double-disk multistreamtube model (DMS) [15].
The detailed CFD model subdivides the fluid domains into numerous elements that are assigned fluid properties. The model is not only able to predict the aerodynamic loadings incurred by VAWTs [9], but it is also able to identify the flow distributions around the structures [10]. Though the CFD model can provide detailed simulation results, it is too computationally expensive to be used for fatigue assessments of VAWTs that involve massive simulations. The vortex model, based on the potential flow theory, simulates the velocity field around the rotors through the assumed vorticities in the wakes of the blades [11]. The strengths of the vorticities can be determined by the relative velocities between the rotational blades and the far-field wind. However, the vortex model is usually limited to situations where there are blades with small angles of attack (ignoring the dynamic stall effect) and high aspect ratios (ignoring the tip loss effect). The cascade model, based on the cascade theory, was originally used for the turbomachinery design [12], and was then applied to calculate the aerodynamic loading of VAWTs by Hirsch and Mandal [13]. The model assumes that the rotor blades are positioned in a row, which is termed “the cascade” [16], with the spacing between the adjacent blades equal to the rotor circumference divided by the number of blades. The cascade model has great computational efficiency and convergence properties because the induced velocities are computed on the basis of an empirical parameter [13]. The AC model, proposed by Madsen [14], adopts an actuator surface to represent the swept area of a VAWT rotor, which was developed by Cheng et al. [17] to simulate the dynamic responses of floating VAWTs. The DMS model proposed by Paraschivoiu [15] uses an actuator disk, divided by a series of streamtubes, to represent a VAWT rotor. It performs the momentum conservation calculations at each streamtube in order to obtain the induced velocities by the rotational blades. In the abovementioned models, the DMS model has much higher computational efficiency than the CFD and vortex models, and greater computational accuracy than the cascade model. Therefore, the DMS model was selected to calculate the aerodynamic loadings of the VAWTs in this study.
The aerodynamic loading incurred by VAWTs is characterized by the effect (N is the blade number, and Ω is the rotor speed) [18,19,20], which produces high-frequency excitations, thereby leading to fatigue-damage accumulations in the structures, especially at the tower bases, where the dynamic stress varies greatly. For example, the Eole VAWT (Figure 1) is by far the largest VAWT ever installed, with a height of 110 m, and a rated power of 3.8 MW. The turbine was inaugurated in 1987 in Quebec, but it was shut down in 1993 because of serious fatigue issues at its bottom bearing [21].
Wind turbine structures are generally designed with a target fatigue life of 20 years [22,23]. Some studies have evaluated the fatigue life of turbines using the finite element method. Harte et al. [24] proposed a dynamic equation to include the nonlinear effect of the damage index on the stiffness matrix of structures. By solving the nonlinear equation, the fatigue life of a 3-MW prestressed concrete tower was evaluated. Paredes et al. [25] developed a compression–tension concrete damage model that ensures that the concrete structure can still maintain the capacity to withstand compressions, even if severe damage occurs in the tension cycles, which was used to fully investigate the fatigue-damage distribution of a reinforced concrete tower under the periodical cyclic actions. Do et al. [26] developed simplified finite-element computational codes to simulate the dynamic response of a 5-MW wind turbine subjected to wind loading, and they then evaluated the fatigue life of the turbine tower in the crack-initiation and -propagation stages, respectively. Huo et al. [27] adopted the time-domain and the time-frequency-domain analysis methods to investigate the wind-induced fatigue damage of a pitch-controlled 1.25-MW wind turbine. The results show that although the time-frequency-domain method was simpler in the calculations, it underestimated the fatigue life of the tower. Fu et al. [28] adopted the probability density evolution method to assess the fatigue damage of flanges and bolts in a 1.5-MW wind-turbine tower, showing that the reliability of the bolts in this tower was much higher than for the flanges.
The abovementioned studies [24,25,26,27,28] aim to deal with the fatigue issues for HAWTs, while the relevant research on VAWTs is very scarce. Considering that the aerodynamic loading incurred by VAWTs varies greatly with the numbers of blades, and that it is more likely to cause the fatigue damage of the tower base than HAWTs, it is necessary to give special attention to the fatigue investigations of VAWTs from a structural-safety point of view. Moreover, most of the studies [24,25,27,28] only evaluate the fatigue lives of turbine towers in the crack-initiation stage on the basis of the S–N curve approach. To the best of the authors’ knowledge, limited attention has been given to the evaluation of the structural fatigue life in the crack-propagation stage.
This study focuses on investigating the effects of the numbers of blades on the fatigue lives of VAWT tower bases. The joint distribution of the wind speed and direction at the potential installation site of the wind turbines was established according to data from the ECMWF. The corrected DMS model was used to calculate the aerodynamic loading on the VAWTs, which, in turn, guided the design of the three VAWTs, which included the same solidity ratios, but different numbers of blades (from two to four). The time-domain dynamic responses of the three turbines were calculated and their stress response characteristics were identified. The failure probability curves of the three turbines were plotted, and their fatigue lives in the crack-initiation and crack-propagation stages were evaluated and compared.

2. Methodology

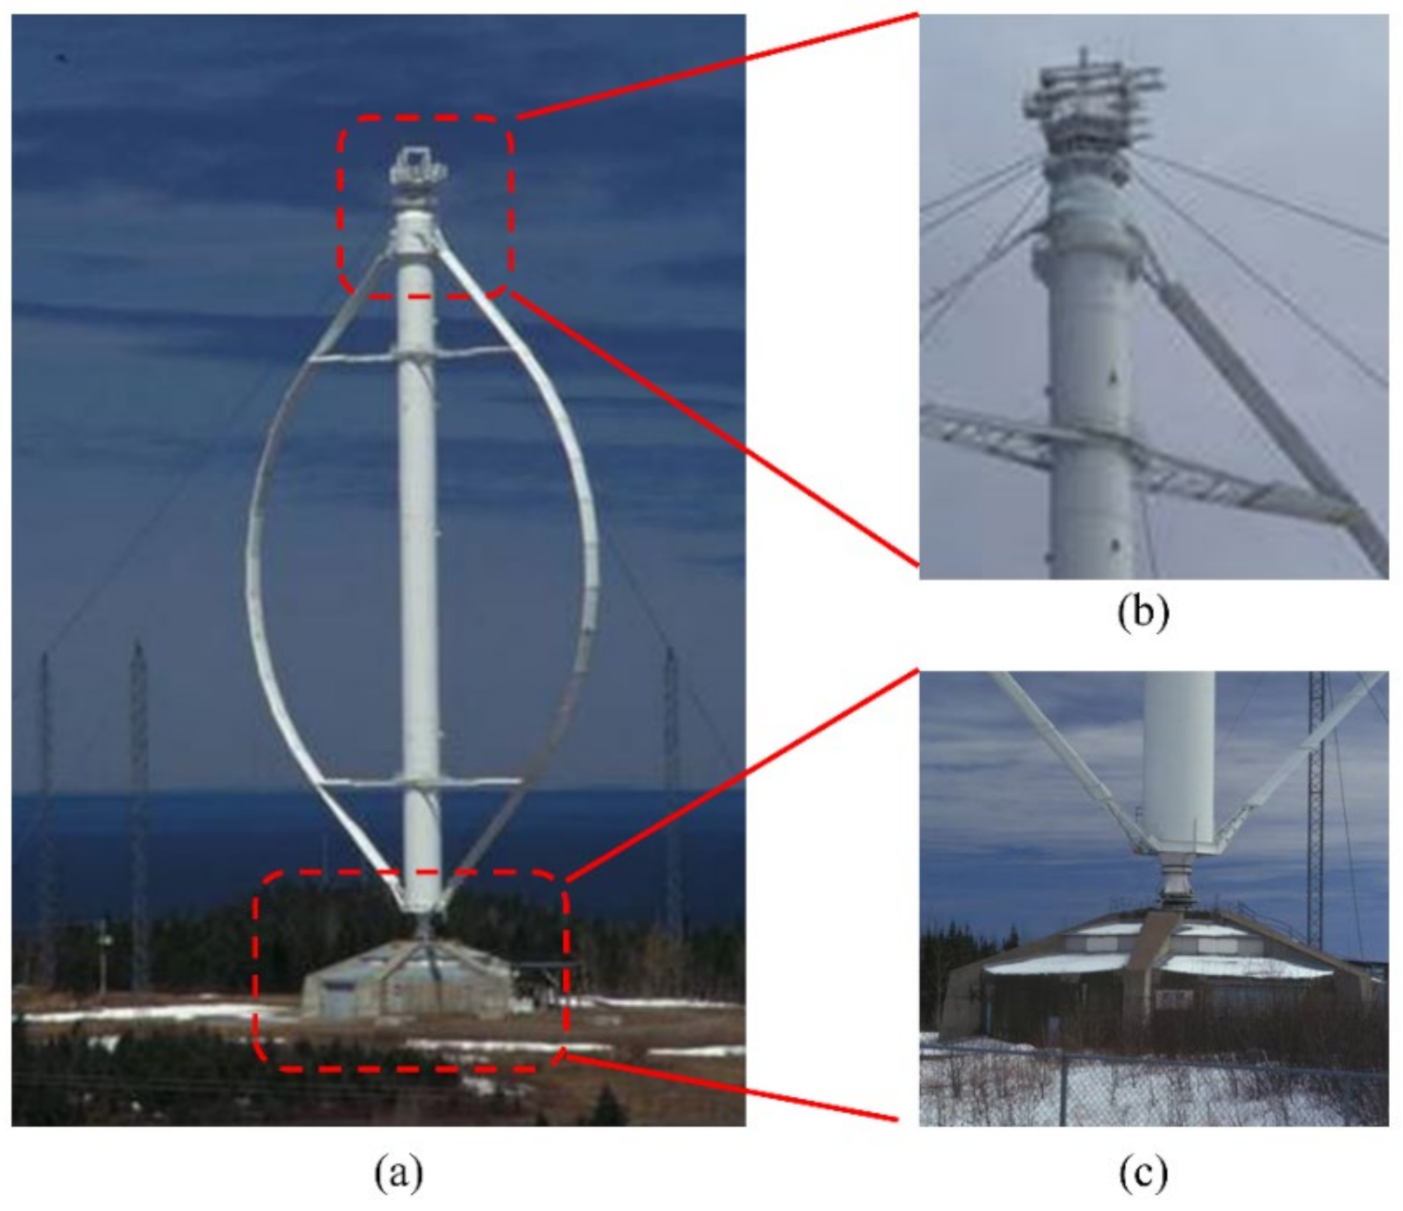
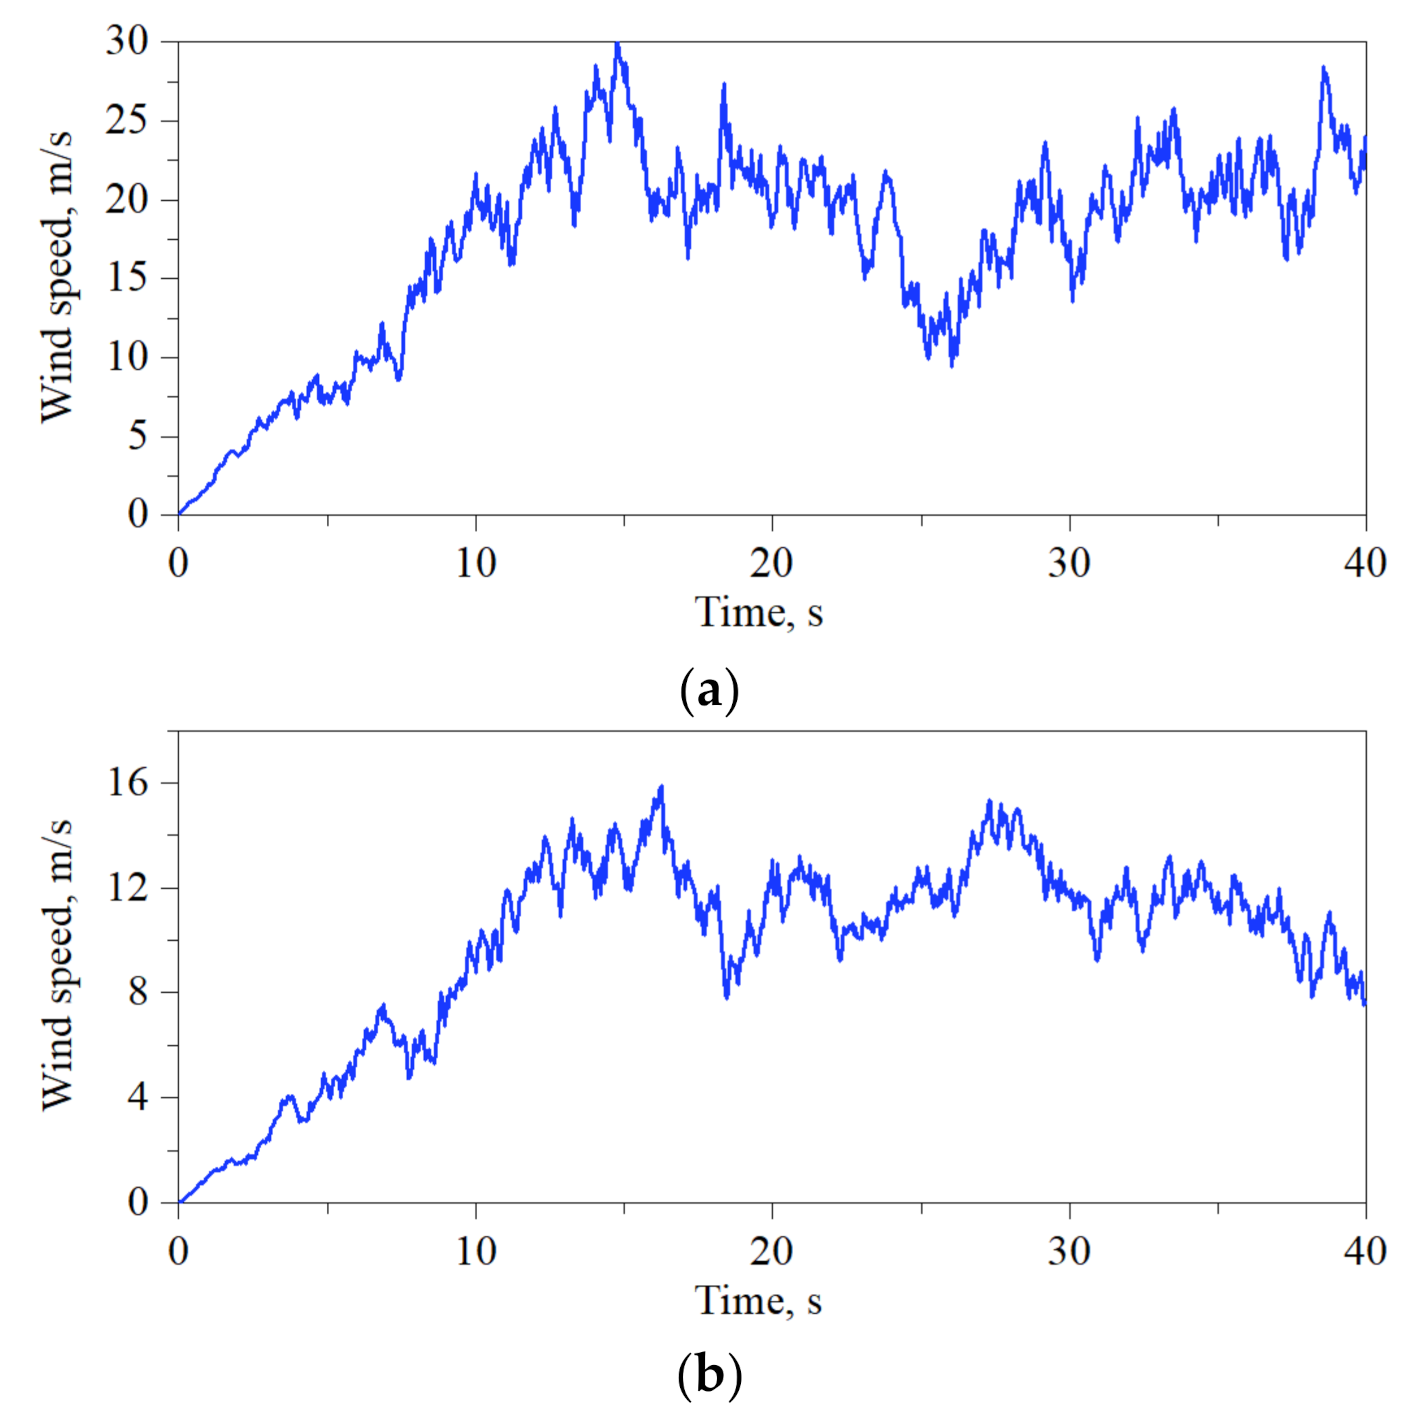
2.1. Wind-Field Simulation Method

The wind speed history, U, at the wind-field points (Figure 2) can be expressed as the sum of the turbulent component, u, and the mean component, u ¯ m :
U ( x , y , z , t ) = u ( x , y , z , t ) + u ¯ m ( z )
The turbulent component, u, is described by the KAIMAL spectrum [29] in this study. In addition, the turbulent components are spatially correlated, which is represented as the asynchrony of the turbulent wind speeds at different field points. The following equation is introduced to define the spatial correlation at any two field points, i and j:
C o h i j ( f ) = exp 12 ( f   L r / u ref ) 2 + ( 0.12 L r / L c ) 2 0.5
where f is the frequency component of the wind speed; Cohij(f) is the correlation coefficient at the frequency of f; Lr is the spatial distance between the field points, i and j, (Figure 2); Lc is the coherence parameter defined in the IEC 61400-1 [29]; and uref is the mean wind speed at the reference height, zref, which is the vertical center of the blades.
On the basis of the spatial correlation coefficient (Equation (2)) and the KAIMAL spectrum, the cross spectrum, Sij(f), for describing the turbulent components at any two points, i and j, is as follows:
S i j ( f ) = S i i ( f ) S j j ( f ) C o h i j ( f )
where Sii(f) and Sjj(f) are the KAIMAL spectra at points i and j, respectively. If a wind field has n field points, a cross-spectrum matrix with the n × n dimension can be obtained:
S ( f ) = S i j ( f ) n × n
The S(f) undergoes Cholesky decomposition [30] to yield the lower triangular matrix, H(f). Then, the time history of the turbulent wind speed at a point, i, can be calculated using the following equation:
u i ( t ) = j = 1 i k = 1 N f H i j ( 2 π f k ) 4 π   Δ f × cos 2 π f k t θ i j ( 2 π f k ) + φ j k
where Nf is the number of frequency sampling points; ∆f is the frequency interval; θ i j ( 2 π f k ) = tan - 1 Im H i j ( 2 π f k ) / Re H i j ( 2 π f k ) ; and φ j k is the evenly distributed independent phase angle between 0 and 2π.
The mean wind speed, u ¯ m , varies with the height, z, which can be described on the basis of the normal wind profile:
u ¯ m ( z ) = u ref z z ref κ
where κ is the ground roughness index, which is taken as 0.14. The probability distribution function (PDF) of the uref satisfies the well-known lognormal distribution [31], which can be expressed as:
f U ref ( u ref ) = 1 2 π ζ u ref exp 1 2 ln u ref λ ζ 2
where ζ = ln ( 1 + σ 2 / μ 2 ) and λ = ln μ 1 / 2 ζ 2 are the shape and scale parameters, respectively, in which μ and σ are the normal mean and the standard deviation, respectively, of the distribution of the annual average wind speed, uan. In this study, the μ is set as the selected uan of the wind turbine installation site, and the σ can be determined by assuming that the distribution of the uan has the same coefficient of variance, namely, σ = μ   COV = 0.35 μ [26].
A potential installation site for VAWTs was located at Riyue mountain, Qinghai Province, China, where several 300-kW and 750-kW VAWTs were installed in 2008, as is shown in Figure 3. The local data of the wind speeds and directions from 1985–2020 were obtained from the Data Sharing Service Platform of the ECMWF. The uan of the site varies from 5–7 m/s at the height of the zref. Moreover, the wind direction (β) distribution is dominant in 135–180 deg, as illustrated in Figure 4.
The wind information at the reference height, zref, is used to establish the joint PDF of the wind speed and the direction. The mean wind speed interval (uref,i, uref,i+1) at each wind direction interval (βj, βj+1) is defined as the (i, j)th case. The interval increments for the wind speed and direction are set to 1 m/s and 22.5 deg, respectiv+ely. The wind speed, uref, and the wind direction, β, are regarded as two independent variables for simplicity, and therefore the joint probability in each case can be obtained on the basis of Equation (7) and Figure 4. Taking uan = 6 and 10 m/s as examples, their occurrence probabilities in different cases are illustrated in Figure 5a,b, respectively. As the wind speed increases beyond the mean value, the volume of each column typically decreases. However, although their occurrence probabilities are very small, high wind speeds have to be included, as they may lead to structures accumulating a significant amount of fatigue damage.

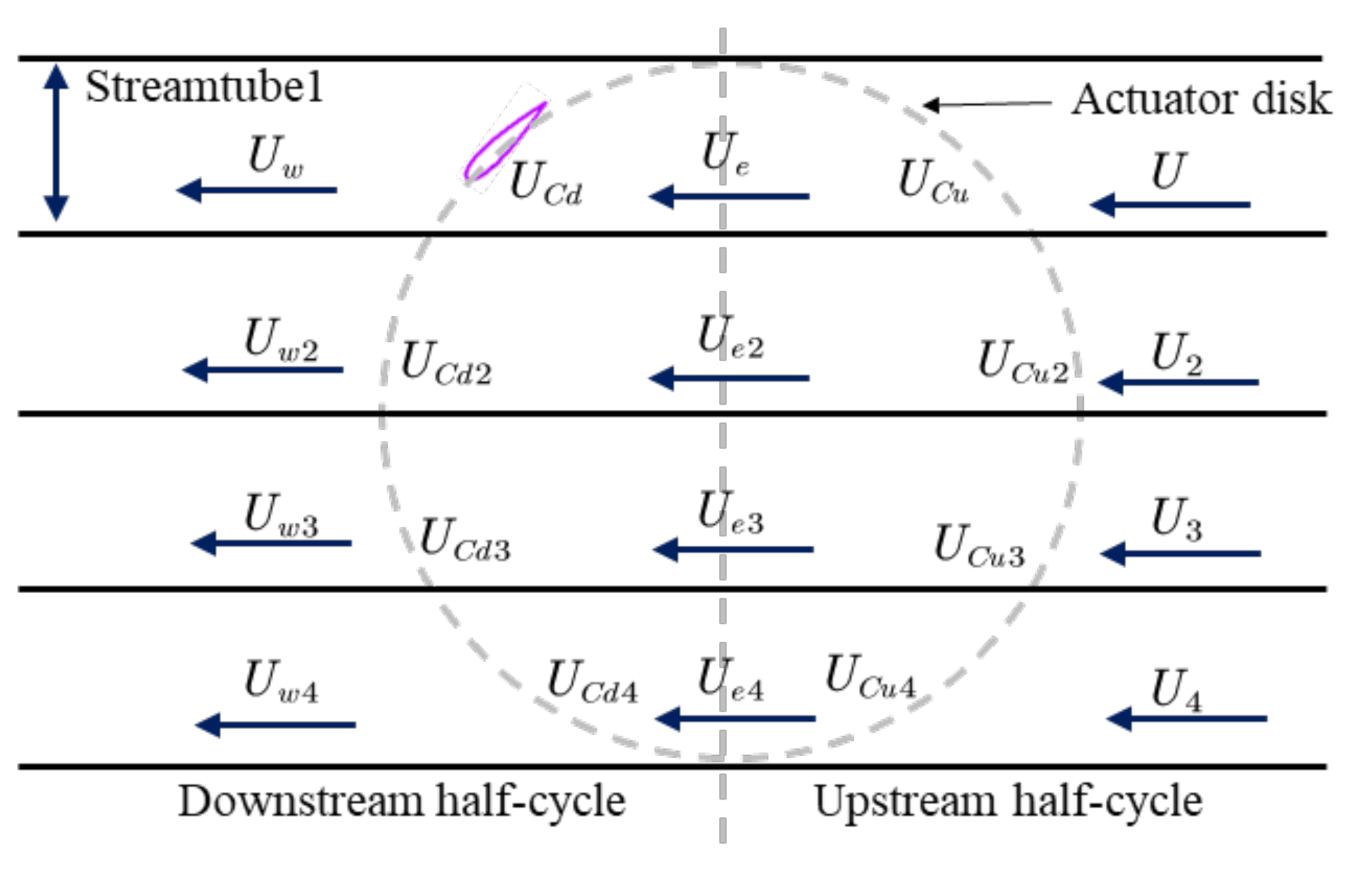
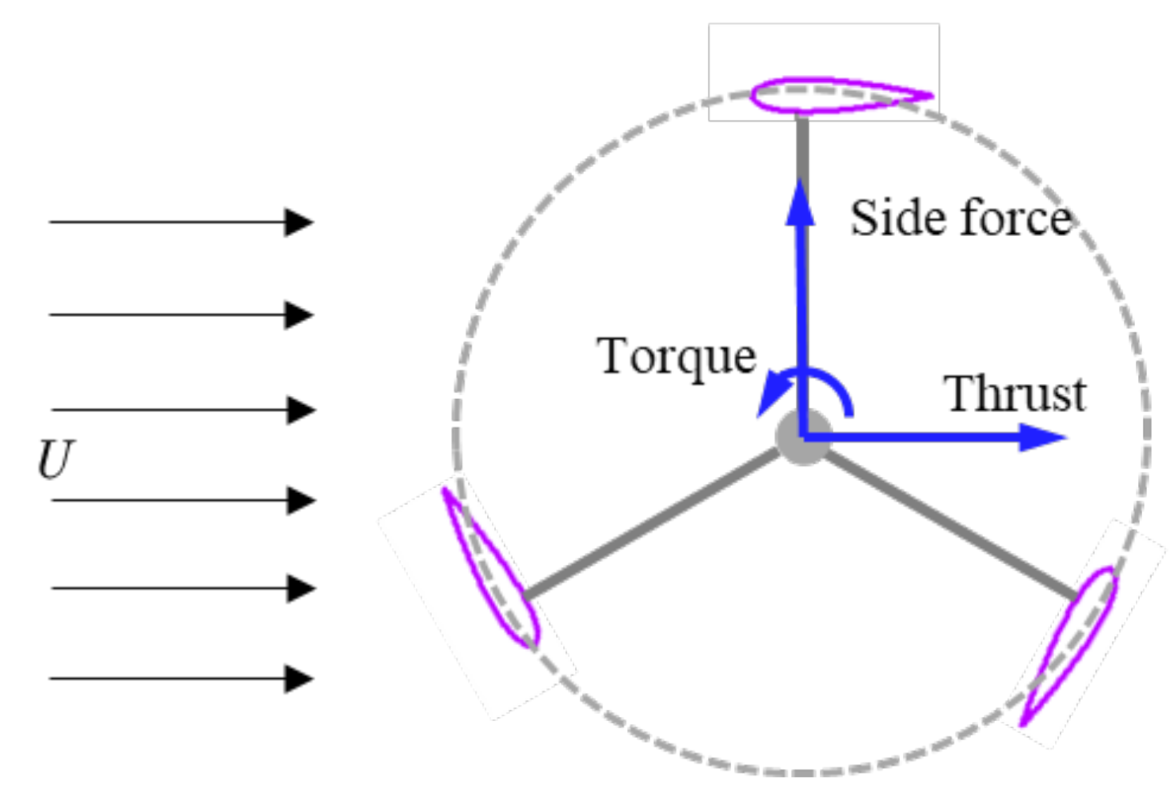
2.2. Aerodynamic Loading Calculation Method for VAWTs
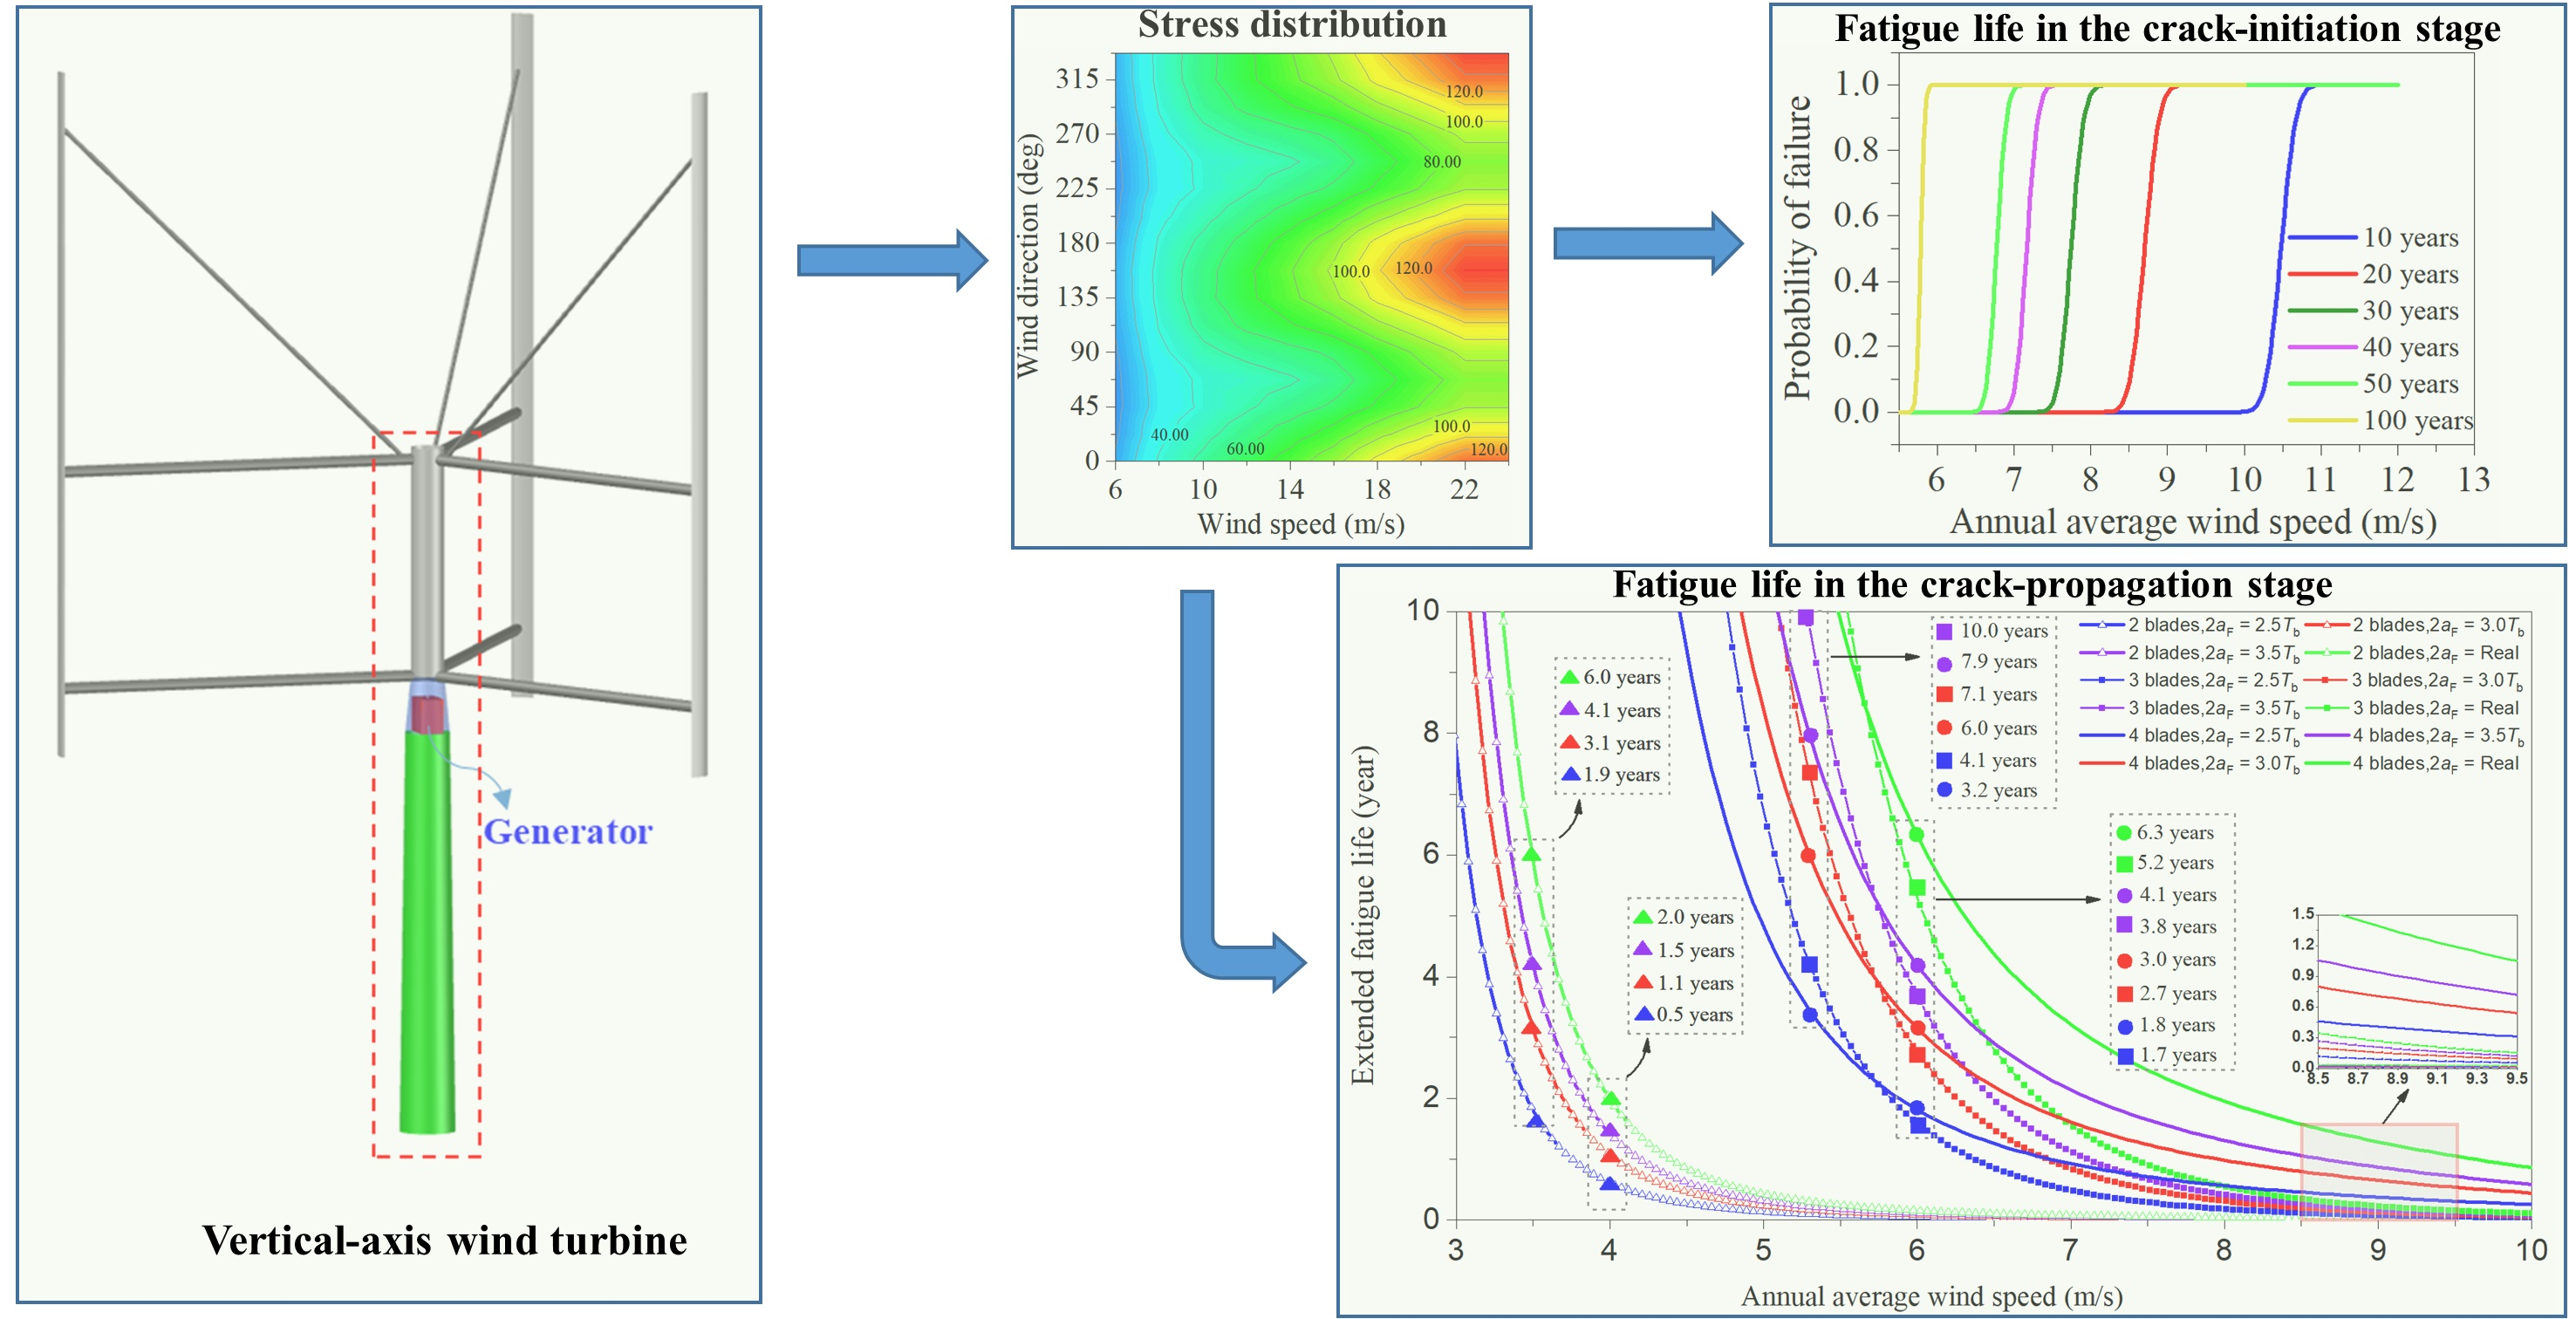
The DMS model was used to simulate the aerodynamic loading incurred by VAWTs. For the typical straight-bladed VAWT in Figure 2, the blades were divided into a number of segments, with a height of ∆h. The track of the rotational blade elements is circular, as is shown in Figure 6. Considering Blade Element 1 (Figure 6) as an example, the resultant flow velocity seen by the element can be expressed as:
W   =   Ω × r + U c
U c =   α U
where W is the vector of the wind speed seen by the blades; Ω and r are the vectors of the rotations and the radius, respectively; Uc is the vector of the induced wind speed; α is the induced coefficient; and U is the vector of the far-field wind velocity.
On the basis of Equations (8) and (9), the angle of attack of the airfoils, φ, is as follows:
φ = arctan U c cos θ Ω r + U c sin θ
where θ is the azimuthal angle of the blade element (Figure 6).
The DMS model adopts an actuator disk to represent a rotor. In order to consider the variations in the induced coefficients along the circle track, the disk is divided into a series of streamtubes from top to bottom, as is shown in Figure 7. For Streamtube 1, the momentum conservation equation is performed at the upstream and downstream half-cycles of the disk, respectively:
α u 1 α u = N b C 8 π r cos θ ( W u U ) 2 C tu φ u sin θ C nu φ u cos θ
α d 1 α d = N b C 8 π r cos θ ( W d U e ) 2 C td φ d sin θ C nd φ d cos θ
where αu = Ucu/U (αd = Ucd/Ue); Ctu (Ctd), Cnu (Cnd), φu (φd), and Wu (Wd) are the induced coefficient, the tangential force coefficient, the normal force coefficient, the angle of attack, and the wind speed experienced by the blades at the upstream (downstream) half-cycle, respectively; Nb is the blade number; C is the chord length of the blades; and Ue is the wind speed at the middle of the disk. Combining Equations (11) and (12), the αu, αd, Wu, and Wd can be solved numerically by iterative computations, and they are then substituted into Equations (8)–(10) for the φ. After that, the Ctu, Ctd, Cnu, and Cnd, corresponding to the φ, can be obtained through a lookup table approach. Once the values of the abovementioned parameters are known, the aerodynamic loading incurred by the VAWTs can then be determined.
The DMS code was developed by Zheng et al. [18], and it further introduces the Leishman–Beddoes correction for the dynamic stall effect [32], and the Huse correction for the tower shadow effect [33]. The developed code was also validated by a comparison with other numerical results and was found to be accurate [18].

3. VAWT Models

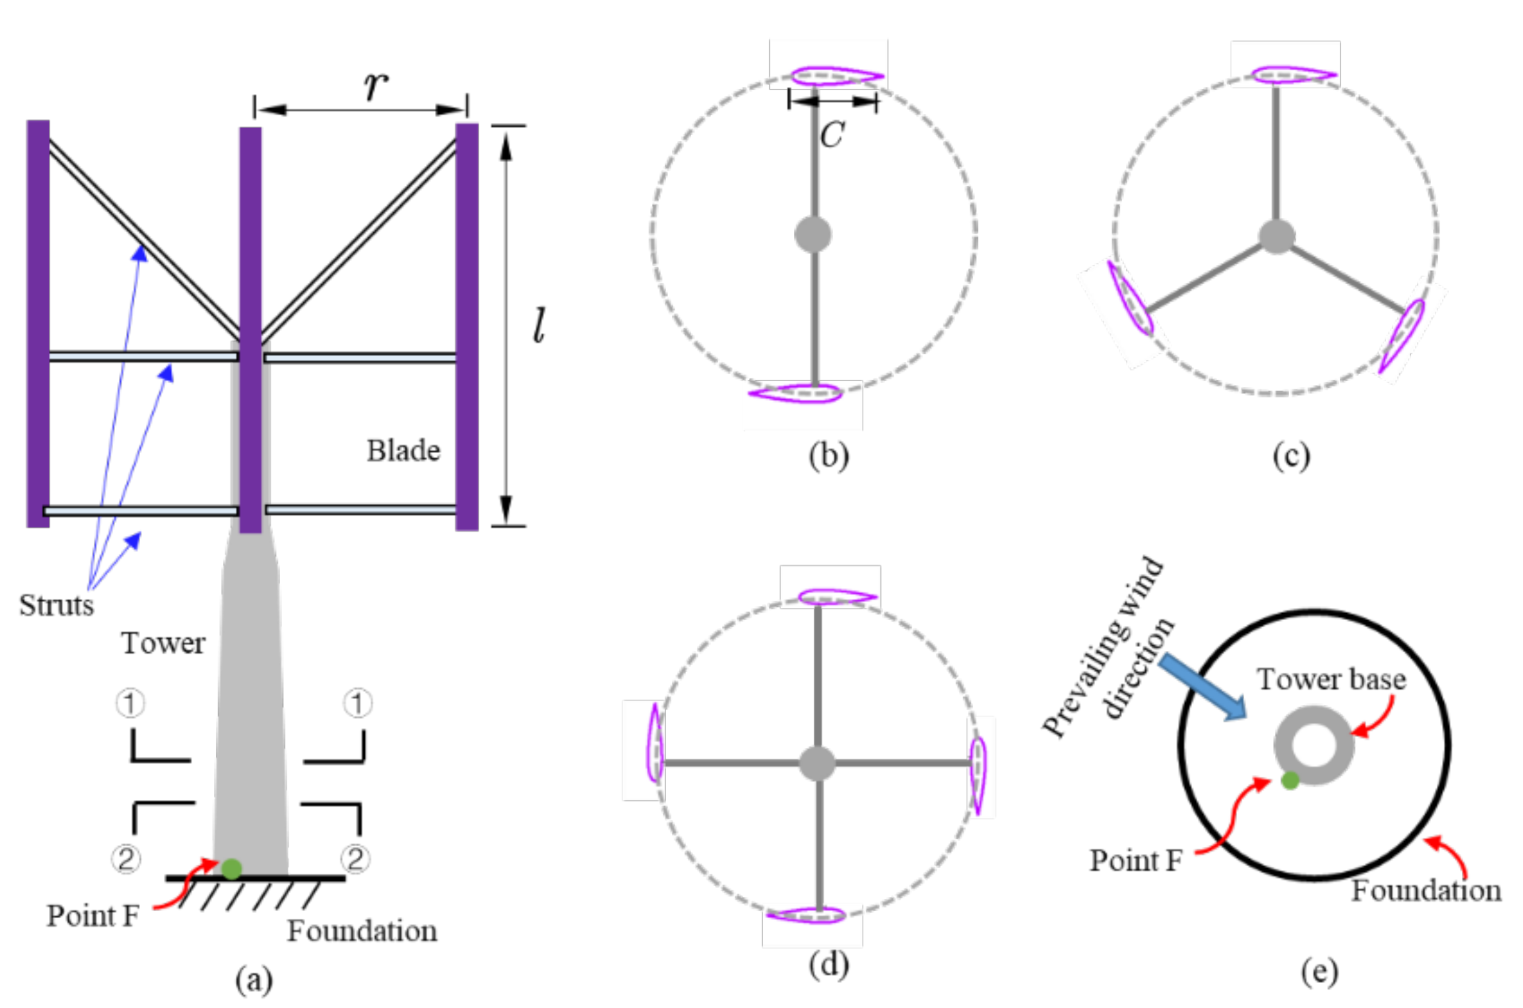
3.1. Design of Straight-Bladed VAWTs

For a straight-bladed VAWT with a rotor radius of R and a rotor height of l (Figure 8a), its power, P, can be expressed as:
P = 1 2 ρ U 3 ( 2 r l ) C p
where ρ is the air density; U is the far-field wind speed; and Cp is the power coefficient, which depends on the rotor solidity, σ, the tip speed ratio, λ, and the Reynolds number, Rey:
σ = N b C r
λ = Ω r U
R e y = C W υ
where W is the wind speed experienced by the blades, and υ is the kinematical viscosity of the air.
As is shown in Figure 8, three straight-bladed 1-MW VAWTs with NACA 0018 airfoils were designed. The values of the main design parameters are listed in Table 1. The blade chord length is reduced with the blade numbers to maintain the same rotor solidity among the three turbines, as is shown in Figure 8b–d. According to Equation (14), the three turbines have identical rotor solidities of 0.2, which refers to the value of the high-MW VAWTs in the FP7 H2OCEAN project [34].
It should be mentioned that the variations in the blade chord lengths lead to different Reynolds numbers, and thus affect the drag and lift coefficients of the airfoil; however, the influence on the total aerodynamic loading and power is assumed to be slight in this study. Figure 9, which is based on the corrected DMS model, illustrates the relationship between the power coefficient, Cp, and the tip speed ratio, λ, for the designed turbine. To avoid structural resonance issues due to the VAWTs’ effects, λ = 3 was chosen in this study, which corresponds to Cp = 0.44 for the three turbines.
Compared to the lattice structure in Figure 3, the cylinder steel tower is a more popular supporting structure for wind turbines. The cylinder turbine tower designed in this study is made of Q235 steel, with a yield stress of 235 MPa, an elastic modulus of 210 GPa, a mass density of 7850 kg/m3, and a Poisson’s ratio of 0.3. The height of the tower is 60 m. The cross sections are presented in Figure 10. The linear tapering of the tower section from bottom to top is also assumed.

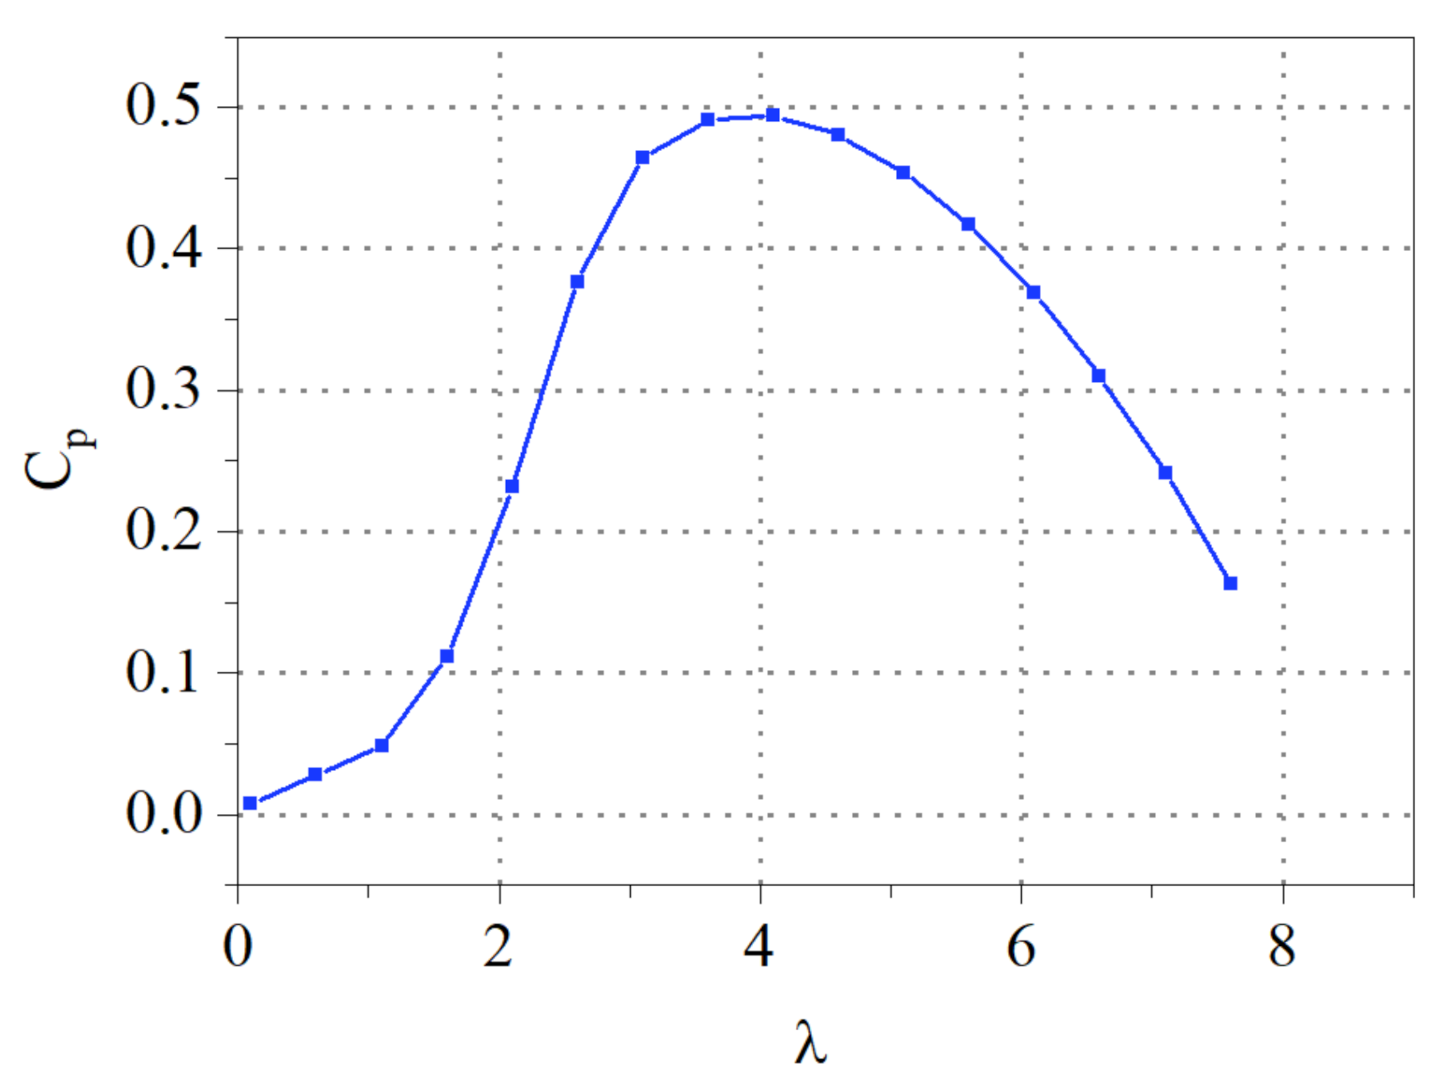
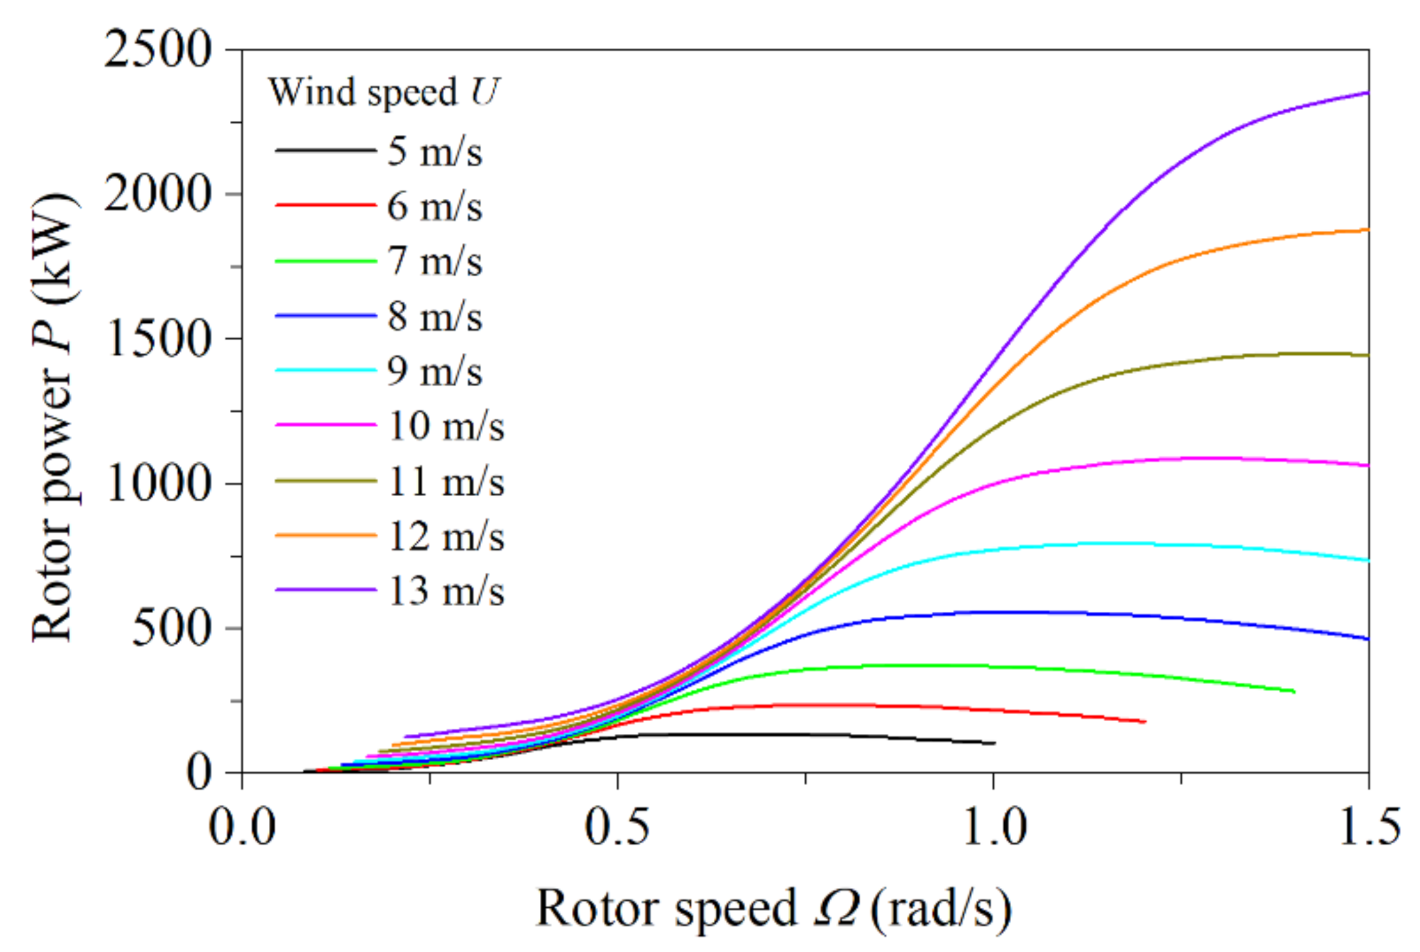
3.2. Control Strategy for VAWTs

To determine the control strategy of the designed VAWTs, the mean rotor power, P, is plotted against the rotor speed, Ω, as a function of the wind speed, U, as is shown in Figure 11. According to the figure, the desired rotor speed, Ωd at the specific wind speed, U, can be determined. For U < 9 m/s, the blue point is located at the peak of each curve, where the Ωd ensures the maximum power output of the turbines, and, for U ≥ 9 m/s, the Ωd keeps constant at the rated value of 1.0 rad/s. In time-domain simulations, the desired rotor speed, Ωd is compared to the computed low-pass rotor speed, Ωcom, at each time step, and then the error, ∆Ωd = ΩcomΩd, is adjusted through the PID method [35], which can be implemented in MATLAB Simulink [36].

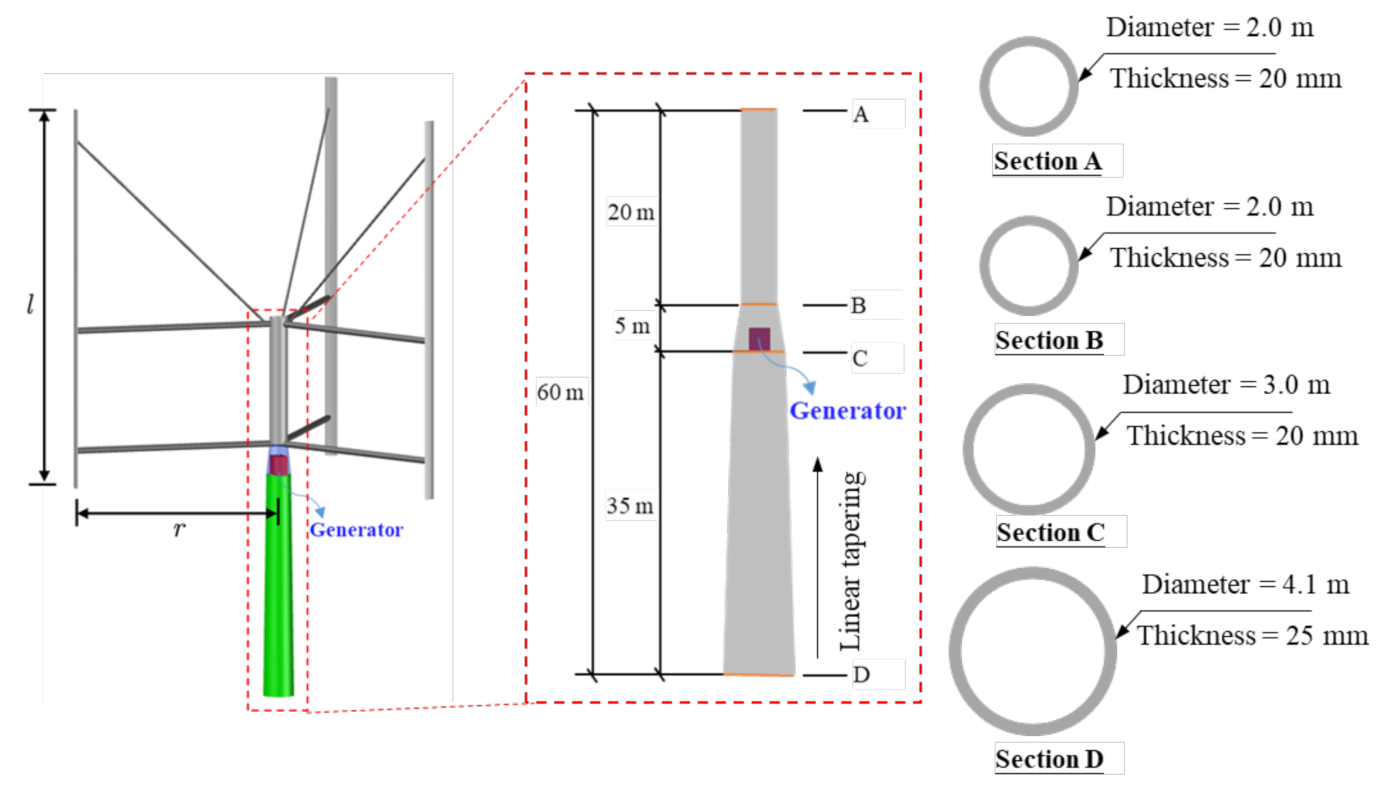
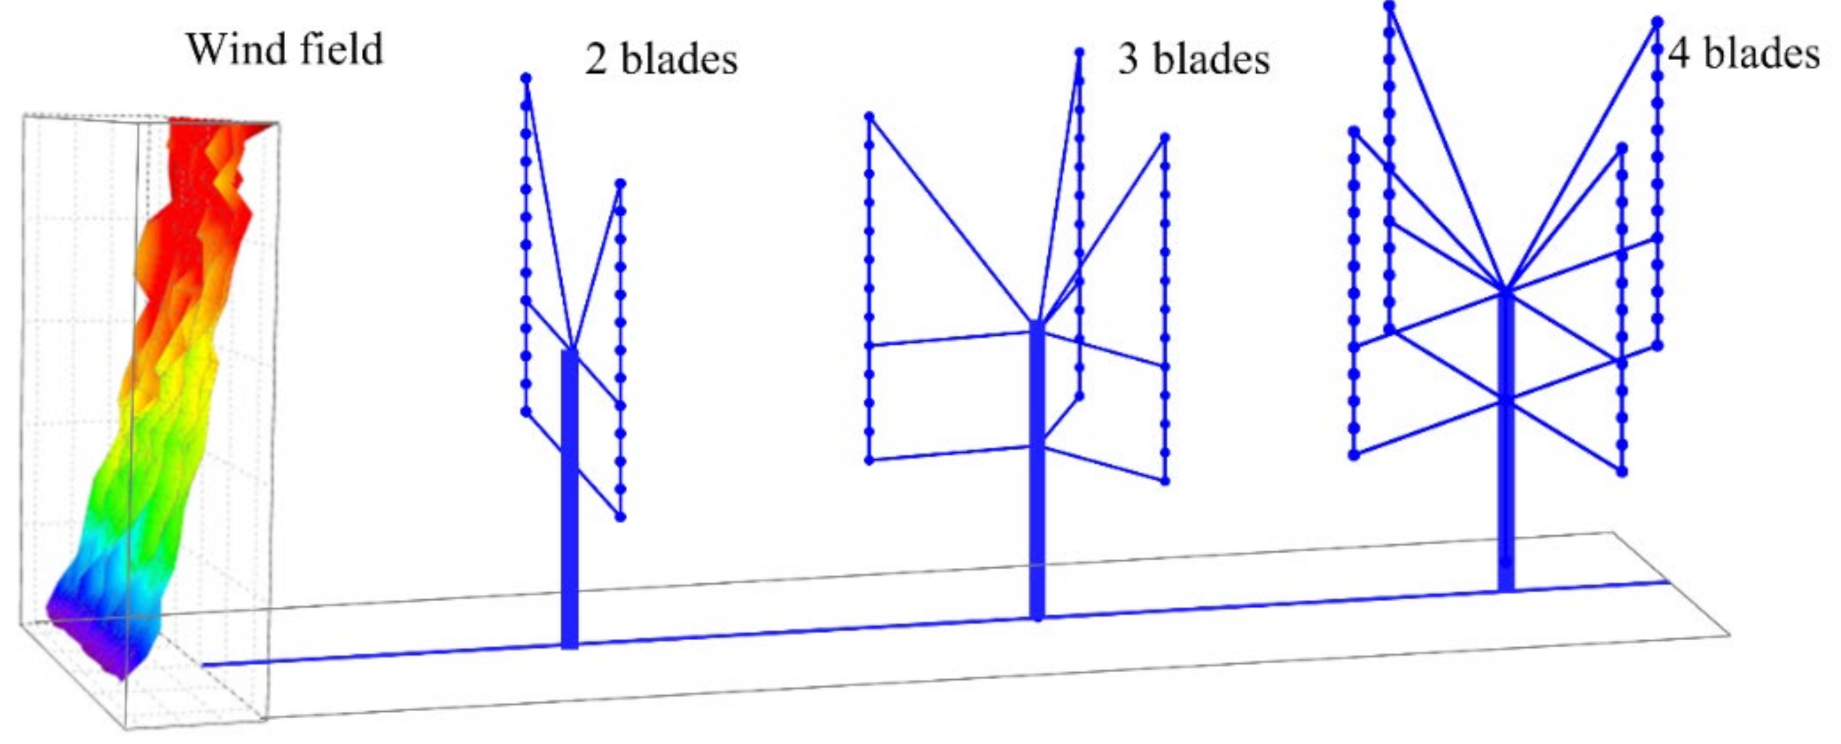
3.3. Numerical Models for VAWTs and Wind Field

The numerical models of the two-to-four-bladed VAWTs were created in MATLAB R2016a, MathWorks, Natick, MA, USA [36] and are shown in Figure 12. The turbine tower is modeled with beam elements. The generator (110 t) is modeled as a lumped mass. The deformations of the blades and struts are not our concern, and they are therefore regarded as rigid members. To accurately capture the vertically varying aerodynamic loading on the rotors, each blade is divided into 12 segments. The aerodynamic loading on each segment is assumed to be uniformly distributed, and it is evenly exerted on the nearby blue nodes. The damping ratio of the structure is set as 1% [37]. The drag coefficient is 1.17 [38] in order to consider the wind-induced drag force on the towers. The dynamic response equation of the whole system is solved by the explicit central difference method. The relevant codes were developed and validated by Zheng et al. [18,19,39] for the dynamic response analyses of transmission and turbine towers.
The spatially coherent wind field is also generated in MATLAB. The generated wind field has the dimensions of 80 m in width and 100 m in height, with a mesh resolution of 2.5 m × 2.5 m as is shown in Figure 12. The turbulent wind speed, with a 20% turbulence intensity, involves a frequency range of 0.005–6Hz, with an increment of 0.005 Hz. To avoid the transient structure response, the wind speed history is scaled with a ramp function from 0 to 1 over the first 10 s. Figure 13 shows the calculated wind speed histories at the tower top, and at 10 m high.

4. Procedure for Fatigue-Life Assessment

The stress response at the turbine tower base is usually much lower than the yield stress under aerodynamic loading. Therefore, the structure will experience a large number of stress cycles before the occurrence of fatigue failure. This process is comprised of two stages: the crack-initiation stage and the crack-propagation stage. For convenience in evaluating the structural fatigue life, the multidimensional stress state can be reduced to the uniaxial equivalent stress state, on the basis of the previous study [40].

4.1. Fatigue Life in Crack-Initiation Stage

Under the (i, j)th case, the dynamic stress history at the tower base can be simulated. The rainflow algorithm is used to construct the stress histogram, which assigns the mean values and amplitudes of the distinguished cycles from the random stress history. On the basis of the schilling [41] method, an effective stress range, Sre, is calculated to characterize the stress histogram, and this value can be applied in Miner’s rule [42] for fatigue analysis. The Sre can be expressed as the root mean cube (RMC) of the obtained stress-range data:
S re = k = 1 n 1 γ k S r , k 3 1 / 3
where Sr,k and γk are the kth stress range and the corresponding occurrence probability, respectively, whose values can be obtained from the stress histogram; and n1 is the total number of stress ranges. The highest cycle number that the tower base can withstand under the (i, j)th case, Ni,j, is determined on the basis of the S–N curve:
N i , j = A S re 3
where A is the material parameter that satisfies a lognormal distribution, with a mean μ A = 65.9 × 10 10 MPa3, and a COV = 0.26 [43].
If the simulation time for each case is T0-hr, then the corresponding stress-cycle number that the tower base suffers is assumed to be N0. Using Miner’s rule [42], the expected life of the tower base, FLi, j, under the [i, j]th case can be evaluated as follows:
F L i , j = T 0 D i , j   ( 365 )   ( 24 ) ( year )
D i , j = N 0 N i , j
where Di,j is the fatigue damage of the tower base in T0-hr. On the basis of the joint distribution of the wind speed and the direction, the fatigue life, Flife, of the tower base at a given annual average wind speed can be evaluated as:
F life = 1 i = 1 n j = 1 m P i , j ( 1 / F L i , j ) ( year )
where n is the total number of wind speed cases; m is the total number of wind direction cases; and Pi,j is the occurrence probability of the [i,j]th case (Figure 5).

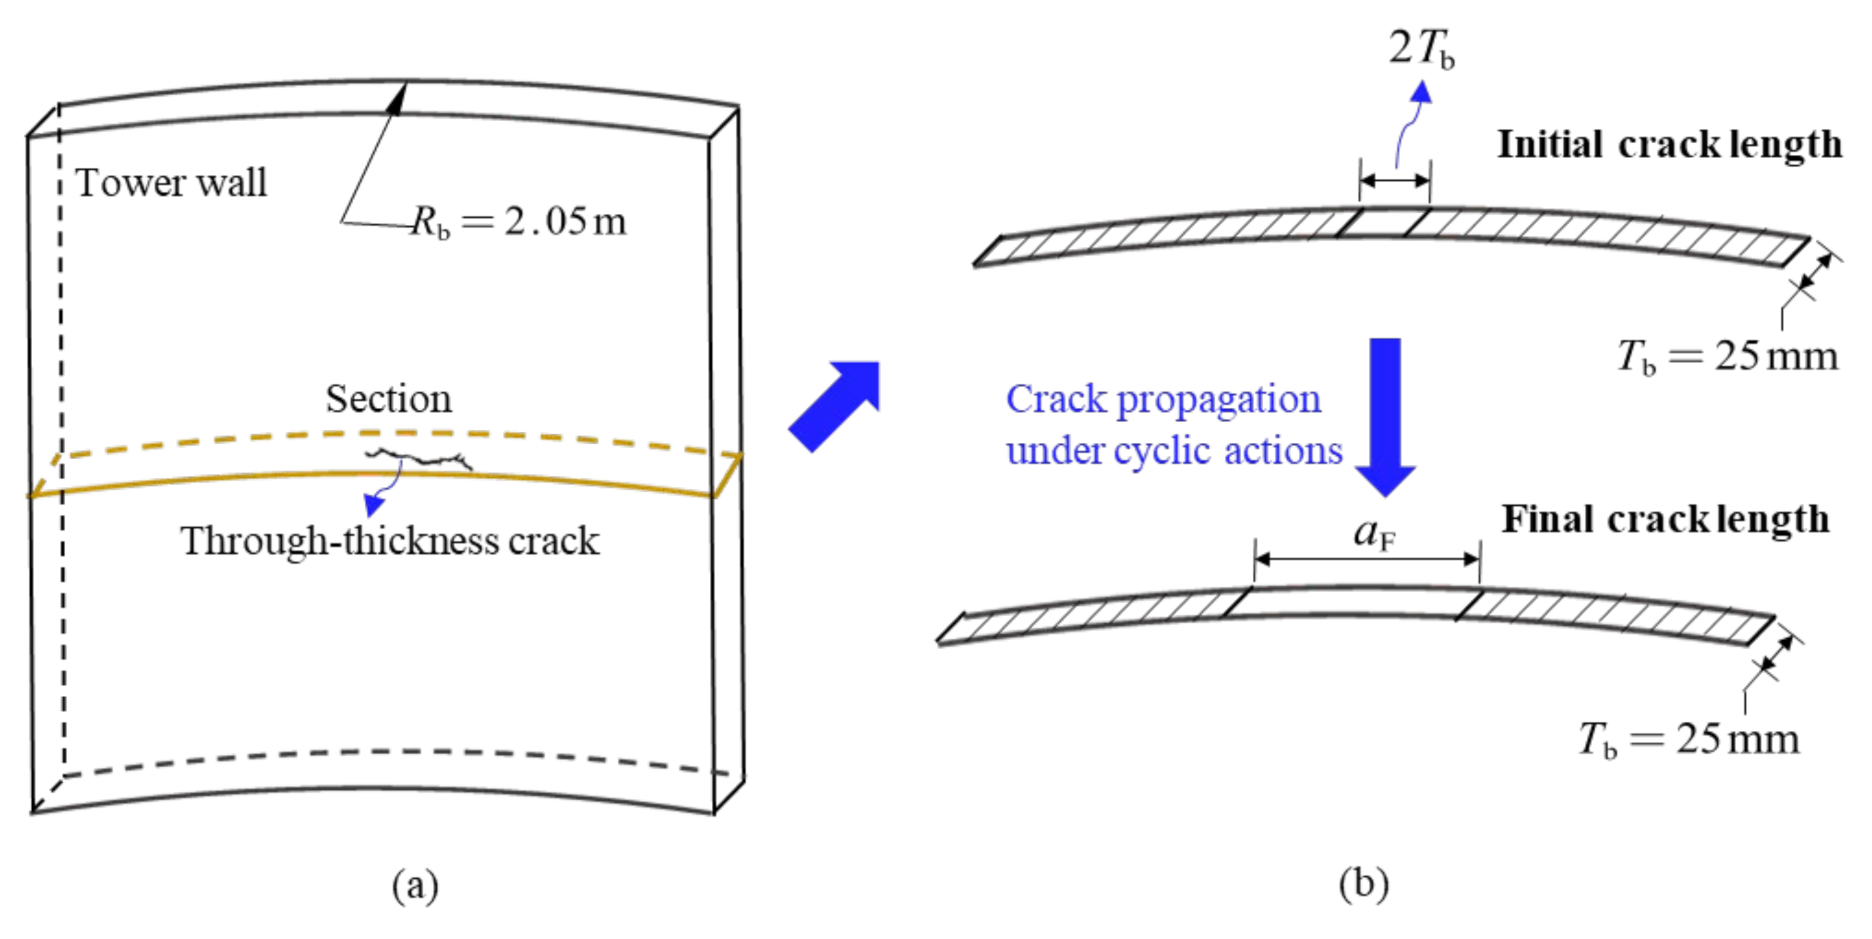
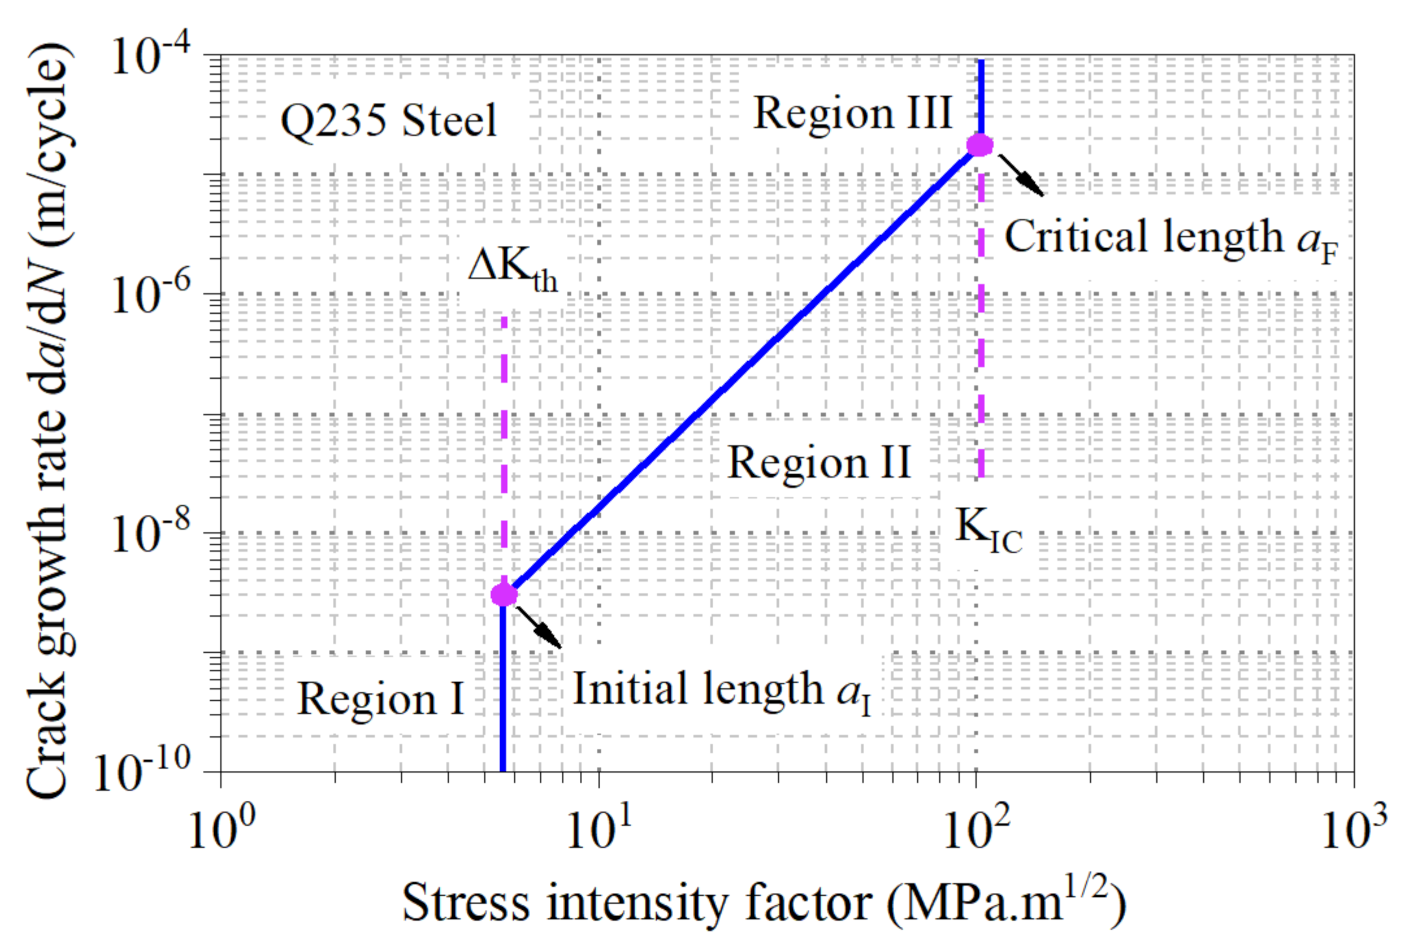
4.2. Fatigue Life in Crack-Propagation Stage

The occurrence of a through-thickness in the crack-initiation stage does not mean the end of the service life of the structure. Generally, the crack will propagate gradually, with subsequent stress cycles, until it reaches the critical length where plastic collapse occurs. For VAWTs, the fatigue life in the crack propagation stage may be substantial, but most structural design standards ignore the service life in this stage. In this study, the Paris rule [44] is applied to define the propagation rate, da/dN (da and dN are the increments of the crack length and the subsequent cycle number, respectively):
d a d N = C g ( Δ K eff ) m
where Cg is the coefficient of the crack growth rate; m is the material constant; and ∆Keff is the stress intensity factor defined in Equation (23):
Δ K eff = G S re π a
where G is the dimensionless function of geometry and the relative crack length. Because the ratio of the curve radius, Rb, to the wall thickness, Tb, at the tower base is a very large value ( R b / T b = 82), the zone around a through-thickness crack is regarded as an infinite flat plate [45], as is shown in Figure 14a. Therefore, the G is always set to 1 in this study.
The life cycles required for the crack-propagation stage, NIF, can be calculated by solving Equation (22) for the dN and integrating both sides:
N I N F d N = N F N I = N IF = a I a F d a C g ( G S re π a ) m
The above integral gives the number of cycles required for the crack to propagate from an initial length, aI, at the cycle number of NI, to a final length, aF, at the cycle number, NF. The initial crack length, aI, can be set as the visible through-thickness crack. It can be assumed that when a through-thickness crack appears under cyclic actions, the crack length, aI, is already double the wall thickness (Figure 14b). The final crack length, aF, is the crack length that can be tolerated before structural plastic collapse occurs (Figure 14b). According to a Level-1A fatigue-crack assessment in the BS 7910 [45], the ratio of the stress intensity to the critical stress intensity is allowed to reach 0.707. As a result, the final crack length, aF, can be determined as [26,45]:
a F = 1 π ( 0.707 K IC S t , max ) 2
where KIC is the fracture toughness of the material; and St,max is the maximum tensile stress. Considering that Cg, G, Sre, and m are all known parameters, the above integration of Equation (25) is straightforward [46]:
N IF = a F 1 m / 2 a I 1 m / 2 C g ( G S re π ) m ( 1 m / 2 )
On the basis of Equations (22)–(26), the NIF under each [i,j]th case can be calculated, and this value can be applied in Equations (19)–(21) for the fatigue-life evaluation of the tower base in the crack-propagation stage. The material of the turbine tower is Q235 steel, whose properties are very close to ASTM A36 steel; the values of the relevant material parameters are listed in Table 2. The growth rate of a crack for Q235 steel can be determined by the Paris rule, as is shown in Figure 15. The crack-propagation process can be defined by three distinct regions: Region I describes slow-crack propagation behavior, with the ∆Keff < ∆Kth [45], where the crack spends most of its life; Region II describes stable-crack propagation behavior, which follows the Paris rule, where the growth rate varies linearly with the stress intensity range on a log–log scale, until the stress intensity range reaches the fracture toughness, KIC; and Region III describes unstable-crack propagation behavior, where the crack grows very rapidly and plastic collapse may occur.

5. Results and Discussion

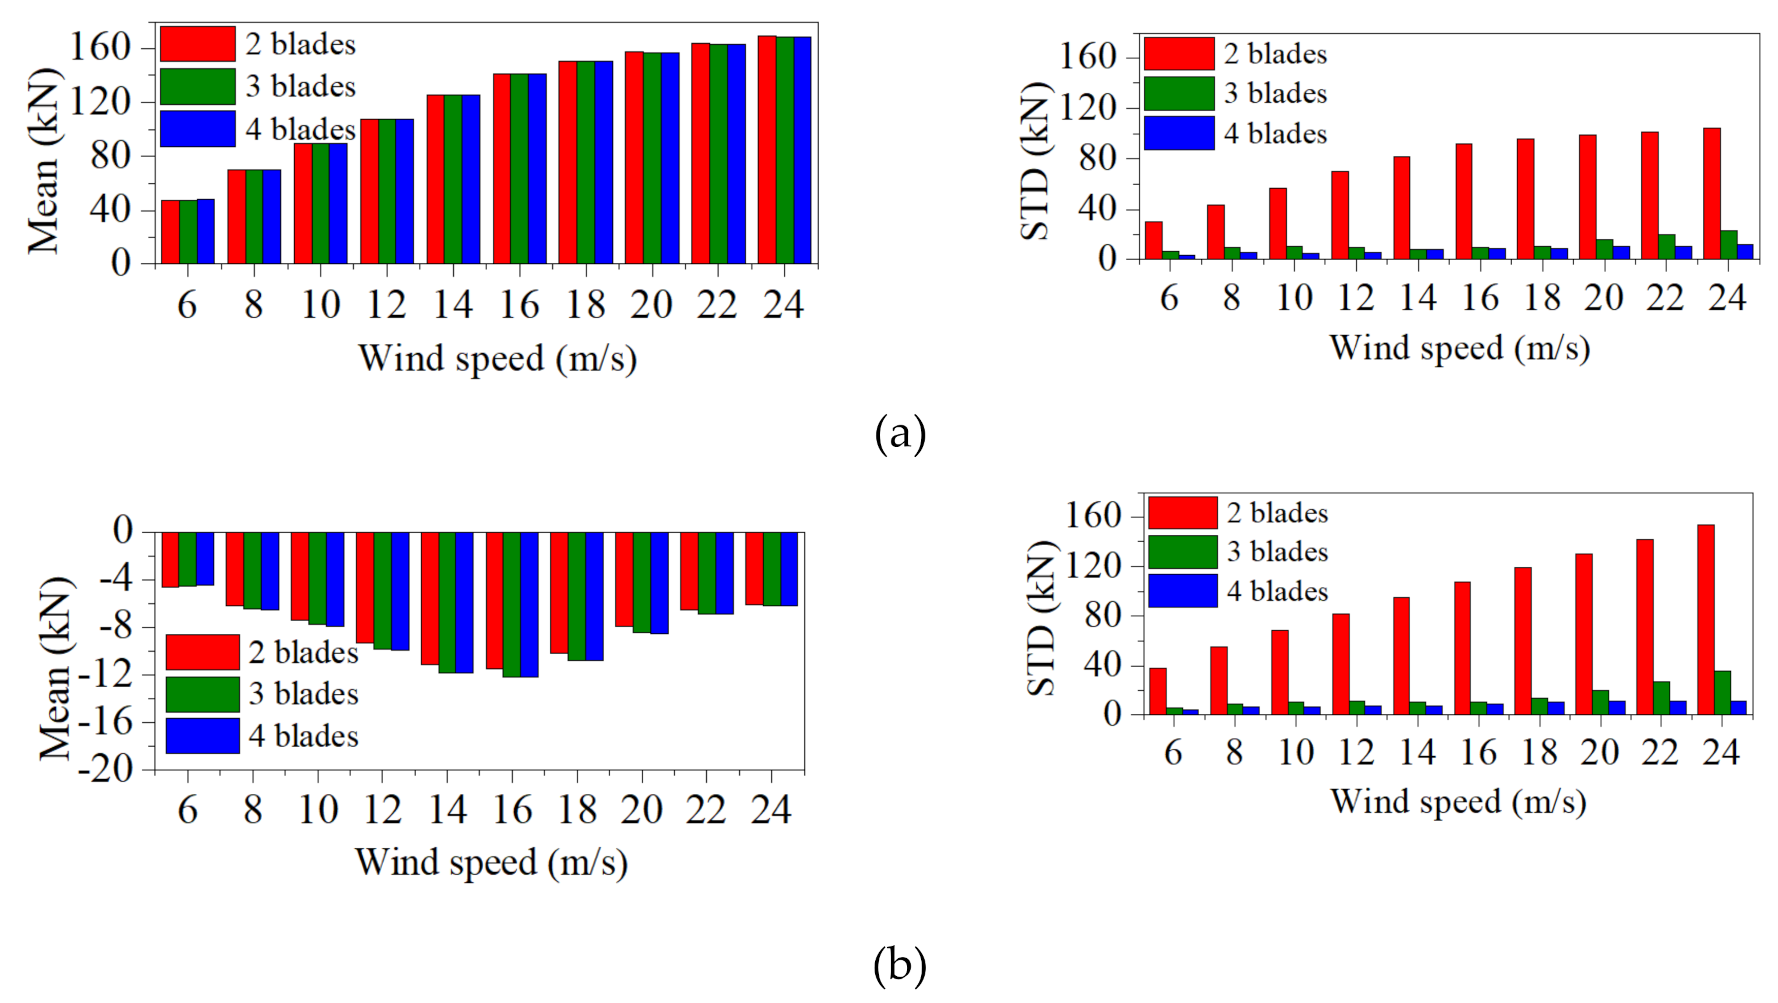
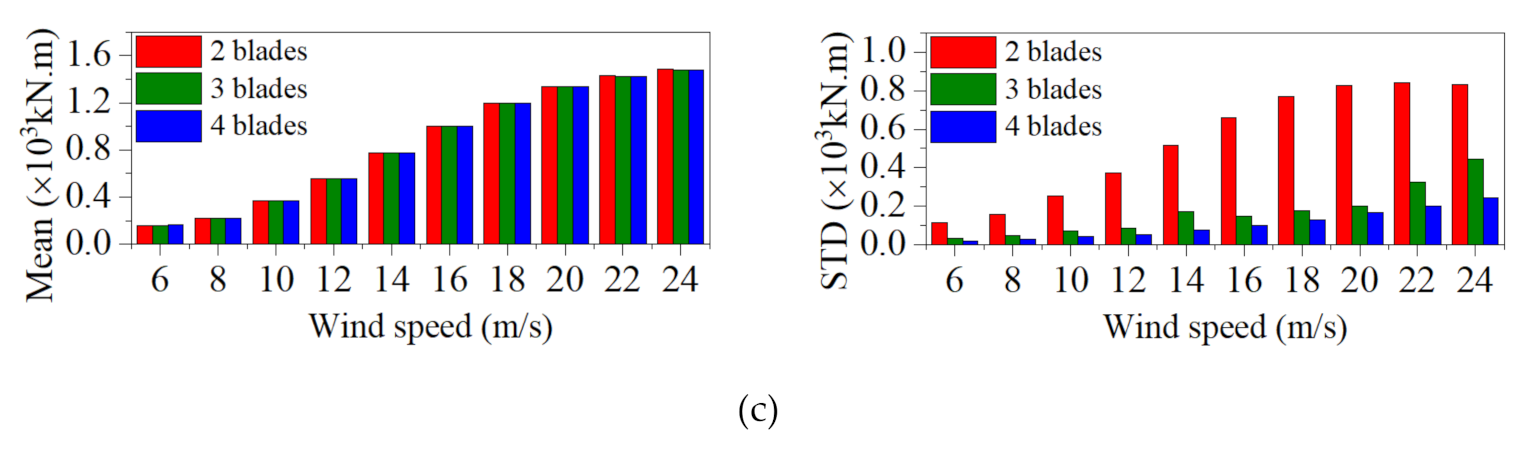
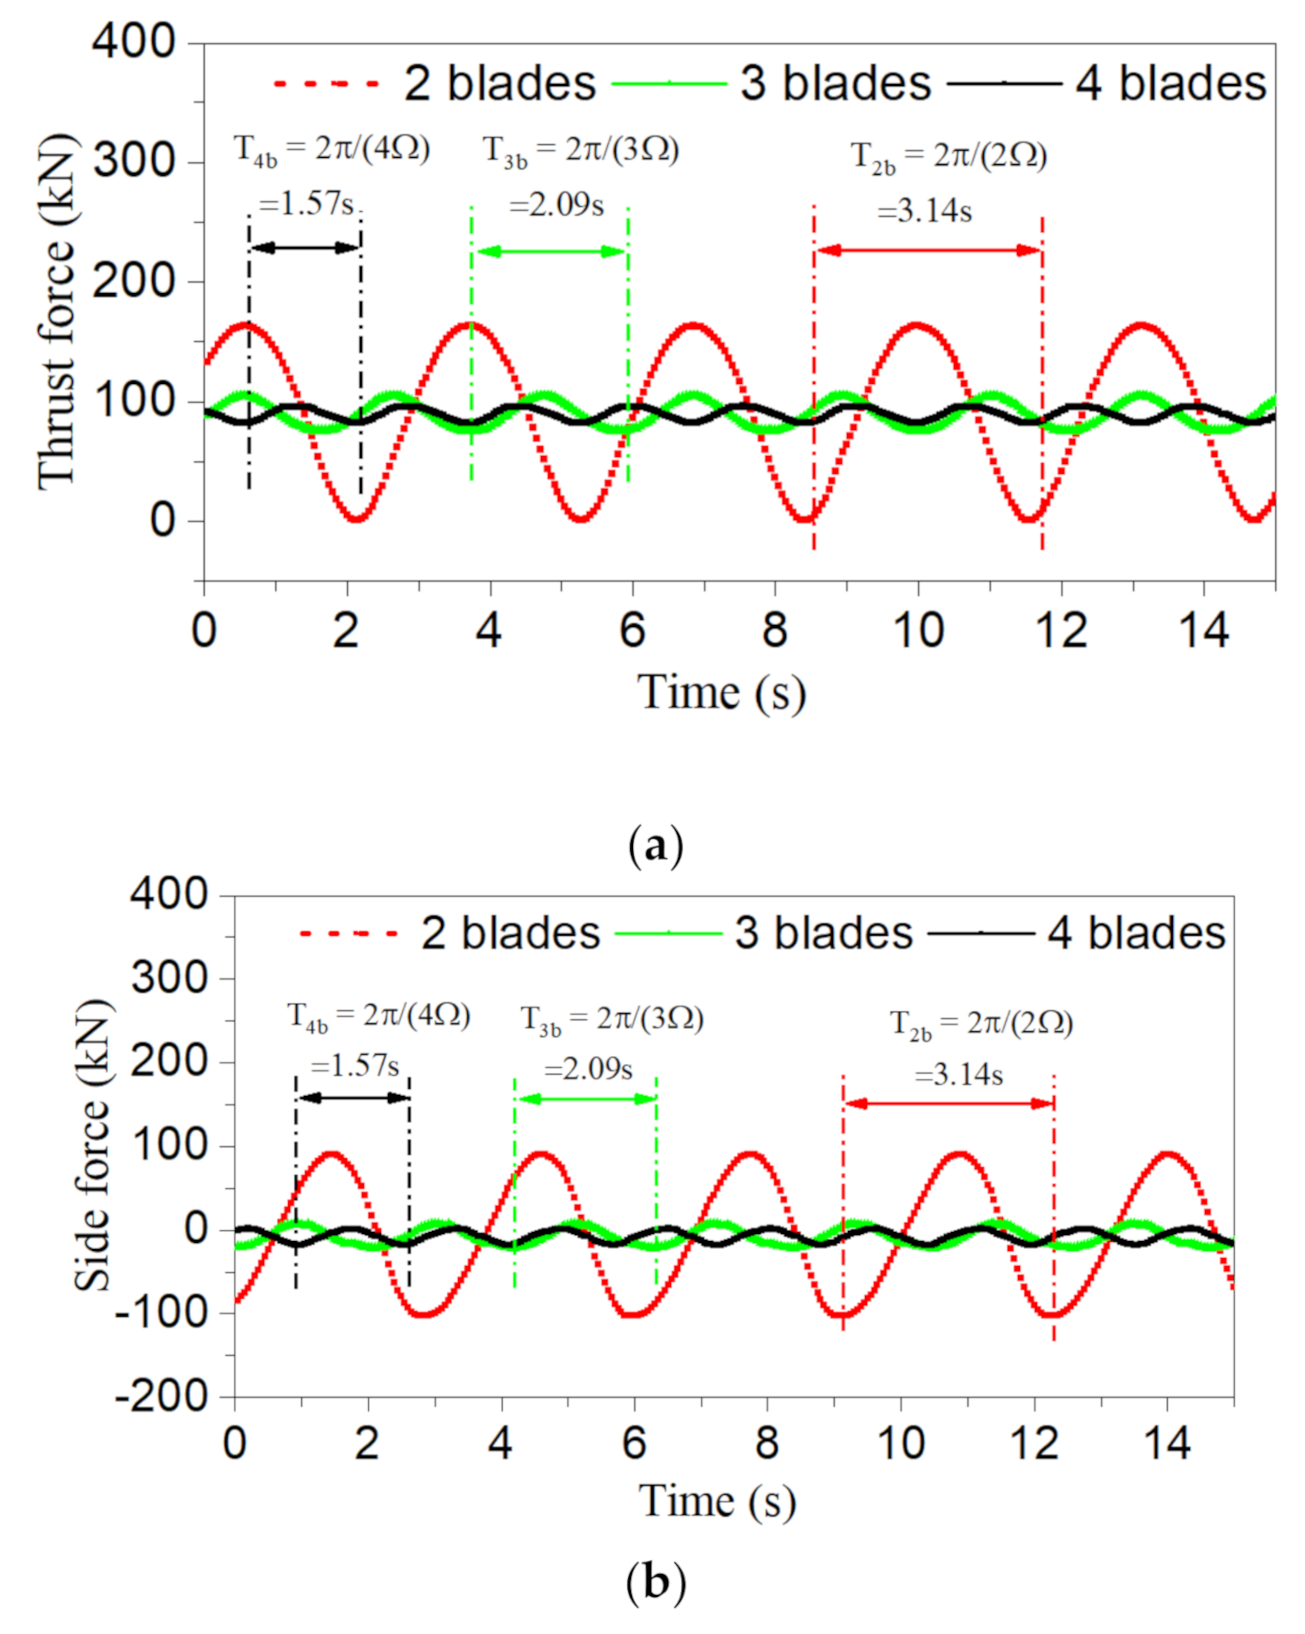
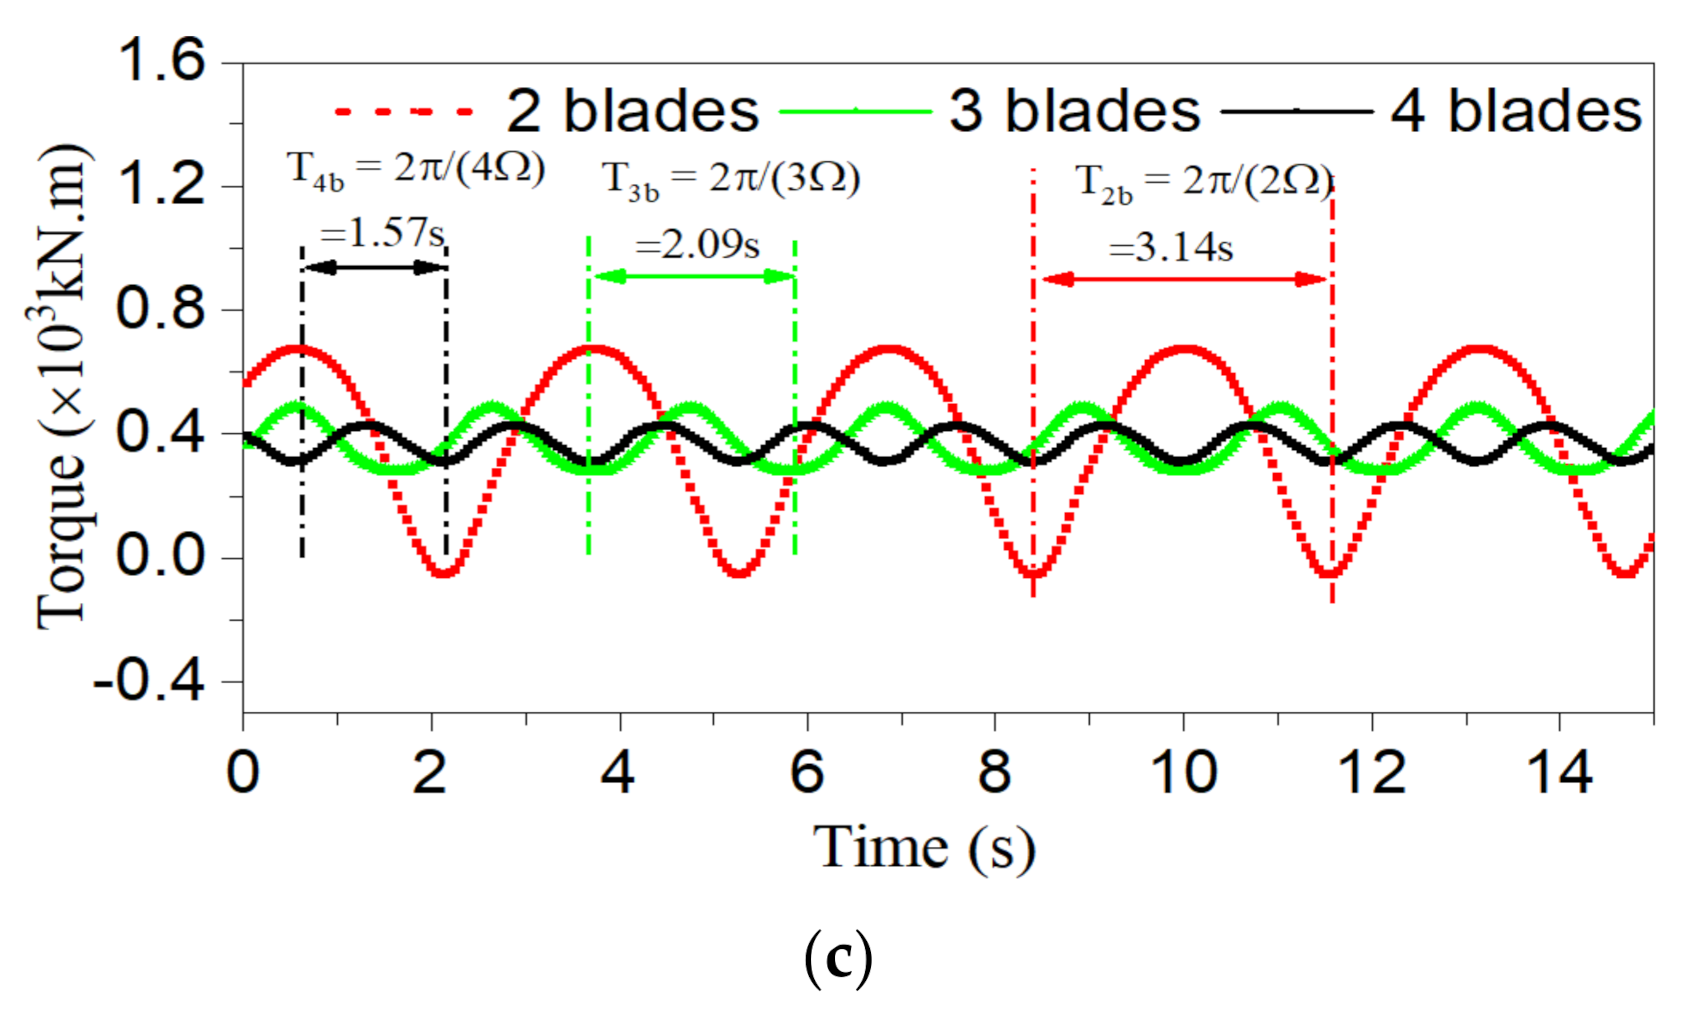
5.1. Aerodynamic-Loading Characteristics of Two-to-Four-Bladed VAWTs

Figure 16 presents a schematic of the aerodynamic loading (thrust, side force, and toque) on the rotors. The thrust is in the wind direction, the side force is in the crosswind direction, and the torque is the moment at the rotor center. Figure 17 compares the mean values and standard deviations (STDs) of the aerodynamic loadings of two-to-four-bladed VAWTs at different steady wind speeds. Although the mean thrusts, side forces, and torques of the three turbines are very close to each other at the same wind speed, the small discrepancies occur because of their different blade chord lengths, which cause slightly different dynamic stall effects. However, the STDs of aerodynamic loading show obvious decreases with the increasing blade numbers, which confirms the discovery by Cheng et al. [17]. It is worth noting that, although the side force has much smaller mean values than the thrust, its STDs are higher, especially at high wind speeds. This illustrates that the side force can cause greater fatigue damage to structures than the thrust. Therefore, unlike many other engineering structures, the potential fatigue damage to VAWT towers is most likely to occur at sites aligned with the crosswind direction.
The aerodynamic-loading histories of the three VAWTs, each at a steady wind speed of 10 m/s, are compared in Figure 18. Compared to the three- and four-bladed VAWTs, the aerodynamic-loading amplitudes of the two-bladed VAWT are much higher because the drag and lift forces on its blades reach the minimum and maximum values simultaneously. Additionally, the amplitudes of the aerodynamic loading decrease with the blade numbers, especially when the number of blades is increased from two to three. Viewed from this perspective, increasing the numbers of blades helps to improve the structural fatigue life because the stress-cycle numbers that the structures can withstand are greater when the VAWTs are subjected to more moderate action amplitudes. On the other hand, the frequency increases with the blade numbers. As is illustrated in Figure 18, the frequencies of the two-, three- and four-bladed VAWTs are 2 rad/s, 3 rad/s, and 4 rad/s, respectively. Generally, higher frequencies mean that the structures will suffer more cyclic actions during the same period, which probably accelerates the fatigue-damage accumulations. Therefore, because of the double-edged-sword effect of the changing blade numbers, it is difficult to judge how the fatigue lives of VAWT structures vary with the blade numbers before making comprehensive assessments.

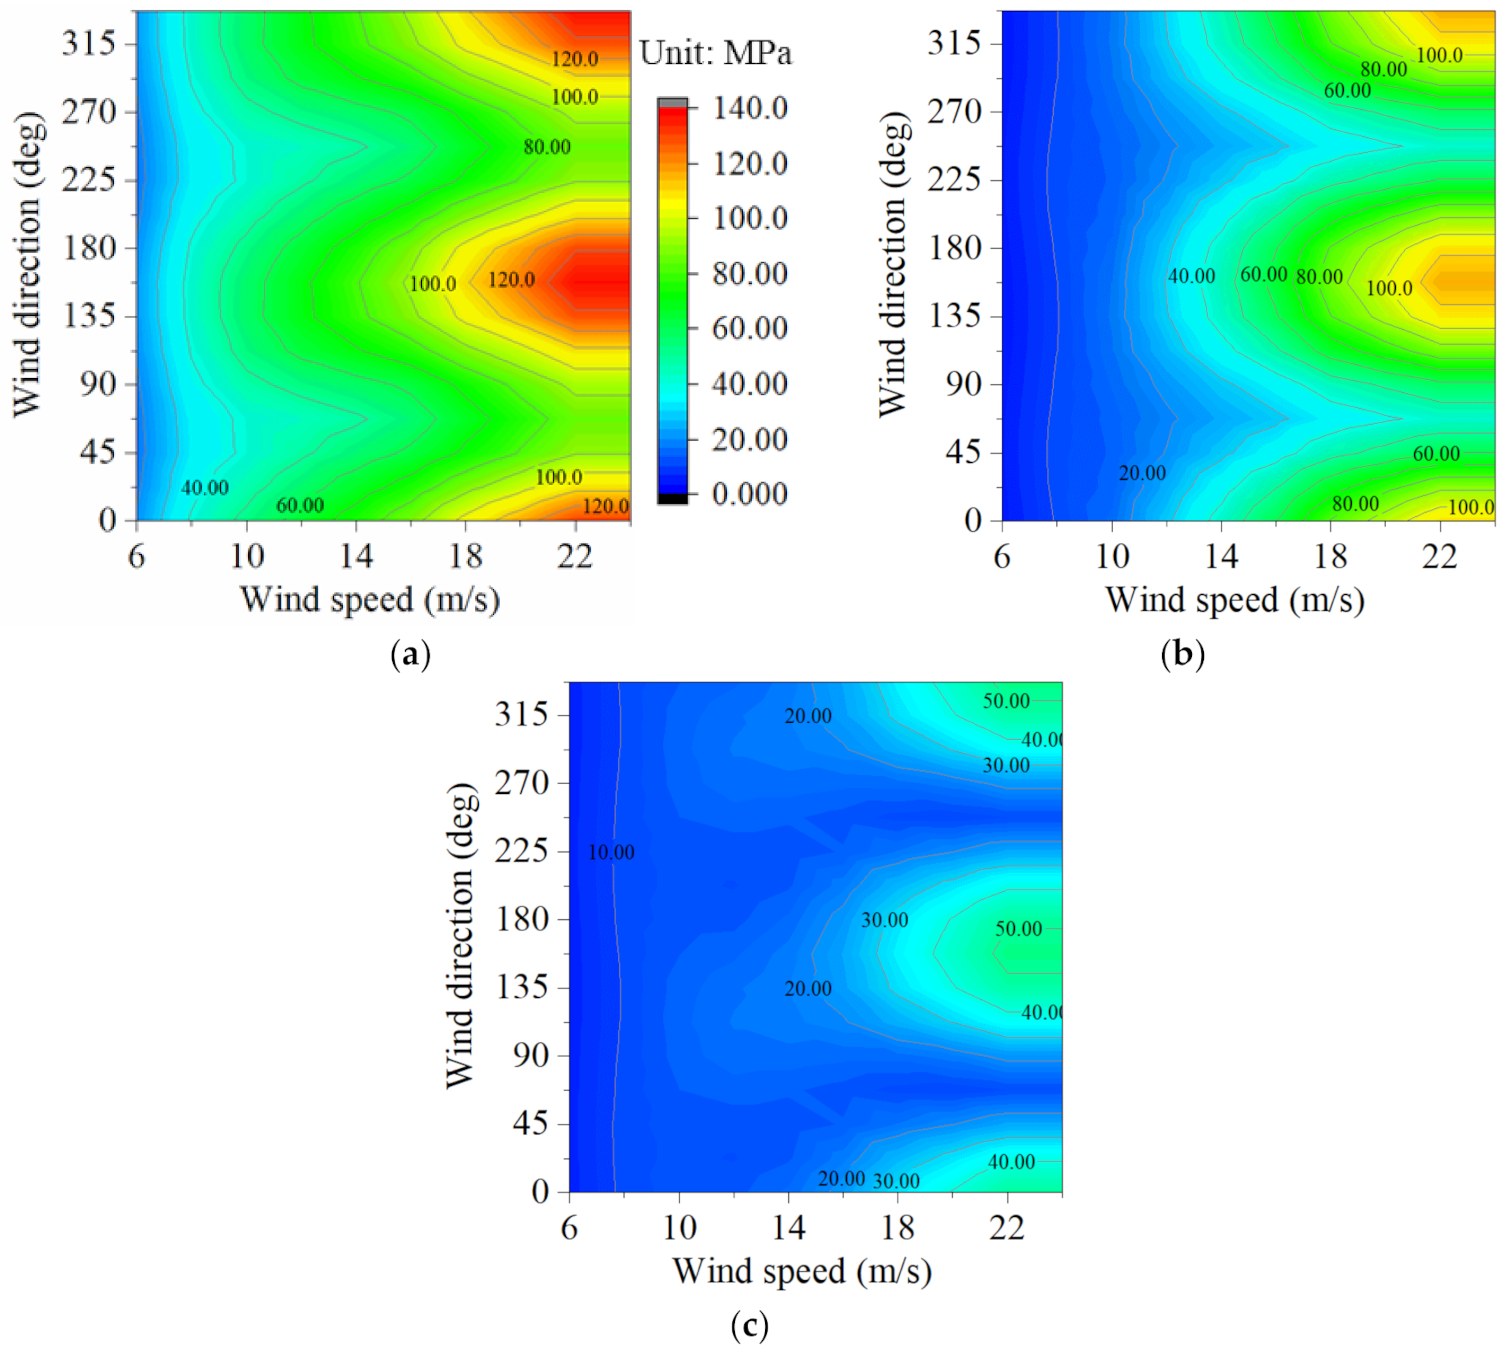
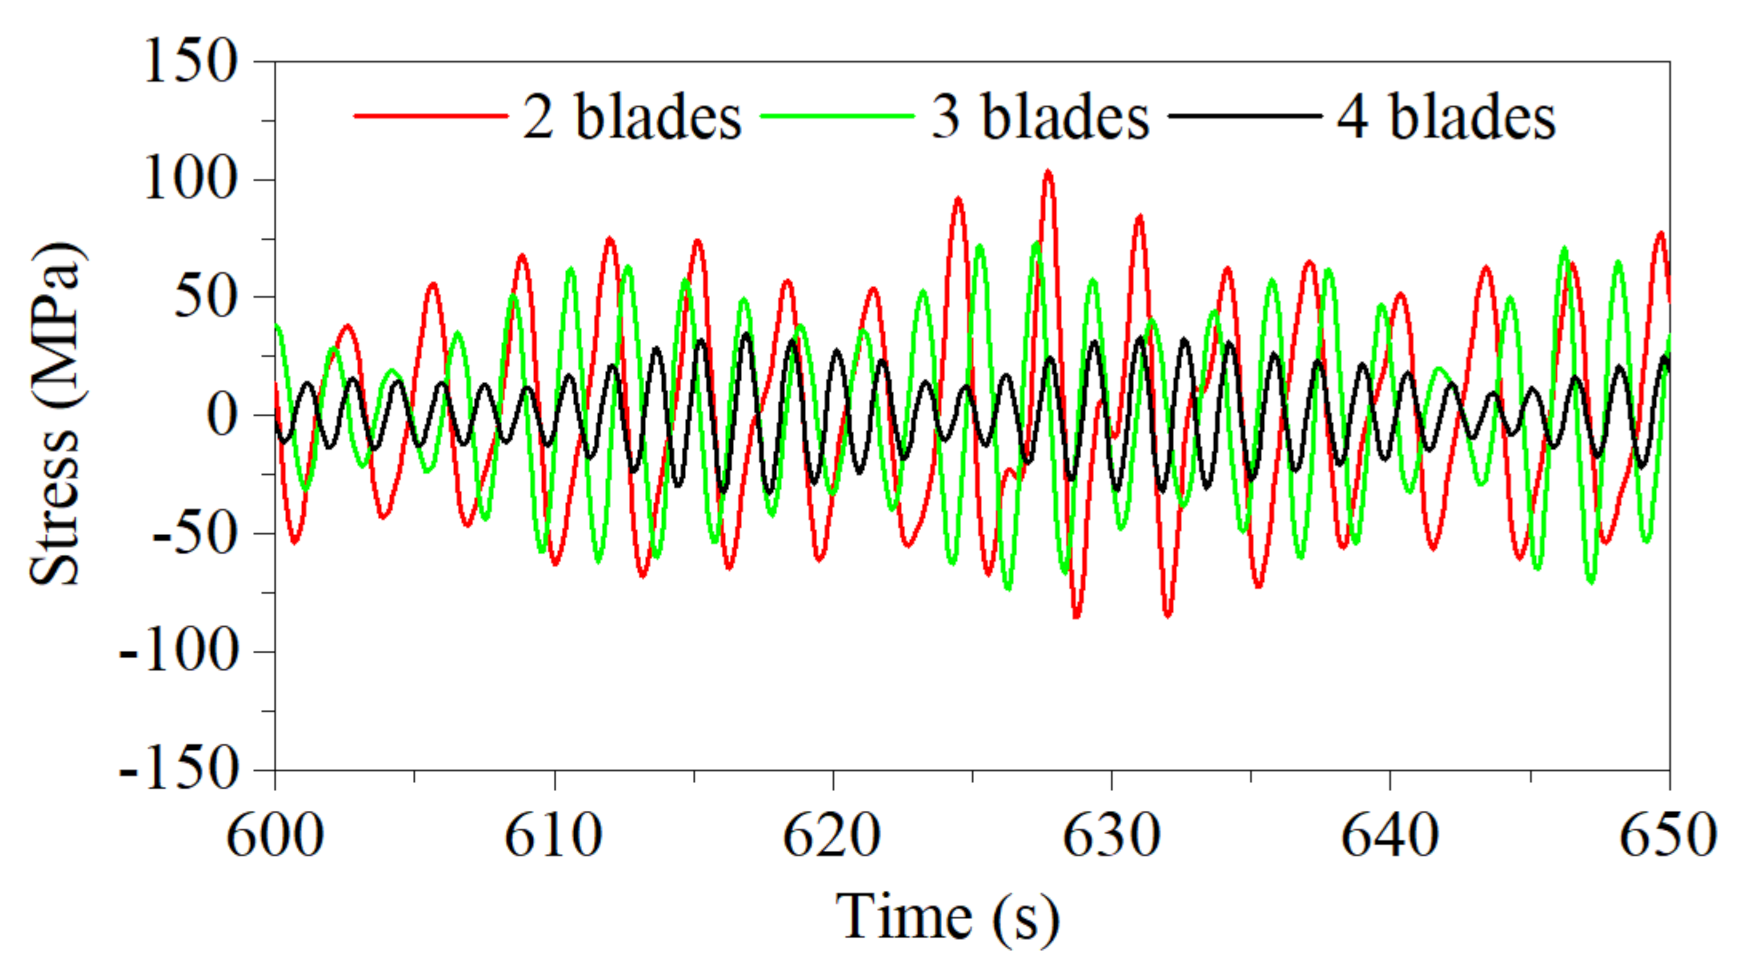
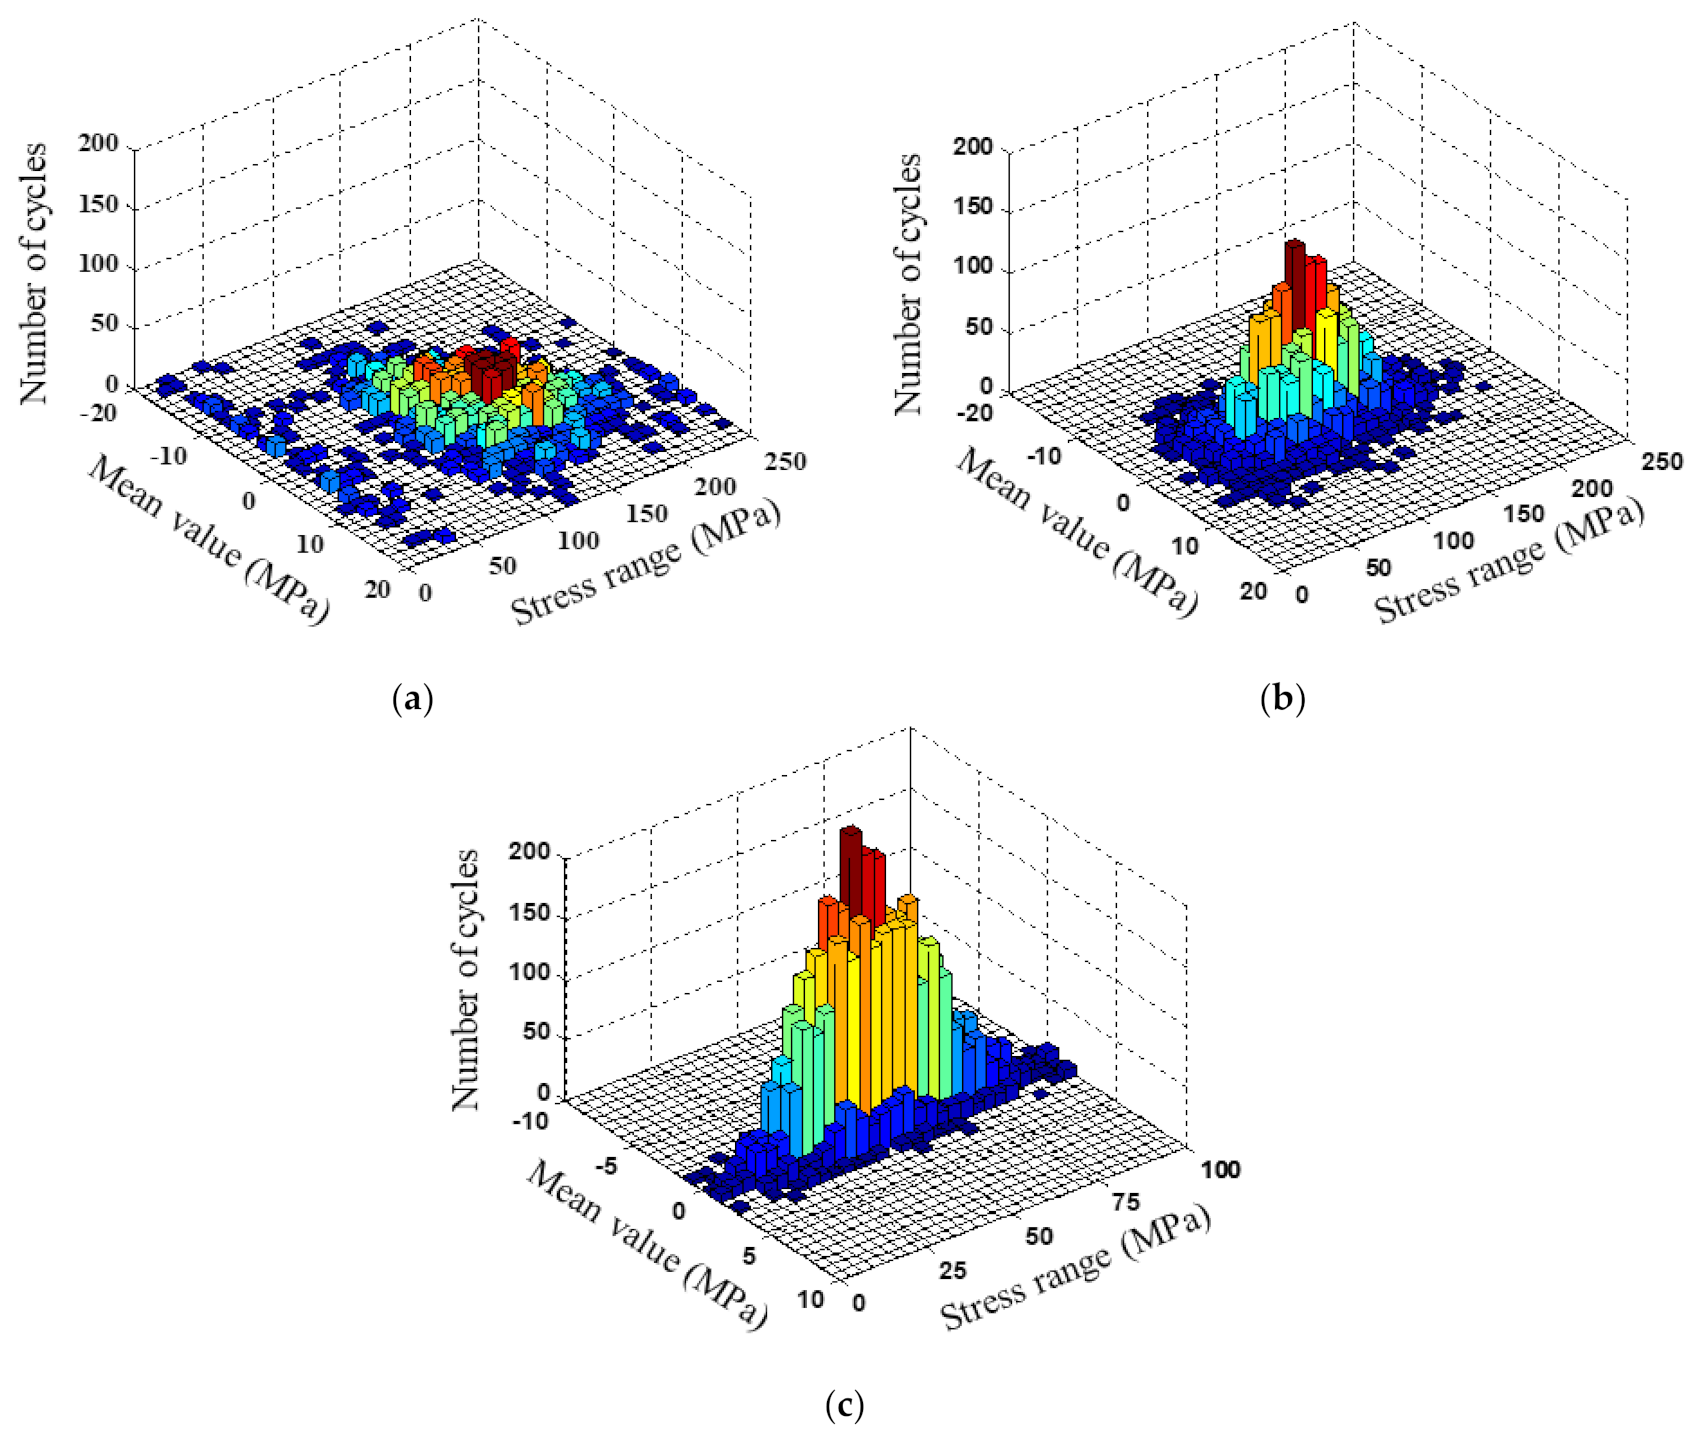
5.2. Stress Response at Location of Critical Fatigue Damage

Although the standards of the IEC61400-1 [29] and the DS472 [47] require that the dynamic-response analysis of wind turbines should consider the start-up, normal-operation, shut-down, and parked states, this study only includes the normal-operation state, which contributes to more than 99% of the total fatigue damage [48]. For the designed VAWTs, the normal operation state corresponds to a mean wind speed interval of 5–24 m/s (Table 1) in the possible wind directions from 0–360 deg. The joint probability distribution of the wind speed and direction is already illustrated in Figure 5. Because the increments of the wind speed and the wind direction are 1 m/s and 22.5 deg, respectively, there are a total of 320 = 20 × 16 simulations for each VAWT. The tower base, Point F (Figure 8a,e), located at the site near the cross-prevailing wind direction, was selected as the potential fatigue-damage location because the aerodynamic loading of the side force probably causes more fatigue damage than the thrust, as was mentioned in the above discussions in Section 5.1. The turbulent-wind field in the simulations was generated on the basis of the method in Section 2.1. Each simulation case lasts 3.2 hr, and the first 0.2 hr were filtered off to alleviate the start-up transience.
For the two-to-four-bladed VAWTs, the effective stress range contours at Point F under different wind speed and direction cases are illustrated in Figure 19. The effective stress range increases with the wind speeds, especially in wind directions of between 157.5 deg and 337.5 deg, where the dynamic stress is greatly affected by the side force. Moreover, it was found that the effective stress range of the two-bladed VAWT is always larger than the three- and four-bladed VAWTs under the same wind speed and direction. The effective stress ranges of the two-, three- and four-bladed VAWTs reach their respective maximum values of 140 MPa, 115 MPa, and 80 MPa when the wind speed is 24 m/s, and when the wind direction is around 157.5 deg. The parts of the corresponding stress histories are also presented in Figure 20. Using the rainflow algorithm [40], the mean values and amplitudes of the stress cycles are counted from the 3-hr stress histories, as is shown in Figure 21. It was found that the four-bladed VAWT has relatively smaller stress ranges than the two- and three-bladed VAWTs, but it experiences more stress cycles. Within the 3-hr simulations, the numbers of cycles experienced by the two-, three-, and four-bladed VAWTs were 3596, 5079, and 6677, respectively (Table 3).

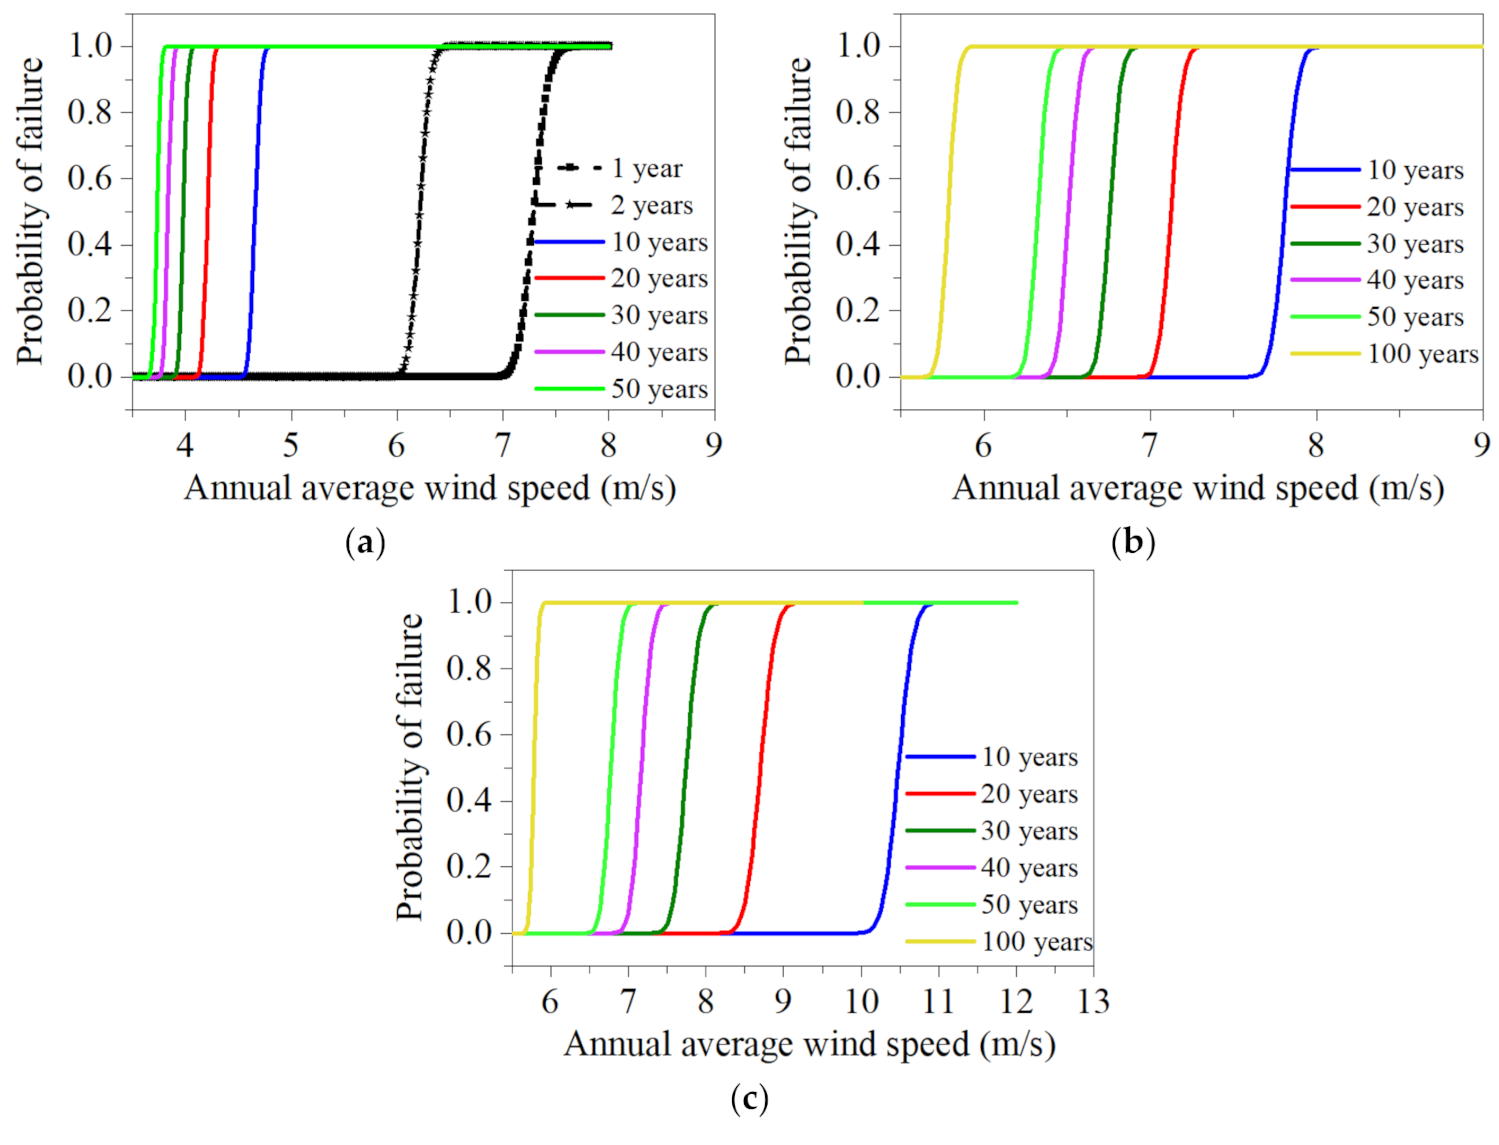
5.3. Fatigue-Life Evaluation in Crack-Initiation Stage

The fatigue failure probabilities in the crack-initiation stage for the two-to-four-bladed VAWTs under different annual average wind speeds are plotted in Figure 22. For the two-bladed VAWT, the tower base can withstand 50, 40, 30, 20, and 10 years at annual average wind speeds of 3.66, 3.76, 3.90, 4.11, and 4.55 m/s, respectively, with the same failure probability of 10−2. For the three-bladed VAWT, the corresponding annual average wind speeds are 6.21, 6.38, 6.63, 6.99, and 7.66 m/s, respectively. For the four-bladed VAWT, the corresponding annual average wind speeds are 6.55, 6.91, 7.45, 8.35, and 10.12 m/s, respectively. If the three turbines are installed at a site with an annual average wind speed of 7.0 m/s, the two-bladed VAWT has almost no chance of failure in the first year, but would experience failure in any time longer than two years, with a probability of 100%. The three-bladed VAWT has almost no chance of failure in the first 10 years, but has failure probabilities of 1.35 and 100% in the 20th and 30th years, respectively. The four-bladed VAWT has almost no chance of failure in the first 30 years, but has failure probabilities of 6.74 and 100% in the 40th and 50th years, respectively.
The material parameter, A (Equation (18)), adopts the mean value: A = 65.9 × 10 10 MPa3. The fatigue-life curves of the two-to-four-bladed VAWTs at different annual average wind speeds are illustrated in Figure 23. As expected, the fatigue-life curves of the three VAWTs show decreases with the increasing annual average wind speeds. At the given annual average wind speed of 6 m/s, the fatigue lives of the four- and three-bladed VAWTs will reach up to 82 and 72 years, respectively, which are 35.6 and 31.3 times the fatigues life of the two-bladed VAWT (2.3 years), respectively. When the annual average wind speed is increased to 10 m/s, the fatigue lives of the four- and three-bladed VAWTs will be 11.5 and 1.6 years, respectively, which are 38.3 and 5.3 times the fatigue lives of the two-bladed VAWT (0.3 years), respectively. One conclusion is that increasing the number of blades from two to three improves the fatigue life of the tower base to a greater degree than increasing it from three to four, as the annual average wind speed is between 6 and 7 m/s, while the latter becomes the more effective way to improve the fatigue life, as the wind speed is beyond 7 m/s. Moreover, from the scaled-in image in Figure 23, it can be seen that, when the annual average wind speed is below 5.9 m/s, the three-bladed VAWT shows a better performance than the four-bladed VAWT in terms of the fatigue life. Similar phenomena can also be found from the failure probability curves over 100 years in Figure 22b,c. Therefore, another conclusion is that the fatigue lives of VAWTs with more blades are not always longer at given wind speeds. The design of VAWTs with three blades is the preferred choice for installation sites with low wind speeds.
The double-edged-sword effect mentioned in Section 5.1 can be used to explain the above findings. Although VAWTs with more blades have smaller effective stress ranges (Figure 19), they experience more stress cycles (Table 3). The three-bladed VAWT has much smaller stress ranges than the two-bladed VAWT (Figure 19a,b), and also has fewer stress cycles than the four-bladed VAWT (Table 3), which results in its best fatigue performance at low wind speeds. However, the effective stress ranges of the three-bladed VAWT increase sharply with increasing wind speeds, and they are even comparable to that of the two-bladed VAWT at high wind speeds. As a result, the fatigue performance of the three-bladed VAWT degrades more than the four-bladed VAWT with increasing wind speeds.
The distributions of the yearly fatigue cumulative damage along the wind direction and wind speed, at an annual average wind speed of 7 m/s, are illustrated in Figure 24. The two-bladed VAWT always accumulates more fatigue damage than the three- and four-bladed VAWTs at a given wind direction and speed. In Figure 24a, it can be seen that the yearly fatigue cumulative damage is greatly affected by the wind directions, and that the fatigue damage is more severely accumulated at wind directions with higher occurrence probabilities. As is illustrated in Figure 24b, the yearly fatigue cumulative damage is obvious when the wind speeds are between 6 and 12 m/s.

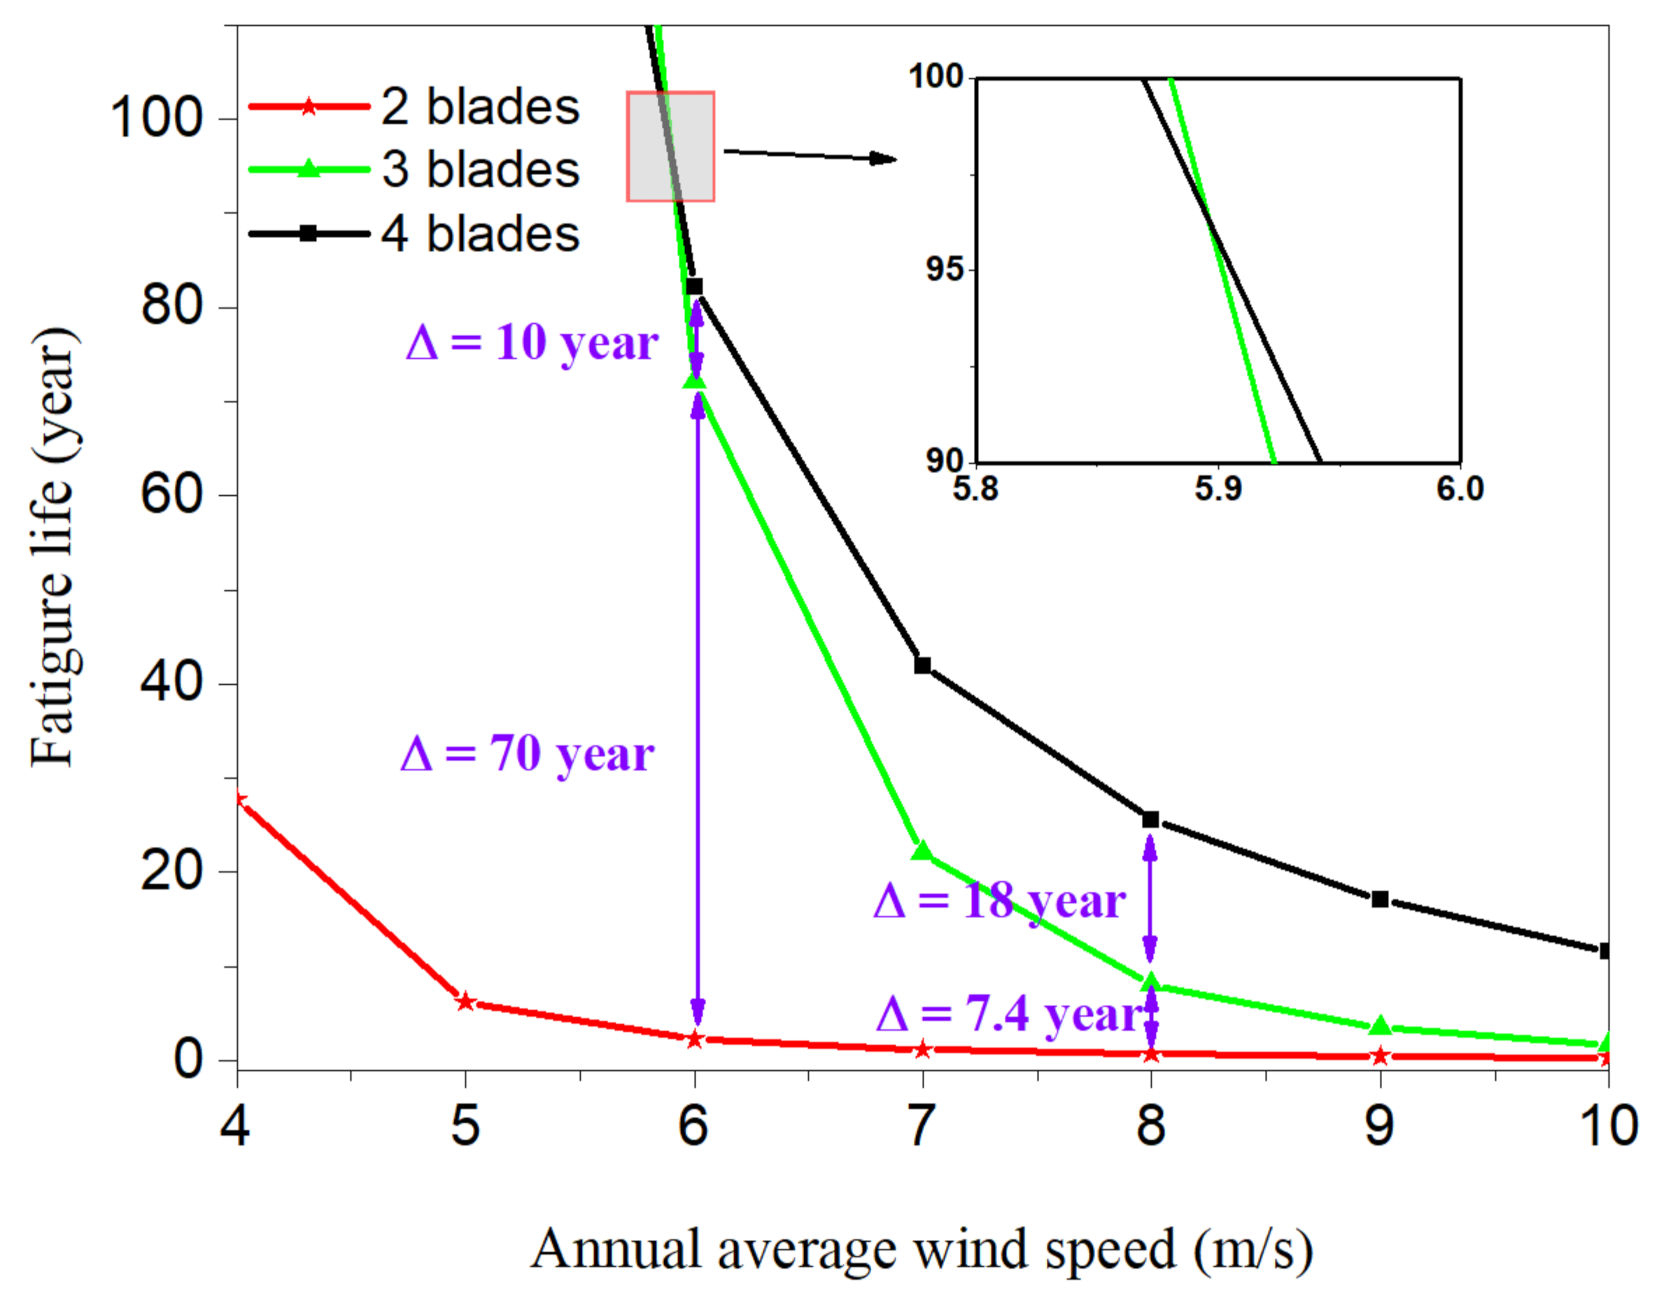
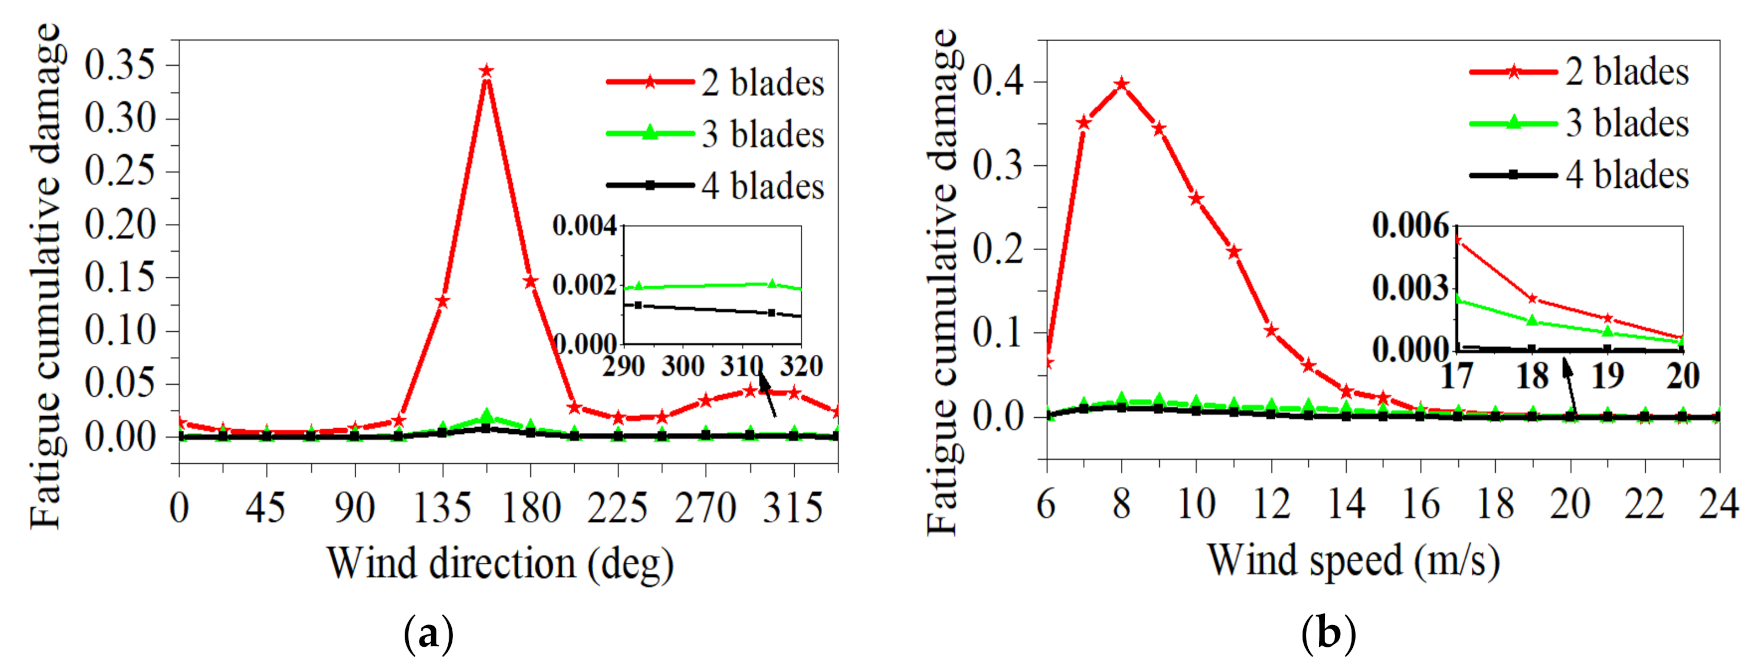
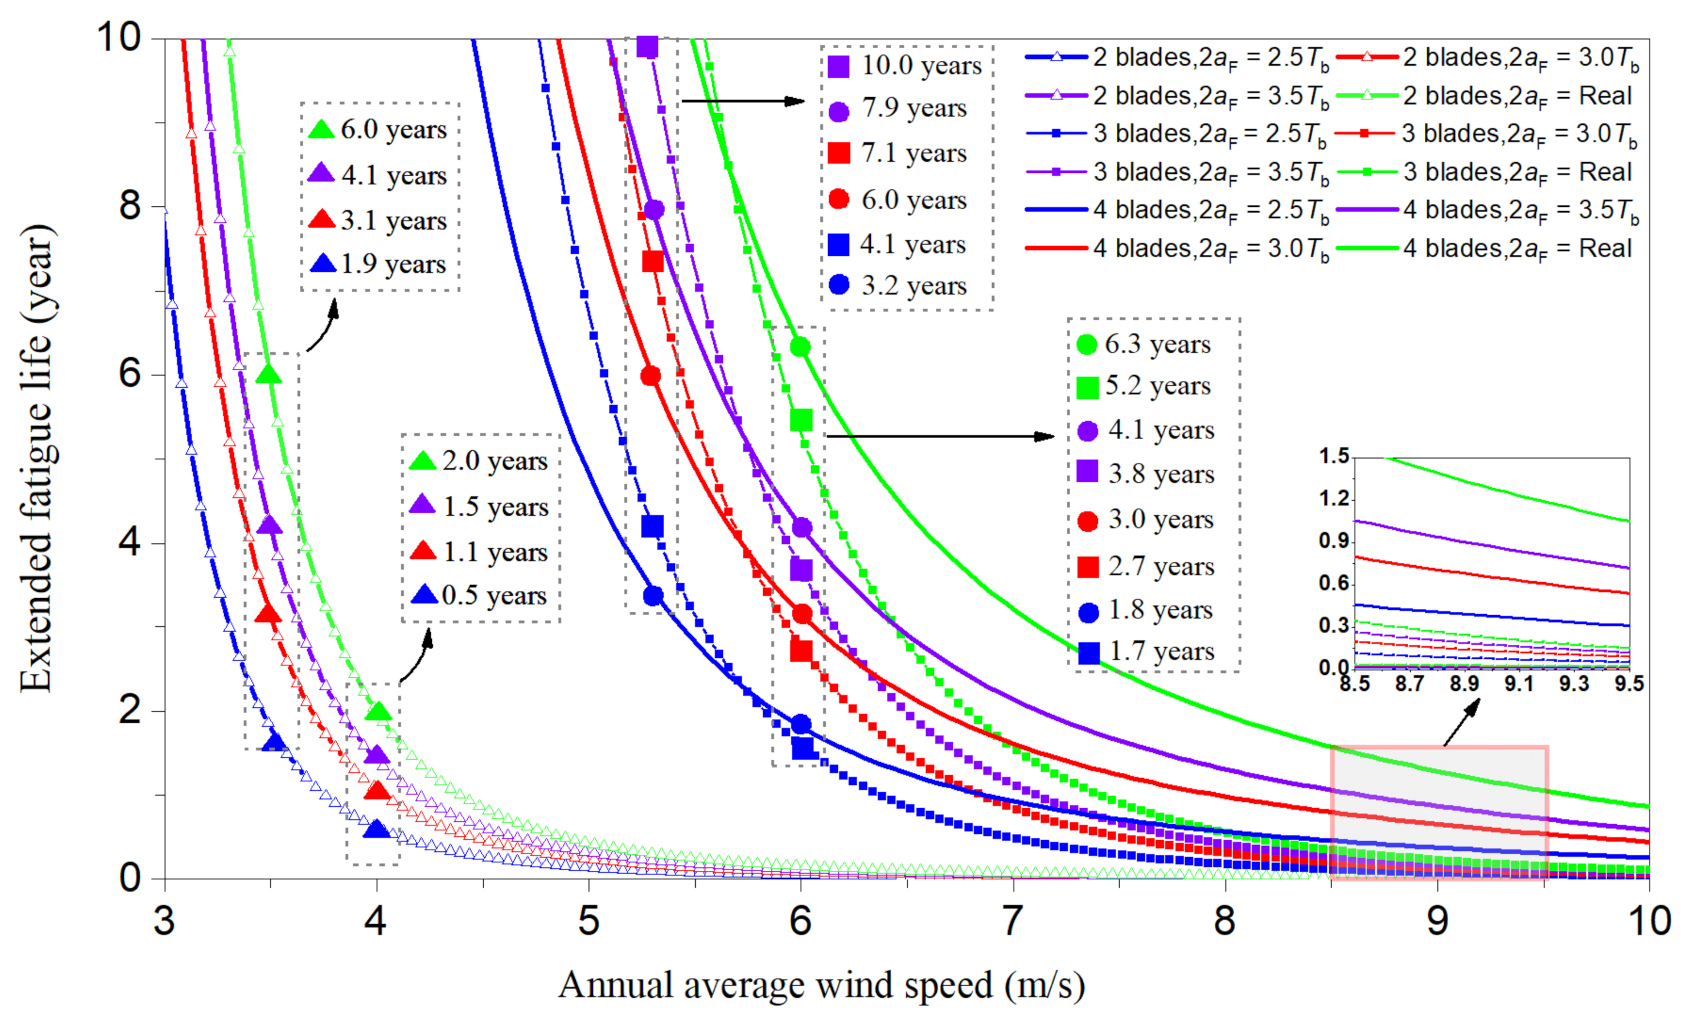
5.4. Fatigue-Life Evaluation in Crack-Propagation Stage

The results presented in Section 5.3 only consider the fatigue life of the tower base in the crack-initiation stage, where the invisible crack length gradually grows into a detectable size. After this, the crack development enters the propagation stage, where it continuously grows until plastic collapse occurs.
The damage levels are defined as the ratio of the failure-crack size (aF) to the tower-wall thickness (Tb). The extended fatigue-life curves of the two-to-four-bladed VAWTs in the crack-propagation stage are illustrated in Figure 25. It is obvious that both the three- and four-bladed VAWTs show better fatigue performance than the two-bladed VAWT in terms of the extended fatigue life in the crack-propagation stage. However, the advantages of the three- and four-bladed VAWTs correspond to distinct wind-speed ranges. The former has a longer extended service life when the annual average wind speed is below 5.5 m/s, while the latter is better at higher wind speeds.
For the two-bladed VAWT, the extended service lives are 1.9, 3.1, 4.1, and 6.0 years, from the development of the initial crack length (2aI = 2.0Tb) to the 2aF = 2.5Tb, 2aF = 3.0Tb, 2aF = 3.5Tb, and 2aF = Real (Equation (26)) under the annual average wind speed of 3.5 m/s. However, if the annual average wind speed is increased to 4.0 m/s, the extended service life decreases sharply, and the corresponding values are 0.5, 1.1, 1.5, and 2.0 years, respectively.
For the three- and four-bladed VAWTs, at an annual average wind speed of 5.25 m/s (<5.5 m/s), the corresponding extended service lives of the three-bladed VAWT are 4.1, 7.1, and 10.0 years, which are all longer than the service lives of the four-bladed VAWT of 3.2, 6.0, and 7.9 years. Although the extended service lives of both the VAWTs decline with the increasing annual average wind speeds, the four-bladed VAWT has the corresponding extended service lives of 1.8, 3.0, 4.1, and 6.3 years, which are already longer than those of the three-bladed VAWT of 1.8, 2.7, 3.8, and 5.2 years, at an annual average wind speed of 6 m/s (>5.5 m/s).

6. Conclusions

This study investigates the effects of the blade numbers on the fatigue lives of VAWT tower bases. Three straight-bladed VAWTs, with the same solidity ratios but with different numbers of blades (from 2 to 4) were designed. The joint probability distribution of the wind speed and direction at the potential installation site of the VAWTs was established. The aerodynamic-loading characteristics and the dynamic stress response of the turbines were investigated. The fatigue lives of the three turbines in the crack-initiation and crack-propagation stages were evaluated and compared. The conclusions are as follows:
The simulations under steady wind speeds are used to capture the effects of the blade numbers on the aerodynamic loadings of the three VAWTs. The variation amplitudes of the thrust, side force, and torque decrease with the number of blades. In particular, increasing the number of blades from two to three better helps to reduce more variations than increasing it from three to four does.
The four-bladed VAWT has relatively smaller stress ranges at the tower base than the two- and three-bladed VAWTs, but it will experience more stress cycles. The fatigue lives of the three VAWTs are influenced by two aspects, namely, the stress ranges and the stress cycles, simultaneously. Increasing the number of blades from two to three in the crack-initiation stage helps to improve the fatigue life of the tower base more significantly than increasing it from three to four when the annual average wind speed is between 6 and 7m/s, while the latter is a more effective way to improve the fatigue life when the annual average wind speed is beyond 7 m/s.
The extended fatigue lives of the tower bases in the crack-propagation stage are substantial for the three- and four-bladed VAWTs. At the given annual average wind speed of 5.25 m/s, the three-bladed VAWT has a longer extended fatigue life (10 years) than the 7.9 years of the four-bladed VAWT. However, the fatigue performance of the three-bladed VAWT degrades more than the four-bladed VAWT with increasing wind speeds. When the annual average wind speed is increased to 6 m/s, the fatigue performance of the three-bladed VAWT is not as good as the four-bladed VAWT, and the corresponding extended fatigue lives are 5.2 and 6.3 years, respectively.

Author Contributions

Conceptualization, H.-D.Z.; methodology, H.-D.Z.; software, H.-D.Z.; validation, B.Z. and S.-B.W.; formal analysis, H.-D.Z.; investigation, H.-D.Z., B.Z. and S.-B.W.; resources, H.-D.Z.; data curation, H.-D.Z.; writing—original draft preparation, H.-D.Z.; writing—review and editing, G.-Z.Z.; visualization, H.-D.Z. and G.-Z.Z.; supervision, H.-D.Z.; funding acquisition, H.-D.Z. All authors have read and agreed to the published version of the manuscript.

Funding

The financial supports received from the Key Promotion Program of Wind Energy Development (WED 20210820) are greatly acknowledged.

Institutional Review Board Statement

Not applicable.

Informed Consent Statement

Not applicable.

Data Availability Statement

Not applicable.

Conflicts of Interest

The authors declare no conflict of interest.

Abbreviation

α [-]Induced coefficient
α u [-]Induced coefficient at the upstream half-cycle
α d [-]Induced coefficient at the downstream half-cycle
u [m/s]Turbulent wind speed component
u ¯ m [m/s]Mean wind speed component
C o h [-]Correlation coefficient
f [Hz]Frequency component of wind speed
L r [m]Spatial distance between field points
L c [m]Coherence parameter
u ref [m/s]Wind speed at the reference height
z ref [m]Reference height
S i i [m2/s ]KAIMAL spectrum at point i
S j j [m2/s]KAIMAL spectrum at point j
S i j [m2/s]Cross-spectrum at points i and j
S [m2/s]Cross-spectrum matrix
H [m2/s]Lower triangular matrix
Δ f [Hz]Frequency interval
ϕ [rad]Phase angle
z [m]Height
κ [-]Ground roughness index
u an [m/s]Annual average wind speed
β [deg]Wind direction
Ω [rad/s]Rotor rotation speed
U c [m/s]Induced wind speed
θ [rad]Azimuthal angle
r [m]Rotor radius
N b [-]Blade number
C [m]Chord length
W [m/s]Wind speed seen by blades
W u [m/s]Wind speed seen by blades at the upstream half-cycle
W d [m/s]Wind speed seen by blades at the downstream half-cycle
φ [rad]Angle of attack
φ u [rad]Angle of attack at the upstream half-cycle
φ d [rad]Angle of attack at the downstream half-cycle
U [m/s]Far-field wind speed
U c [m/s]Induced wind speed
U e [m/s]Wind speed at the middle of disk
C tu [-]Normal force coefficient at the upstream half-cycle
C td [-]Normal force coefficient at the downstream half-cycle
C nu [-]Tangential force coefficient at the upstream half-cycle
C nd [-]Tangential force coefficient at the downstream half-cycle
C p [-]Power coefficient
P [MW]Power of wind turbine
ρ [kg/m3]Air density
l [m]Blade length
σ [-]Rotor solidity
σ y [MPa]Yield stress
λ [-]Tip speed ratio
R e y [-]Reynolds number
S re [MPa]Effective stress range
γ [-]Occurrence probability
N [cycle]Cycle number
A [-]Material parameter
T 0 [hr]Simulation time
F L [year]Expected fatigue life under the special case
D [-]Fatigue-damage index
N 0 [cycle]Cycle number during T 0 -hr
F life [year]Fatigue life
C g [ m / cycle / ( MPa m ) 3 ]Coefficient of crack-growth rate
m [-]Material constant
Δ K eff [MPa m ]Stress intensity factor
G [-]Dimensionless function of geometry and the relative crack length
a [mm]Crack length
a I [mm]Initial crack length
a F [mm]Final crack length
R b [m]Tower-wall curve radius
T b [mm]Tower-wall thickness
N I [cycle]Cycle number corresponding to the initial crack length
N F [cycle]Cycle number corresponding to the final crack length
N IF [cycle]Cycle number required for the crack-propagation stage
S t , max [MPa]Maximum tensile stress

References

  1. Exajoules, C.; Emissions, C.D. Statistical Review of World Energy June 2020; BP: London, UK, 2006. [Google Scholar]
  2. GWEC. Global Wind Energy Council. Global Wind Report 2021; GWEC: Brussels, Belgium, 2019. [Google Scholar]
  3. Barnes, A.; Hughes, B. Determining the impact of VAWT farm configurations on power output. Renew. Energy 2019, 143, 1111–1120. [Google Scholar] [CrossRef]
  4. Zheng, H.D.; Zheng, X.Y.; Zhao, S.X. Arrangement of clustered straight-bladed wind turbines. Energy 2020, 200, 117563. [Google Scholar] [CrossRef]
  5. Jonkman, J.M.; Buhl, M.L., Jr. FAST User’s Guide; National Renewable Energy Laboratory: Golden, CO, USA, 2005 October; pp. 365–366. [Google Scholar]
  6. Garrad Hassan, G.L. Bladed User Manual Version 4.2; Garrad Hassan & Partners Ltd.: Bristol, UK, 2012. [Google Scholar]
  7. Orcina, L.T.C. OrcaFlex User Manual: OrcaFlex Version 10.2 c; Daltongate Ulverston: Cumbria, UK, 2018. [Google Scholar]
  8. Larsen, T.J.; Hansen, A.M. How 2 HAWC2, the User’s Manual; Risø National Laboratory: Roksilde, Denmark, 2007. [Google Scholar]
  9. Balduzzi, F.; Bianchini, A.; Maleci, R.; Ferrara, G.; Ferrari, L. Critical issues in the CFD simulation of Darrieus wind turbines. Renew. Energy 2016, 85, 419–435. [Google Scholar]
  10. Zanforlin, S.; Nishino, T. Fluid dynamic mechanisms of enhanced power generation by closely spaced vertical axis wind turbines. Renew. Energy 2016, 99, 1213–1226. [Google Scholar]
  11. Strickland, J.H.; Webster, B.T.; Nguyen, T. A vortex model of the Darrieus turbine: An analytical and experimental study. J. Fluids Eng. 1979, 101, 500–505. [Google Scholar] [CrossRef]
  12. Chen, N. Aerothermodynamics of Turbomachinery: Analysis and Design; John Wiley & Sons: Hoboken, NJ, USA, 2011. [Google Scholar]
  13. Hirsch, I.H.; Mandal, A.C. A cascade theory for the aerodynamic performance of Darrieus wind turbines. Wind. Eng. 1987, 11, 164–175. [Google Scholar]
  14. Madsen, H.A.; Paulsen, U.S.; Vitae, L. Analysis of VAWT aerodynamics and design using the Actuator Cylinder flow model. J. Phys. Conf. Ser. 2014, 555, 012065. [Google Scholar] [CrossRef] [Green Version]
  15. Paraschivoiu, I. Double-Multiple Streamtube Model for Darrieus in Turbines; NASA Lewis Research Center: Cleveland, OH, USA, 1981. [Google Scholar]
  16. Islam, M.; Ting, D.S.K.; Fartaj, A. Aerodynamic models for Darrieus-type straight-bladed vertical axis wind turbines. Renew. Sustain. Energy Rev. 2008, 12, 1087–1109. [Google Scholar] [CrossRef]
  17. Cheng, Z.; Madsen, H.A.; Gao, Z.; Moan, T. Effect of the number of blades on the dynamics of floating straight-bladed vertical axis wind turbines. Renew. Energy 2017, 101, 1285–1298. [Google Scholar] [CrossRef]
  18. Zheng, X.Y.; Zheng, H.D.; Lei, Y.; Chen, H. Nonlinear stochastic responses of a newly developed floating wind-solar-aquaculture system. Ocean. Eng. 2021, 241, 110055. [Google Scholar] [CrossRef]
  19. Zheng, H.D.; Zheng, X.Y.; Lei, Y.; Li, D.-A.; Xiang, C. Experimental validation on the dynamic response of a novel floater uniting a vertical-axis wind turbine with a steel fishing cage. Ocean. Eng. 2022, 243, 110257. [Google Scholar] [CrossRef]
  20. Liu, L.; Guo, Y.; Zhao, H.; Tang, Y. Motions of a 5 MW floating VAWT evaluated by numerical simulations and model tests. Ocean. Eng. 2017, 144, 21–34. [Google Scholar] [CrossRef]
  21. Möllerström, E.; Gipe, P.; Beurskens, J.; Ottermo, F. A historical review of vertical axis wind turbines rated 100 kW and above. Renew. Sustain. Energy Rev. 2019, 105, 1–13. [Google Scholar]
  22. Manwell, J.F.; McGowan, J.G.; Rogers, A.L. Wind Energy Explained: Theory, Design and Application; John Wiley & Sons: Hoboken, NJ, USA, 2010. [Google Scholar]
  23. Nijssen, R.P.L. Fatigue Life Prediction and Strength Degradation of Wind Turbine Rotor Blade Composites; Contractor Report SAND2006-7810P; Sandia National Laboratories: Albuquerque, NM, USA, 2006. [Google Scholar]
  24. Harte, R.; Van Zijl, G.P. Structural stability of concrete wind turbines and solar chimney towers exposed to dynamic wind action. J. Wind. Eng. Ind. Aerodyn. 2007, 95, 1079–1096. [Google Scholar] [CrossRef]
  25. Paredes, J.A.; Barbat, A.H.; Oller, S. A compression–tension concrete damage model, applied to a wind turbine reinforced concrete tower. Eng. Struct. 2011, 33, 3559–3569. [Google Scholar] [CrossRef]
  26. Do, T.Q.; van de Lindt, J.W.; Mahmoud, H. Fatigue life fragilities and performance-based design of wind turbine tower base connections. J. Struct. Eng. 2015, 141, 04014183. [Google Scholar] [CrossRef]
  27. Huo, T.; Tong, L. An approach to wind-induced fatigue analysis of wind turbine tubular towers. J. Constr. Steel Res. 2020, 166, 105917. [Google Scholar] [CrossRef]
  28. Fu, B.; Zhao, J.; Li, B.; Yao, J.; Teifouet, A.R.M.; Sun, L.; Wang, Z. Fatigue reliability analysis of wind turbine tower under random wind load. Struct. Saf. 2020, 87, 101982. [Google Scholar] [CrossRef]
  29. International Electrotechnical Commission. Wind Turbines-Part 1: Design Requirements, 3rd ed.; International Electrotechnical Commission: Geneva, Switzerland, 2006. [Google Scholar]
  30. Higham, N.J. Analysis of the Cholesky Decomposition of a Semi-Definite Matrix; Oxford University Press: Oxford, UK, 1990. [Google Scholar]
  31. Goode, J.S.; van de Lindt, J.W. Development of a semiprescriptive selection procedure for reliability-based fatigue design of high-mast lighting structural supports. J. Perform. Constr. Facil. 2007, 21, 193–206. [Google Scholar] [CrossRef]
  32. Leishman, J.G.; Beddoes, T.S. A Semi-Empirical model for dynamic stall. J. Am. Helicopter Soc. 1989, 34, 3–17. [Google Scholar]
  33. Huse, E. Current Force on Individual Elements of Riser Arrays. In Proceedings of the Second International Offshore and Polar Engineering Conference, San Francisco, CA, USA, 14–19 June 1992. [Google Scholar]
  34. Borg, M.; Manuel, L.; Collu, M.; Liu, J. Long-term global performance analysis of a vertical-axis wind turbine supported on a semi-submersible floating platform. Int. Conf. Offshore Mech. Arct. Eng. 2015, 56574, V009T09A066. [Google Scholar]
  35. Cheng, Z.; Wang, K.; Gao, Z.; Moan, T. A comparative study on dynamic responses of spar-type floating horizontal and vertical axis wind turbines. Wind Energy 2017, 20, 305–323. [Google Scholar] [CrossRef] [Green Version]
  36. Higham, D.J.; Higham, N.J. MATLAB Guide; Society for Industrial and Applied Mathematics: Philadelphia, PA, USA, 2016. [Google Scholar]
  37. ASCE–American Wind Energy Association. Recommended Practice for Compliance of Large Land-Based Wind Turbine Support Structures; American Wind Energy Association: Reston, VA, USA; Washington, DC, USA, 2011. [Google Scholar]
  38. Zheng, X.; Zheng, H.; Lei, Y.; Li, Y.; Li, W. An offshore floating wind–solar–aquaculture system: Concept design and extreme response in survival conditions. Energies 2020, 13, 604. [Google Scholar] [CrossRef] [Green Version]
  39. Zheng, H.D.; Fan, J. Progressive collapse analysis of a truss transmission tower-line system subjected to downburst loading. J. Constr. Steel Res. 2022, 188, 107044. [Google Scholar] [CrossRef]
  40. Niesłony, A. Determination of fragments of multiaxial service loading strongly influencing the fatigue of machine components. Mech. Syst. Signal Processing 2009, 23, 2712–2721. [Google Scholar] [CrossRef]
  41. Schilling, C.G. Fatigue of Welded Steel Bridge Members under Variable-Amplitude Loadings; NCHRP Report; Transportation Research Board: Washington, DC, USA, 1978. [Google Scholar]
  42. Miner, M.A. Cumulative damage in fatigue. J. Appl. Mach. 1945, 12, A159–A164. [Google Scholar] [CrossRef]
  43. Chung, H.Y.; Manuel, L.; Frank, K.H. Optimal Inspection of Fracture-Critical Steel Trapezoidal Girders: A Summary; Center for Transportation Research, University of Texas at Austin: Austin, TX, USA, 2004. [Google Scholar]
  44. Paris, P.; Erdogan, F. A critical analysis of crack propagation laws. J. Fluids Eng. 1963, 85, 528–533. [Google Scholar] [CrossRef]
  45. BS7910. Guide to Methods for Assessing the Acceptability of Flaws in Metallic Structures; British Standards Institution (BSI): London, UK, 2005. [Google Scholar]
  46. Dowling, N.E. Mechanical Behavior of Materials: Engineering Methods for Deformation, Fracture, and Fatigue; Prentice Hall international: Hoboken, NJ, USA, 1993. [Google Scholar]
  47. DEA. Loads and Safety of Wind Turbine Construction (DS472); Danish Engineering Association: Copenhagen, Denmark, 2017. [Google Scholar]
  48. Thomsen, K.; Madsen, P.H.; Jørgensen, E. Status og Perspektiver for Forskning I Aeroelasticitet. Lastgrundlag og Sikkerhed. Lastgrundlag og sikkerhed-DTU; Forskningscenter Risø: Roskilde, Denmark, 1997. [Google Scholar]
Figure 1. (a) Eole VAWT; (b) upper part of tower; (c) tower base (photo by Paul Gipe [21]).
Metals 12 00321 g001
Figure 2. Wind-field points.
Metals 12 00321 g002
Figure 3. VAWT wind farm located at Riyue mountain, Qinghai province, China.
Metals 12 00321 g003
Figure 4. Wind direction distribution for the potential site.
Metals 12 00321 g004
Figure 5. The joint probability distribution of wind speed and direction. (a) Annual average wind speed is 6 m/s. (b) Annual average wind speed is 10 m/s.
Metals 12 00321 g005
Figure 6. Track of rotational elements and schematic of the velocities.
Metals 12 00321 g006
Figure 7. The actuator disk and streamtubes in the DMS model.
Metals 12 00321 g007
Figure 8. The straight-bladed VAWTs with different numbers of blades: (a) VAWT with straight blades; (b) Section view ①-① (two blades); (c) Section view ①-① (three blades); (d) Section view ①-① (four blades); (e) Section view ②-② at base connection.
Metals 12 00321 g008
Figure 9. Power coefficient, Cp, versus tip speed ratio, λ, for the designed turbine.
Metals 12 00321 g009
Figure 10. Cross sections of the cylinder turbine tower at different heights.
Metals 12 00321 g010
Figure 11. The mean rotor powers versus the rotor speeds at different wind speeds.
Metals 12 00321 g011
Figure 12. Numerical models for wind field and VAWTs.
Metals 12 00321 g012
Figure 13. Turbulent wind speed histories at different heights: (a) wind speed history at the tower top; (b) wind speed history at 10 m high.
Metals 12 00321 g013
Figure 14. (a) tower wall; (b) initial crack length and final crack length (Rb is the tower-base radius; Tb is the tower-base thickness).
Metals 12 00321 g014
Figure 15. Crack growth rate versus stress intensity range.
Metals 12 00321 g015
Figure 16. Schematic of thrust, side force, and torque on rotors.
Metals 12 00321 g016
Figure 17. Mean values and standard deviations of aerodynamic loading of the three VAWTs at different steady wind speeds: (a) thrust; (b) side force; and (c) torque.
Metals 12 00321 g017aMetals 12 00321 g017b
Figure 18. Aerodynamic-loading histories of the three VAWTs at a steady wind speed of 10 m/s: (a) thrust; (b) side force; and (c) torque.
Metals 12 00321 g018aMetals 12 00321 g018b
Figure 19. Effective stress range contours at Point F under different wind speeds and directions: (a) two blades; (b) three blades; and (c) four blades.
Metals 12 00321 g019
Figure 20. Stress histories at Point F for the two-to-four-bladed VAWTs (wind speed = 24 m/s; wind direction = 157.5 deg).
Metals 12 00321 g020
Figure 21. Stress histograms at Point F for two-to-four-bladed VAWTs (wind speed = 24 m/s; wind direction = 157.5 deg): (a) two blades; (b) three blades; and (c) four blades.
Metals 12 00321 g021
Figure 22. Fatigue failure probability curves at Point F for two-to-four-bladed VAWTs: (a) two blades; (b) three blades; and (c) four blades.
Metals 12 00321 g022
Figure 23. Fatigue lives at Pont F for two-to-four-bladed VAWTs ( A = 65.9 × 10 10 MPa3).
Metals 12 00321 g023
Figure 24. Yearly fatigue cumulative damage along wind direction and speed at the annual average wind speed of 7 m/s ( A = 65.9 × 10 10 MPa3): (a) fatigue-damage distribution along wind direction; (b) fatigue-damage distribution along wind speed.
Metals 12 00321 g024
Figure 25. Extended fatigue-life curves of two-to-four-bladed VAWTs in the crack-propagation stage.
Metals 12 00321 g025
Table 1. Design parameters of the VAWTs.
ParameterVAWTs
2 Blades3 Blades4 Blades
Rated Power, P (MW)111
Blade Number234
Rotor Radius, R (m)303030
Height, l (m)606060
Chord Length, C (m)321.5
Tower Height (m)606060
Aerofoil SectionNACA 0018NACA 0018NACA 0018
Cut-in, Rated, Cut-out Wind Speeds (m/s)5, 10, 245, 10, 245, 10, 24
Rated Rotor Speed (rad/s)111
Table 2. Values of material parameters for Q235 steel (refer to ASTM A36 steel [45]).
Material ParametersValue
K IC 100 ( MPa m )
C g 1.65 × 10 11 ( m / cycle ) / ( MPa m ) 3
m 3
σ y 235 MPa
Table 3. Stress-cycle numbers within 3-hr simulations.
ItemVAWT
Two BladesThree BladesFour Blades
Cycle number359650796677
Publisher’s Note: MDPI stays neutral with regard to jurisdictional claims in published maps and institutional affiliations.

