Article

Investigation of Material Properties of Wall Structures from Stainless Steel 316L Manufactured by Laser Powder Bed Fusion

1
Mechanical Engineering, Center for Structural Materials, State Materials Testing Institute Darmstadt (MPA), Chair and Institute for Materials Technology (IfW), Technical University of Darmstadt, 64283 Darmstadt, Germany
2
Mechanical Engineering, Institute for Production Management, Technology and Machine Tools (PTW), Technical University of Darmstadt, 64287 Darmstadt, Germany
3
Additive Manufacturing, Processing Technology, Fraunhofer Institute for Casting, Composite and Processing Technology (IGCV), 86159 Augsburg, Germany
*
Author to whom correspondence should be addressed.
Metals 2022, 12(2), 285; https://doi.org/10.3390/met12020285
Submission received: 14 December 2021 / Revised: 18 January 2022 / Accepted: 31 January 2022 / Published: 5 February 2022
(This article belongs to the Topic Additive Manufacturing)

Abstract

:
To make powder bed fusion (PBF) via laser beam (-LB) for metals (/M) available for highly regulated components such as pressure equipment according to the Pressure Equipment Directive, system-specific qualification methods need to be established to deal with process- and geometry-dependent inhomogeneous material behavior. Therefore, the material properties of austenitic stainless steel (316L) and their influences on normative acceptable qualification strategies were investigated in this study. Flat tensile test specimens were produced by two manufacturing systems identical in construction and were compared to specimens produced from conventionally rolled sheet material. Specimens were compared in the horizontal and vertical building directions in relation to different slope angles, wall thicknesses and cross-sectional areas. Despite identical process setups, parameters and powder feedstock, differences in mechanical behavior could be seen. Furthermore, the mechanical properties, surface roughness and density showed dependencies on the wall thickness and slope angle. In particular, the influence of wall thickness has not been covered in publications about PBF-LB/M before. These results suggest that geometry- and system-dependent components can be designed based on associated data from qualification processes. Therefore, a new qualification method based on wall structure properties is suggested for standard qualification processes of components with wall structures, such as pressure equipment.

1. Introduction

Additive manufacturing (AM) technologies are steadily developing into a serial manufacturing technology in the processing industry. One of these AM technologies is the powder bed fusion of metals via a laser beam (PBF-LB/M according to [1,2]). In addition to the functional technology advantages, the trend towards industrially deployable machines can be noted in the equipment supplier market. The equipment manufacturers provide production systems, consisting of PBF-LB/M equipment, powder feedstocks, process strategies and approaches for process monitoring, which shall encourage higher technology acceptance on the application side. While the range of application of the PBF-LB/M process is increasing strongly in numerous branches of industry, there are obstacles to the production of components with high safety requirements (e.g., aerospace, automotive industry, pressure equipment) due to mandatory norms and standards in component design and quality assurance. Pressure equipment is manufactured according to predefined standards, such as the EN 13445 series of standards “Unfired Pressure Vessels” [3] or similar, which are harmonized under the Pressure Equipment Directive in Europe [4]. While there are numerous established national, European and international standards for the conventional manufacture of pressure equipment [5,6,7,8,9,10,11,12], which fulfill Annex I of the Pressure Equipment Directive directly or with additional requirements, these regulations are lacking in the area of additive manufacturing processes.

1.1. Powder Bed Fusion of Metals via Laser Beam

Additive manufacturing by PBF-LB/M has been investigated in many publications before. PBF-LB/M is a layer-by-layer production technology, in which geometries are made of several fused layers of powder feedstock. The layers therefore are coated thinly in the form of powder on top of each other on a building platform, and each layer is melted and fused with the previous ones using a laser beam [13,14]. Often, a PBF-LB/M system is considered to consist only of the machine with its process parameters. However, the part quality is influenced by several factors, such as the powder feedstock, job geometries and nesting, as well as the operator of the machine [15,16].

1.2. Powder Feedstock

The powder feedstock hereby can vary in terms of multiple powder properties, including particle size distribution, morphology, density, moisture, chemical composition and impurities, which all have an impact on the processability behavior and subsequently on the material and part properties [17]. While the reuse of the powder is generally possible [18], it has been found that, especially over multiple reuses, the particle size coarsens and the oxygen content of the powder feedstock increases. The bulk chemical composition, on the other hand, does not change. While this apparently has no effect on the tensile properties, a decrease in impact toughness could be detected, emphasizing the difference in static and dynamic tests [19]. Furthermore, a higher proportion of coarse powder particles is observed to have a negative impact on the surface quality and the mechanical properties of PBF-LB/M specimens [20].

1.3. Process Parameters and Machine Influence

In several publications, the dependency between process parameters and material properties, microstructure, porosity and surface roughness, as well as mechanical properties, has been investigated. For example, a correlation between melt pool temperature, grain size and tensile properties has been found for stainless steel 316L [21]. In particular, laser power, scanning velocity, hatch distance and layer thickness are used to describe the energy density, which has been found to have a major effect on the microstructure, the porosity and, finally, on the mechanical properties [18,22,23,24]. Hereby, higher energy densities tend to lead to lower porosities and therefore better mechanical properties [22], as long as a critical energy density is not exceeded, at which chemical components with low evaporation temperatures vaporize during the melting process [23]. The roughness, on the other hand, is assumed to be dependent on the layer thickness [25], particle sizes of the powder feedstock, surface angle as well as weld geometry, especially for downskin areas. Despite this, manufacturing parameters cannot be copied to another system assuming the same results [26].
A fine microstructure with columnar dendritic cells is often described as typical for PBF-LB/M-manufactured 316L, which shows mainly the austenitic phase in most of the literature [24,27,28]. However, it has been found that the formation of martensite can occur using specific process conditions [29]. Studies found that, apart from energy density, the scanning strategy has a significant effect on the melt pool boundaries, orientation and aspect ratio of the grains [27]. This leads to varying mechanical properties, anisotropic structures and the formation of textures [22,30]. Therefore, up to a 16% difference in elongation at fracture due to applied hatch strategy could be observed [31]. The mechanical properties of PBF-LB/M-manufactured specimens therefore show different tensile strengths and elongations depending on the orientation to the building direction [25,30], which still exceed the values of conventionally manufactured specimens [25]. This can be attributed to the refined microstructure by the rapid solidification during the PBF-LB/M process [32].
While the majority of publications present similar findings relating to microstructure and mechanical properties in dependency on process parameters or powder feedstock, design-relevant parameters related to the geometry of the product are rarely investigated. It has been found that a higher contour to cross-sectional area ratio by reducing the width of specimens results in higher UTS and lower elongation at fracture [33]. Furthermore, higher hardness in the contour area compared to the core area has been reported [34]. Thus far, the influence of different PBF-LB/M machines is observed to have an effect on the porosities of specimens, resulting in different mechanical properties [26]. Differences in identical machines as well as the machine user and the manufacturing location are very rarely discussed in state-of-the-art publications and are addressed in the present work.

1.4. Standards and Regulations

Pressure devices in the European Union (EU) are regulated by the Pressure Equipment Directive (PED) [4], which is realized by national harmonized laws, which, in terms of content, are typically close to the US Standards defined by the American Society of Mechanical Engineers (ASME). One important standard hereby is the DIN EN 13445 “Unfired Pressure Vessels” [3], which defines general information, materials, design, fabrication, inspection and testing. Additionally, there are material-specific chapters. For example, “Part 2: Materials” [3] defines minimum requirements such as elongation at fracture for austenitic stainless steel including 316L to be at least 14%. Manufacturers therefore have to ensure that they conform to these specifications. In the event that a specification cannot be fulfilled, there are additional procedures allowed to still ensure parts’ safety. For designing pressure components, three approaches are common: design by formulae (DBF), design by analysis (DBA) and design by experiment (DBE). “Part 3: Design” [3] provides a formula for designing typical geometries of conventional pressure vessels such as flanges, brims or bottoms. While there are calculations for DBF available, it can be assumed that DBE is the most common procedure in industry. Within these standards, additive manufacturing (AM) techniques are not represented, making single qualification expenses for each additively manufactured component necessary [4]. Since 2019, the DIN Standards Committee Technology of Materials (NWT) has worked on adapting DIN EN 13445 for AM. In this context, currently, two pre-normative documents exist in Europe: DIN/TS 17026 “Unfired pressure vessels—Additional requirements for pressure equipment and pressure components fabricated with additive manufacturing methods” [35], which was attachment B and Part 14 in an earlier draft state of prEN 13445, and Chapter 4 to 8 of DIN/TS 17026, representing the same structure as described above of EN 13445 parts 1 to 5 [3]. An additional four safety classes in correlation to inspection expenses for AM parts have been introduced. Attachments define process-specific guidelines, where A describes powder bed fusion. Besides this technical specification (TS), DIN SPEC 17071 was published in December of 2019 via a PAS procedure defining “requirements for quality-assured processes at additive manufacturing centers” [36].

1.5. Objective of This Work

This work investigates the mechanical properties, porosity and roughness of specimens from two apparently identical manufacturing systems in different locations using PBF-LB/M-produced walls with different thicknesses and slope angles relative to the building direction. In particular, the influence of the wall thickness on the mechanical properties and porosity has not been covered in publications about PBF-LB/M before and will therefore be the focus in this work. Most importantly, the influence of wall thickness is investigated using the same cross-sectional area for different wall thicknesses. Furthermore, differences in material and mechanical properties between two apparently identical machines are investigated to evaluate the transferability of process parameters between the same manufacturing setups. Investigations on this topic using the same powder feedstock have not been covered sufficiently in publications before but are of high technological interest for industrial applications.

2. Materials and Methods
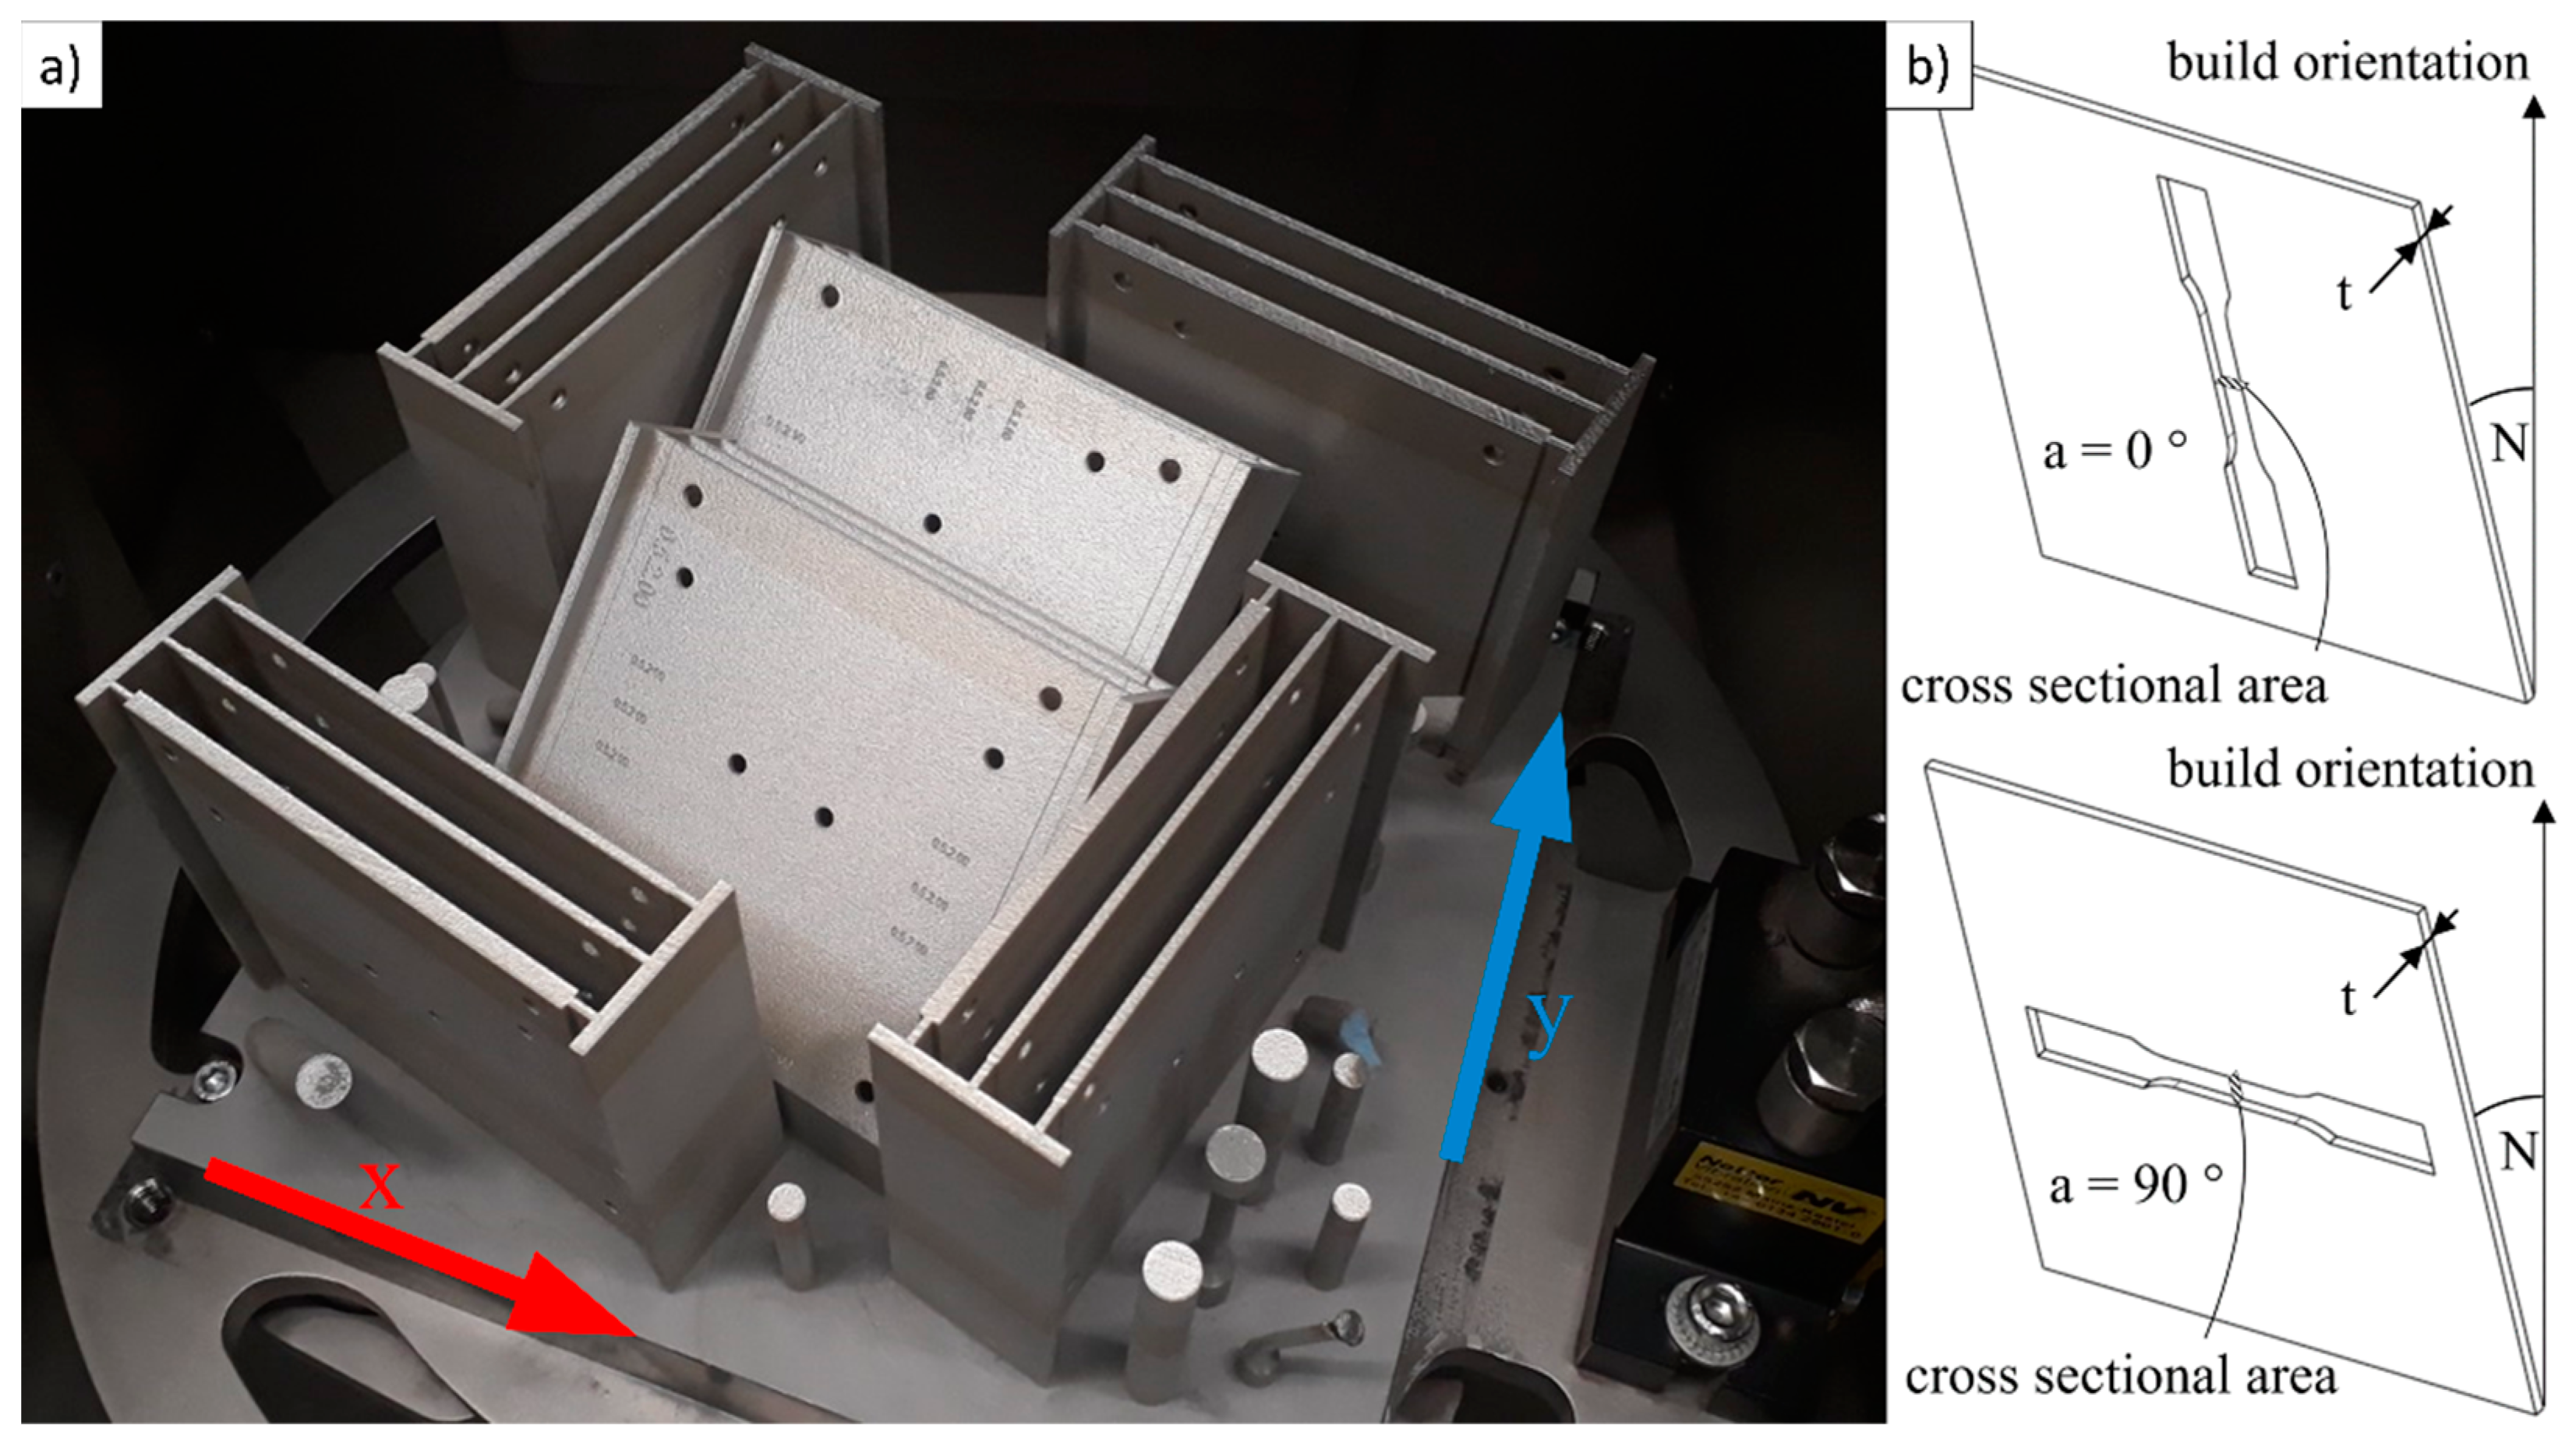
2.1. Geometry

Flat tensile test specimens (T specimens) were manufactured according to Form-E of DIN 50125:2016-12 [37] with different thicknesses (t), cross-sectional area specified by the equivalent diameter (D) and according gauge lengths and were orientated in different slope angles (N) to the building platform and directions (a) vertically (vert.) and horizontally (hor.) to the building direction. For process reliability reasons, continuous walls with the same thickness and slope angle were built, which were furthermore arranged together in stacks of three walls. The specimens were then cut out of the walls using waterjet cutting. The additive-manufactured T specimens are named by number 1 or 2 defining the manufacturing system. Due to obstacles in the waterjet cutting process, T specimens 2 with an equivalent diameter of 5 mm and wall thickness of 4 mm (M2-D5t4) are not included in this work. Reference T specimens with the same geometry were manufactured out of rolled and solution-annealed sheet metal 316L and are referred to as T specimens 3 in this paper. A summary of all 72 T specimens is given in Table 1.
Furthermore, metallographic micro-specimens (M specimens 1 and 2) for optical microscopy analysis were additively manufactured with different thicknesses and different slope angles to the building platform. For process reliability reasons, the M specimens were stacked by either three walls with the same wall thickness (M specimens 1) or by five walls with different wall thicknesses (M specimens 2). An overview of all 86 M specimens with different slope angles and wall thicknesses can be seen in Table 2.

2.2. Additive Manufacturing Systems

The specimens were produced by PBF-LB/M using two M290 devices by EOS GmbH (Krailling/München, Bayern, Germany), which were identical in construction, at two different manufacturing locations. Specifications for both machines and processes can be seen in Table 3. As process parameters, the same EOS standard parameter set “316L 040 FlexM291 1.00” was used on both machines (Table 4) with skywriting and vector flow optimization turned on. Contour, downskin areas and short-edge parameters use lower energy densities, while upskin areas suffer higher energy input compared to infill of 57.7 J/mm3 (Table 5). This is significantly below the critical energy density for 316L of 104.2 J/mm3 as determined in [38] and around a third of the energy density used in [24] due to the higher layer thickness. Both machines were prepared using the same Standard Tessellation Language (STL) geometry, powdery material, software and operator guidelines. Although both machines were identical in construction, small differences in Rayleigh length, focus diameter, diffraction coefficient and linear laser power were identified. Geometry-dependent differences in scan strategy, such as edge parameters, were not applied.
The specimens were built on a square platform with 250 mm length and each powder layer was applied from the x direction. Argon was used as a process gas, with a constant in-machine pressure of 6 bar flowing in the y direction inside the process chamber. The arrangement of the specimens for each building job as well as the used specimen parameters slope angle (N) and orientation (a) can be seen in Figure 1. Fresh recoater steel blades of type EOS 2200-4073 were used. Figure 1 shows an exemplary finished building job with described manufacturing arrangements of the six specimen stacks.

2.3. Material

As the building material, gas-atomized stainless steel 316L powder from Nanoval GmbH & Co. KG (Berlin, Berlin, Germany) with a nominal particle size distribution D10/D90 of 15/45 µm was used. The powder was sieved before usage to ensure that no coarse particles were left using a vibratory sieve shaker and a mesh size of 63 µm type, Analysette 3 Spartan by Fritsch GmbH (Idar-Oberstein, Rheinland-Pfalz, Germany).

2.4. Examination Methods

The chemical composition was examined using optical emission spectrometry with inductively coupled plasma (ICP-OES) for the powder feedstock and spark optical emission spectrometry (spark-OES) for the T specimens. Carbon values for both powder feedstock and T specimens were determined using combustion analysis and infrared spectrometric detection according to DIN EN ISO 15350:2010-08 [39].
All scanning electron microscope (SEM) images including fractography and Electron backscatter diffraction (EBSD) images were taken in a scanning electron microscope Zeiss EVO 60 with EBSD camera Nordlys II Channel 5 by Oxford Instruments HKL (Abingdon, Oxfordshire, UK) and all optical microscope (OM) images with an optical microscope DM 4000 M by Leica Microsystems GmbH (Wetzlar, Hessen, Germany). For the porosity analysis as well as the analysis of the surface roughness of the profile based on DIN EN ISO 13565-1:1998-04 [40] and DIN EN ISO 13565-2:1998-04 [41], the OM images taken from the M specimens were binarized by grayscale analysis using the software Matlab ® R2018b by The MathWorks, Inc. (Natick, MA, USA).
XRD diffractometry was conducted on T specimens 1 and 2 for qualitative and quantitative determination of bcc-iron phase (delta ferrite and martensite, respectively) using a high-resolution X-ray diffractometer SmartLAB®SE by Rigaku Europe SE (Neu-Isenburg, Hessen, Germany).
Particle size distribution by count after sieving was measured using a laser light scattering device Mastersizer 3000 (Malvern Panalytical Ltd., Malvern, Worcestershire, UK) and wet dispersion unit Hydro EV (Malvern Panalytical Ltd., Malvern, Worcestershire, UK) according to DIN EN ISO/ASTM 52907:2020-05 [42]. Particle size hereby refers to the equivalent diameter of the projected area of particles. The average particle size distribution out of 15 measurements in total of the used powder feedstock in this study can be seen in Table 6.
Quasi-static tensile tests were performed according to DIN EN ISO 6892-1:2020-06 [43] using tensile test device Zwick Roell 100 (ZwickRoell GmbH & Co. KG, Ulm, Baden-Württemberg, Germany) with a constant strain rate of 0.001 s−1. Elongation of tensile tests was measured using a visual evaluation method based on reference marks on specimens.

3. Results

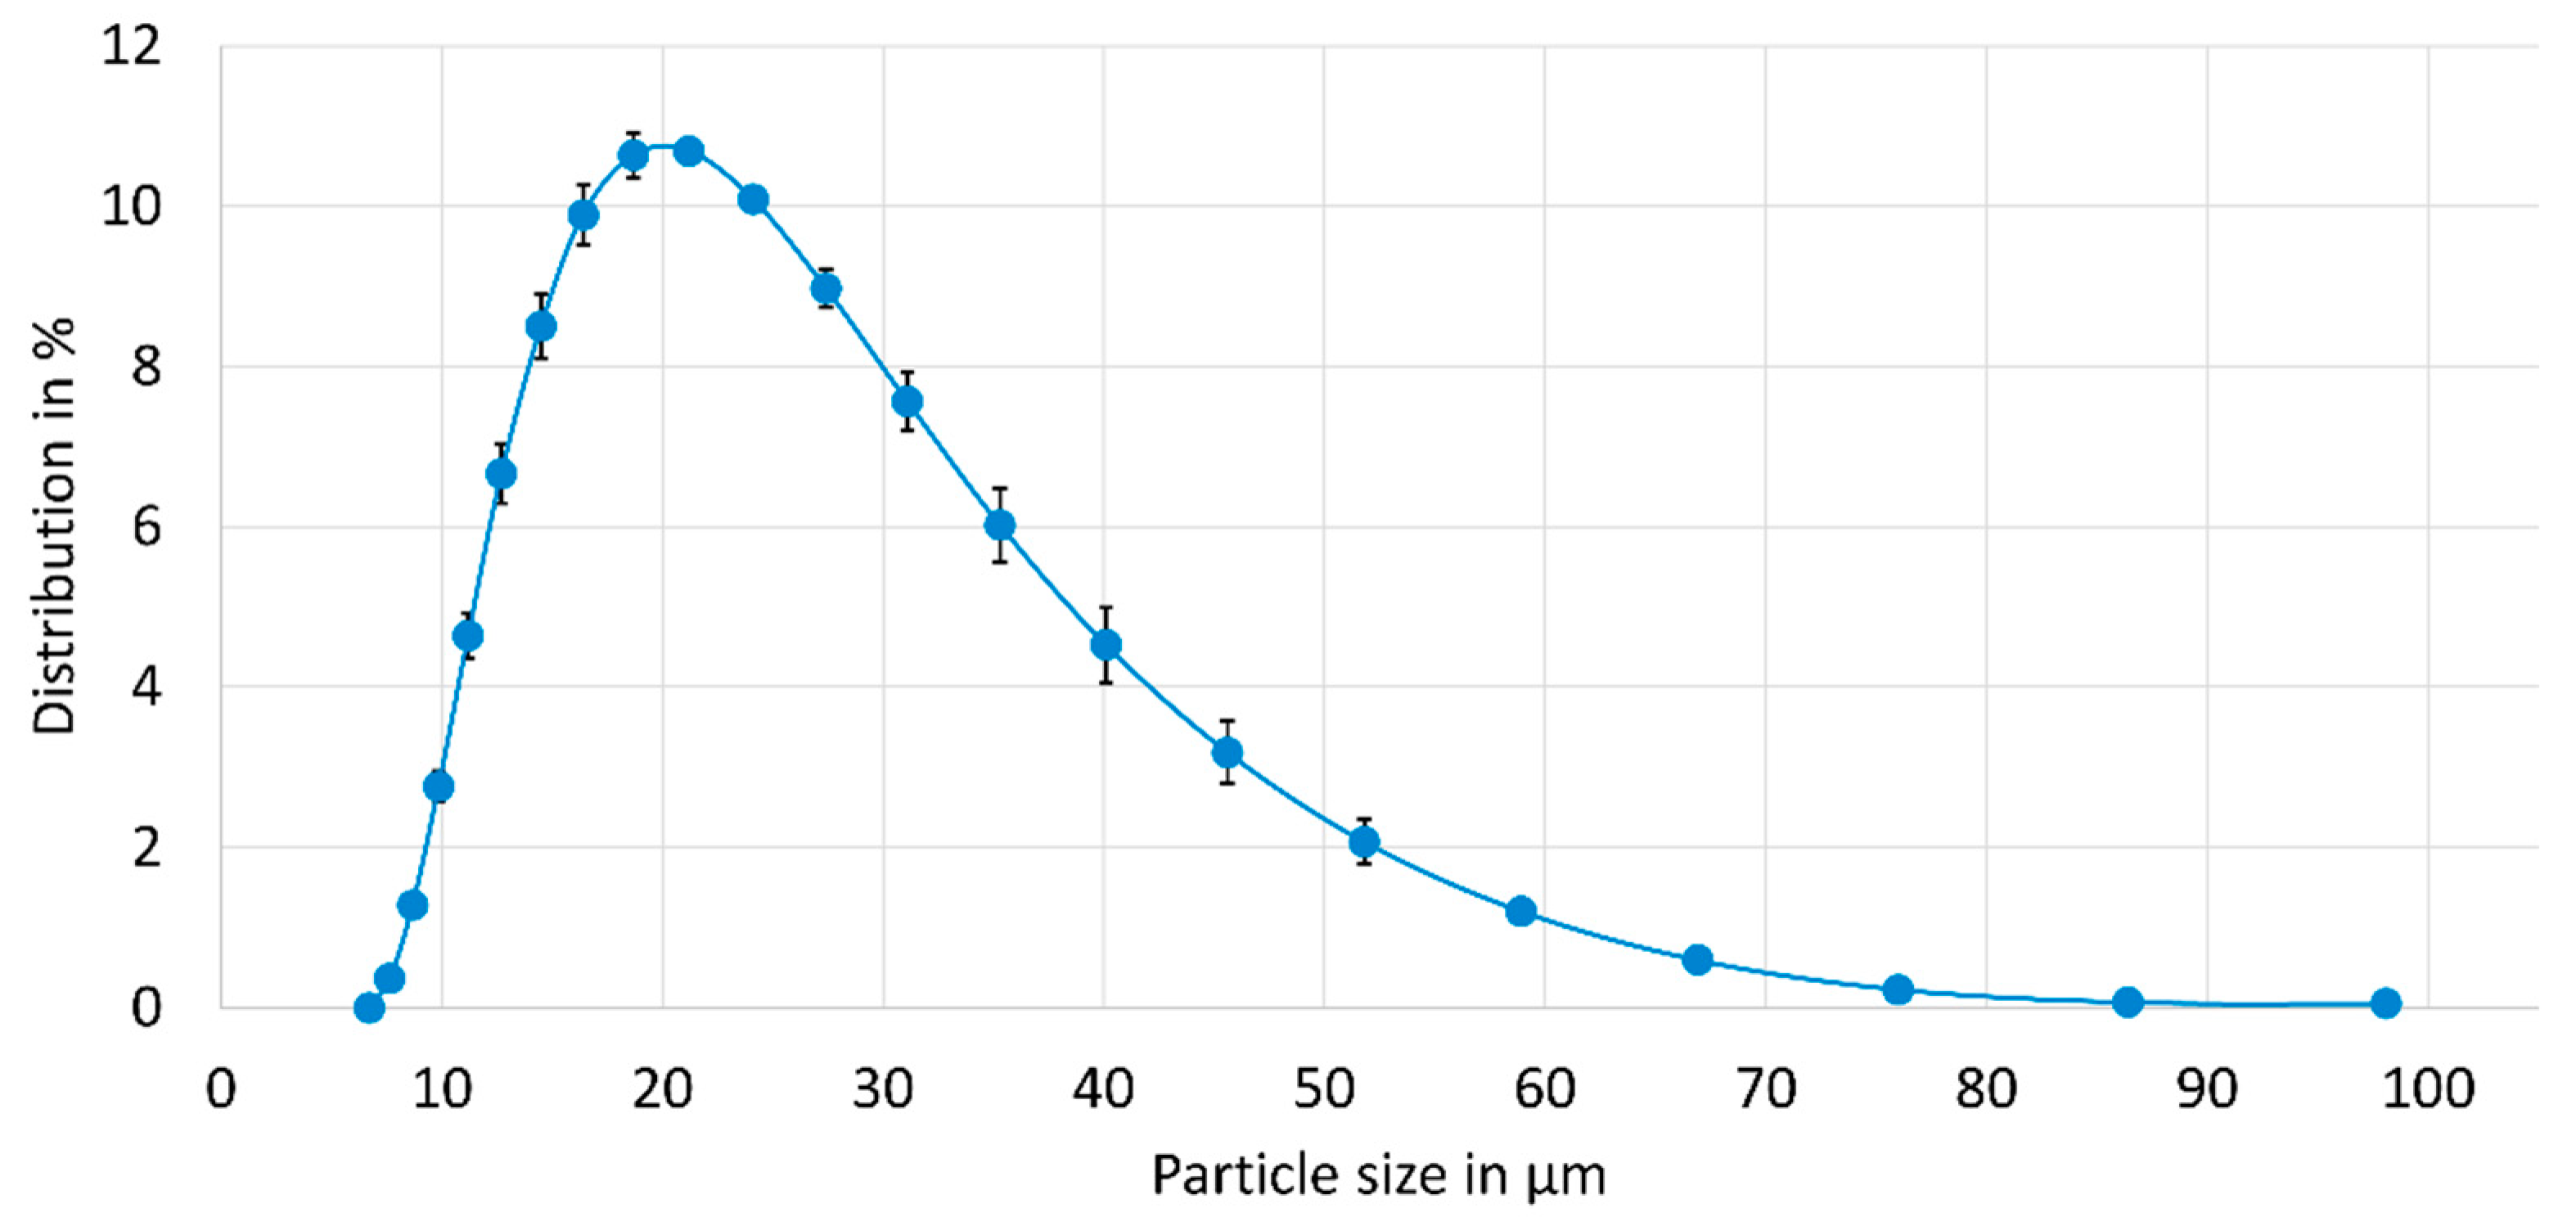
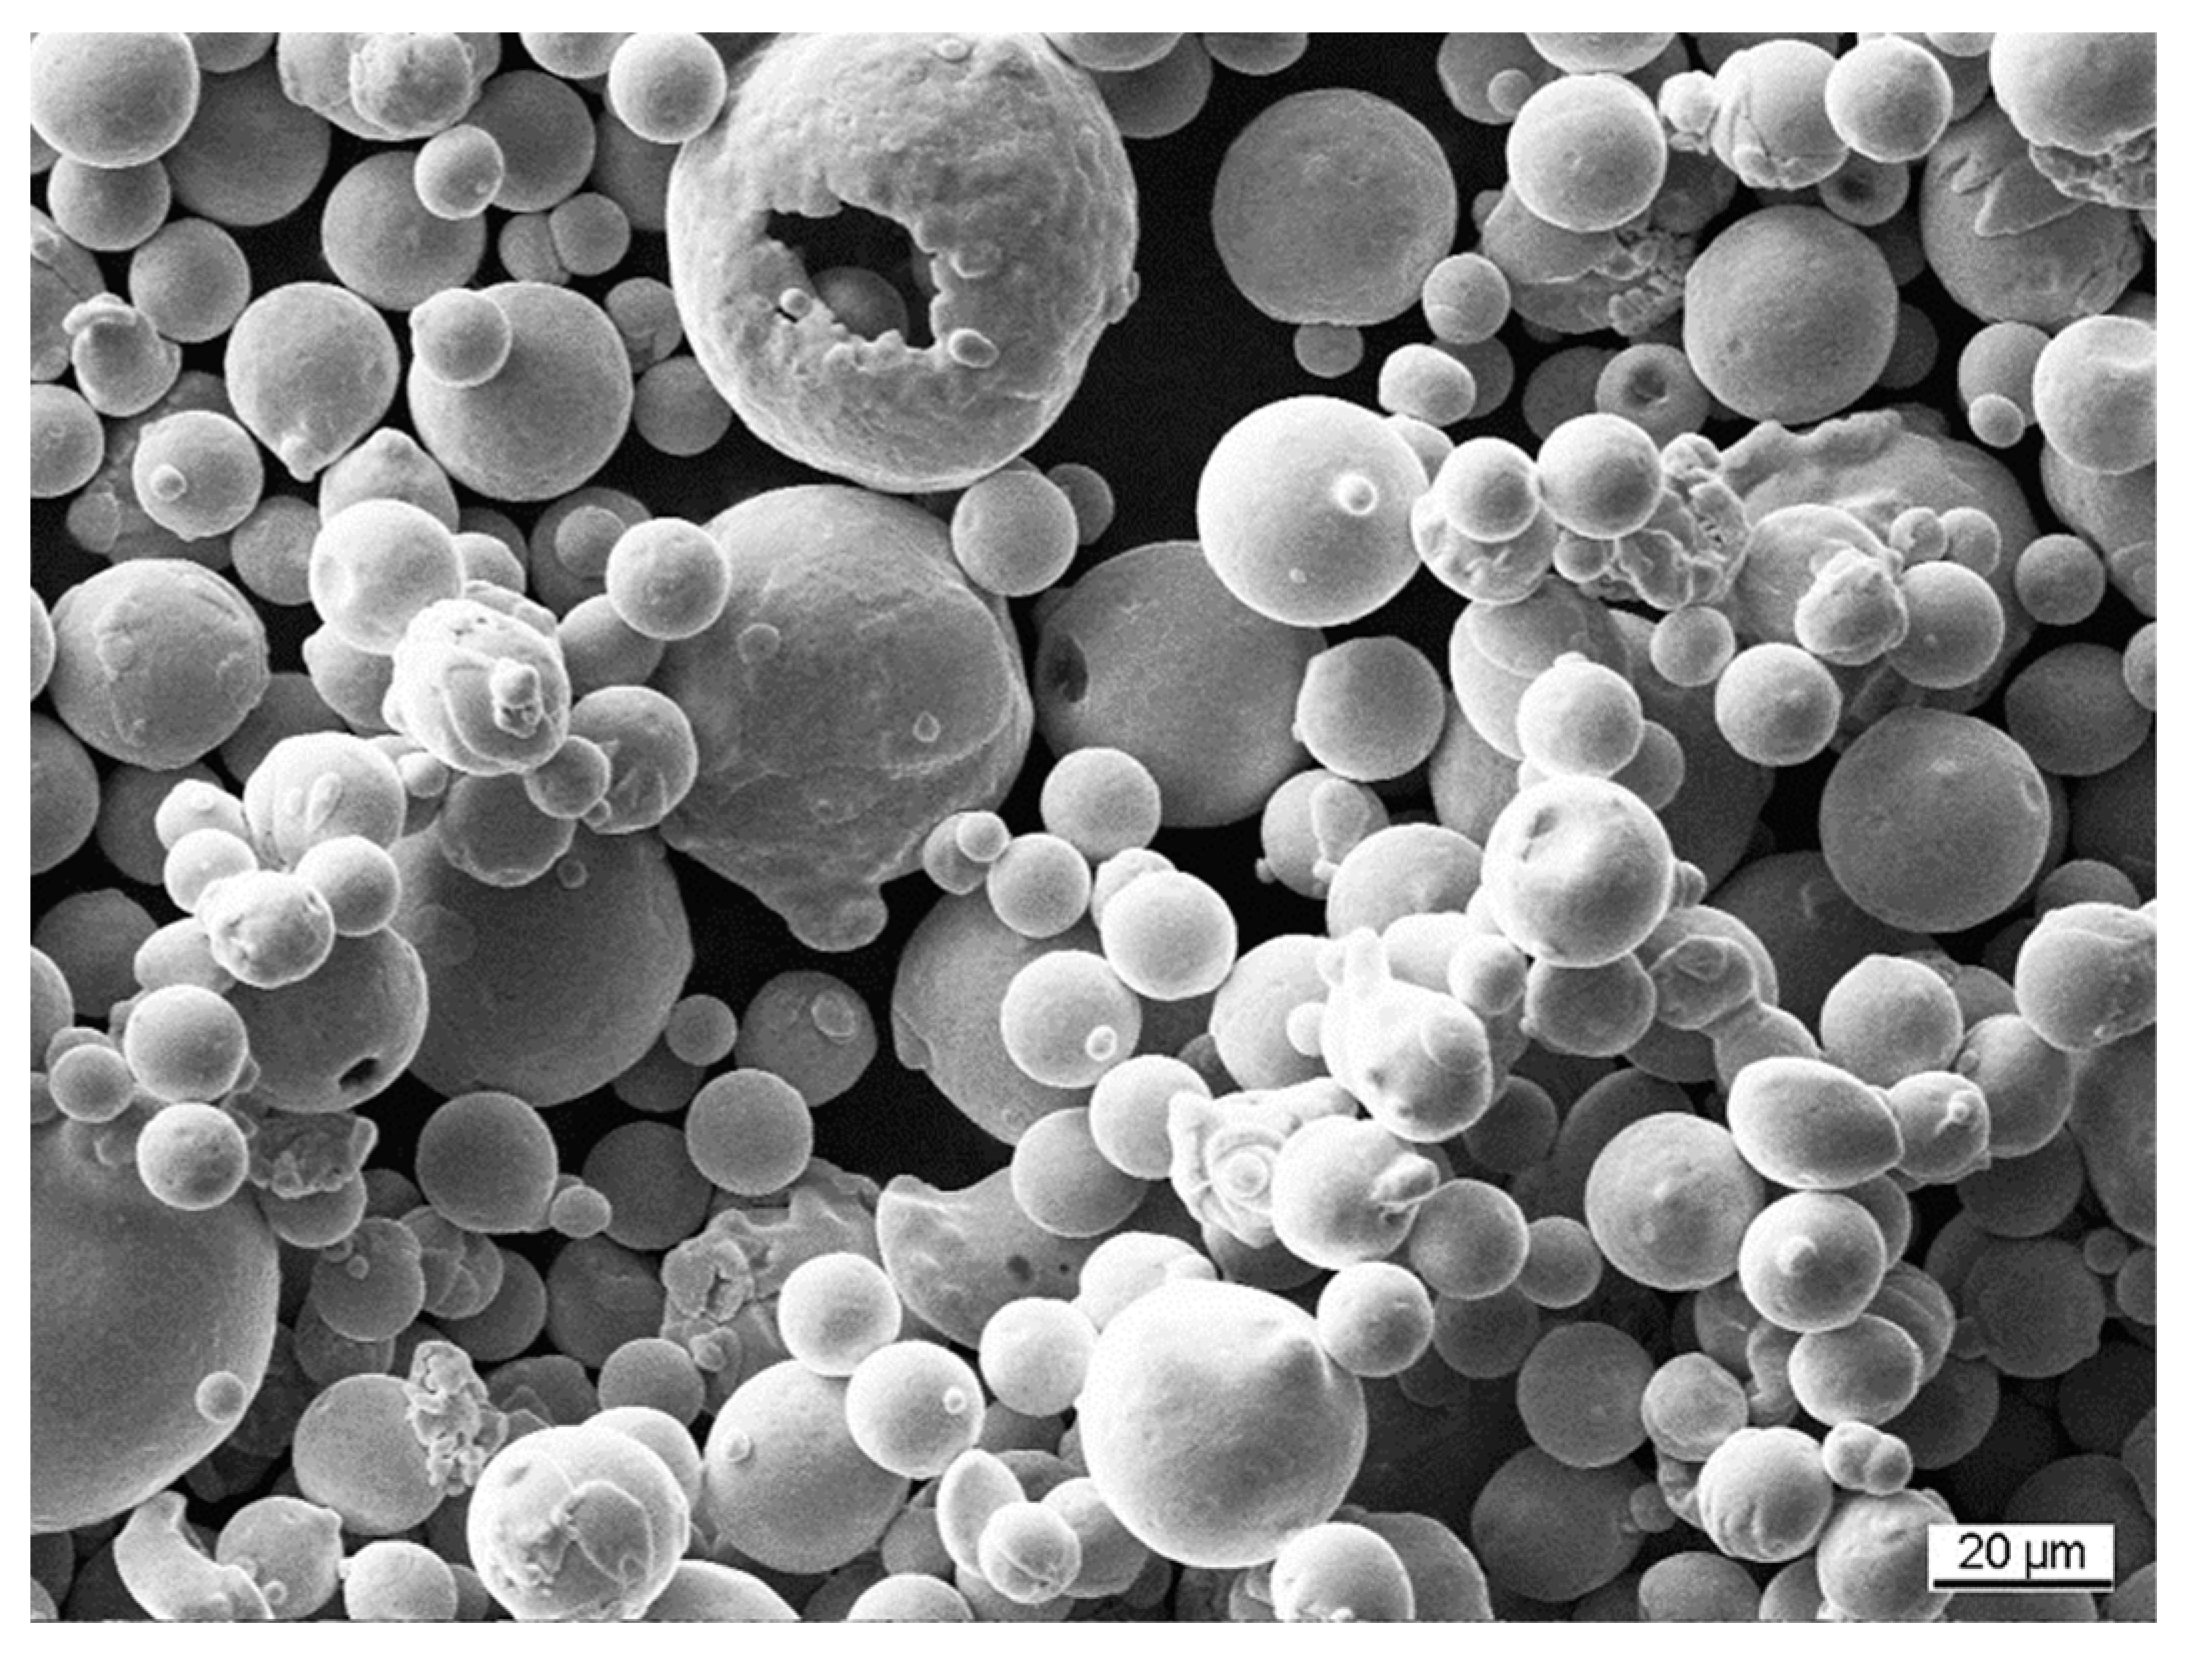
3.1. Particle Size Distribution

While the particle size distribution is close to the nominal specification of 15/45, as can be seen in Table 6 and Figure 2, it tends to have a higher fraction of smaller particles.

3.2. Chemical Composition of the Powder Feedstock

The chemical composition of the powder feedstock and the T specimens is shown in Table 7. All elements are within the typical range of the 316L standards according to ASTM A240/A240M-20a [44] and ASTM A276/A276M-17 [45] (comparable to 1.4404 according to DIN EN 10088-1:2014-12 [46]). ICP-OES and spark OES values differ slightly, which could be a matter of the different used analysis methods and reference materials for calibration or some effects of the PBF-LB/M process itself. However, the differences between the analysis of the powder feedstock and the produced T specimens are insignificant and mostly within the measurement uncertainty. Only the Si content differs, which is likely to be a calibration issue. Moreover, the specifications for the 1.4404 and 316L, respectively, are fulfilled.
As can be seen in Figure 3, the powder feedstock shows some porosity as well as agglomerates, which can be attributed to the manufacturing process of the powder feedstock.

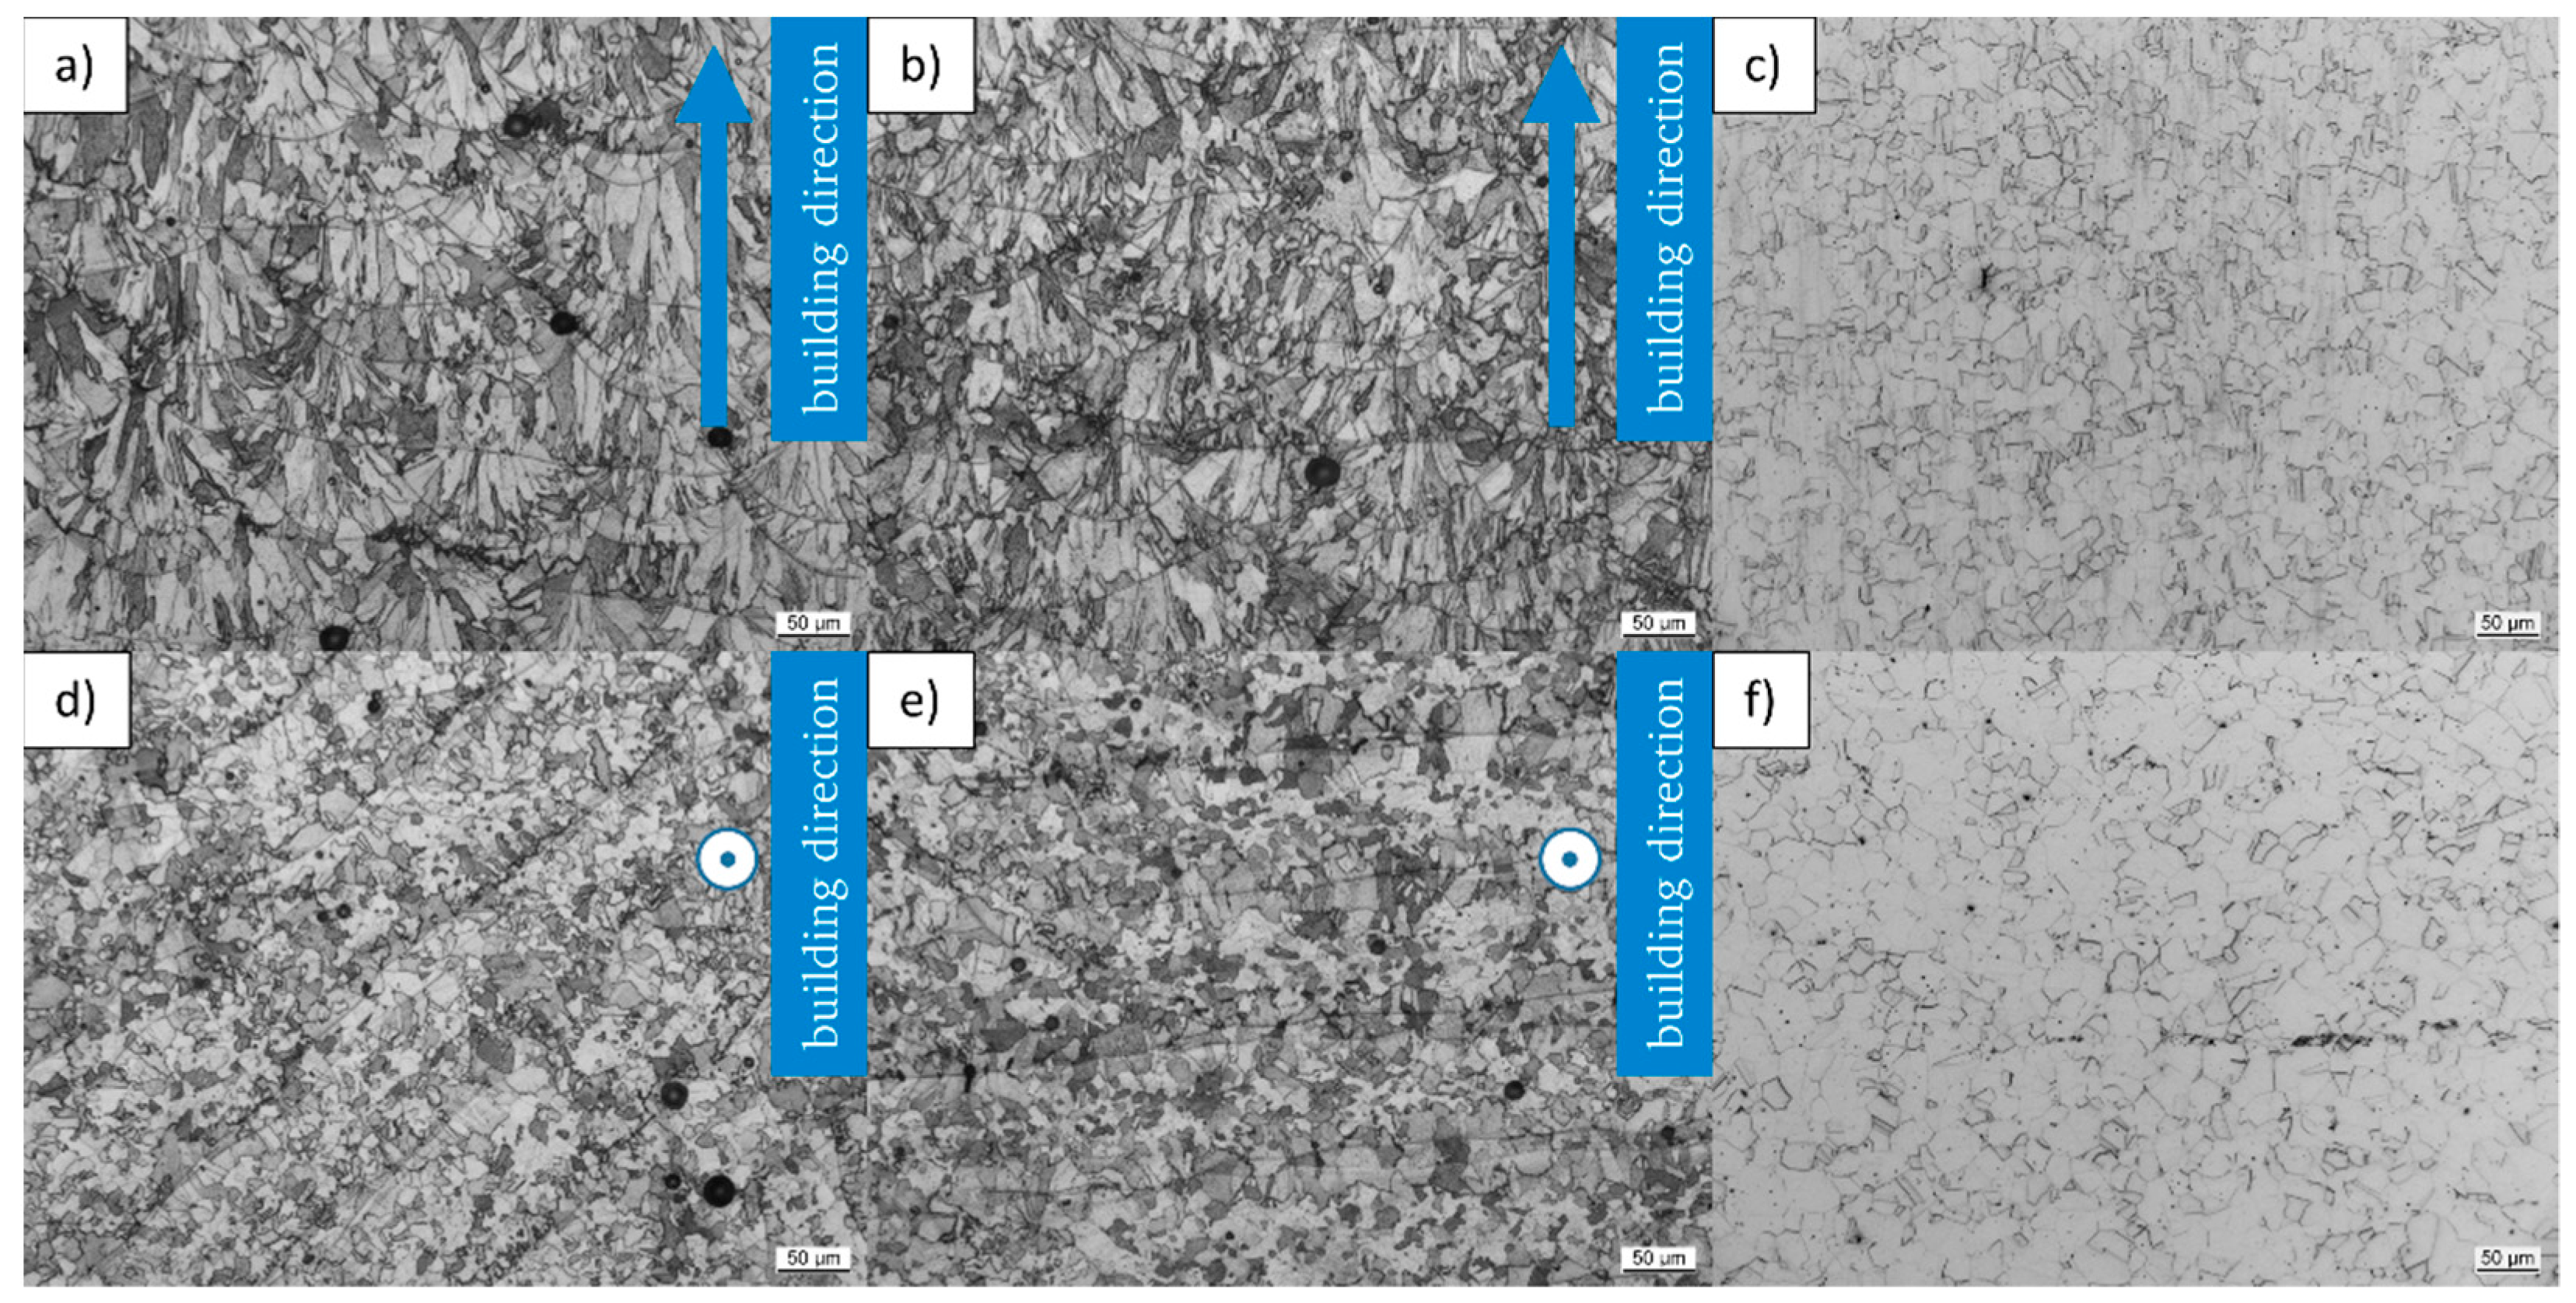
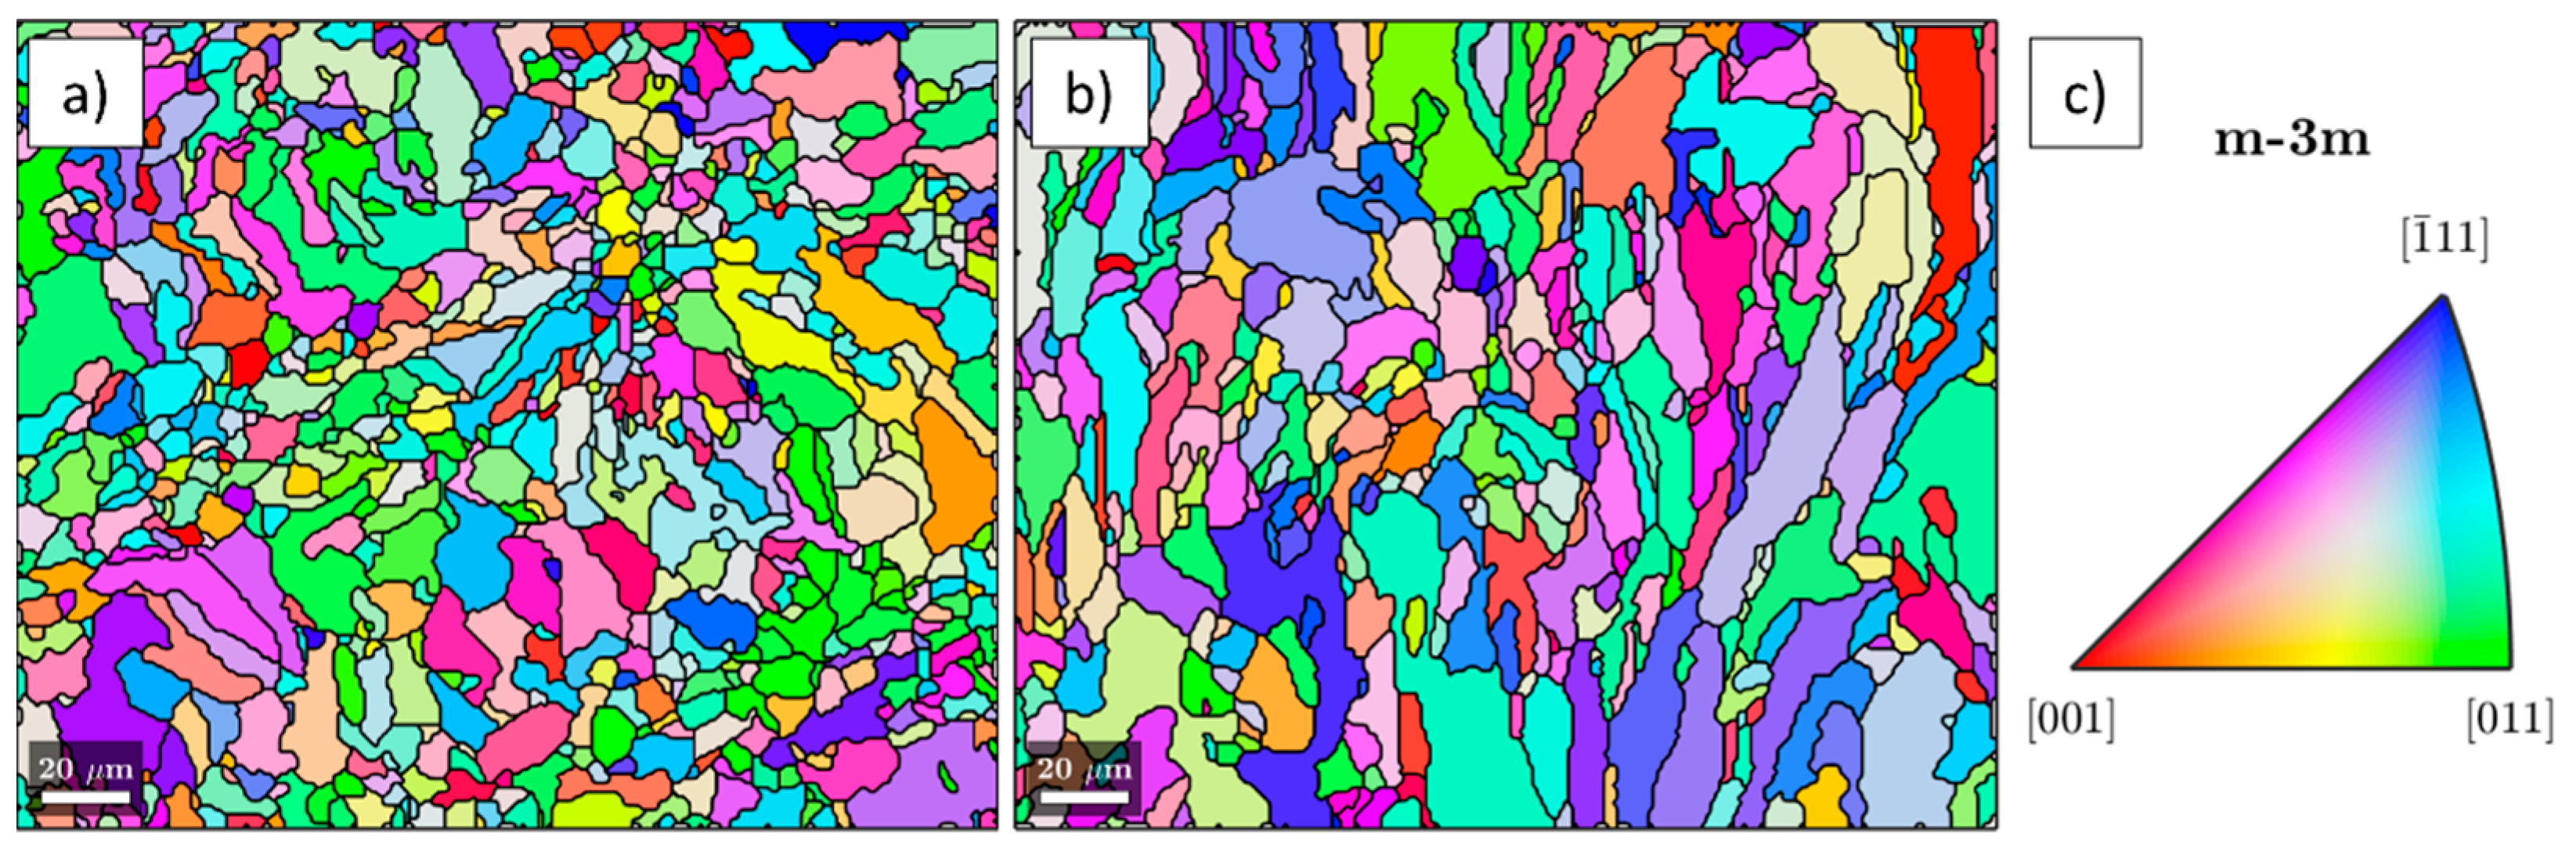
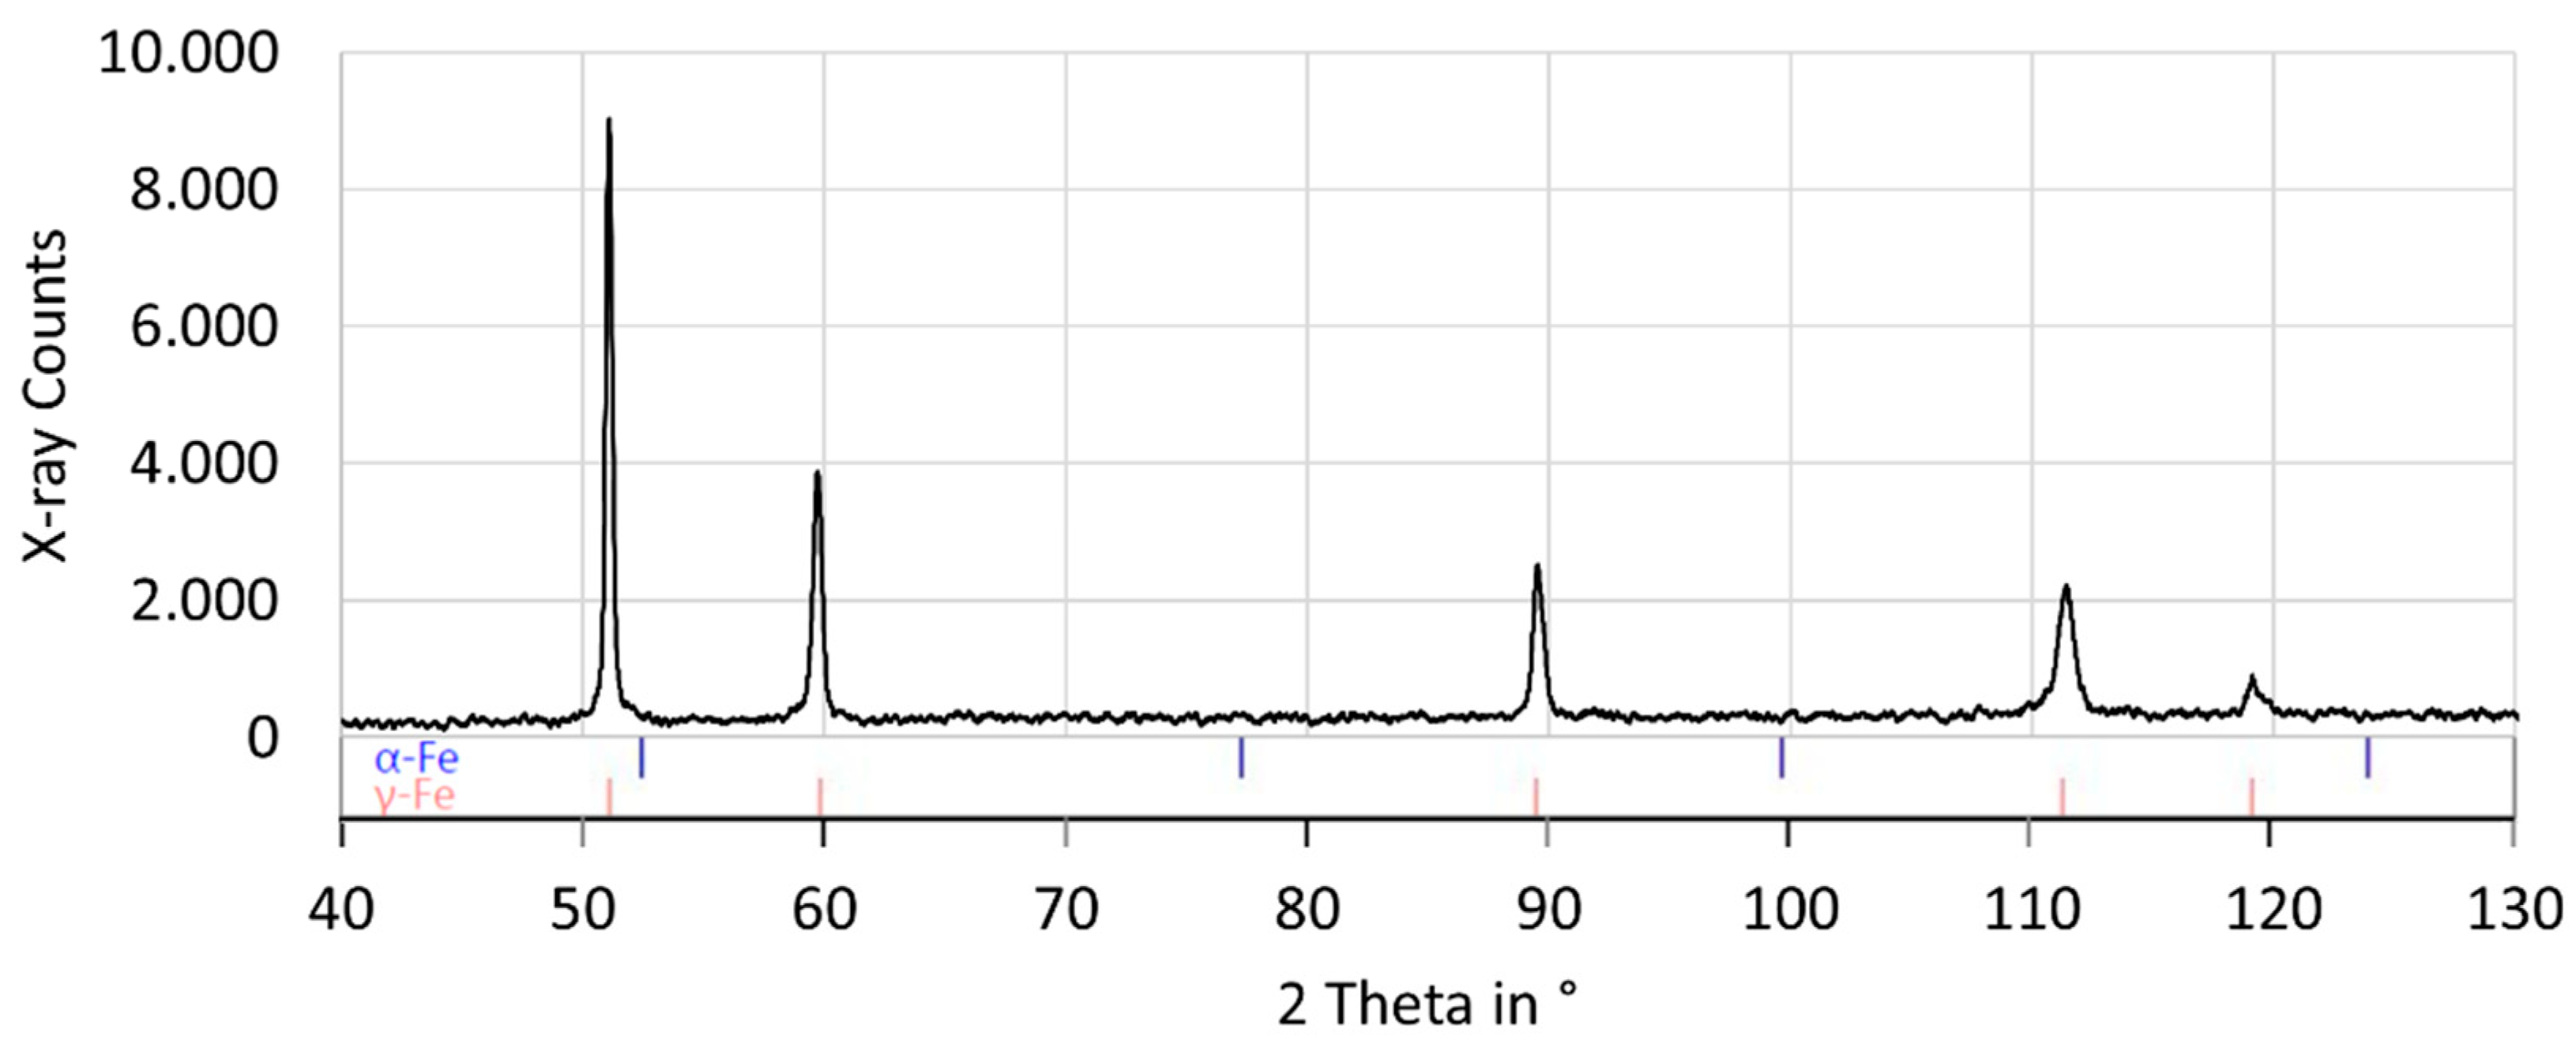
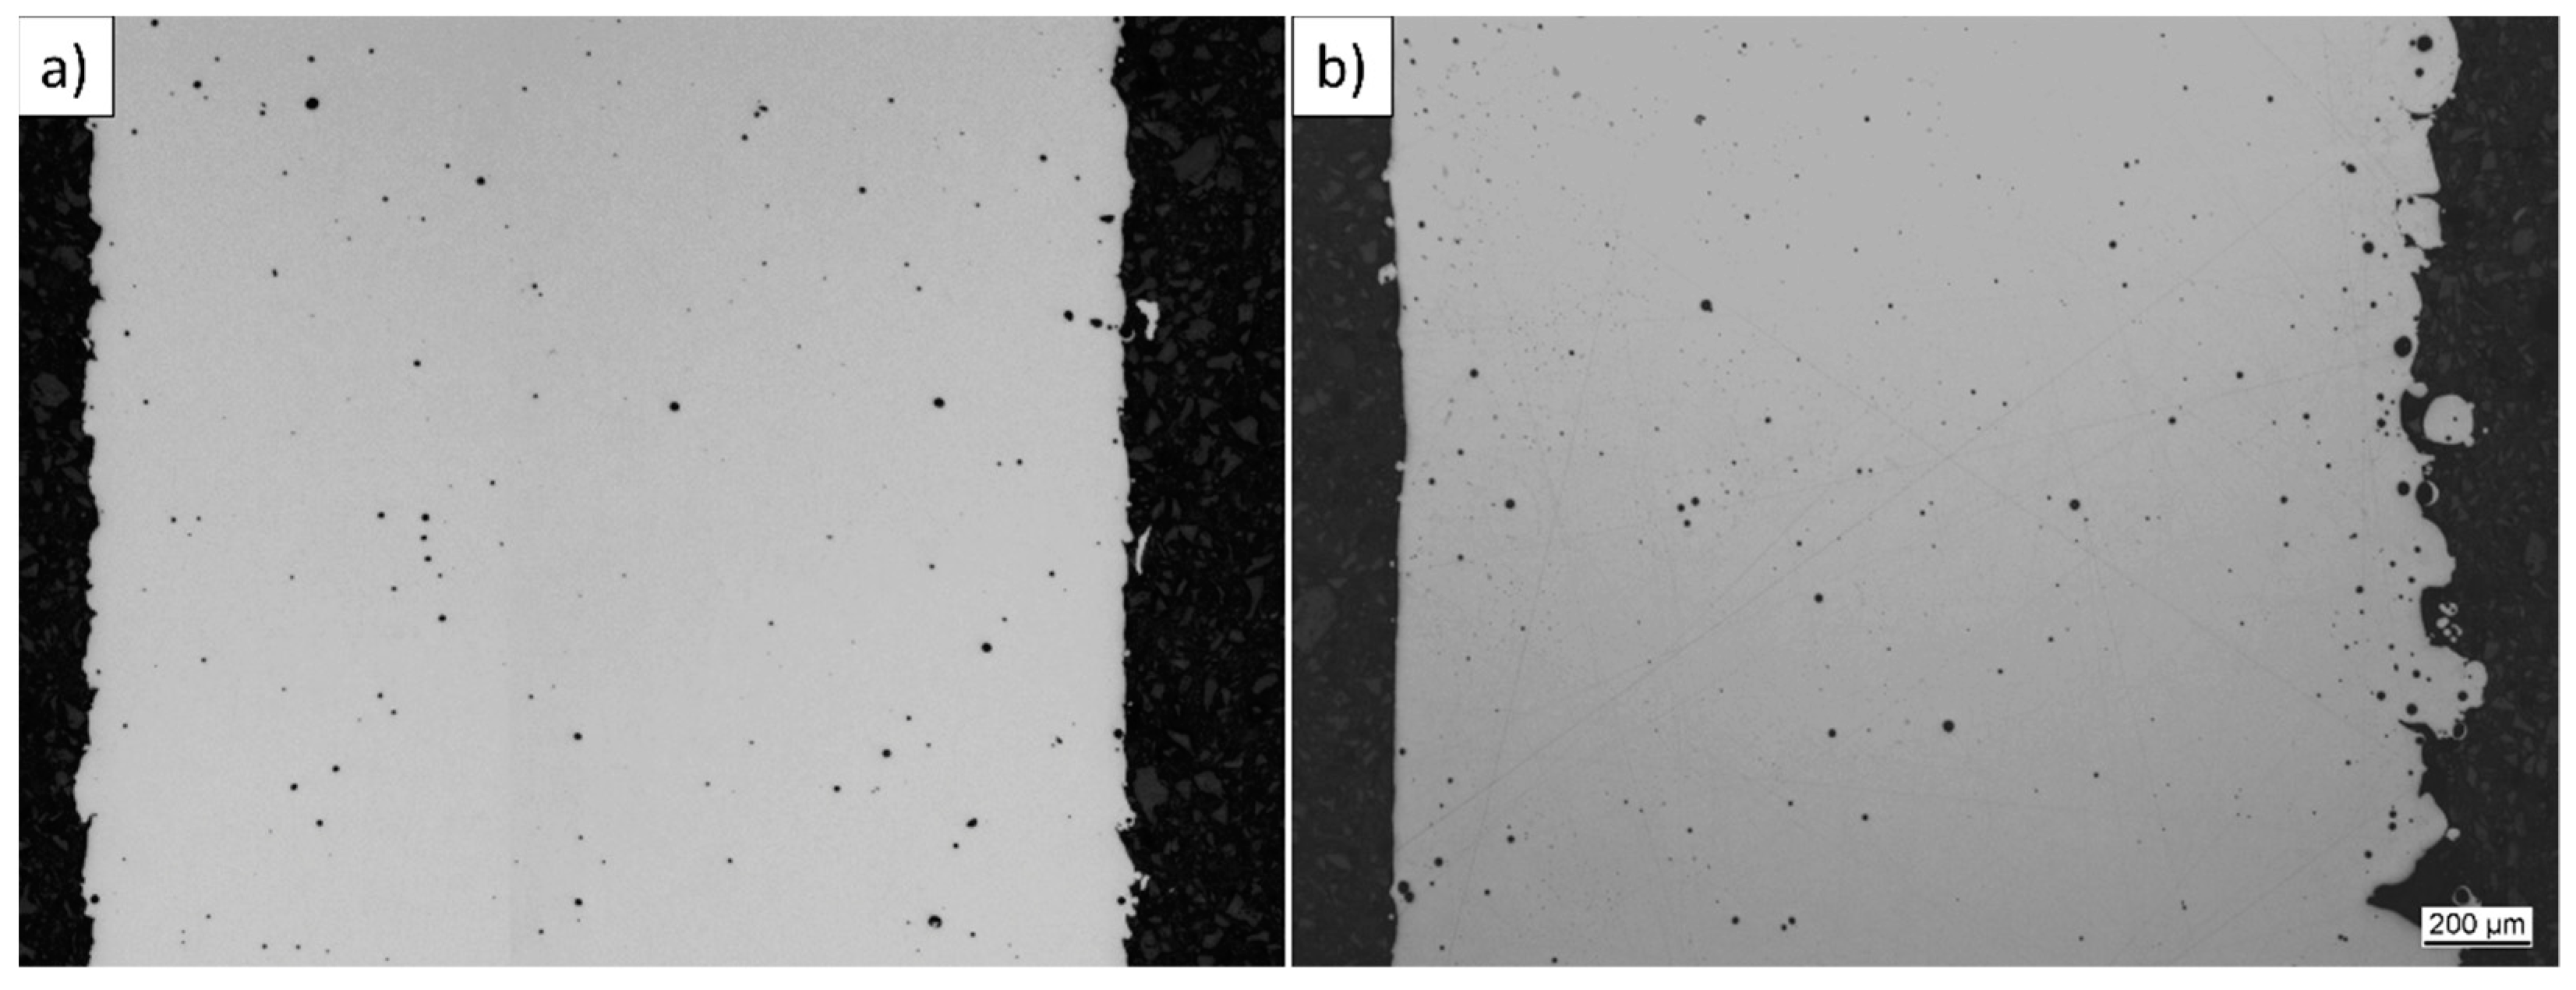
3.3. Microstructure of the Material

Exemplary OM images of etched PBF-LB/M-manufactured M specimens 1 and 2 as well as OM images of etched M specimens 3 with etchant V2A can be seen in Figure 4. From the side view perpendicular to the building direction, fine, columnar grains and melt pool boundaries from the laser tracks are clearly visible in (a) and (b) for the additive-manufactured specimens. This is typical for PBF-LB/M [24,47]. The crystal growth of the grains is orthogonal to the melt pool boundaries along the highest temperature gradient. From the top view parallel to the building direction, individual laser tracks can be seen in (d) and (e). Small round grain boundaries confirm the columnar characteristic of the microstructure found in the literature [28,32,48,49], which can also be seen in the EBSD images in Figure 5. M1 and M2 show similar microstructures, with no obvious differences to the eye. Small round pores can be seen, which were further analyzed in unetched OM images using grayscale analysis. In comparison, exemplary OM images of reference M specimens 3 in (c) and (f) from different orientations show a typical austenite microstructure for rolled and solution-annealed sheet material 316L with some delta-ferrite segregations in the longitudinal direction. With regard to the aim of this work, no further investigations were conducted on the quantification of microstructural units.
Although it has been found that the austenite single-phase material stainless steel 316L can be converted into martensite using specific process conditions [29], no significant indications for the formation of martensite could be found using either OM or XRD analysis. This confirms the findings of [24]. The authors of [27] observed needle structures in microstructural analysis, which were identified as austenite needles. According to [28], martensite is only formed at very low laser powers. Figure 6 shows an exemplary XRD diffractogram of the additive-manufactured specimens. In addition, quantitative phase analysis according to ASTM E 975-13 revealed no bcc phase in the PBF-LB/M specimens.

3.4. Mechanical Properties of the Material

An overview of tensile tests for specimens manufactured using machine 1 can be seen in Figure 7. Generally, the measured data show low variation, with a few exceptions for the yield strength (YS). Differences in YS, ultimate tensile strength (UTS) and elongation at fracture (elongation) can clearly be seen between specimens, with variations regarding slope angle (N), orientation (a), wall thickness (t) and cross-sectional area of the specimen, which is described via the equivalent diameter (D) of a circle with the same surface area. These dependencies will be discussed in the following sections.

3.4.1. Comparison of PBF-LB/M-Manufactured Specimens and Specimens from Sheet Metal

In comparison to the reference specimens produced from sheet metal (M3), the PBF-LB/M-manufactured specimens from both PBF-LB/M machines (M1, M2) show comparable mechanical properties. UTS from all specimens as well as elongation of vertical (a 0°) specimens at 0° slope angle are very similar. YS of additive-manufactured specimens are around 40% higher. For AM specimens, slightly higher values for YS and UTS in the horizontal (a 90°) direction were determined along with reduced elongation at fracture by approximately 20% compared to the vertical direction. Horizontal additive-manufactured specimens show up to 35% lower elongation at fracture compared to conventional reference M3 specimens.
An overview of the compared specimens with an equivalent diameter (D) of 5 mm and a wall thickness (t) of 2 mm (D5t2) can be seen in Figure 8.

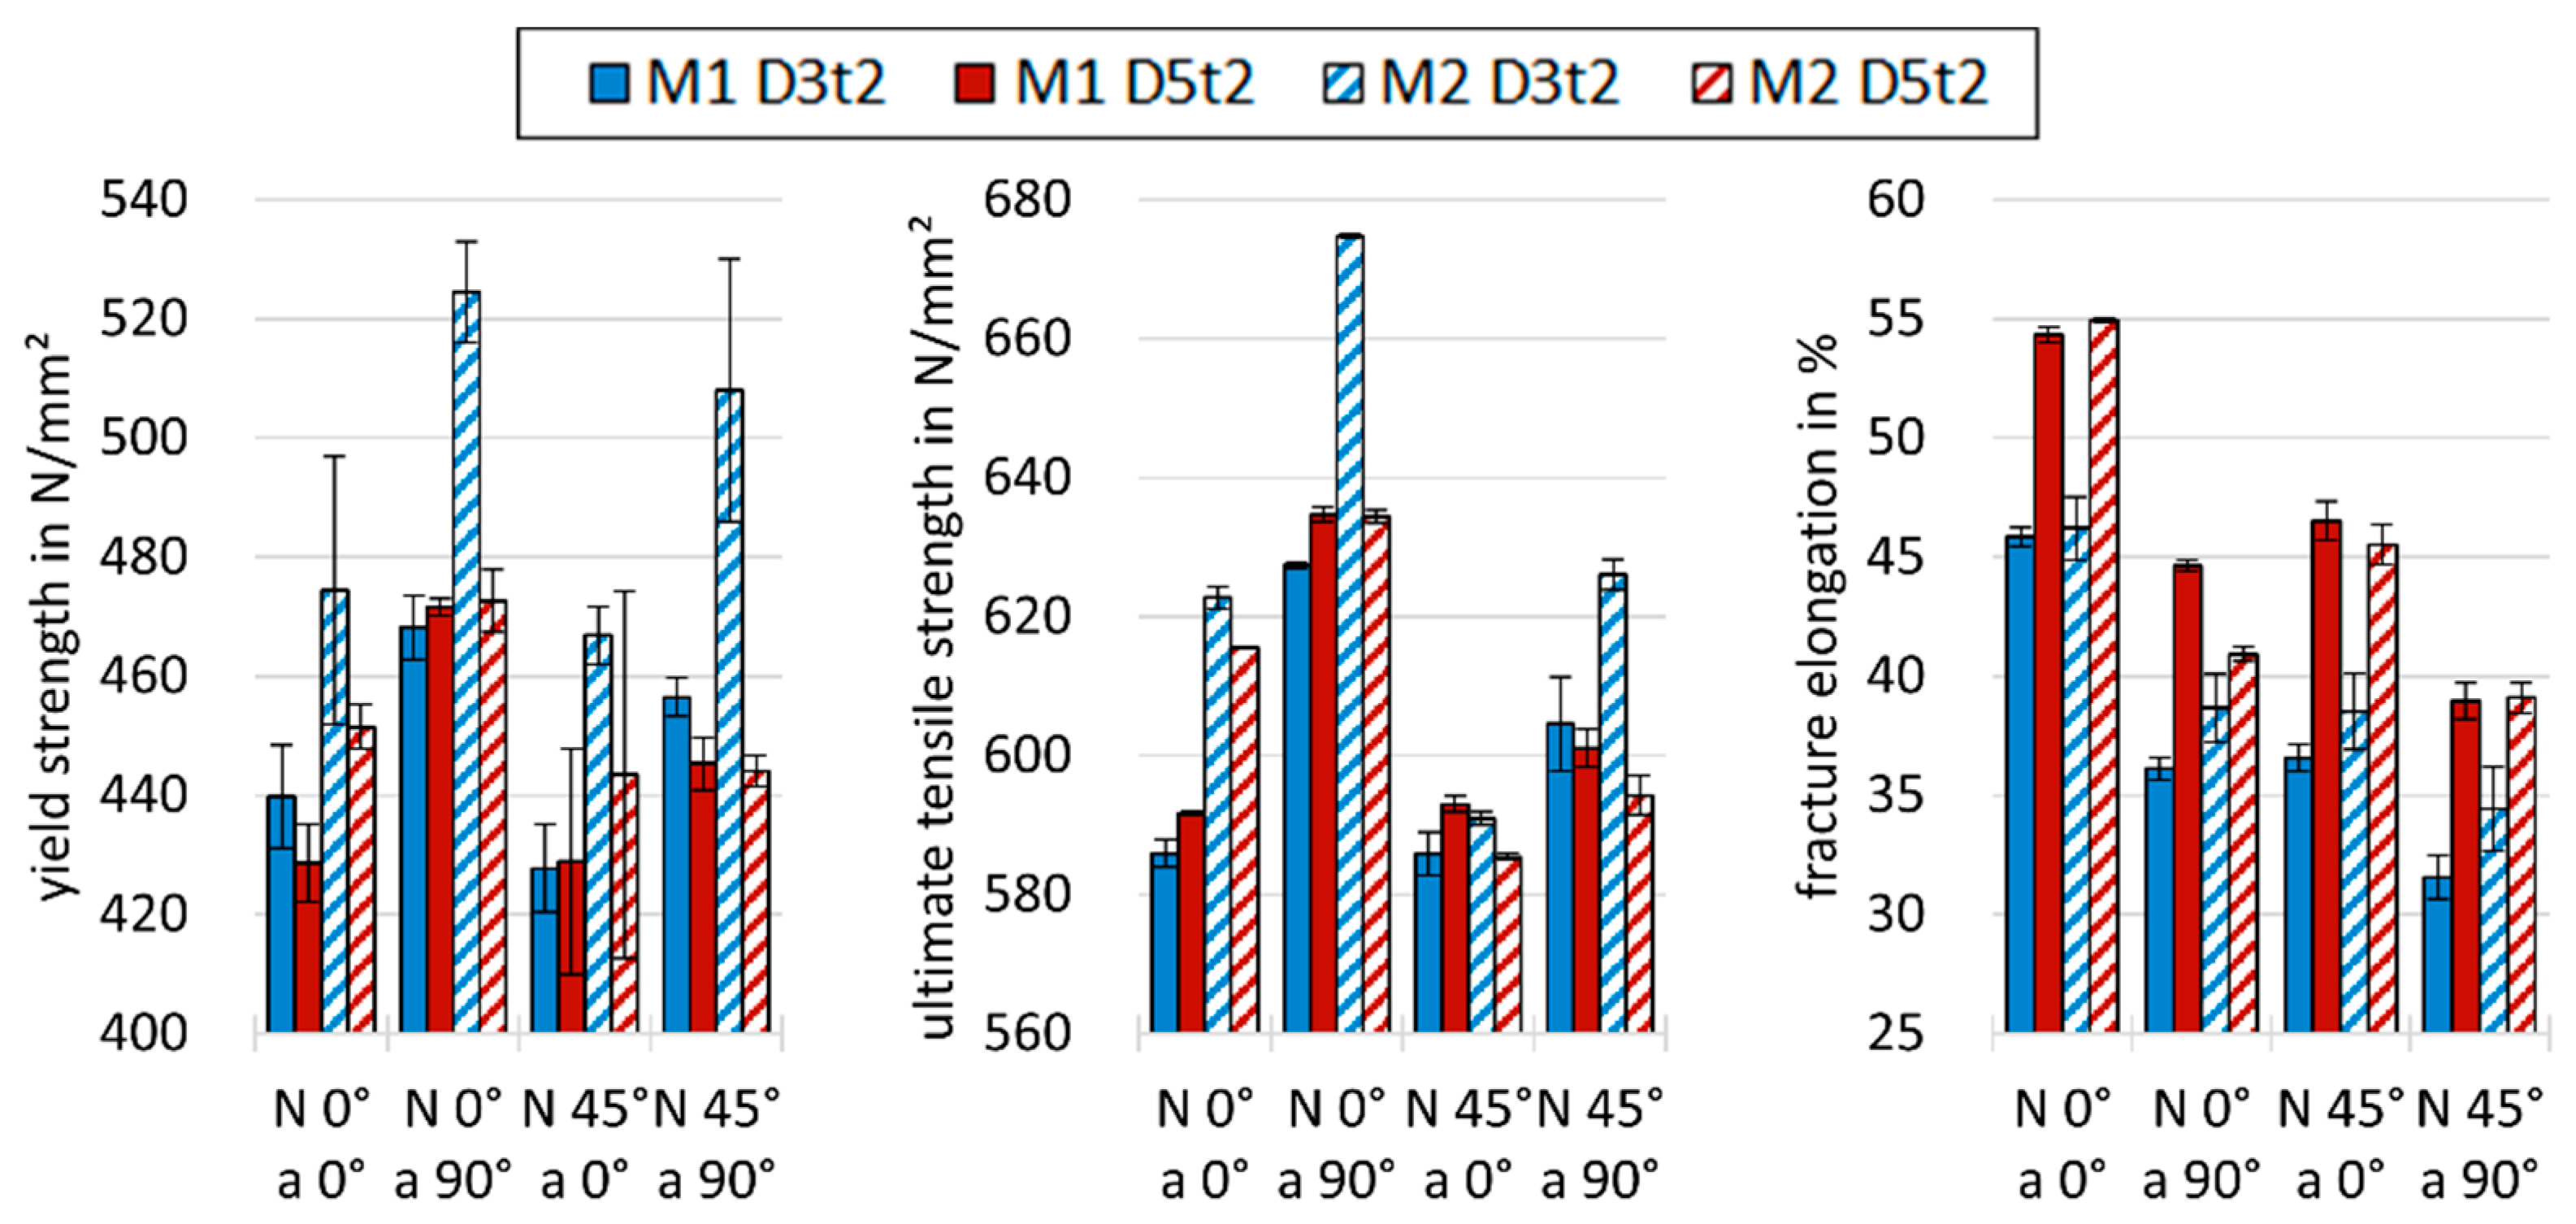
3.4.2. Comparison of Specimens from Two Machines Identical in Construction

Figure 9 shows the comparison of the mechanical properties of two different specimen geometries from two identical PBF-LB/M machines at two different locations.
While differences in mechanical properties between specimens with geometry D5t2 from both machines are small, the mechanical properties for specimen geometry D3t2 are significantly different, especially in YS and UTS, with around 10% and around 7% higher values for M2, respectively. Generally, M2 shows better mechanical properties for both specimen geometries.

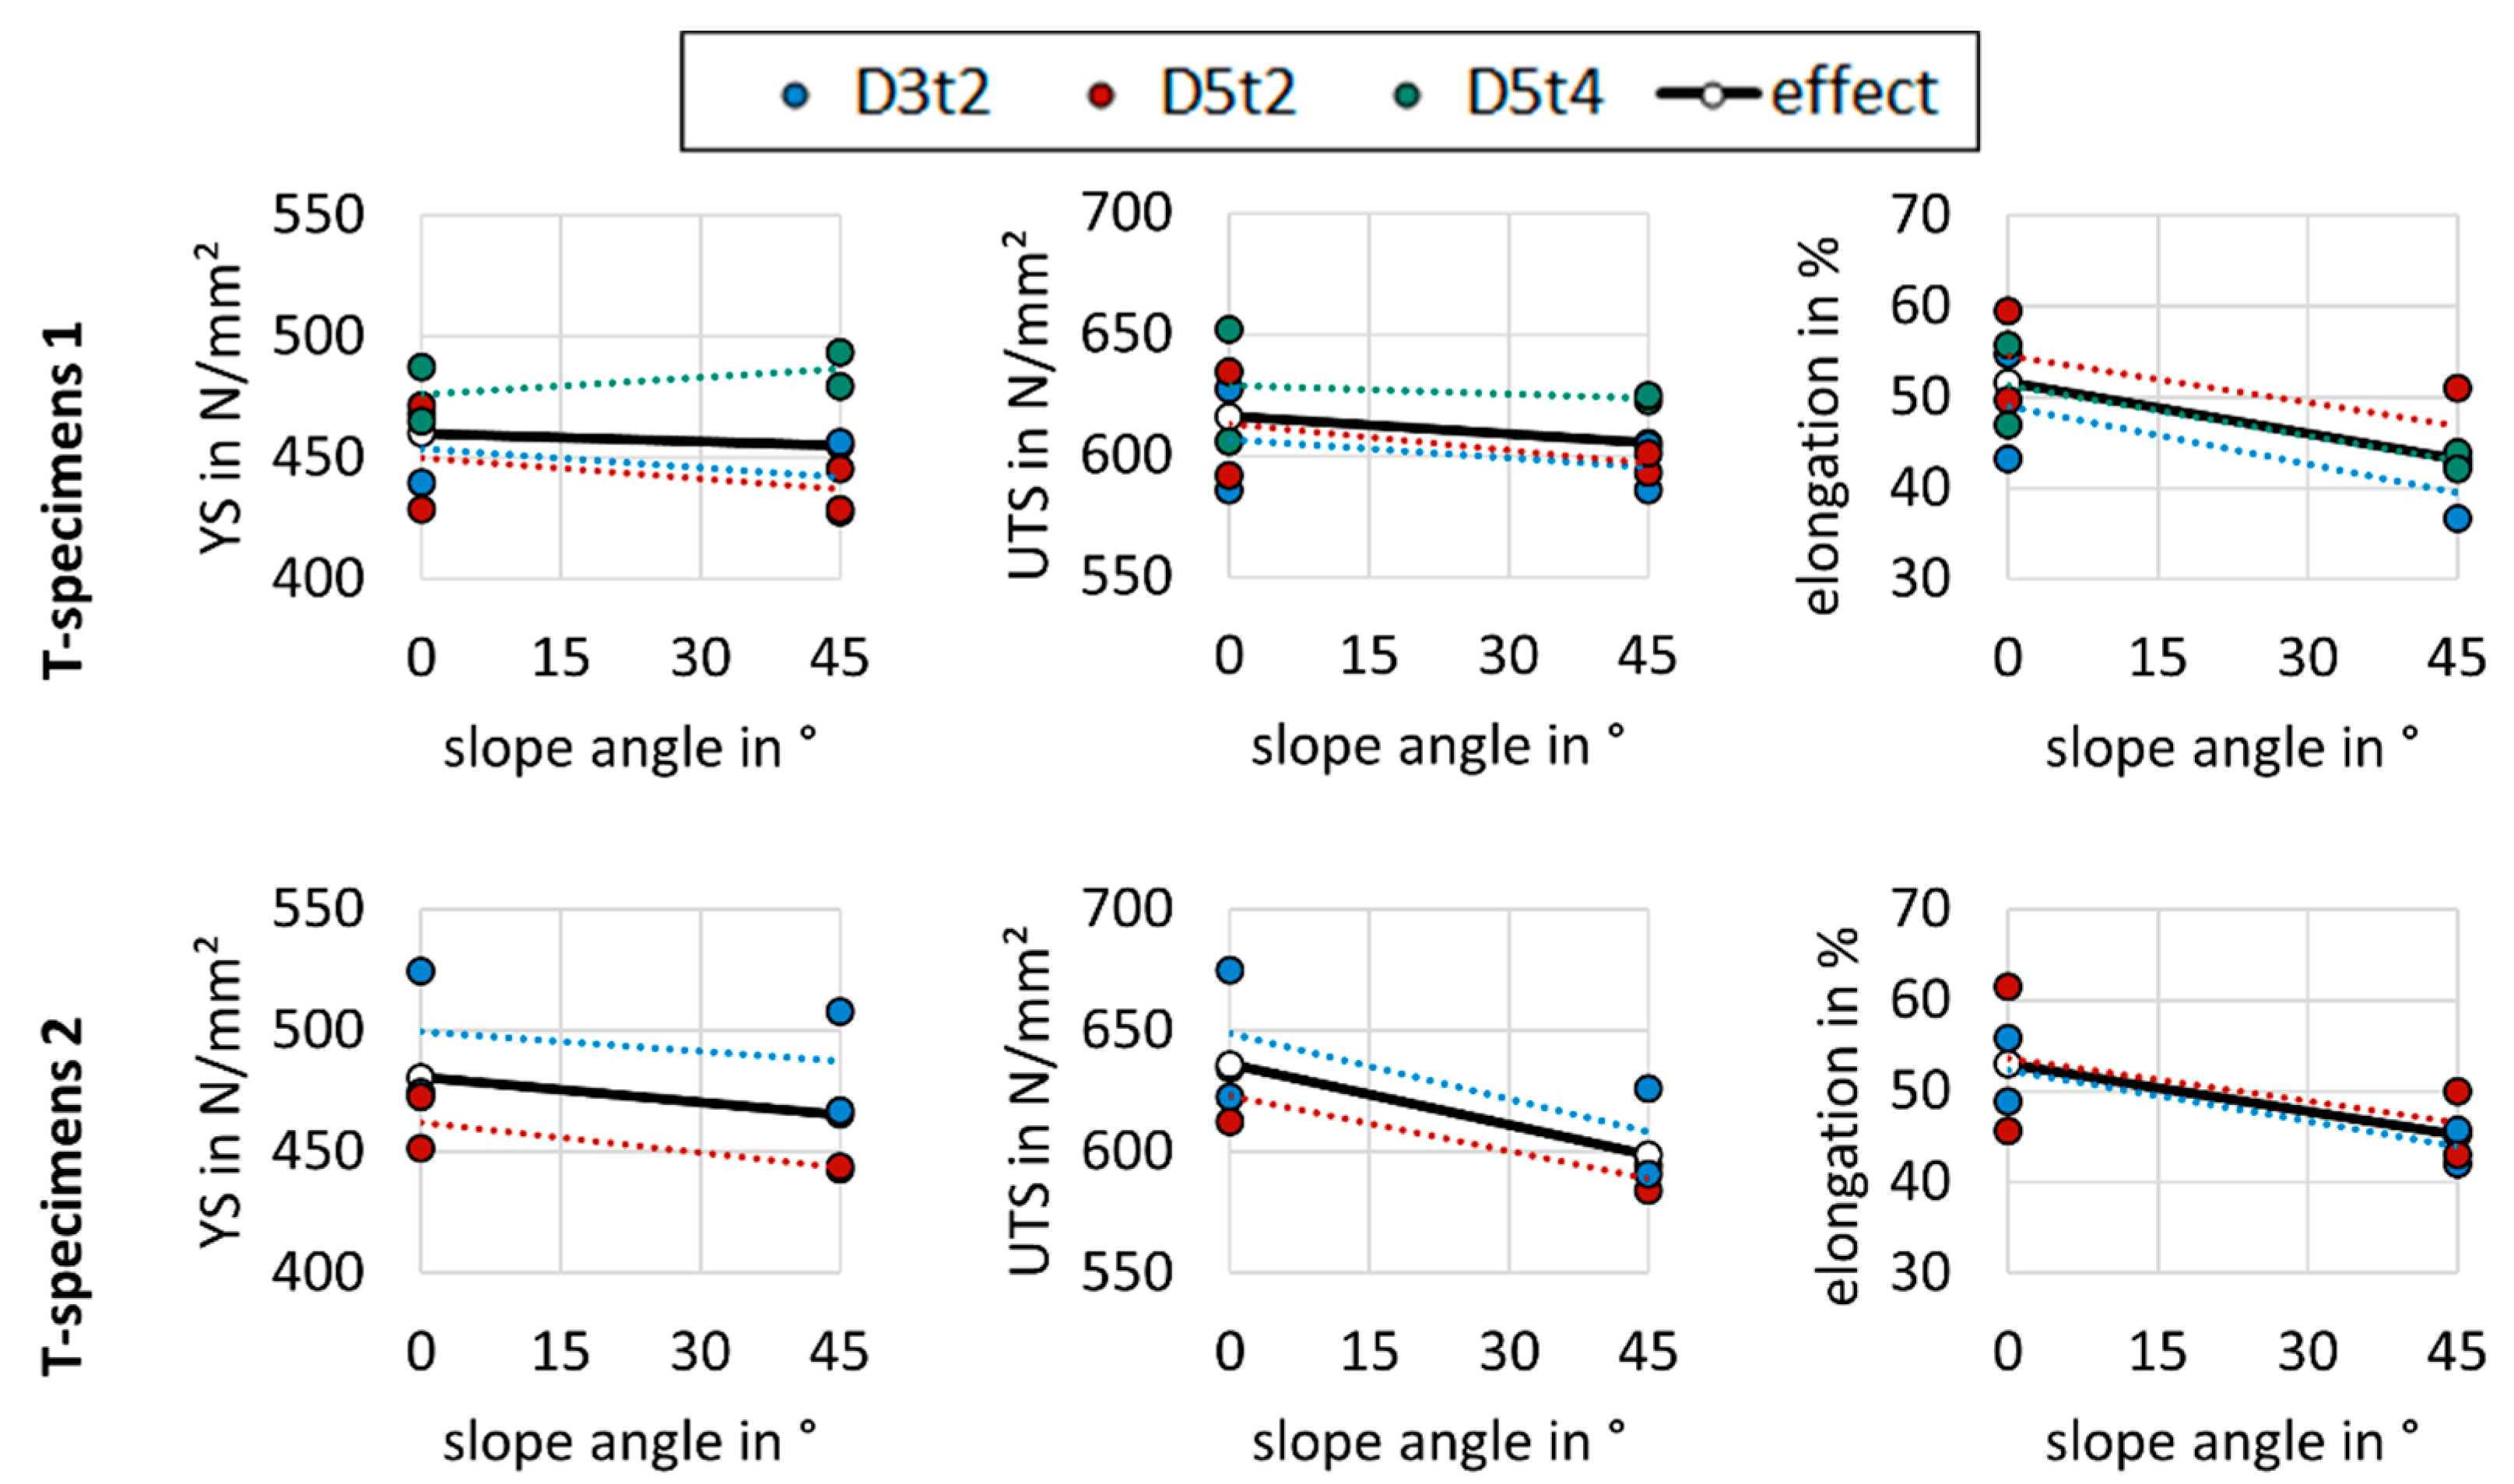
3.4.3. Influence of the Slope Angle

The effect of the slope angle on YS, UTS and elongation can be seen in Figure 10 for the PBF-LB/M-manufactured tensile test specimens.
All following effects hereby represent main effects according to a design of experiment (DOE) based on linear models. These main effects describe trends of the investigated property with regard to all parameters used in this study and do not represent the actual profile of the dependencies.
As specimen geometry D5t4 is available for M1, but not for M2, the determined effect of the slope angle differs slightly for T specimens 1 and T specimens 2 due to possible cross-correlations. In general, all investigated tensile properties tend to decrease with rising slope angle, except for specimen D5t4 of machine M1, which shows a slightly increasing YS with increasing slope angle, while the behavior of UTS and elongation matches that of the other specimen geometries. Cross-correlations regarding the influence of the slope angle and the influence of the specimen geometries cannot be identified with certainty.

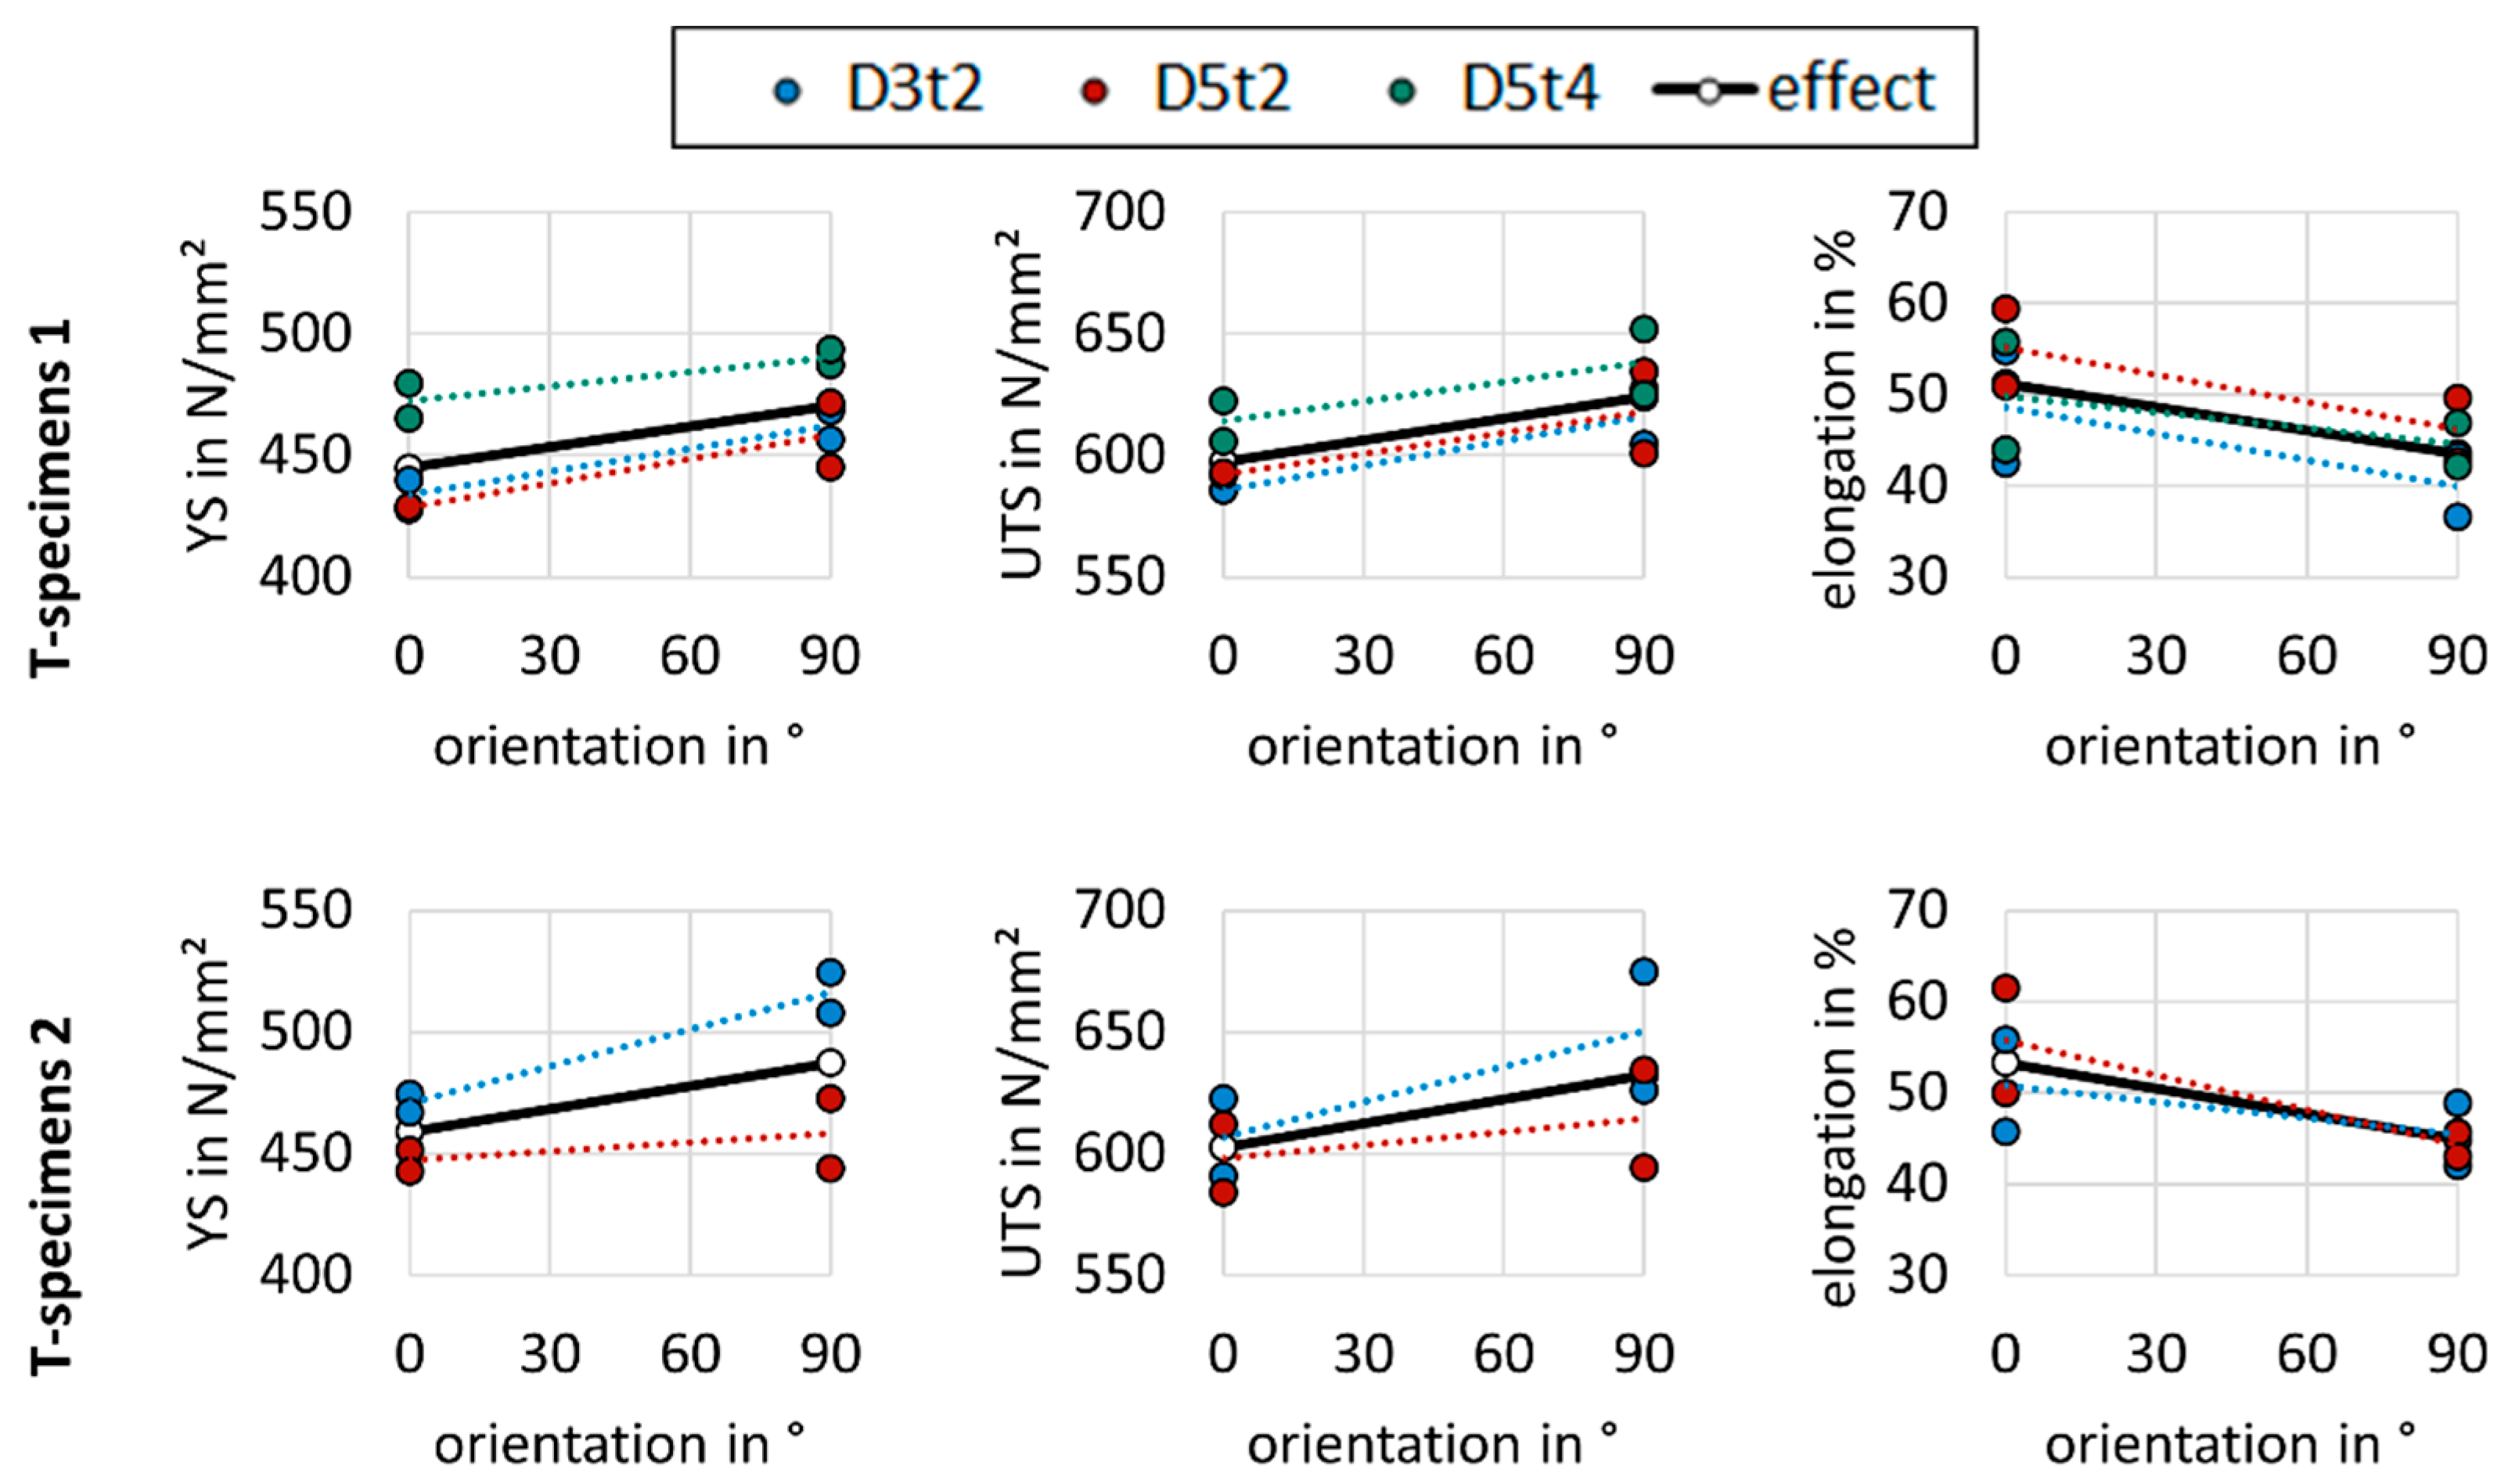
3.4.4. Influence of the Orientation

Regarding the effect of the orientation, very similar tendencies for both machines can be observed, as depicted in Figure 11.
While YS as well as UTS are around 5% higher for horizontal specimens from both machines, elongations of vertical specimens exceed those of horizontal specimens by up to 20% relatively on average. Regarding specimens with slope angles of 0°, specimen M1-D3t2 shows 27%, M2-D3t2 shows 21%, M1-D5t2 shows 22% and M2-D5t2 shows 34% lower elongation at fracture in the horizontal direction compared to the vertical direction. Specimens with slope angles of 45° also have consistently lower elongation at fracture in the horizontal direction compared to the vertical direction. However, the decreases in elongation at fracture of 45° specimens are not as pronounced as those of 0° specimens (Figure 9). Small cross-correlations with the cross-sectional area can be seen by comparing the data points of D3t2 and D5t2 from M2, resulting in larger influences of the orientation on the YS and UTS at smaller cross-sectional areas. This effect is not observable for the specimens of M1 though.

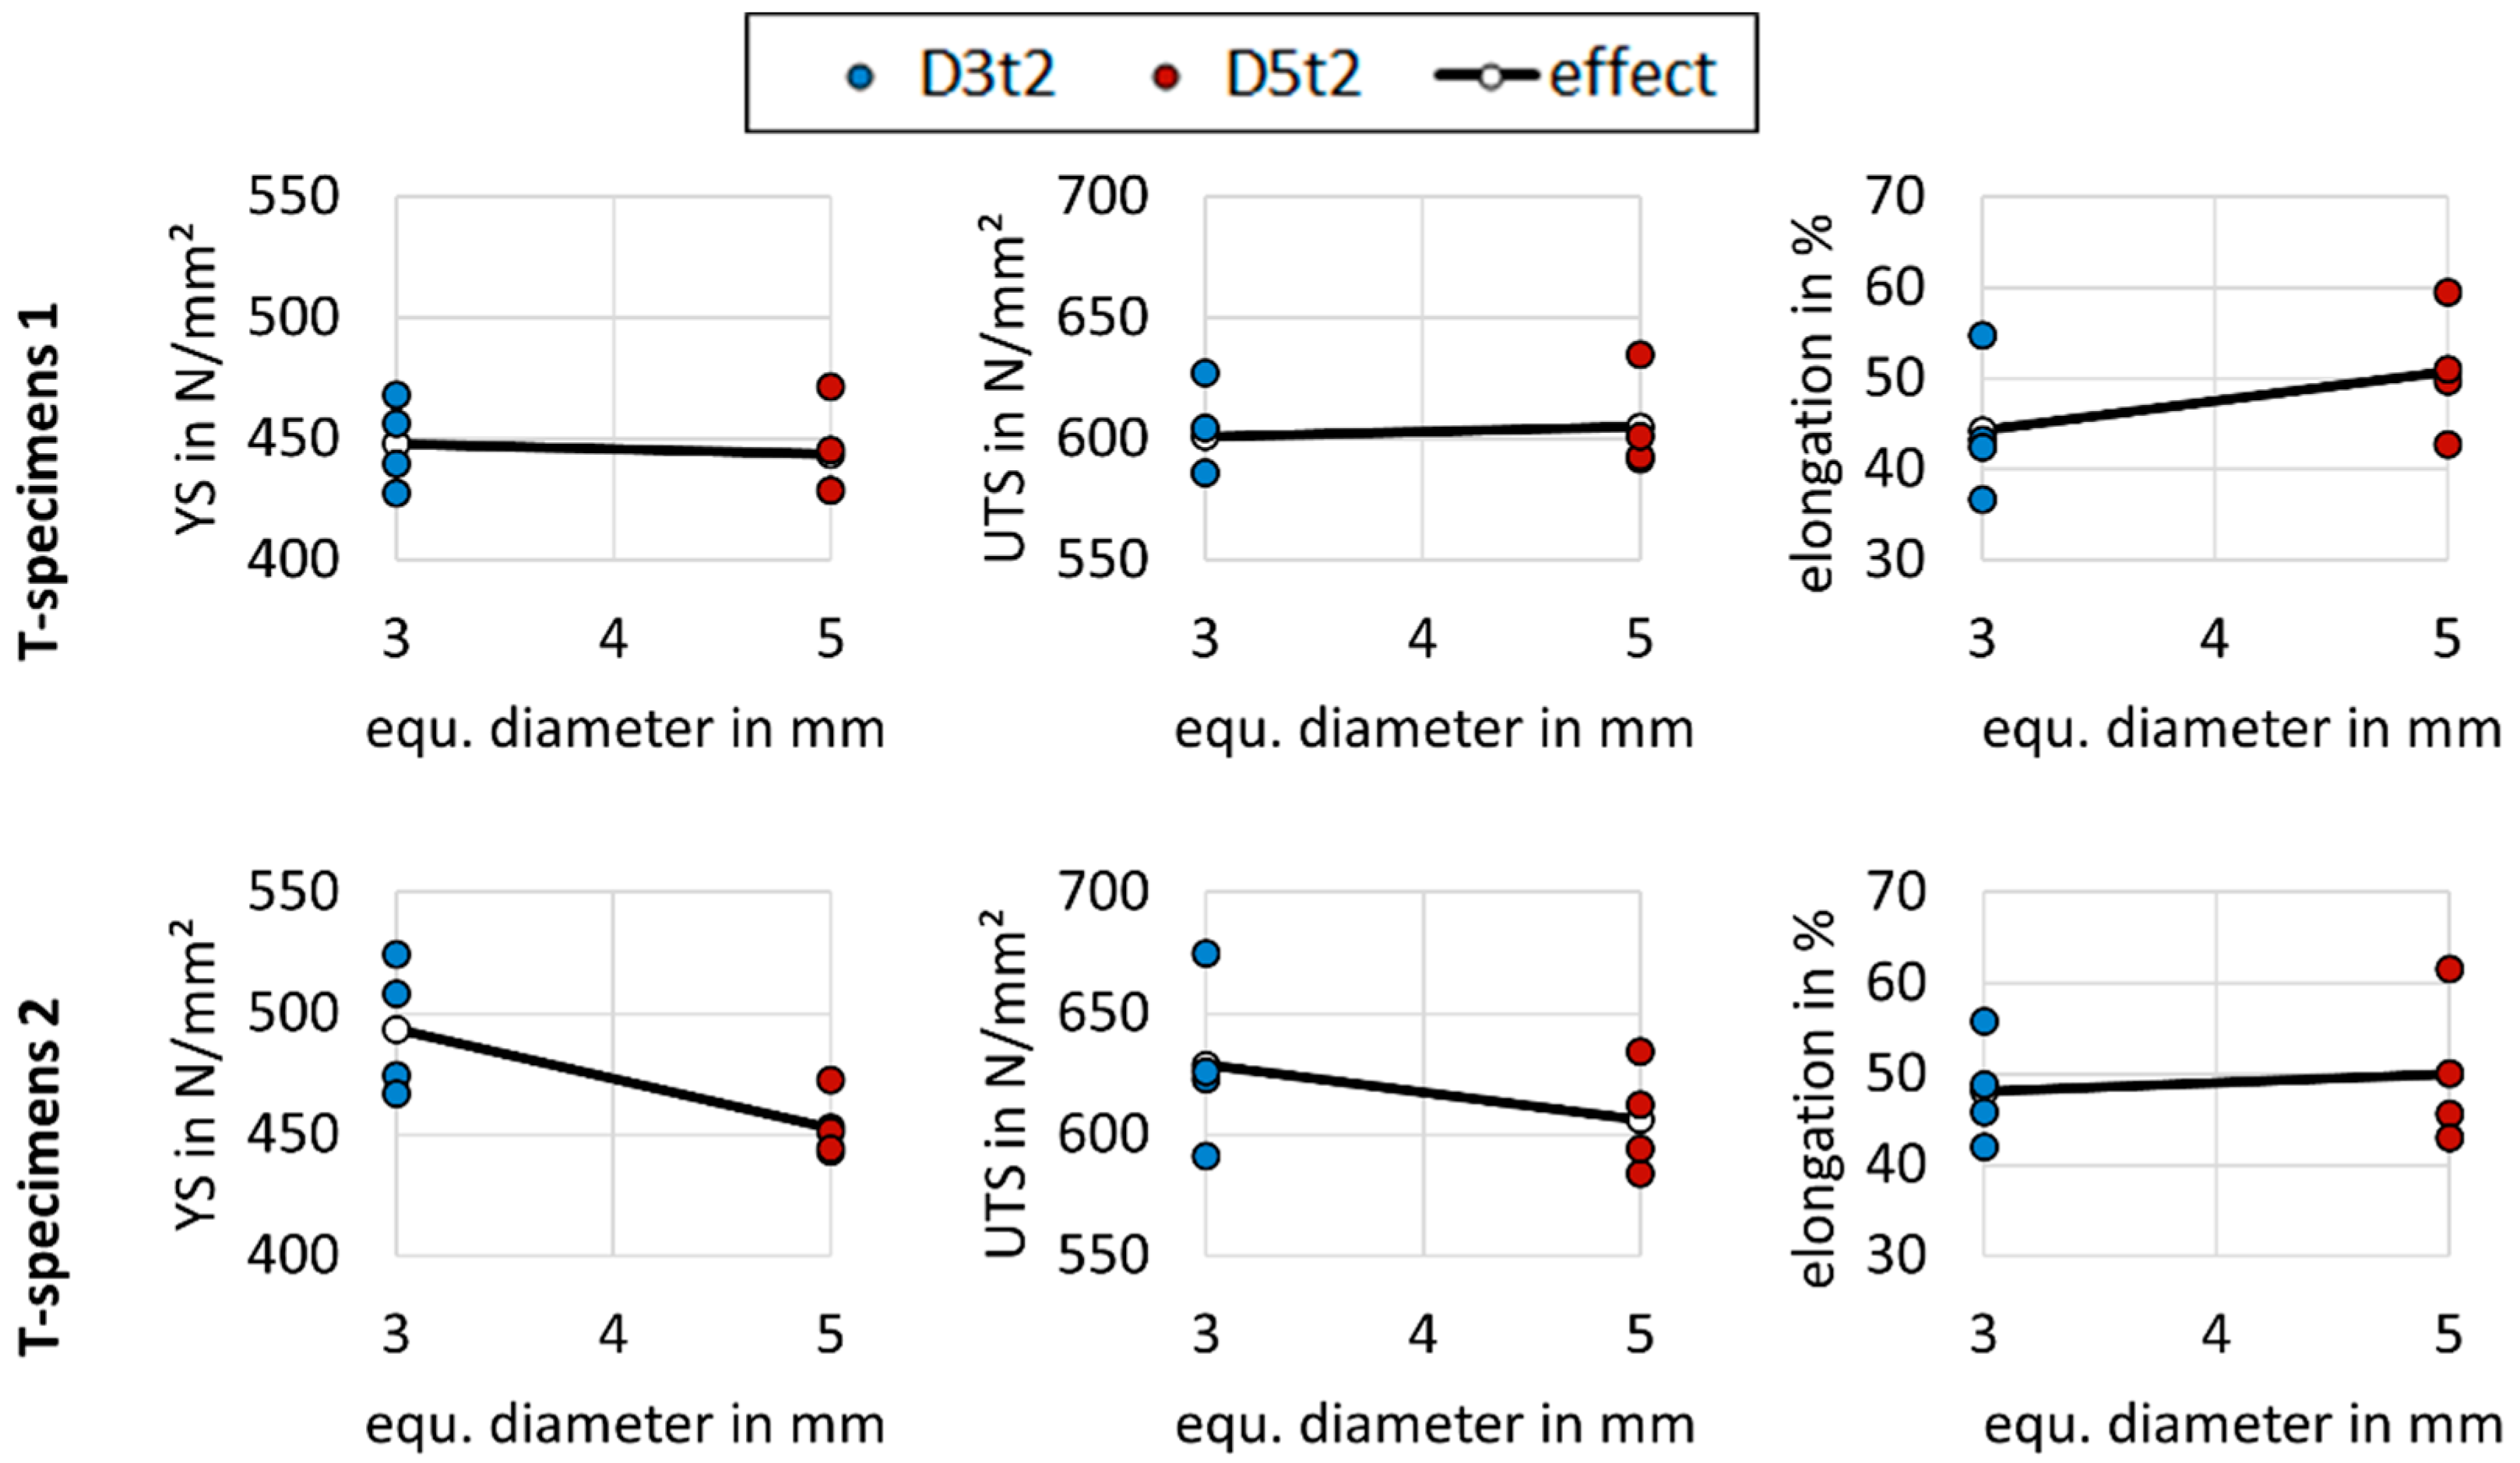
3.4.5. Influence of the Cross-Sectional Area

Differences in mechanical properties can be seen at different cross-sectional areas for both machines and are shown in Figure 12.
Although the UTS slightly rises at increasing cross-sectional areas for T specimens 1 and decreases at increasing cross-sectional areas for T specimens 2 and therefore the tendencies of the UTS do not match for the two machines, the YS as well as the elongation show similar dependencies for both machines to the cross-sectional area. The YS decreases by up to 10% and the UTS by up to 5% for T specimens 2 with increasing cross-sectional area and the elongation increases by up to 20% for T specimens 1 with increasing cross-sectional area. The effect is not pronounced for YS and UTS at M1 and for the elongation at M2 though.

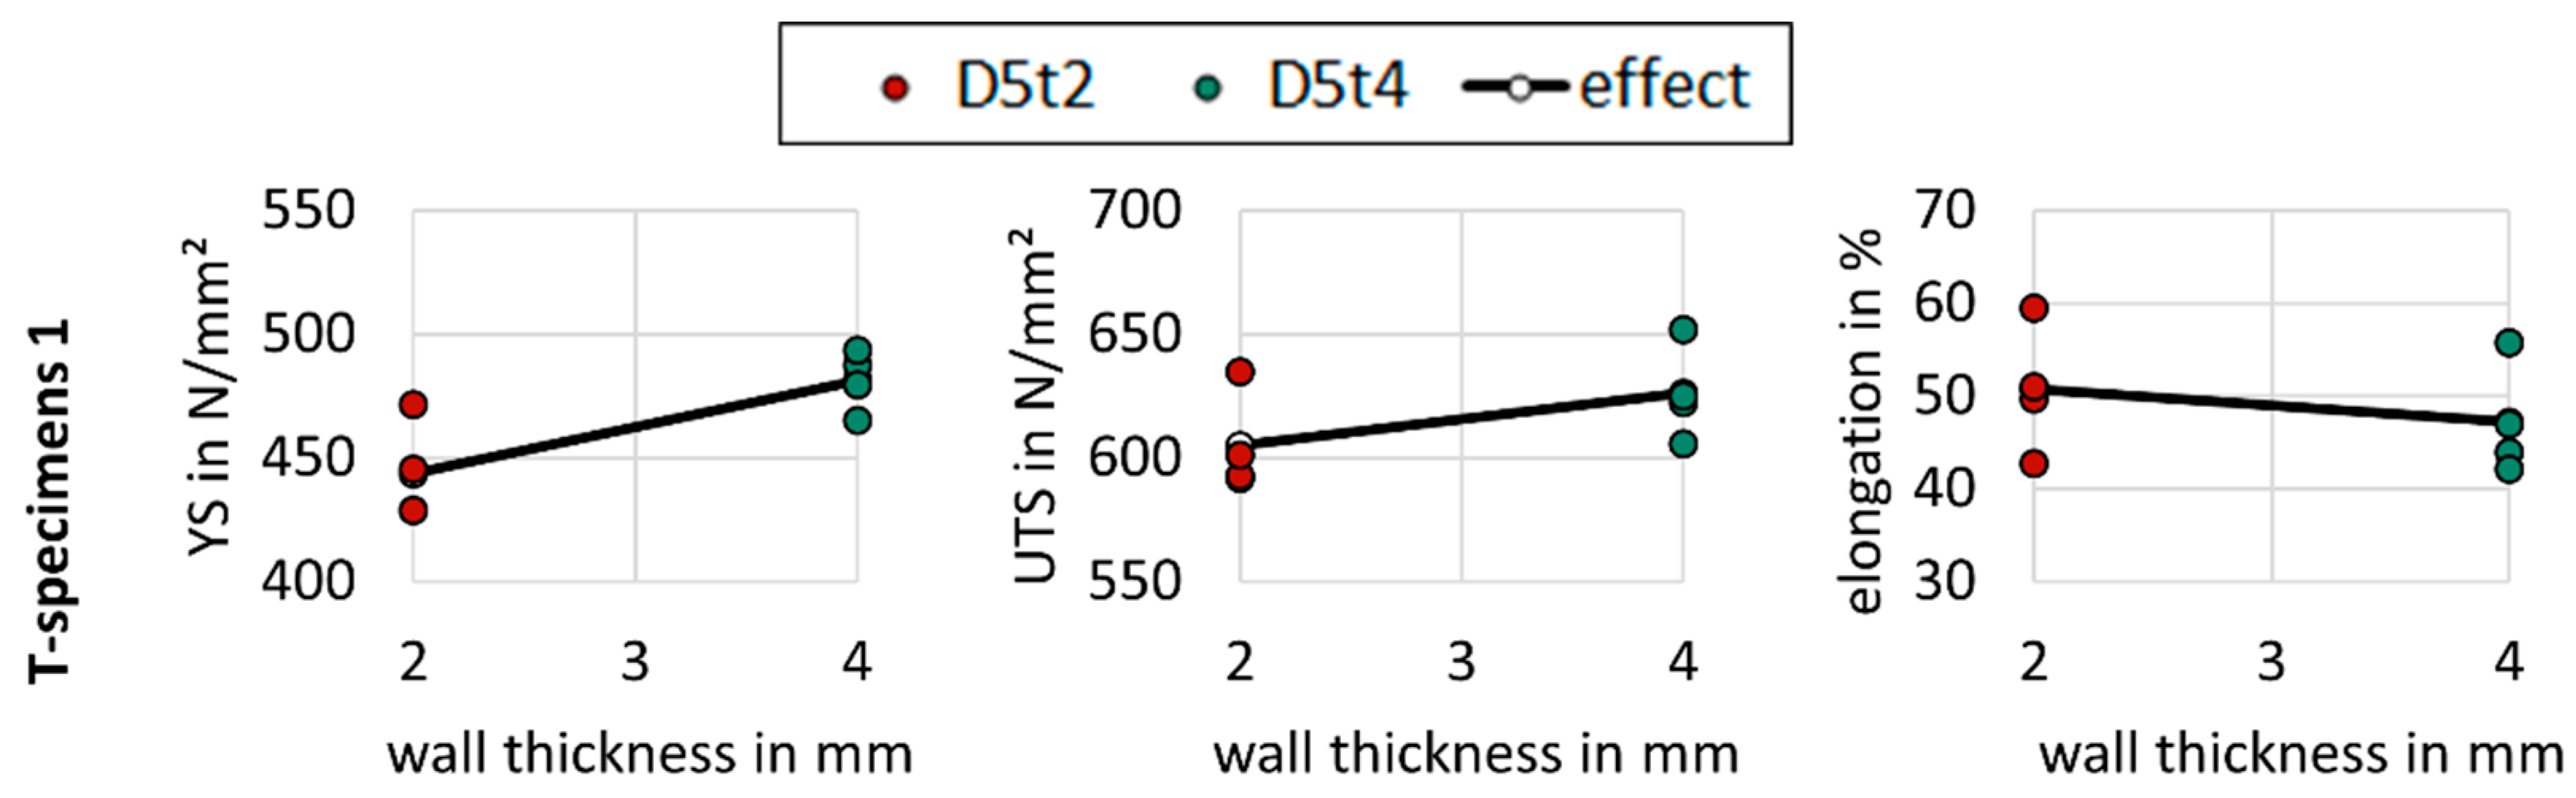
3.4.6. Influence of the Wall Thickness
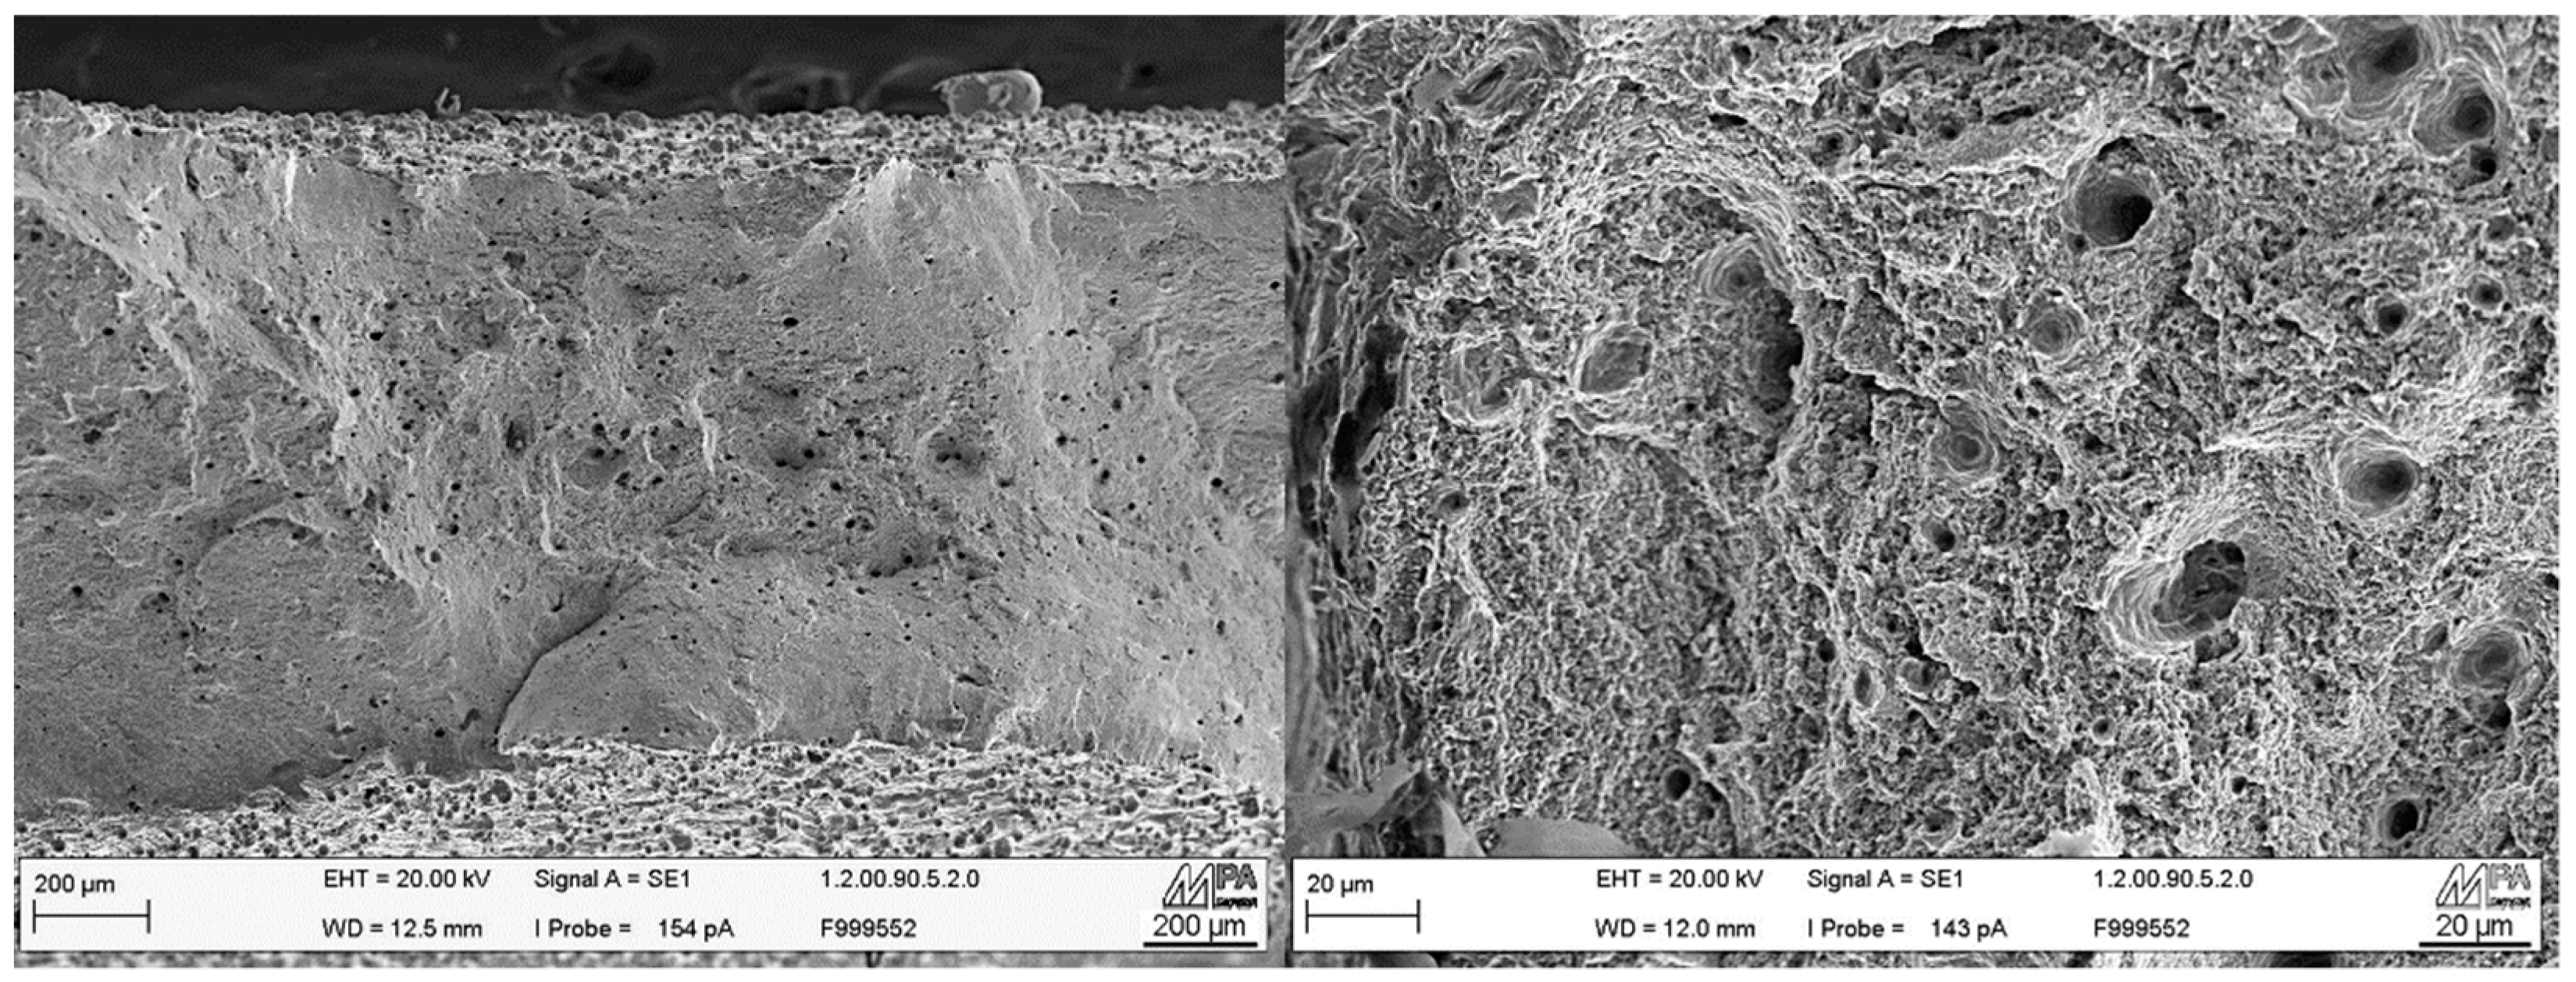
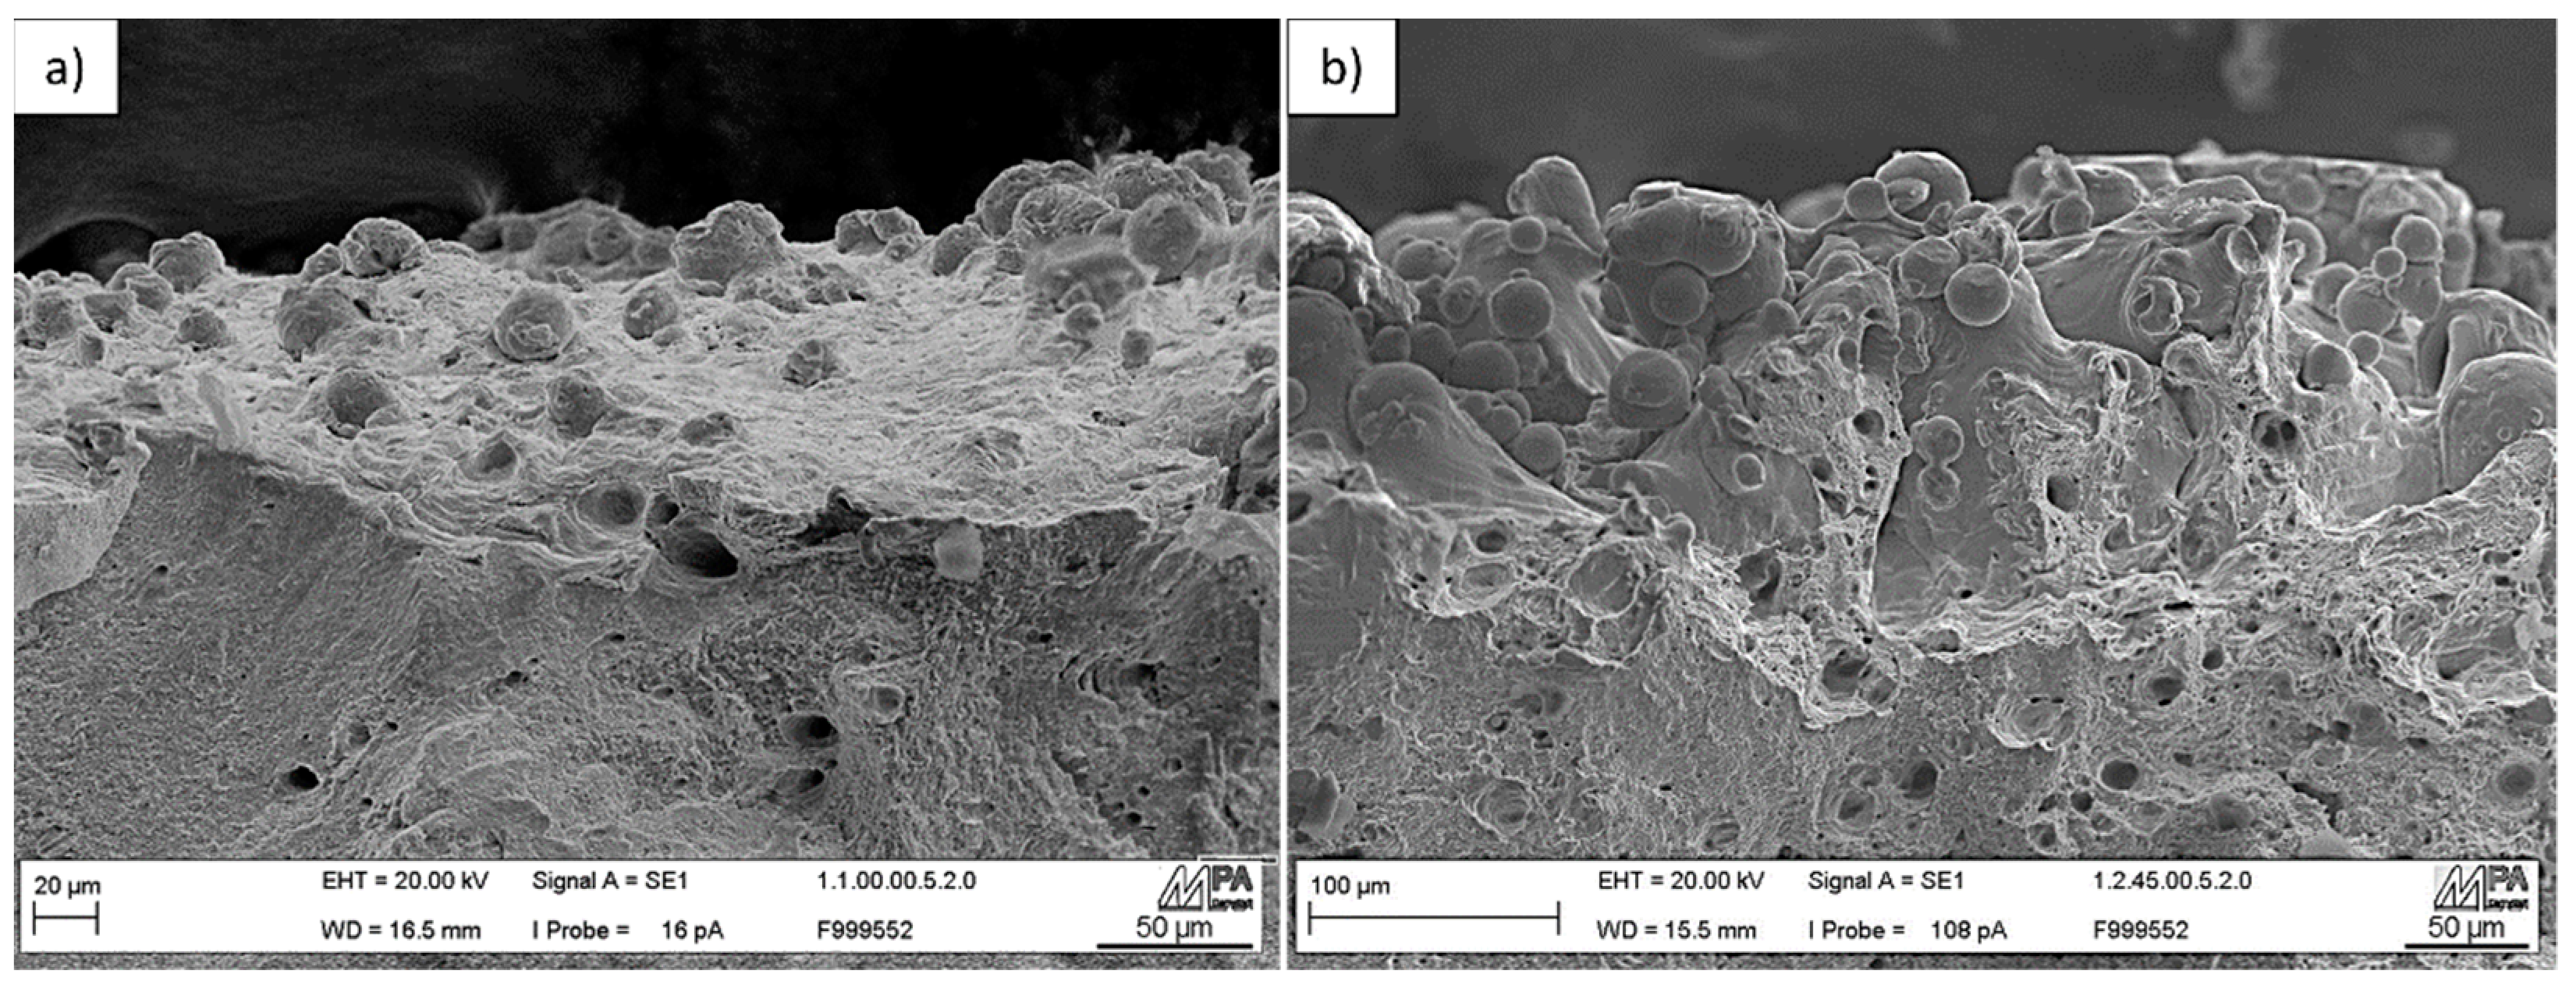
The influence of the wall thickness on the mechanical properties can be seen in Figure 13.
Specimens with the same cross-sectional area but thicker wall thicknesses show around 10% higher YS and around 5% higher UTS compared to specimens with smaller wall thicknesses. On the other hand, the elongation at fracture is reduced slightly by up to 5% relative to a higher wall thickness.

3.4.7. Fractography

Exemplary SEM images of the fracture surfaces of additive-manufactured T specimens are shown in Figure 14. In contrast to [50], where different fracture surfaces are observed for different orientations, all additive-manufactured T specimens in this work show very similar ductile fracture surfaces with very fine ductile dimples and some larger cavities caused by porosity, indicating the same ductile fracture mechanism. Therefore, the entire fracture surfaces reveal the characteristic features for a ductile shear fracture and no significant differences in fracture microstructure could be observed between the different orientations.

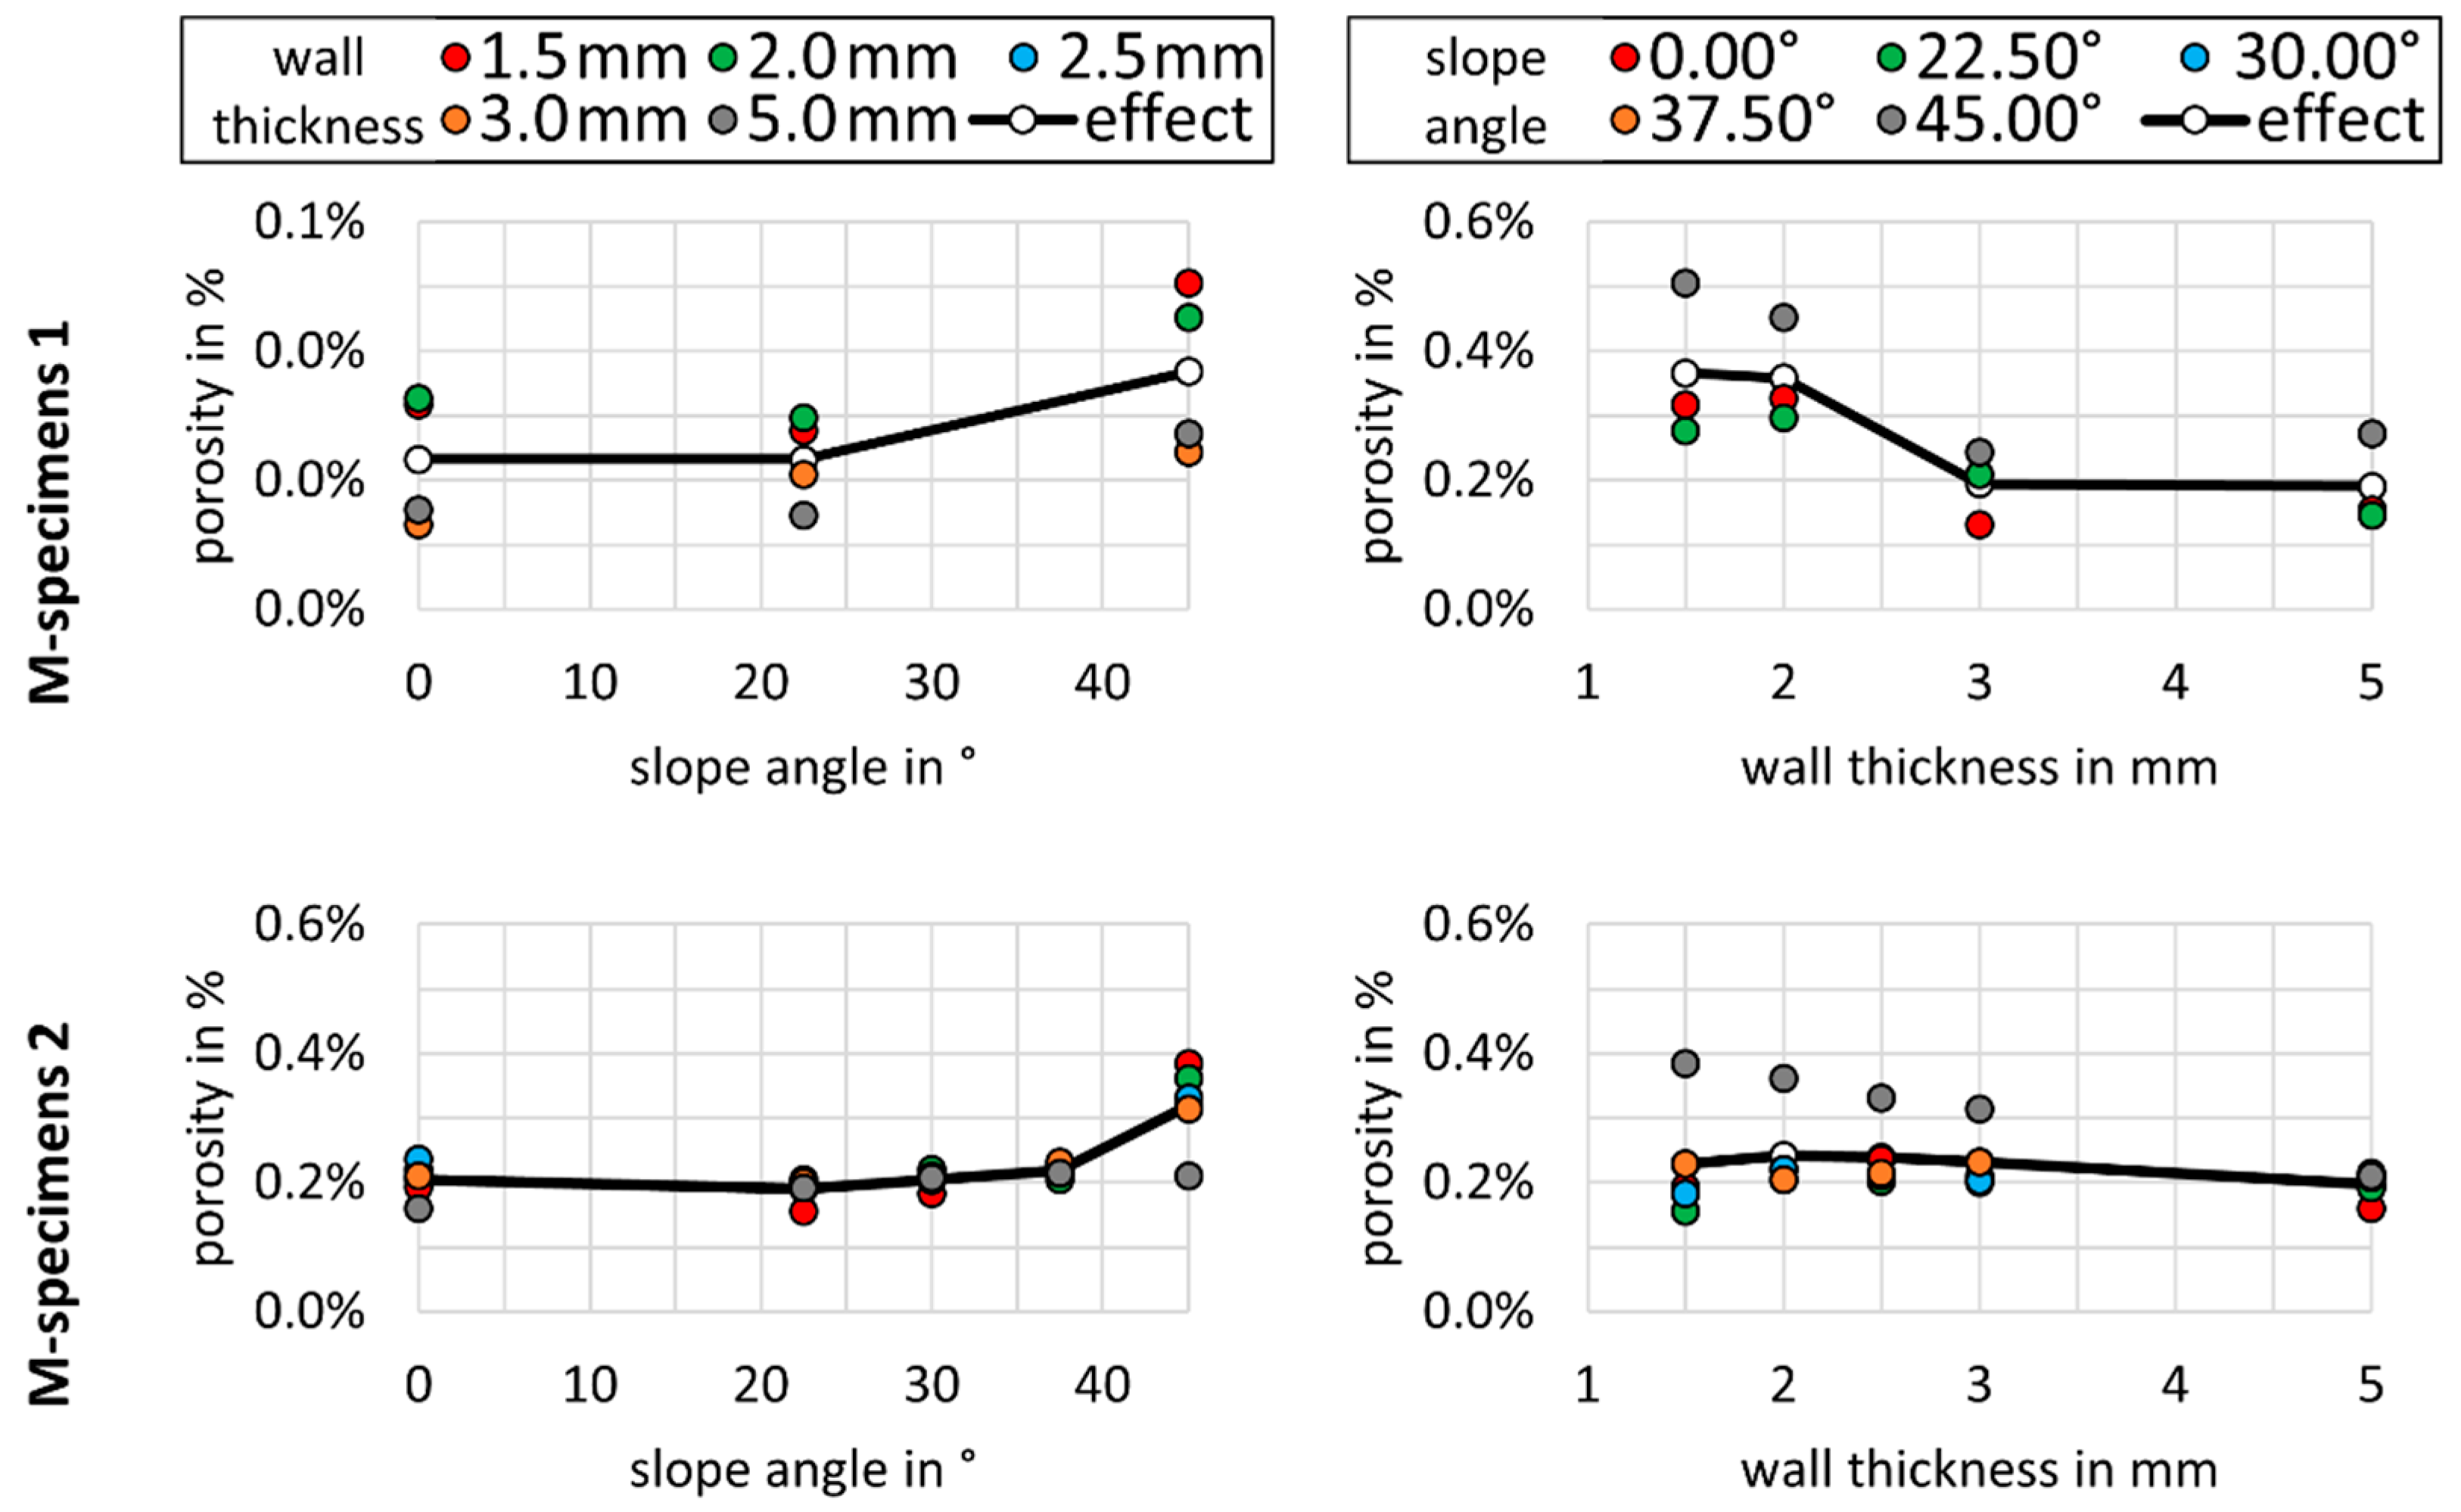
3.5. Porosity in Relation to Wall Thickness and Slope Angle

As can be seen in the exemplary optical microscopy images in Figure 15 of the porosity in unetched M specimens 1, the accumulation of round pores as well as higher surface roughness occur near the downskin area of M specimens built at slope angles of 45°. The porosity of M specimens 1 and 2 in relation to the slope angle and the wall thickness can be seen in Figure 16.
M specimens 1 and 2 show similar porosity values of around 0.2% with very similar tendencies by increasing slope angle with porosities up to 0.5%. First, the porosity changes only slightly with smaller slope angles up to 37.5°, but then rapidly increases at 45°. However, while the porosity in M specimens 1 decreases by around 45% on average with increasing wall thickness, this dependency can only be seen in walls with slope angles of 45° in M specimens 2. Walls with lower slope angles of M specimens 2 show almost no obvious dependencies on the wall thickness.

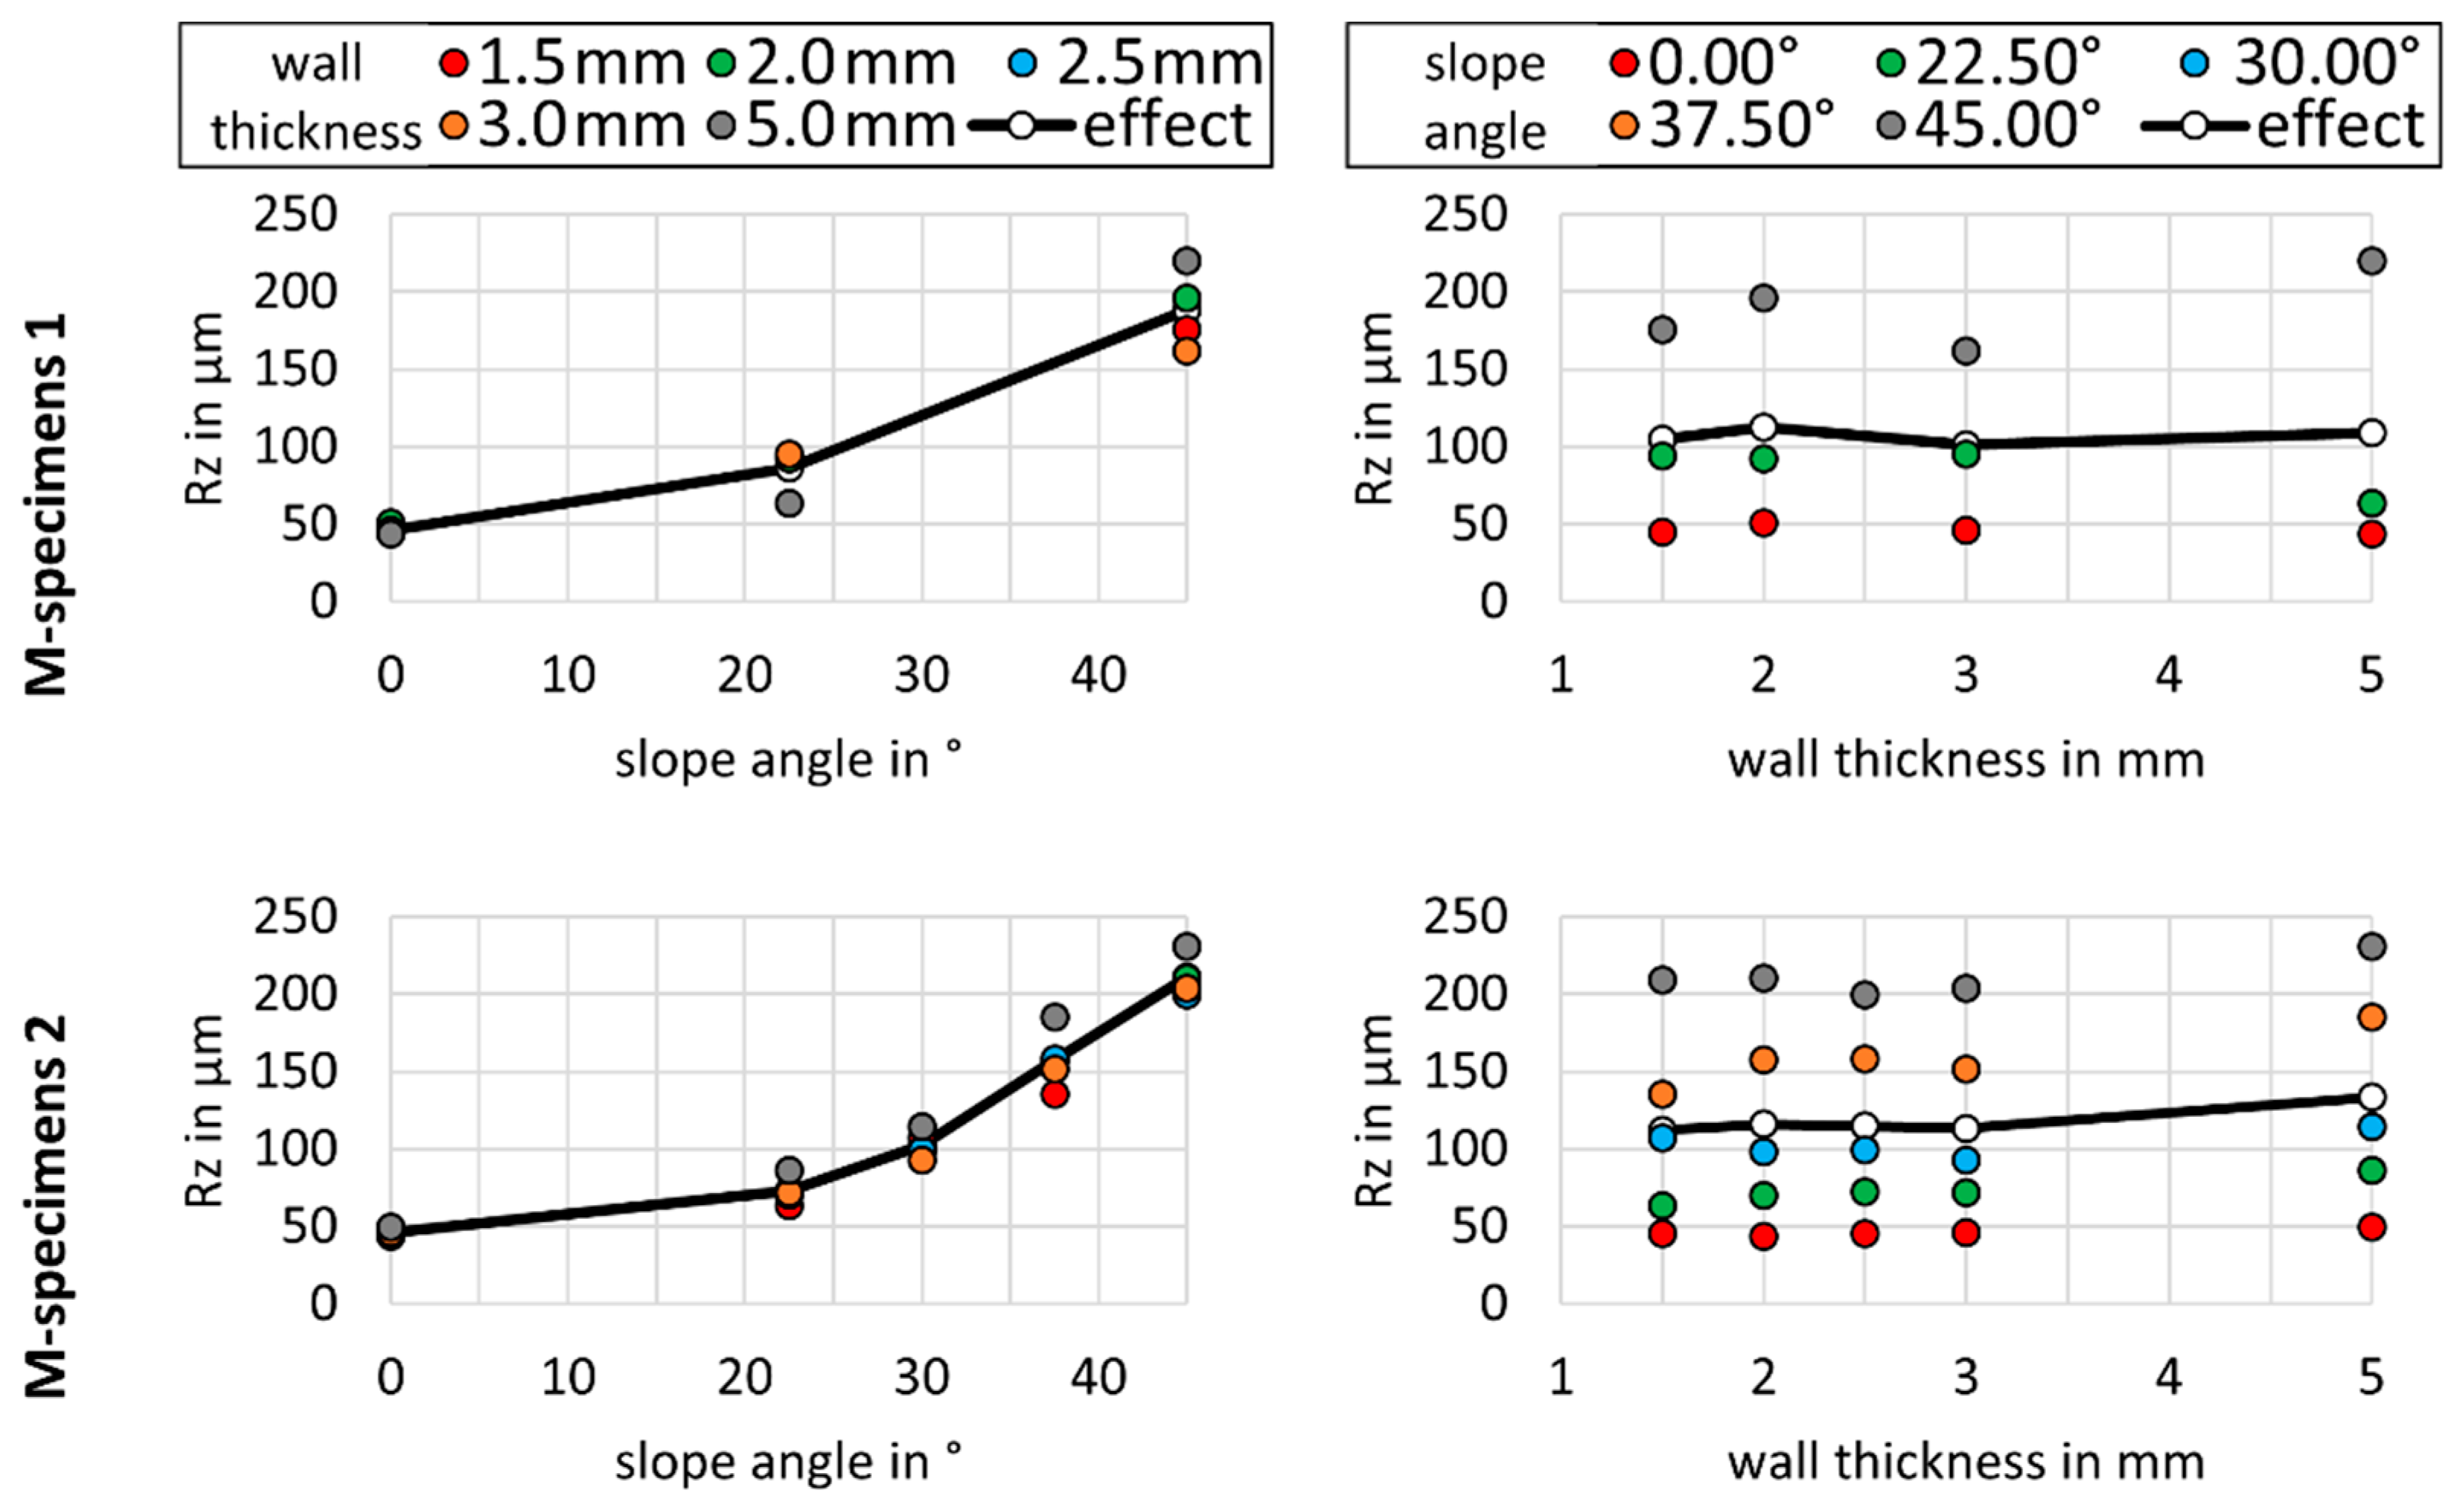
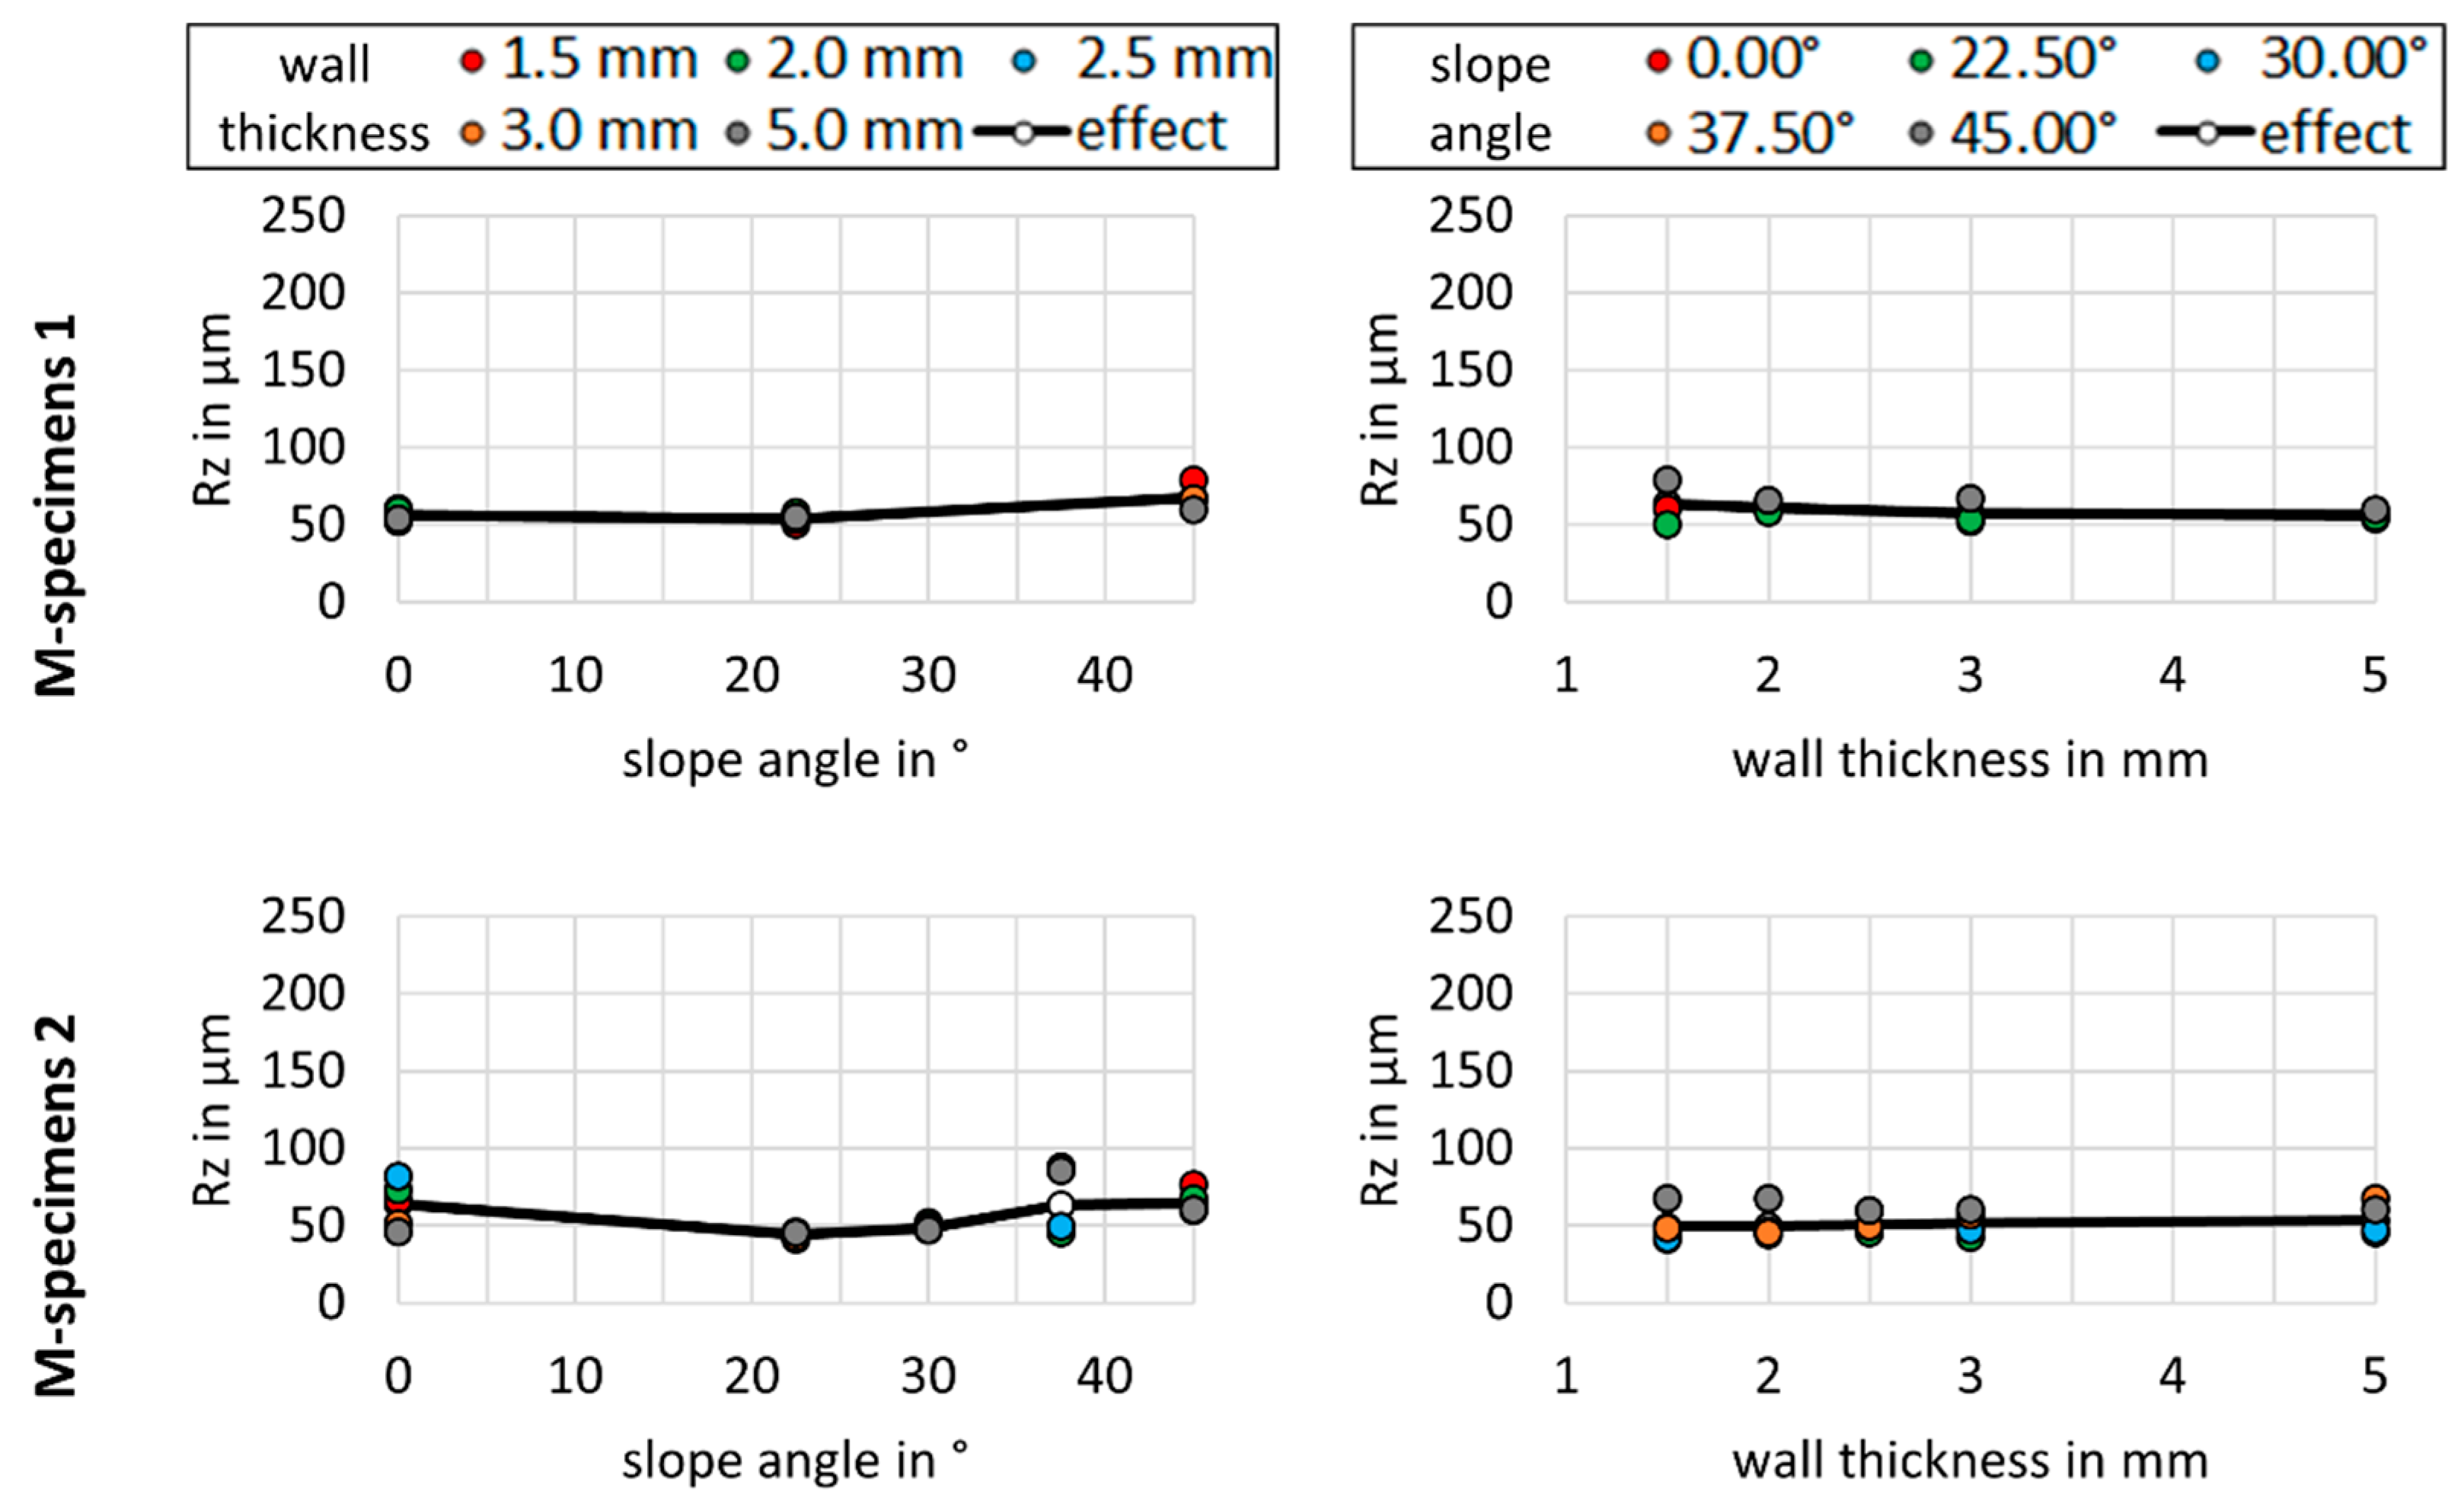
3.6. Surface Roughness in Relation to Wall Thickness and Slope Angle

Results of the roughness measurements, which are presented for downskin areas in Figure 17 and for upskin areas in Figure 18, show almost identical tendencies for all M specimens 1 and 2.
For downskin areas, the roughness increases with the rising slope angle. As with the porosities in specimens 1 and 2, the increase is higher at higher slope angles compared with smaller angles, reaching its peak at a slope angle of 45° with a roughness around Rz = 200 µm, which is four-times higher than for vertically oriented M specimens. Dependencies on the wall thickness are not clearly detectable.
Although all M specimens 1 and 2 also show comparable tendencies for roughness on upskin areas, in comparison to downskin areas, the measured surface roughness values are much lower at higher slope angles. Roughness values increase with increasing slope angles. The highest roughness values are measured at a slope angle of 45° with a maximum value of Rz = 100 µm. A dependency of surface roughness on wall thickness can also not be found for upskin areas.
Figure 19 shows exemplary SEM images of the surfaces of additive-manufactured T specimens built at (a) 0° slope angle and (b) 45° slope angle in downskin area showing higher accumulation of unmolten or partially molten powder feedstock particles at higher slope angles.

4. Discussion

4.1. Mechanical Properties

Tensile tests of PBF-LB/M-manufactured stainless steel 316L specimens show approximately 40% higher YS and comparable UTS in comparison to conventionally manufactured specimens from sheet metal. Furthermore, they show lower elongation values, especially for horizontal specimens, with up to 35% lower elongation at fracture. This confirms the findings of existing studies [18]. As no significant indication for martensite could be measured using XRD, differences in mechanical properties cannot be related to the formation of martensite. It can be assumed that the higher YS results from the finer microstructure and the lower elongation at fracture from the porosity up to 0.5%. Slightly lower UTS values may be caused by effect of both strengthening through the refined microstructure and weakening through the higher defect density. The fracture microstructures show the characteristic features of a ductile shear fracture with dimples, which confirms the findings of [51] for low-porosity specimens.
The mechanical properties, especially the elongation at fracture, are found to be anisotropic, resulting in around 5% higher YS and UTS and up to 20% higher elongation at fracture in the vertical direction parallel to the building direction in comparison to the vertical direction. This can also be explained by the columnar and therefore anisotropic microstructure, which is a result of the layer-by-layer manufacturing process of PBF-LB/M and is well described in the literature [30,31,34,50,52].
Decreasing mechanical properties with rising slope angle can be explained by both the anisotropic properties of the microstructure and higher porosities and surface roughness due to specific thermal process conditions at downskin area features. While the effect of such low porosity as determined in this work has been said to have no influence on the mechanical properties according to [53], the individual influence of each effect cannot be determined in this study and is a topic for further investigations.
The geometries of the specimens have an effect on the mechanical properties obtained from tensile tests. In this study, the effects of the cross-sectional area and the wall thickness have been investigated. It has been shown that specimens with the same cross-sectional area but with a smaller wall thickness tend to have up to 10% lower YS and up to 5% lower UTS but up to 20% higher elongation, which was also found for specimens with the same wall thickness but a higher cross-sectional area. The findings of this work remain in contrast to observations by [33], in which, at decreasing widths of specimens for the same cross-sectional area, the UTS increases and elongation decreases. The differences in observations between [33] and this work could be caused by the variation of different parameters, either wall thickness or width, resulting in opposite effects. Regarding the variation of width in relation to the variation of wall thickness in this work, the results are similar. The result of the current work can be explained either by a specimen-size-dependent material property, by size-dependent cooling rates during the PBF-LB/M process similar to the observed correlation between melt pool temperature, grain size and tensile properties reported by [21] or by local inhomogeneous mechanical properties as described in [34], with higher hardness at contour areas in comparison to the core area due to a different surface boundary to cross-sectional area ratio. Varying residual stresses in the additive manufacturing process as reported in [54] due to different geometries of the specimens may also cause differences in mechanical properties and were not investigated in this work. The isolated effects on the mechanical properties will be investigated in future studies.
Furthermore, differences in mechanical properties, especially in YS and UTS, could be identified between T specimens of M1 and M2. Moreover, differences in the effect of the used parameters, such as cross-sectional area and slope angle, on the mechanical properties could be observed between specimens of the two used machines. These differences may result from the observed differences between the machines. However, the actual cause of the differences in mechanical properties and parameter effects cannot be explained solely based on these differences in machine and process specifications with certainty and are topics for further studies.

4.2. Porosity

The density for AM specimens manufactured in this work is >99%, which matches reported densities in the current literature [53,55,56,57]. While dependencies between porosity and wall thickness are not pronounced for all the M specimens 2 at lower slope angles of up to 45°, all M specimens 1 show almost 45% higher porosities on average at a thinner wall thickness. It is assumed that the thermal conditions at thinner walls are different from those at thicker walls, leading to higher heat peaks and therefore to higher porosity, caused by, for example, vaporized material components and expanding gases. Furthermore, boundary effects with locally higher porosities near the surface have a higher relative impact on the porosities at thin walls compared to thick walls due to the surface to volume relationship. As the effect is not very pronounced on all M specimens 2, the effect of the wall thickness is assumed to be machine-dependent. However, this hypothesis remains questionable and the main reason cannot be retrieved from this study with certainty.
In contrast to the above, the effect of the slope angle on porosity is evident for specimens from both machines. All specimens show higher porosities at higher slope angles, with around 0.2% on average at a 0° slope angle and around 0.4% porosity on average at a 45° slope angle, which can be explained by the increasing surface effects, especially at downskin areas, where an increase in near-surface porosity can be observed.

4.3. Surface Roughness

With regard to the conducted surface measurements, it can be assumed that the wall thickness has no significant effect on the surface roughness. Differences in thermal conditions caused by different cross-sectional areas through different wall thicknesses therefore have no or too small an impact to be detectable in the surface roughness.
On the other hand, the slope angle has a significant effect on the surface roughness, especially in downskin areas, resulting in rougher surfaces at higher slope angles for specimens of both machines. In this study, surface roughness values of around Rz = 200 µm were measured for specimens with a 45° slope angle, which is almost four times the surface roughness of vertical specimens. This confirms the findings of [58], but lies in contrast to [59], in which the surface roughness remains almost constant between slope angles of 5° and 45°. The differences in observations are probably caused by the different used process parameters. In particular, the used layer thickness of 20 µm in [59] may have different effects on the surface roughness in comparison to the layer thickness of 40 µm used in this work. The pronounced increase in surface roughness can be explained through the manufacturing process, which is layer-by-layer using a laser beam. The layer-by-layer process causes increasing staircase effects at higher slope angles, resulting in higher surface roughness, which is also described in [59]. This effect can mainly be seen at upskin areas of specimens. Furthermore, the surface roughness of upskin areas also increases because of laser tracks.
It can be assumed that the main cause of the higher surface roughness on the downskin area is the laser beam process, in which the laser beam melts multiple layers of powder and solid material underneath together to form the part. As the laser beam process provides a constant laser energy density but the powder particles as well as the solid material may have varying and anisotropic heat conduction properties, the depth of the formed melt pool also can vary locally. Consequently, the downskin area is marked with microscopic surface peaks and the adhesion of lose or partially fused powder particles, resulting in much higher surface roughness values than for upskin areas. This effect becomes more pronounced with increasing slope angle and depends on other process parameters, as described in [60].

4.4. Recommendation for Testing Methods and Testing Geometries

With regard to the conducted investigations, porosity analysis using optical microscopy shows several advantages compared to density measurements using the Archimedes principle. Optical microscopy not only provides a better resolution for the porosity of specimens and therefore for the density, but can also provide local information about the distribution of porosities and defects in a given geometry. Furthermore, reference densities of the manufactured material from the literature, which may vary due to variations in chemical composition, are not needed to calculate the porosity as with the Archimedes principle. Optical microscopy therefore gives independent and material-specific information about the porosity of the manufactured material.
For the measurement of the surface roughness, optical microscopy is recommended too, especially when the porosity analysis is conducted using optical microscopy. The qualification strategies can therefore be kept lean. Furthermore, while conventional methods such as tactile measurement are limited due to equipment or specimen geometry, optical microscopy is only limited to the resolution of the microscope and therefore can provide high resolutions of surface topology.
To obtain related information about the material state and mechanical properties in one building job, a combined test geometry for metallographic and tensile test specimens is recommended. An optimized combined test geometry enables the investigation of both types of information while keeping the required testing and preparation capacities low. A specific geometry suggestion for this optimized test geometry will be introduced in future publications.

5. Conclusions

5.1. Findings of This Study

Based on the conducted investigations in this publication on specimens produced from stainless steel 316L manufactured using PBF-LB/M, the following statements can be made:
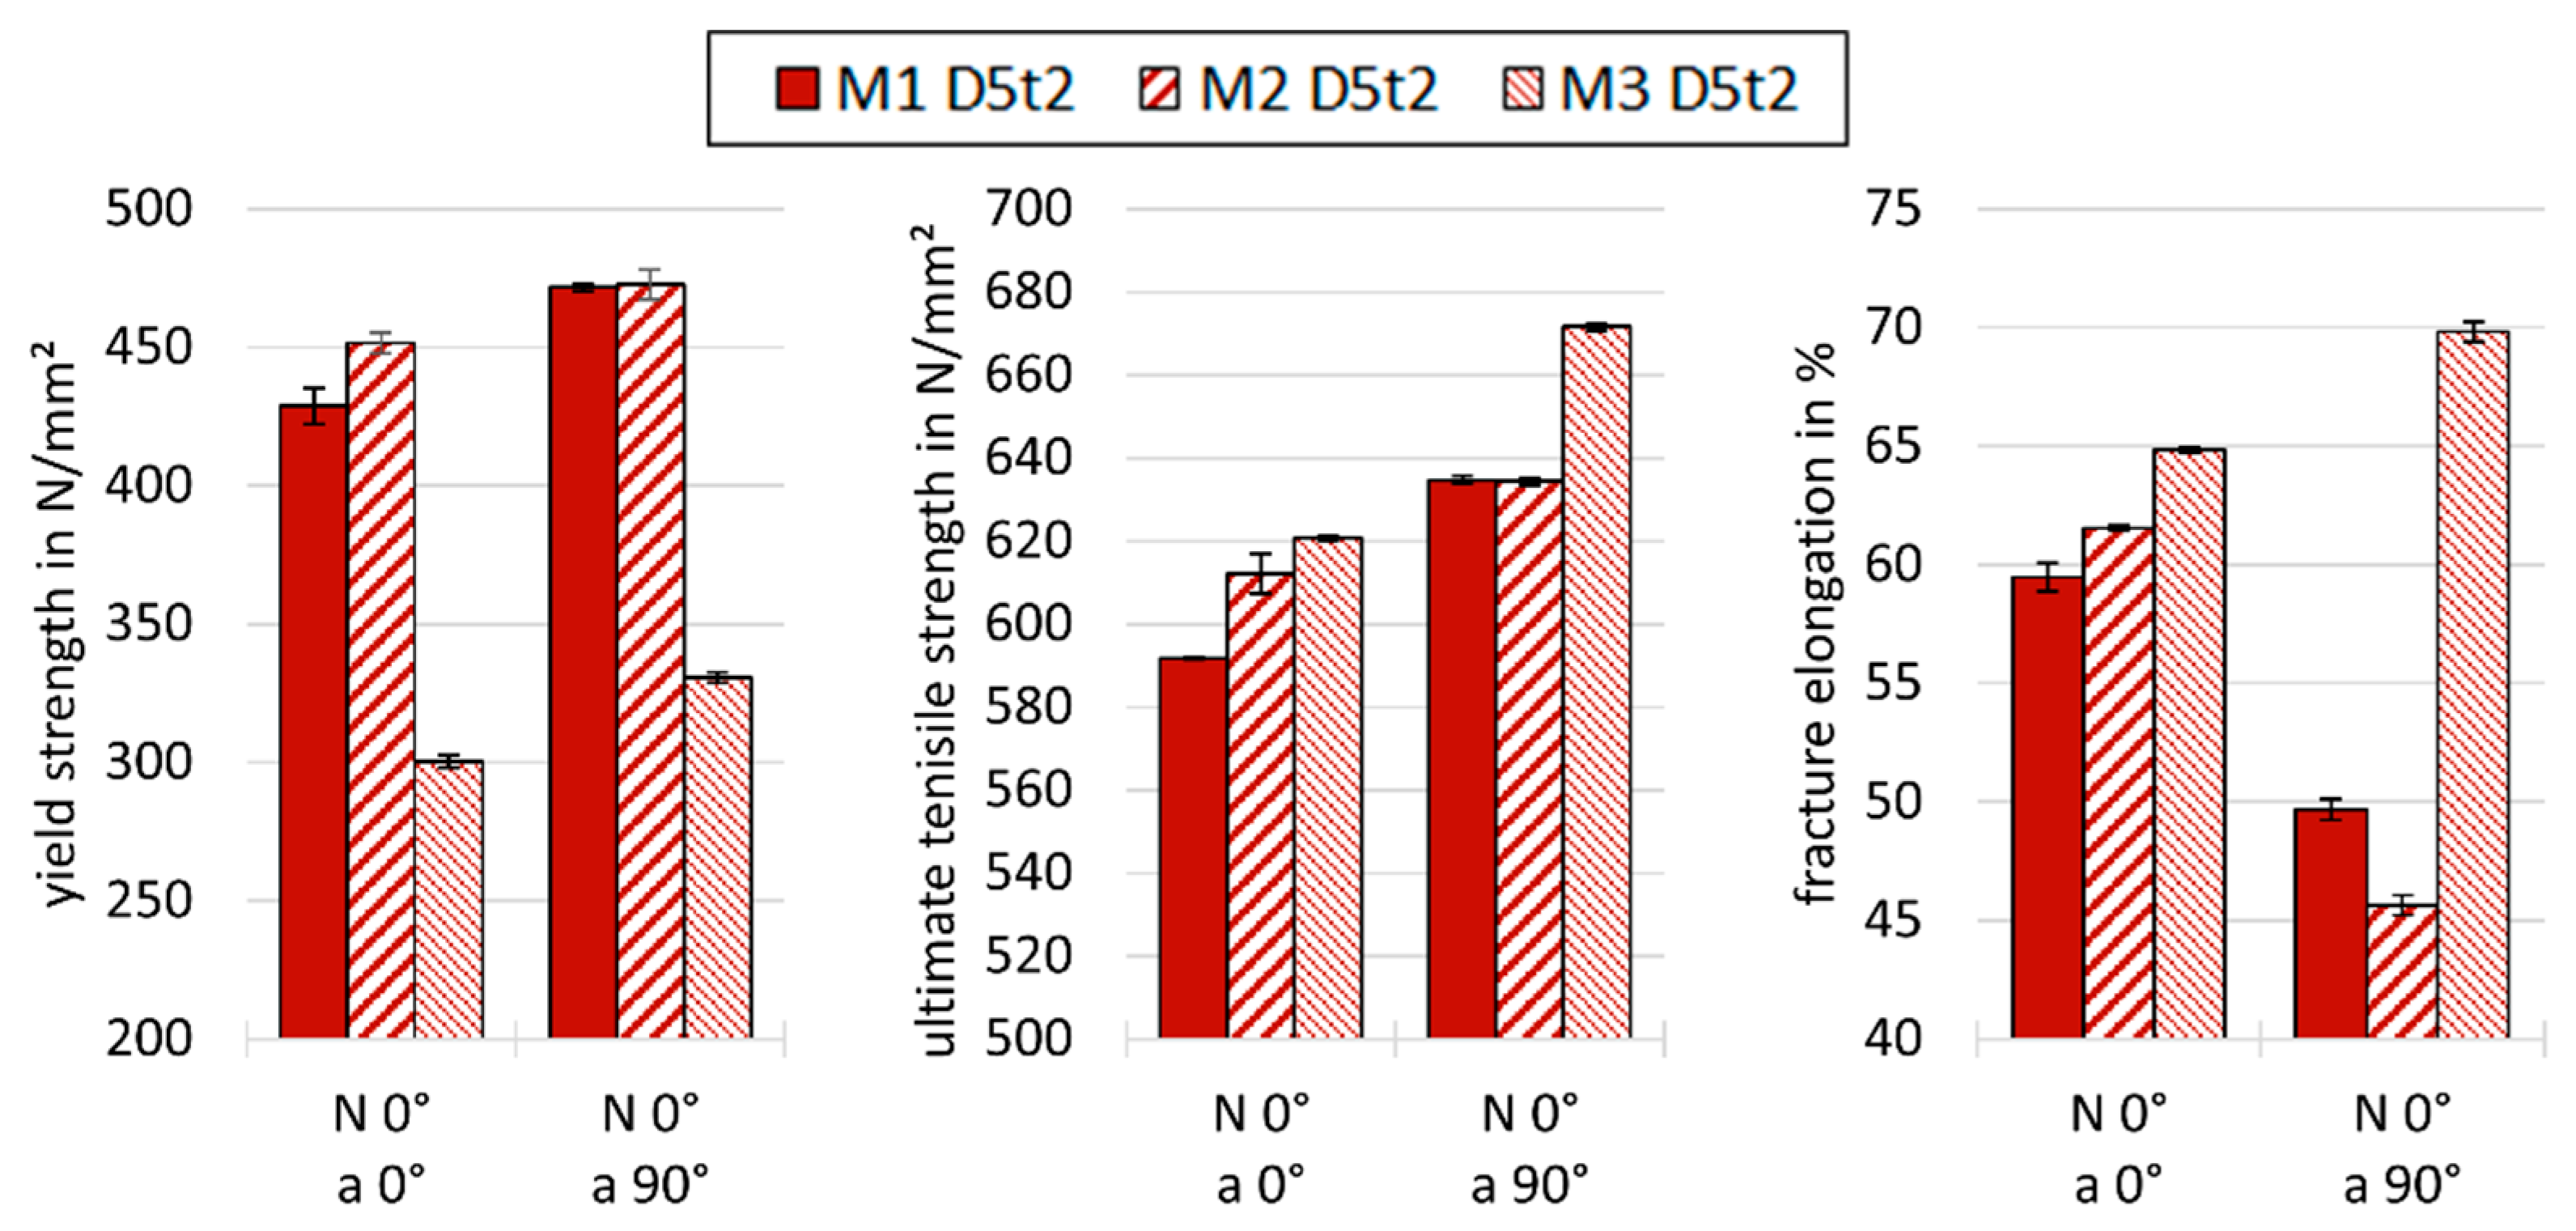
  • differences in mechanical properties between tensile test specimens of machines identical in construction could be observed, which cannot be explained solely by the small differences identified in the laser caustic of used machines with certainty;
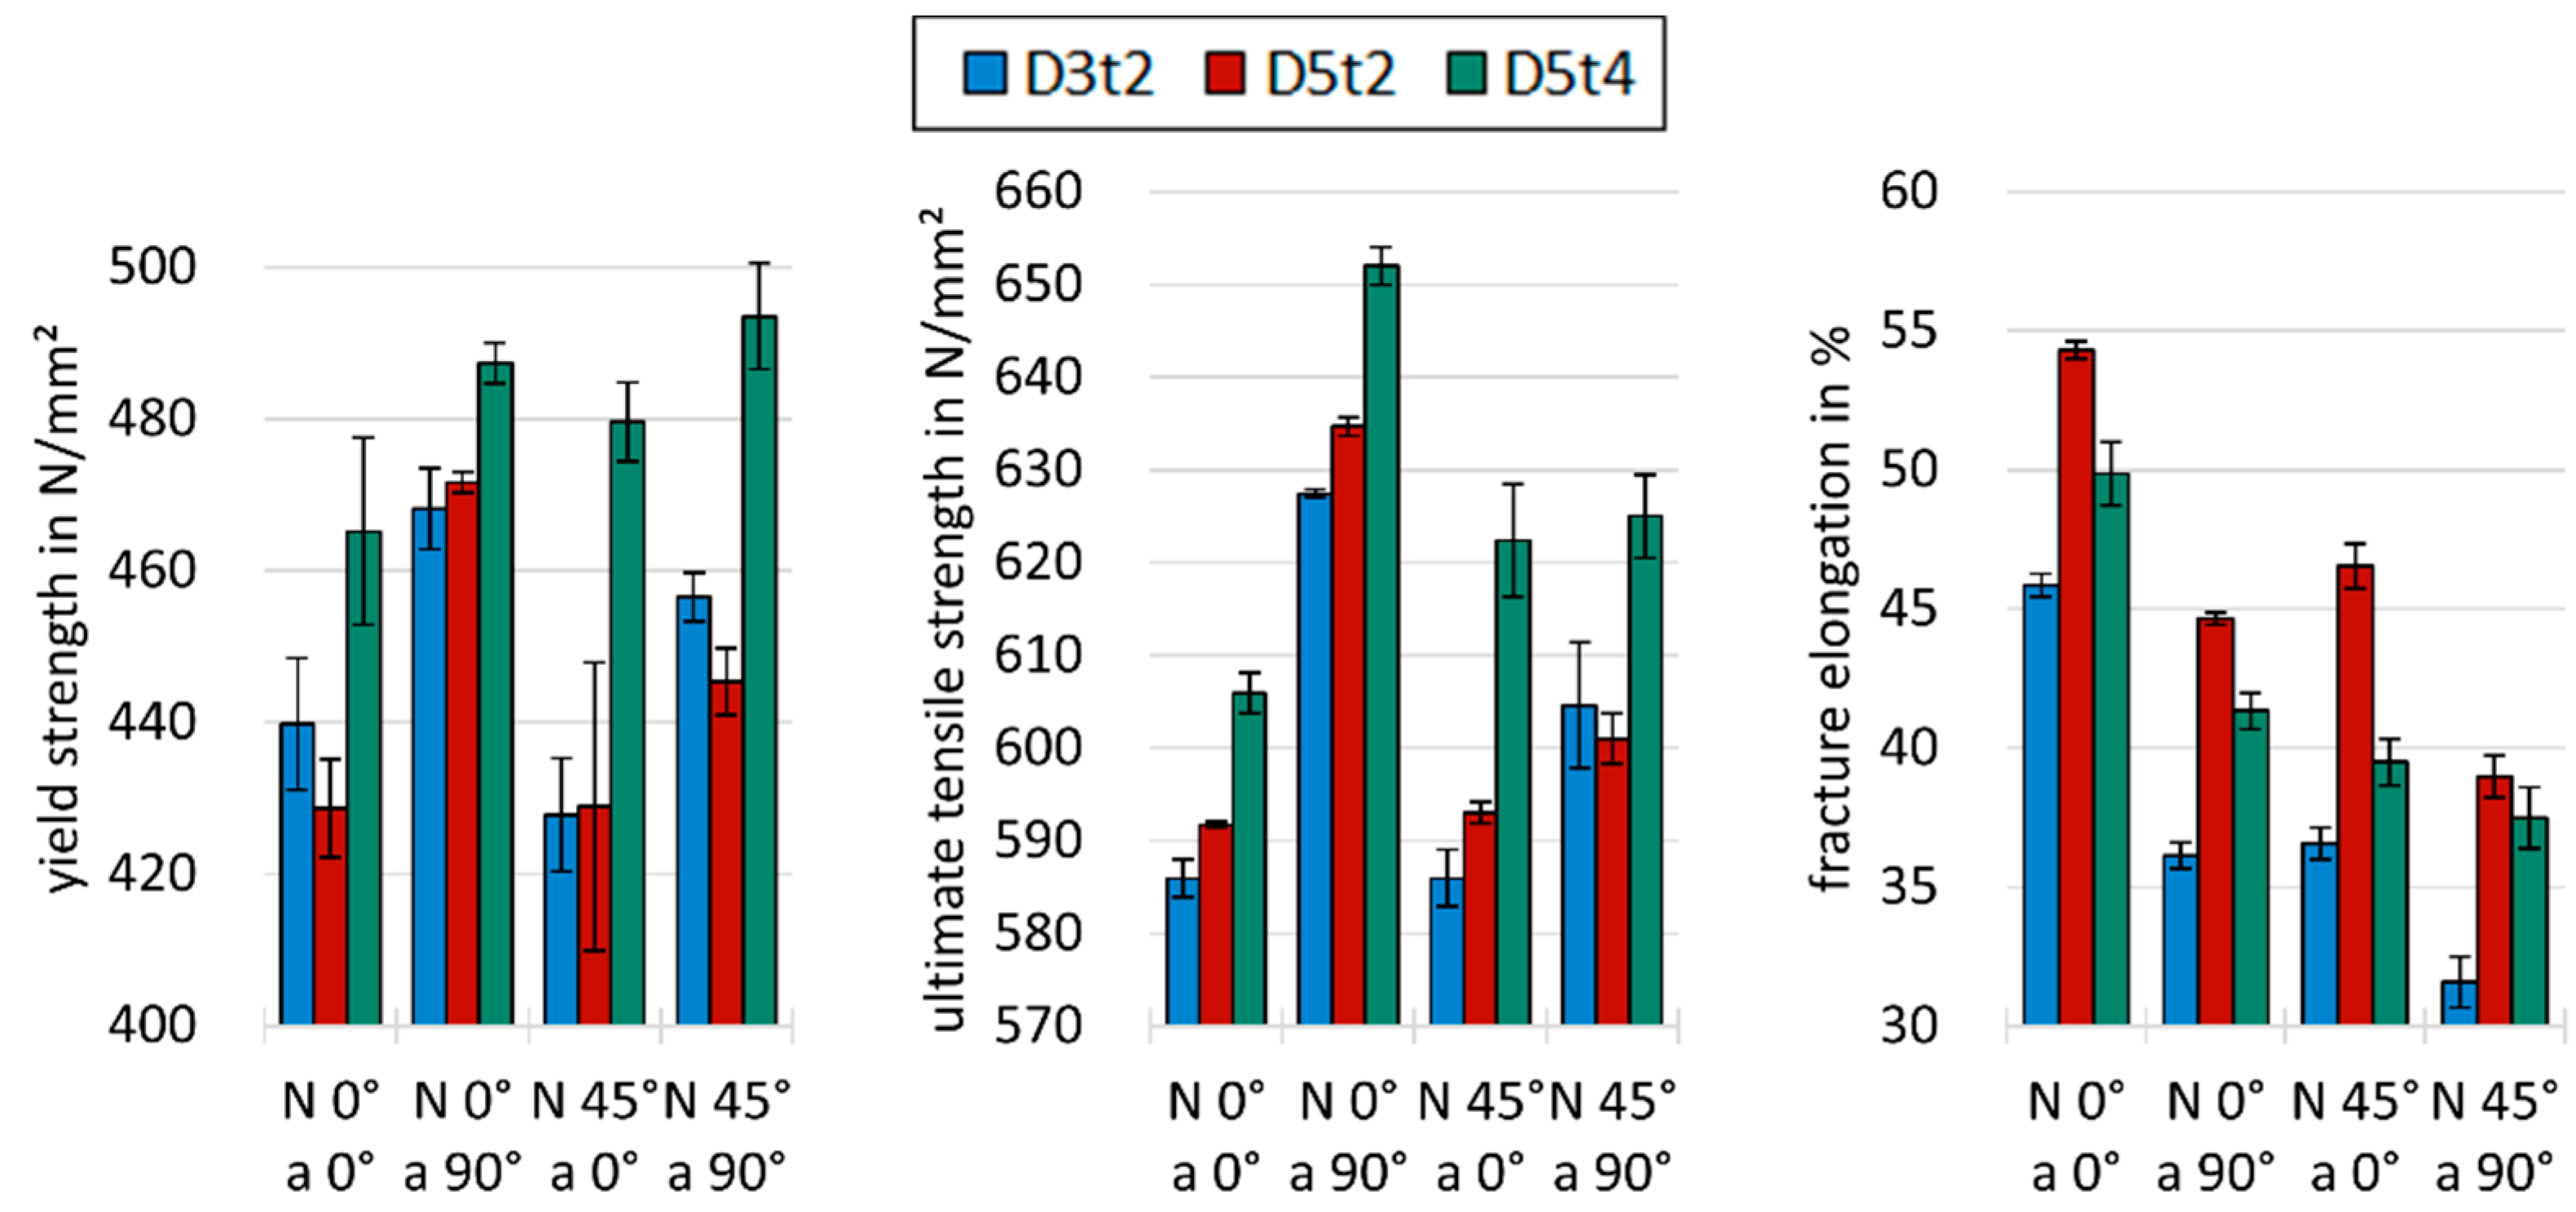
  • mechanical properties of PBF-LB/M-manufactured 316L show higher YS, comparable UTS and lower elongation values in comparison to specimens from sheet metal;
  • mechanical properties, especially elongation, are anisotropic, resulting in lower values in the vertical direction;
  • increasing slope angle has a negative effect on mechanical properties;
  • specimens with the same cross-sectional area but with a smaller wall thickness and specimens with the same wall thickness but a higher cross-sectional area tend to have lower YS and UTS but higher elongation;
  • the effect of wall thickness on the porosity yields different results depending on the manufacturing system and needs to be further investigated;
  • specimens show higher porosities at higher slope angles;
  • wall thickness has no significant effect on the surface roughness;
  • for downskin areas, the roughness increases with rising slope angle—specimens show four-times higher surface roughness at slope angles of 45° compared to vertically oriented specimens;
  • the effect of slope angle on surface roughness is much more pronounced on downskin areas than on upskin areas.

5.2. Impact of the Findings in This Publication

Investigations of specimens produced from 316L in this publication show that, with regard to the quasi-static mechanical properties, PBF-LB/M can be used as an alternative to conventional manufacturing methods. The observed anisotropy of these mechanical properties requires the testing of PBF-LB/M-manufactured materials in different directions or in the worst-case direction, which is the vertical building direction considering the results of this investigation. Dependencies of mechanical properties on specimen geometry size also require the consideration of specimen geometries for the comparison of mechanical properties—for example, in qualification processes.
Pressure equipment typically has an enclosed volume using wall structures, which makes slope angles necessary. For efficient construction as well as qualification processes, anisotropic mechanical properties, especially elongation at fracture, need to be known due to component safety and regulations.
Investigations on the fatigue behavior of materials show that porosity and surface roughness have a major impact on the fatigue properties of components [61]. To be able to predict porosity and surface roughness dependent on wall thickness and slope angle therefore makes precise predictions of fatigue strength based on component geometry possible. This enables the optimization of component size, weight and ultimately manufacturing cost.

5.3. Qualification Method

The characteristics of material state and mechanical properties investigated in this publication shall be the input and output of an extendable wall geometry and orientation-dependent material (WOrM) model to predict the mechanical properties for a given material state in wall geometry. This WOrM model is considered to enable the systematic collection and arrangement of data for different features of material state and mechanical properties, simplifying the identification of direct and cross-over dependencies and therefore enabling the qualification of complex systems, which is the case in additive-manufactured materials using PBF-LB/M. Using a qualification method based on this WOrM model, the reliability and quality of PBF-LB/M manufacturing systems can be evaluated by the local material state of additive-manufactured metals, which is system- and geometry-dependent. This enables the quantification of design parameters and process boundaries such as maximum slope angle and minimum or orientation-dependent width, allowing the optimization of process expenditures such as process time and process costs, especially for complex parts such as pressure equipment. Based on the WOrM model, a schematic illustration of a new qualification concept is shown in Figure 20. The development and implementation of this concept into an applicable qualification method will be the subject of future publications.
As the qualification method is based on the dependencies of material state, geometry and mechanical properties alone and therefore only includes the end results of the PBF-LB/M manufacturing system with its system- and part-dependent variables, it is perfectly suitable for individual machine qualification, which is necessary for PBF-LB/M manufacturing systems according to section 4.6 of DIN SPEC 17071:2019-12, since there are too many parameters influencing the system. This publication and the introduction of the qualification method therefore are important scientific foundations for normative work.

5.4. Further Investigation of Additional Effects for the Qualification Method

To further extend the introduced qualification method, various features of material state, such as residual stresses, geometrical precision or microstructure, and mechanical properties, such as fatigue strength, impact toughness or hardness, will be the subject of future publications. Furthermore, the transferability of the findings in this publication to different PBF-LB/M manufacturing systems is to be investigated.

Author Contributions

Conceptualization, H.M.V., S.M. and B.R.; methodology, H.M.V., S.M. and B.R.; investigation H.M.V., S.M. and B.R.; resources, H.M.V., S.M. and B.R.; writing—original draft preparation, H.M.V., S.M. and B.R.; writing—review and editing, H.C.H., M.O., M.W., M.S. and G.S.; supervision, H.C.H.; project administration, H.C.H. All authors have read and agreed to the published version of the manuscript.

Funding

The research project “QuAFD” with IGF project no. 20325 N of the Forschungsvereinigung Forschungs-Gesellschaft Verfahrens-Technik e.V. (GVT), which forms the basis of this work, is funded by the Federal Ministry for Economic Affairs and Energy via the AiF within the framework of the program for the promotion of joint industrial research (IGF) based on a resolution of the German Bundestag. We acknowledge the support of the Deutsche Forschungsgemeinschaft (DFG—German Research Foundation) and the Open Access Publishing Fund of the Technical University of Darmstadt for funding the article processing charge.

Institutional Review Board Statement

Not applicable.

Informed Consent Statement

Not applicable.

Data Availability Statement

The data presented in this study are available from the corresponding author on request.

Conflicts of Interest

The authors declare no conflict of interest. The funders had no role in the design of the study; in the collection, analyses, or interpretation of data; in the writing of the manuscript, or in the decision to publish the results.

References

  1. Deutsches Institut für Normung e.V. DIN EN ISO/ASTM 52900:2018-06; Additive Fertigung-Grundlagen-Terminologie (ISO/ASTM DIS_52900:2018). Deutsche und Englische Fassung prEN_ISO/ASTM 52900:2018; Beuth Verlag GmbH: Berlin, Germany, 2018.
  2. Deutsches Institut für Normung e.V. DIN 8580:2020-01; Fertigungsverfahren-Begriffe, Einteilung. Beuth Verlag GmbH: Berlin, Germany, 2020.
  3. Deutsches Institut für Normung e.V. DIN EN 13445:2018-12; Unbefeuerte Druckbehälter. Beuth Verlag GmbH: Berlin, Germany, 2018.
  4. European Parliament. Richtlinie 2014/68/EU des Europäischen Parlaments und des Rates vom 15. Mai 2014 zur Harmonisierung der Rechtsvorschriften der Mitgliedstaaten über die Bereitstellung von Druckgeräten auf dem Markt Text von Bedeutung für den EWR. 2014. Available online: https://eur-lex.europa.eu/legal-content/DE/TXT/HTML/?uri=CELEX:32014L0068&from=DE (accessed on 7 July 2021).
  5. Deutsches Institut für Normung e.V. DIN 28018:2006-05; Druckbehälter aus Stahl, emailliert-Behälter für Anlagen 0,063 m3 bis 10 m3. Beuth Verlag GmbH: Berlin, Germany, 2006.
  6. Deutsches Institut für Normung e.V. DIN 28136-1:2005-12; Rührbehälter-Teil 1: Hauptmaße. Beuth Verlag GmbH: Berlin, Germany, 2005.
  7. Deutsches Institut für Normung e.V. DIN 30690-1:2019-05; Bauteile in Anlagen der Gasversorgung-Teil 1: Anforderungen an Bauteile in Gasversorgungsanlagen. Beuth Verlag GmbH: Berlin, Germany, 2019.
  8. Deutsches Institut für Normung e.V. DIN EN 12266-1:2012-06; Industriearmaturen-Prüfung von Armaturen aus Metall-Teil 1: Druckprüfungen, Prüfverfahren und Annahmekriterien-Verbindliche Anforderungen. Beuth Verlag GmbH: Berlin, Germany, 2012.
  9. Deutsches Institut für Normung e.V. DIN EN 12953-1:2012-05; Großwasserraumkessel-Teil 1: Allgemeines. Beuth Verlag GmbH: Berlin, Germany, 2012.
  10. Deutsches Institut für Normung e.V. DIN EN 13480-1:2017-12; Metallische industrielle Rohrleitungen-Teil 1: Allgemeines. Beuth Verlag GmbH: Berlin, Germany, 2017.
  11. Deutsches Institut für Normung e.V. DIN EN 1515-4:2021-06; Flansche und ihre Verbindungen-Schrauben und Muttern-Teil 4: Auswahl von Schrauben und Muttern zur Anwendung im Gültigkeitsbereich der Druckgeräterichtlinie 2014/68/EU. Beuth Verlag GmbH: Berlin, Germany, 2021.
  12. Deutsches Institut für Normung e.V. DIN EN 764-1:2016-12; Druckgeräte_-Teil_1: Vokabular; Deutsche Fassung EN_764-1:2015+A1:2016. Beuth Verlag GmbH: Berlin, Germany, 2016.
  13. Dev Singh, D.; Mahender, T.; Raji Reddy, A. Powder bed fusion process: A brief review. Mater. Today Proc. 2020, 46, 350–355. [Google Scholar] [CrossRef]
  14. Meiners, W.; Wissenbach, K.; Poprawe, R. Direct generation of metal parts and tools by selective laser powder remelting (SLPR). In International Congress on Applications of Lasers & Electro-Optics. ICALEO® ’98: Proceedings of the Laser Materials Processing Conference, Orlando, FL, USA, 16–19 November 1998; Laser Institute of America: Orlando, FL, USA, 1998; pp. E31–E37. ISBN 0-912035-58-7. [Google Scholar]
  15. Rehme, O. Cellular Design for Laser Freeform Fabrication. Schr. Lasertechnik 2010, 4, 304. [Google Scholar]
  16. Lutter-Günther, M.; Horn, M.; Seidel, C.; Reinhart, G. Einfluss der Korngrößenverteilung auf Fließfähigkeit und Bauteilqualität beim Laserstrahlschmelzen. In Proceedings of the 14th Rapid.Tech Conference Erfurt, Munich, Germany, 6 June 2017; pp. 297–311. [Google Scholar] [CrossRef]
  17. Vock, S.; Klöden, B.; Kirchner, A.; Weißgärber, T.; Kieback, B. Powders for powder bed fusion: A review. Prog. Addit. Manuf. 2019, 4, 383–397. [Google Scholar] [CrossRef] [Green Version]
  18. Röttger, A.; Geenen, K.; Windmann, M.; Binner, F.; Theisen, W. Comparison of microstructure and mechanical properties of 316 L austenitic steel processed by selective laser melting with hot-isostatic pressed and cast material. Mater. Sci. Eng. A 2016, 678, 365–376. [Google Scholar] [CrossRef]
  19. Sutton, A.T.; Kriewall, C.S.; Karnati, S.; Leu, M.C.; Newkirk, J.W.; Everhart, W.; Brown, B. Evolution of AISI 304L stainless steel part properties due to powder recycling in laser powder-bed fusion. Addit. Manuf. 2020, 36, 101439. [Google Scholar] [CrossRef]
  20. Yang, X.; Ren, Y.-j.; Liu, S.-f.; Wang, Q.-j.; Shi, M.-j. Microstructure and tensile property of SLM 316L stainless steel manufactured with fine and coarse powder mixtures. J. Cent. South Univ. 2020, 27, 334–343. [Google Scholar] [CrossRef]
  21. Khorasani, M.; Ghasemi, A.H.; Awan, U.S.; Singamneni, S.; Littlefair, G.; Farabi, E.; Leary, M.; Gibson, I.; Veetil, J.K.; Rolfe, B. On the role of process parameters on meltpool temperature and tensile properties of stainless steel 316L produced by powder bed fusion. J. Mater. Res. Technol. 2021, 12, 2438–2452. [Google Scholar] [CrossRef]
  22. Ahmadi, A.; Mirzaeifar, R.; Moghaddam, N.S.; Turabi, A.S.; Karaca, H.E.; Elahinia, M. Effect of manufacturing parameters on mechanical properties of 316L stainless steel parts fabricated by selective laser melting: A computational framework. Mater. Des. 2016, 112, 328–338. [Google Scholar] [CrossRef]
  23. Yakout, M.; Elbestawi, M.A.; Veldhuis, S.C. Density and mechanical properties in selective laser melting of Invar 36 and stainless steel 316L. J. Mater. Processing Technol. 2019, 266, 397–420. [Google Scholar] [CrossRef]
  24. Liverani, E.; Toschi, S.; Ceschini, L.; Fortunato, A. Effect of selective laser melting (SLM) process parameters on microstructure and mechanical properties of 316L austenitic stainless steel. J. Mater. Processing Technol. 2017, 249, 255–263. [Google Scholar] [CrossRef]
  25. Guan, K.; Wang, Z.; Gao, M.; Li, X.; Zeng, X. Effects of processing parameters on tensile properties of selective laser melted 304 stainless steel. Mater. Des. 2013, 50, 581–586. [Google Scholar] [CrossRef]
  26. Röttger, A.; Boes, J.; Theisen, W.; Thiele, M.; Esen, C.; Edelmann, A.; Hellmann, R. Microstructure and mechanical properties of 316L austenitic stainless steel processed by different SLM devices. Int. J. Adv. Manuf. Technol. 2020, 108, 769–783. [Google Scholar] [CrossRef]
  27. Qiu, C.; Kindi, M.A.; Aladawi, A.S.; Hatmi, I.A. A comprehensive study on microstructure and tensile behaviour of a selectively laser melted stainless steel. Sci. Rep. 2018, 8, 7785. [Google Scholar] [CrossRef] [PubMed]
  28. Kurzynowski, T.; Gruber, K.; Stopyra, W.; Kuźnicka, B.; Chlebus, E. Correlation between process parameters, microstructure and properties of 316 L stainless steel processed by selective laser melting. Mater. Sci. Eng. A 2018, 718, 64–73. [Google Scholar] [CrossRef]
  29. Yakout, M.; Elbestawi, M.A.; Veldhuis, S.C. On the characterization of stainless steel 316L parts produced by selective laser melting. Int. J. Adv. Manuf. Technol. 2018, 95, 1953–1974. [Google Scholar] [CrossRef]
  30. Casati, R.; Lemke, J.; Vedani, M. Microstructure and Fracture Behavior of 316L Austenitic Stainless Steel Produced by Selective Laser Melting. J. Mater. Sci. Technol. 2016, 32, 738–744. [Google Scholar] [CrossRef]
  31. Marattukalam, J.J.; Karlsson, D.; Pacheco, V.; Beran, P.; Wiklund, U.; Jansson, U.; Hjörvarsson, B.; Sahlberg, M. The effect of laser scanning strategies on texture, mechanical properties, and site-specific grain orientation in selective laser melted 316L SS. Mater. Des. 2020, 193, 108852. [Google Scholar] [CrossRef]
  32. Suryawanshi, J.; Prashanth, K.G.; Ramamurty, U. Mechanical behavior of selective laser melted 316L stainless steel. Mater. Sci. Eng. A 2017, 696, 113–121. [Google Scholar] [CrossRef]
  33. Yu, J.; Kim, D.; Ha, K.; Jeon, J.B.; Kim, D.J.; Lee, W. Size effect due to contour laser scanning in 316L stainless steel produced by laser powder bed fusion. J. Mater. Res. Technol. 2021, 15, 5554–5568. [Google Scholar] [CrossRef]
  34. Hitzler, L.; Hirsch, J.; Heine, B.; Merkel, M.; Hall, W.; Öchsner, A. On the Anisotropic Mechanical Properties of Selective Laser-Melted Stainless Steel. Materials 2017, 10, 1136. [Google Scholar] [CrossRef] [Green Version]
  35. Deutsches Institut für Normung e.V. DIN/TS 17026:2020-10; Unbefeuerte Druckbehälter-Zusätzliche Anforderungen an Additiv Gefertigte Druckgeräte und Deren Bauteile. Beuth Verlag GmbH: Berlin, Germany, 2020.
  36. Deutsches Institut für Normung e.V. DIN SPEC 17071:2019-12; Additive Fertigung-Anforderungen an Qualitätsgesicherte Prozesse für Additive Fertigungszentren. Beuth Verlag GmbH: Berlin, Germany, 2019.
  37. Deutsches Institut für Normung e.V. DIN 50125:2016-12; Prüfung metallischer Werkstoffe-Zugproben. Beuth Verlag GmbH: Berlin, Germany, 2016.
  38. Yakout, M.; Elbestawi, M.A.; Veldhuis, S.C. A study of thermal expansion coefficients and microstructure during selective laser melting of Invar 36 and stainless steel 316L. Addit. Manuf. 2018, 24, 405–418. [Google Scholar] [CrossRef]
  39. Deutsches Institut für Normung e.V. DIN EN ISO 15350:2010-08; Stahl und Eisen_- Bestimmung der Gesamtgehalte an Kohlenstoff und Schwefel-Infrarotabsorptionsverfahren nach Verbrennung in Einem Induktionsofen (Standardverfahren). Beuth Verlag GmbH: Berlin, Germany, 2010.
  40. Deutsches Institut für Normung e.V. DIN EN ISO 13565-1:1998-04; Geometrische Produktspezifikationen (GPS)-Oberflächenbeschaffenheit: Tastschnittverfahren-Oberflächen mit plateauartigen funktionsrelevanten Eigenschaften-Teil 1: Filterung und allgemeine Meßbedingungen. Beuth Verlag GmbH: Berlin, Germany, 1998.
  41. Deutsches Institut für Normung e.V. DIN EN ISO 13565-2:1998-04; Geometrische Produktspezifikationen (GPS)-Oberflächenbeschaffenheit: Tastschnittverfahren-Oberflächen Mit Plateauartigen Funktionsrelevanten Eigenschaften-Teil 2: Beschreibung der Höhe Mittels Linearer Darstellung der Materialanteilkurve. Beuth Verlag GmbH: Berlin, Germany, 1998.
  42. Deutsches Institut für Normung e.V. DIN EN ISO/ASTM 52907:2020-05; Additive Fertigung-Ausgangswerkstoffe-Verfahren zur Charakterisierung von Metallpulvern. Beuth Verlag GmbH: Berlin, Germany, 2020.
  43. Deutsches Institut für Normung e.V. DIN EN ISO 6892-1:2020-06; Metallische Werkstoffe-Zugversuch- Teil 1: Prüfverfahren bei Raumtemperatur. Beuth Verlag GmbH: Berlin, Germany, 2020.
  44. ASTM. A240/A240M-20a Specification for Chromium and Chromium-Nickel Stainless Steel Plate, Sheet, and Strip for Pressure Vessels and for General Applications; ASTM: West Conshohocken, PA, USA, 2020. [Google Scholar]
  45. ASTM. A276/A276M-17 Specification for Stainless Steel Bars and Shapes; ASTM: West Conshohocken, PA, USA, 2017. [Google Scholar]
  46. Deutsches Institut für Normung e.V. DIN EN 10088-1:2014-12; Nichtrostende Stähle-Teil 1: Verzeichnis der nichtrostenden Stähle. Beuth Verlag GmbH: Berlin, Germany, 2014.
  47. Koch, C. Normung für Neue Technologien am Beispiel Additiver Fertigung: Normen und Standards für Die Digitale Transformation; Mangelsdorf, A., Weiler, P., Eds.; De Gruyter Oldenbourg: Berlin, Germany, 2019; pp. 18–36. [Google Scholar]
  48. Herzog, D.; Seyda, V.; Wycisk, E.; Emmelmann, C. Additive manufacturing of metals. Acta Mater. 2016, 117, 371–392. [Google Scholar] [CrossRef]
  49. Zhong, Y.; Liu, L.; Wikman, S.; Cui, D.; Shen, Z. Intragranular cellular segregation network structure strengthening 316L stainless steel prepared by selective laser melting. J. Nucl. Mater. 2016, 470, 170–178. [Google Scholar] [CrossRef]
  50. Zhou, B.; Xu, P.; Li, W.; Liang, Y.; Liang, Y. Microstructure and Anisotropy of the Mechanical Properties of 316L Stainless Steel Fabricated by Selective Laser Melting. Metals 2021, 11, 775. [Google Scholar] [CrossRef]
  51. Carlton, H.D.; Haboub, A.; Gallegos, G.F.; Parkinson, D.Y.; MacDowell, A.A. Damage evolution and failure mechanisms in additively manufactured stainless steel. Mater. Sci. Eng. A 2016, 651, 406–414. [Google Scholar] [CrossRef] [Green Version]
  52. Wang, D.; Song, C.; Yang, Y.; Bai, Y. Investigation of crystal growth mechanism during selective laser melting and mechanical property characterization of 316L stainless steel parts. Mater. Des. 2016, 100, 291–299. [Google Scholar] [CrossRef]
  53. Yusuf, S.; Chen, Y.; Boardman, R.; Yang, S.; Gao, N. Investigation on Porosity and Microhardness of 316L Stainless Steel Fabricated by Selective Laser Melting. Metals 2017, 7, 64. [Google Scholar] [CrossRef] [Green Version]
  54. Yadroitsev, I.; Yadroitsava, I. Evaluation of residual stress in stainless steel 316L and Ti6Al4V samples produced by selective laser melting. Virtual Phys. Prototyp. 2015, 10, 67–76. [Google Scholar] [CrossRef]
  55. Zhang, B.; Dembinski, L.; Coddet, C. The study of the laser parameters and environment variables effect on mechanical properties of high compact parts elaborated by selective laser melting 316L powder. Mater. Sci. Eng. A 2013, 584, 21–31. [Google Scholar] [CrossRef]
  56. Tolosa, I.; Garciandía, F.; Zubiri, F.; Zapirain, F.; Esnaola, A. Study of mechanical properties of AISI 316 stainless steel processed by “selective laser melting”, following different manufacturing strategies. Int. J. Adv. Manuf. Technol. 2010, 51, 639–647. [Google Scholar] [CrossRef]
  57. Spierings, A.B.; Herres, N.; Levy, G. Influence of the particle size distribution on surface quality and mechanical properties in AM steel parts. Rapid Prototyp. J. 2011, 17, 195–202. [Google Scholar] [CrossRef] [Green Version]
  58. Zhang, J.; Chaudhari, A.; Wang, H. Surface quality and material removal in magnetic abrasive finishing of selective laser melted 316L stainless steel. J. Manuf. Processes 2019, 45, 710–719. [Google Scholar] [CrossRef]
  59. Strano, G.; Hao, L.; Everson, R.M.; Evans, K.E. Surface roughness analysis, modelling and prediction in selective laser melting. J. Mater. Processing Technol. 2013, 213, 589–597. [Google Scholar] [CrossRef]
  60. Deng, Y.; Mao, Z.; Yang, N.; Niu, X.; Lu, X. Collaborative Optimization of Density and Surface Roughness of 316L Stainless Steel in Selective Laser Melting. Materials 2020, 13, 1601. [Google Scholar] [CrossRef] [PubMed] [Green Version]
  61. Jaskari, M.; Mäkikangas, J.; Järvenpää, A.; Mäntyjärvi, K.; Karjalainen, P. Effect of High Porosity on Bending Fatigue Properties of 3D Printed AISI 316L Steel. Procedia Manuf. 2019, 36, 33–41. [Google Scholar] [CrossRef]
Figure 1. (a) Manufacturing arrangements of the specimens on the building platform with powder deposition from the x direction (red arrow) and argon process gas flow from the y direction (blue arrow); (b) schematic overview of the specimen parameters slope angle (N), orientation (a), wall thickness (t) and cross-sectional area represented by the equivalent diameter (D) used in this study.
Metals 12 00285 g001
Figure 2. Particle size distribution by laser diffractometry.
Metals 12 00285 g002
Figure 3. Scanning electron microscope image of powder particles showing different particle sizes, agglomerates and pores.
Metals 12 00285 g003
Figure 4. Exemplary optical microscopy images from the microstructure of the PBF-LB/M-manufactured M specimens 1 in (a) and (d) and M specimens 2 in (b) and (e) perpendicular (top) and parallel (bottom) to the building direction showing columnar grains and melt pool boundaries of the laser tracks with crystal growth in direction of the highest temperature gradient orthogonal to the melt pool boundaries. Exemplary optical microscopy images from the microstructure of reference M specimens 3 produced from sheet metal in (c) and (f) in different orientations reveal a typical austenitic microstructure with some delta-ferrite lines in the longitudinal direction.
Metals 12 00285 g004
Figure 5. Exemplary EBSD images from the microstructure of PBF-LB/M-manufactured M specimens (a) from vertical direction with small round grains and (b) from horizontal direction with elongated grains along the building direction. (c) Colour legend for IPF colouring used in (a,b).
Metals 12 00285 g005
Figure 6. Exemplary XRD diffractogram of additive-manufactured specimens. No significant indications for other phases besides austenite were measured.
Metals 12 00285 g006
Figure 7. Mechanical properties of the tensile test (T) specimens manufactured using machine 1 with variations in slope angle (N), orientation (a), equivalent diameter (D) and wall thickness (t).
Metals 12 00285 g007
Figure 8. Comparison of the mechanical properties of the T specimens D5t2, which were manufactured either by PBF-LB/M (M1, M2) or from sheet metal (M3).
Metals 12 00285 g008
Figure 9. Comparison of the mechanical properties of T specimens 1 and 2.
Metals 12 00285 g009
Figure 10. Effect of the slope angle on yield strength (YS), ultimate tensile strength (UTS) and elongation at fracture (elongation) of T specimens 1 and 2.
Metals 12 00285 g010
Figure 11. Influence of the load direction (orientation) on yield strength (YS), ultimate tensile strength (UTS) and elongation at fracture (elongation) of T specimens 1 and 2.
Metals 12 00285 g011
Figure 12. Influence of the cross-sectional area on yield strength (YS), ultimate tensile strength (UTS) and elongation at fracture (elongation) of T specimens 1 and 2.
Metals 12 00285 g012
Figure 13. Influence of the wall thickness on yield strength (YS), ultimate tensile strength (UTS) and elongation at fracture (elongation) of T specimens 1.
Metals 12 00285 g013
Figure 14. Exemplary SEM images of the ductile fracture surfaces of additive-manufactured T specimens showing very fine ductile dimples in combination with larger holes caused by porosity.
Metals 12 00285 g014
Figure 15. Exemplary optical microscopy images of the porosity in unetched M specimens 1 at (a) 0° and (b) 45° slope angle showing high surface roughness and accumulation of near-surface porosity in downskin areas.
Metals 12 00285 g015
Figure 16. Porosity of M specimens 1 and 2 in relation to the slope angle and the wall thickness.
Metals 12 00285 g016
Figure 17. Surface roughness of the downskin area of M specimens 1 and 2 in relation to the slope angle and the wall thickness.
Metals 12 00285 g017
Figure 18. Surface roughness of the upskin area of M specimens 1 and 2 in relation to the slope angle and the wall thickness.
Metals 12 00285 g018
Figure 19. Exemplary SEM images of the surface of additive-manufactured T specimens built at (a) 0° slope angle and (b) 45° slope angle in downskin area showing higher accumulation of unmolten or partially molten powder feedstock particles at higher slope angles.
Metals 12 00285 g019
Figure 20. Schematic concept of the qualification method for additive-manufactured materials based on the wall geometry and orientation-dependent material model (WOrM model).
Metals 12 00285 g020
Table 1. Overview of the manufactured and investigated tensile test (T) specimens discussed in this study. Orientation vertically (vert.) and horizontally (hor.) to the building platform.
Number of
T Specimens 1
(Machine M1)
Slope Angle (N)
45°
Thickness (t)Thickness (t)
2 mm4 mm2 mm4 mm
orientation (a)vert.equivalent
diameter (D)
3 mm3-3-
5 mm3333
hor.equivalent
diameter (D)
3 mm3-3-
5 mm3333
total126126
36
Number of
T Specimens 2
(Machine M2)
Slope Angle (N)
45°
Thickness (t)Thickness (t)
2 mm4 mm2 mm4 mm
orientation (a)vert.equivalent
diameter (D)
3 mm3-3-
5 mm3-3-
hor.equivalent
diameter (D)
3 mm3-3-
5 mm3-3-
total12-12-
24
Number of
T Specimens 3
(Annealed Sheet Metal)
Slope Angle (N)
45°
Thickness (t)Thickness (t)
2 mm4 mm2 mm4 mm
orientation (a)vert.equivalent
diameter (D)
3 mm----
5 mm33--
hor.equivalent
diameter (D)
3 mm----
5 mm33--
total6600
12
Table 2. Overview of the manufactured and investigated metallographic (M) specimens discussed in this study.
Number of
M Specimens 1
(Machine M1)
Slope Angle (N)Number of
M Specimens 2
(Machine M2)
Slope Angle (N)
0.0°22.5°30.0°37.5°45.0°0.0°22.5°30.0°37.5°45.0°
wall thickness (t)1.5 mm33--3wall thickness (t)1.5 mm22222
2.0 mm33--32.0 mm22222
2.5 mm-----2.5 mm22222
3.0 mm33--33.0 mm22222
5.0 mm33--35.0 mm22222
total1212--12total1010101010
3650
Table 3. Machine and process specifications for both machines M1 and M2.
MachineMachine 1 (M1)Machine 2 (M2)
machine typeEOS M290-YLR-400-WC
softwareEOS Version 10 M291/Ed.10.18 RFS1.2
Rayleigh length @ 200 W4.588 mm4.098 mm
focus diameter @ 200 W82.8 µm75.3 µm
diffraction coefficient @ 200 W1.091.01
linear laser power 370 W370.7 W365.5 W
parameter set316L 40 µm Flex M291 1.00
laser pathidentical
skywritingOn
inert gas nozzleEOS Gridnozzle (additiv)
inert gasArgon 5.0
software preparationEOSPRINT Version 2.6
building platformC45 d 50 mm
recoater bladeEOS HSS Recoater Blade 2200-4073
Table 4. Main infill process parameters.
Hatch DistanceLaser PowerScanning
Velocity
Exposure
Pattern
Layer
Thickness
100 µm214 W928 mm/sstripes, 12 mm40 µm
Table 5. Energy density (J/mm3) for different part areas of used parameter set.
TypeInfillUpskinContourDownskinEdges
Energy density (J/mm3)57.772.937.6121.72.78
Table 6. Particle size distribution by laser light scattering of 316L.
D10 (µm)σ (µm)D50 (µm)σ (µm)D90 (µm)σ (µm)
13.1±0.04722.7±0.13342.4±0.874
Table 7. Chemical composition of the 316L powder feedstock determined using optical emission spectrometry with inductively coupled plasma (ICP-OES) and of the T specimens determined using spark optical emission spectrometry (spark-OES) in combination with combustion analysis and infrared spectrometric detection for the carbon values according to DIN EN ISO 15350:2010-08.
ElementCSiMnPSCrMoNiNCu
results in wt.-%powder feedstock0.0130.261.600.020.01816.302.0010.00- *0.49
T specimens 10.0140.491.490.040.02416.542.0810.340.030.47
T specimens 20.0150.481.490.040.02516.552.0810.360.030.47
T specimens 30.0200.491.360.03<0.0116.742.0710.340.030.38
1.4404 *0.030 *1.00 *2.00 *0.045 *0.015 *16.5–18.52.00–2.5010.0–13.00.10 *- *
316L *0.030 *0.75 *2.00 *0.045 *0.030 *16.0–18.02.00–3.0010.0–14.00.10 *- *
* Reference values for the chemical composition of 1.4404 according to DIN EN 10088-1:2014-12 and 316L according to ASTM A240/A240M-20a. Reference values for C, Si, Mn, P, S and N are maximum values. Values with ‘-‘ are not defined.
Publisher’s Note: MDPI stays neutral with regard to jurisdictional claims in published maps and institutional affiliations.

