
Corrosion Behaviour of Cemented Carbides with Co- and Ni-Alloy Binders in the Presence of Abrasion

Abstract
:1. Introduction
2. Experimental
2.1. Sample Preparation
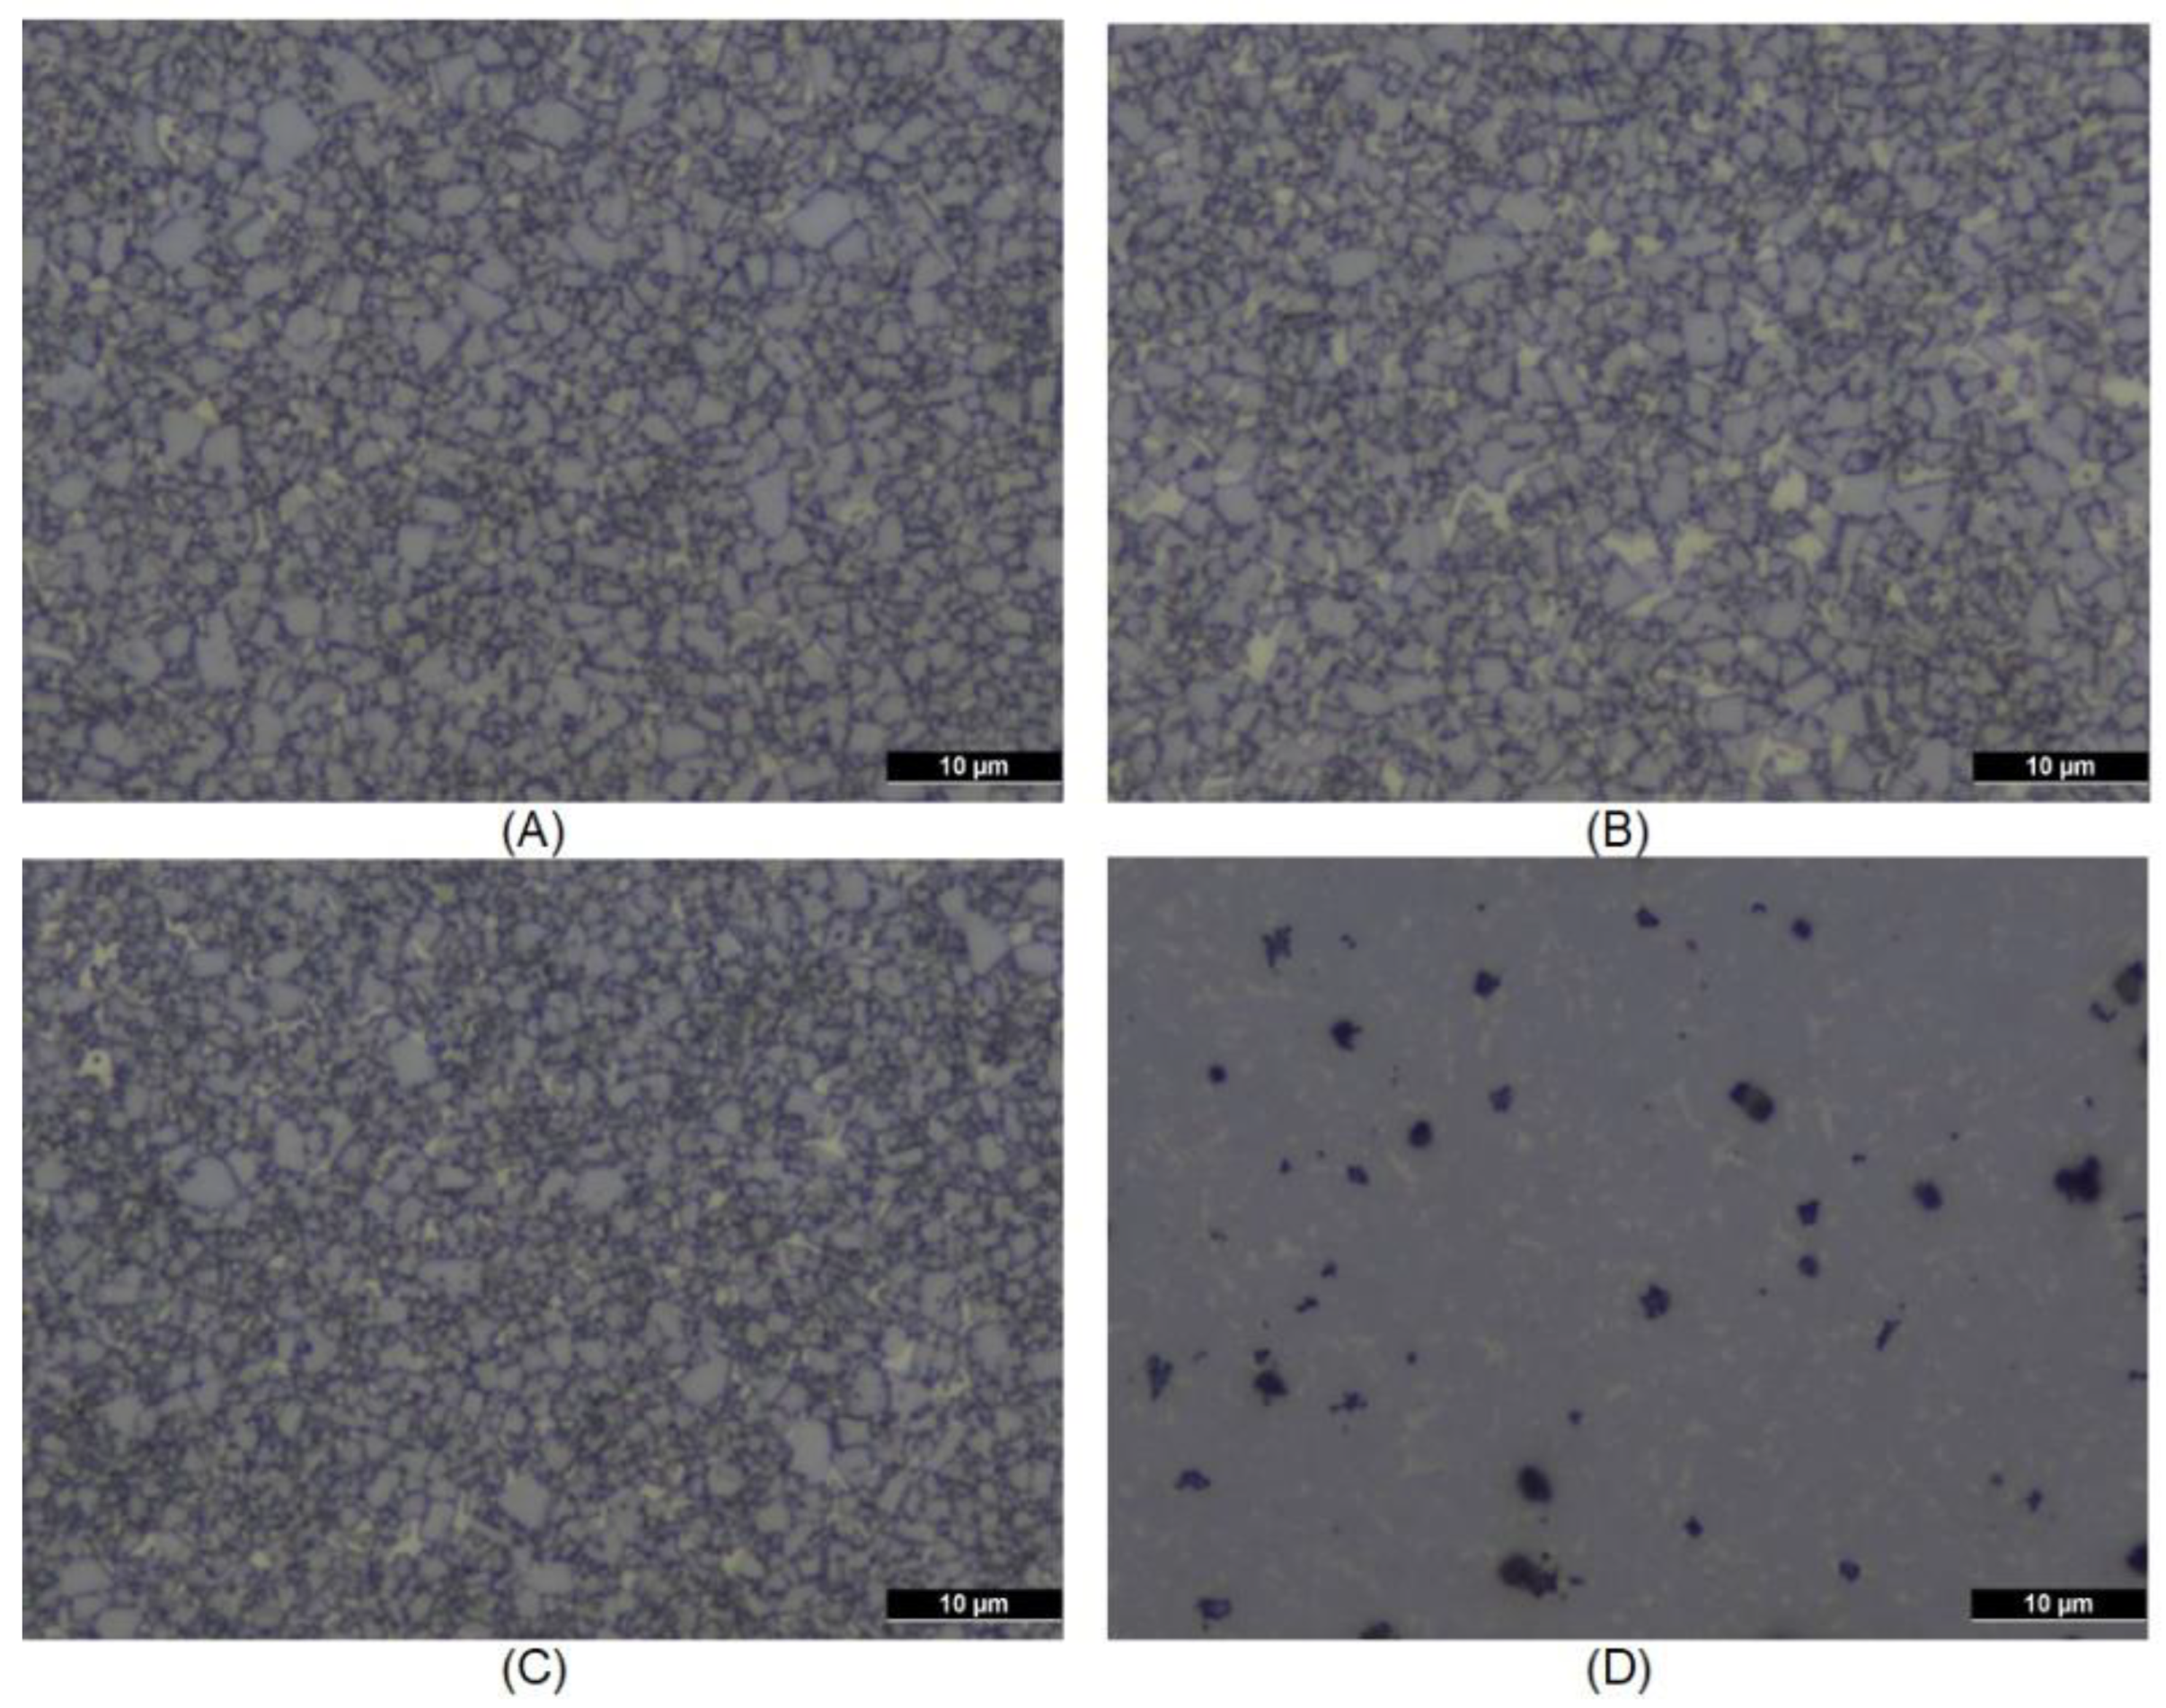
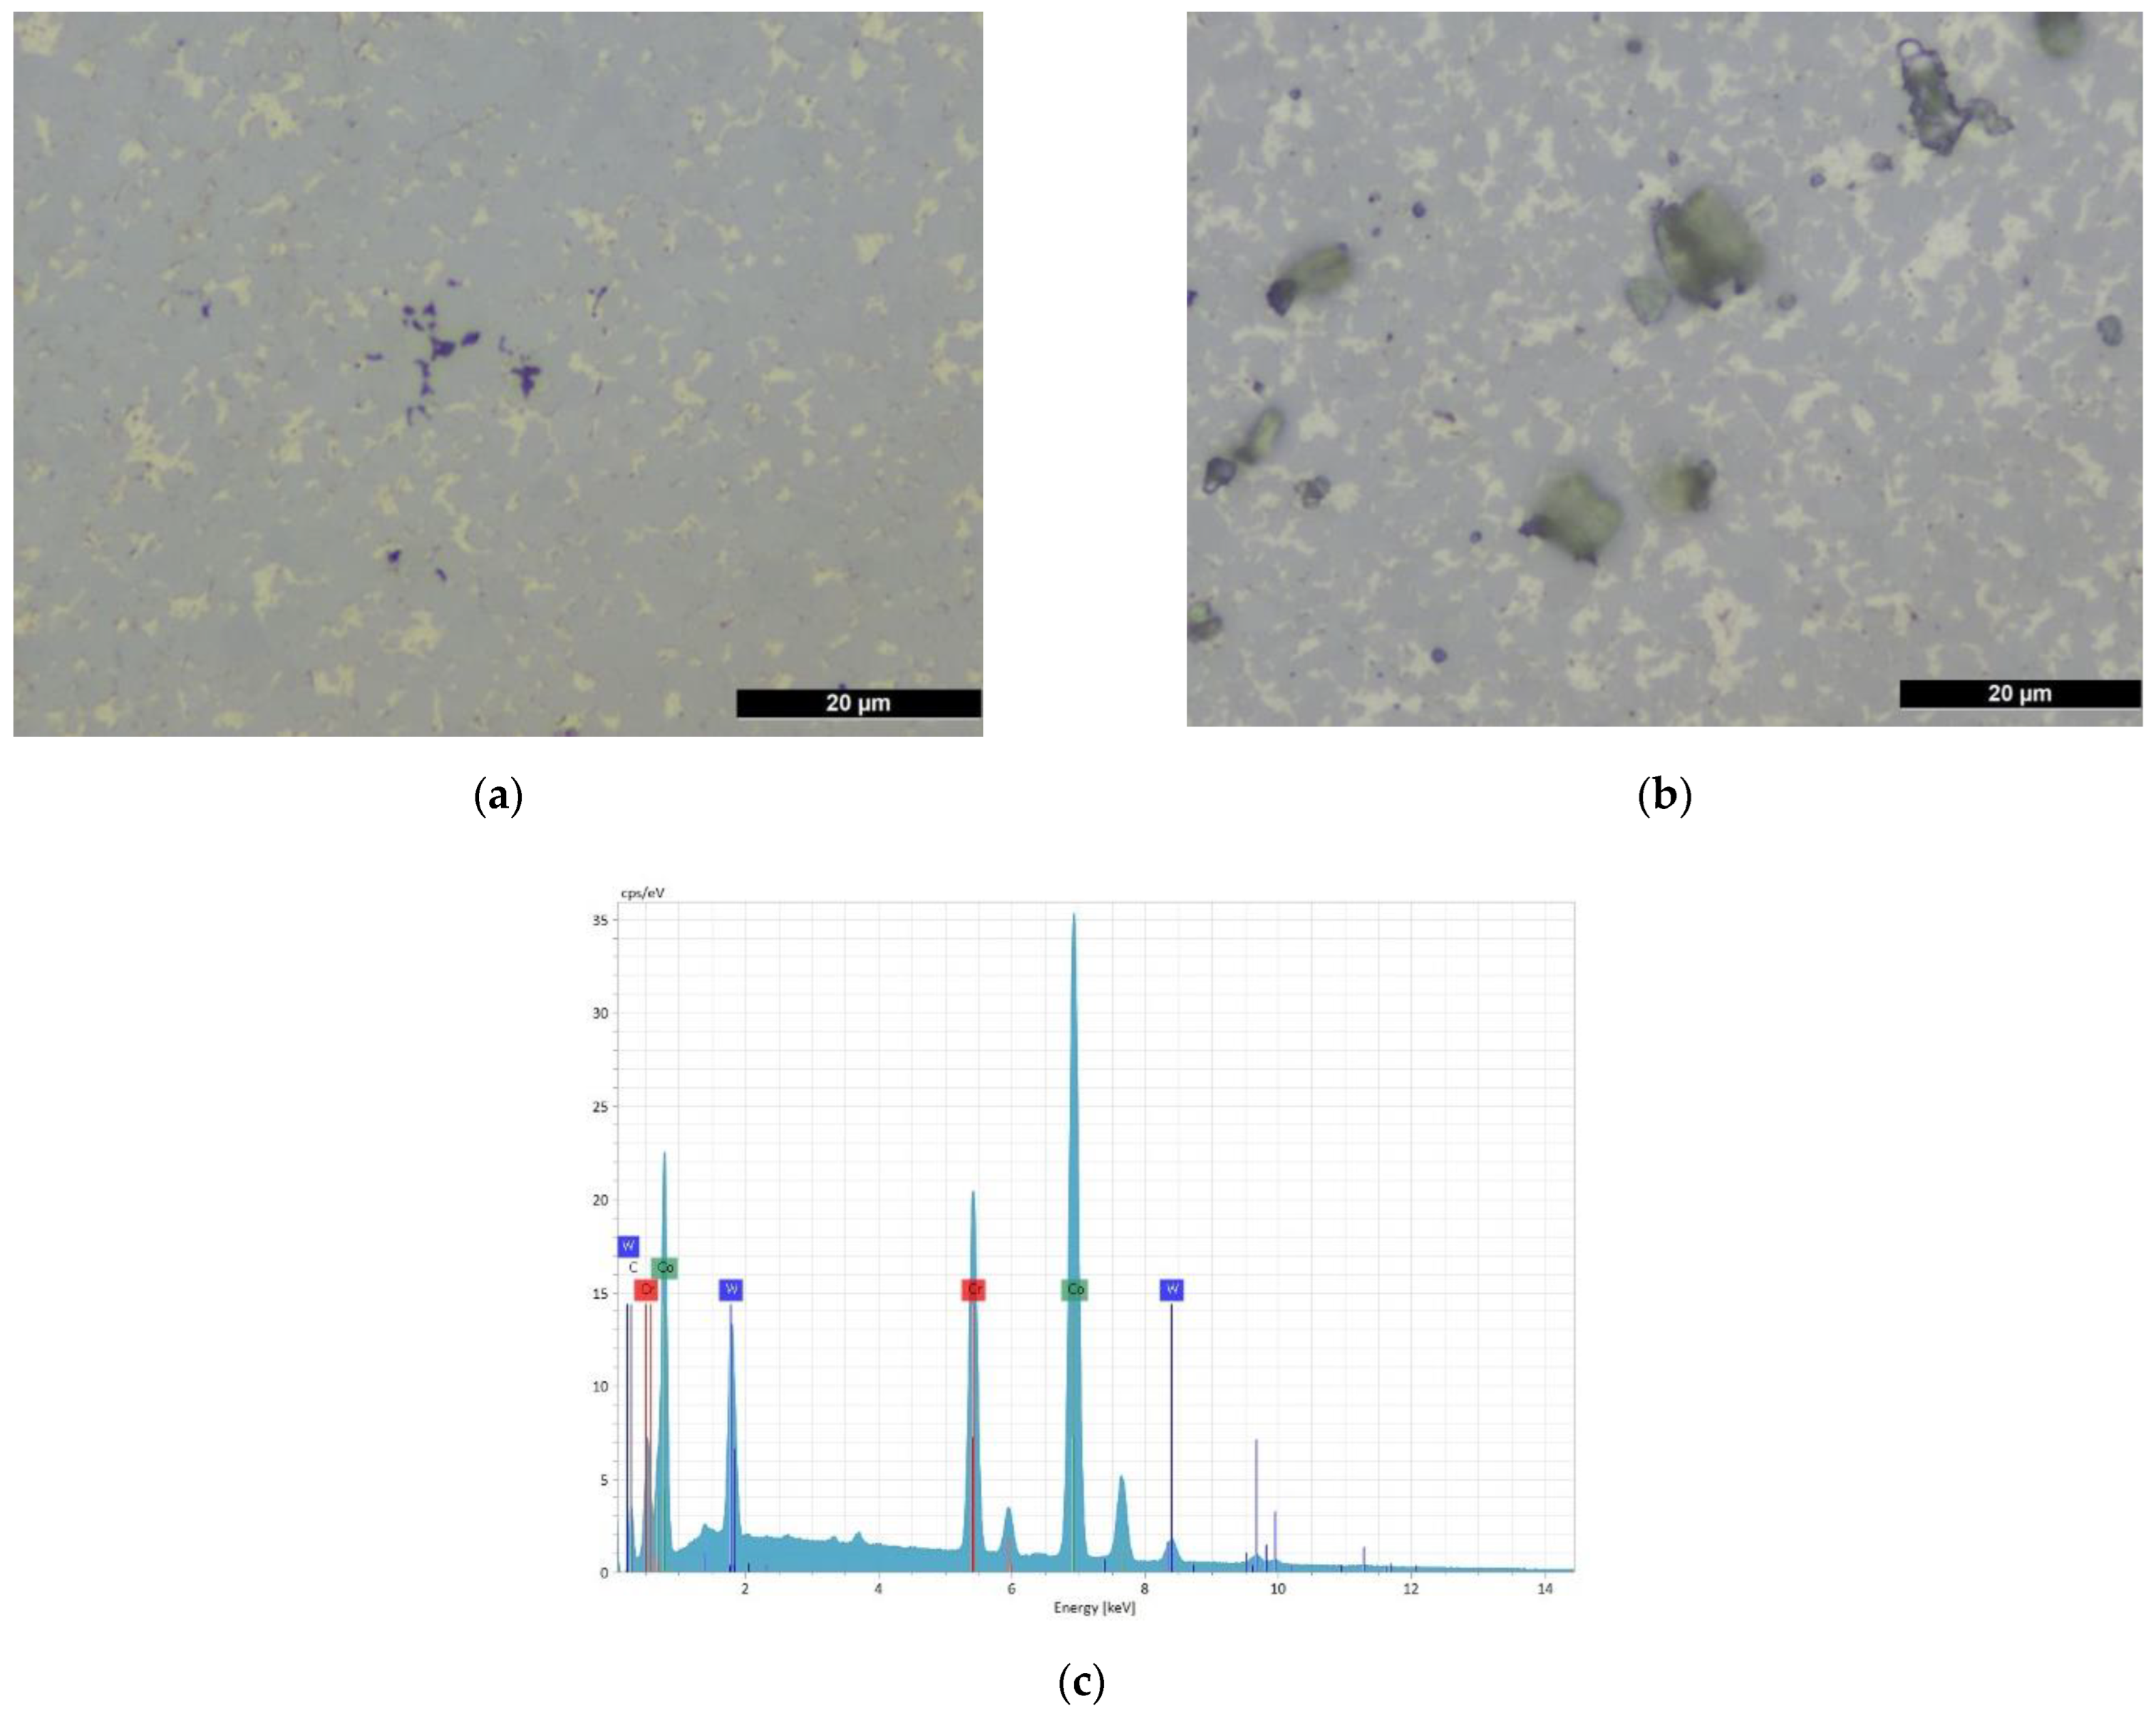
2.2. Physical Characterization
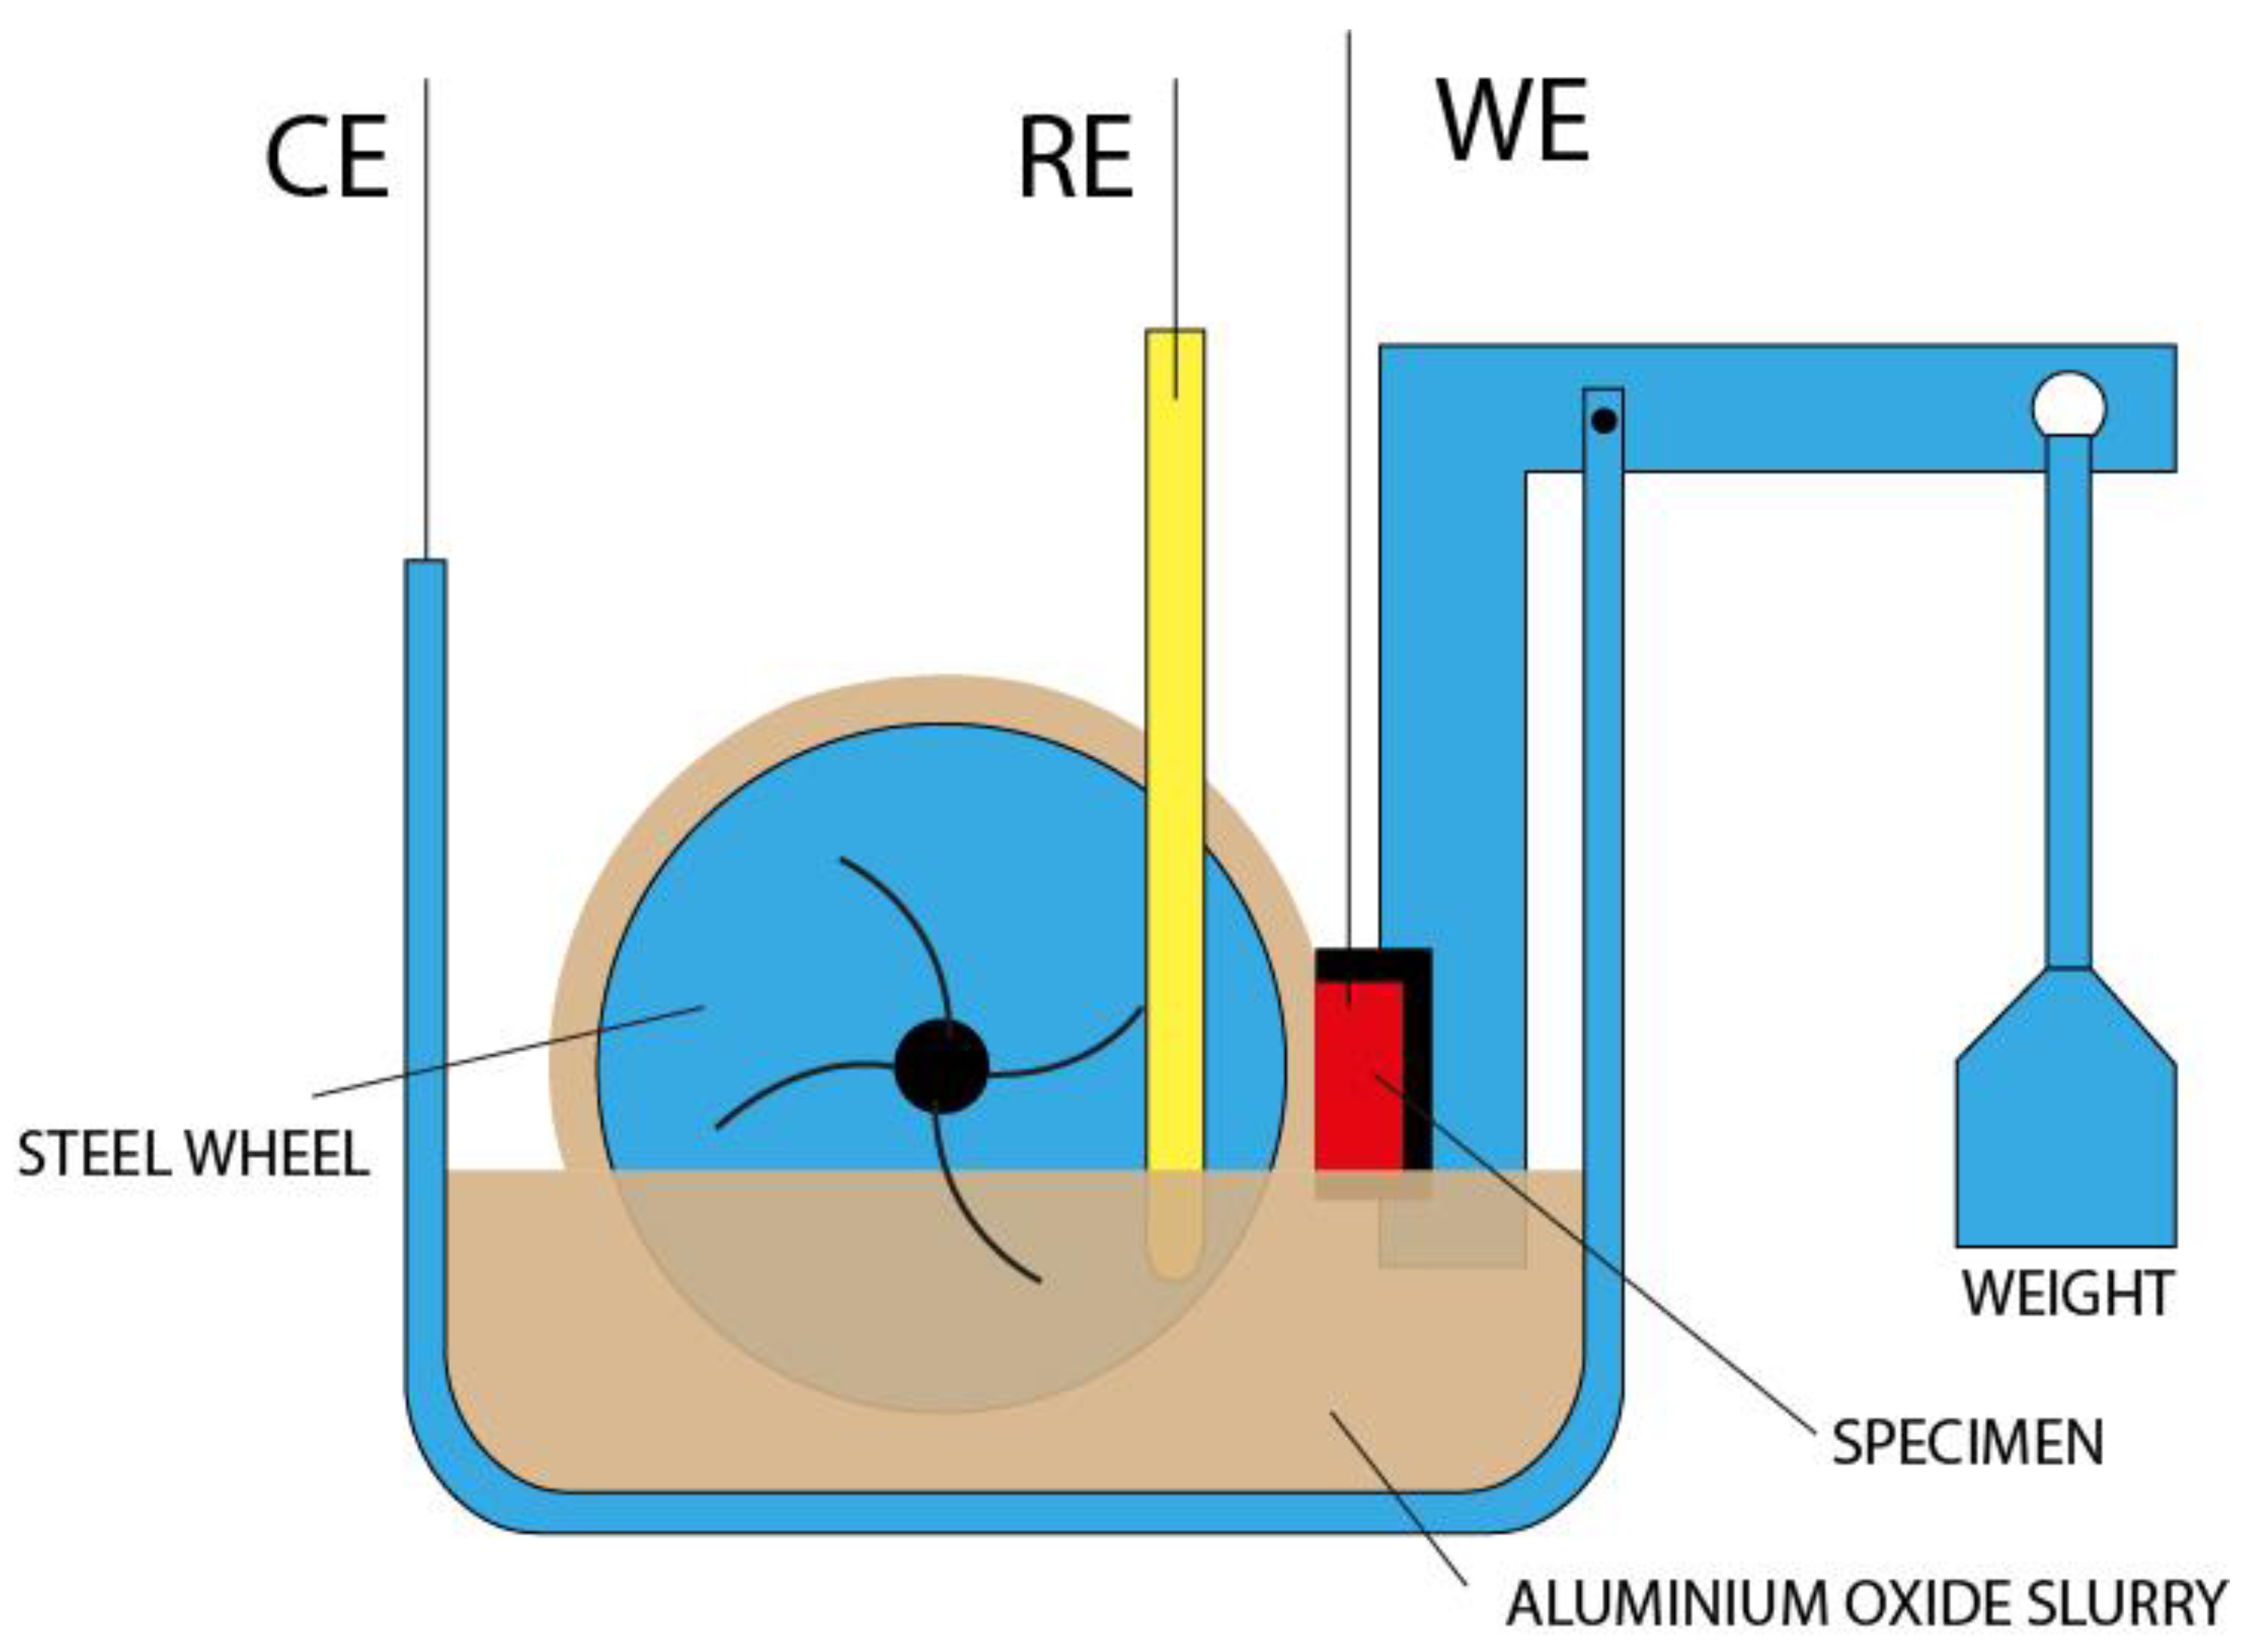
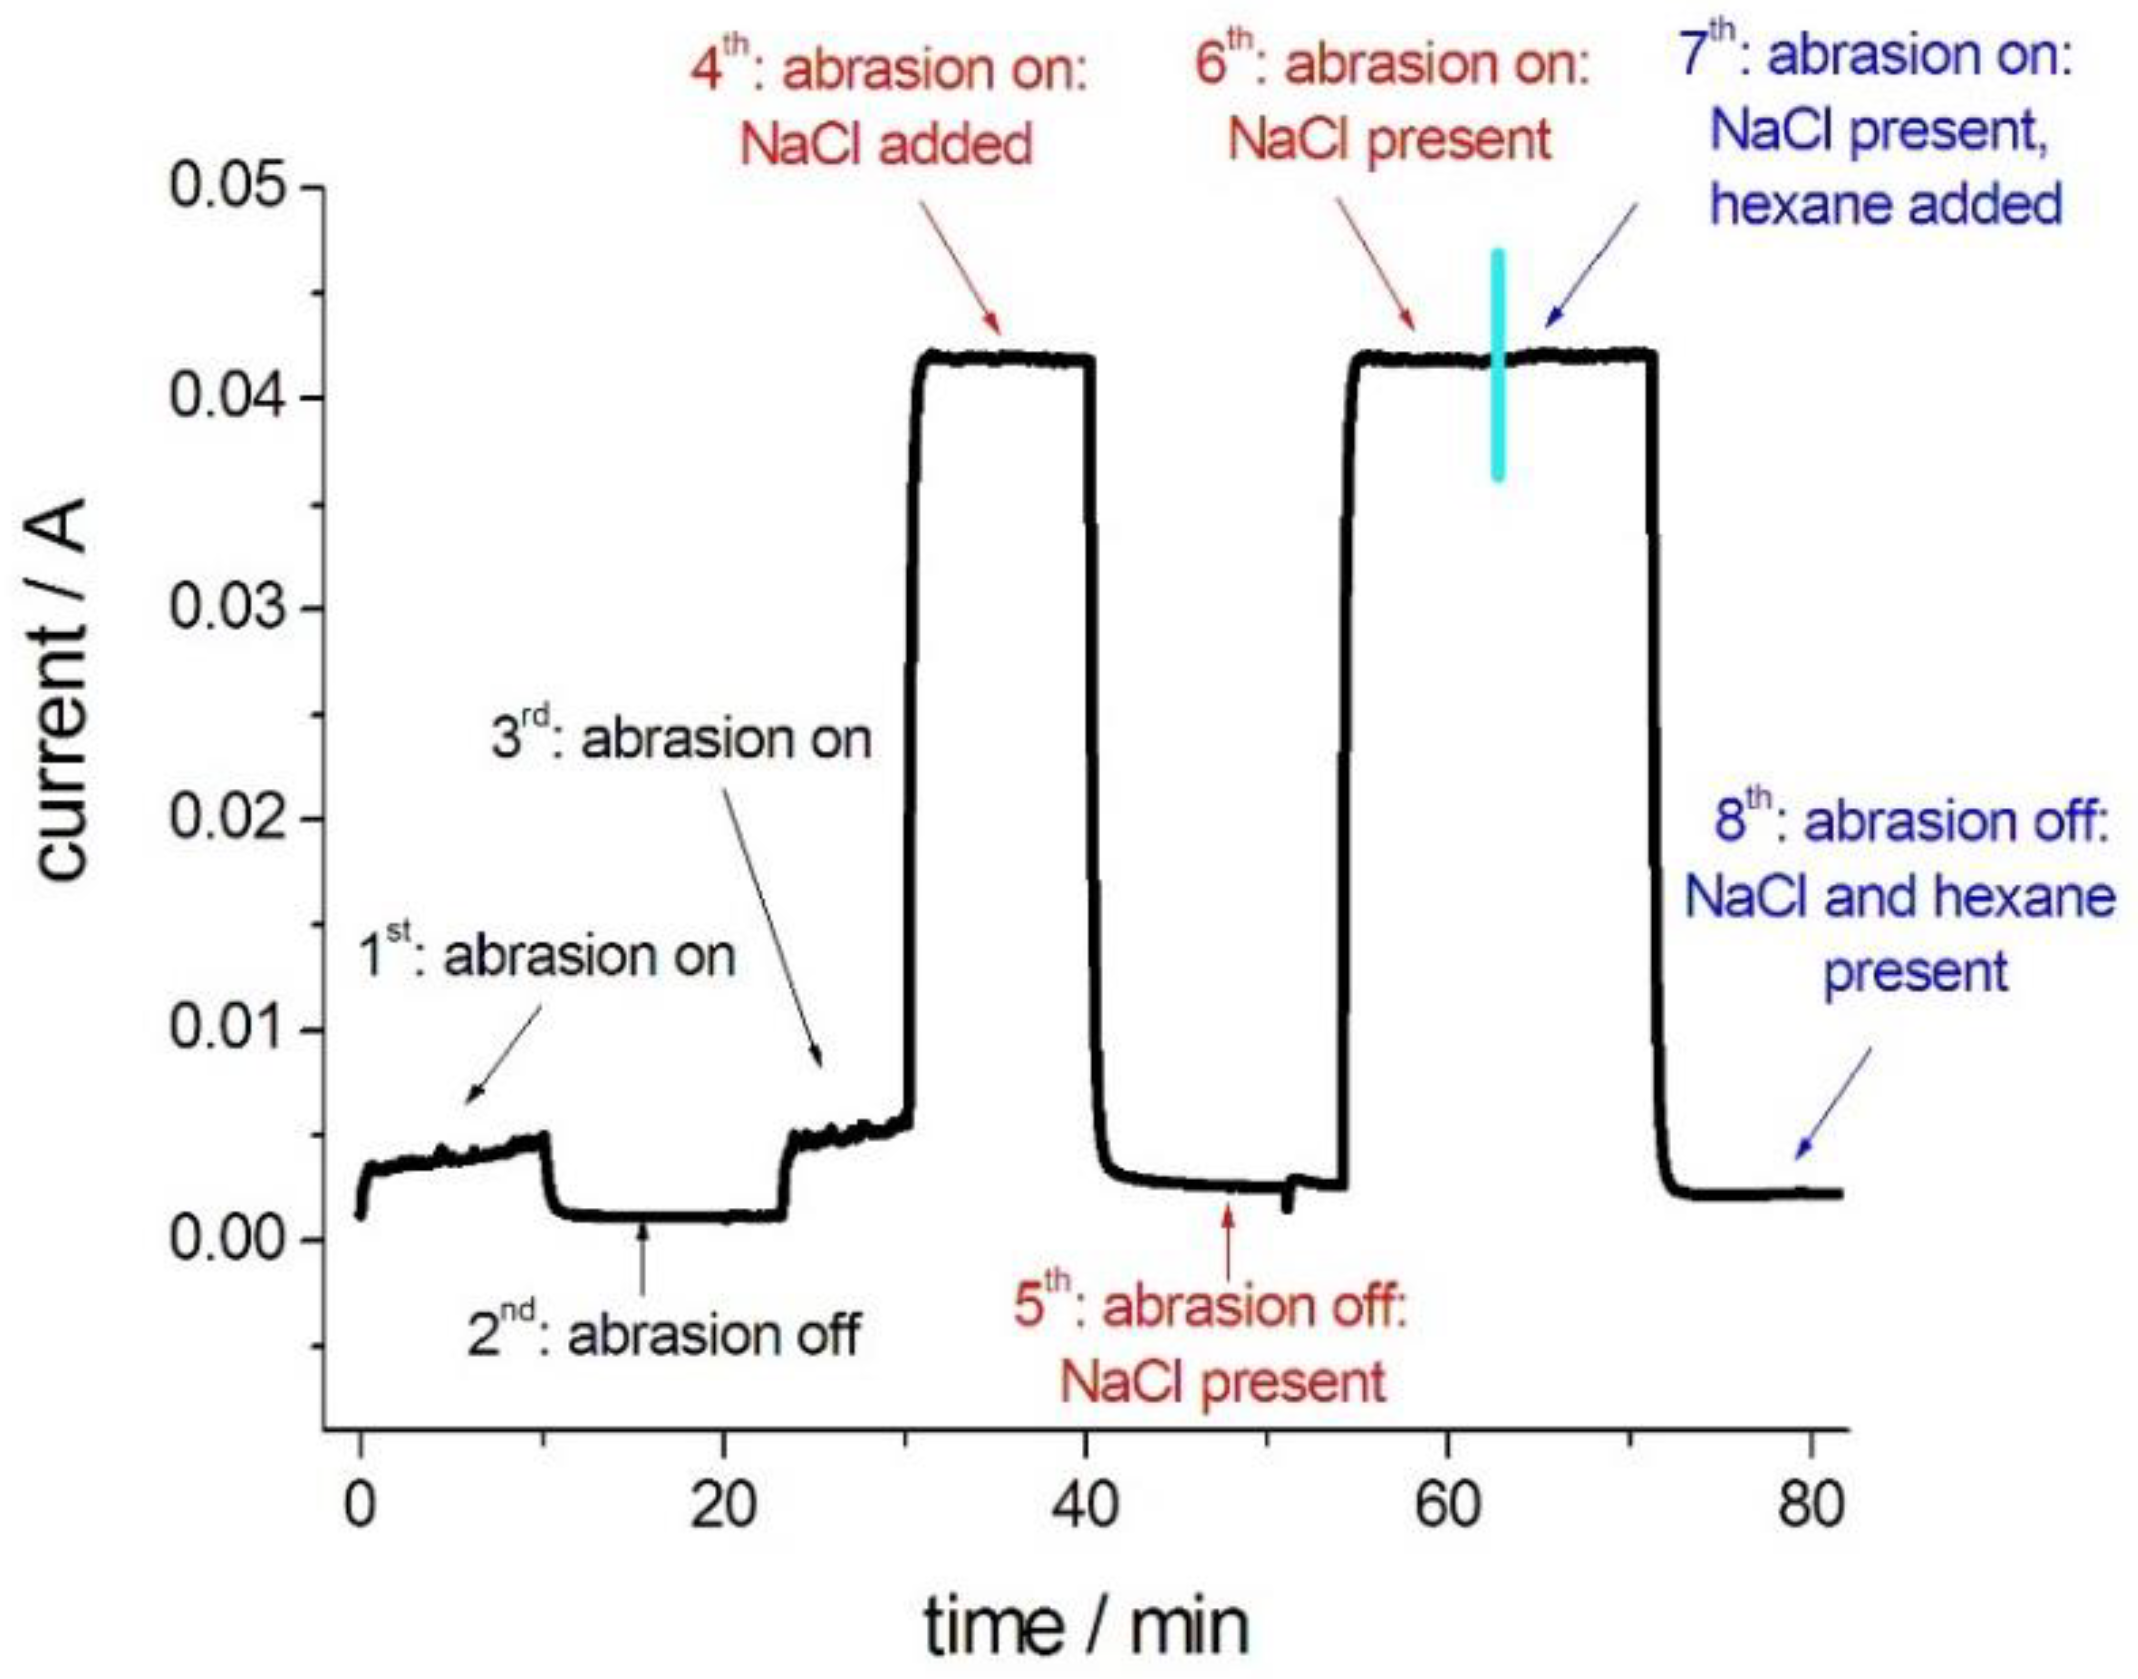
2.3. The Abrasion–Corrosion Test System
2.4. Linear Sweep Voltammetry Setups for Electrochemical Characterization
2.5. Data Analysis
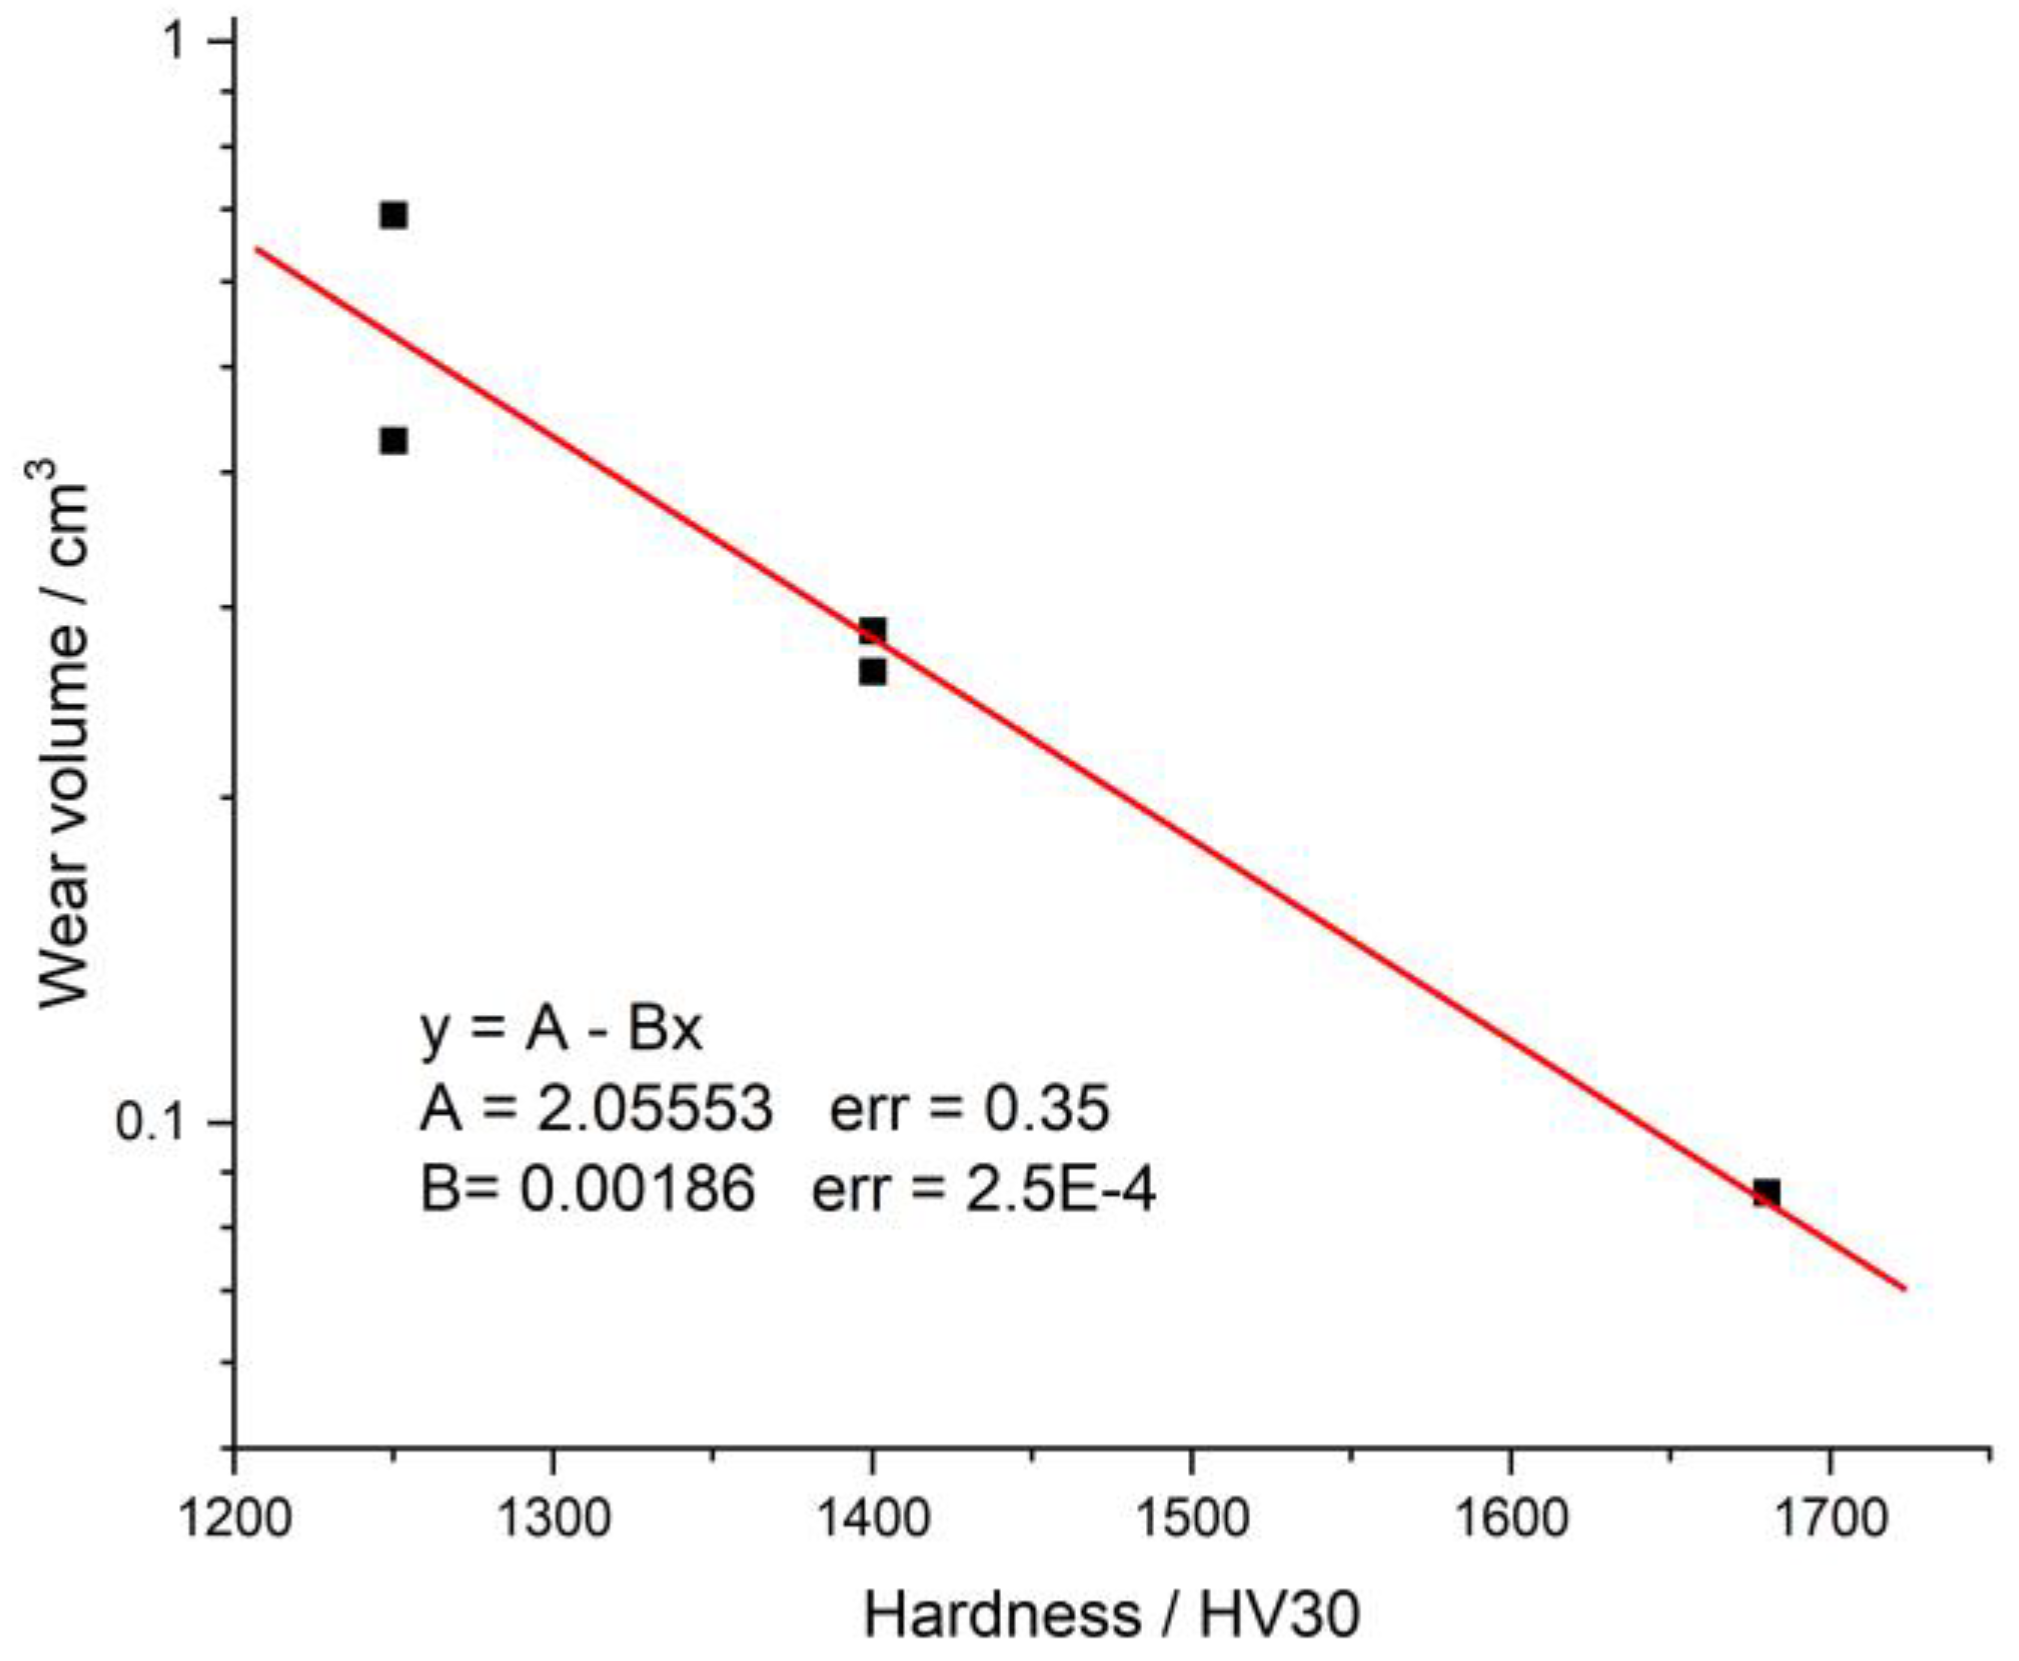
2.5.1. Wear Volume
2.5.2. Steady-State Abrasion–Corrosion Performance
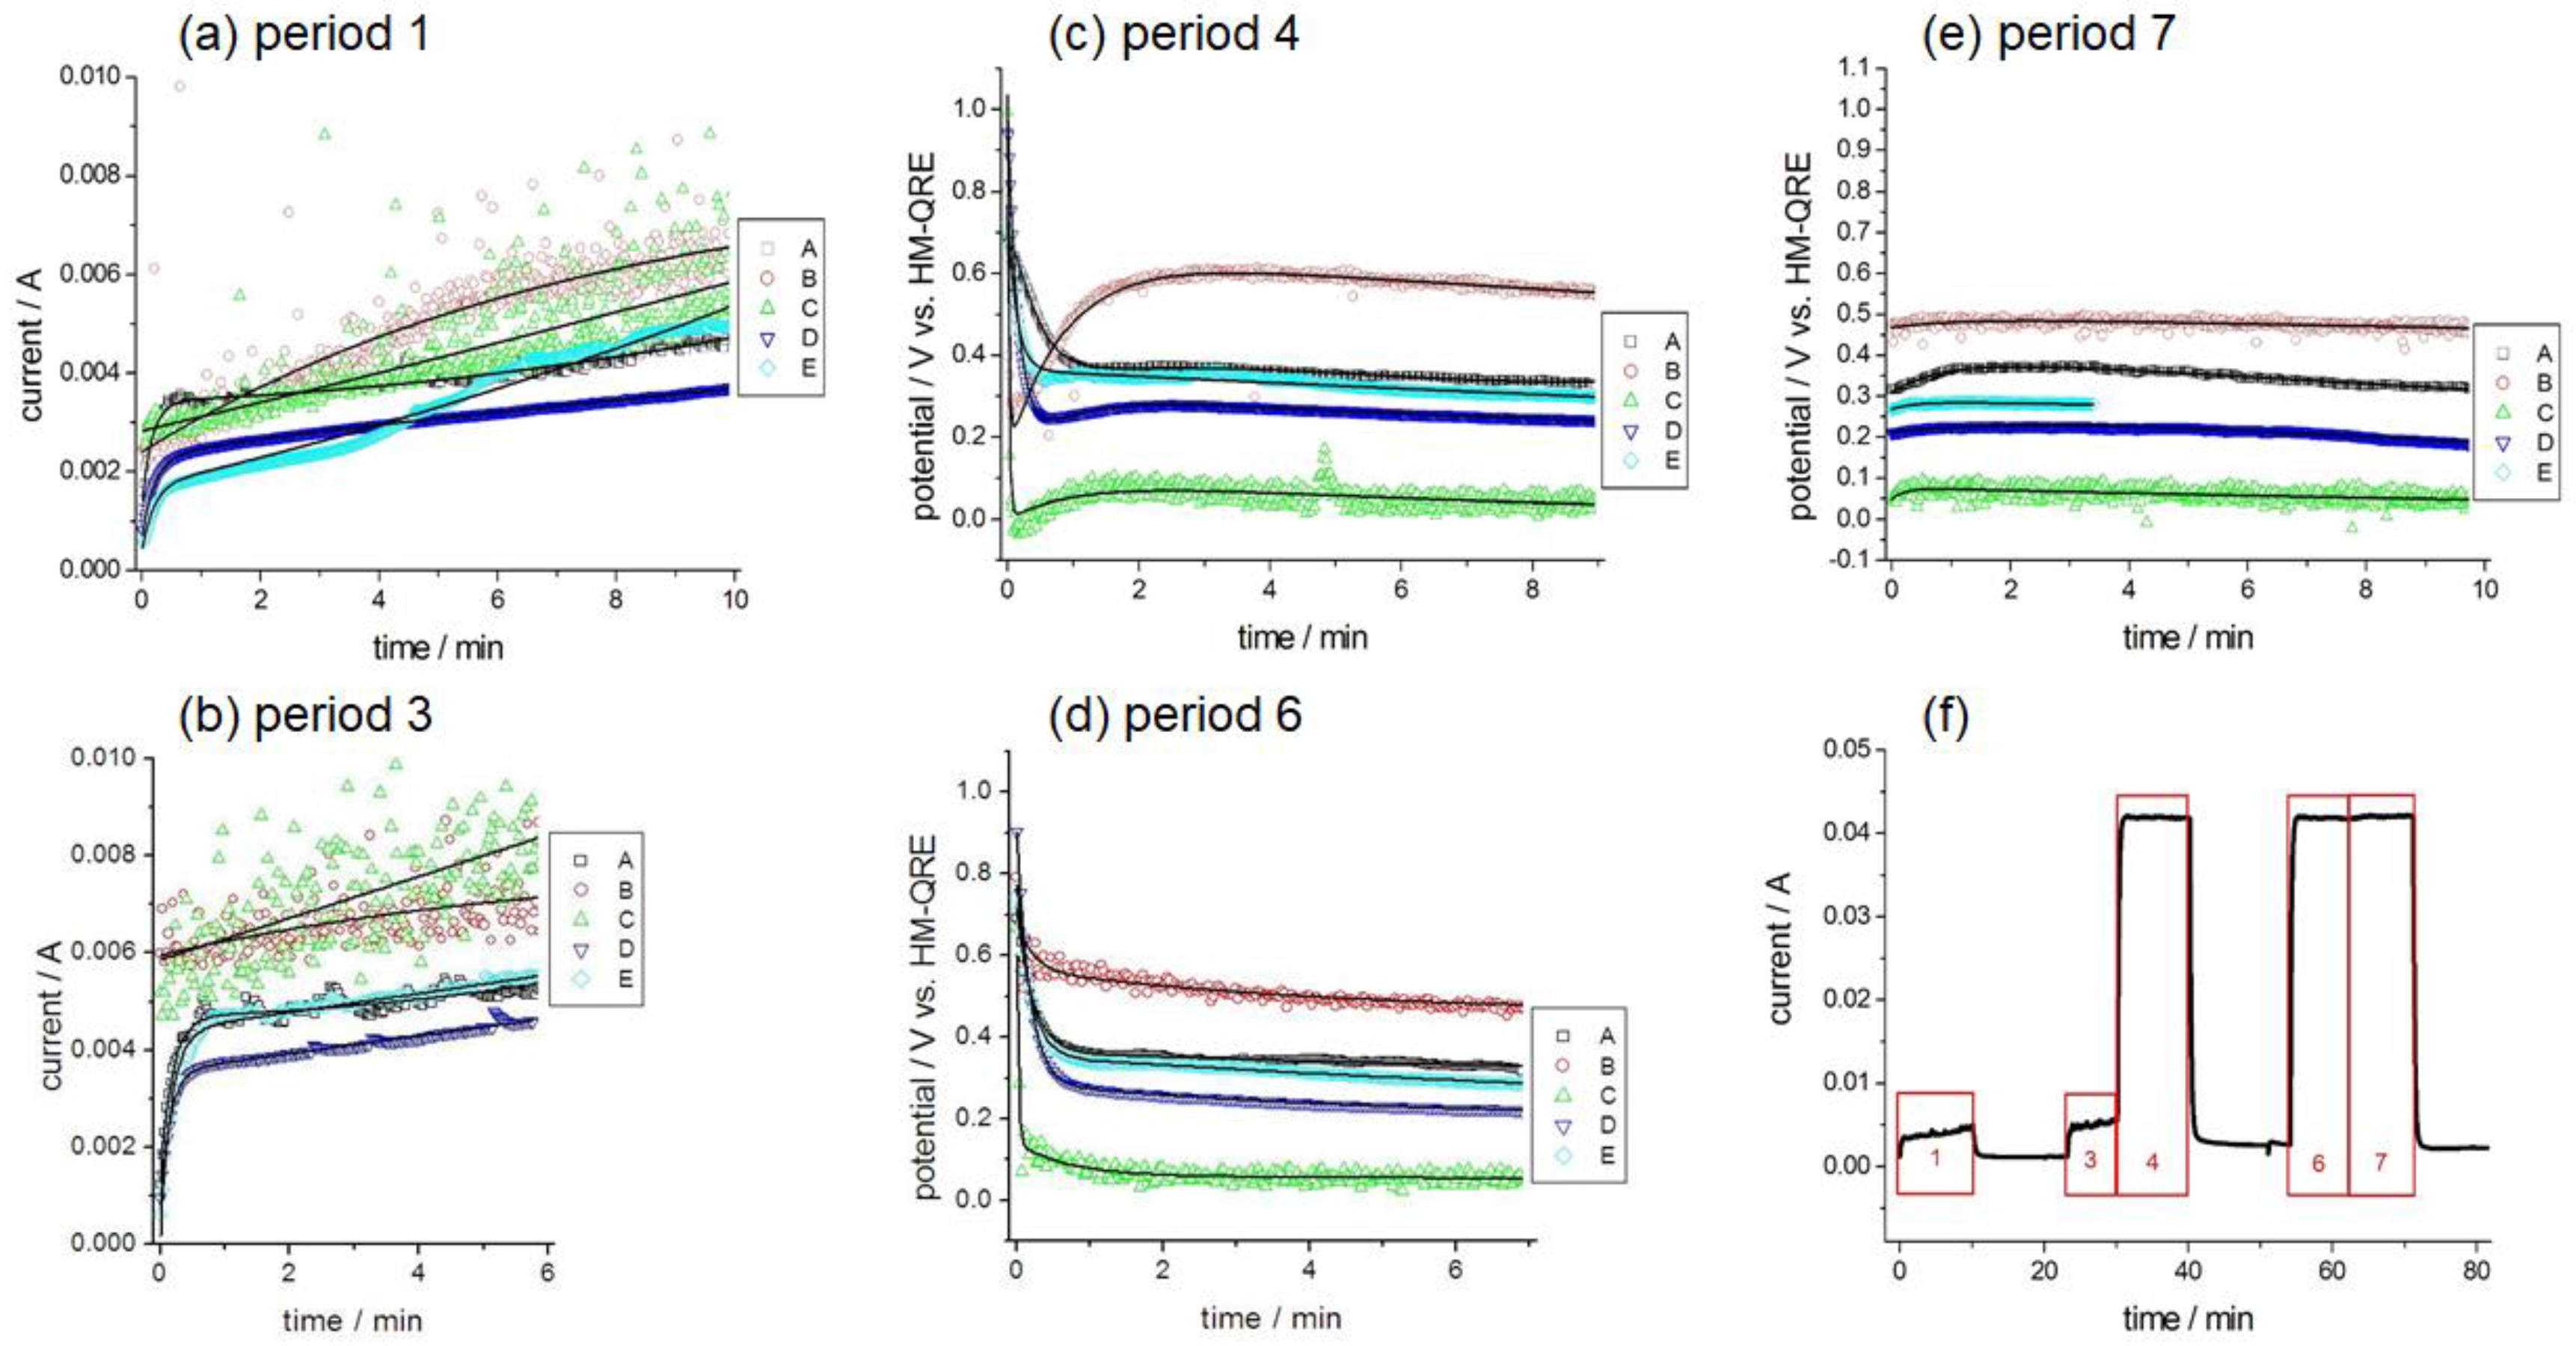
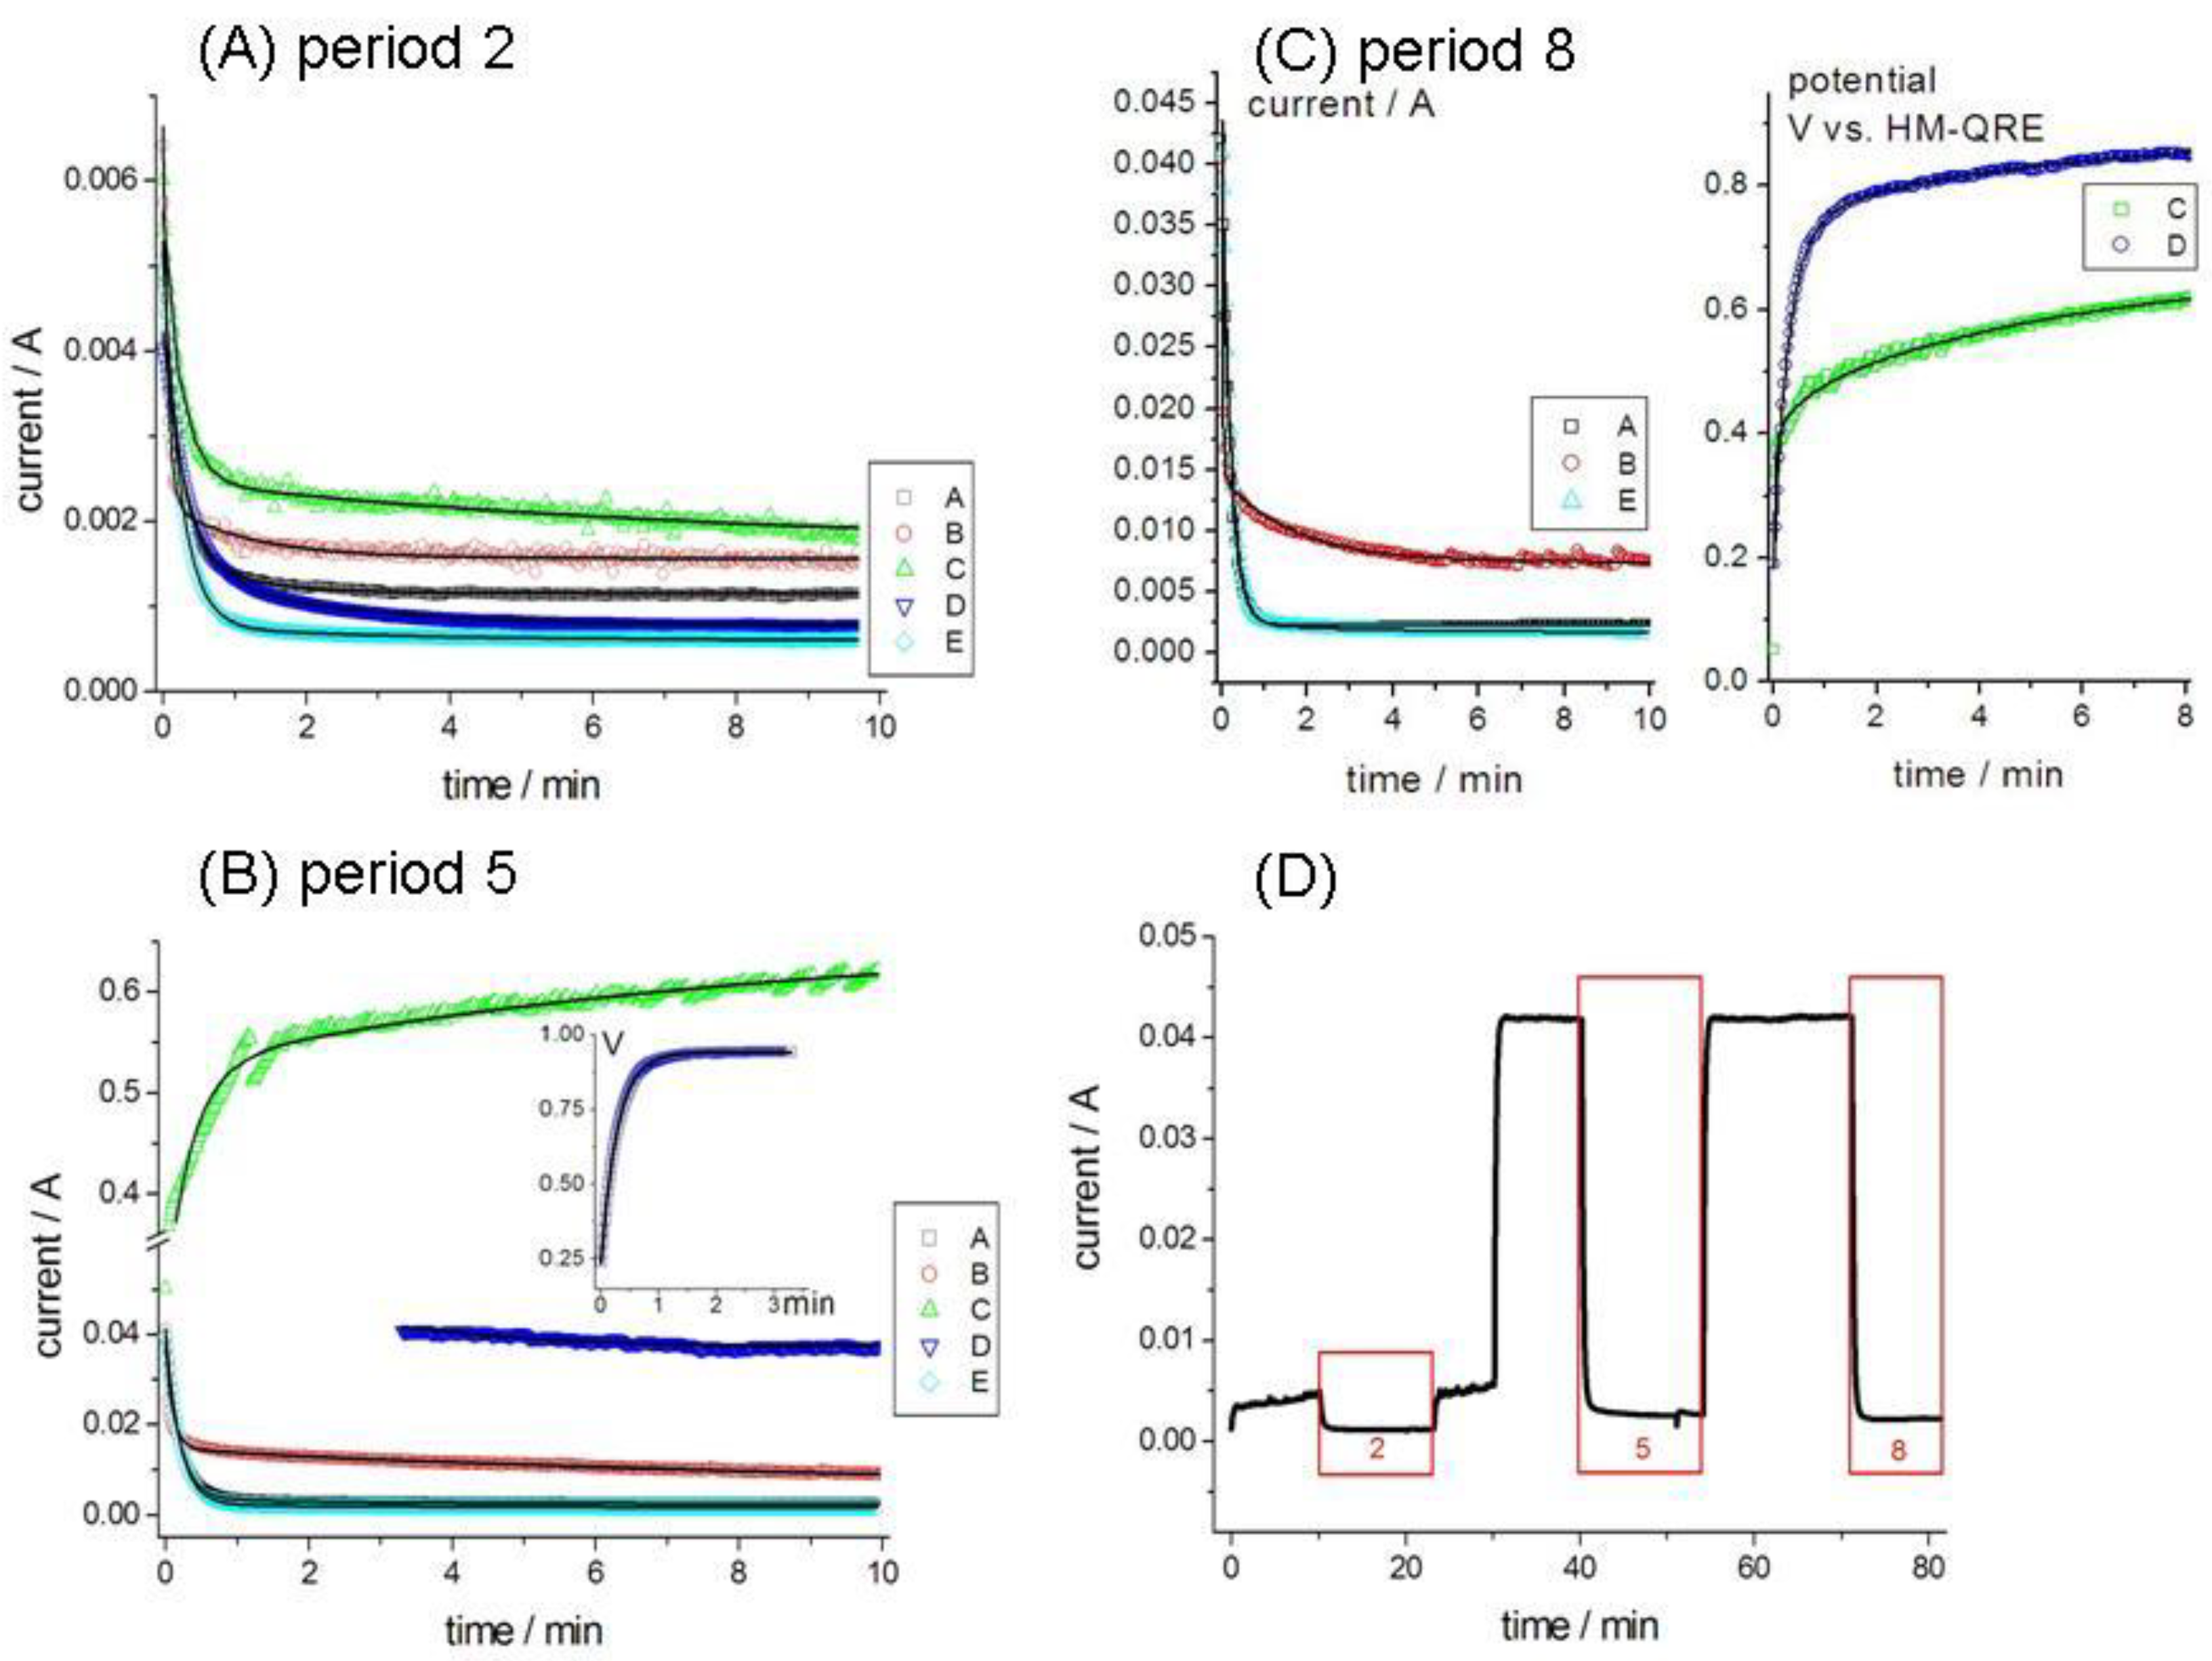
2.5.3. Transient Abrasion–Corrosion Performance
3. Discussion and Results
3.1. Abrasion Resistance
3.1.1. Co-, CoNi- and CoNiCr-Based Grades
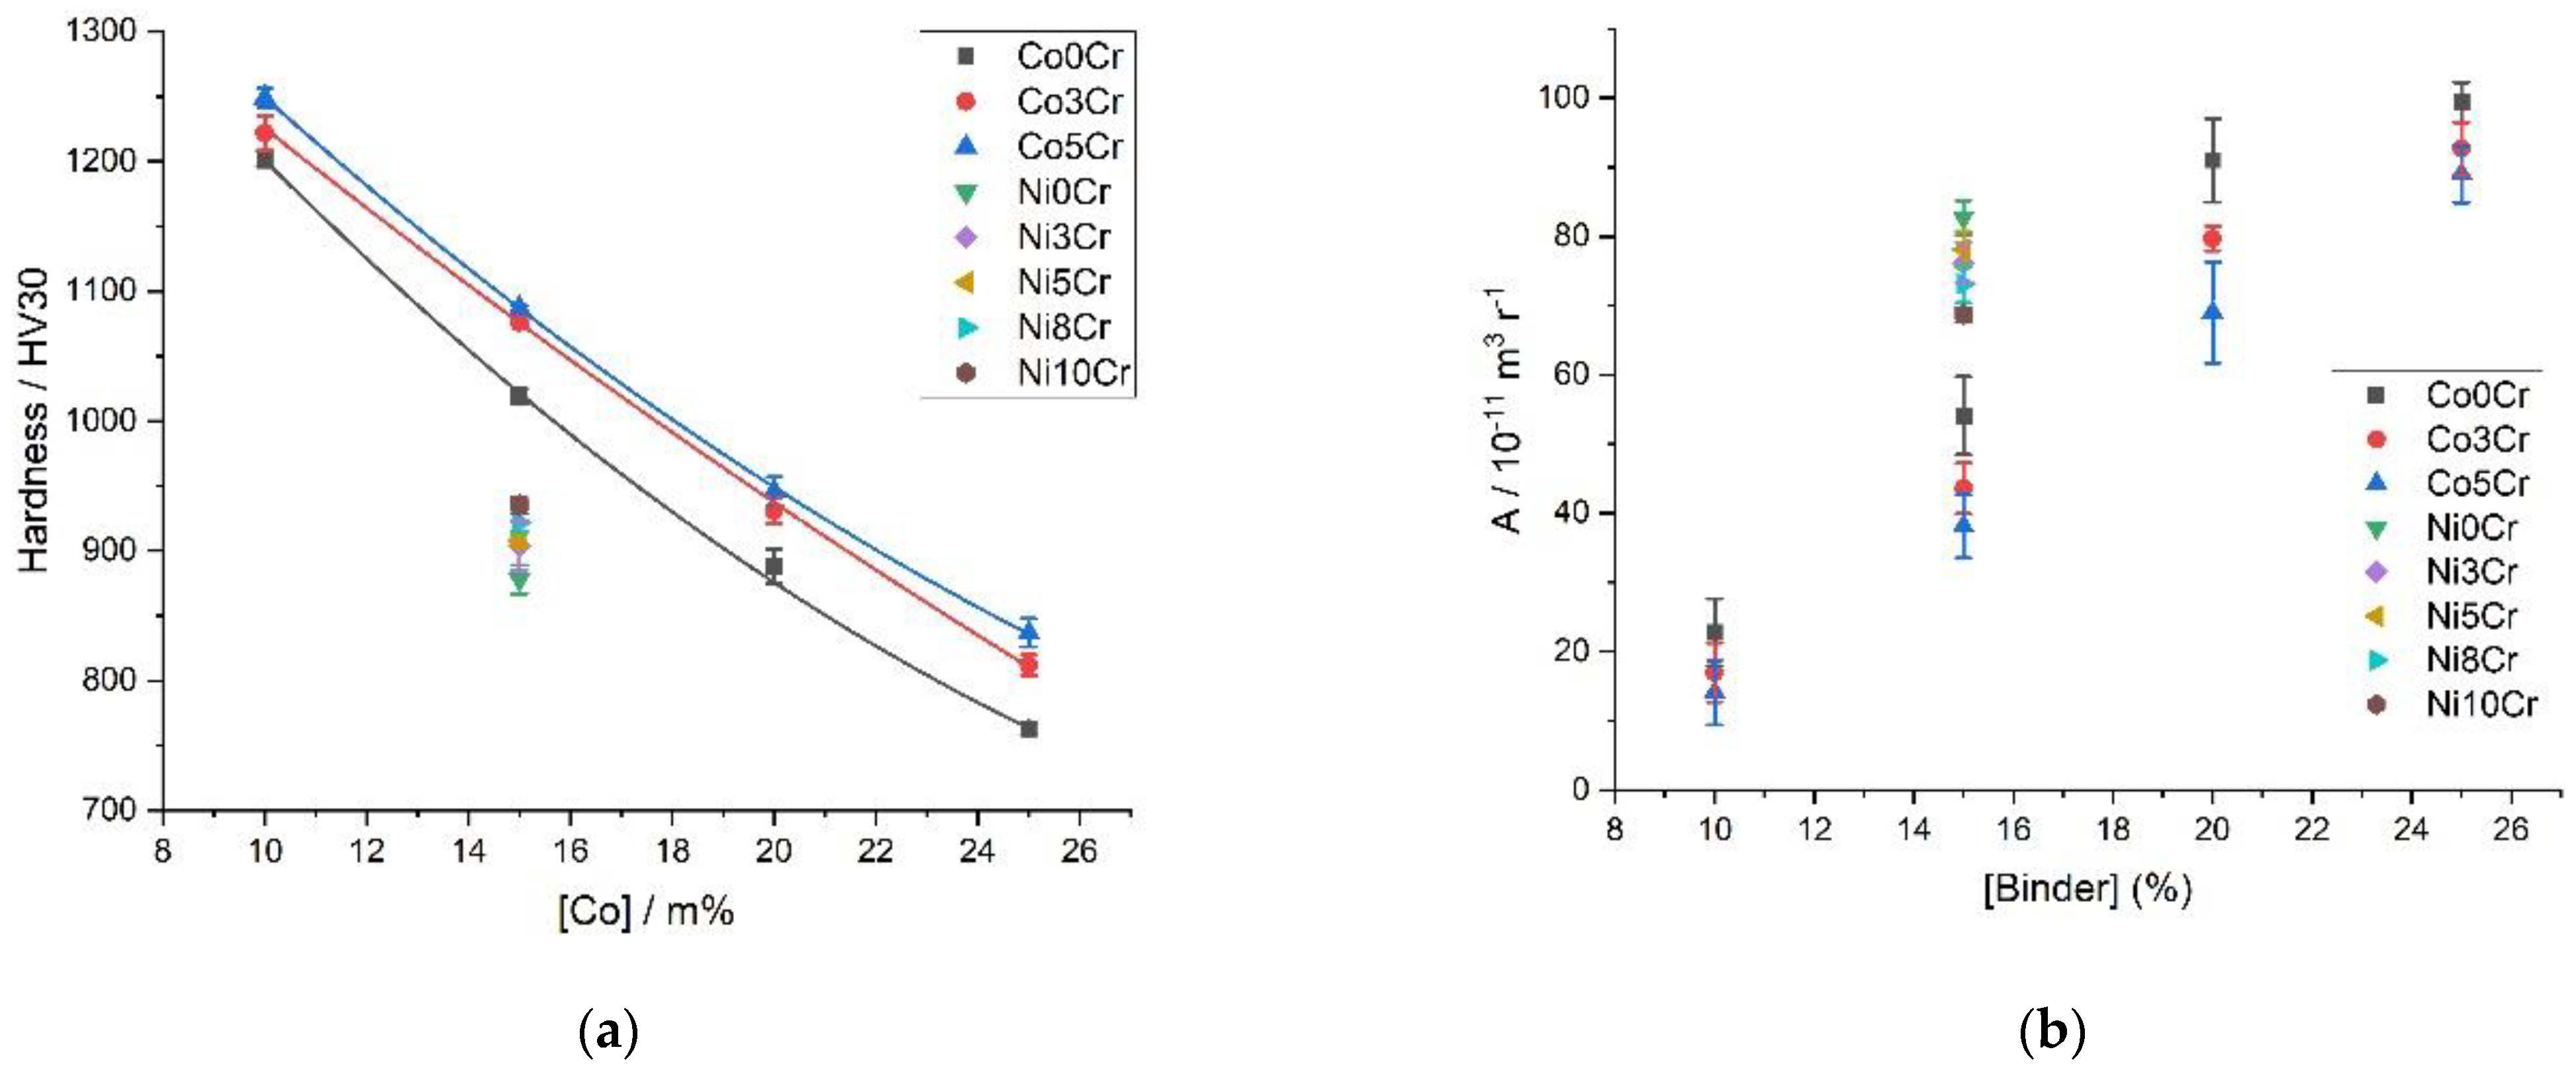
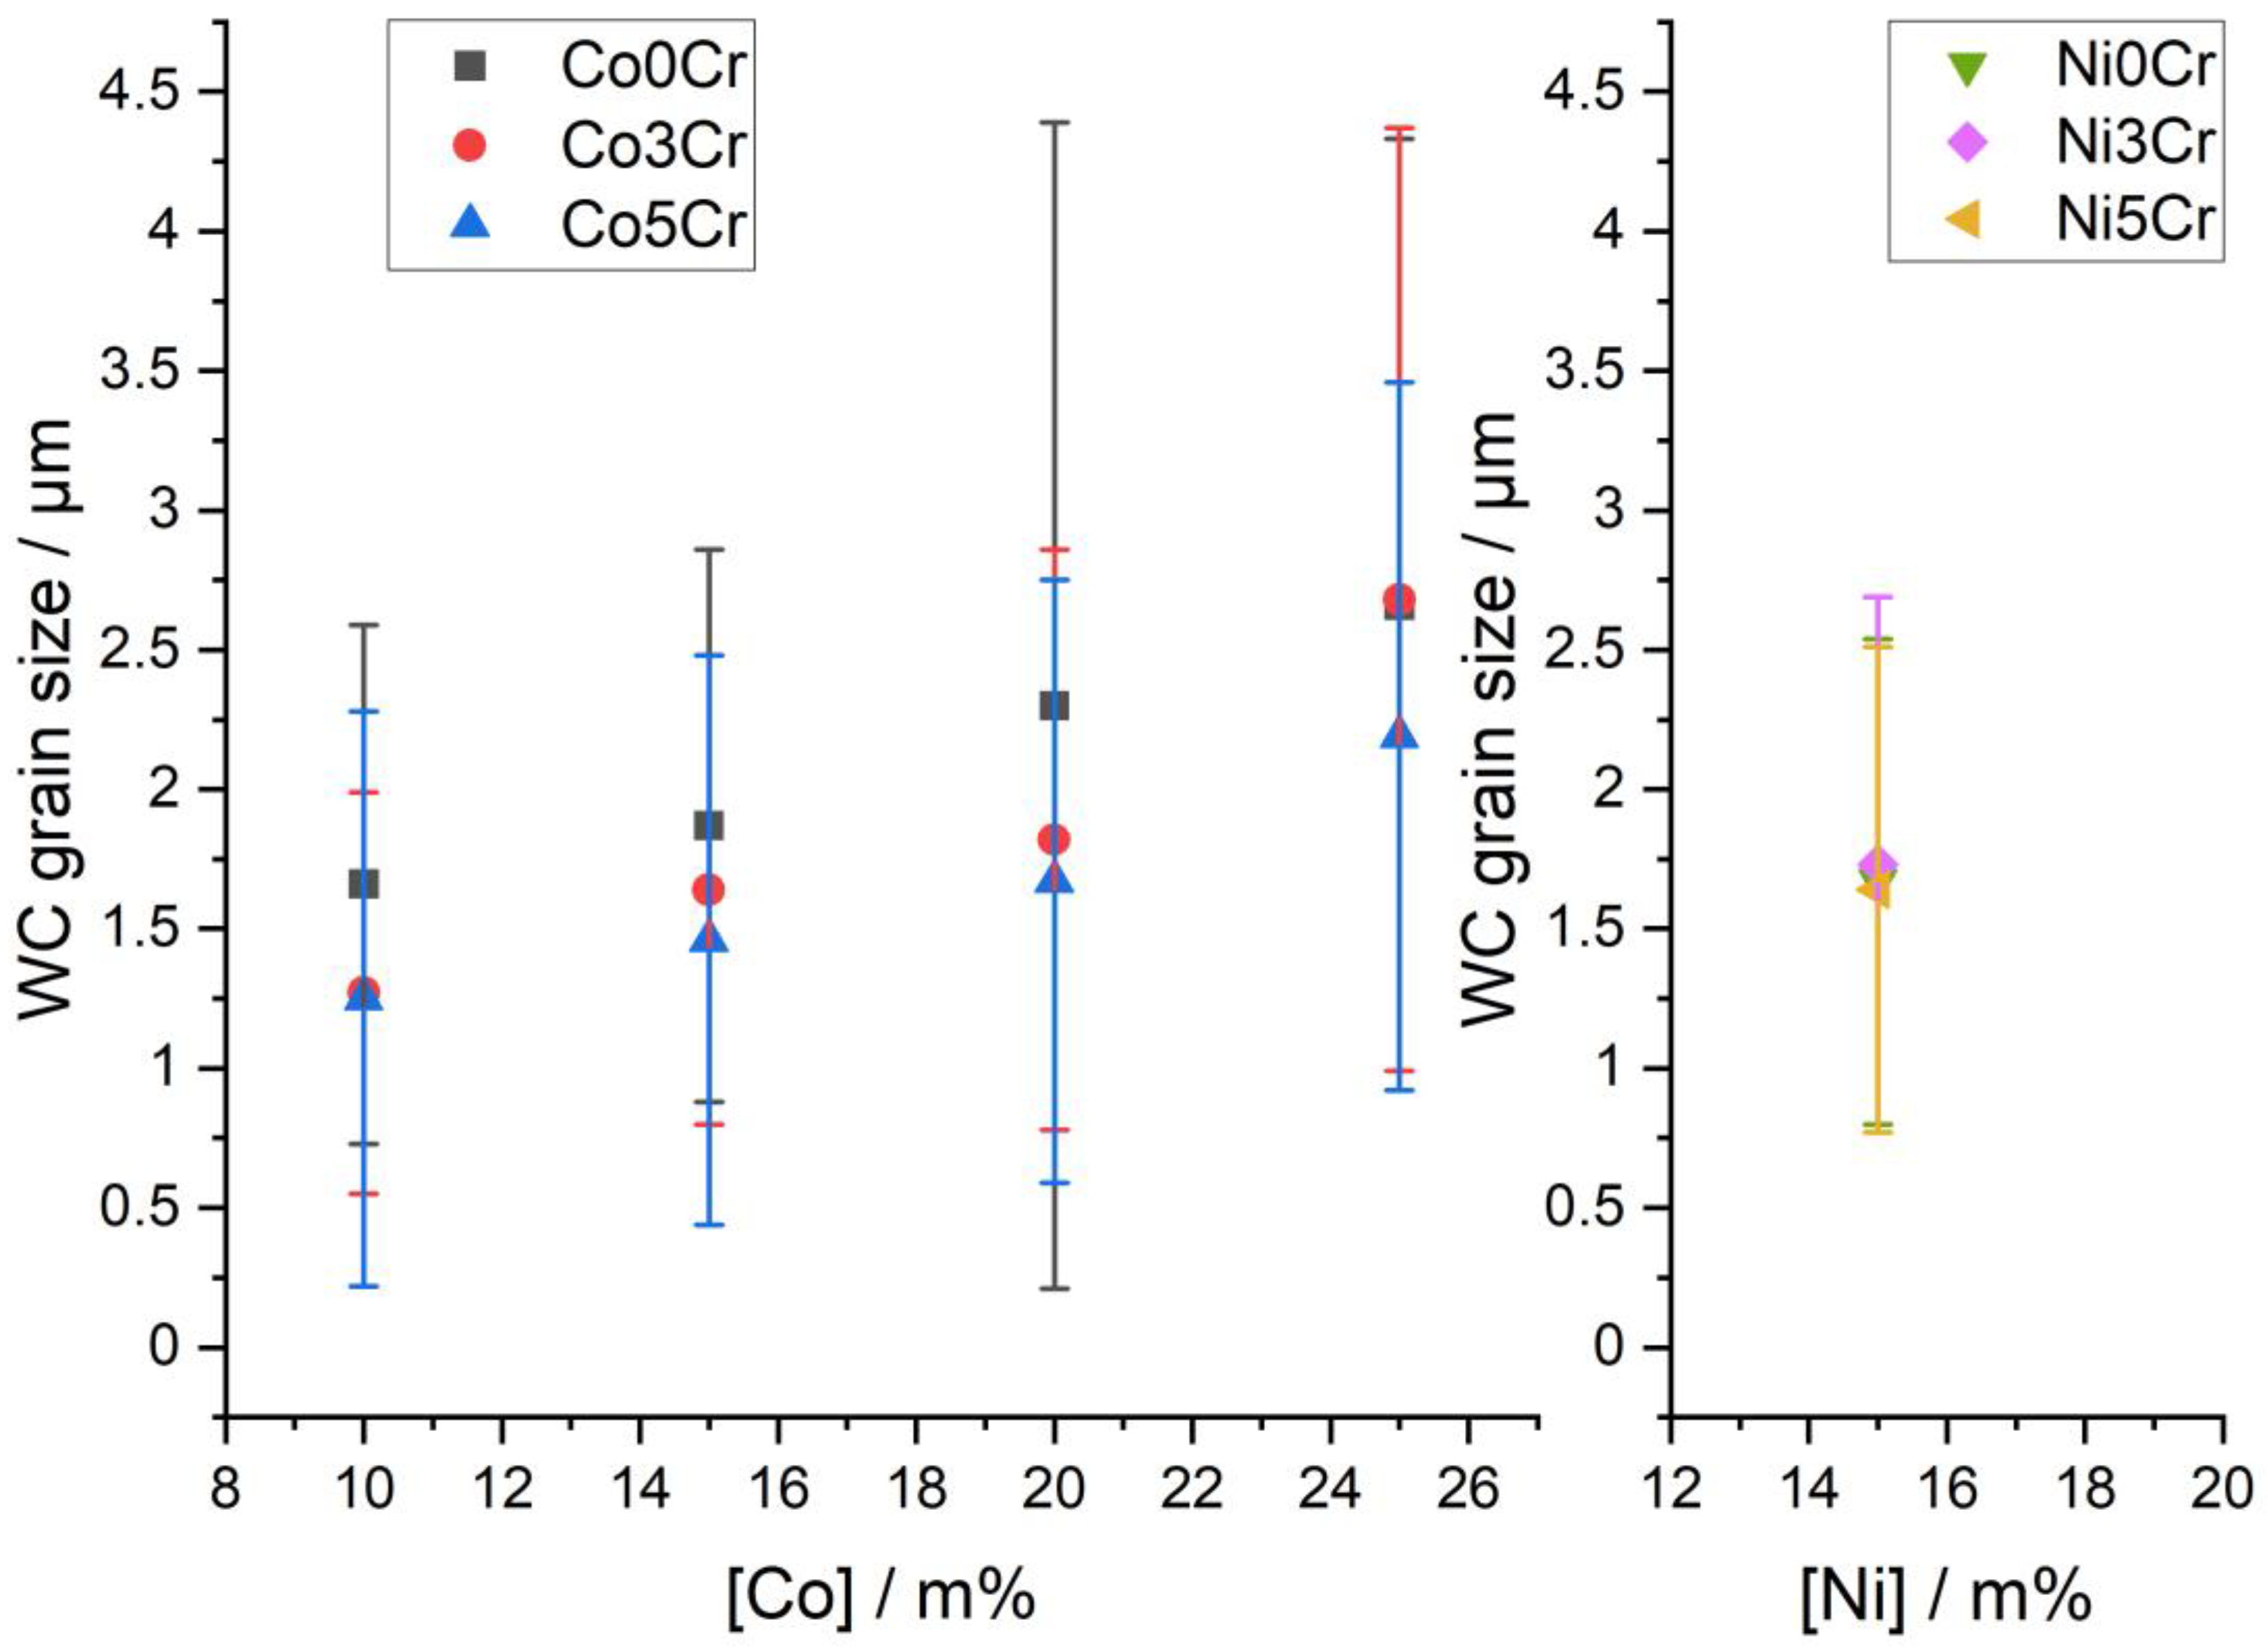
3.1.2. Impact of Systematic Variations of Cr Content
3.2. Corrosion Behaviour
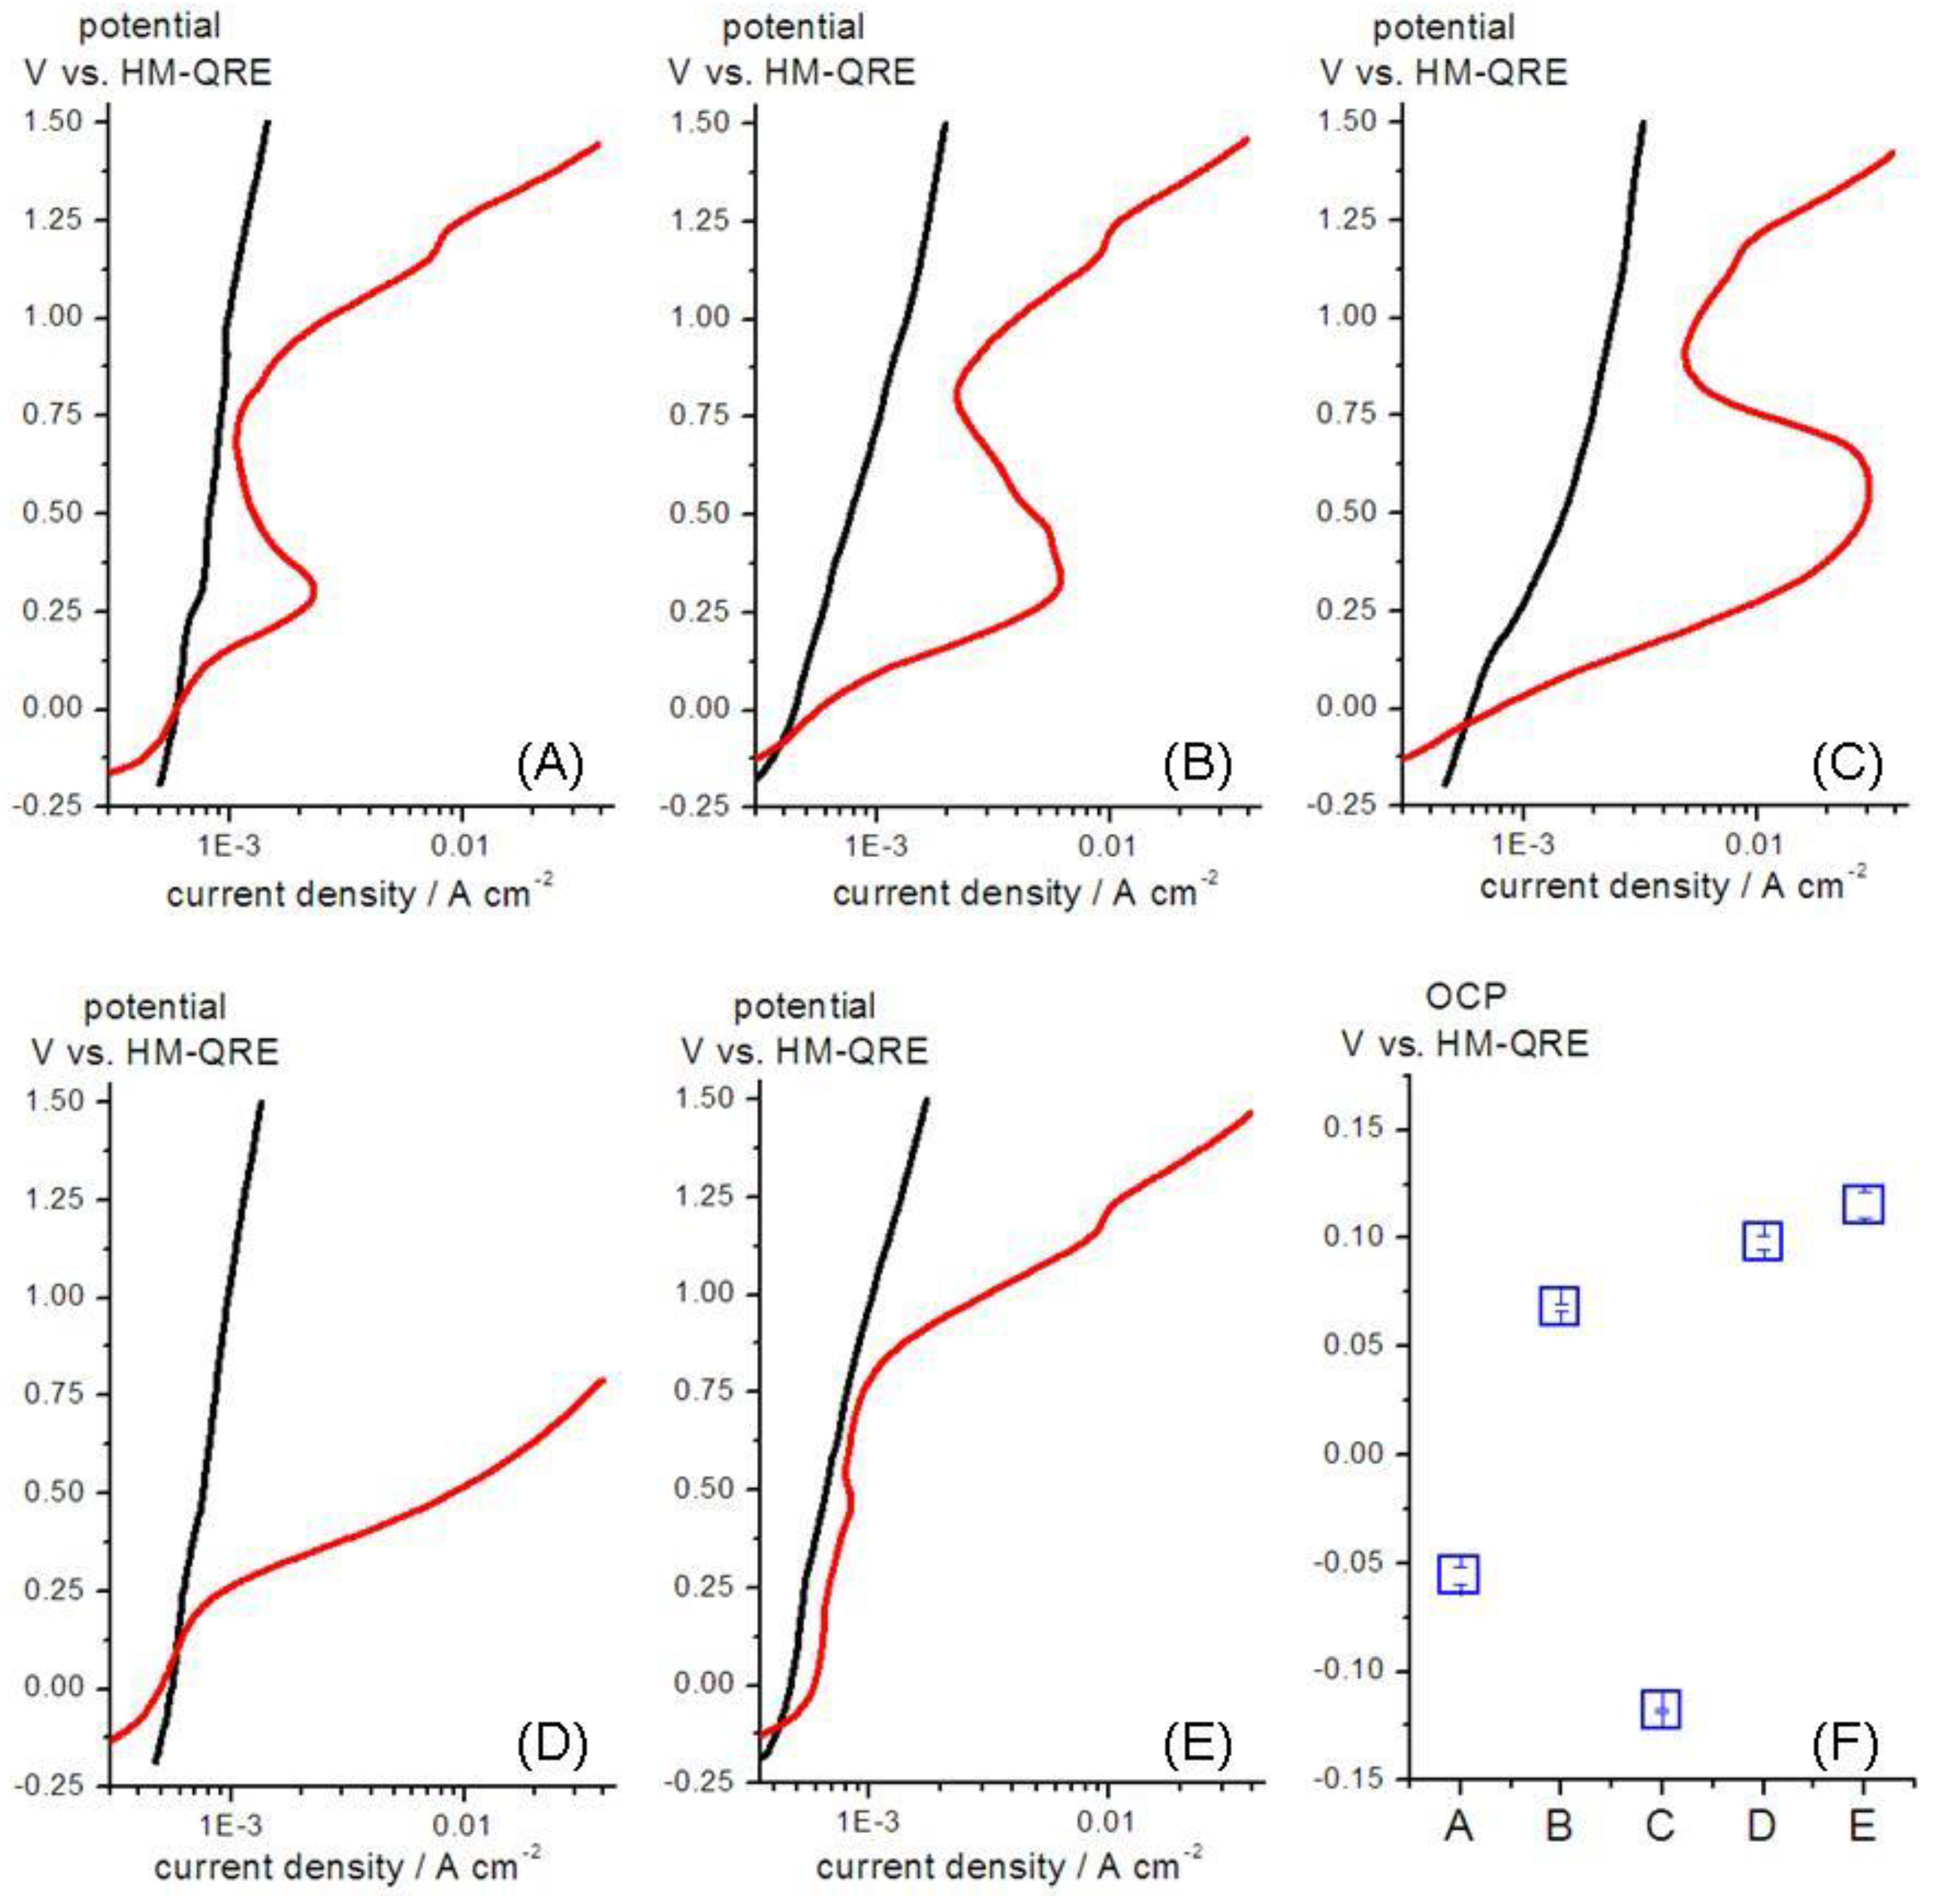
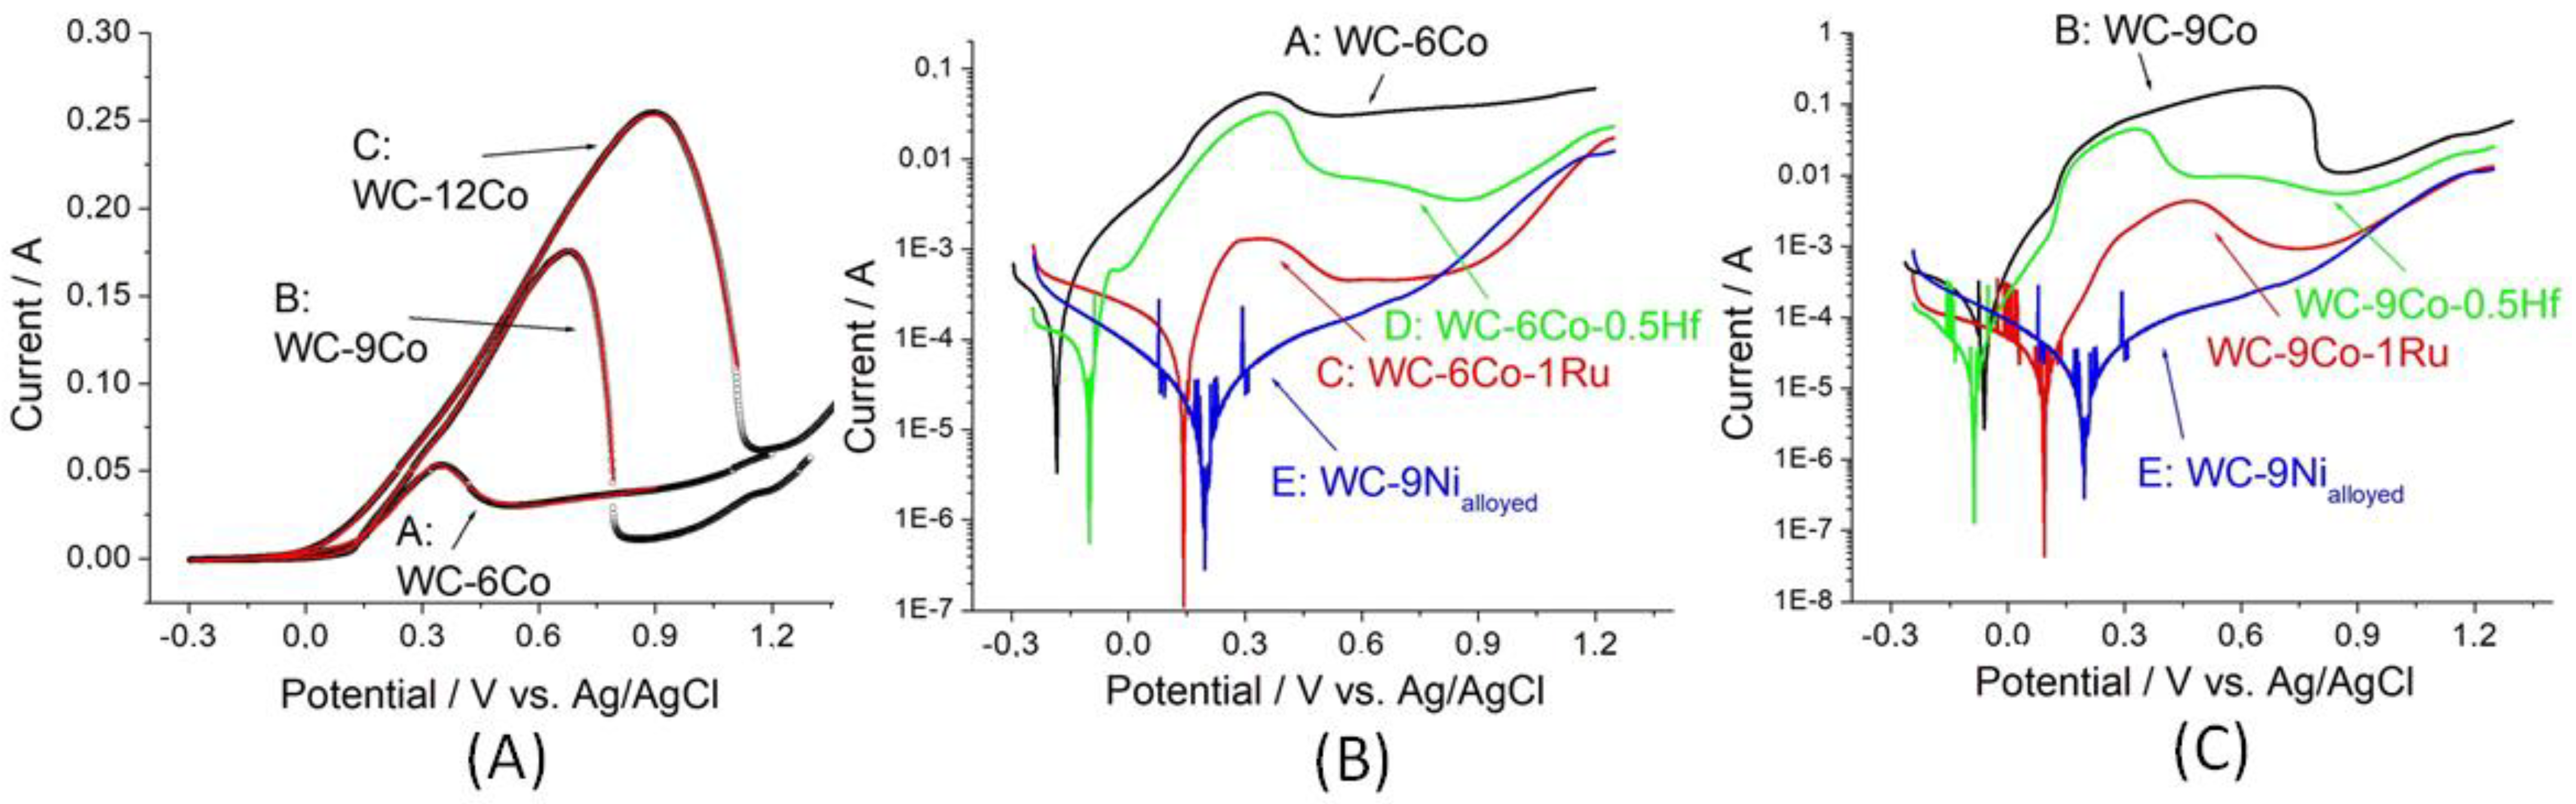
3.2.1. Co- and Ni-Based Grades with Cr, Hf and Ru Addition
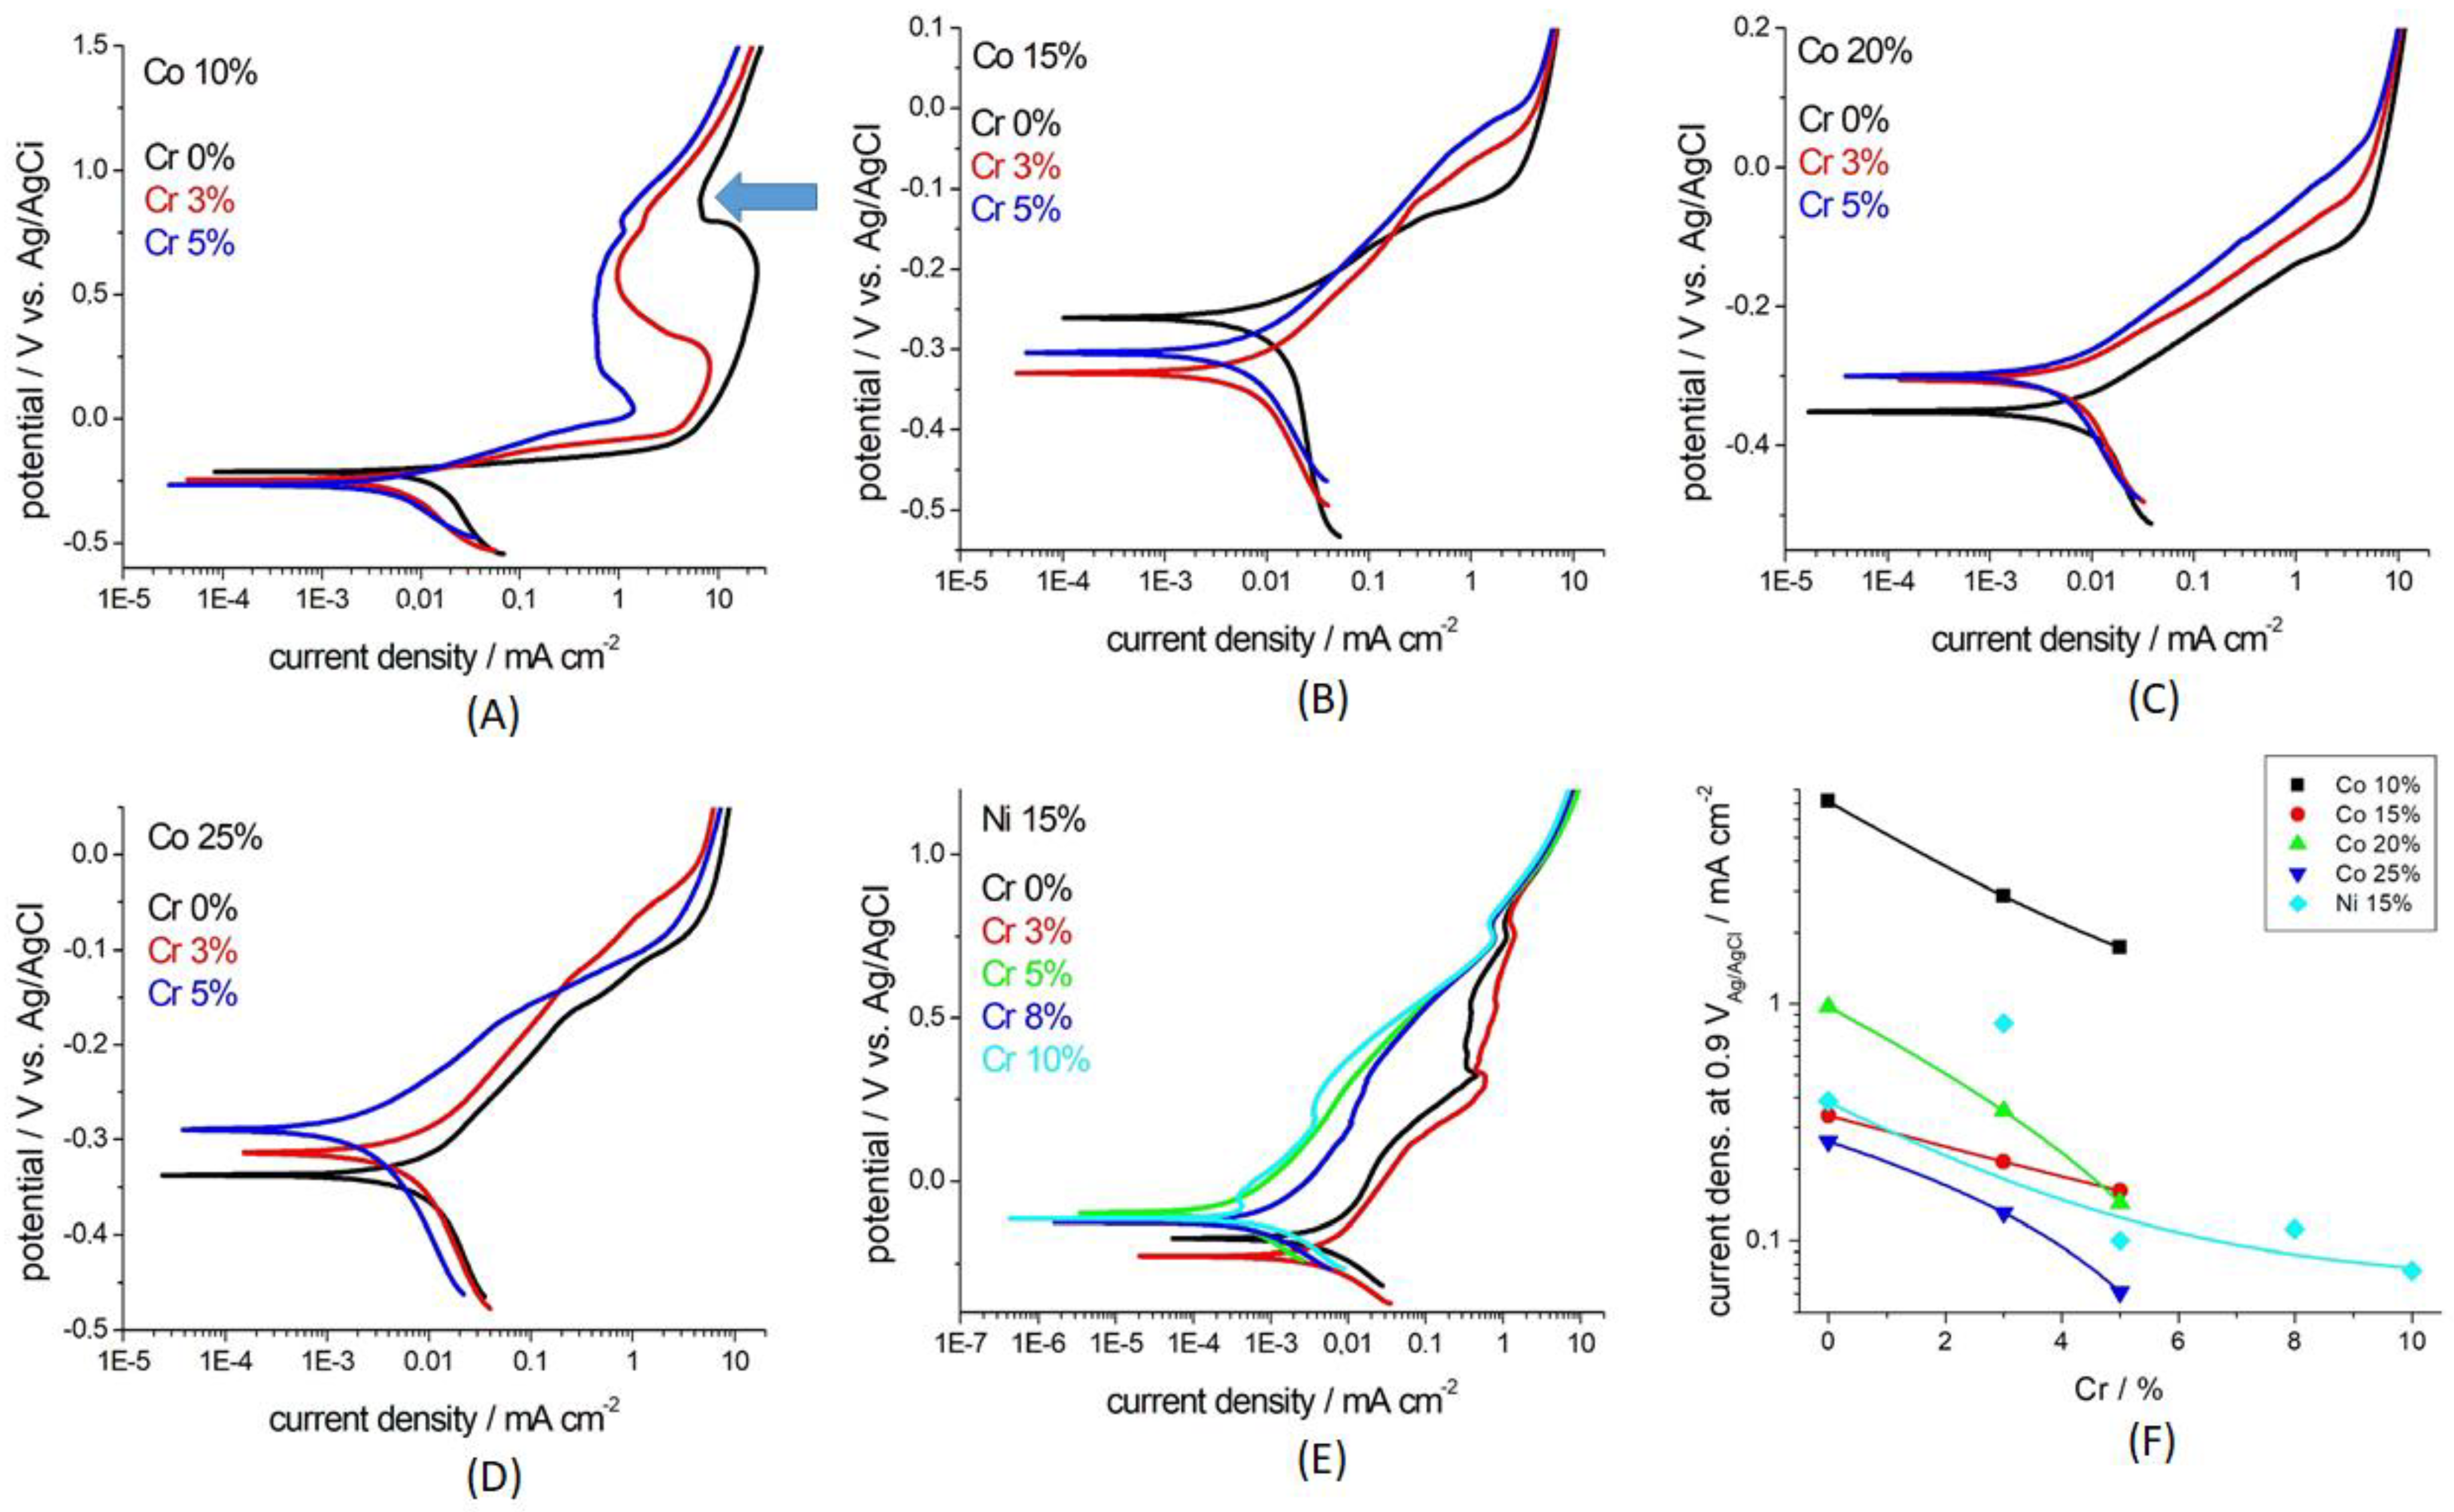
3.2.2. Impact of Systematic Variations of Cr Content
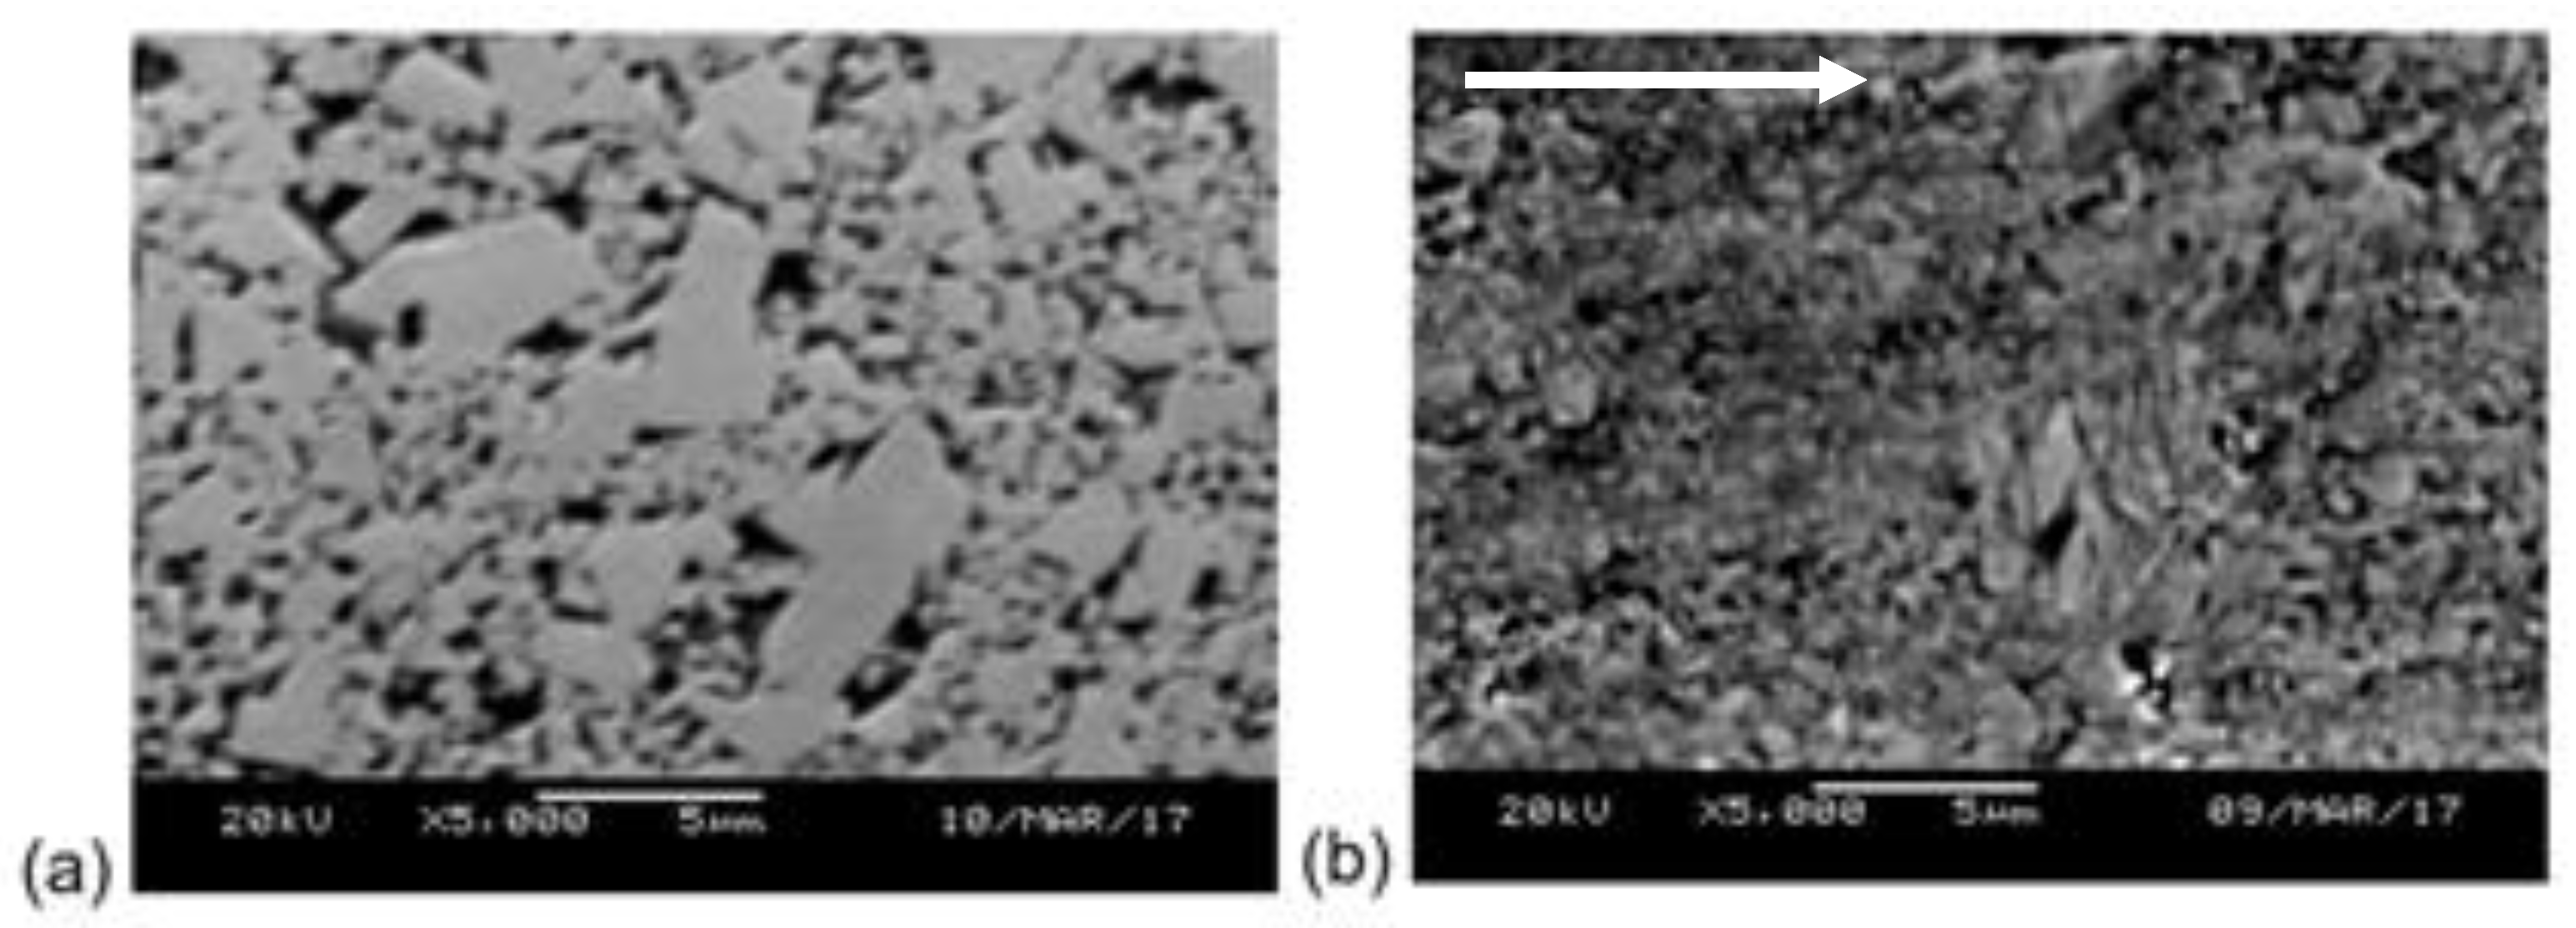
3.3. Abrasion–Corrosion Behaviour
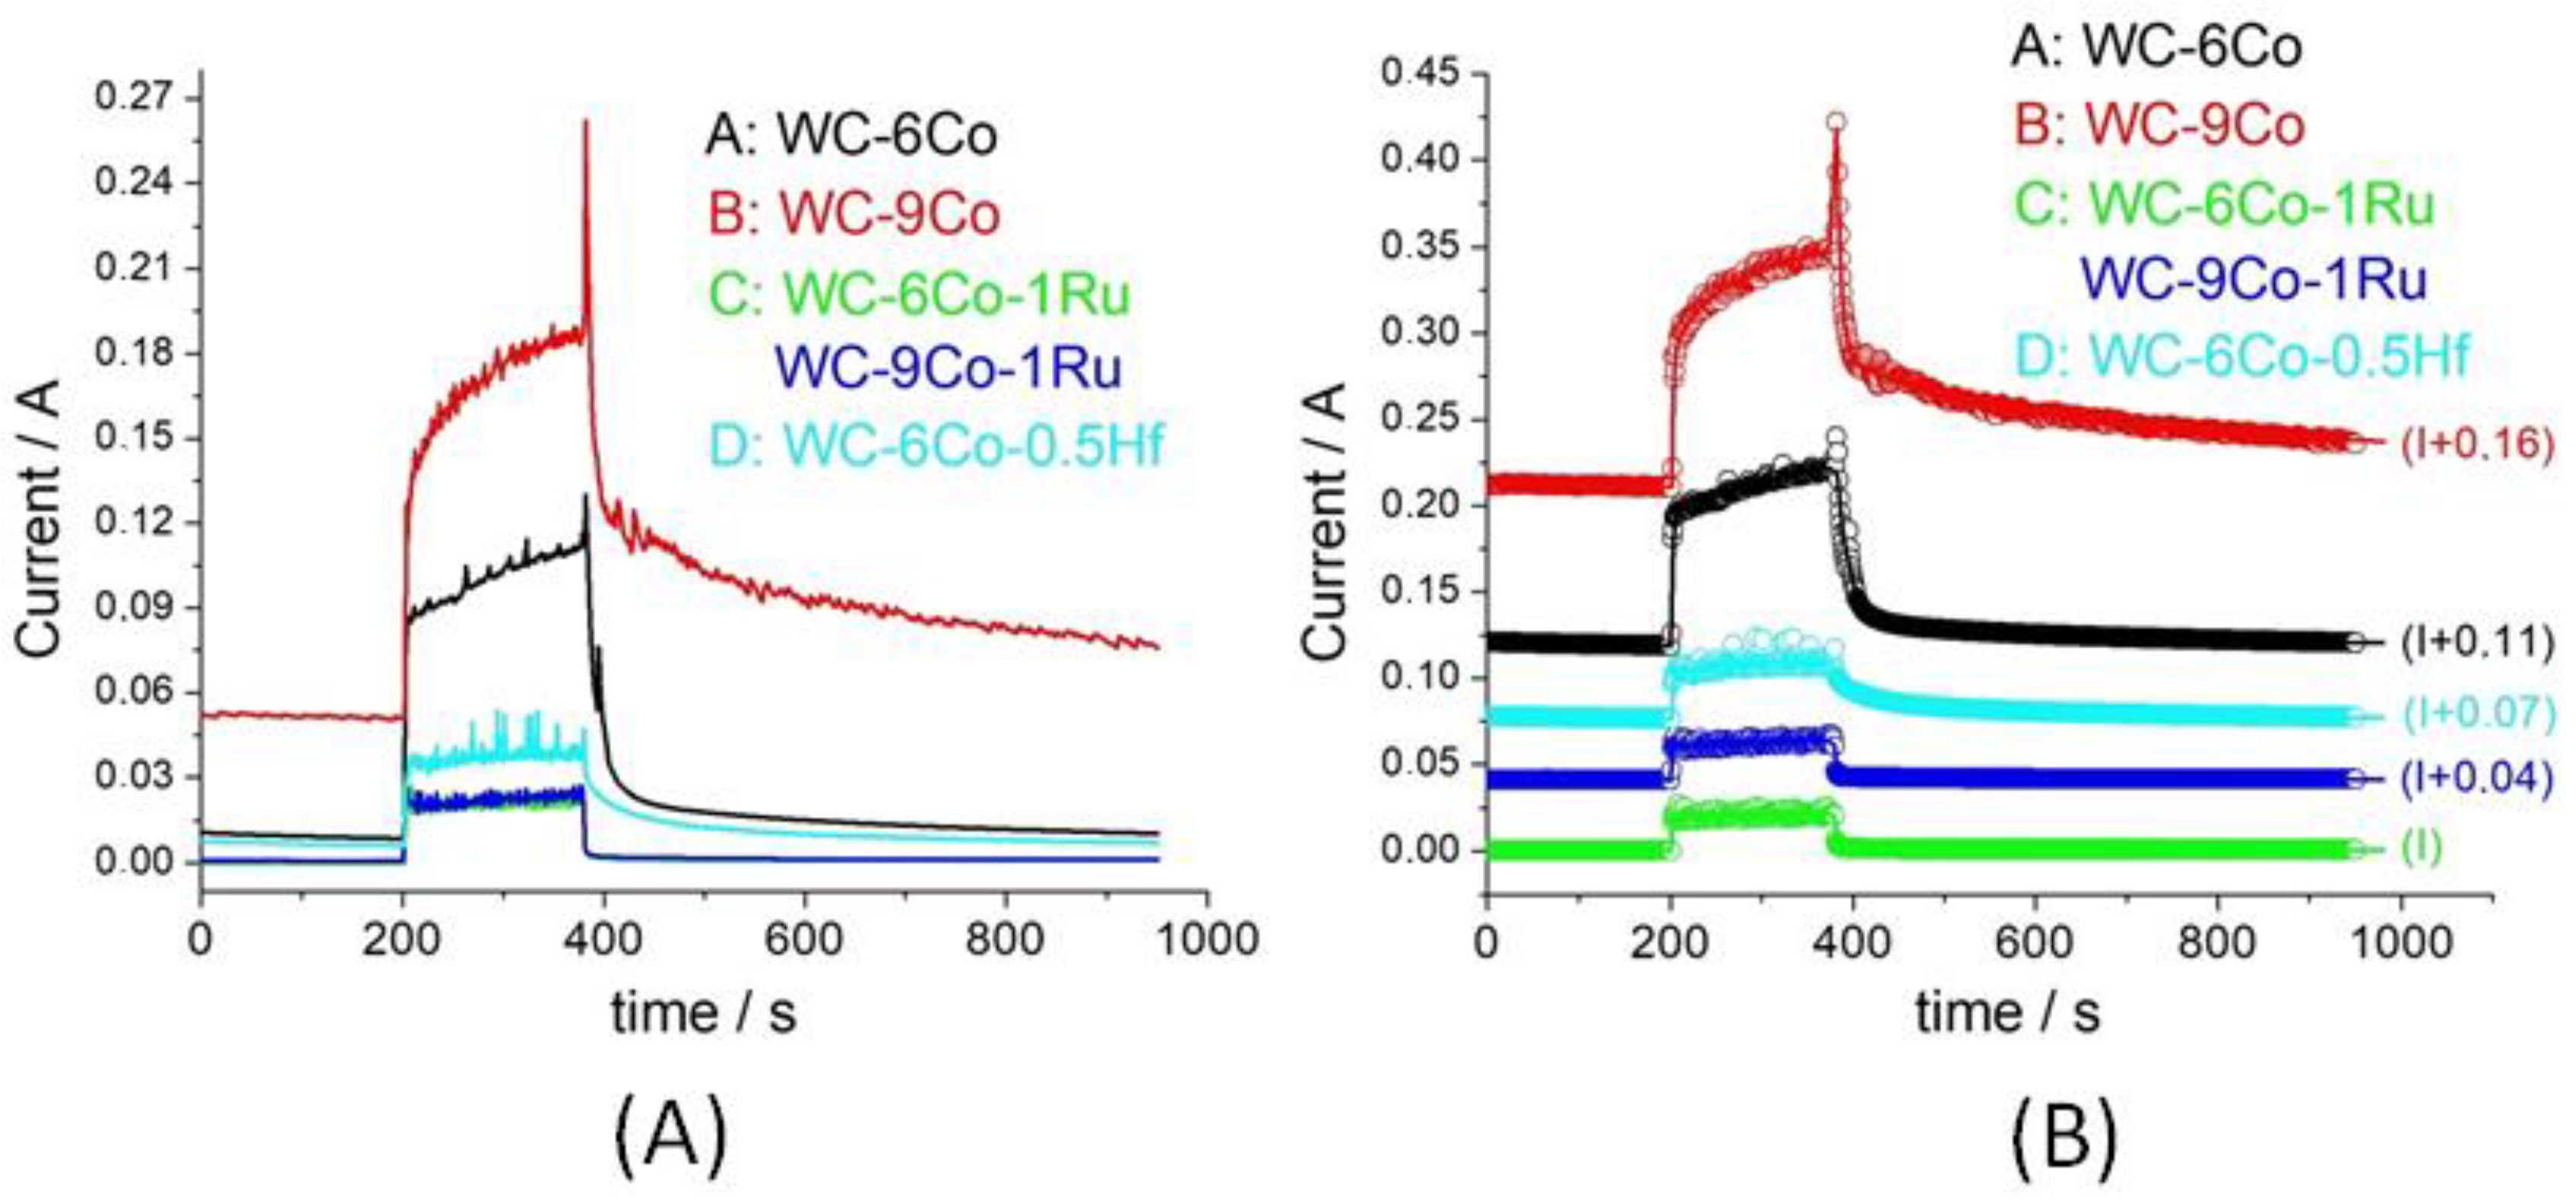
3.3.1. Co- and Ni-Based Grades with Cr, Hf and Ru Addition
3.3.2. Impact of Systematic Variations of Cr Content
4. Conclusions
Author Contributions
Funding
Data Availability Statement
Conflicts of Interest
References
- Ettmayer, P.; Kolaska, H.; Ortner, H.M. History of Hardmetals. In Comprehensive Hard Materials—Hardmetals, Ceramics, Super Hard Materials; Mari, D., Llanes, L., Nebel, C.E., Eds.; Elsevier: Amsterdam, The Netherlands, 2014. [Google Scholar]
- Wright, I.G.; Shetty, D.K.; Clauer, A.H. A comparison of the slurry erosion behaviour of WC-Co cermets and ceramics. In Proceedings of the Conference 11th International Plansee Seminar, Reutte, Austria, 20–24 May 1985; Bildstein, H., Ortner, H., Eds.; Plansee Metalwerke: Reutte, Austria, 1985; Volume 2, p. 643. [Google Scholar]
- Gee, M.G.; Gant, A.J.; Roebuck, B.; Mingard, K.P. Wear of Hardmetals. In Comprehensive Hard Materials—Hardmetals, Ceramics, Super Hard Materials; Mari, D., Llanes, L., Nebel, C.E., Eds.; Elsevier: Amsterdam, The Netherlands, 2014. [Google Scholar]
- De Gaudenzi, G.P.; Bozzini, B. Meccanismi di corrosione del metallo duro. Metall. Ital. 2017, 11, 39. [Google Scholar]
- De Gaudenzi, G.P.; Amati, M.; Gianoncelli, A.; Gregoratti, L.; Kiskinova, M.; Kourousias, G.; Tedeschi, S.; Bozzini, B. The spatial organization of corrosion products at the hardmetal/environment interface. In Proceedings of the 20th International Plansee Seminar, Reutte, Austria, 30 May–3 June 2022; Wex, K., Kestler, H., Pilz, A., Eds.; Plansee Group Functions Austria GmbH: Reutte/Tyrol, Austria, 2022. [Google Scholar]
- Mischler, S.; Debaud, S.; Landolt, D. Wear-Accelerated Corrosion of Passive Metals in Tribocorrosion Systems. J. Electrochem. Soc. 1998, 145, 750. [Google Scholar] [CrossRef]
- Mischler, S.; Spiegel, A.; Landolt, D. The role of passive oxide films on the degradation of steel in tribocorrosion systems. Wear 1999, 225, 1078–1087. [Google Scholar] [CrossRef]
- Mischler, S.; Spiegel, A.; Stemp, M.; Landolt, D. Influence of passivity on the tribocorrosion of carbon steel in aqueous solutions. Wear 2001, 251, 1295. [Google Scholar] [CrossRef]
- Landolt, D.; Mischler, S.; Stemp, M. Electrochemical methods in tribocorrosion: A critical appraisal. Electrochim. Acta 2001, 46, 3913. [Google Scholar] [CrossRef]
- Wood, R.J.K.; Sun, D.; Thakare, M.R.; de Frutos Rozas, A.; Wharton, J.A. Interpretation of electrochemical measurements made during micro-scale abrasion-corrosion. Tribol. Int. 2010, 43, 1218. [Google Scholar] [CrossRef]
- Thakare, M.R.; Wharton, J.A.; Wood, R.J.K.; Menger, C. Exposure effects of alkaline drilling fluid on the microscale abrasion–corrosion of WC-based hardmetals. Wear 2007, 263, 125. [Google Scholar] [CrossRef]
- Spriggs, G.E. A history of fine grained hardmetal. Int. J. Refract. Met. Hard Mater. 1995, 13, 241. [Google Scholar] [CrossRef]
- Exner, H.E.; Gurland, J. A review of parameters influencing some mechanical properties of tungsten carbide–cobalt alloys. Powder Metall. 1970, 13, 13–31. [Google Scholar] [CrossRef]
- Tracey, V.A.; Hall, N.R.V. Nickel matrices in cemented carbides. Powder Metall. Int. 1980, 12, 132. [Google Scholar]
- Ekemar, S.; Lindholm, L.; Hartzell, T. Nickel as a binder in WC-based cemented carbides. Int. J. Refract. Met. Hard Mater. 1982, 3, 37. [Google Scholar]
- Adorjan, A.; Schubert, W.; Schön, A.; Bock, A.; Zeiler, B. WC grain growth during the early stages of sintering. Int. J. Refract. Met. Hard Mater. 2006, 24, 365. [Google Scholar] [CrossRef]
- Garcia, J.; Ciprés, V.C.; Blomqvist, A.; Kaplan, B. Cemented carbide microstructures: A review. Int. J. Refract. Met. Hard Mater. 2019, 80, 40. [Google Scholar] [CrossRef]
- Warbichler, P.; Hofer, F.; Grogger, W.; Lackner, A. EFTEM-EELS characterization of VC and Cr3C2 doped cemented carbides. In Proceedings of the 15th International Plansee Seminar, Reutte, Austria, May 2001; Kneringer, G., Rodhammer, P., Wildner, H., Eds.; Plansee AG: Reutte, Austria, 2001; Volume 2, p. 65. [Google Scholar]
- Delanoe, A.; Lay, S. Evolution of the WC grain shape in WC–Co alloys during sintering: Cumulated effect of the Cr addition and of the C content. Int. J. Refract. Met. Hard Mater. 2009, 27, 189. [Google Scholar] [CrossRef] [Green Version]
- Llanes, L.; Casas, B.; Idañez, E.; Marsal, M.; Anglada, M. Surface Integrity Effects on the Fracture Resistance of Electrical-Discharge-Machined WC–Co Cemented Carbides. J. Am. Ceram. Soc. 2004, 87, 1687–1693. [Google Scholar] [CrossRef]
- Human, A.M.; Roebuck, B.; Exner, H.E. Electrochemical polarisation and corrosion behaviour of cobalt and Co(W,C) alloys in 1 N sulphuric acid. Mater. Sci. Eng. A 1998, 241, 202. [Google Scholar] [CrossRef]
- Bozzini, B.; Busson, B.; de Gaudenzi, G.P.; Humbert, C.; Mele, C.; Tedeschi, S.; Tadjeddine, A. Corrosion of cemented carbide grades in petrochemical slurries. Part I—Electrochemical adsorption of CN−, SCN− and MBT: A study based on in situ SFG. Int. J. Refract. Met. Hard Mater. 2016, 60, 37. [Google Scholar] [CrossRef]
- Santos, R.F.; Rocha, A.M.F.; Bastos, A.C.; Cardoso, J.P.; Rodrigues, F.; Fernandes, C.M.; Sacramento, J.; Ferreira, M.G.S.; Senos, A.M.R.; Fonseca, C.; et al. The effect of Cr content on the corrosion resistance of WC-Ni-Cr-Mo composites. Int. J. Refract. Met. Hard Mater. 2021, 95, 105434. [Google Scholar] [CrossRef]
- Motitschka, R.; Ettmayer, P.; Kny, E. Constitution of the Systems Co-Cr-W-C and Ni-Cr-W-C in the Cobalt and Nickel Corner. In Proceedings of the 12th International Plansee Seminar, Reutte, Tirol, Austria, 8–12 May 1989; Bildstein, H., Ortner, H.M., Eds.; Metallwerk Plansee GmbH: Reutte, Austria, 1989; Volume 2, p. 863. [Google Scholar]
- Zackrisson, J.; Jansson, B.; Uphadyaya, G.S.; Andrén, H.-O. WC-Co based cemented carbides with large Cr3C2 additions. Int. J. Refract. Met. Hard Mater. 1998, 16, 417. [Google Scholar] [CrossRef]
- Markström, A.; Norgren, S.; Frisk, K.; Jansson, B.; Sterneland, T. Experimental and thermodynamic evaluation of the Co-Cr-C system. Int. J. Mater. Res. 2006, 97, 1243. [Google Scholar] [CrossRef]
- Kaplan, B.; Norgren, S.; Schwind, M.; Selleby, M. Thermodynamic calculations and experimental verification in the WC-Co-Cr cemented carbide system. Int. J. Refract. Met. Hard Mater. 2015, 48, 257. [Google Scholar] [CrossRef]
- De Calderon, R.; Edtmaier, C.; Schubert, W.-D. Novel binders for WC-based cemented carbides with high Cr contents. Int. J. Refract. Met. Hard Mater. 2019, 85, 105063. [Google Scholar] [CrossRef]
- Steinlechner, R.; de Oro Calderon, R.; Koch, T.; Linhardt, P.; Schubert, W.D. A study on WC-Ni cemented carbides: Constitution, alloy compositions and properties, including corrosion behaviour. Int. J. Refract. Met. Hard Mater. 2022, 103, 105750. [Google Scholar] [CrossRef]
- Lisovskii, A.F. Cemented carbides alloyed with ruthenium, osmium and rhenium. Powder Metall. Met. Ceram. 2000, 39, 428. [Google Scholar] [CrossRef]
- Shing, T.L.; Luyckx, S.; Northrop, I.T.; Wolff, I. The effect of ruthenium additions on the hardness, toughness and grain size of WC-Co. Int. J. Refract. Met. Hard Mater. 2001, 19, 41. [Google Scholar] [CrossRef]
- Bonjour, C.; Actis-Data, A. Effects of ruthenium additions on the properties of WC-Co ultra micrograins. In Proceedings of the Conference Euro PM2004, Vienna, Austria, 17–21 October 2004; EPMA: Shewsbury, UK, 2004; Volume 3. [Google Scholar]
- Ettmayer, P. Hardmetals and cermets. Annu. Rev. Mater. Sci. 1989, 19, 145. [Google Scholar] [CrossRef]
- Gant, A.J.; Gee, M.G.; Roebuck, B. Rotating wheel abrasion of WC/Co hardmetals. Wear 2005, 258, 178. [Google Scholar] [CrossRef]
- Kim, C.-S. Microstructural-Mechanical Properties Relationship in WC-Co Composites. Ph.D. Thesis, Carnegie Mellon University, Pittsburgh, PA, USA, 2004. [Google Scholar]
- Frisk, K.; Markström, A. Effect of Cr and V on phase equilibria in Co–WC based hardmetals. Int. J. Mater. Res. 2008, 99, 287. [Google Scholar] [CrossRef]
- ISO 4499–2:2008; Hardmetals—Metallographic Determination of Microstructure—Part 2: Measurement of WC Grain Size. ISO: Geneva, Switzerland, 2008.
- Bozzini, B.; Gianoncelli, A.; Kourousias, G.; Boniardi, M.; Casaroli, A.; Zilio, S.D.; Hussain, R.; Abyaneh, M.K.; Kiskinova, M.; Mele, C.; et al. The role of chromium in the corrosion performance of cobalt- and cobalt-nickel based hardmetal binders: A study centred on X-ray absorption microspectroscopy. Int. J. Refract. Met. Hard Mater. 2020, 92, 105320. [Google Scholar] [CrossRef]


| Material | Metallic Binder | Additive Carbide | [MB] (wt%) | WC Grain Size | Density (×103 kg m−3) | Hardness (HV30) | MMS (%) | TRS (MPa) | PT (MN m−3/2) |
|---|---|---|---|---|---|---|---|---|---|
| A | Co | - | 8 | s | 14.72 ± 0.02 | 1679 ± 9 | 89 ± 1 | 3410 ± 90 | 9.5 ± 0.4 |
| A1 | Co | - | 6 | m | 14.91 ± 0.03 | 1442 ± 15 | 87 ± 1 | 3345 ± 76 | 11.8 ± 0.5 |
| B1 | Co | - | 9 | m | 14.58 ± 0.02 | 1291 ± 12 | 88 ± 1 | 3379 ± 112 | 18.2 ± 0.4 |
| B | Co | - | 10 | m | 14.46 ± 0.02 | 1398 ± 15 | 87 ± 1 | 3213 ± 64 | 18.0 ± 0.3 |
| C | Co | - | 15 | m | 14.02 ± 0.01 | 1256 ± 19 | 90 ± 1 | 3248 ± 99 | >20 |
| D | CoNiCr | - | 15 | m | 13.98 ± 0.02 | 1246 ± 7 | 86 ± 1 | 3137 ± 121 | >20 |
| E | NiCr | - | 8 | f | 14.69 ± 0.02 | 1400 ± 18 | - | 3118 ± 107 | 11.8 ± 0.3 |
| C1 | Co15Ru | - | 6 | m | 14.85 ± 0.02 | 1530 ± 13 | 77 ± 1 | 3276 ± 124 | 10.6 ± 0.4 |
| D1 | Co | 0.5HfC | 6 | m | 14.82 ± 0.02 | 1490 ± 14 | 90 ± 1 | 3176 ± 94 | 9.7 ± 0.5 |
| E1 | Alloyed Ni | - | 9 | m | 14.45 ± 0.03 | n.d. | - | n.d. | n.d. |
| Batch | [Binder Base] | [Cr]binder | [Cr]HM | Density | Coercivity Hc | Specific Magnetic Moment at Saturation σs | Abrasion Resistance (See Text) A |
|---|---|---|---|---|---|---|---|
| m% | m% | m% | ×103 kg m−3 | kA m−1 | 10−7 T m3 kg−1 | 10−11 m3 r−1 | |
| 584 | Co 10 | 0 | 0 | 14.51 ± 0.02 | 8.28 ± 0.80 | 11.3 ± 0.2 | 22.7 ± 4.8 |
| 585 | Co 10 | 3 | 0.3 | 14.46 ± 0.02 | 9.23 ± 0.72 | 10.4 ± 0.1 | 17.0 ± 4.3 |
| 586 | Co 10 | 5 | 0.5 | 14.44 ± 0.02 | 10.03 ± 0.79 | 9.6 ± 0.1 | 14.1 ± 4.7 |
| 587 | Co 15 | 0 | 0 | 14.02 ± 0.02 | 5.77 ± 0.59 | 11.5 ± 0.2 | 54.1 ± 5.6 |
| 588 | Co 15 | 3 | 0.45 | 13.96 ± 0.01 | 6.84 ± 0.63 | 11.4 ± 0.2 | 43.6 ± 3.7 |
| 589 | Co 15 | 5 | 0.75 | 13.91 ± 0.02 | 7.16 ± 0.65 | 10.4 ± 0.2 | 38.1 ± 4.6 |
| 590 | Co 20 | 0 | 0 | 13.54 ± 0.01 | 4.91 ± 0.53 | 12 ± 0.2 | 91.0 ± 6.1 |
| 591 | Co 20 | 3 | 0.6 | 13.48 ± 0.02 | 5.71 ± 0.55 | 10.8 ± 0.2 | 79.7 ± 1.8 |
| 592 | Co 20 | 5 | 1.0 | 13.41 ± 0.02 | 5.78 ± 0.60 | 10.5 ± 0.2 | 69.0 ± 7.3 |
| 605 | Co 20 | 8 | 1.6 | 13.32 ± 0.02 | 4.51 ± 0.51 | 10.3 ± 0.1 | - |
| 606 | Co 20 | 10 | 2.0 | 13.29 ± 0.02 | 4.98 ± 0.40 | 10.1 ± 0.1 | - |
| 593 | Co 25 | 0 | 0 | 13.10 ± 0.01 | 3.69 ± 0.37 | 12.4 ± 0.2 | 99.4 ± 2.9 |
| 594 | Co 25 | 3 | 0.75 | 13.01 ± 0.02 | 4.40 ± 0.41 | 11.2 ± 0.2 | 92.7 ± 3.8 |
| 595 | Co 25 | 5 | 1.25 | 12.95 ± 0.02 | 4.81 ± 0.48 | 11.4 ± 0.2 | 89.0 ± 4.1 |
| 596 | Ni 15 | 0 | 0 | 14.05 ± 0.03 | - | - | 82.7 ± 2.5 |
| 597 | Ni 15 | 3 | 0.45 | 13.95 ± 0.03 | - | - | 76.2 ± 2.9 |
| 598 | Ni 15 | 5 | 0.75 | 13.89 ± 0.03 | - | - | 78.1 ± 2.6 |
| 599 | Ni 15 | 8 | 1.2 | 13.79 ± 0.02 | - | - | 73.1 ± 2.7 |
| 600 | Ni 15 | 10 | 1.5 | 13.75 ± 0.02 | - | - | 68.7 ± 1.0 |
| 607 | Ni 15 | 12 | 1.8 | 13.87 ± 0.03 | - | - | - |
| 608 | Ni 15 | 15 | 2.25 | 13.82 ± 0.03 | - | - | - |
| Current growth | τ↑1 Fast component associated with the mechanical removal of the PPF. |
| τ↓1 Slow component associated with the mechanical damaging of the bare composite. | |
| Current decay | τ↑2 Fast component associated with the build-up of the surface coverage with the PPF. |
| τ↓2 Slow component associated with the growth of the resistive film. |
| Material | A | B | C | D | E |
|---|---|---|---|---|---|
| Weight loss | 1.2678 | 4.1363 | 9.6851 | 5.9901 | 3.8484 |
| Wear volume | 0.0862 | 0.2853 | 0.6918 | 0.4279 | 0.2618 |
| WC-xCo | WC-xCo-1Ru | WC-xCo-0.5Hf | WC-9Nialloyed | |
|---|---|---|---|---|
| x = 6 | −0.220 ± 0.006 V (samp. A1) | −0.100 ± 0.005 V (samp. C1) | −0.305 ± 0.001 V (samp. D1) | - |
| x = 9 | −0.275 V (samp. B1) | −0.110 ± 0.006 V | −0.331 ± 0.014 V | −0.081 ± 002 V (samp. E1) |
| x = 12 | −0.312 ± 0.007 V | - | - | - |
| A | B | C | D | E | |
|---|---|---|---|---|---|
| 1st | 0.170 ± 0.010 + parabola | 7.603 ± 1.024 + line | fast rise + line | 0.203 ± 0.001 + line | 0.2 + parabola |
| 2nd | 0.222 ± 0.003 0.934 ± 0.044 | 0.065 ± 002 1.139 ± 0.052 | 0.246 ± 0.007 8.165 ± 1.101 | 0.326 ± 0.003 1.922 ± 0.034 | 0.245 ± 0.001 2.574 ± 0.147 |
| 3rd | 0.183 ± 0.008 + parabola | 6.314 ± 3.173 | fast rise + line | 0.154 ± 0.002 | 0.173 ± 0.002 + line |
| 4th | 0.255 ± 0.083 + parabola | 0.028 ± 0.002 0.886 ± 0.027 56.77 ± 3.07 | 0.023 ± 0.001 1.198 ± 0.288 8.401 ± 1.103 | 0.164 ± 0.002 0.988 ± 0.667 50.58 ± 9.49 | 0.134 ± 0.003 43.52 ± 27.76 |
| 5th | 0.188 ± 0.001 2.628 ± 0.057 | 0.093 ± 0.002 6,448 ± 0.251 | 0.023 ± 0.008 0.356 ± 0.020 8.230 ± 1.558 | 0.282 ± 0.001 4.809 38.55 | 0.198 ± 0.001 3.115 ± 0.174 |
| 6th | 0.221 ± 0.002 8.756 ± 0.220 | 0.199 ± 0.029 4.014 ± 0.177 | 0.023 ± 0.002 0.734 ± 0.163 14.33 | 0.177 ± 0.000 4.726 ± 0.046 | 0.187 ± 0.001 17.17 ± 0.10 |
| 7th | 0.982 ± 0.020 40.25 ± 0.380 | 1.093 ± 0.250 173.9 ± 19.40 | 0.224 ± 0.094 20.54 ± 1.64 | 3.287 ± 0.272 22.81 ± 0.960 | 0.374 ± 0.023 128.7 ± 10.10 |
| 8th | 0.197 ± 0.001 | 0.034 ± 0.001 1.696 ± 0.027 | 0.031 ± 0.003 0.509 ± 0.112 5.425 ± 0402 | 0.218 ± 0.008 0.515 ± 0.043 6.112 ± 0.406 | 0.209 ± 0.001 3.152 ± 0.416 |
| Grade | RPP (%) | τ↑1 (s) | τ↑2 (s) | τ↓1 (s) | τ↓2 (s) |
|---|---|---|---|---|---|
| A: WC-6Co | 3.75 ± 0.34 | 1.70 ± 0.21 | 238.0 ± 11.0 | 13.13 ± 0.93 | 278.0 ± 12.0 |
| B: WC-9Co | 5.41 ± 0.67 | 2.03 ± 0.13 | 69.0 ± 7.6 | 5.096 ± 0.771 | 227.0 ± 8.0 |
| C: WC-6CoRu | 0.365 ± 0.023 | 0.97 ± 0.10 | 257.0 ± 14.0 | 0.690 ± 0.103 | 28.8 ± 1.7 |
| WC-9CoRu | 0.453 ± 0.065 | 1.12 ± 0.25 | 262.0 ± 21 | 0.739 ± 0.094 | 109 ± 8.0 |
| D: WC-6CoHf | 0.946 ± 0.134 | 0.97 ± 0.07 | 257.0 ± 12 | 24.44 ± 1.55 | 200.0 ± 7 |
Publisher’s Note: MDPI stays neutral with regard to jurisdictional claims in published maps and institutional affiliations. |
© 2022 by the authors. Licensee MDPI, Basel, Switzerland. This article is an open access article distributed under the terms and conditions of the Creative Commons Attribution (CC BY) license (https://creativecommons.org/licenses/by/4.0/).
Share and Cite
De Gaudenzi, G.P.; Tavola, F.; Tedeschi, S.; Bozzini, B. Corrosion Behaviour of Cemented Carbides with Co- and Ni-Alloy Binders in the Presence of Abrasion. Metals 2022, 12, 1914. https://doi.org/10.3390/met12111914
De Gaudenzi GP, Tavola F, Tedeschi S, Bozzini B. Corrosion Behaviour of Cemented Carbides with Co- and Ni-Alloy Binders in the Presence of Abrasion. Metals. 2022; 12(11):1914. https://doi.org/10.3390/met12111914
Chicago/Turabian StyleDe Gaudenzi, Gian Pietro, Francesco Tavola, Sandra Tedeschi, and Benedetto Bozzini. 2022. "Corrosion Behaviour of Cemented Carbides with Co- and Ni-Alloy Binders in the Presence of Abrasion" Metals 12, no. 11: 1914. https://doi.org/10.3390/met12111914