

CFD–DPM Simulation Study of the Effect of Powder Layer Thickness on the SLM Spatter Behavior

Abstract
:
1. Introduction
2. CFD–DPM Simulation Method
3. Results and Discussion
4. Conclusions
- (1)
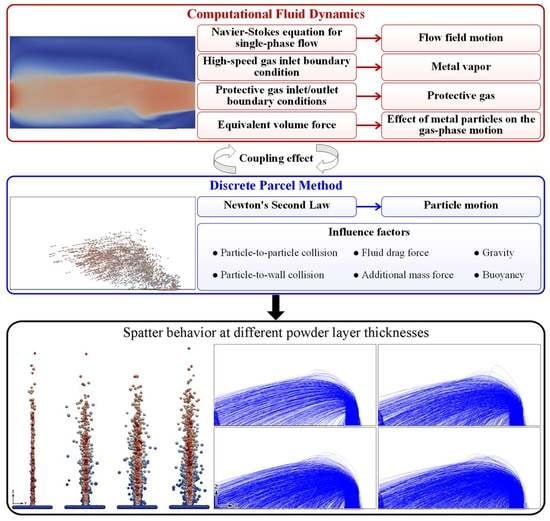
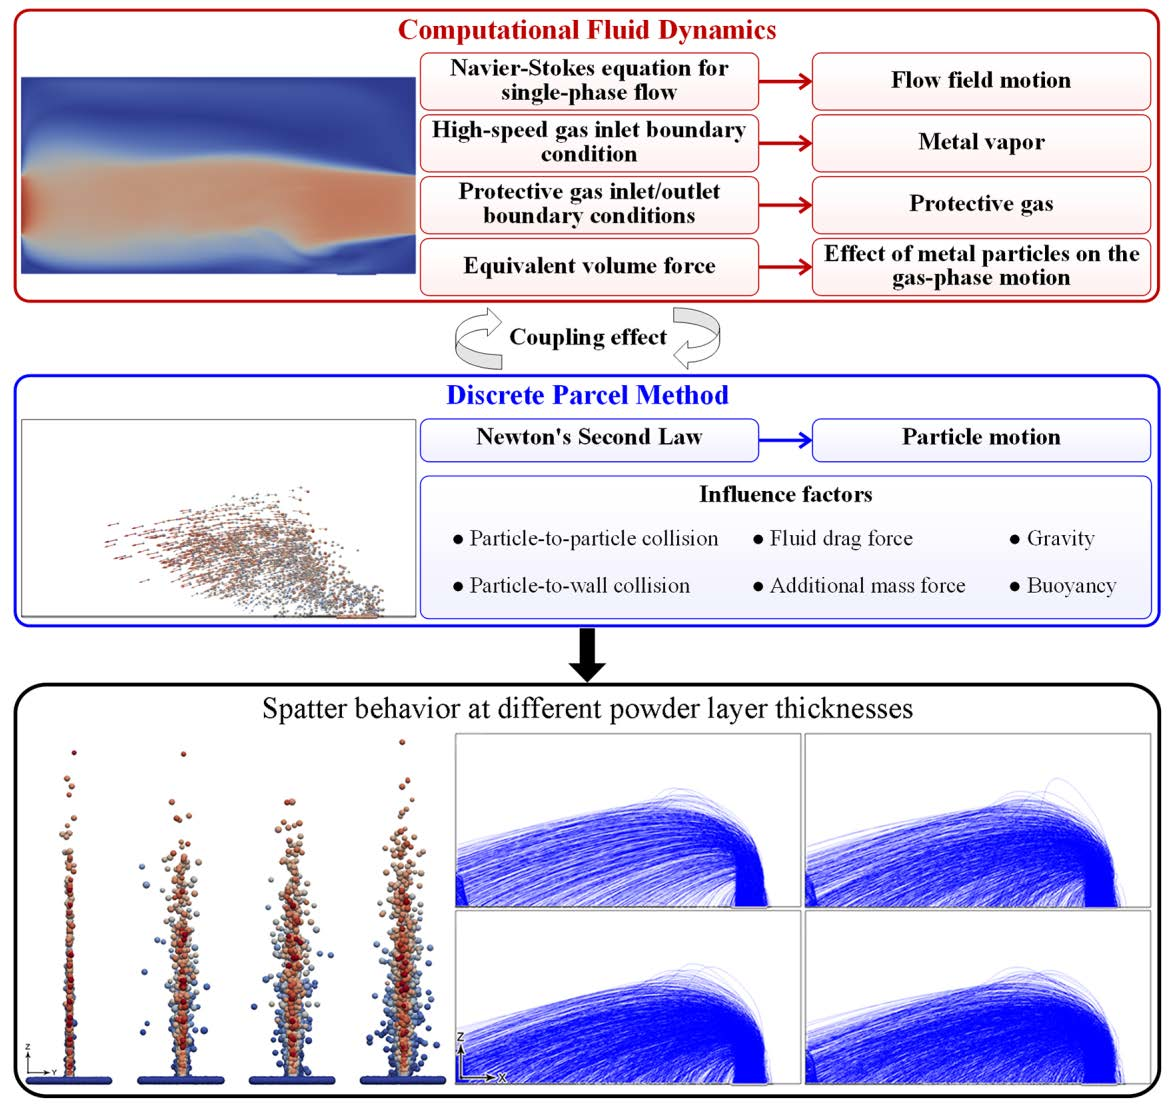
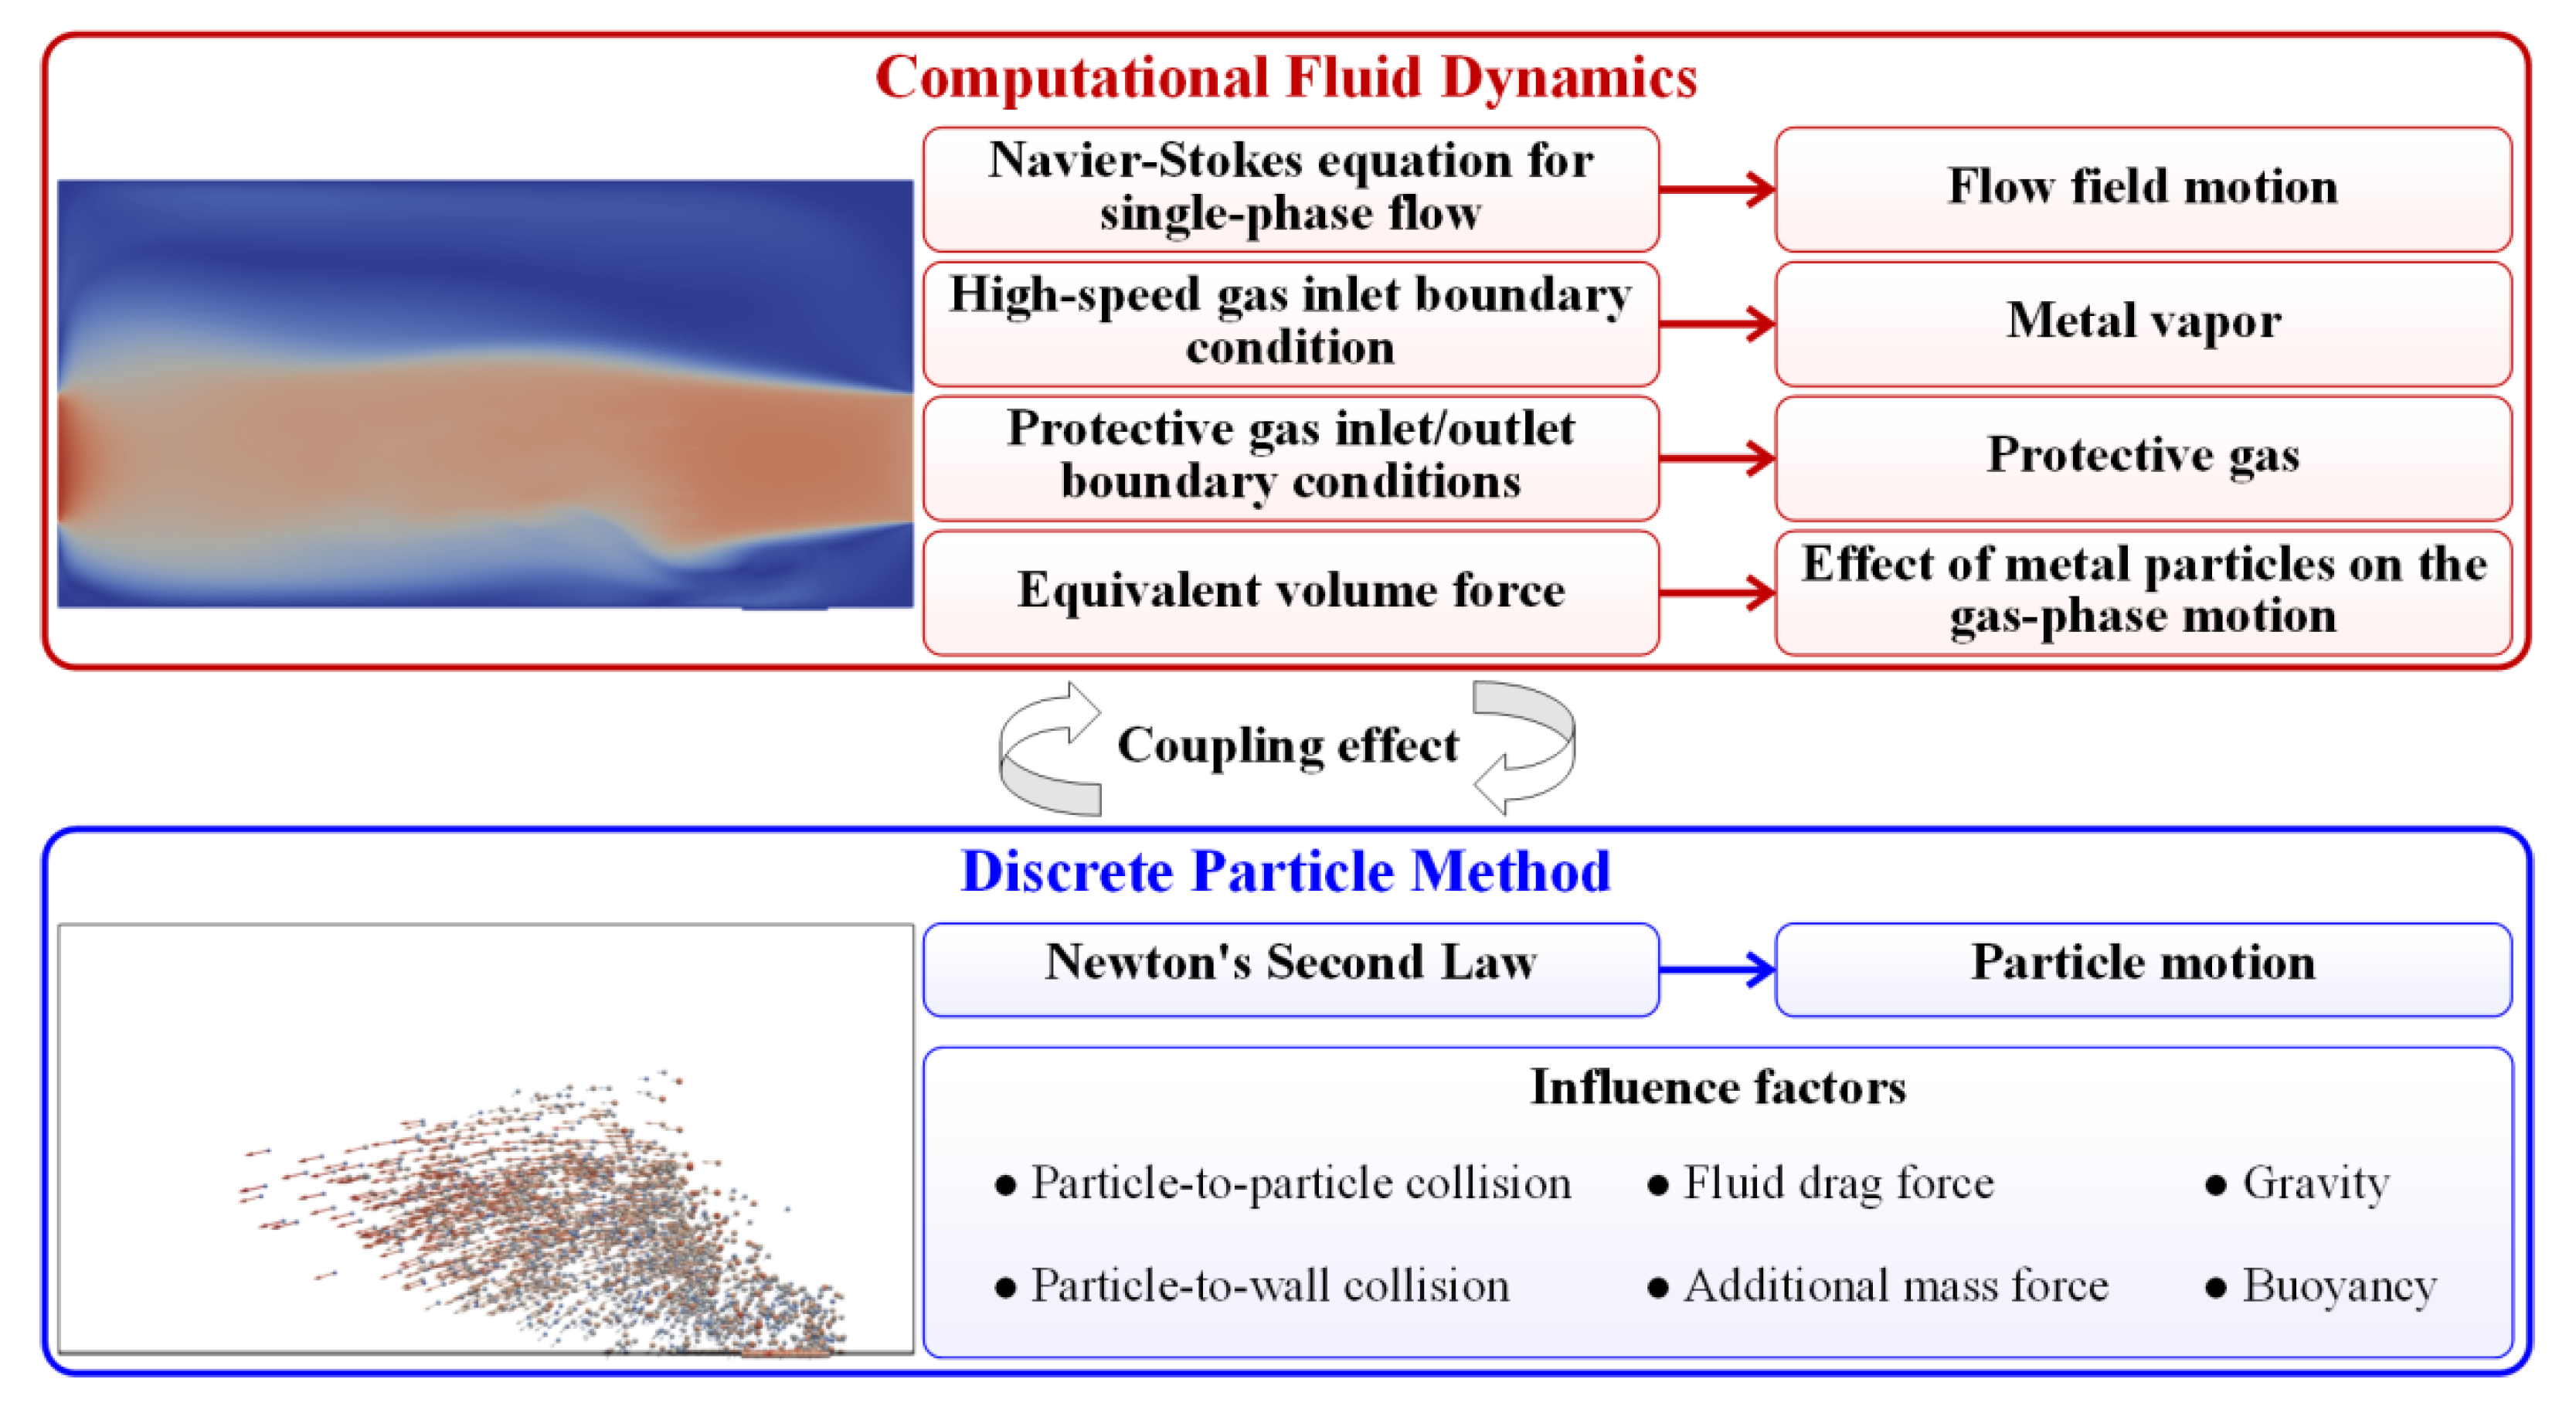
- In this paper, a study on the prediction of SLM spatter behavior is carried out based on the denseParticleFoam solver in the CFD open-source code OpenFOAM-v9, in which the single-phase flow N-S equation is used to equivalently describe the effect of metal vapor and protective gas on the flow field of the forming cavity in the Eulerian framework, and the DPM method is used to describe the metal particle motion in the Lagrangian framework. In addition, the equivalent volume force and the fluid drag force are used to characterize the interaction forces between the fluid and the particles, respectively.
- (2)
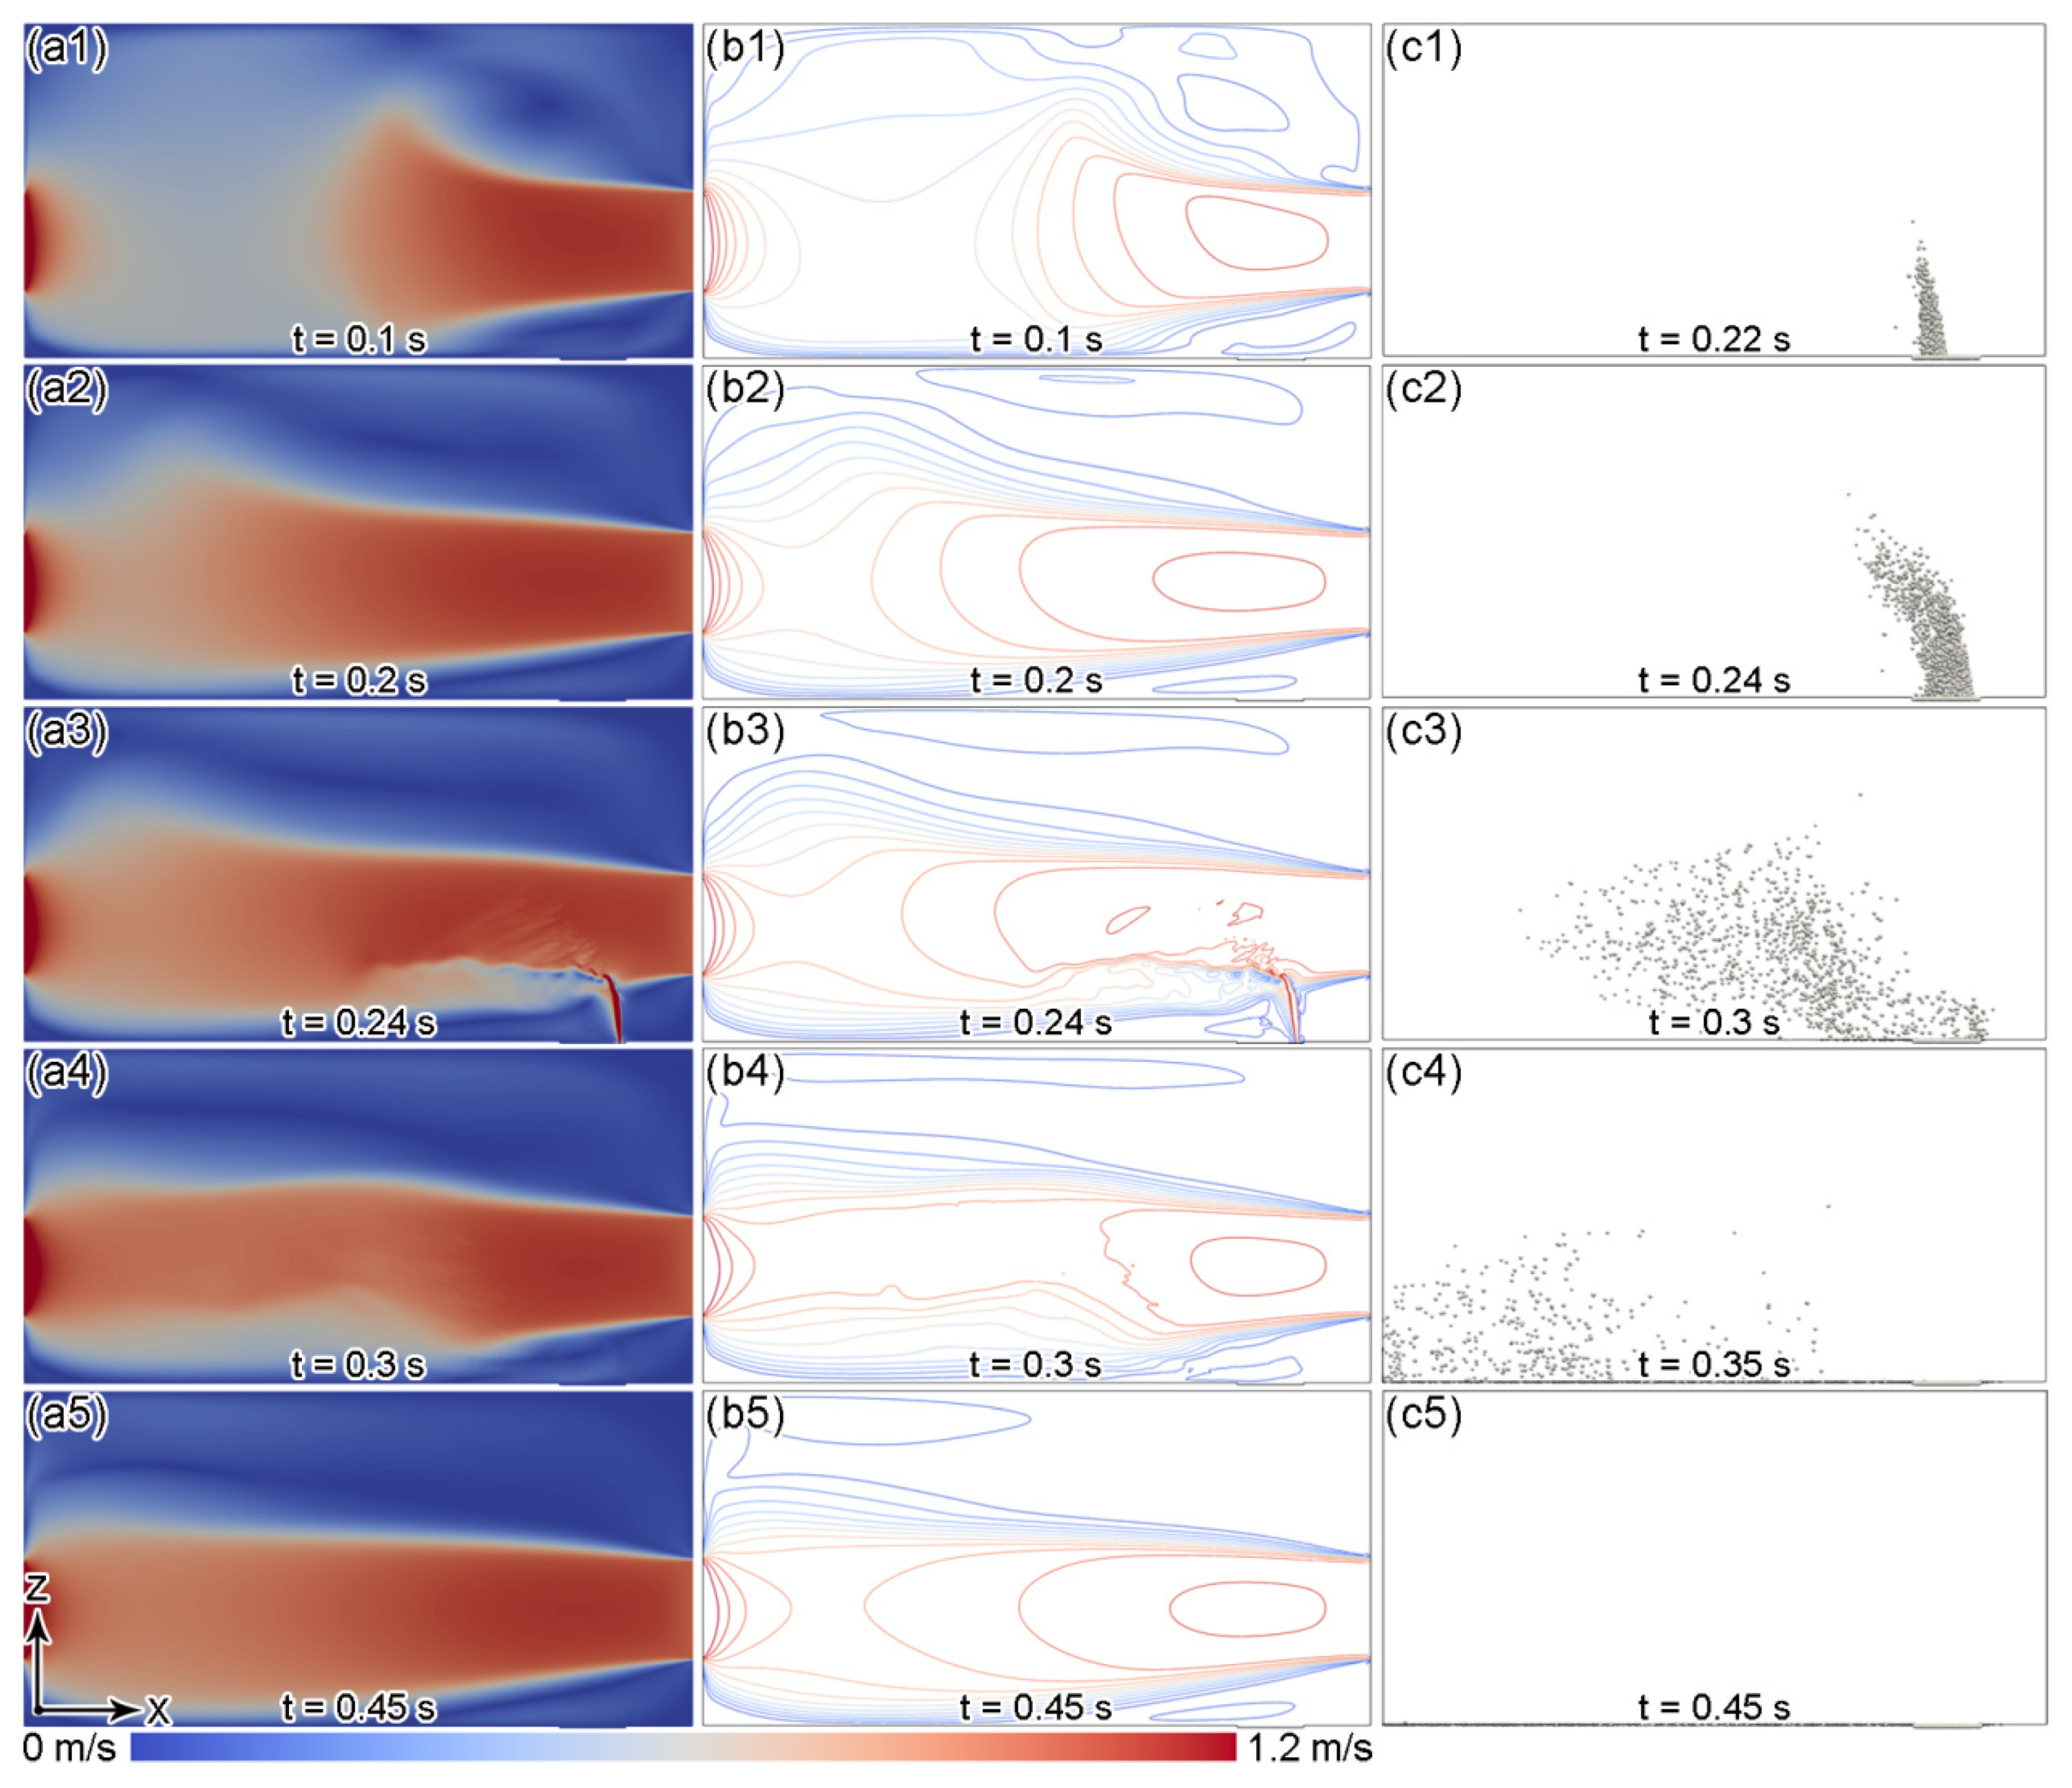
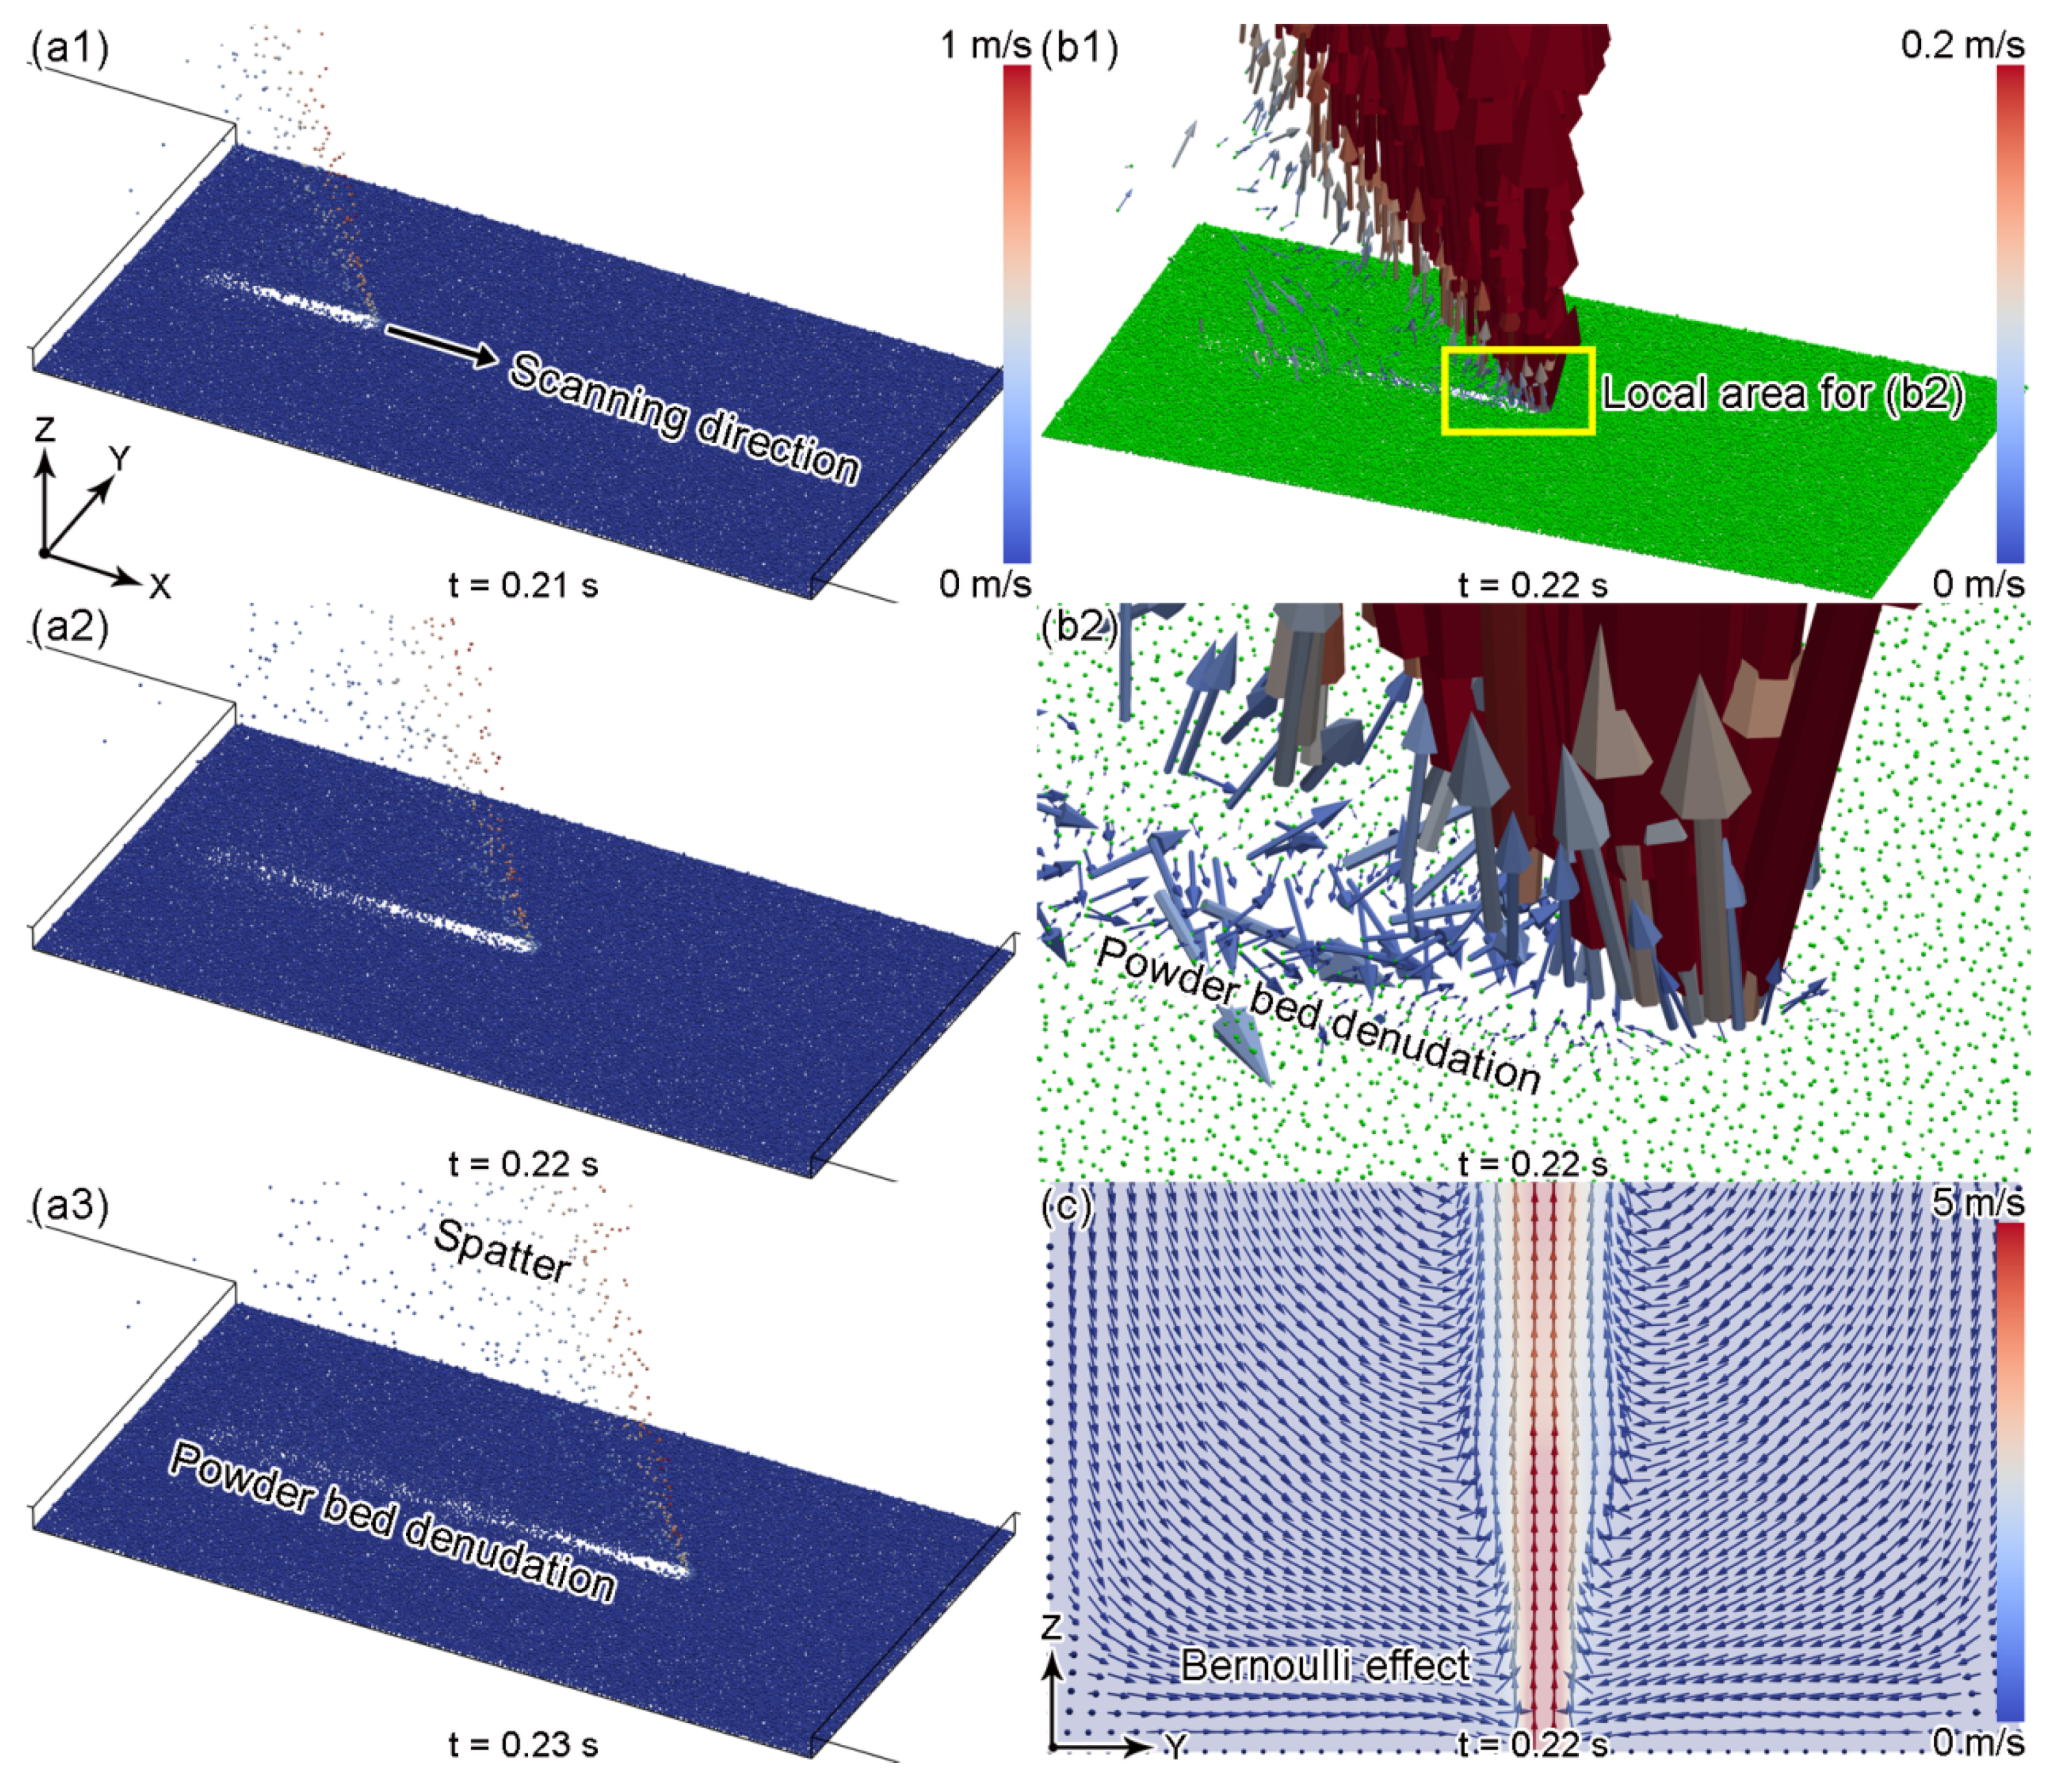
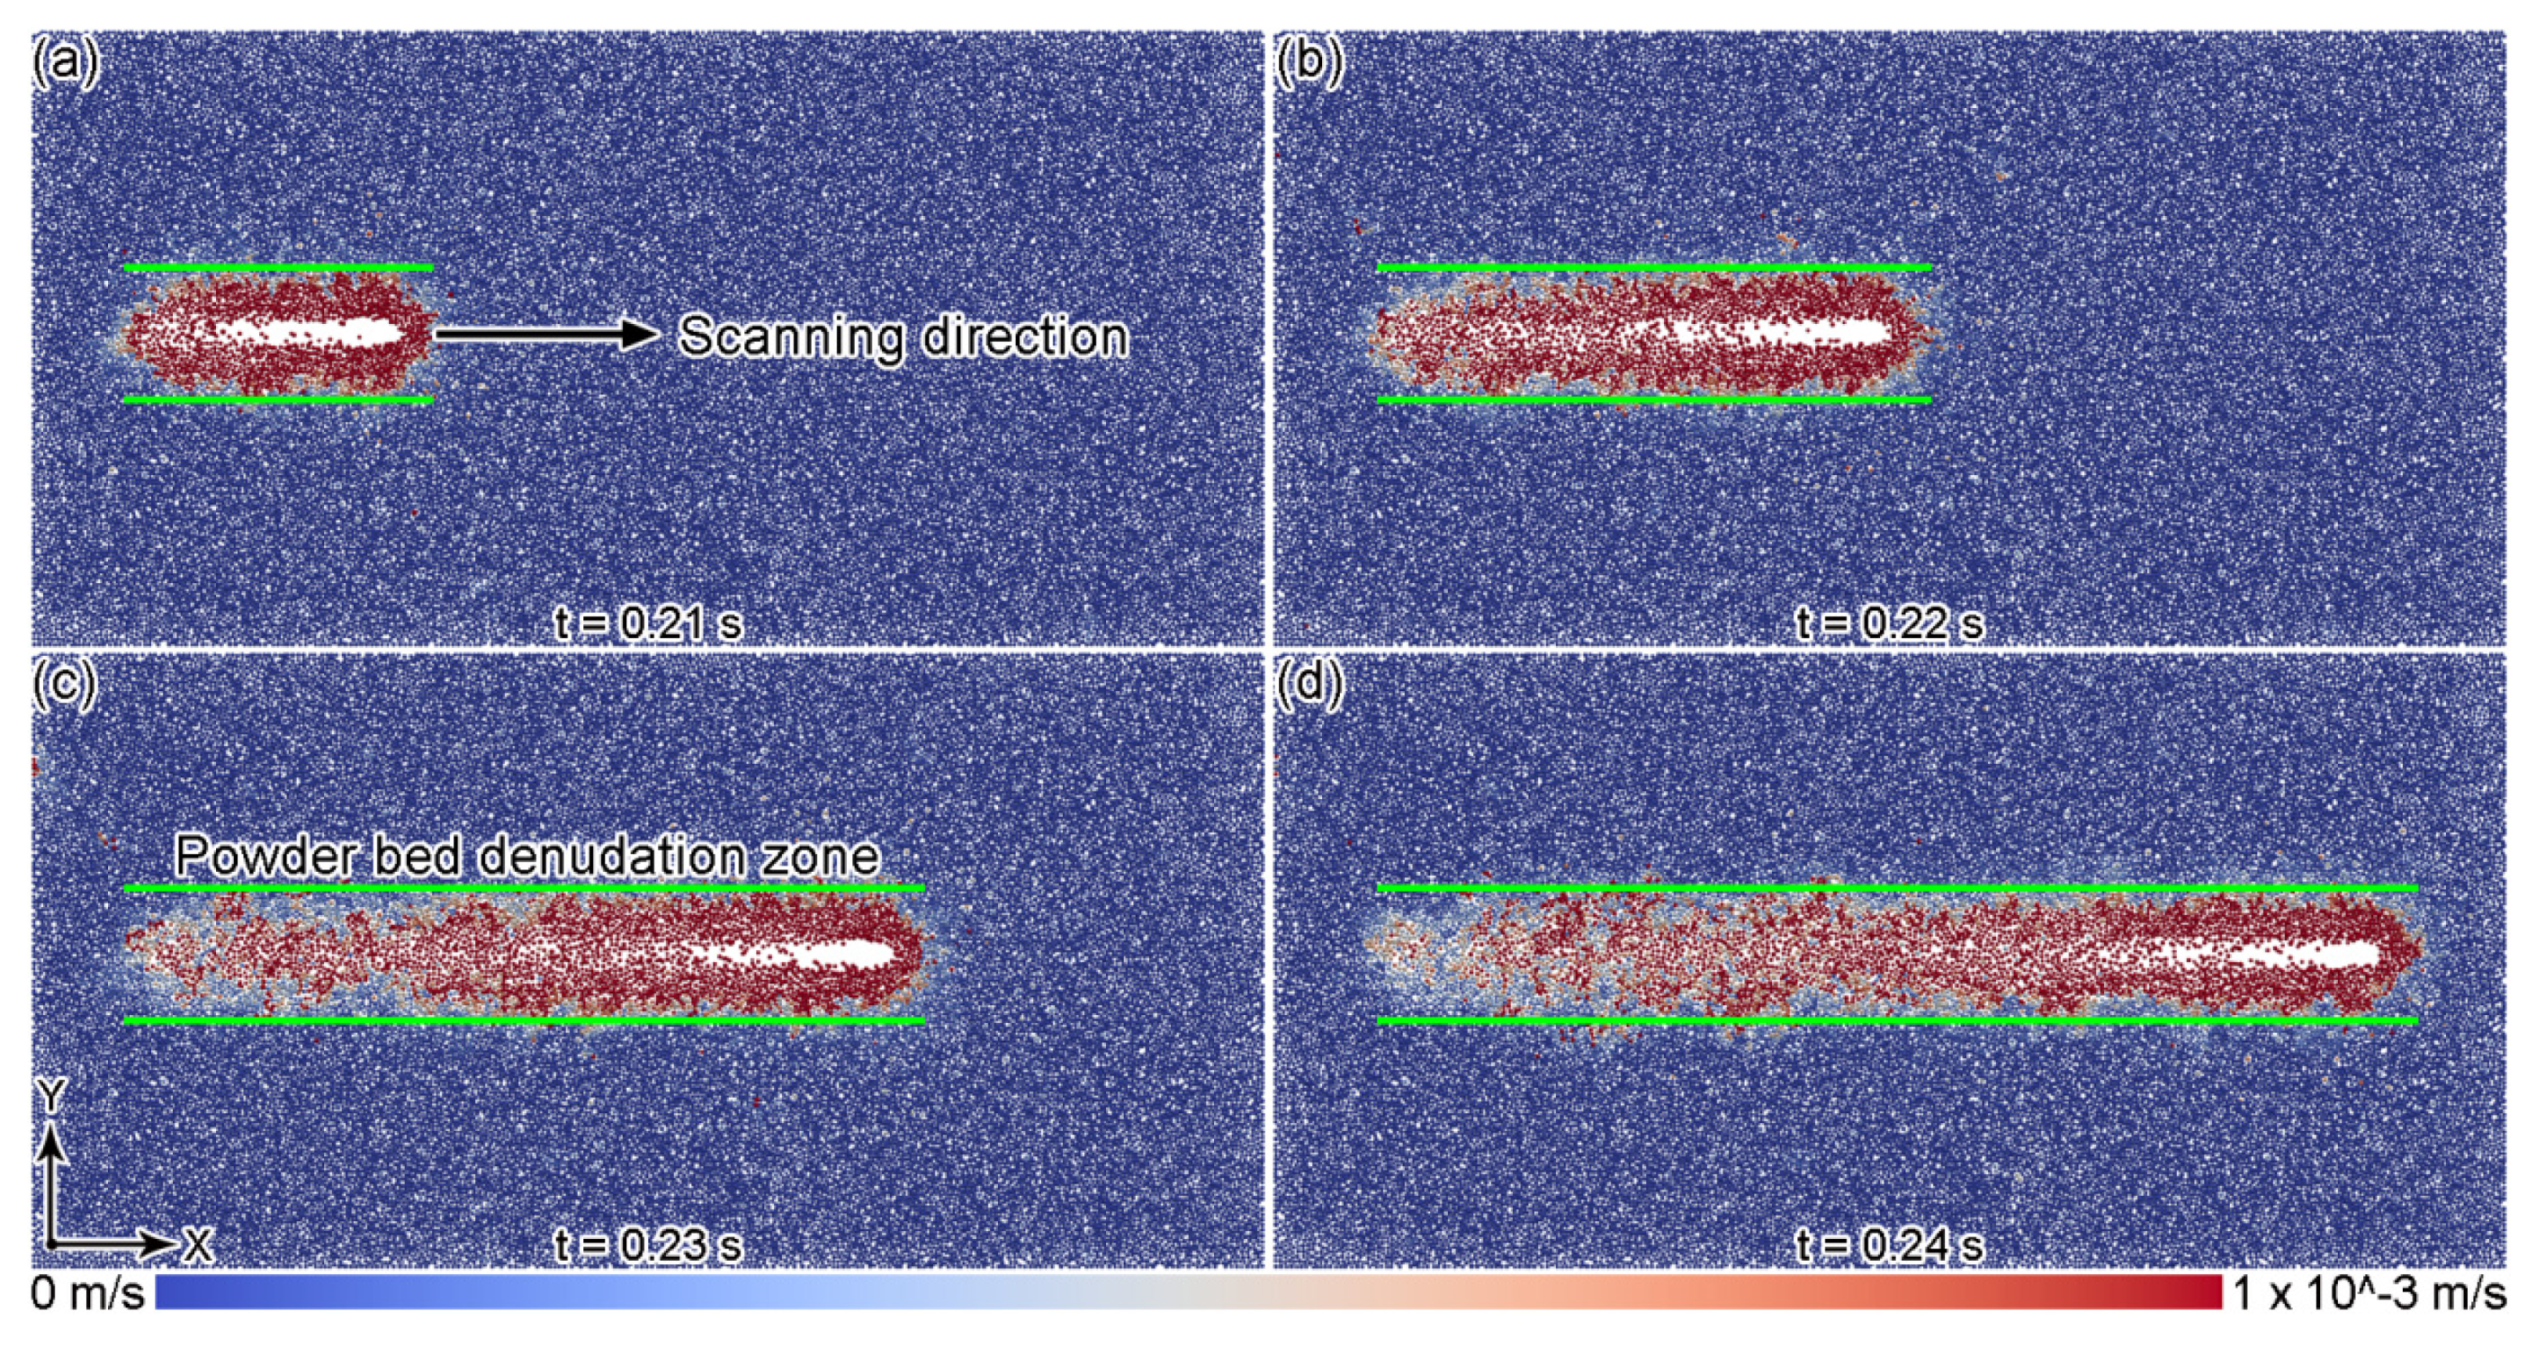
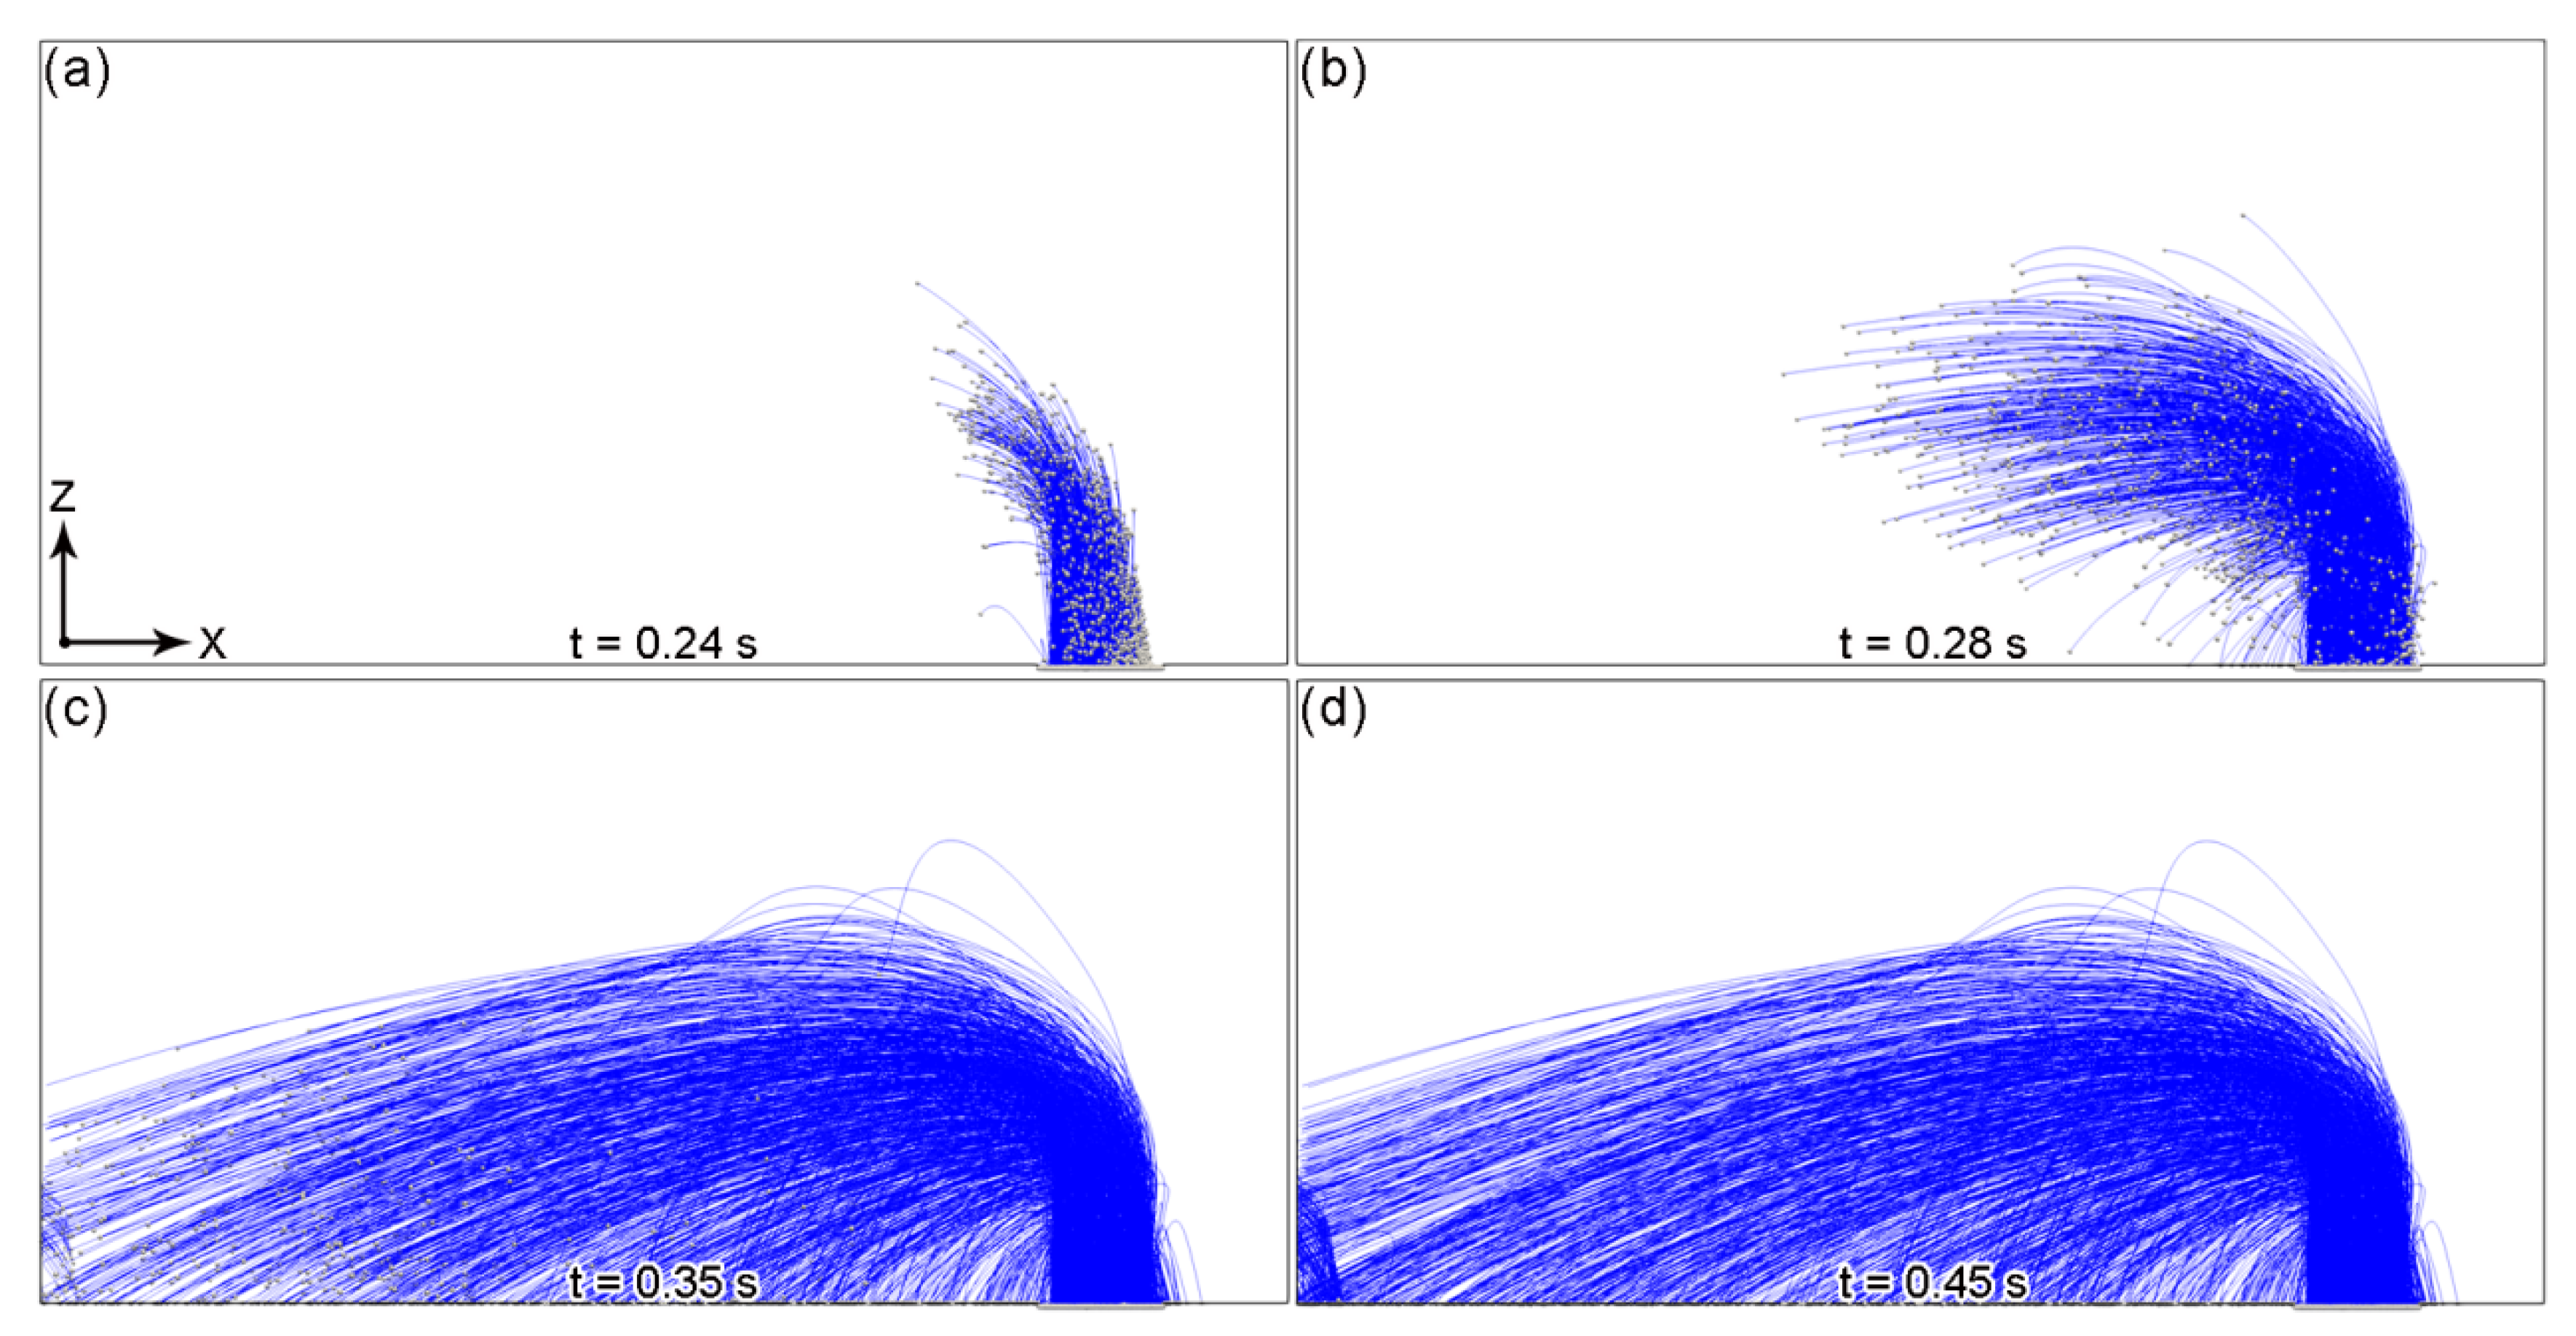
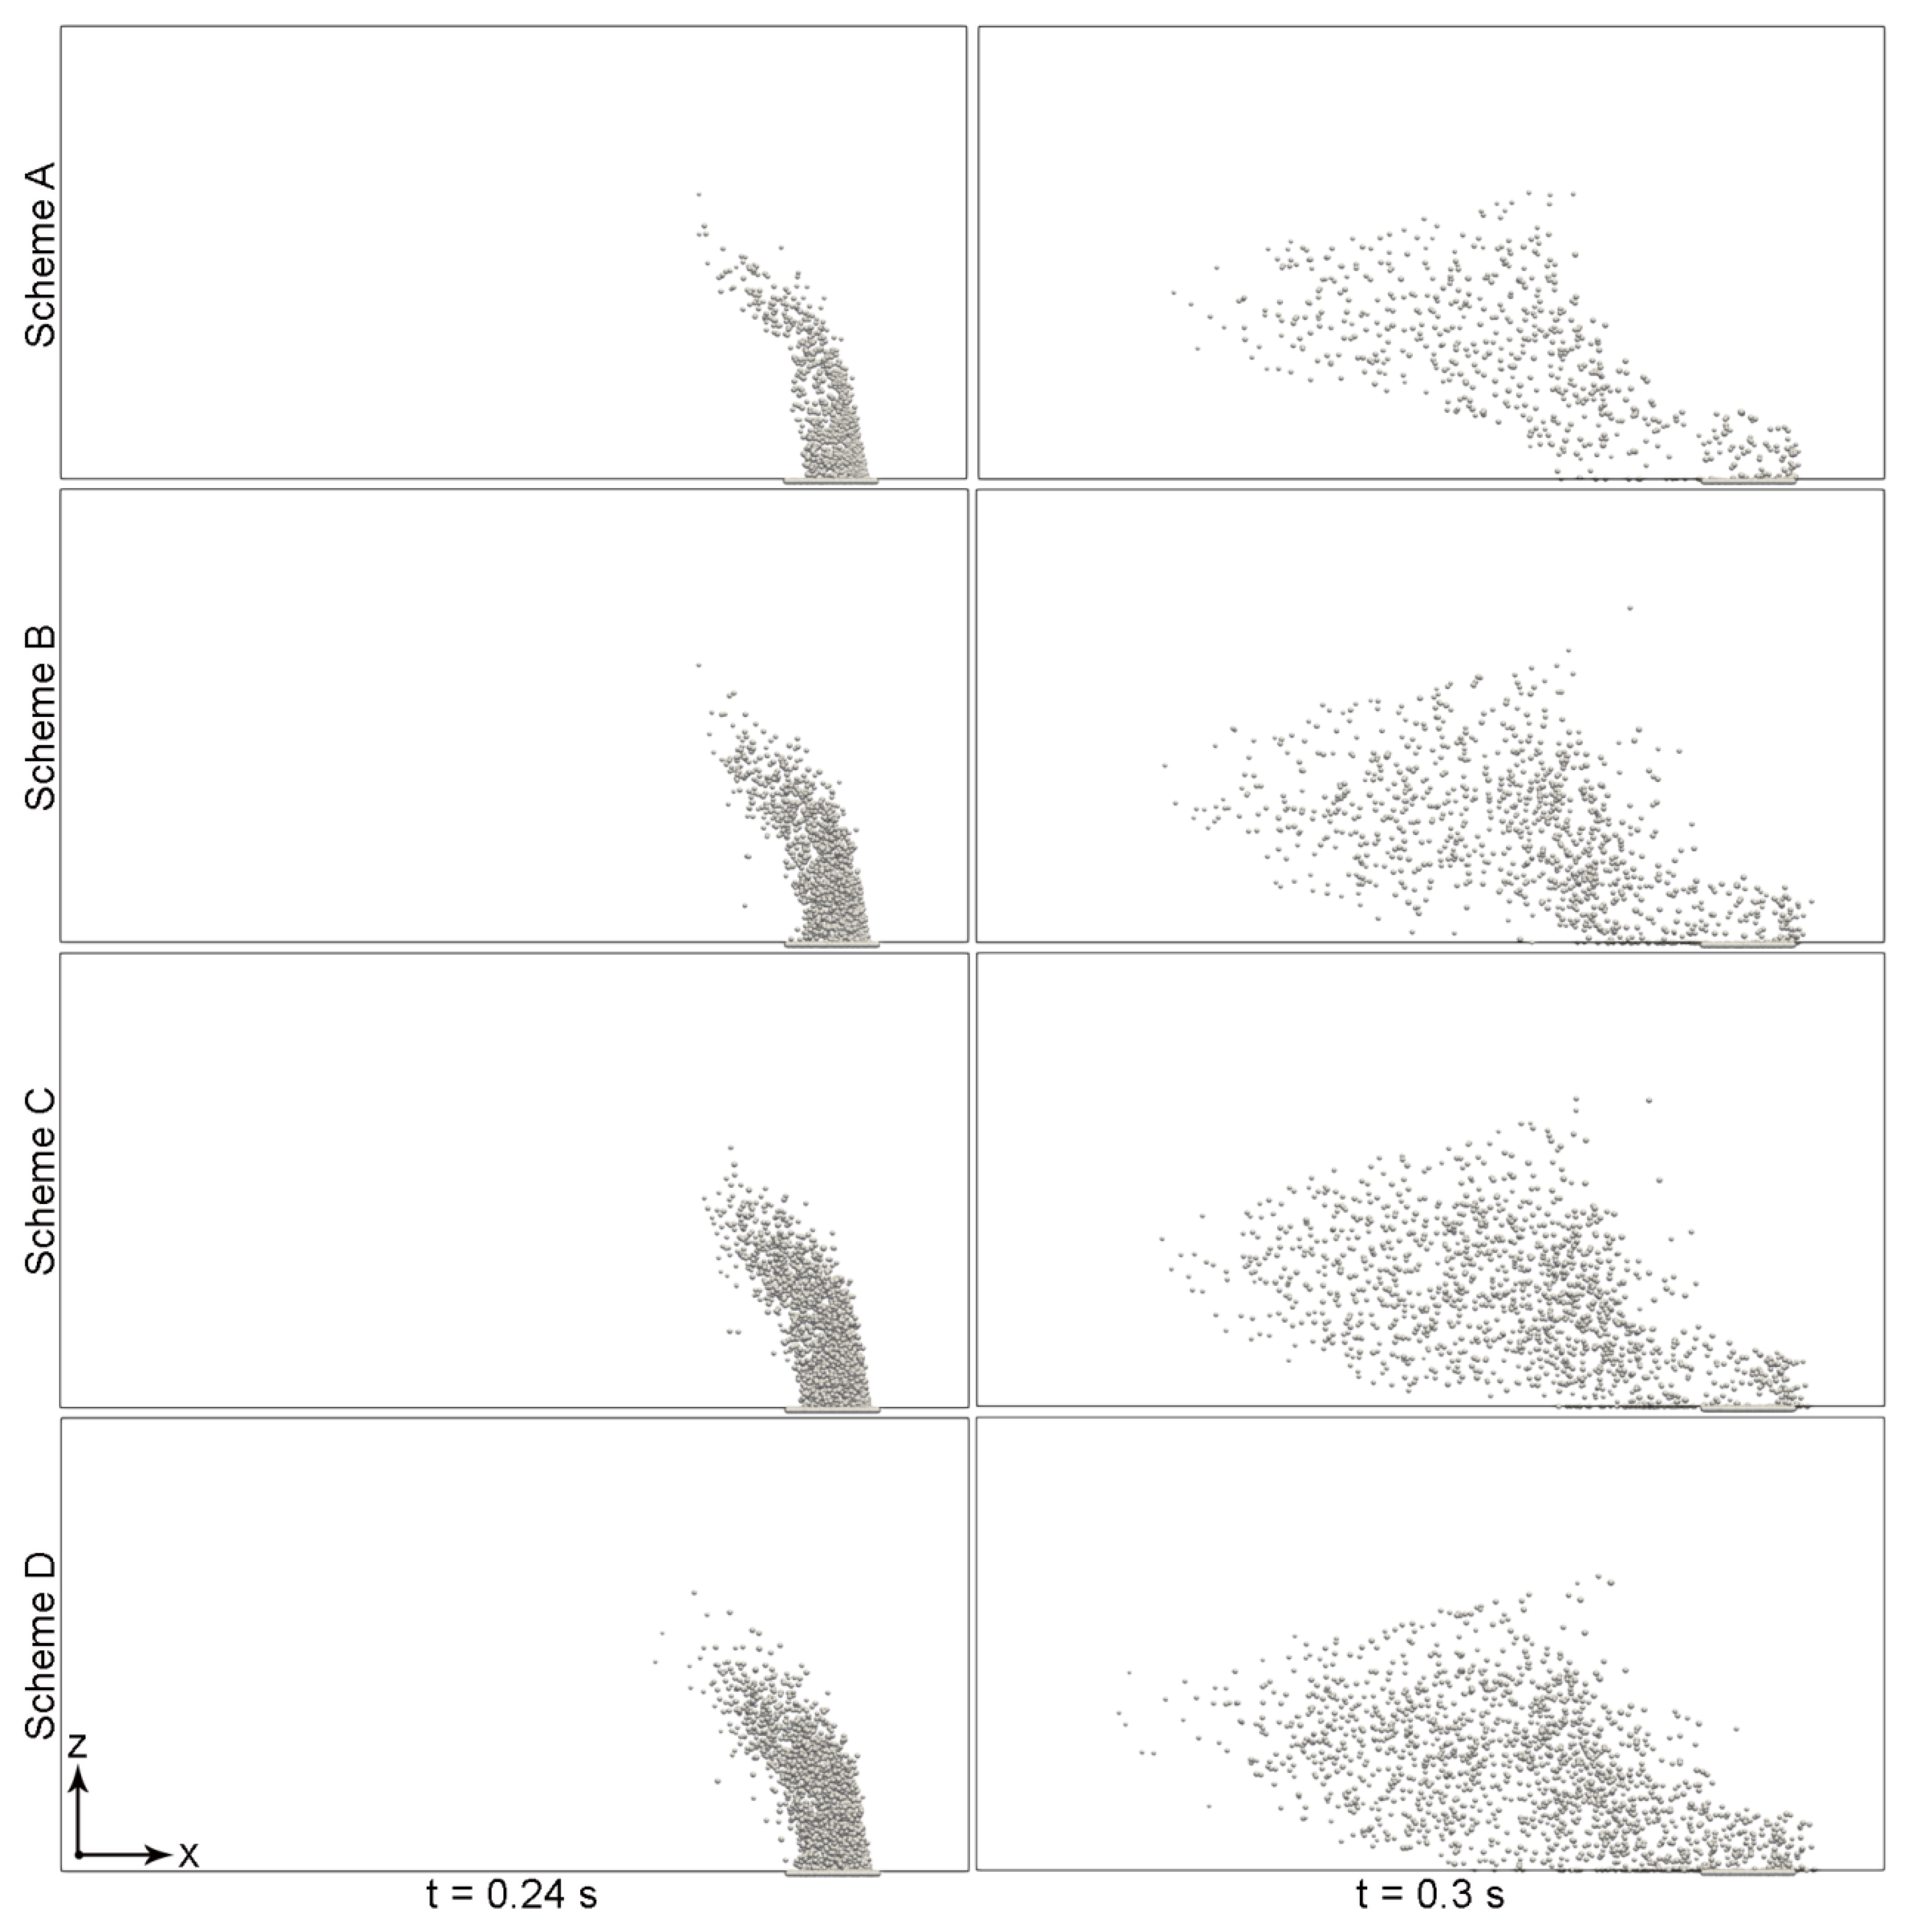
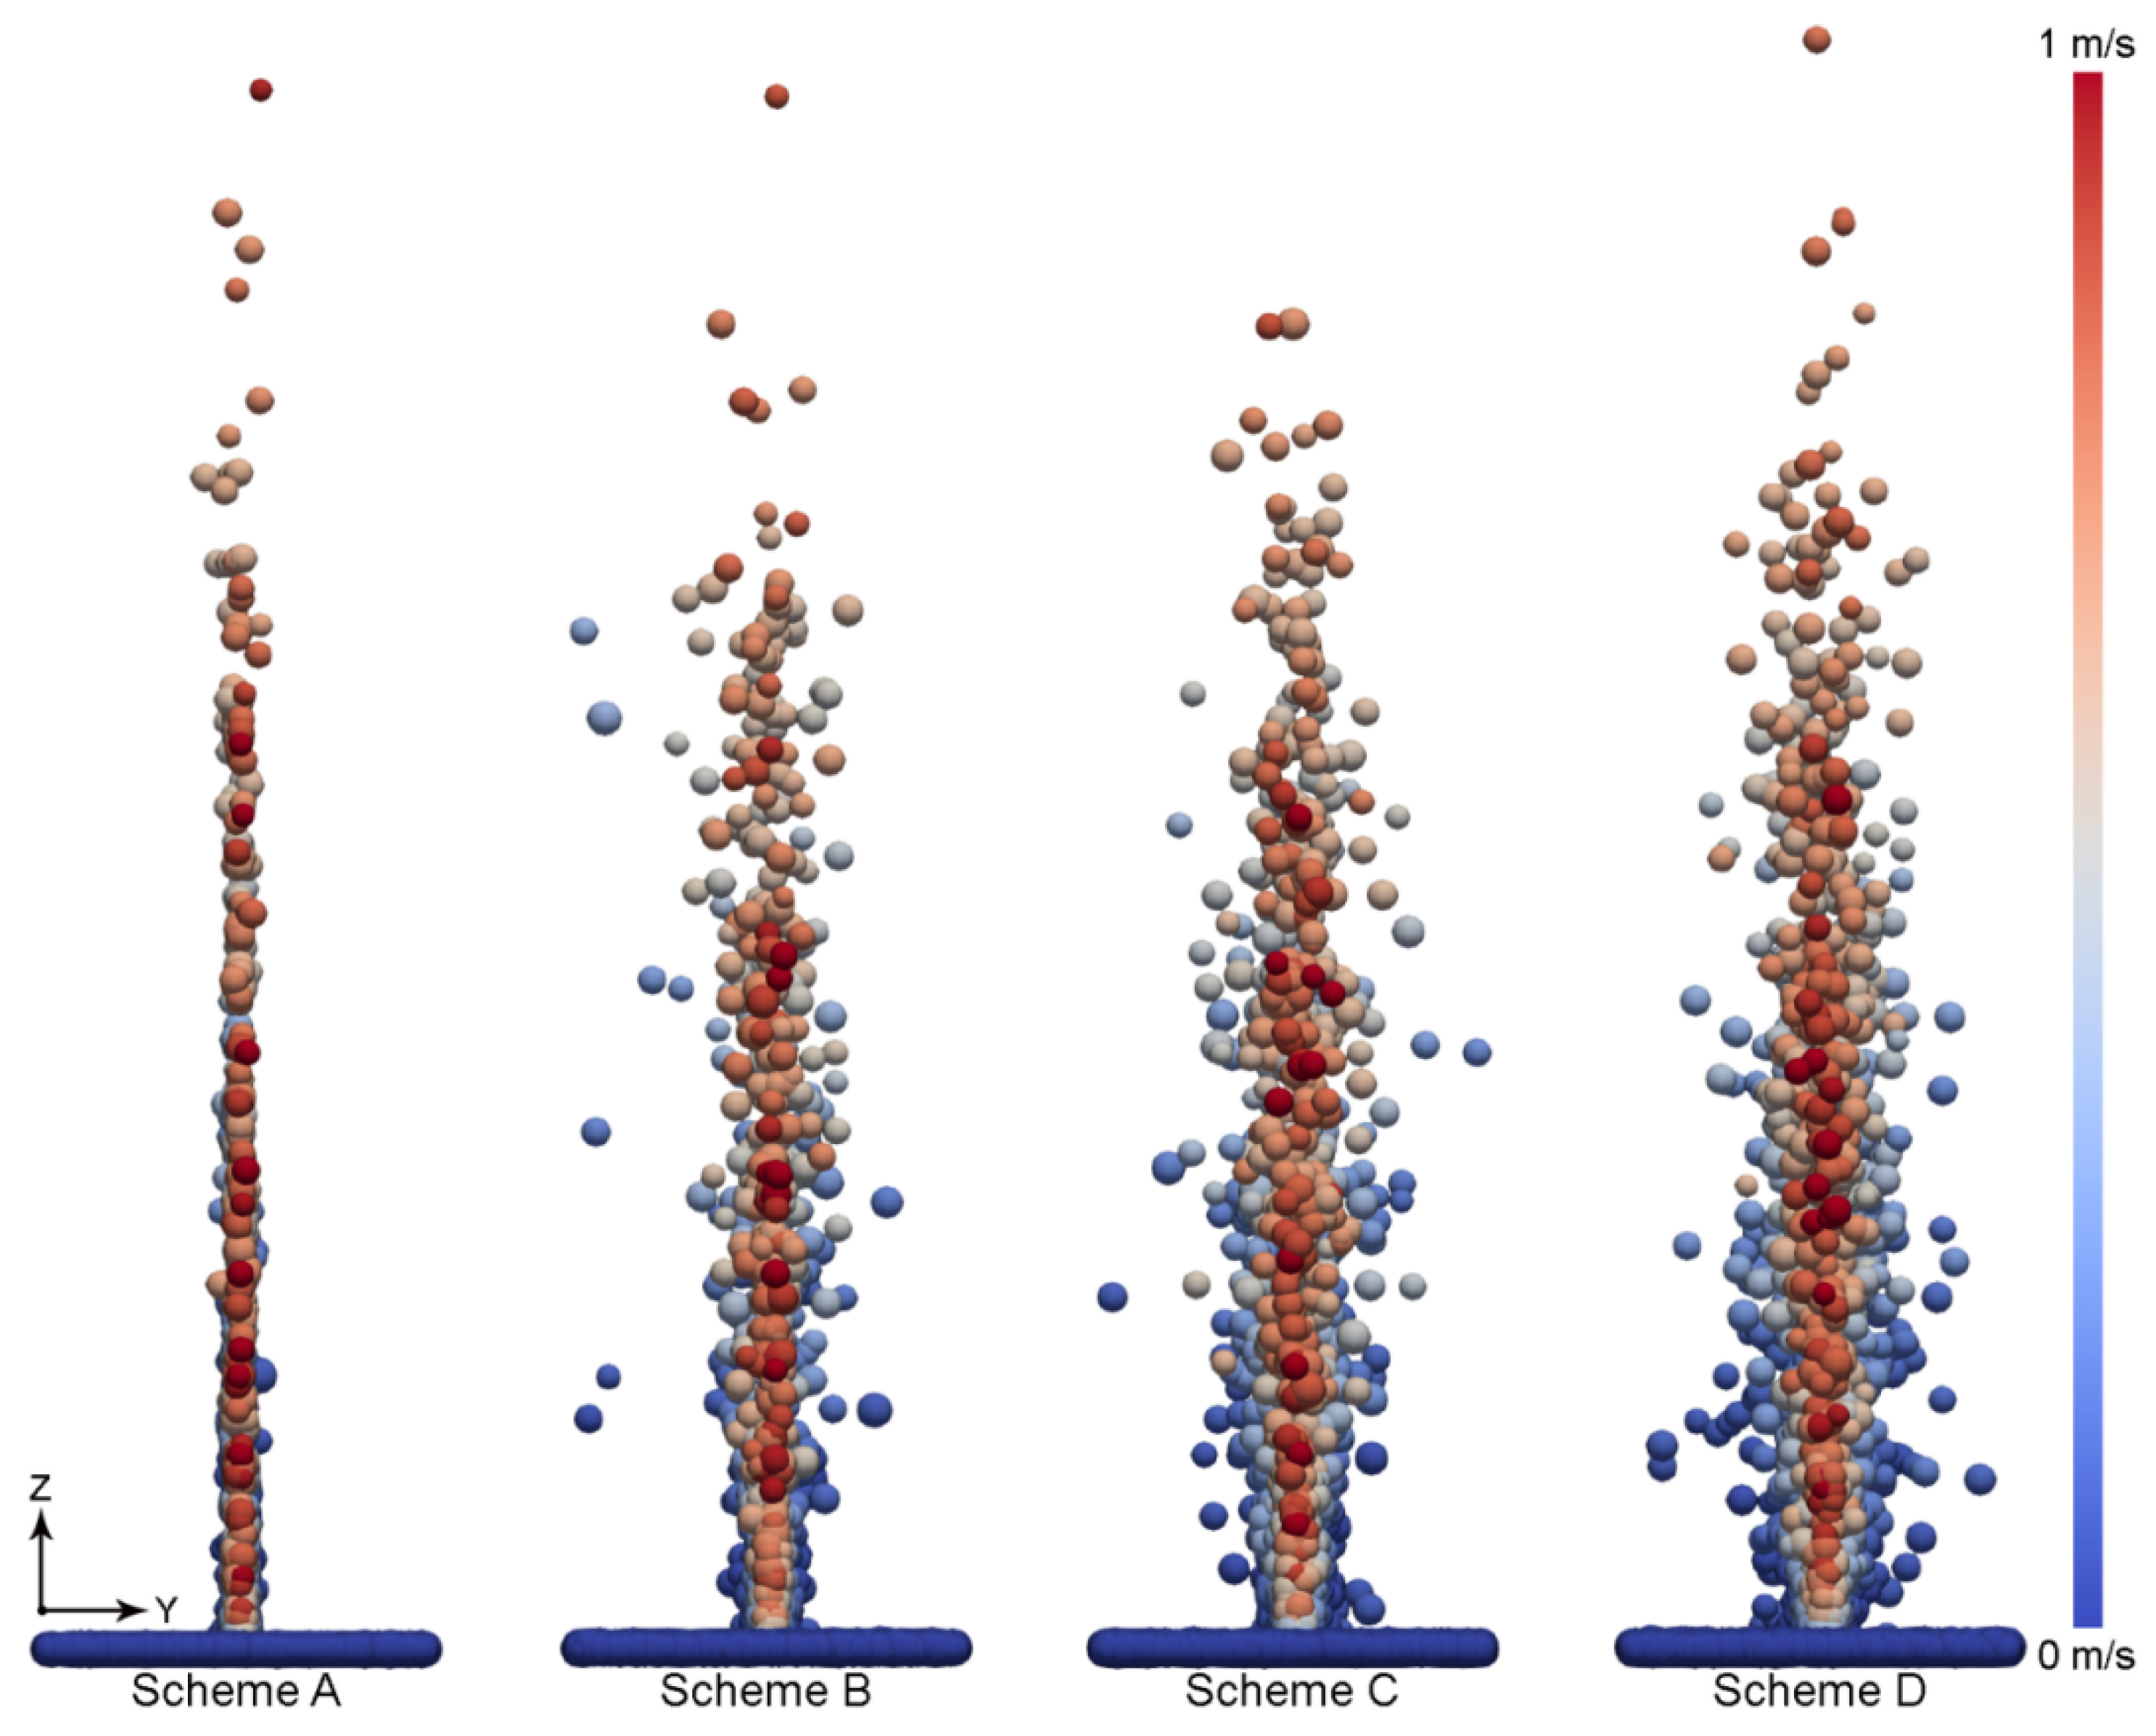
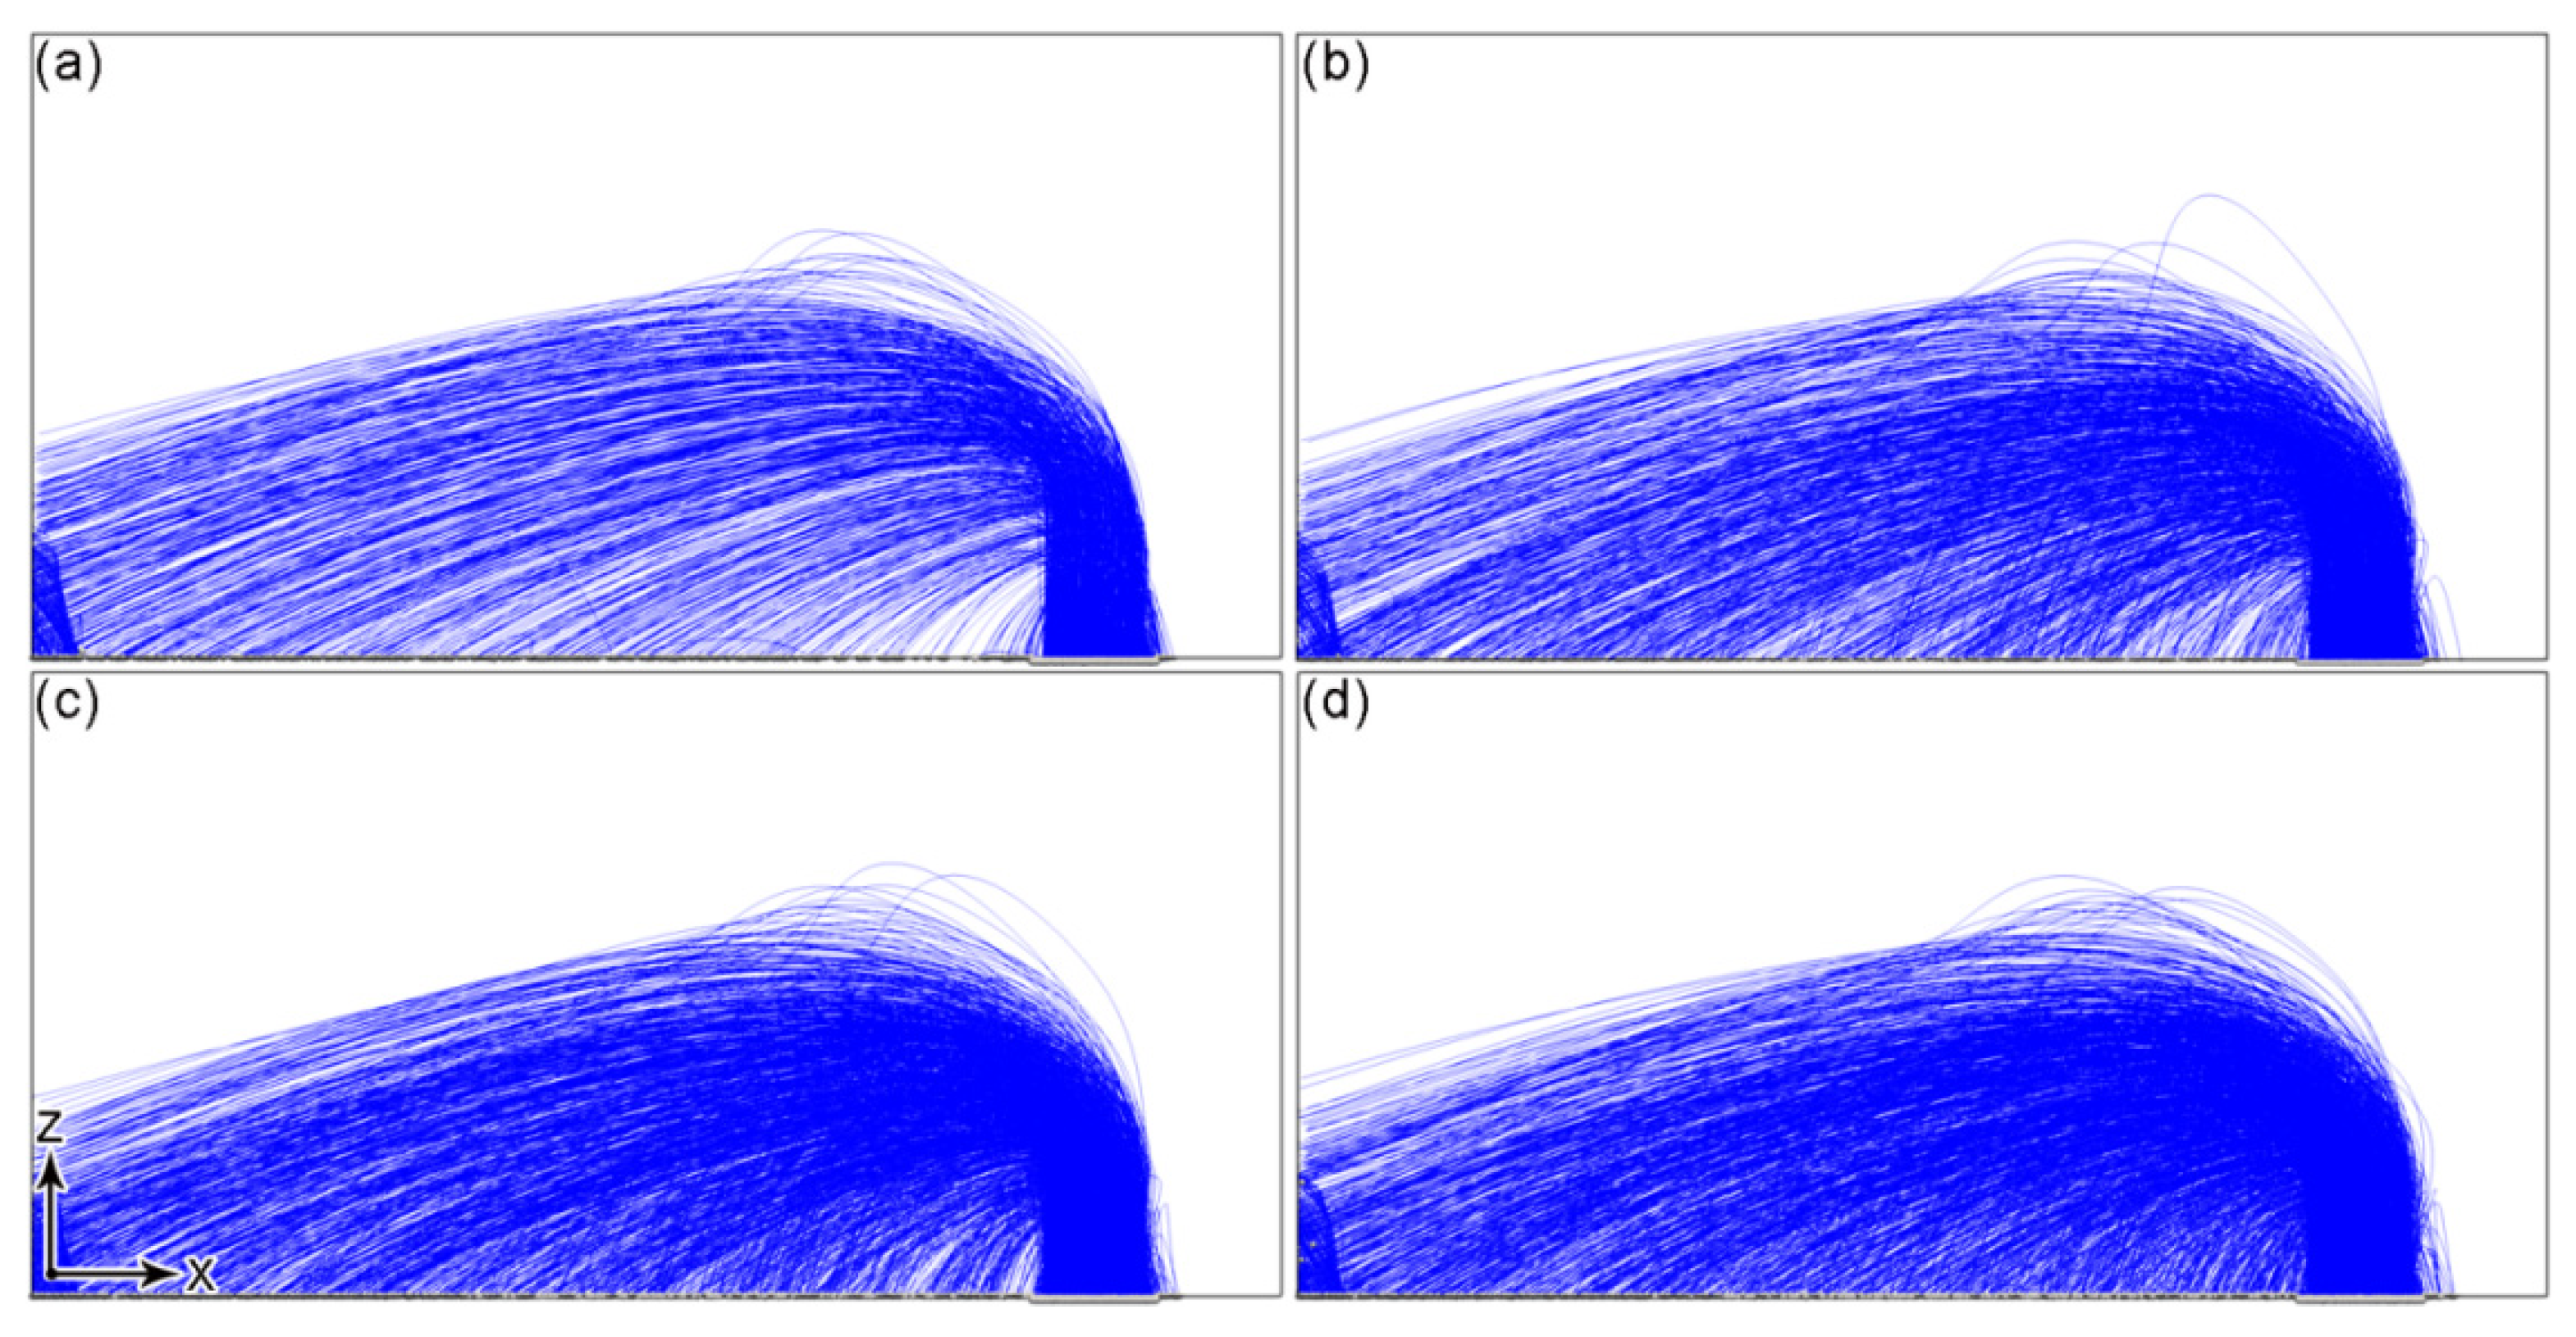
- For the spatter behavior and powder bed denudation phenomenon, the calculation results show that the spatter height and drop location show a clear correlation, and the powder bed denudation phenomenon is caused by the Bernoulli effect triggered by the high-speed gas flow, which causes the surrounding gas to gather in the high-speed gas flow area, thus driving the powder bed particles to gather in the forming zone.
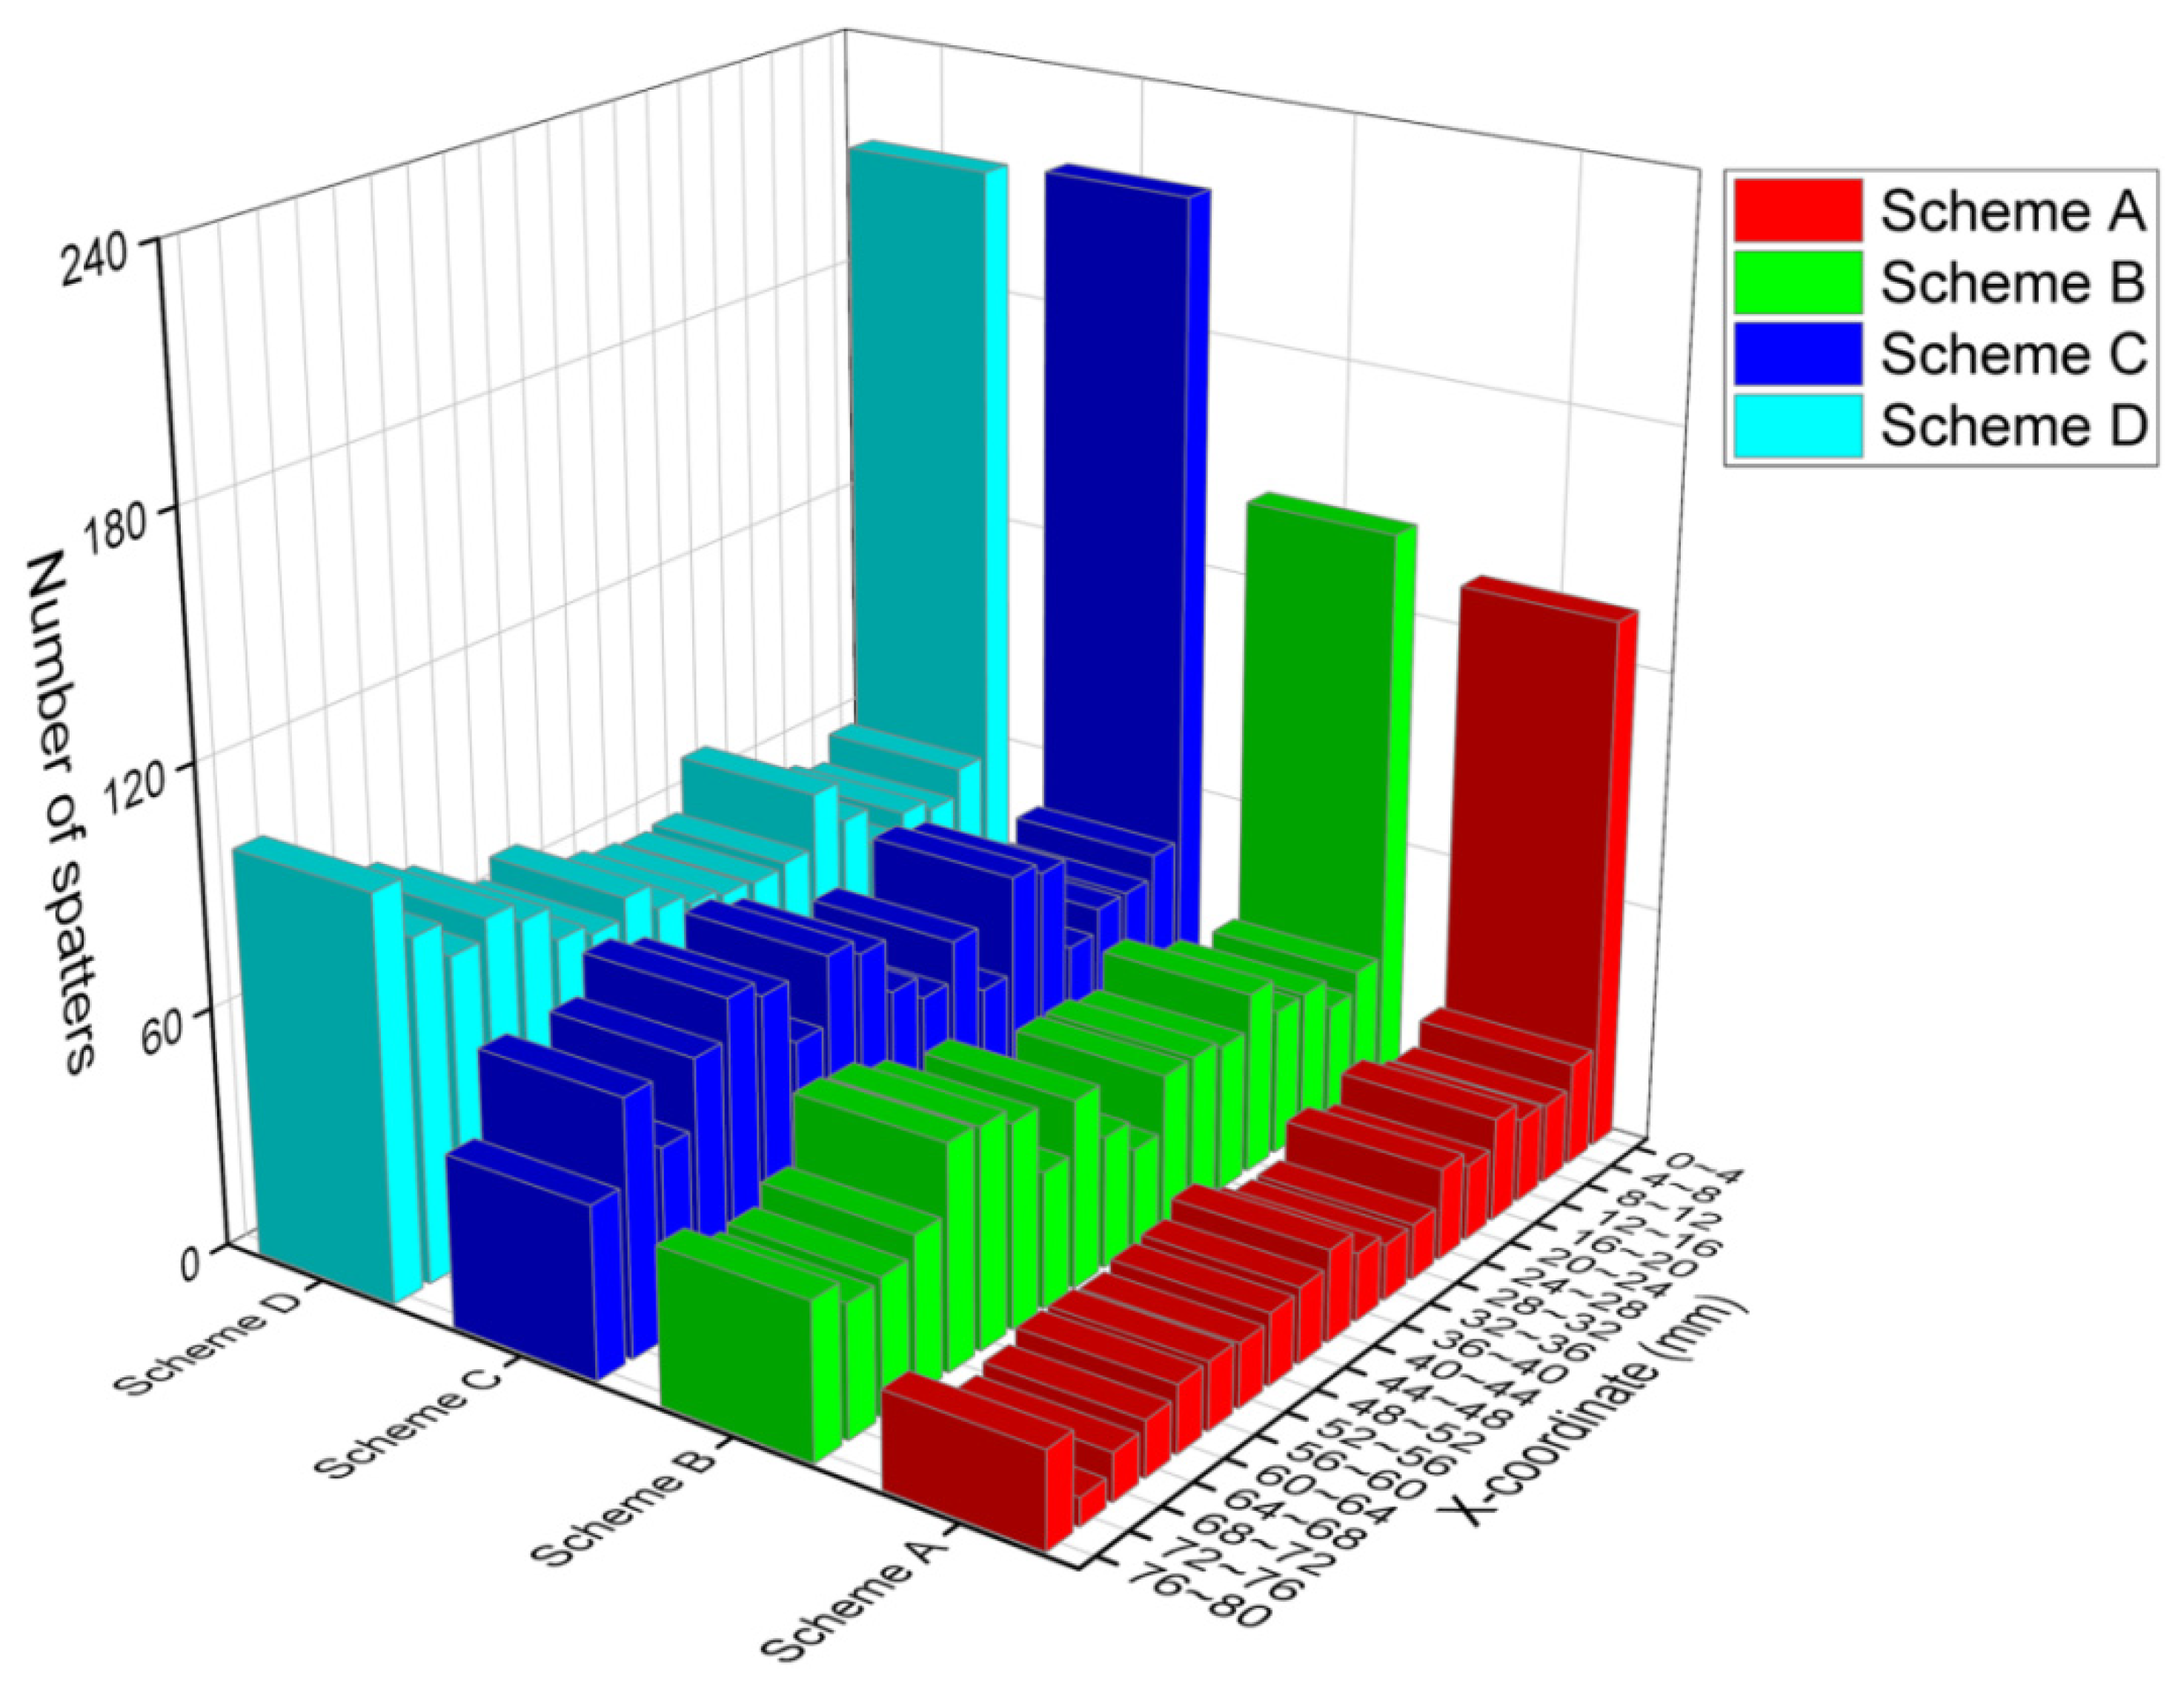
- (3)
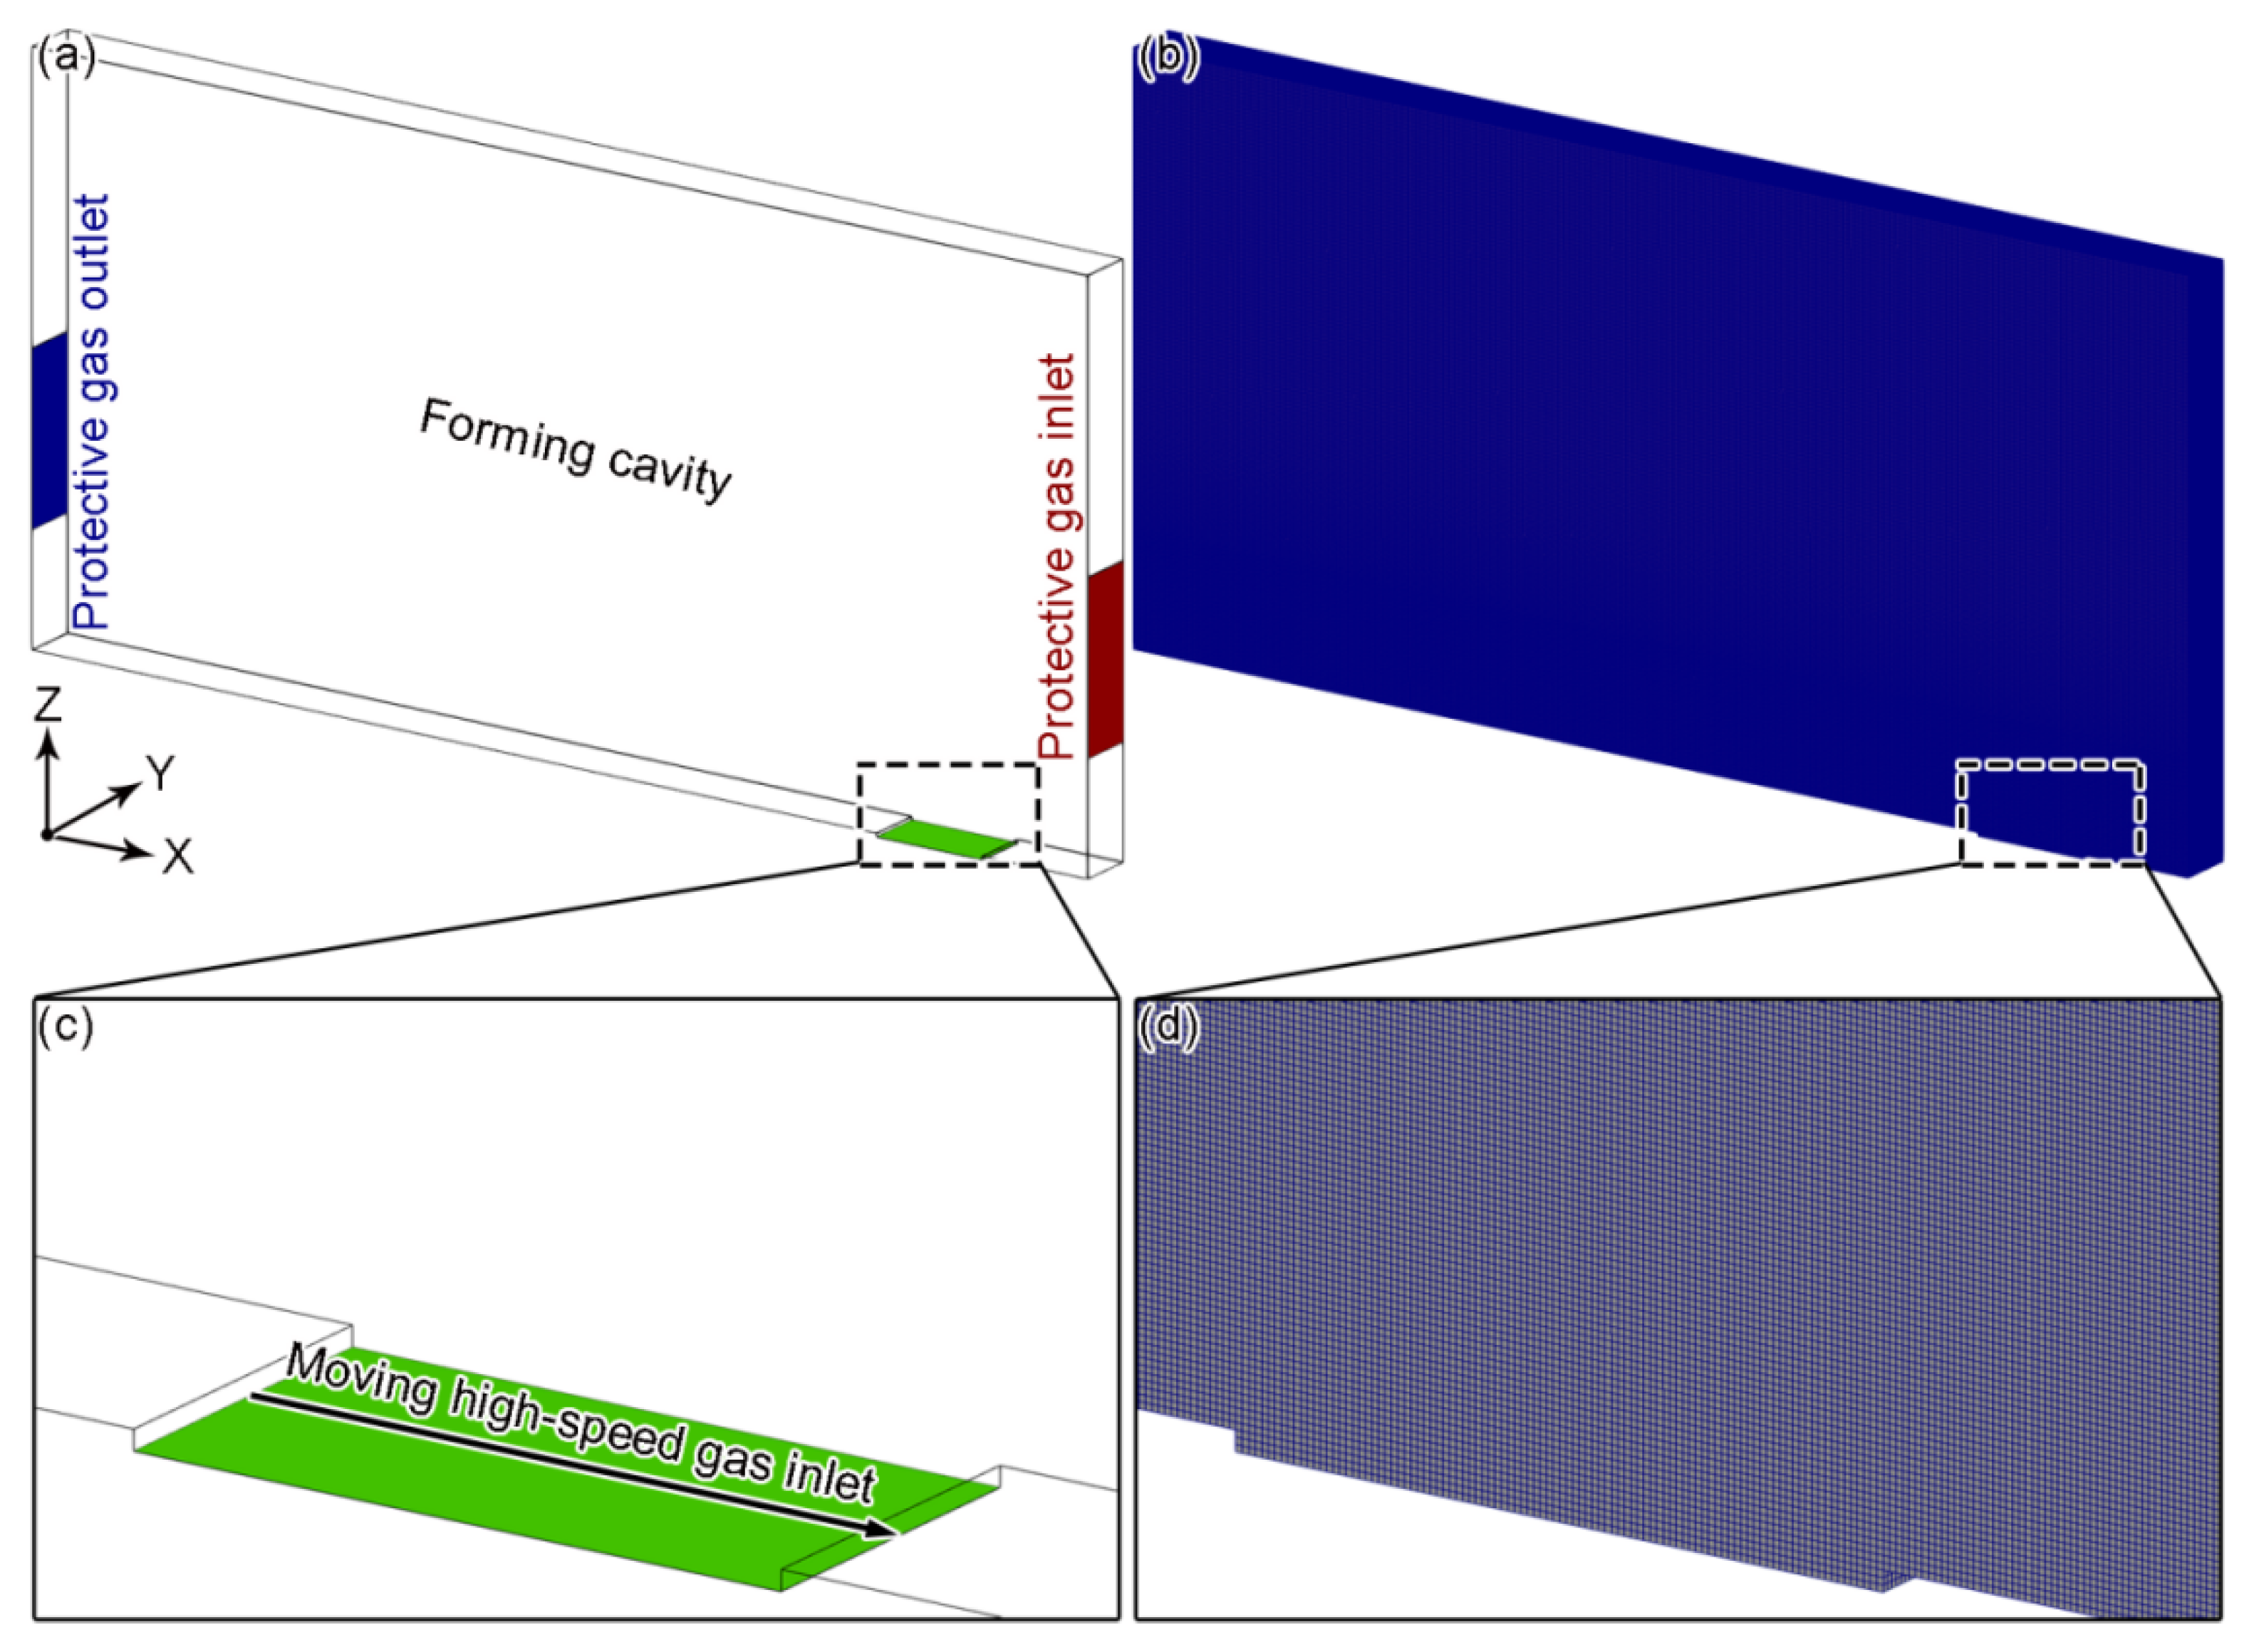
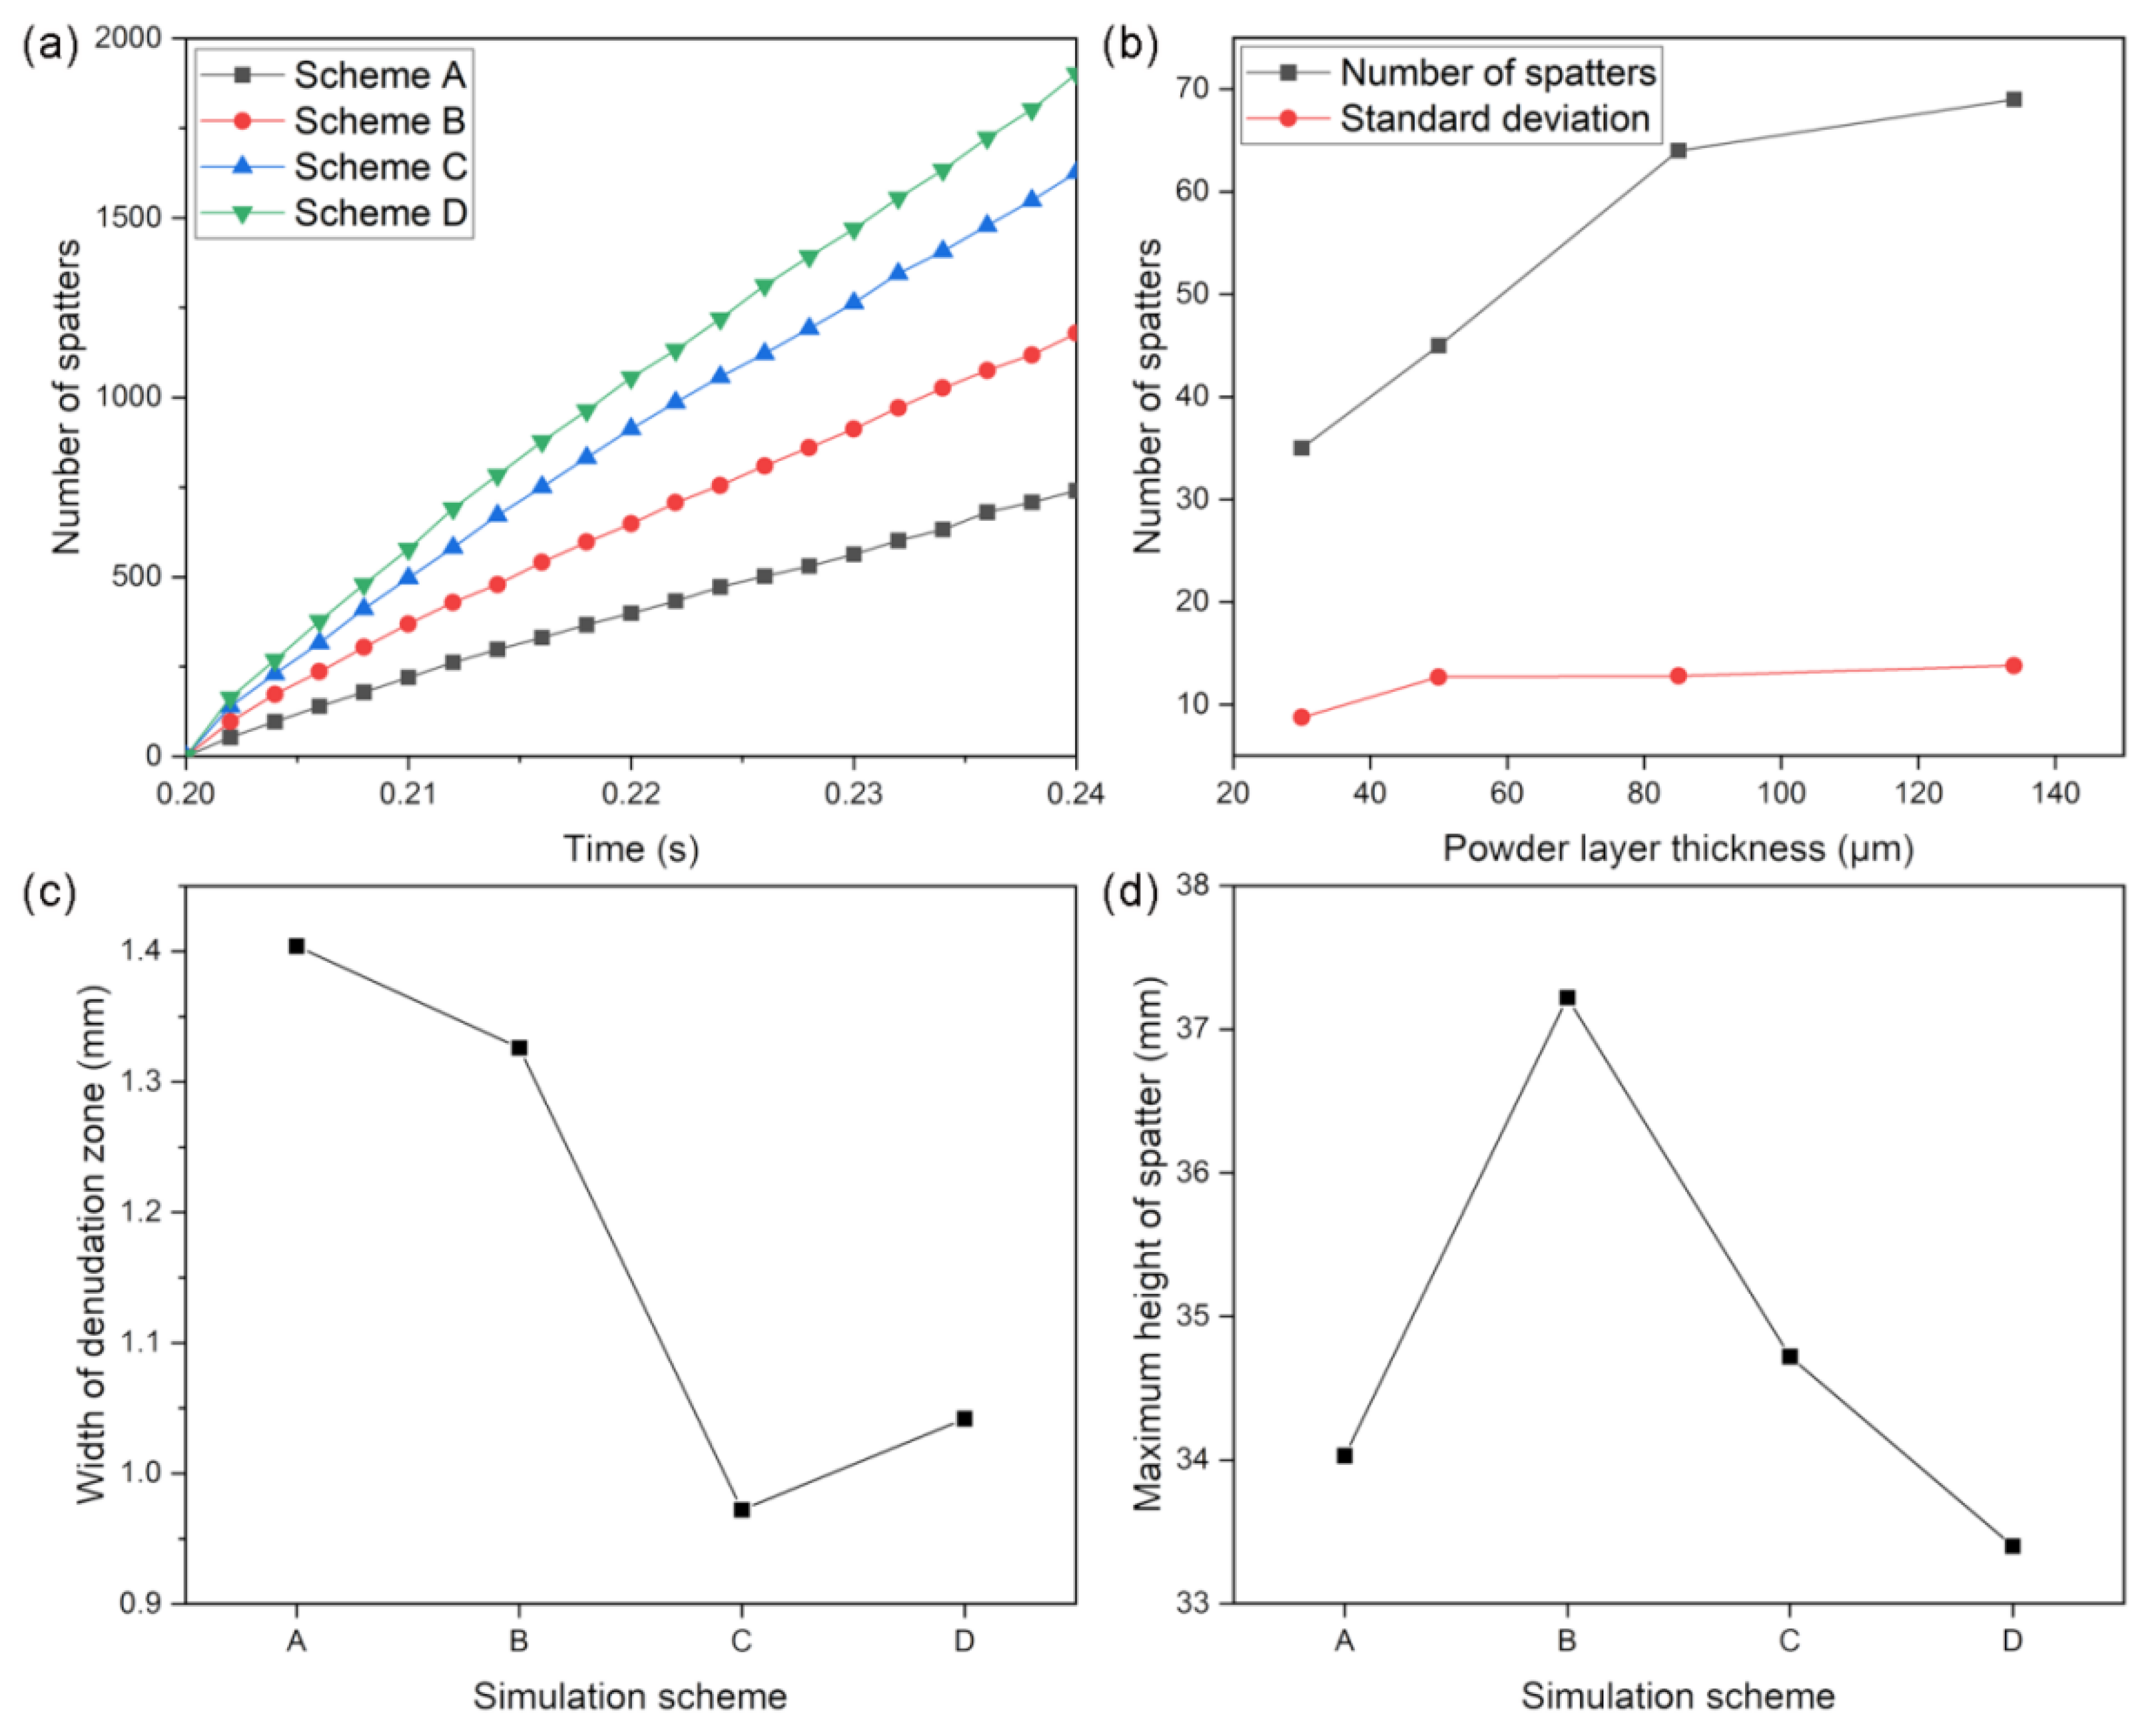
- For the effect of powder layer thickness on spatter and powder bed denudation, the calculation results show that the number of spatters increases significantly with the increase in powder layer thickness; meanwhile, the effect of powder layer thickness on spatter height and drop location distribution is small. When the powder layer thickness is small, the denudation zone width is obviously larger, but when the powder layer reaches a certain thickness, the denudation zone width does not show significant changes.
- (4)
- Since the main objective of this paper is to establish a simulation flow to describe the SLM spatter behavior, the subsequent research will focus on setting the computational parameters more rationally to achieve quantitative prediction of the SLM spatter.
Author Contributions
Funding
Institutional Review Board Statement
Informed Consent Statement
Acknowledgments
Conflicts of Interest
References
- Sefene, E.M. State-of-the-art of selective laser melting process: A comprehensive review. J. Manuf. Syst. 2022, 63, 250–274. [Google Scholar] [CrossRef]
- Yin, J.; Wang, D.Z.; Yang, L.L.; Wei, H.L.; Dong, P.; Ke, L.D.; Wang, G.Q.; Zhu, H.H.; Zeng, X.Y. Correlation between forming quality and spatter dynamics in laser powder bed fusion. Addit. Manuf. 2020, 31, 100958. [Google Scholar] [CrossRef]
- Guo, Q.L.; Zhao, C.; Escano, L.I.; Young, Z.; Xiong, L.H.; Fezzaa, K.; Everhart, W.; Brown, B.; Sun, T.; Chen, L.Y. Transient dynamics of powder spattering in laser powder bed fusion additive manufacturing process revealed by in-situ high-speed highenergy X-ray imaging. Acta Mater. 2018, 151, 169–180. [Google Scholar] [CrossRef]
- Schwerz, C.; Raza, A.; Lei, X.Y.; Nyborg, L.; Hryha, E.; Wirdelius, H. In-situ detection of redeposited spatter and its influence on the formation of internal flaws in laser powder bed fusion. Addit. Manuf. 2021, 47, 102370. [Google Scholar] [CrossRef]
- Fedina, T.; Sundqvist, J.; Kaplan AF, H. Spattering and oxidation phenomena during recycling of low alloy steel powder in Laser Powder Bed Fusion. Mater. Today Commun. 2021, 27, 102241. [Google Scholar] [CrossRef]
- Wang, D.; Ye, G.Z.; Dou, W.H.; Zhang, M.K.; Yang, Y.Q.; Mai, S.Z.; Liu, Y. Influence of spatter particles contamination on densification behavior and tensile properties of CoCrW manufactured by selective laser melting. Opt. Laser Technol. 2020, 121, 105678. [Google Scholar] [CrossRef]
- Wang, D.; Dou, W.H.; Ou, Y.H.; Yang, Y.Q.; Tan, C.L.; Zhang, Y.J. Characteristics of droplet spatter behavior and process-correlated mapping model in laser powder bed fusion. J. Mater. Res. Technol. 2021, 12, 1051–1064. [Google Scholar] [CrossRef]
- Volpp, J. Spattering effects during selective laser melting. J. Laser Appl. 2020, 32, 022023. [Google Scholar] [CrossRef]
- Tan, Z.B.; Fang, Q.H.; Li, H.; Liu, S.; Zhu, W.K.; Yang, D.K. Neural network based image segmentation for spatter extraction during laser-based powder bed fusion processing. Opt. Laser Technol. 2020, 130, 106347. [Google Scholar] [CrossRef]
- Kivirasi, E.; Piili, H.; Minet-Lallemand, K.; Kotila, J. Detecting spattering phenomena by using high speed imaging in L-PBD of 316 L. Procedia CIRP 2020, 94, 398–403. [Google Scholar] [CrossRef]
- Young, Z.A.; Guo, Q.L.; Parab, N.D.; Zhao, C.; Qu, M.L.; Escano, L.I.; Fezzaa, K.; Everhart, W.; Sun, T.; Chen, L.Y. Types of spatter and their features and formation mechanisms in laser powder bed fusion additive manufacturing process. Addit. Manuf. 2020, 36, 101438. [Google Scholar] [CrossRef]
- Luo, S.Y.; Ma, X.Q.; Xu, J.; Li, M.L.; Cao, L.C. Deep Learning Based Monitoring of Spatter Behavior by the Acoustic Signal in Selective Laser Melting. Sensors 2021, 21, 7179. [Google Scholar] [CrossRef] [PubMed]
- Slodczyk, M.; Ilin, A.; Kiedrowski, T.; Bareth, T.; Ploshikhin, V. Spatter reduction by multi-beam illumination in laser powder-bed fusion. Mater. Des. 2021, 212, 110206. [Google Scholar] [CrossRef]
- Andani, M.T.; Dehghani, R.; Karamooz-Ravari, M.R.; Mirzaeifar, R.; Ni, J. Spatter formation in selective laser melting process using multi-laser technology. Mater. Des. 2017, 131, 460–469. [Google Scholar] [CrossRef]
- Pauzon, C.; Hoppe, B.; Pichler, T.; Goff, S.D.-L.; Forêt, P.; Nguyen, T.; Hryha, E. Reduction of incandescent spatter with helium addition to the process gas during laser powder bed fusion of Ti-6Al-4V. CIRP J. Manuf. Sci. Technol. 2021, 35, 371–378. [Google Scholar] [CrossRef]
- Anwar, A.B.; Pham, Q.-C. Study of the spatter distribution on the powder bed during selective laser melting. Addit. Manuf. 2018, 22, 86–97. [Google Scholar] [CrossRef]
- Tran-Le, T.; Wang, J.X.; Byron, M.; Lynch, S.; Kunz, R. Experimental and computational studies on saltation of metal powders used in laser powder bed fusion systems for metal additive manufacturing. In Proceedings of the ASME 2021 International Mechanical Engineering Congress and Exposition, Online, 1–5 October 2021. [Google Scholar] [CrossRef]
- Qu, M.L.; Guo, Q.L.; Escano, L.I.; Nabaa, A.; Hojjatzadeh, M.H.; Young, Z.A.; Chen, L.Y. Controlling process instability for defect lean metal additive manufacturing. Nat. Commun. 2022, 13, 1079. [Google Scholar] [CrossRef]
- Chen, H.; Zhang, Y.J.; Giam, A.; Yan, W.T. Experimental and computational study on thermal and fluid behaviours of powder layer during selective laser melting additive manufacturing. Addit. Manuf. 2022, 52, 102645. [Google Scholar] [CrossRef]
- Chen, H.; Yan, W.T. Spattering and denudation in laser powder bed fusion process: Multiphase flow modelling. Acta Mater. 2020, 196, 154–167. [Google Scholar] [CrossRef]
- Wang, J.Y.; Zhu, Y.W.; Li, H.; Liu, S.; Shen, S.N.; Wang, L.; Wen, S.F. Numerical Study of the Flow Field and Spatter Particles in Laser-based Powder Bed Fusion Manufacturing. Int. J. Precis. Eng. Manuf.-Green Technol. 2022, 9, 1009–1020. [Google Scholar] [CrossRef]
- Chien, C.-Y.; Le, T.-N.; Lin, Z.-H.; Lo, Y.-L. Numerical and experimental investigation into gas flow field and spattering phenomena in laser powder bed fusion processing of Inconel 718. Mater. Des. 2021, 210, 110107. [Google Scholar] [CrossRef]
- Zhang, X.B.; Cheng, B.; Tuffile, C. Simulation study of the spatter removal process and optimization design of gas flow system in laser powder bed fusion. Addit. Manuf. 2020, 32, 101049. [Google Scholar] [CrossRef]
- Anwar, A.B.; Ibrahim, I.H.; Pham, Q.C. Spatter transport by inert gas flow in selective laser melting: A simulation study. Powder Technol. 2019, 352, 103–116. [Google Scholar] [CrossRef]
- Greenshields, C.J. OpenFOAM v9 User Guide; The OpenFOAM Foundation: London, UK, 2021. [Google Scholar]
- Ly, S.; Rubenchik, A.M.; Khairallah, S.A.; Guss, G.; Matthews, M.J. Metal vapor micro-jet controls material redistribution in laser powder bed fusion additive manufacturing. Sci. Rep. 2017, 7, 4085. [Google Scholar] [CrossRef] [PubMed] [Green Version]
- Cao, L. Study on the numerical simulation of laying powder for selective laser melting process. Int. J. Adv. Manuf. Technol. 2019, 105, 2253–2269. [Google Scholar] [CrossRef]
- Šmilauer, V.; Angelidakis, V.; Catalano, E.; Caulk, R.; Chareyre, B.; Chèvremont, W. Yade Documentation, 3rd ed. Available online: https://doi.org/10.5281/zenodo.5705394 (accessed on 9 September 2022).
- Kloss, C.; Goniva, C.; Hager, A.; Amberger, S.; Pirker, S. Models, algorithms and validation for opensource DEM and CFD-DEM. Prog. Comput. Fluid Dyn. 2012, 12, 140–152. [Google Scholar] [CrossRef]
- Zhang, W.H.; Ma, H.L.; Zhang, Q.; Fan, S.Q. Prediction of powder bed thickness by spatter detection from coaxial optical images in selective laser melting of 316L stainless steel. Mater. Des. 2022, 213, 110301. [Google Scholar] [CrossRef]


| CFD model for fluid phase | |
| DPM model for particle phase | |
| CFD–DPM coupling strategy | |
| Boundary conditions |
|
| Initial conditions |
|
| Simulation Scheme | Powder Layer Thickness (μm) | Number of Particles |
|---|---|---|
| Scheme A | 50 | 26,598 |
| Scheme B | 70 | 39,839 |
| Scheme C | 90 | 52,913 |
| Scheme D | 100 | 61,441 |
| Simulation Scheme | Computational Configuration | Number of Cores Used for Calculation | Physical Time Period (s) | Time Step (μs) | Time Consumption (h) |
|---|---|---|---|---|---|
| Scheme A | Intel Xeon Gold 6240 CPU (dual CPU, 72 threads, 128 GB RAM) | 68 | 0–0.2 | 50 | 120.3 |
| 0.2–0.24 | 5 | 192.0 | |||
| 0.24–0.45 | 50 | 234.4 | |||
| Scheme B | Intel Xeon Gold 6240 CPU (dual CPU, 72 threads, 128 GB RAM) | 68 | 0–0.2 | 50 | 122.4 |
| 0.2–0.24 | 5 | 182.0 | |||
| 0.24–0.45 | 50 | 271.7 | |||
| Scheme C | Intel Xeon Gold 5120 CPU (dual CPU, 56 threads, 96 GB RAM) | 52 | 0–0.2 | 50 | 106.7 |
| 0.2–0.24 | 5 | 139.4 | |||
| 0.24–0.45 | 50 | 242.5 | |||
| Scheme D | Intel Xeon Gold 5120 CPU (dual CPU, 56 threads, 96 GB RAM) | 52 | 0–0.2 | 50 | 107.3 |
| 0.2–0.24 | 5 | 141.2 | |||
| 0.24–0.45 | 50 | 255.4 |
Publisher’s Note: MDPI stays neutral with regard to jurisdictional claims in published maps and institutional affiliations. |
© 2022 by the authors. Licensee MDPI, Basel, Switzerland. This article is an open access article distributed under the terms and conditions of the Creative Commons Attribution (CC BY) license (https://creativecommons.org/licenses/by/4.0/).
Share and Cite
Cao, L.; Zhang, Q.; Meng, R. CFD–DPM Simulation Study of the Effect of Powder Layer Thickness on the SLM Spatter Behavior. Metals 2022, 12, 1897. https://doi.org/10.3390/met12111897
Cao L, Zhang Q, Meng R. CFD–DPM Simulation Study of the Effect of Powder Layer Thickness on the SLM Spatter Behavior. Metals. 2022; 12(11):1897. https://doi.org/10.3390/met12111897
Chicago/Turabian StyleCao, Liu, Qindan Zhang, and Ruifan Meng. 2022. "CFD–DPM Simulation Study of the Effect of Powder Layer Thickness on the SLM Spatter Behavior" Metals 12, no. 11: 1897. https://doi.org/10.3390/met12111897