Article

Metallographic Study of Overlapped Laser Welds of Dissimilar Materials

1
Department of Technology, Materials and Computer Supported Production, Faculty of Mechanical Engineering, Technical University of Košice, Mäsiarska 74, 040 01 Košice, Slovakia
2
Department of Automotive Production, Faculty of Mechanical Engineering, Technical University of Košice, Mäsiarska 74, 040 01 Košice, Slovakia
3
Department of Engineering for Design of Machines and Transport Equipment, Faculty of Mechanical Engineering, Technical University of Košice, Letná 1/9, 042 00 Košice, Slovakia
4
Institute of Materials Research, Slovak Academy of Sciences, Watsonova 1935/47, 040 01 Košice, Slovakia
*
Author to whom correspondence should be addressed.
Metals 2022, 12(10), 1682; https://doi.org/10.3390/met12101682
Submission received: 13 September 2022 / Revised: 3 October 2022 / Accepted: 5 October 2022 / Published: 9 October 2022
(This article belongs to the Special Issue Advanced Welding Technology in Metals II)

Abstract

:
The paper deals with the metallographic analysis of overlapped laser welds of dissimilar materials based on galvanized and ungalvanized steels in various combinations. In addition to a gallery of metallographic sections, the paper presents the monitoring of weld defects, the measurement of selected weld geometrical characteristics and changes in weld microstructure by measuring the microhardness profile across the joint. The mixing of materials was monitored by area and line EDX analysis in the melting zone. Subsequently, the load carrying capacity of the formed joints was determined and compared with FEM simulation. Finally, the dependences of hardness and strength of welds on carbon content and carbon equivalent were determined.

1. Introduction

The drive to reduce the weight of automotive structures, the pressure to reduce emissions as well as the increasing importance of saving material resources, have triggered the massive development of multi-material structures [1,2,3,4]. The joining of dissimilar materials stands mainly on two pillars—welding and mechanical joining. Each of these directions has its advantages, but also challenges and bottlenecks. Welding of dissimilar materials struggles with the different melting temperatures of the materials being joined as well as the chemical incompatibility of the materials with each other. The latter leads to the formation of brittle intermetallic phases at the interface (especially steel-alloy Al joints and others), which cause weld cracking [5,6,7,8,9,10,11,12,13,14,15]. The solution lies mainly in the use of interlayers [16] and suitable filler materials [17,18], which mitigate chemical differences, in the modification of welding processes [19,20,21,22], as well as in the use of low heat input technologies, especially laser welding [23,24,25,26]. Low heat input means a thinner layer of intermetallic phases, less time for their growth and narrower HAZ.
The joining of materials of different grades and thicknesses—tailored fit body in white—is mainly achieved by resistance spot welding. L. Mei et al. [27] performed a comparative analysis between resistance welds and multi-segment intermittent welds of a certain length and found better static stiffness for laser welds compared to resistance welds. The laser welding process, even though more expensive to implement, is more agile, more controllable and can produce welds with better quality and flexibility.
Welding of various low carbon thin steel sheets is metallurgically mastered, but the low melting temperature of the zinc layer on the surface of these materials causes evaporation in the welding process, weld defects and local weakening of the corrosion protection.
L. Mei et al. [28] performed a comprehensive comparison of laser overlapped welds of dissimilar steels with different thicknesses by two types of lasers—CO2 and fiber laser—in order to detect the effect of laser source on the shape and strength characteristics of the joint. Fiber laser showed equal influence on the top and bottom plate, larger weld width, higher load carrying capacity and better mechanical properties. With larger weld gap, the weld surface sink appears as the main shape deviation. He identified lamellar low-carbon martensite, acicular ferrite and Widmanstätten structures as the main microstructural constituents in welding of galvanized and ungalvanized low-carbon steels, which are the result of high-temperature changes and continuous high cooling rate of the weld.
G. Chen et al. [29] and L. Mei et al. [30] investigated the effect of weld gap and laser incidence angle on the appearance, load carrying capacity and failure location of overlapped laser welds of thin steel sheets. They found that as the laser beam is deflected away from the vertical, the weld width increases, but at the same time, from a deflection angle of about 30°, the load carrying capacity of the welds starts to decrease. They also found that overlapped welds with a plate thickness of 0.8 mm have the highest load carrying capacity when the weld gap is between 0.1 and 0.2 mm. Of course, this value is also influenced by the welding speed. With no or very small weld gap, welding defects such as spatters, pores, etc., can occur due to evaporating zinc that has no room to escape. Zinc vapor causes damage to the weld zone and creates pores in the weld, resulting in poor surface quality, reduced strength and lower corrosion resistance. Conversely, if the weld gap between the overlapped plates is above a certain limit, joining and mixing of the materials will not occur, sinkholes and other defects will appear on the weld surface.
Similar conclusions were reached by Hao et al. [31], who performed an experimental study of zinc vapor departure from the keyhole during laser welding of overlapped galvanized sheets. He found that in zero-gap overlapped sheets, zinc vapor exits through the weld bath at a high velocity and pushes a large amount of melt out of the bath, forming a spatter. This unfavorable phenomenon disappears at small gap, which was verified experimentally and by numerical analysis.
This paper presents a metallographic analysis of overlapped laser welds of dissimilar steel materials, monitoring their defects, geometrical characteristics and microstructural changes through microhardness profile measurements across the joint and EDX analyses.

2. Materials and Methods

The following materials were used for the experimental works:
DC04—deep-drawn, uncoated, cold-rolled low-carbon steel for bodywork. Hereafter: DC.
TL 1550-220 + Z—double-sided hot-dip galvanized high-strength low alloyed steel with fine structure and excellent cold formability. Hereafter: TL.
HCT600X + Z—high-strength dual-phase steel galvanized on both sides with excellent formability, capable of absorbing impact energy, resistant to fatigue. Hereafter: HCT.
HX340LAD + Z—high-strength low alloyed steel with good formability and high yield strength. Hereafter: HX.
The thickness of all materials was 0.8 mm. The chemical composition of the materials used is given in Table 1.
The mechanical properties of the materials used—yield strength (YS), ultimate tensile strength (UTS), elongation (A80), r—coefficient of normal anisotropy and n—strain hardening exponent and surface conditions are shown in Table 2.

2.1. Weldability of Materials Used
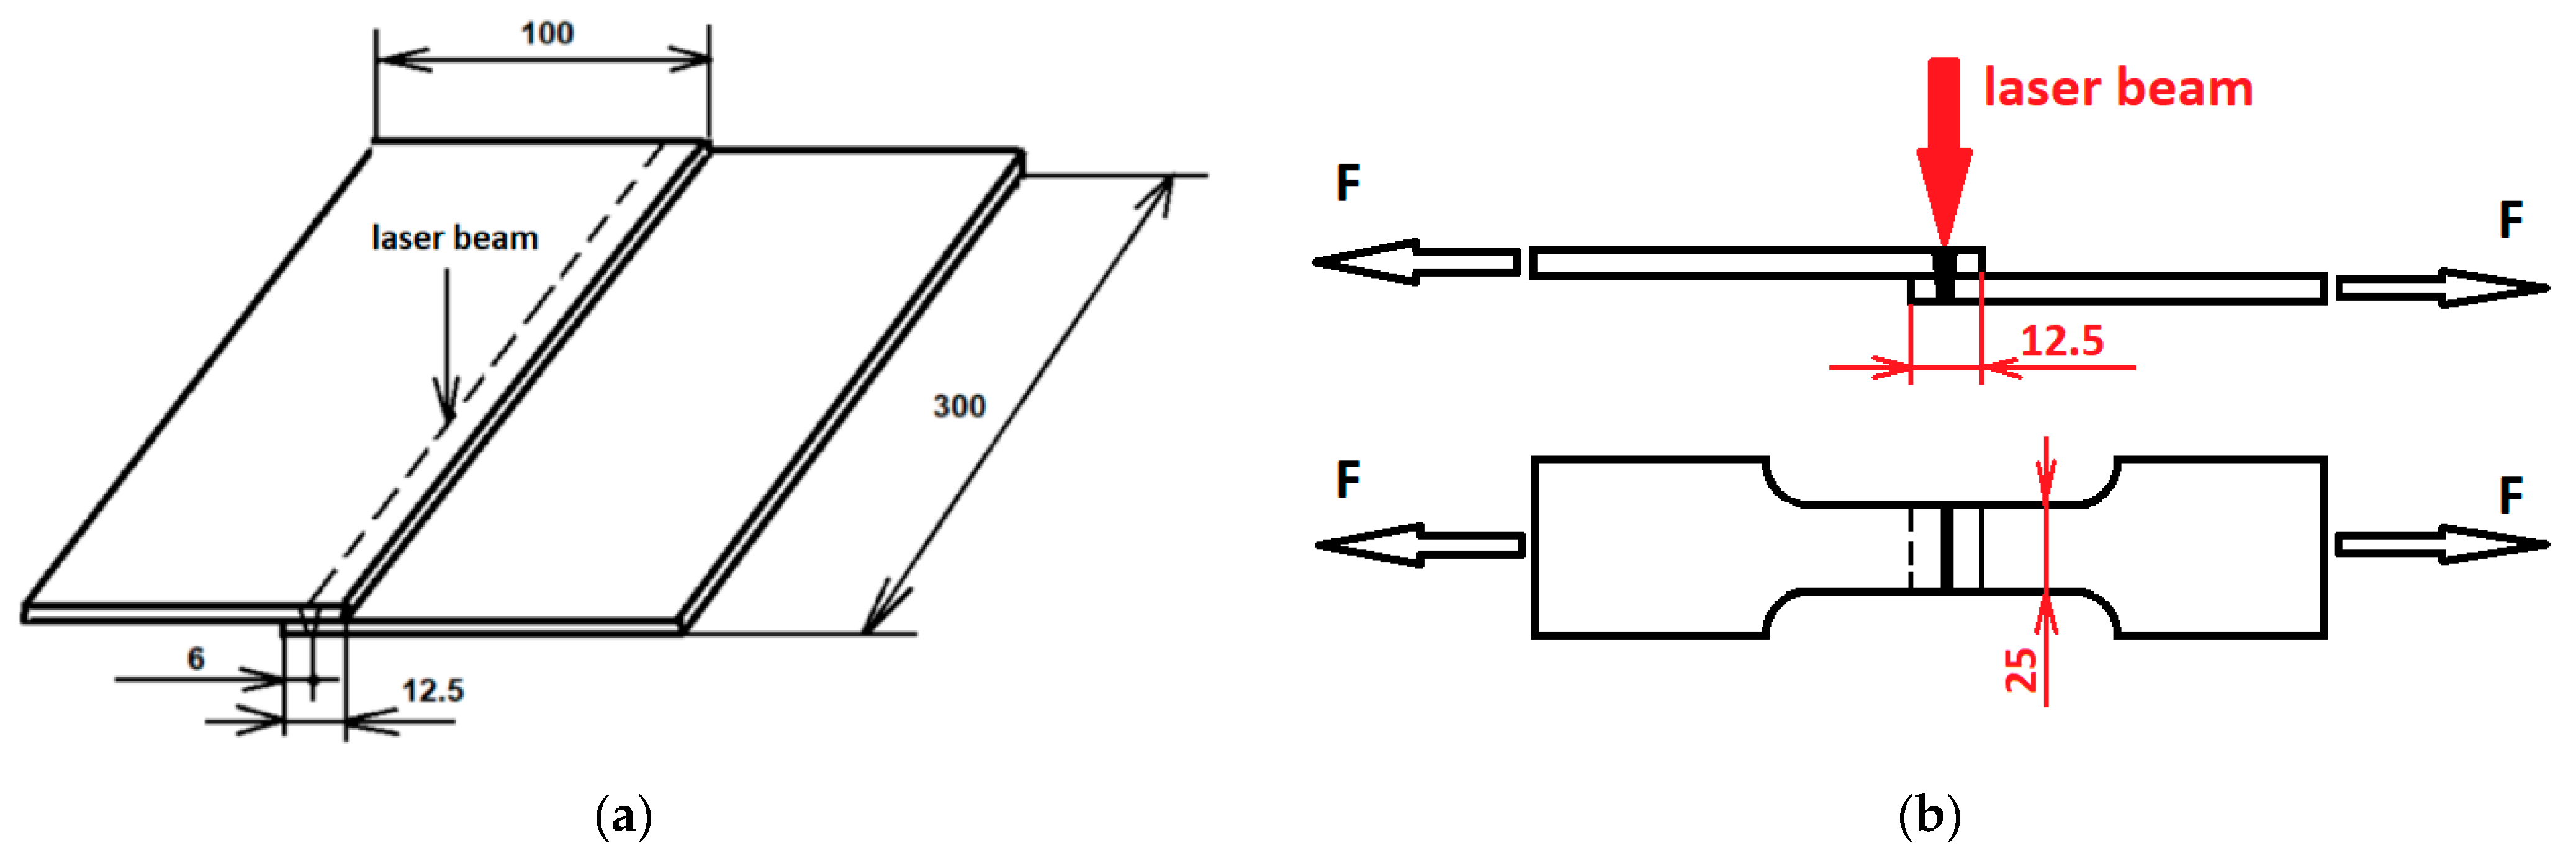
The purpose of calculating the weldability of steels is to determine the minimum necessary preheating temperature to ensure the evaporation of hydrogen from the welds in order to prevent hydrogen-induced cold cracking. The chemical composition of the welded materials together with the wall thickness of the welded material, the content of dissolved hydrogen in the material, the amount of heat input, the residual stresses in the weld, the yield strength of the weld metal, the stiffness of the clamping of the parts, the concentration of stresses in the weld, the number of passes, the speed of preheating and the width of the heated zone, ambient temperature and reheating form a set of factors affecting the sensitivity of the weld to cold cracking [32]. Carbon equivalent (1)
C E ( I I W ) = C + M n 6 + C r + M o + V 5 + C u + N i 15       [ wt   % ]
has long been used to assess weldability and susceptibility to cold cracking [33]. This index works reliably for steels with a carbon content > 0.12%. However, modern microalloyed steels have a carbon content of < 0.12%. More adequately, the weldability of these steels reflects the carbon equivalent (2) [34].
P C M = C + S i 30 + M n + C r + C u 20 + N i 60 + V 10 + M o 15 + 5 · B       [ wt   % ]
Susceptibility to cold cracking is determined by the hardness of the welds (HAZ and weld metal). The hardness of the weld is determined by the interactive influence of weld hardenability and carbon content. The following carbon equivalent (3) takes this effect into account and can evaluate the weldability of steel over a wide range of carbon content [35]:
C E n = C + f ( C ) · [ S i 24 + M n 6 + C u 15 + N i 20 + ( C r + M o + N b + V ) 5 ]       [ wt   % ]
where
f ( C ) = 0.75 + 0.25 · tanh [ 20 ( C 0.12 ) ]       [ wt   % ]
With decreasing carbon content, the function f(C) decreases from 1.0 to 0.5. Therefore, for steels with C > 0.15%, CEn is close to CE(IIW), and for steels with lower carbon content, CEn is close to CE(IIW).
Due to the content of alloying elements in the used steels, it is sometimes difficult to choose a suitable formula for calculating the carbon equivalent; therefore, we calculated the carbon equivalent for individual materials according to all three formulas, Table 3.
When melting and solidifying dissimilar materials in a simple overlapped joint, the basic materials themselves are actually remelted (Figure 1, blue area)—then the carbon equivalent of the individual materials (Table 3) are applied, as well as their mutual mixing (Figure 1, red the area).
In the case of welding of dissimilar materials, according to [36], it is necessary to start from the chemical composition, calculated as the average of the content of the individual elements of the materials to be welded. Then, the carbon equivalent values will also lie between the carbon equivalent values of the welded materials. The carbon equivalent values for the different combinations of welded materials are given in Table 4.
Considering the calculated CEn values, all steels were welded without preheating.

2.2. Test Samples

The scheme of laser weld formation, shape and dimensions of the test specimens are shown in Figure 2. Plates of 100 × 300 mm were made from each material by shearing. The plates were then one-sided laser welded, with a laser incidence angle on the upper plate of 90°, Figure 2a, with a plate overlap of 12.5 mm. Test specimens to determine the tensile load capacity of the joints were made from welded plates by waterjet cutting, Figure 2b. The procedure was chosen so that the individual test specimens did not contain the beginning and end of the weld.

2.3. Material Combinations and Welding Parameters

All combinations of all materials were made in the joining process, as the aim was also to find out the influence of the position of the materials in the joint. The material combinations are shown in Table 5. Parameters of the welding: laser power: 1.7 kW, weld speed: 40 mm/s, defocusing distance: 0 mm. The welding was carried out without filler material.
A Trudisk 4002, high-power solid-state laser (TRUMPF Pvt. Ltd., Pune, India) was used for welding. The maximum power of this laser is 4000 W, wavelength 1030 nm.

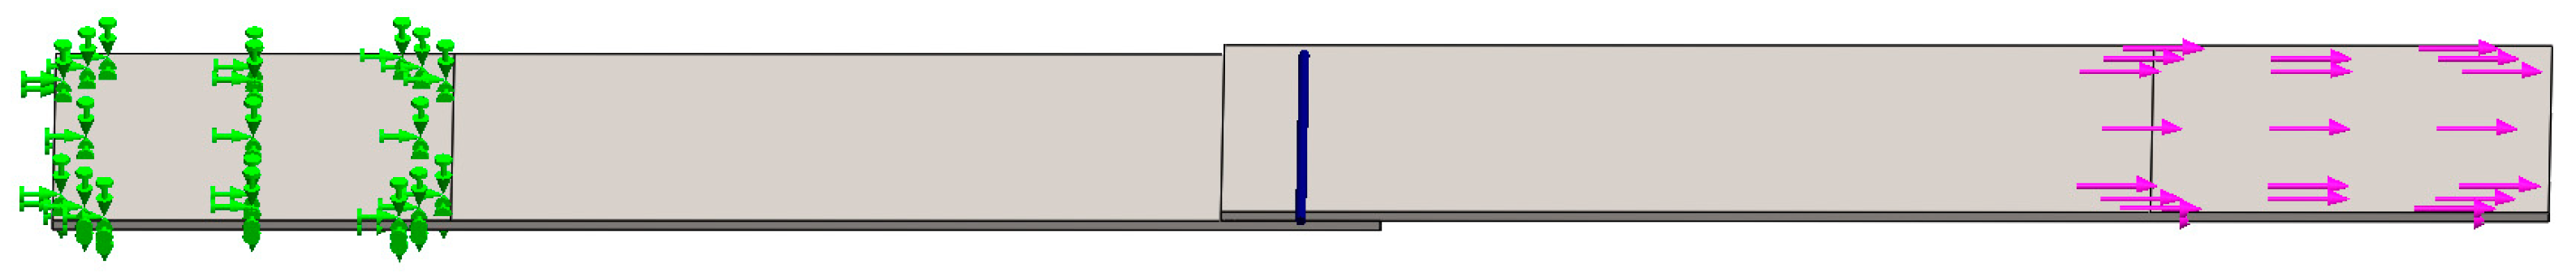
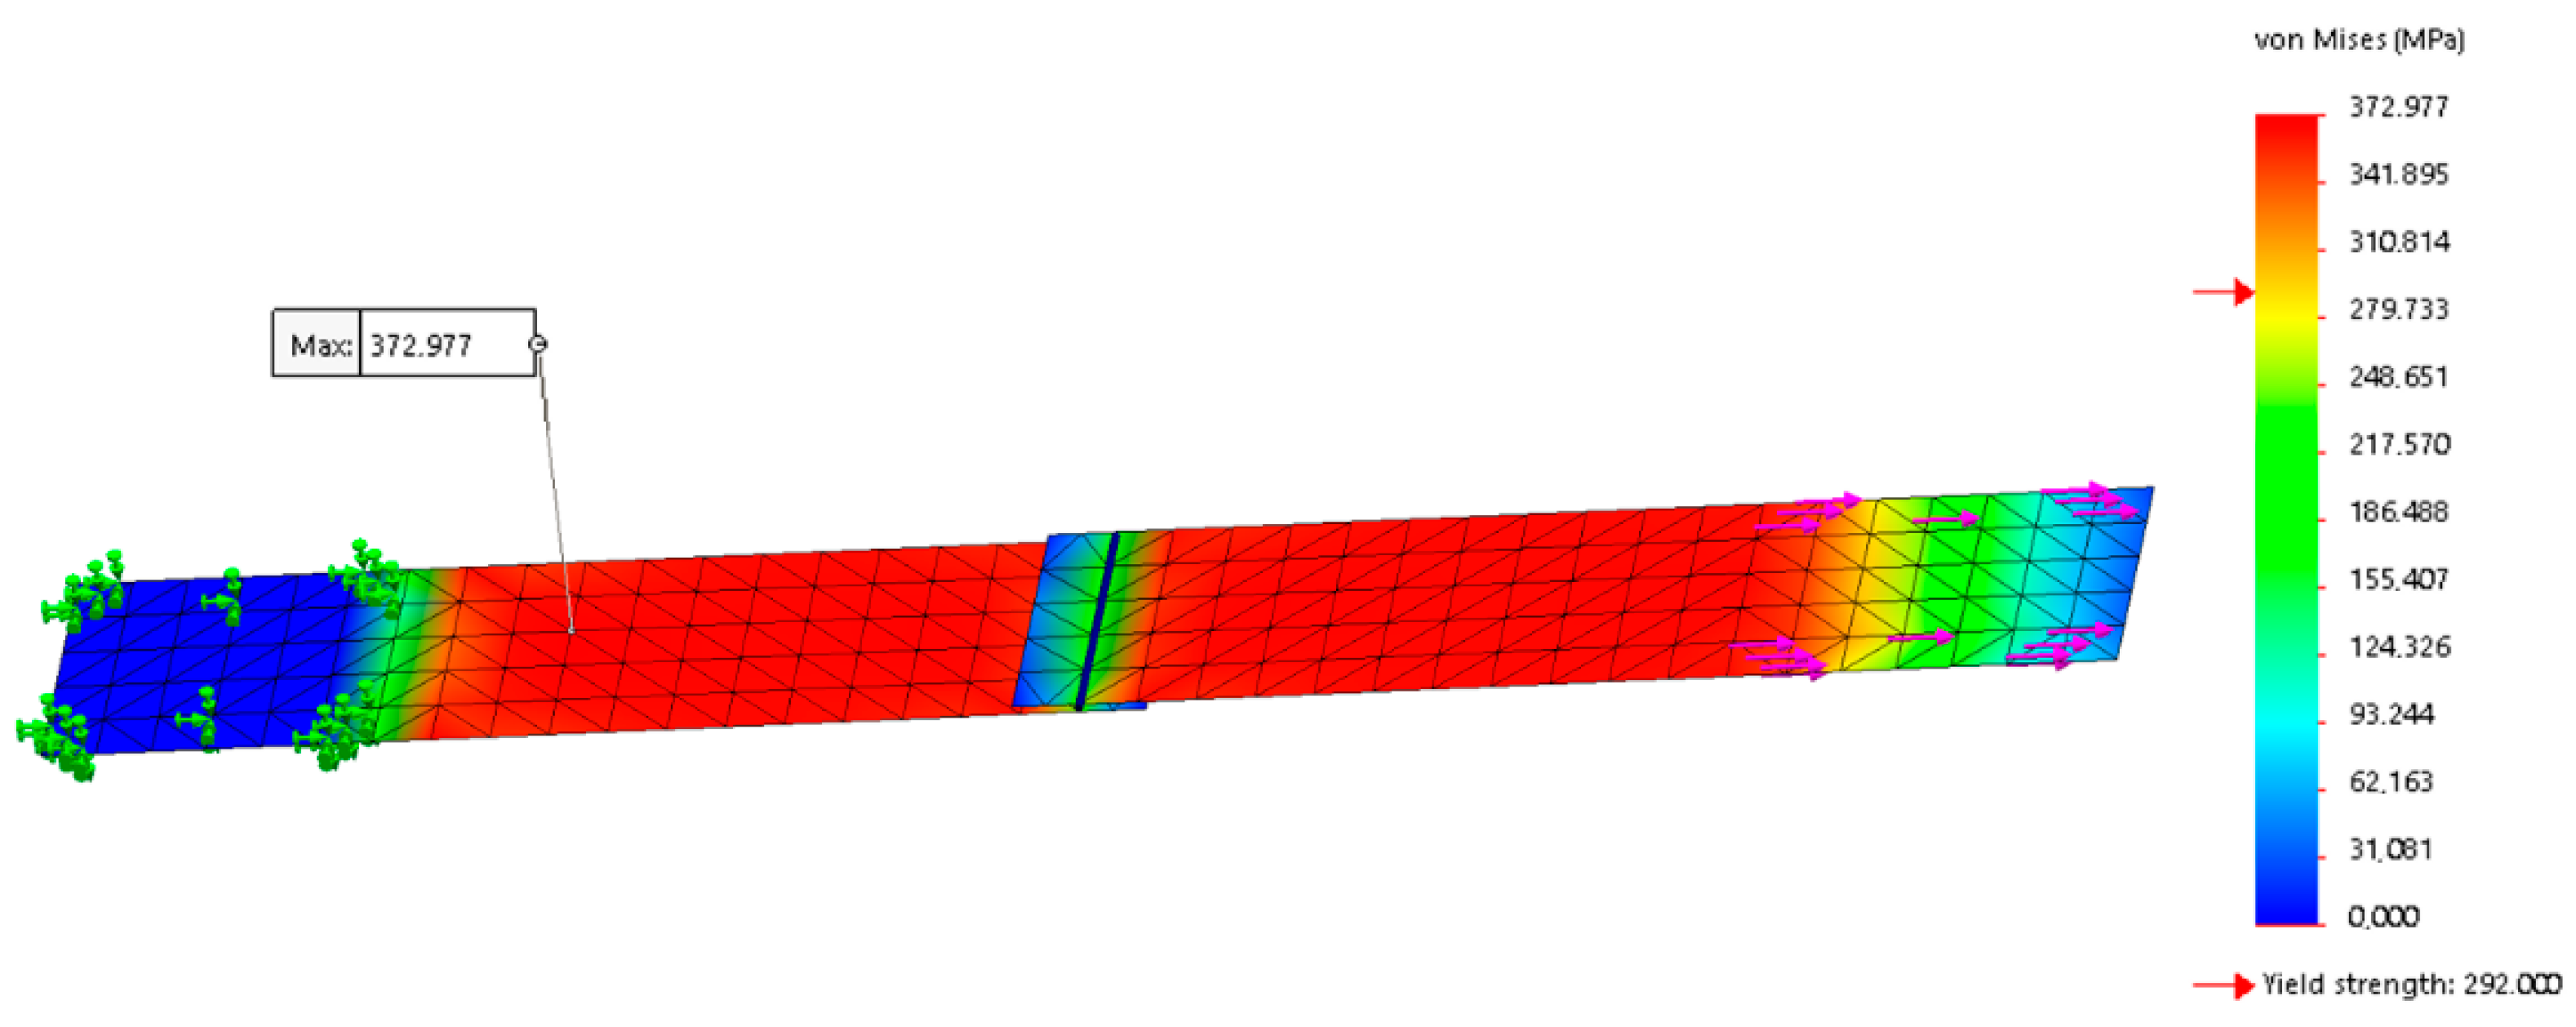
2.4. FEM Calculation of Weld Joints Carrying Capacity

A simple FEM analysis of welded joints was carried out in Solid Works software. Modeling sheet metal plate solid bodies was the first stage. The metal plates have the following measurements: 25 mm wide, 100 mm long and 0.8 mm thick. Although the welded material is in fact a spatial solid with a relatively small thickness, when creating a model in Solid Works for FEM analysis, the steel plate is defined as a 2D object. The model assembly consists of two 2D objects that share a common weld line, Figure 3. Materials were defined in a library using the manufacturer-specified attributes before being built up in the FEM environment for the study. Due to the properties and the shape of the studied geometric model, a finite element of the Jacobian type with the number of nodes 4 was used. Automatic finite element mesh was used, in which the compatibility of the created finite element mesh is ensured. Variable finite element mesh size was used when meshing the object, a denser mesh was used in areas where large stress changes are expected. The size of the finite element mesh for the Jacobian 4 point type was determined by successive numerical iterations in Solid Works, and was chosen to be 3.6 mm, while the size in the place of the weld and its surroundings was chosen to be 1.5 mm, taking into account also the information and experiences of other researchers [37]. The size of the element in the weld area was set also with respect to the size of the weld area, determined on the metallographic sections.
The next step was to test the developed model by verifying the yield strength for each material. The welding was modeled as a groove weld since the laser weld function is not included in the Solid Works menu. The weld was placed along the weld line; its features can be easily changed. Boundary and force conditions were defined. Boundary conditions can be entered directly before writing nodal displacements (rotations) and nodal forces of individual nodes. To simulate the failure of a joint, one plate of the assembly must be stationary in all directions while a linear movement of elements is applied to the other plate. The linear movement causes a stress distribution in both sheet metal plates. The variable meshing avoids the occurrence of a local stress maximum, Figure 4.
The ultimate tensile strength is obtained in the same way as the yield strength. There is no suitable function available in Solid Works for determining the maximum force at weld failure, so sequential calculations using coefficients were used. By successive iteration, the force at which the weld will fail was found.

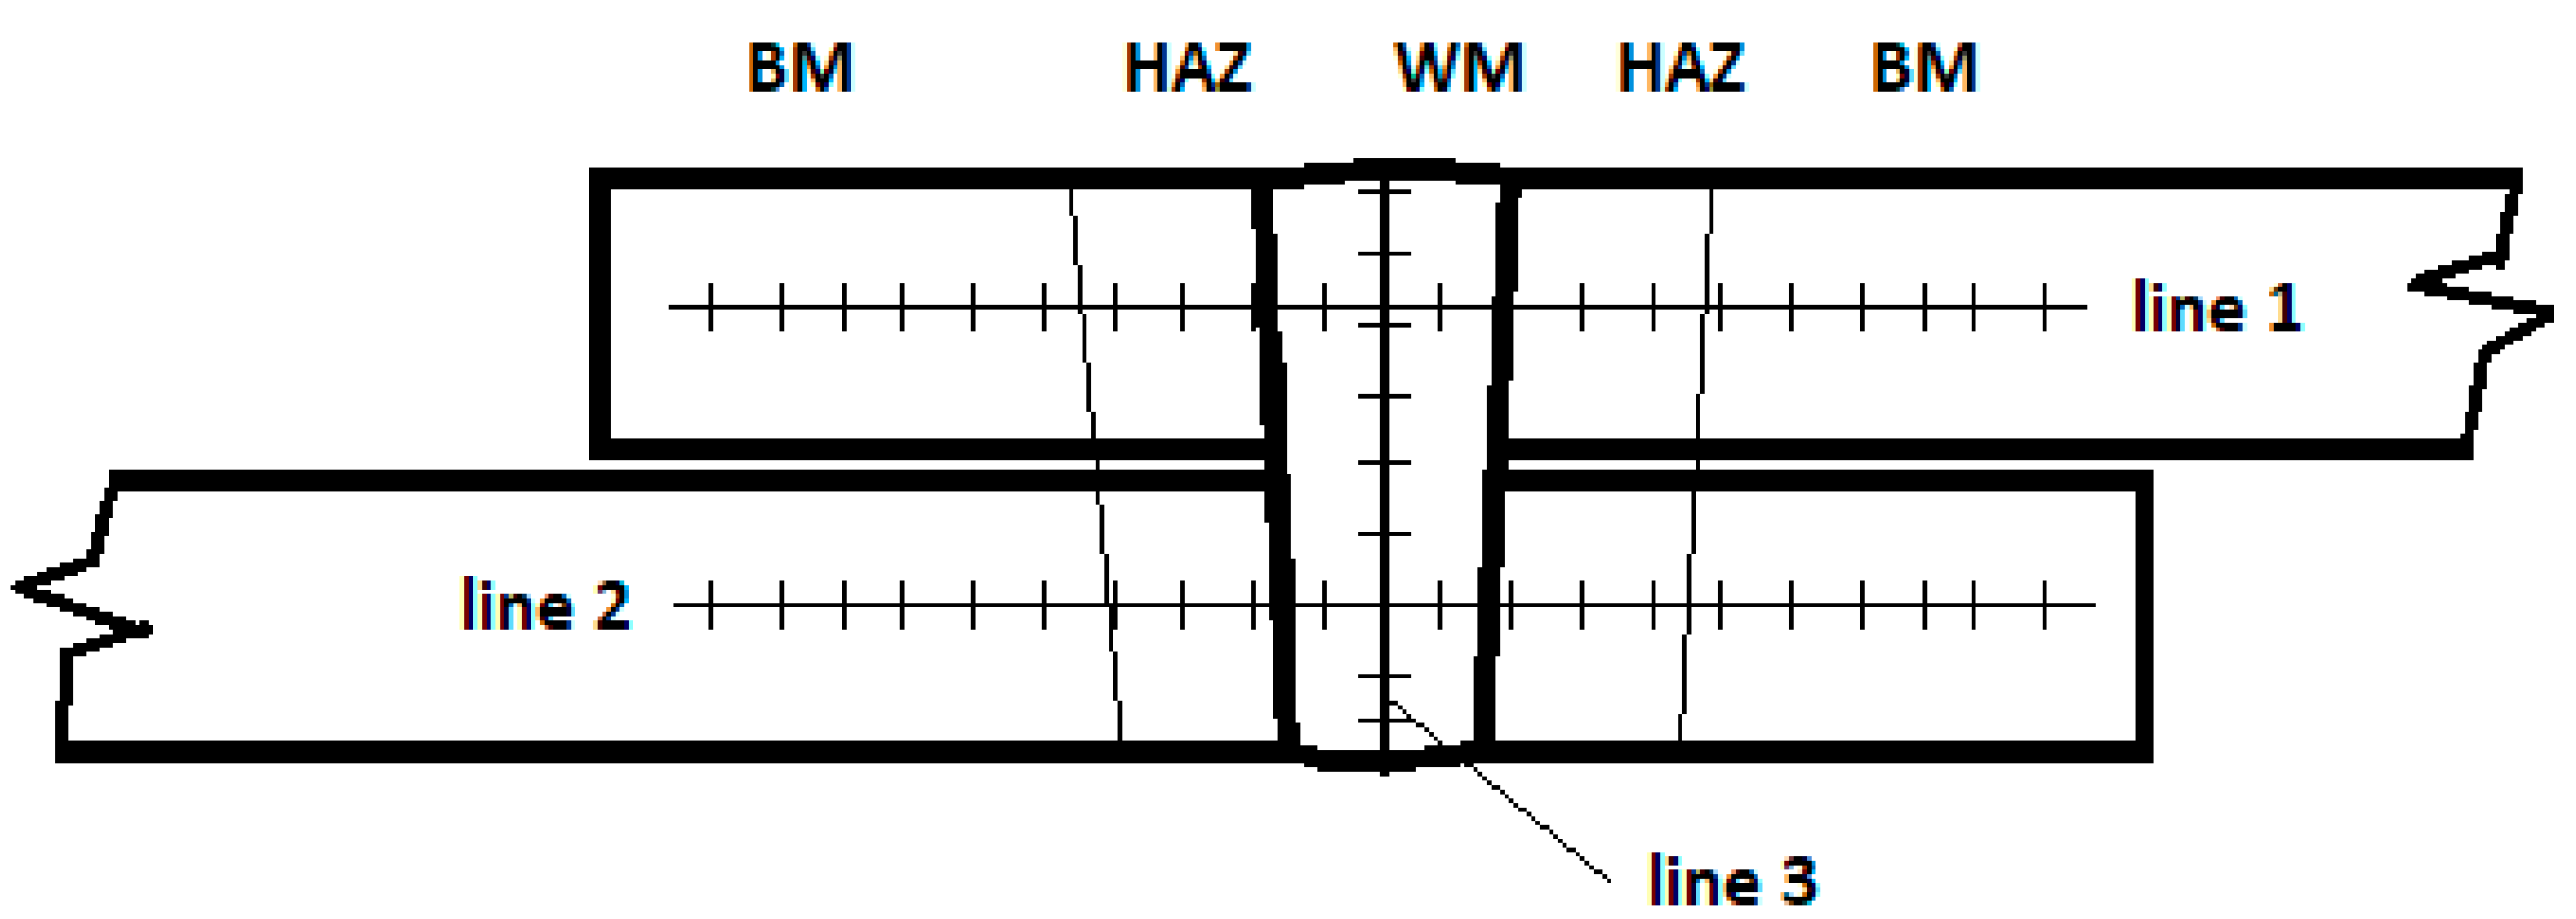
2.5. Metallographic Analysis of Welds

Samples were taken from the prepared welded plates for metallographic study of the welds. The preparation of the metallographic sections was carried out in the standard way—mounting in acrylic resin, grinding, mechanical polishing and etching in 2% Nital. Image documentation was taken using an Olympus BXFM (Olympus Deutschland GmbH, Hamburg, Germany) light microscope. The weld metallography evaluation identified weld defects according to ISO 6520-1 [38], as well as selected imperfections of shape and weld dimensions, the presence of pores or the contact angle of dendrites in the weld axis. EDX linear and planar analysis was performed in the different areas of the fusion zone on a Scanning electron microscope EVO MA15 EDX/WDX (Oxford Instruments, Abingdon United Kingdom).

2.6. Microhardness of Welds

The prepared metallographic sections were also used to measure the microhardness of the welds. A Shimadzu HMV2 microhardness tester was used for the measurement, with a load of 0.1 kg and a dwell time of 15 s (HV0.1). Due to the thickness of the materials used, the hardness measurement line was drawn approximately in the middle of the thickness of each plate and one line of measurements was drawn perpendicular to the overlapped plates—across the weld, Figure 5. The spacing between indentations was 0.1 mm.

2.7. Weld Load Capacity Testing

The load capacity of the welded joints was then tested under tensile stress (Figure 2b) on a TIRA test 2300 universal testing machine (TIRA GmbH, Schalkau, Germany) at a testing machine ram speed 10 mm/min, which corresponds to quasi-static strain rate 0.0033 s−1 when considering specimen dimensions [39,40].

3. Results and Discussion

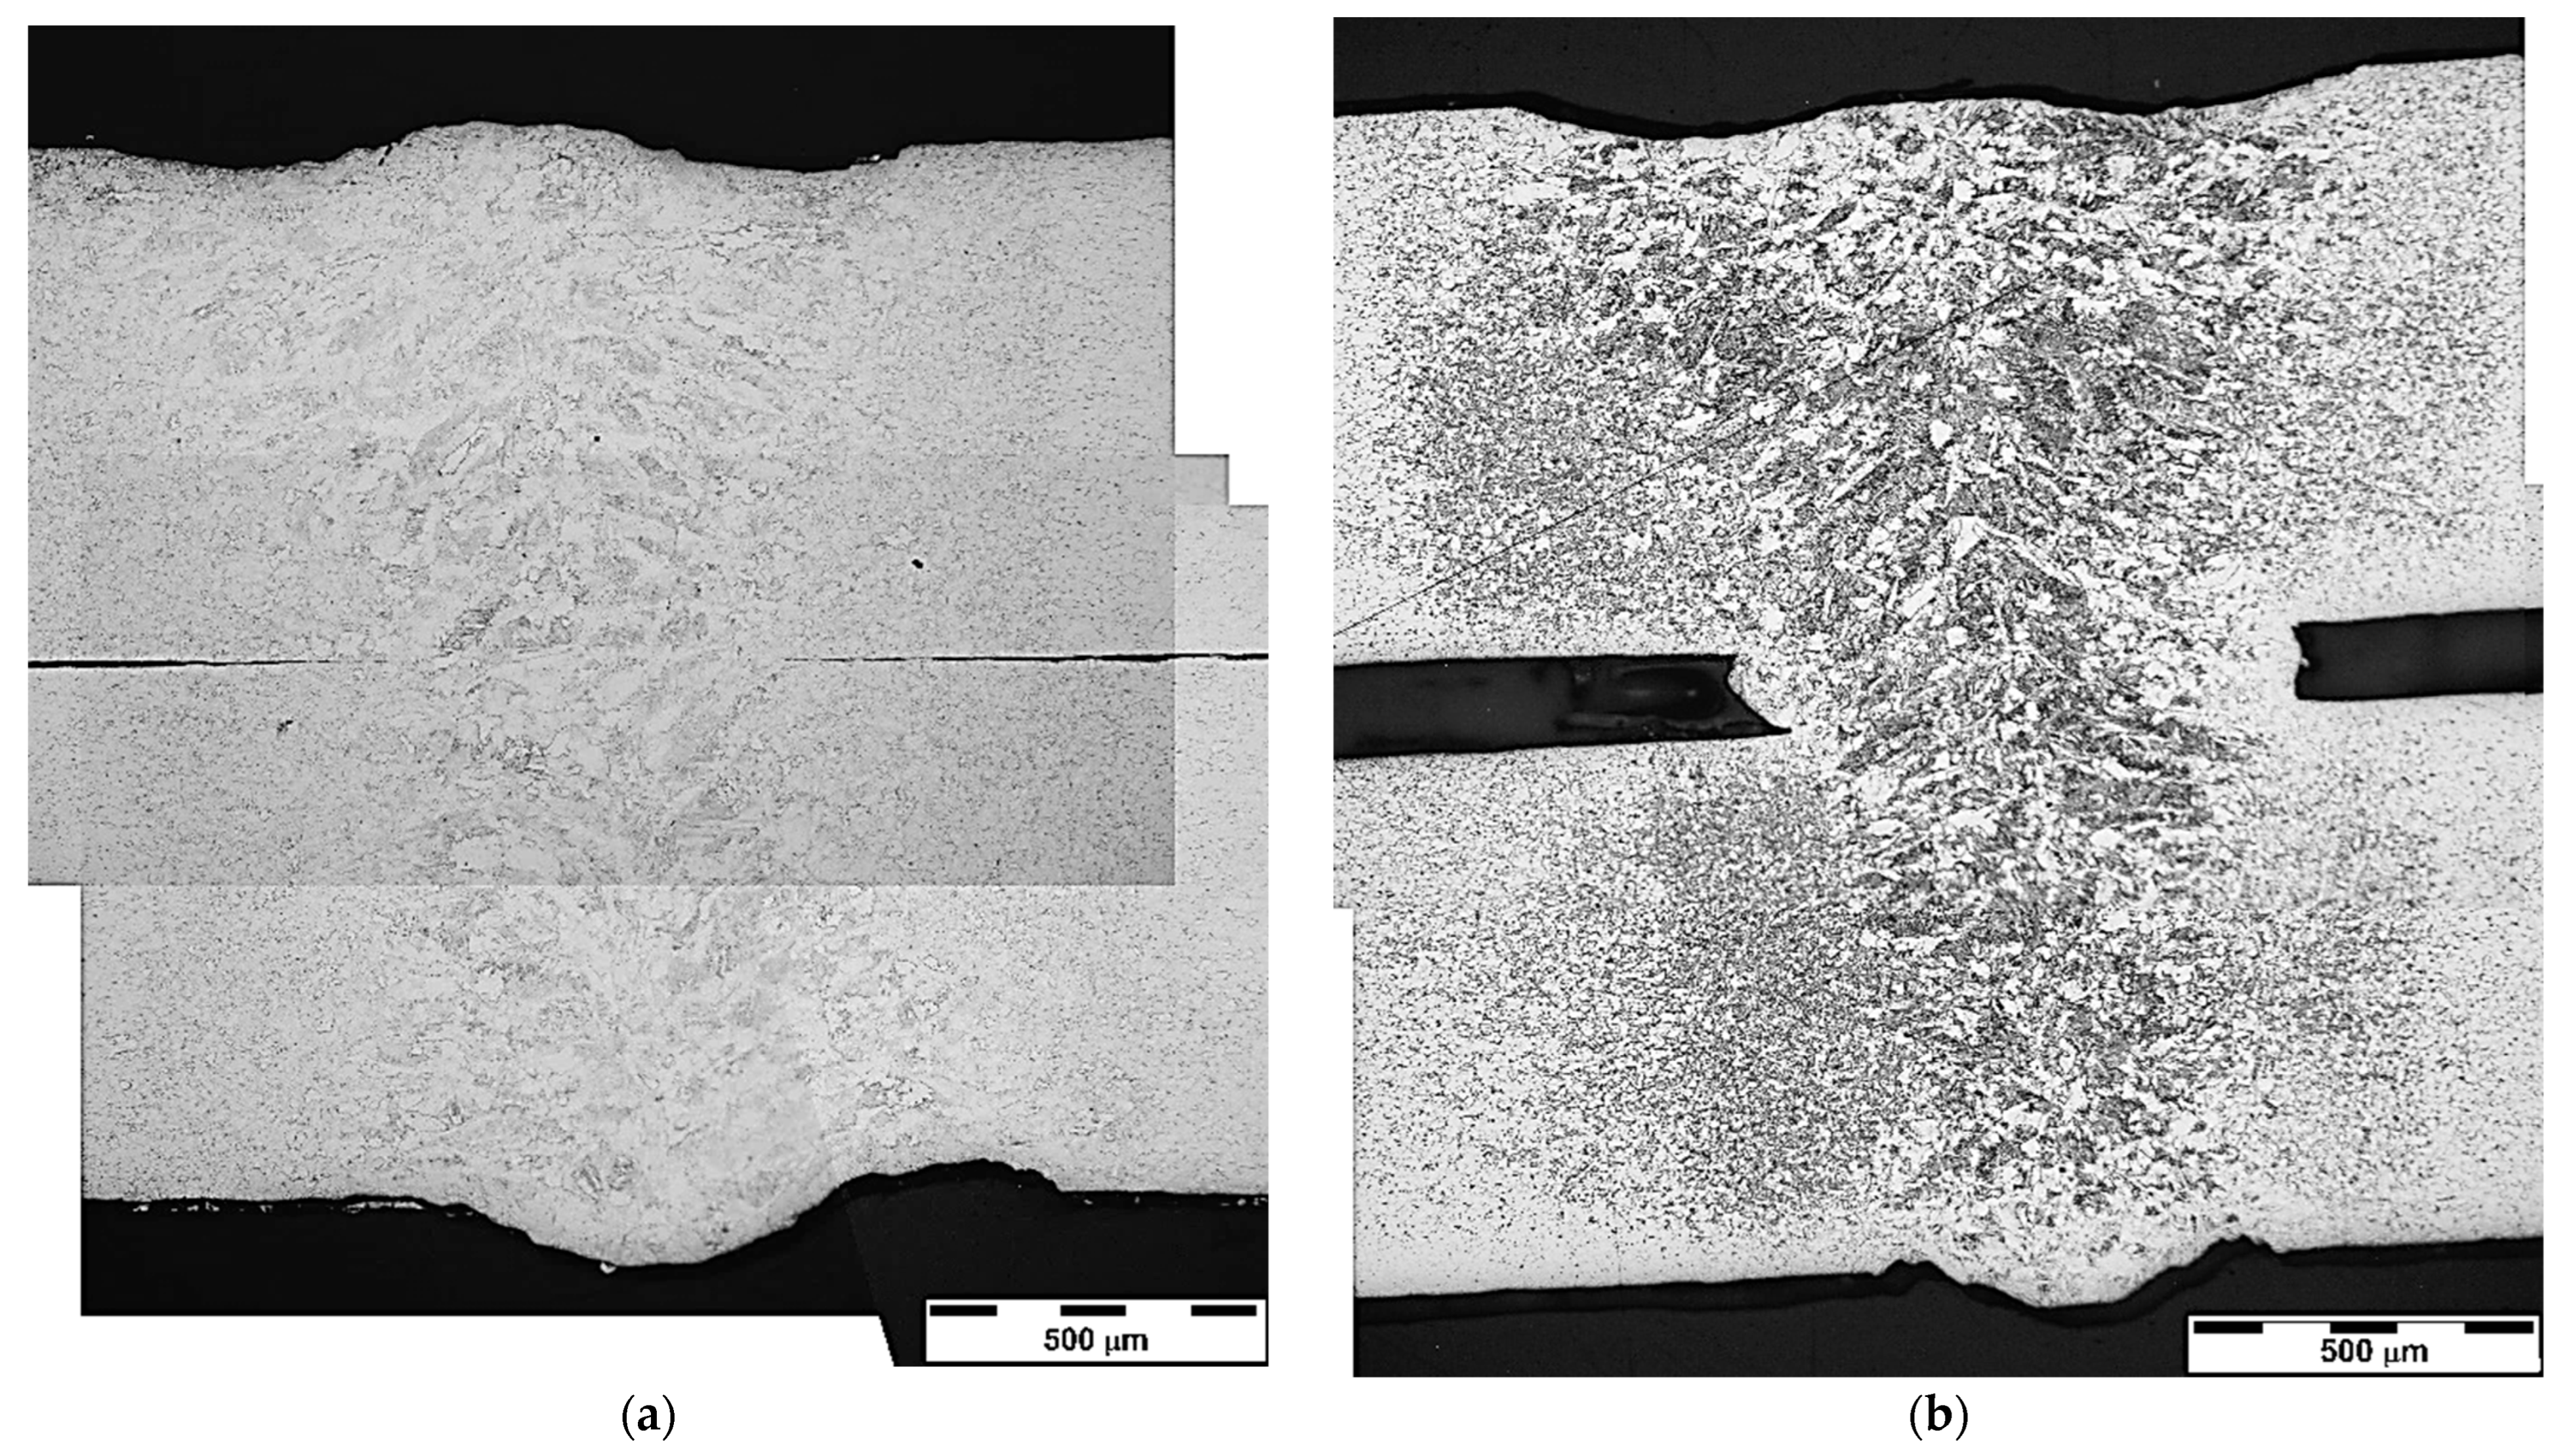
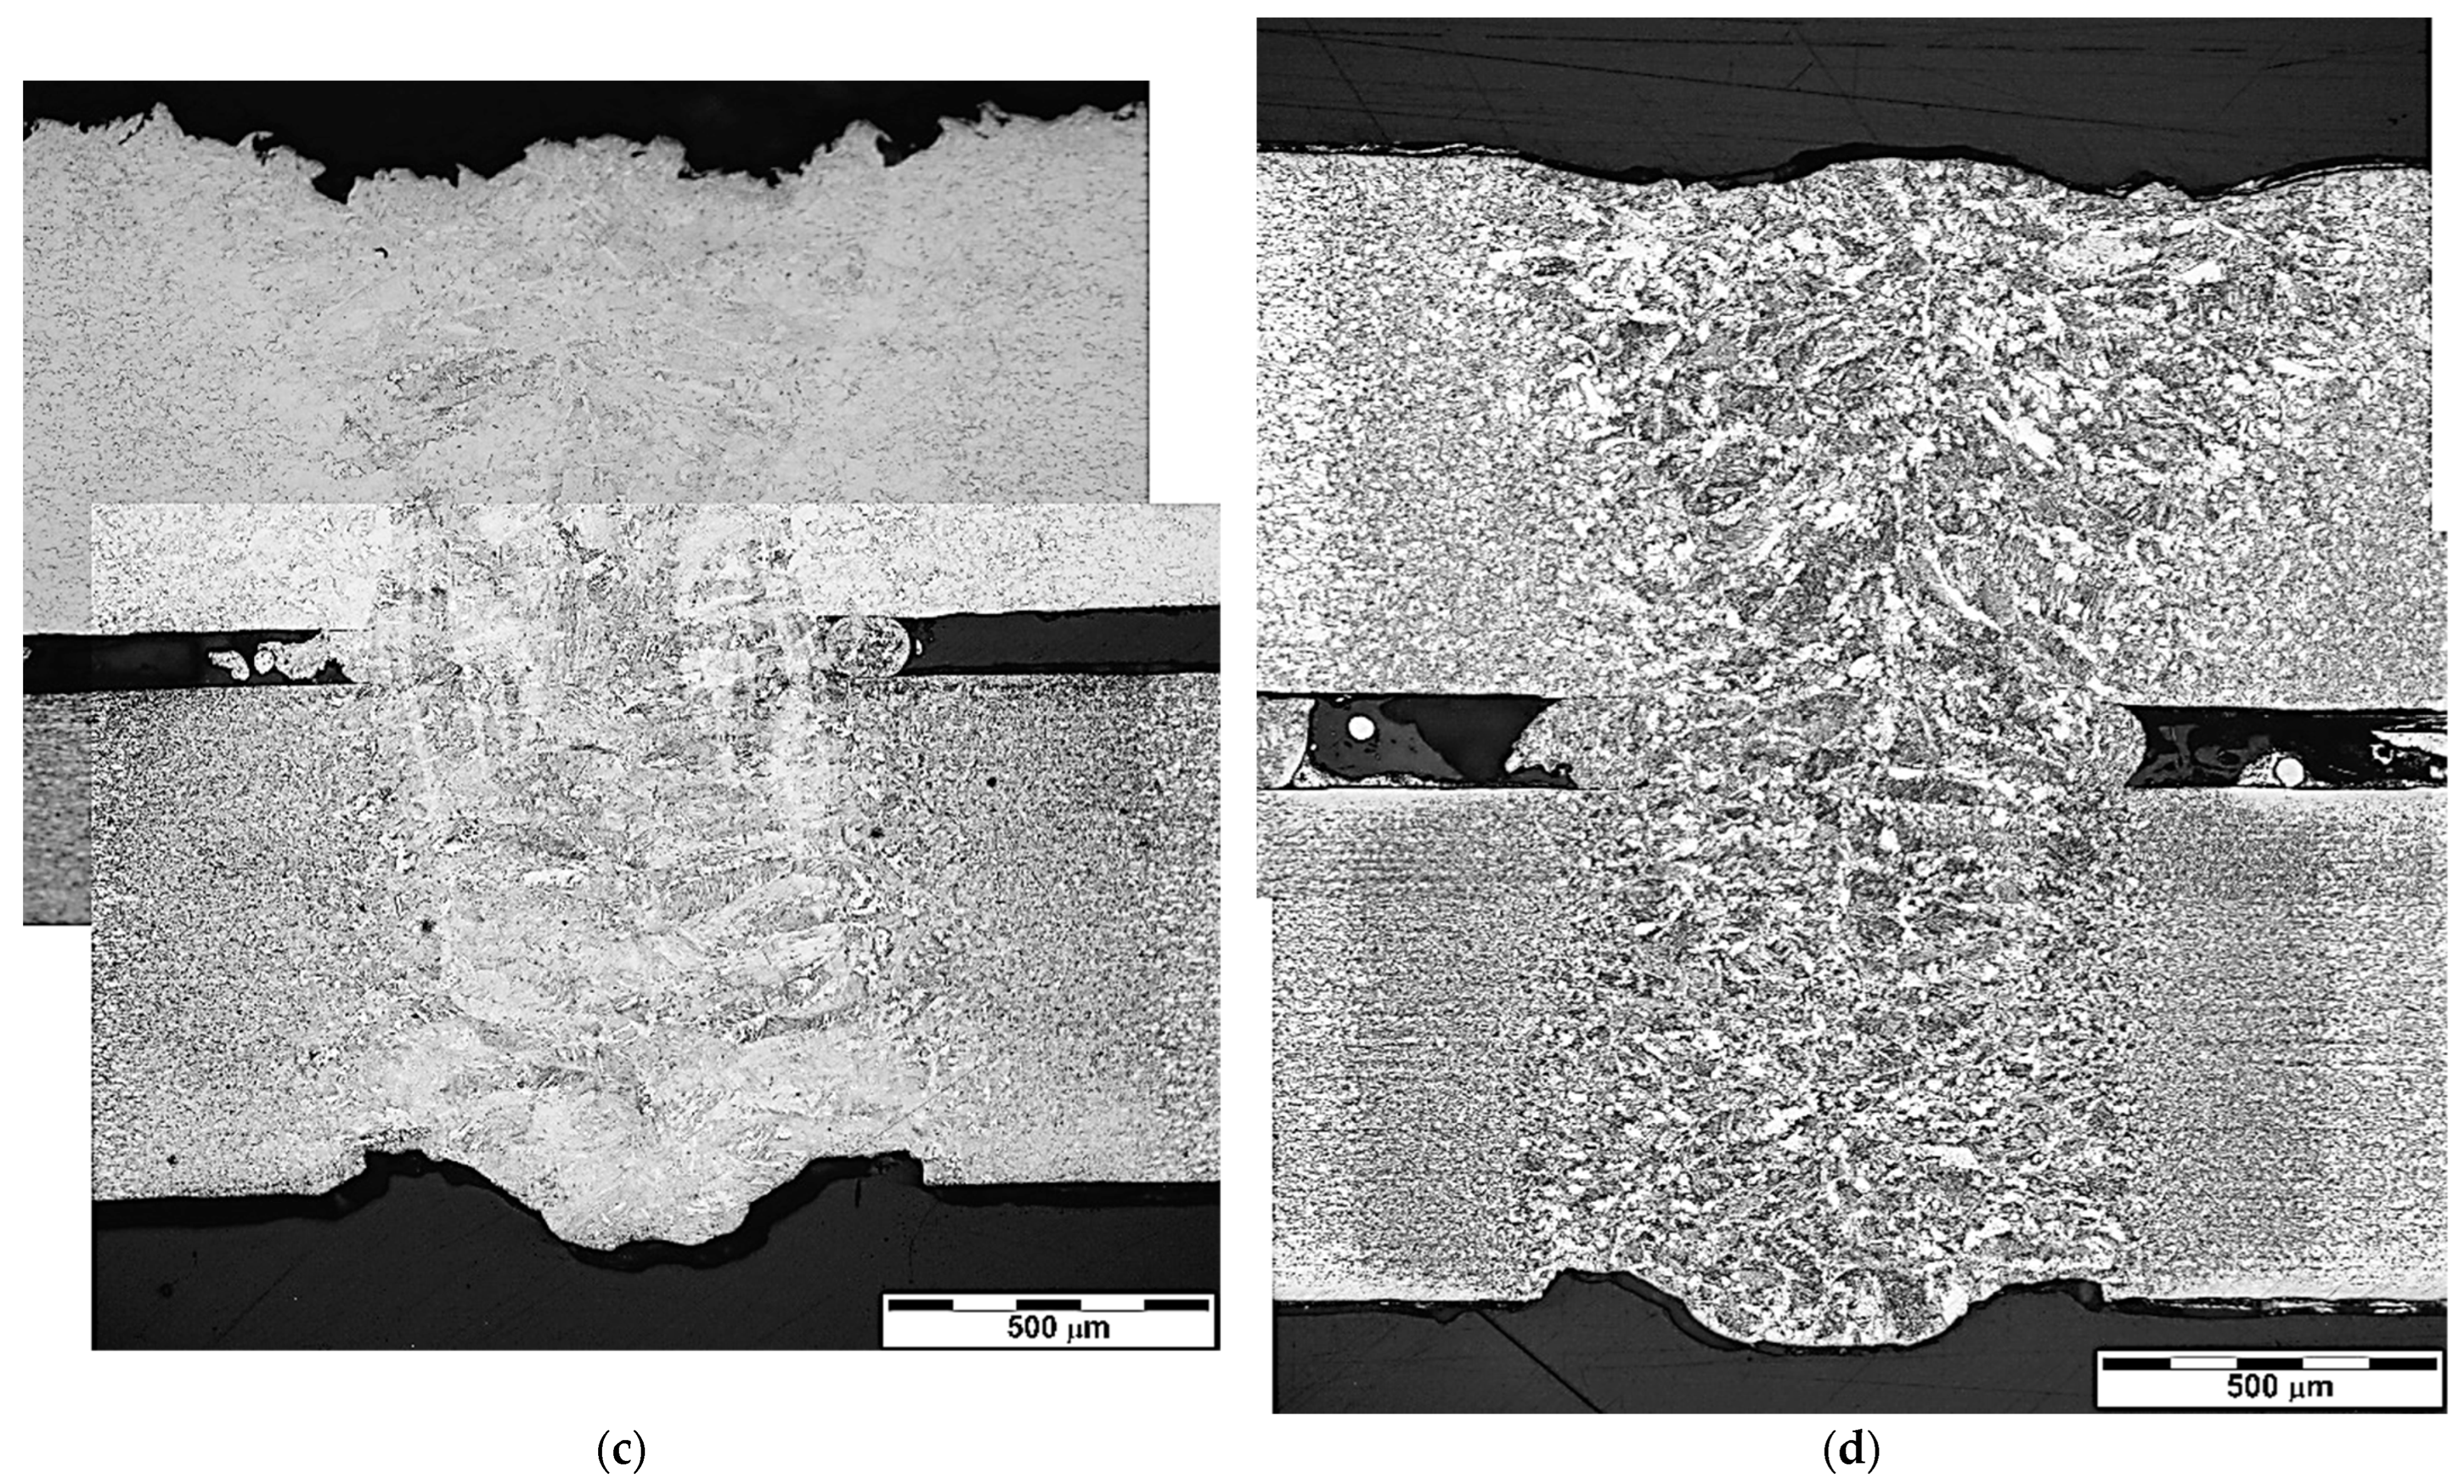
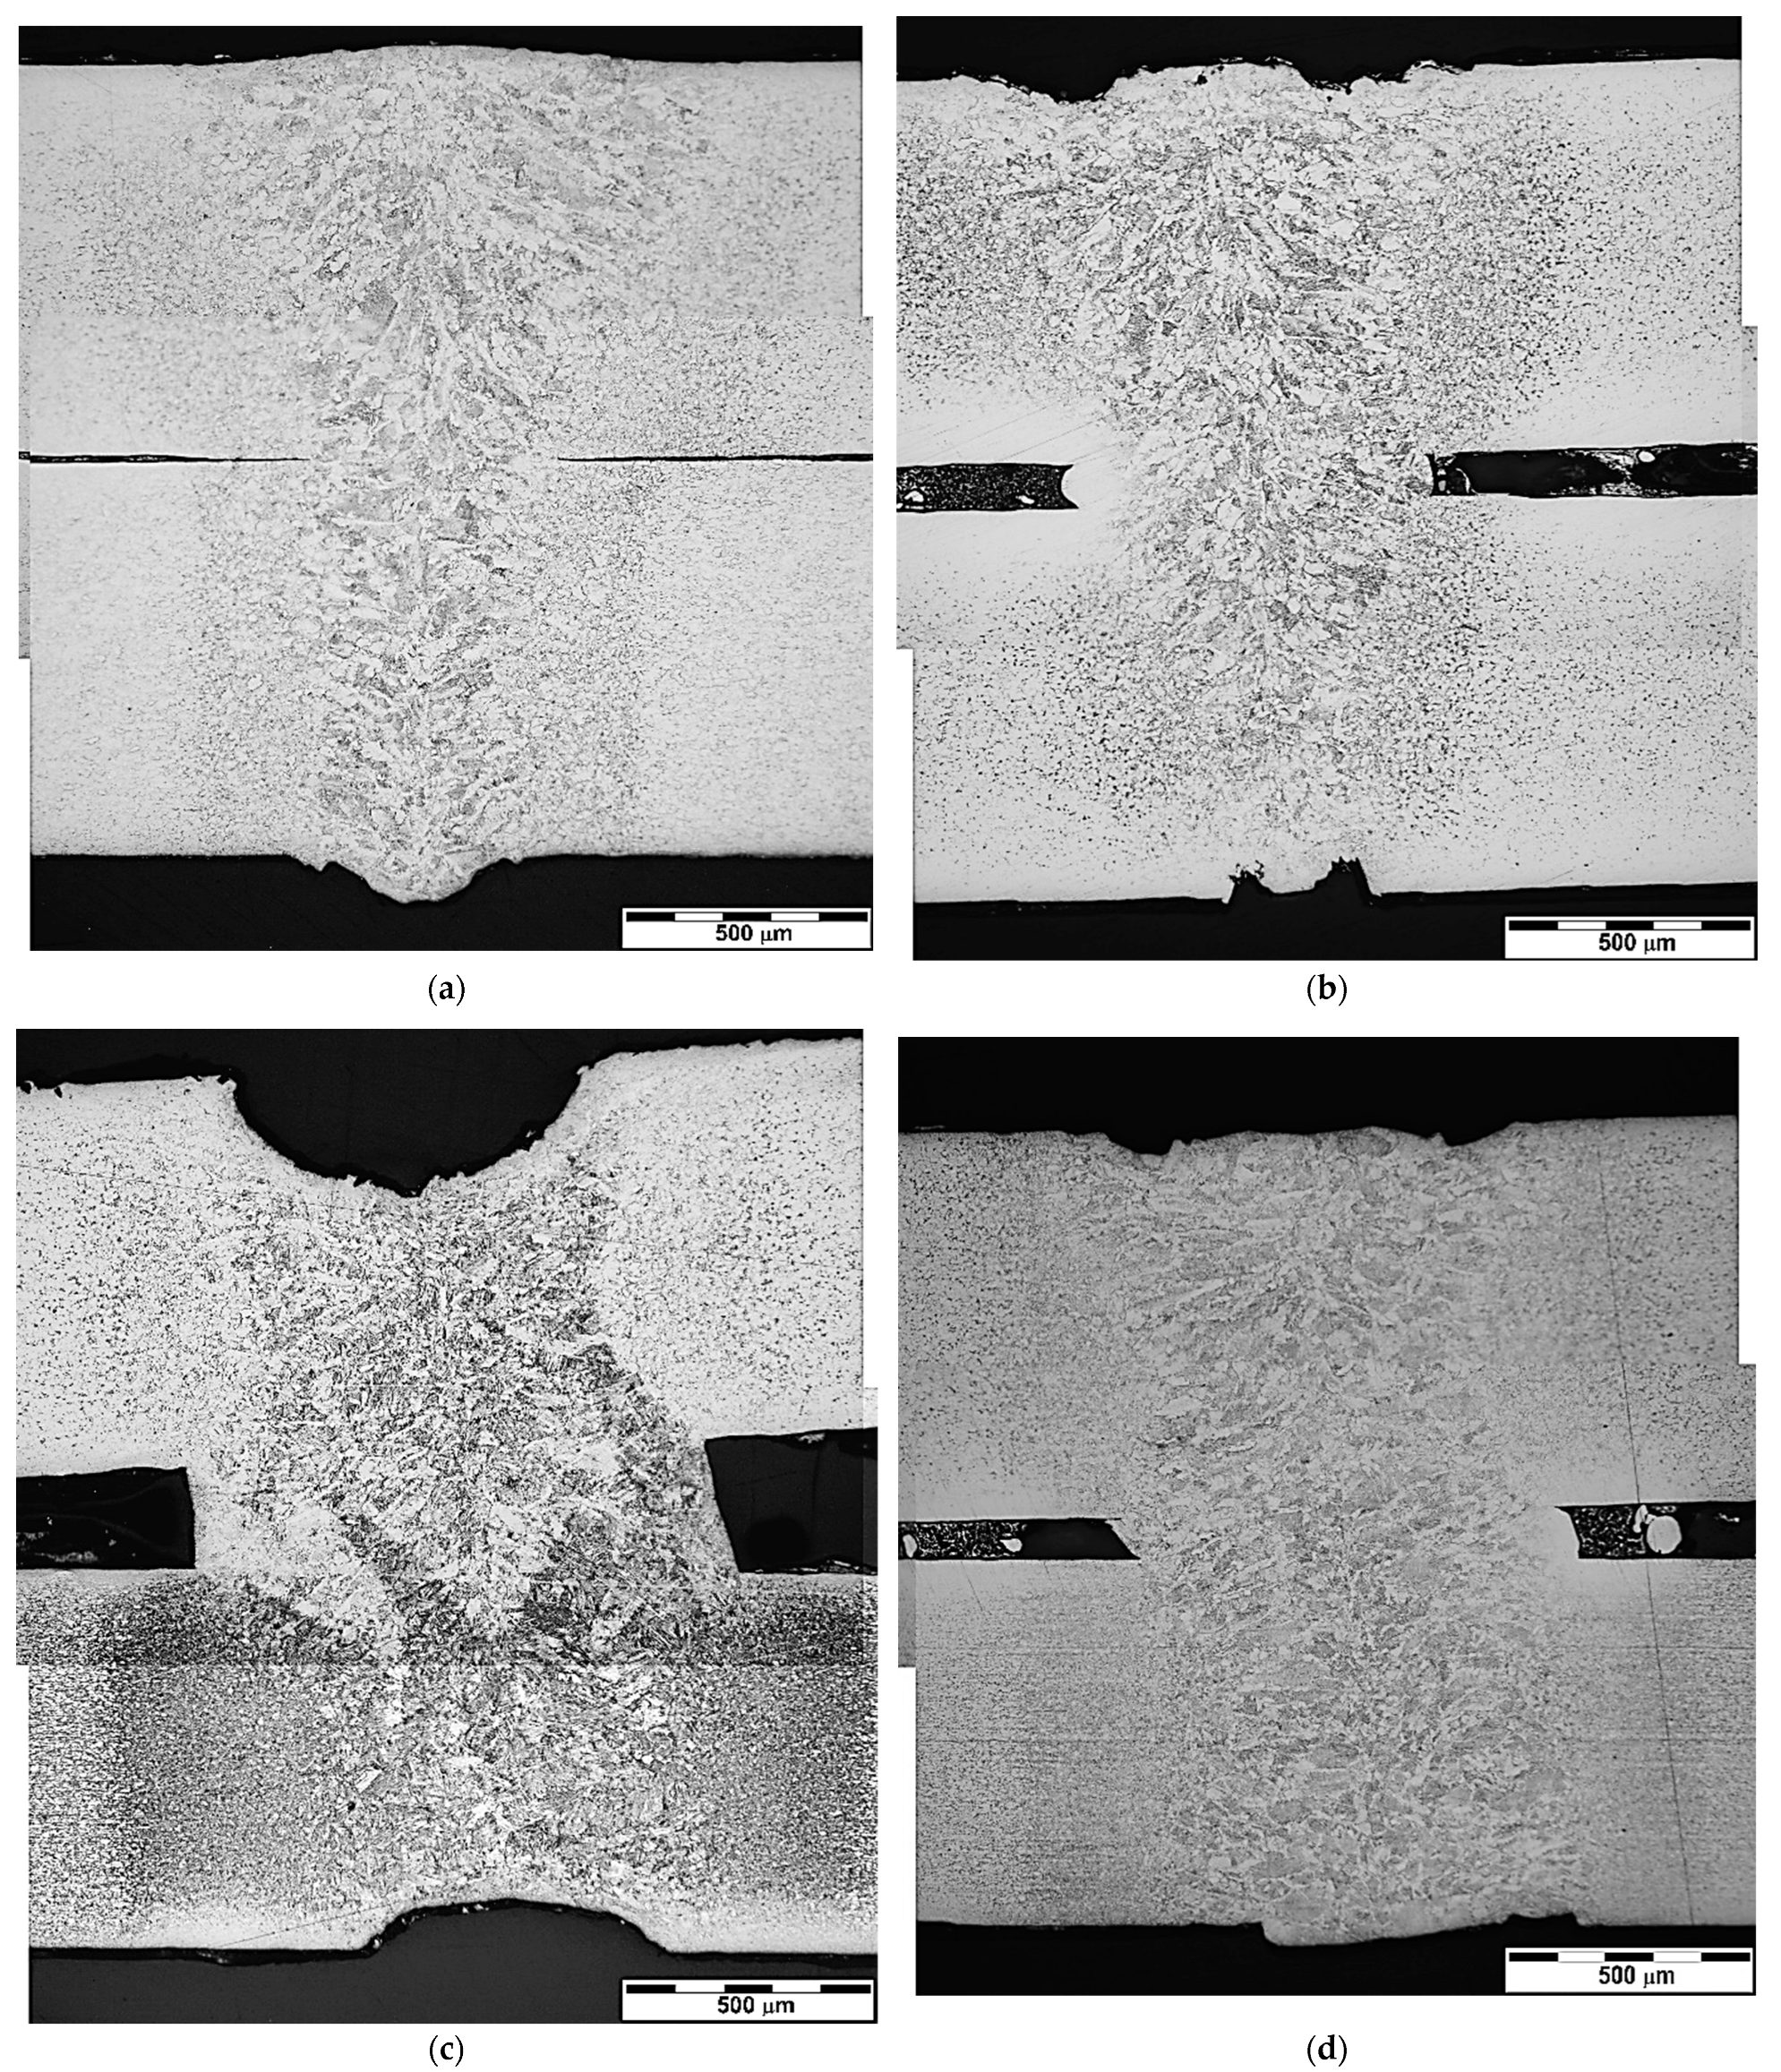
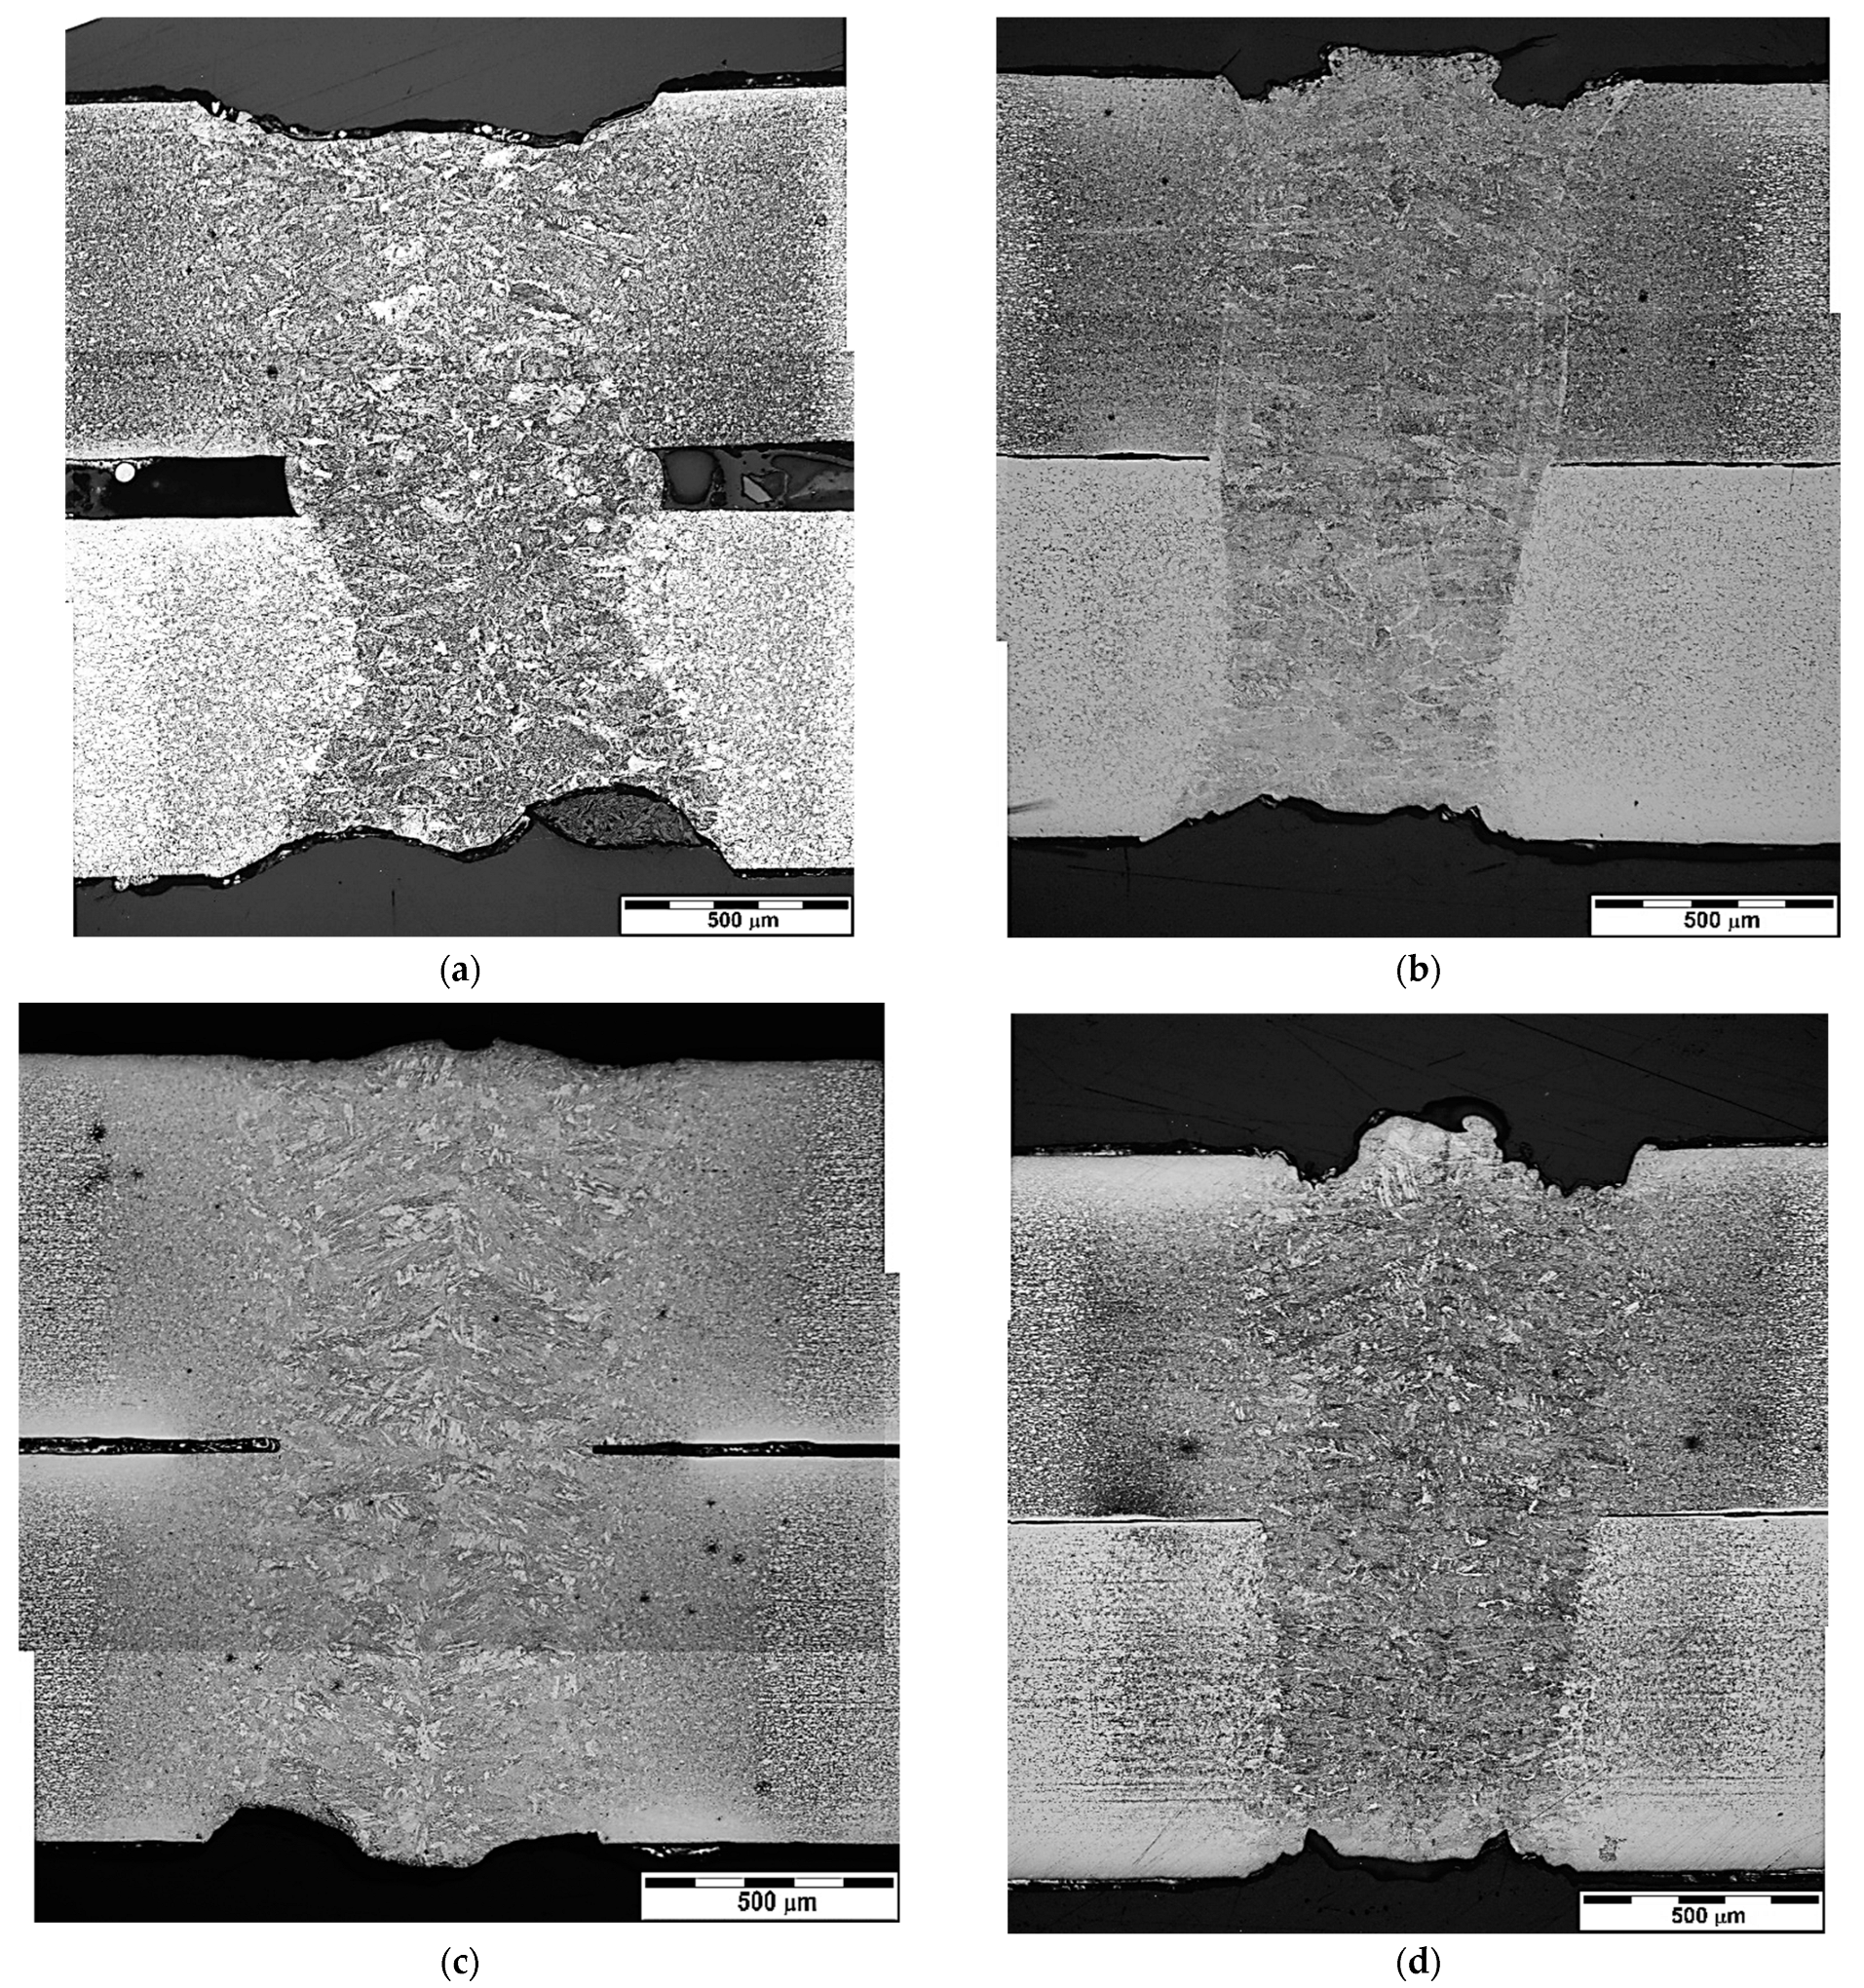
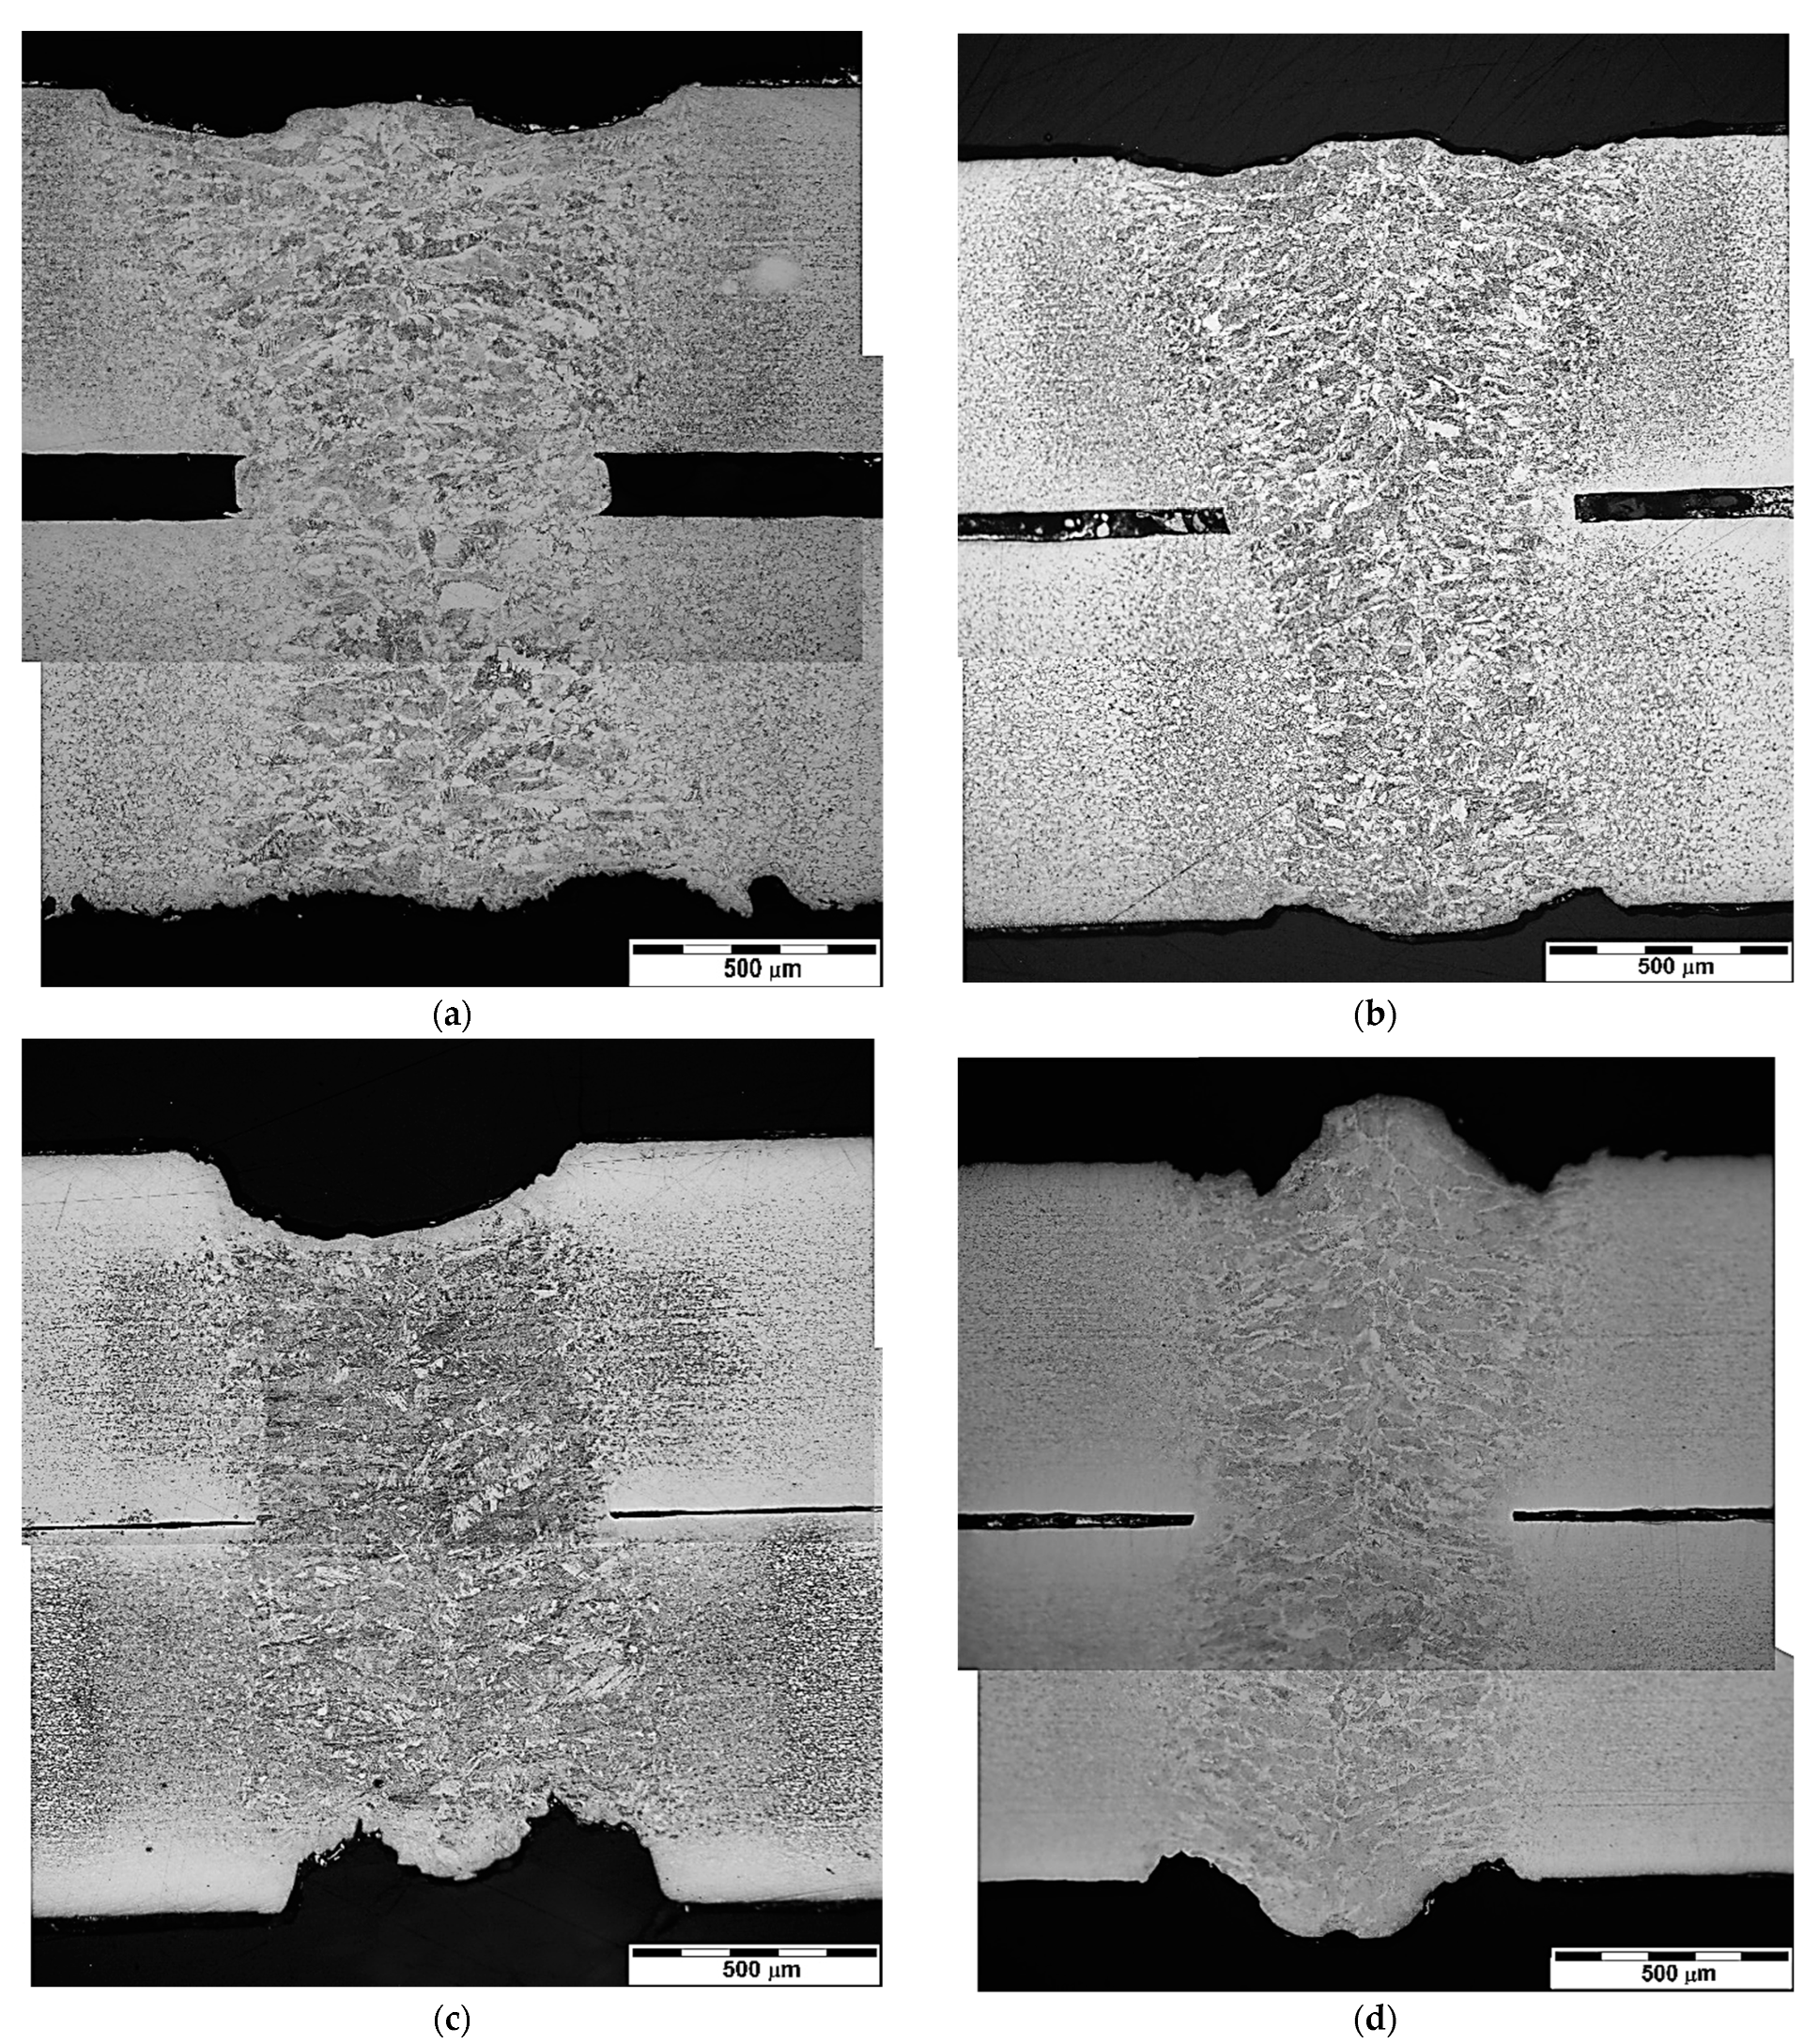
3.1. Weld Metallography

Figure 6, Figure 7, Figure 8 and Figure 9 show a gallery of metallographic sections of individual welded joints.
DC-DC weld (Figure 6a) has a minimum gap between materials, continuous penetration, and the surface and root of the weld show slight unevenness, but the surface is relatively smooth, with no undercuts.
DC-HCT (Figure 6c) weld has a relatively large gap between materials, the weld metal has flowed into it. Complete penetration, the surface and root of the weld exhibit more pronounced undercuts, which are more pronounced by the displacement of the weld metal volume into the gap between the materials. The heat affected zone (HAZ) is more pronounced in HCT material compared to DC. In particular, the fine-grained part of the HAZ is well observable. The dihedral angle in DC is estimated to be about 120°. In this case, however, this angle has no influence on the weld purity and the formation of crystallization cracks because there is no joining of the two weld edges in the weld axis, but only remelting of the base material.
The welds DC-TL (Figure 6b) and DC-HX (Figure 6d) have a distinctive pattern, the surface is relatively smooth, the gap between the materials is optimum in terms of zinc vapor departure, continuous penetration and an undercut is present at the root of the weld. There is well observable fine-grained HAZ in both materials.
The TL-DC weld (Figure 7a) has almost perfect geometry, smooth surface, slight root depression, no undercuts, minimal weld gap, continuous penetration, narrow HAZ in the bottom plate, and the shape of the fusion zone in the top plate is V-shaped. The TL-HCT joint (Figure 7c), on the other hand, contains defects—a too-large weld gap, sagging on the surface and root concavity. The joints TL-TL (Figure 7b) and TL-HX (Figure 7d) have a gap of about 100 μm, less pronounced weld surface drawing and HAZ due to shorter etching, undercuts on the surface and in the root of the weld. The TL-TL joint shows an undercut in the root with sharp notches.
The HCT-DC (Figure 8a) weld has sagging at the surface and root concavity because this volume fills the gap between the materials. A clear HAZ in both materials. The HCT-HCT (Figure 8c) joint has a small gap between the materials, root undercut and equally wide HAZ in both sheets. HCT-TL (Figure 8b) and HCT-HX joints (Figure 8d) have minimal weld gap, full penetration and clear, approximately equal width HAZ in both materials. Undercuts are present at the surface and root of both joints.
The HX-DC (Figure 9a) and HX-TL (Figure 9b) welds exhibit continuous weld penetration, distinct equal width HAZs, and undercuts present at both the surface and root of the welds. The HX-HCT (Figure 9c) and HX-HX (Figure 9d) joints have a minimal weld gap between the materials, with approximately equal width HAZs. The HX-HCT joint exhibits sagging and root concavity caused by material shrinkage. The HX-HX joint exhibits undercut at both the surface and root of the weld.
The metallographic sections of the welds show a distinct dendritic structure in the remelting zone. The contact angle of the dendrites in all joints is relatively small, which means that the lower fusible phases and impurities forming the liquid film have suitable conditions to be pushed out of the weld metal.
Undercuts in the surface and root of the weld, the most common weld shape deviation observed, can act as a notch and can adversely affect the load carrying capacity of welds, especially under bending stresses. The formation of undercuts is more pronounced with a larger weld gap as the metal that fills the weld gap is then logically absent from the surface or root of the weld—recall that this is welding without filler metal. This can be seen most clearly in the TL-HCT weld, Figure 10.
However, sometimes, e.g., in the HX-HCT weld, shape imperfections do not support this explanation and the joint shows missing volumes on the surface and at the root even with zero weld gap, and so the explanation must be sought in metal shrinkage or evaporation.

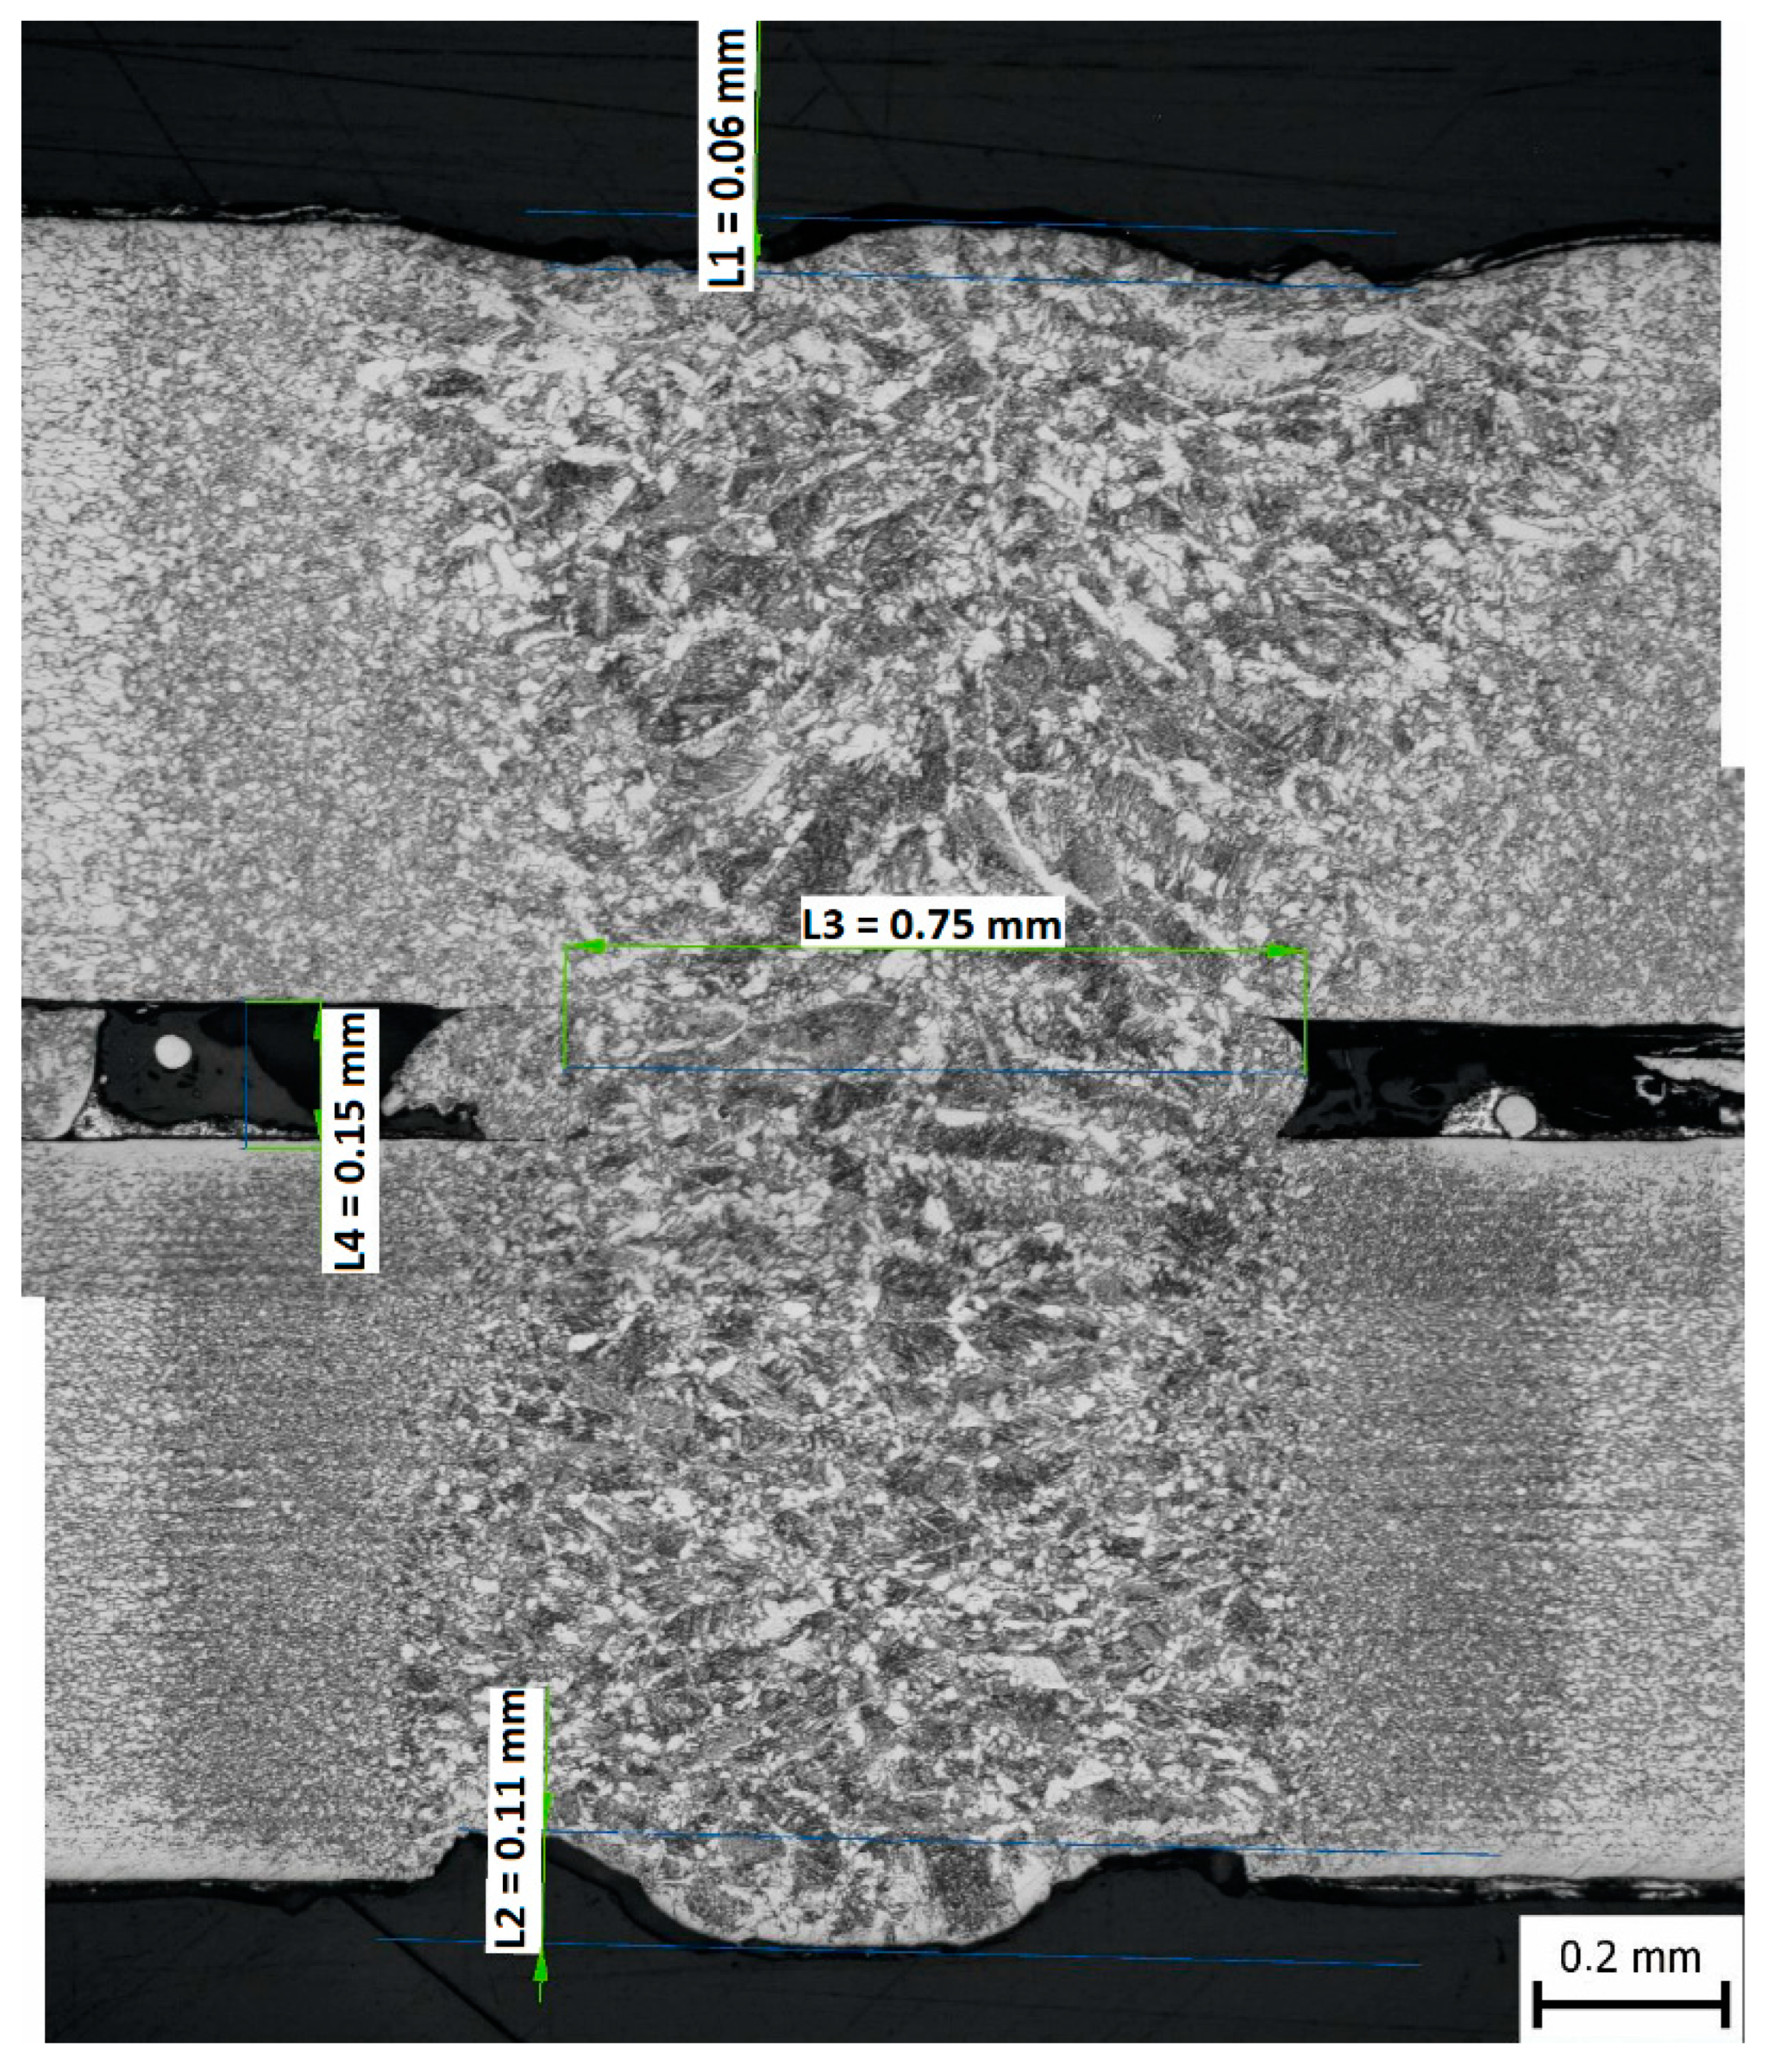
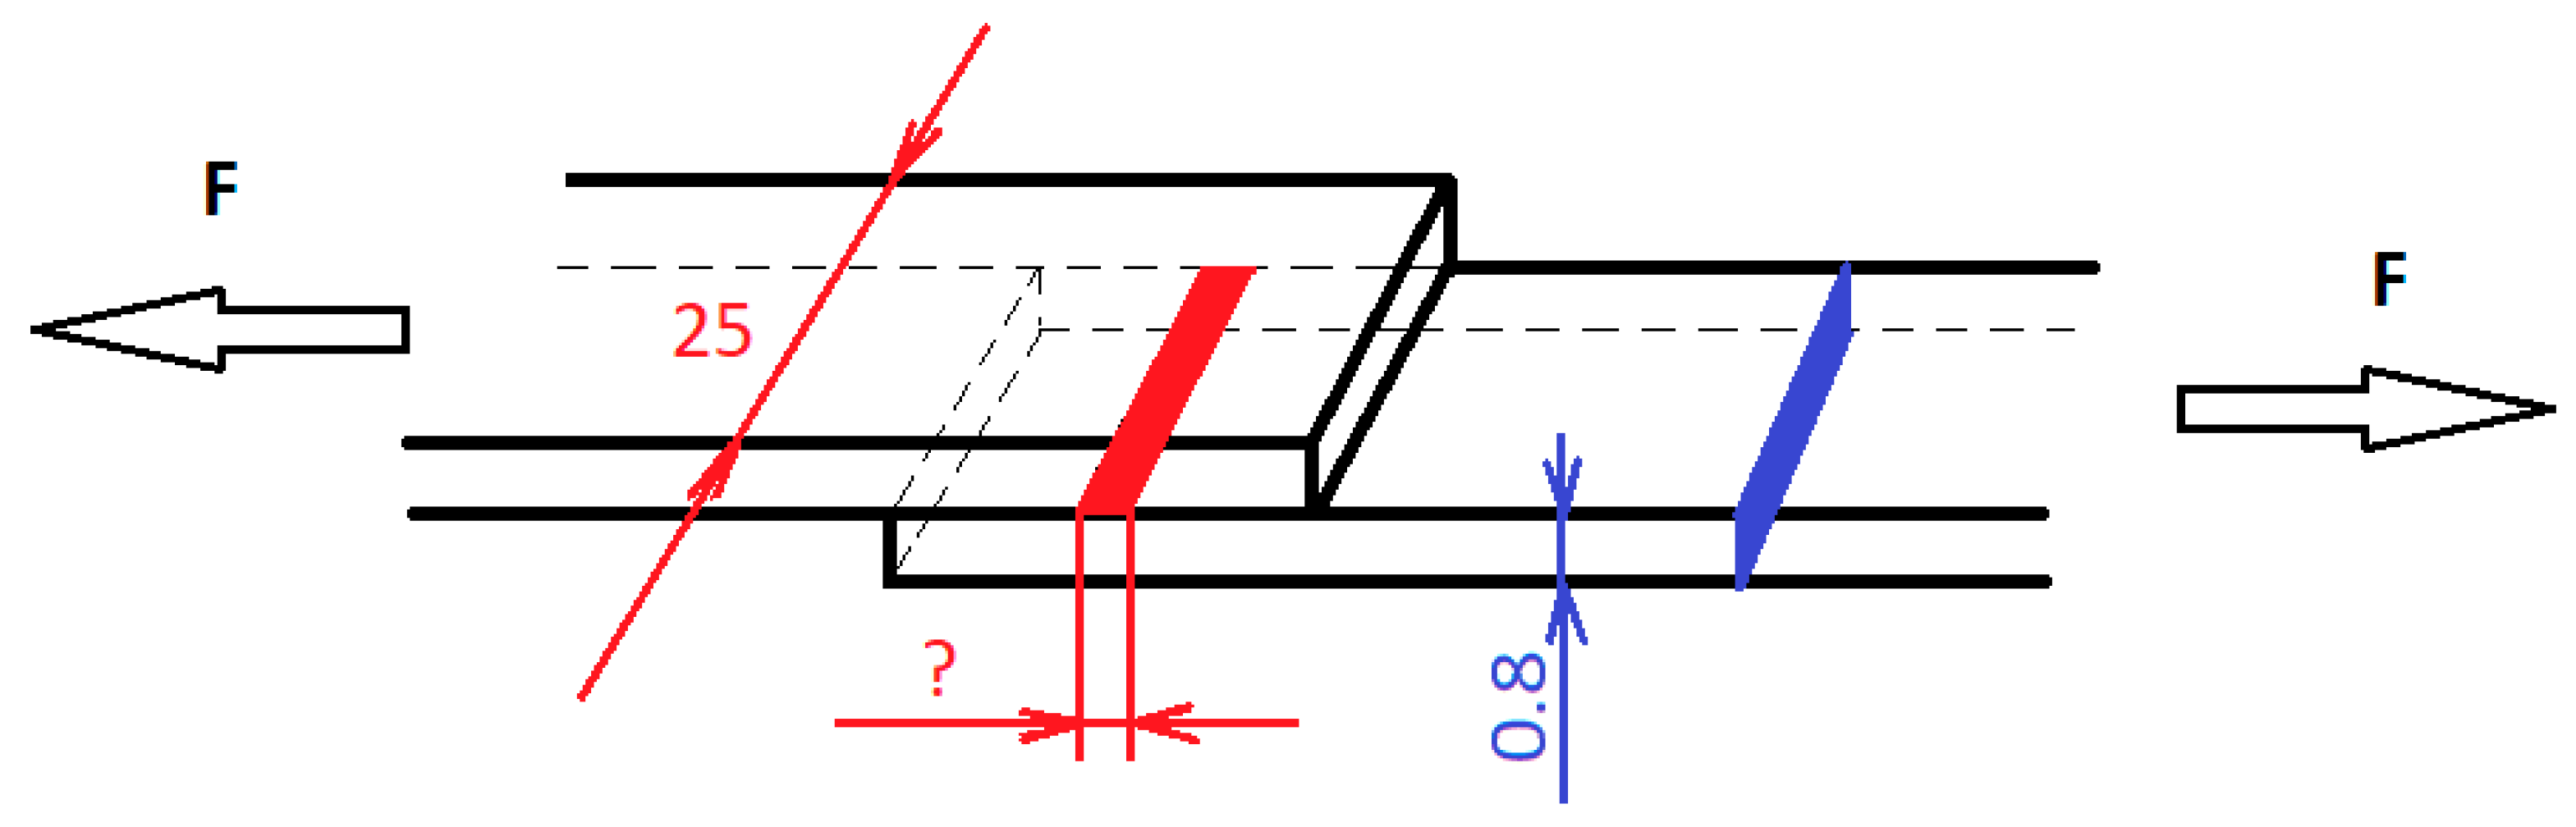
3.2. Geometric Characteristics of Welds

An example of the measurement of the individual geometric characteristics is shown in Figure 11 in the case of a DC-HX joint.
The values of selected geometrical characteristics of welds are provided in Table 6.
The weld width varied most often between 0.7–0.8 mm, the weld gap did not exceed the optimum value of 0.2 mm. The widths of the HAZs were relatively narrow, corresponding to the small heat input of the welding technology used.

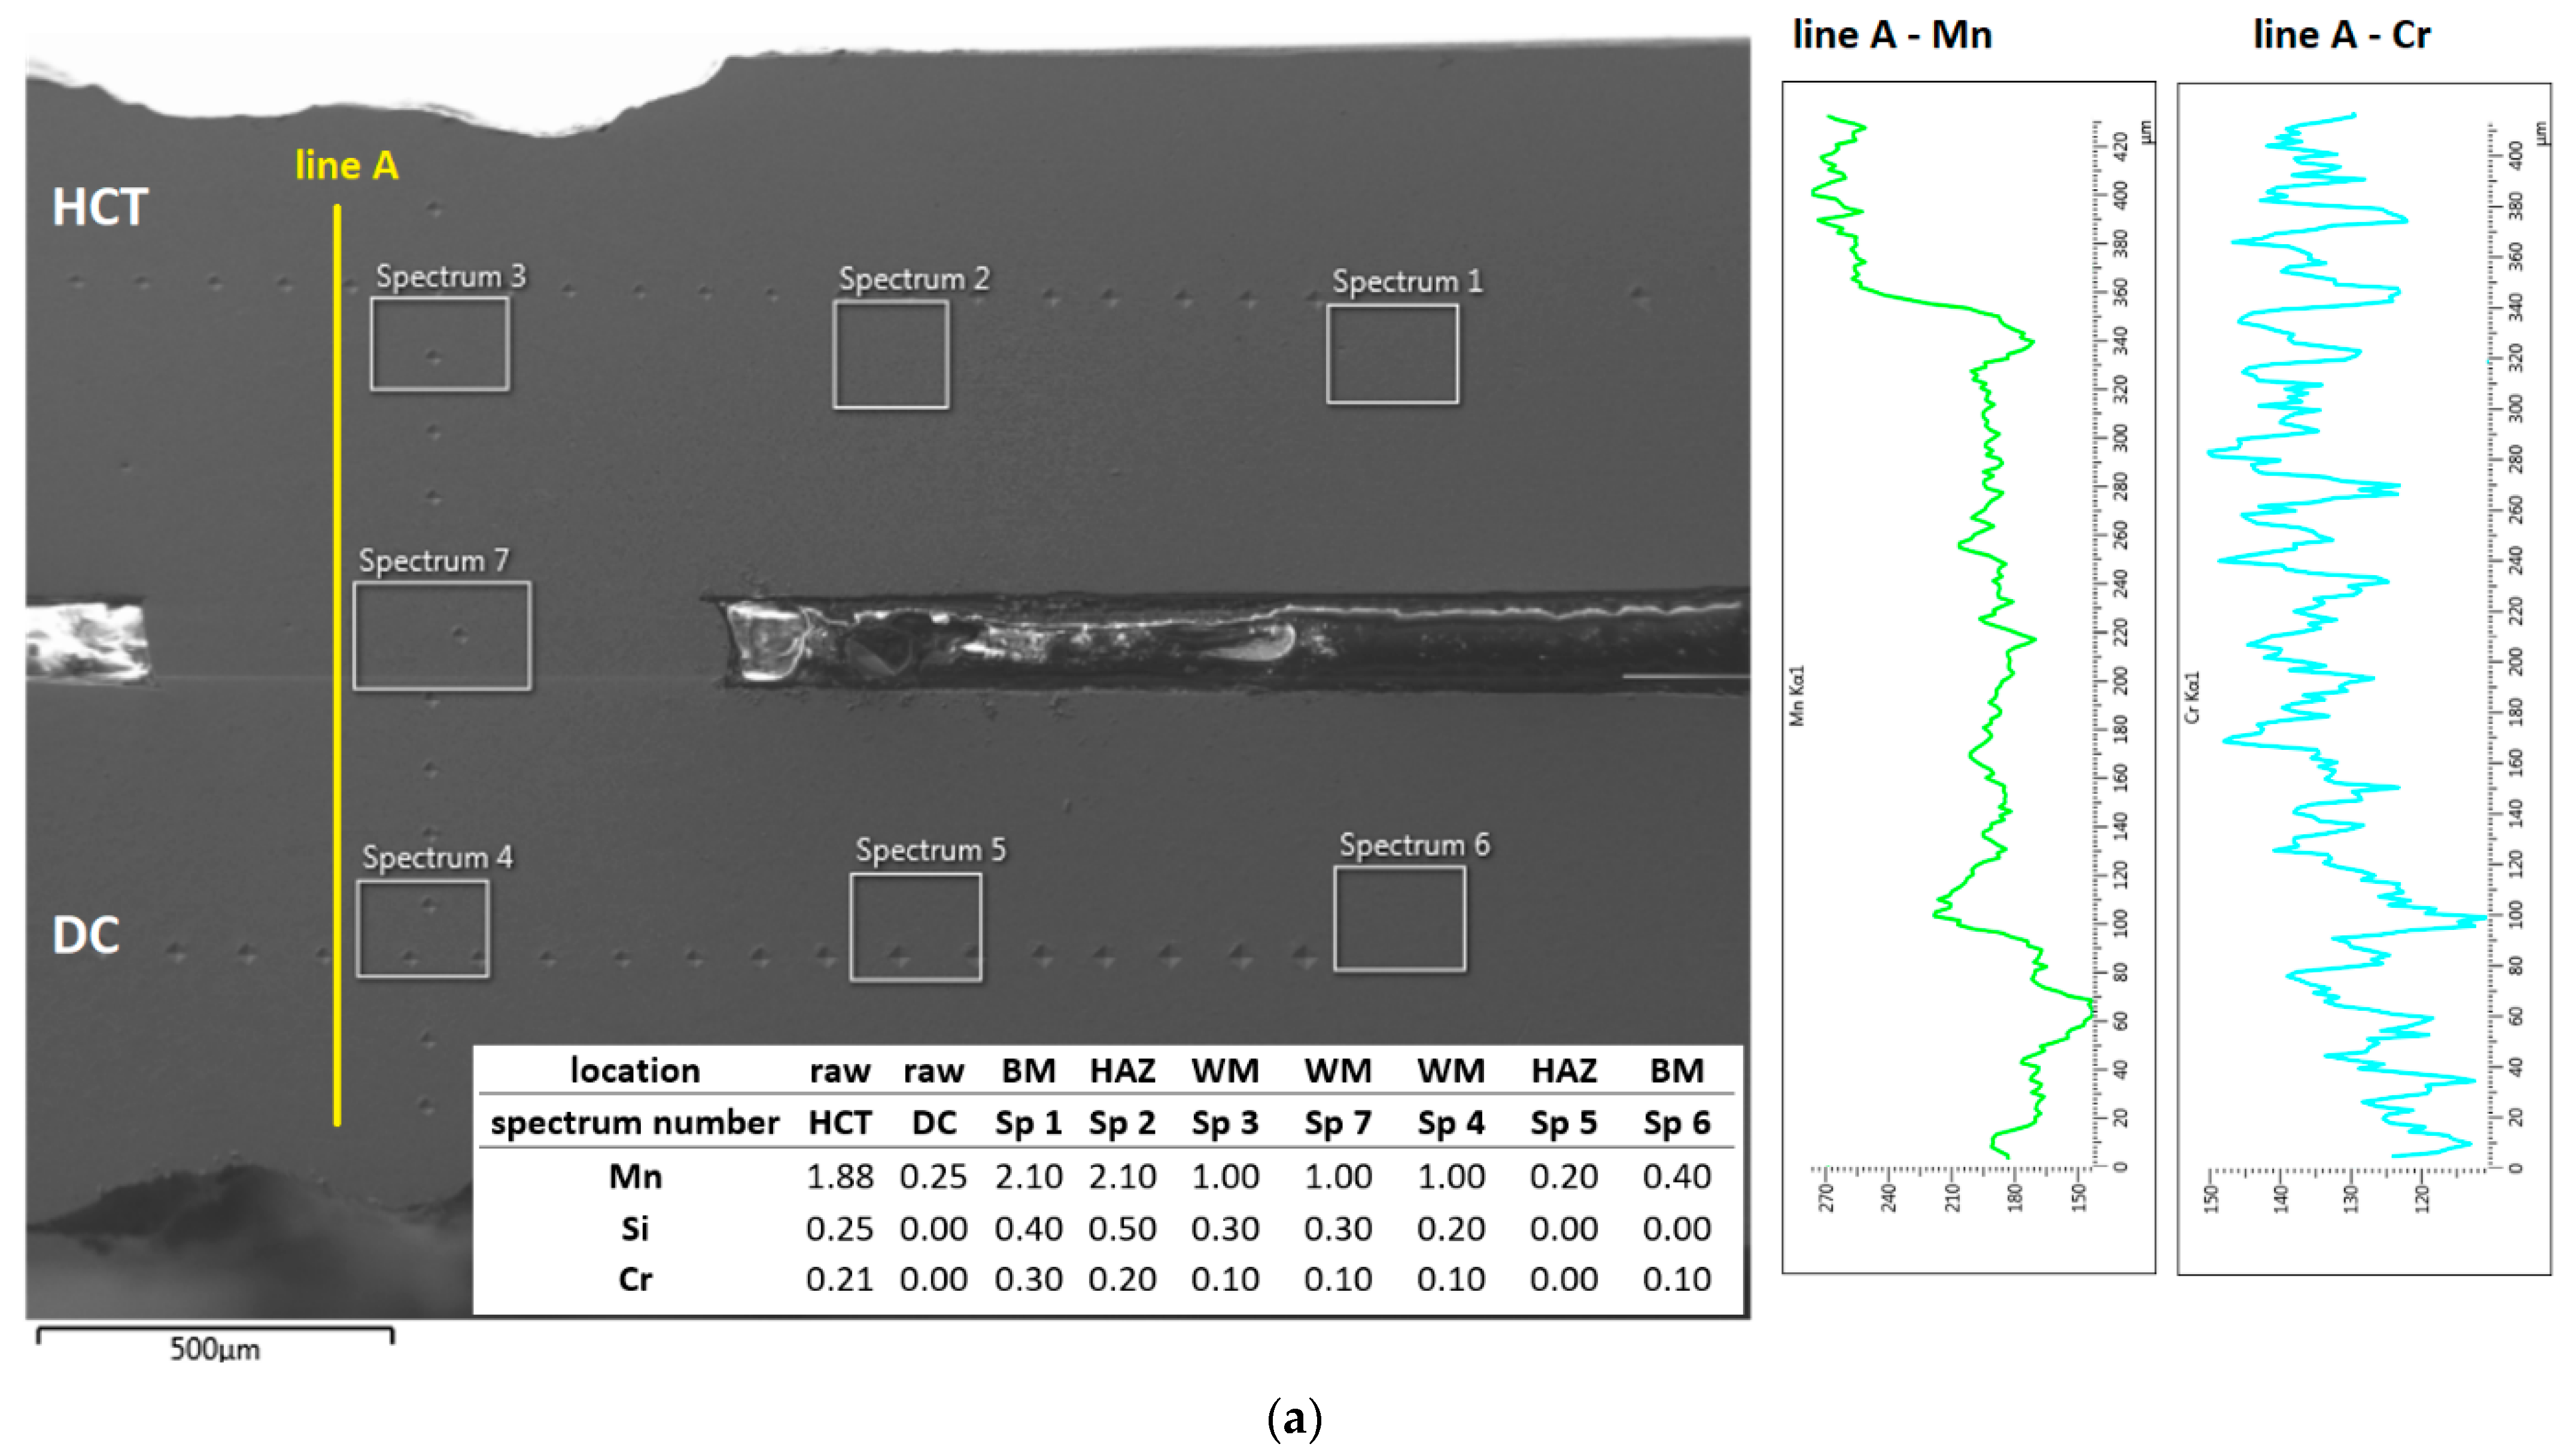
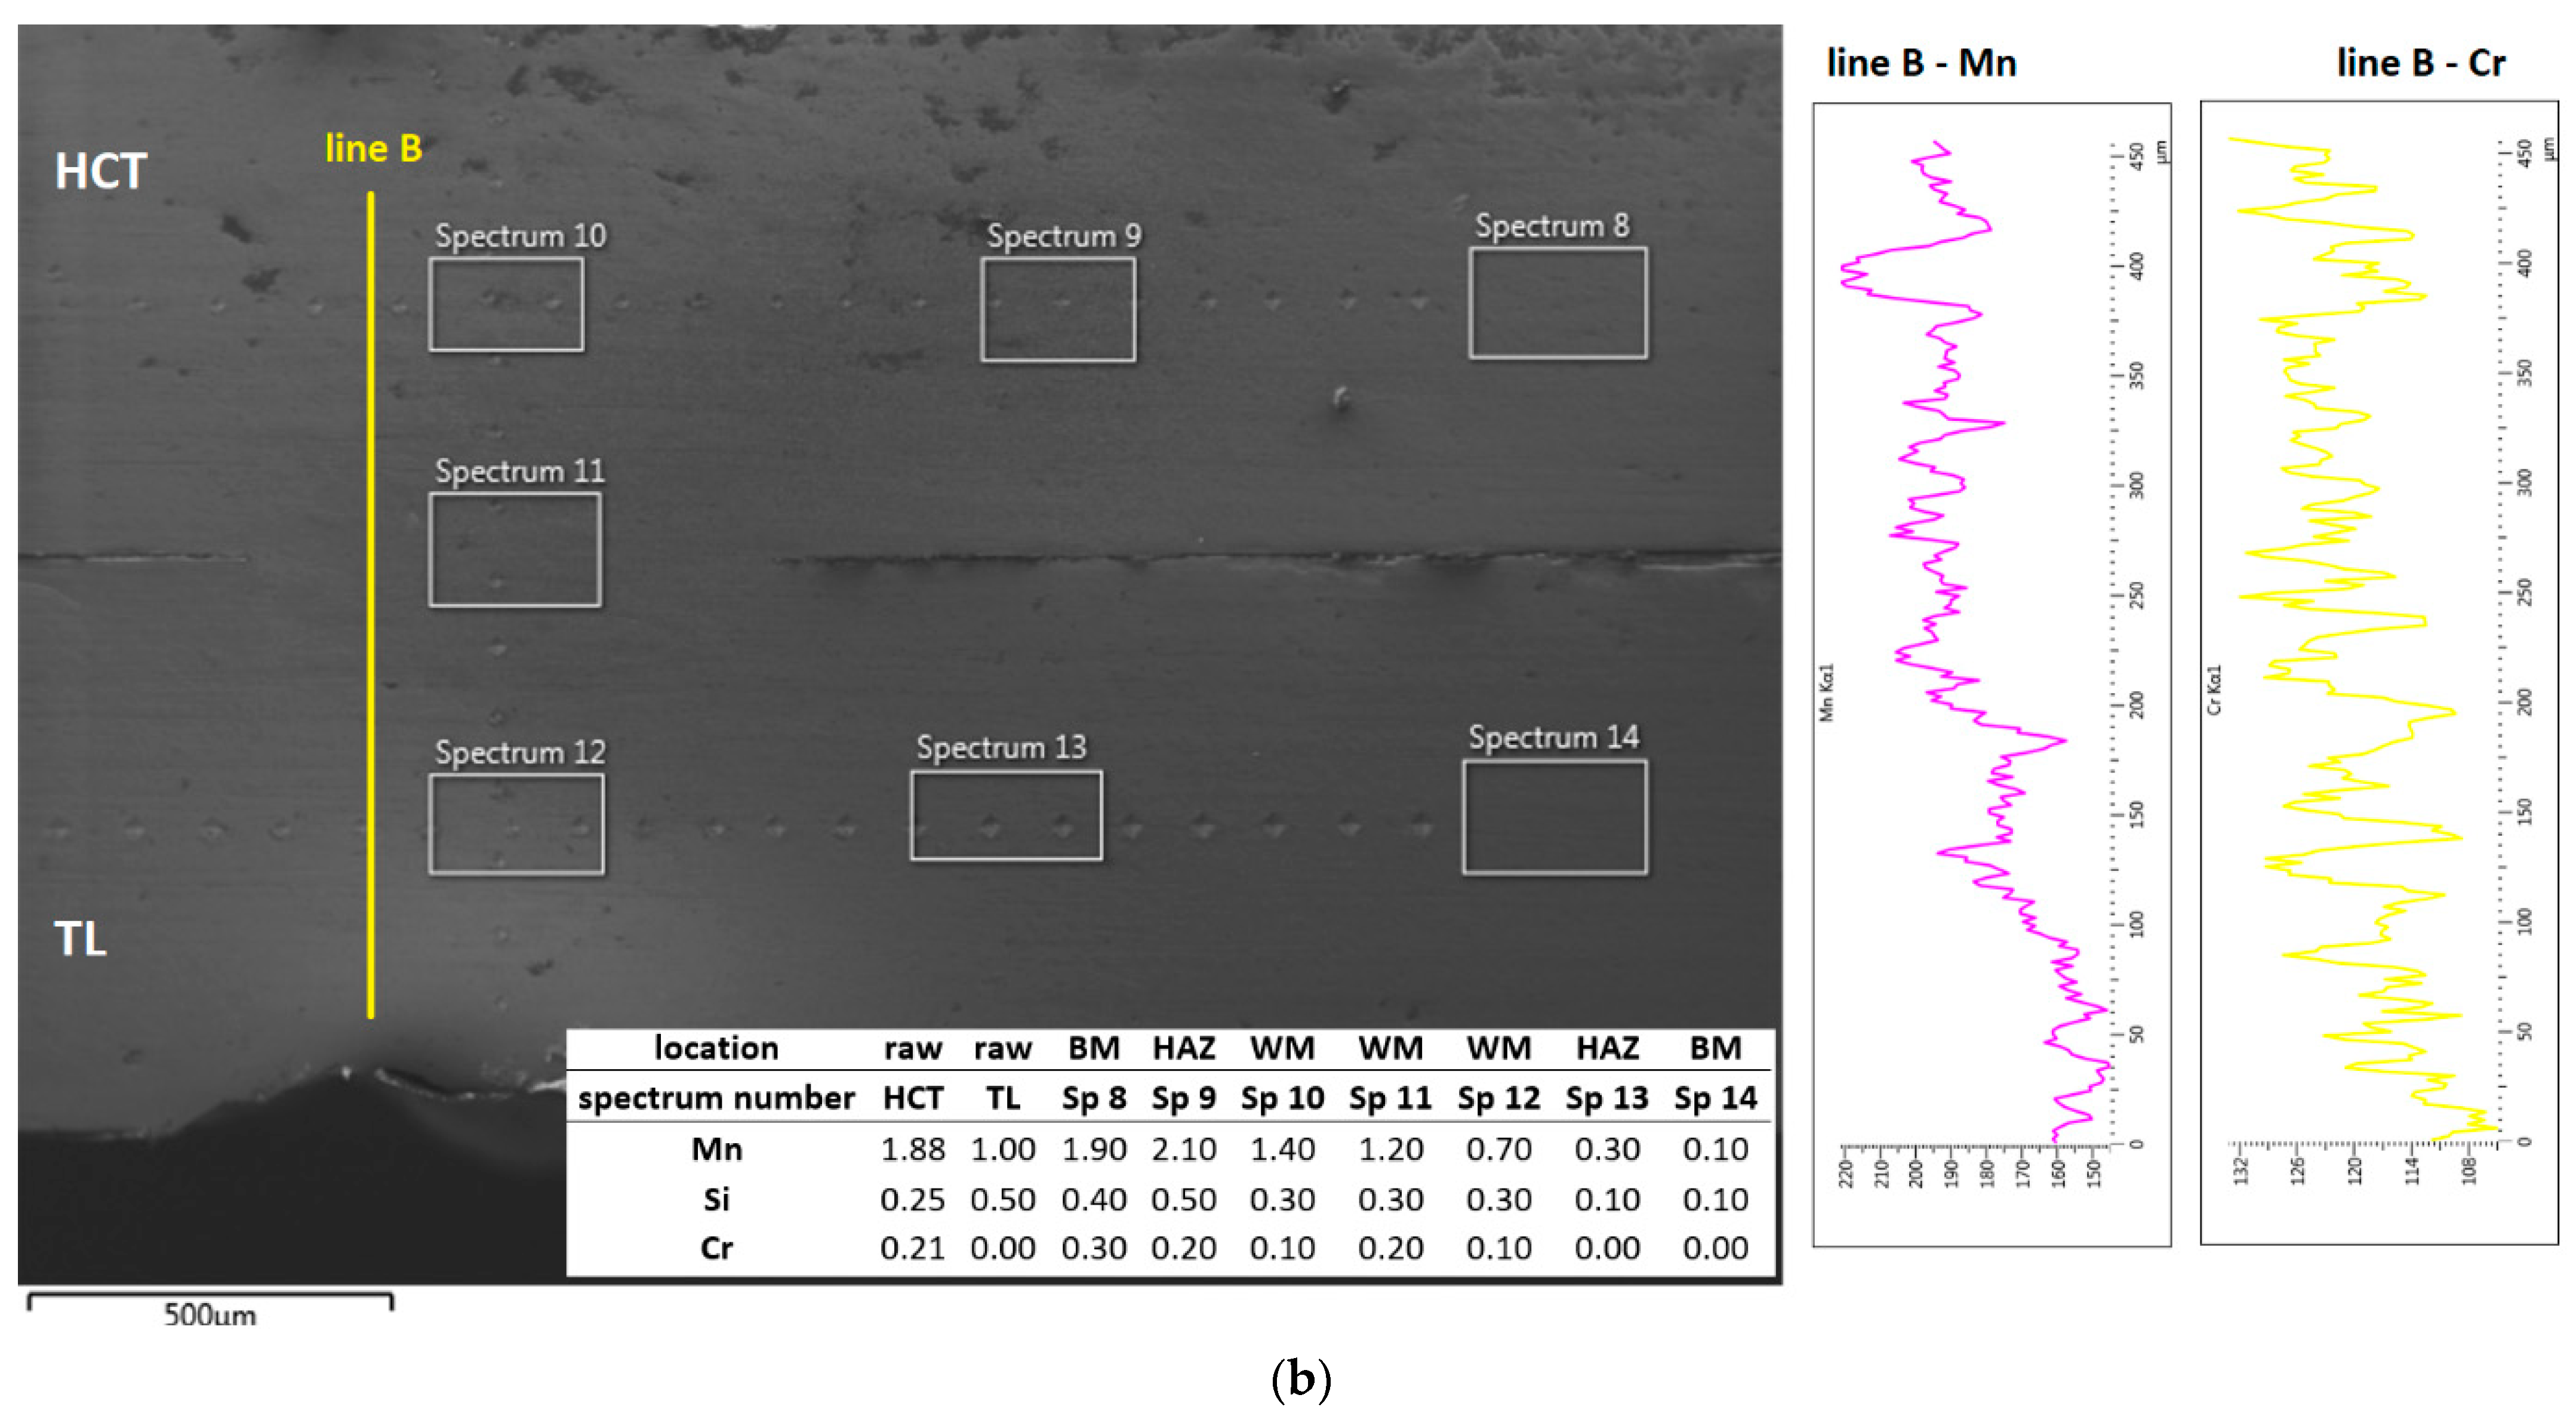
3.3. EDX Analysis of Material Mixing in the Fusion Zone

The mixing of materials in the weld area is documented by EDX area and line analyses of two welds, HCT-DC and HCT-TL, Figure 12. The welds shown represent the joining of two galvanized steels and a galvanized and an ungalvanized steel.
The analyses performed show that the materials in the weld are perfectly mixed, which is documented by monitoring the content of selected chemical elements in which the welded materials differed the most (Mn, Si, Cr). The content of these elements varies continuously from one material to another. Zinc did not appear in the spectra, evaporated residue-free from the surface during welding and did not enter the weld metal chemistry.

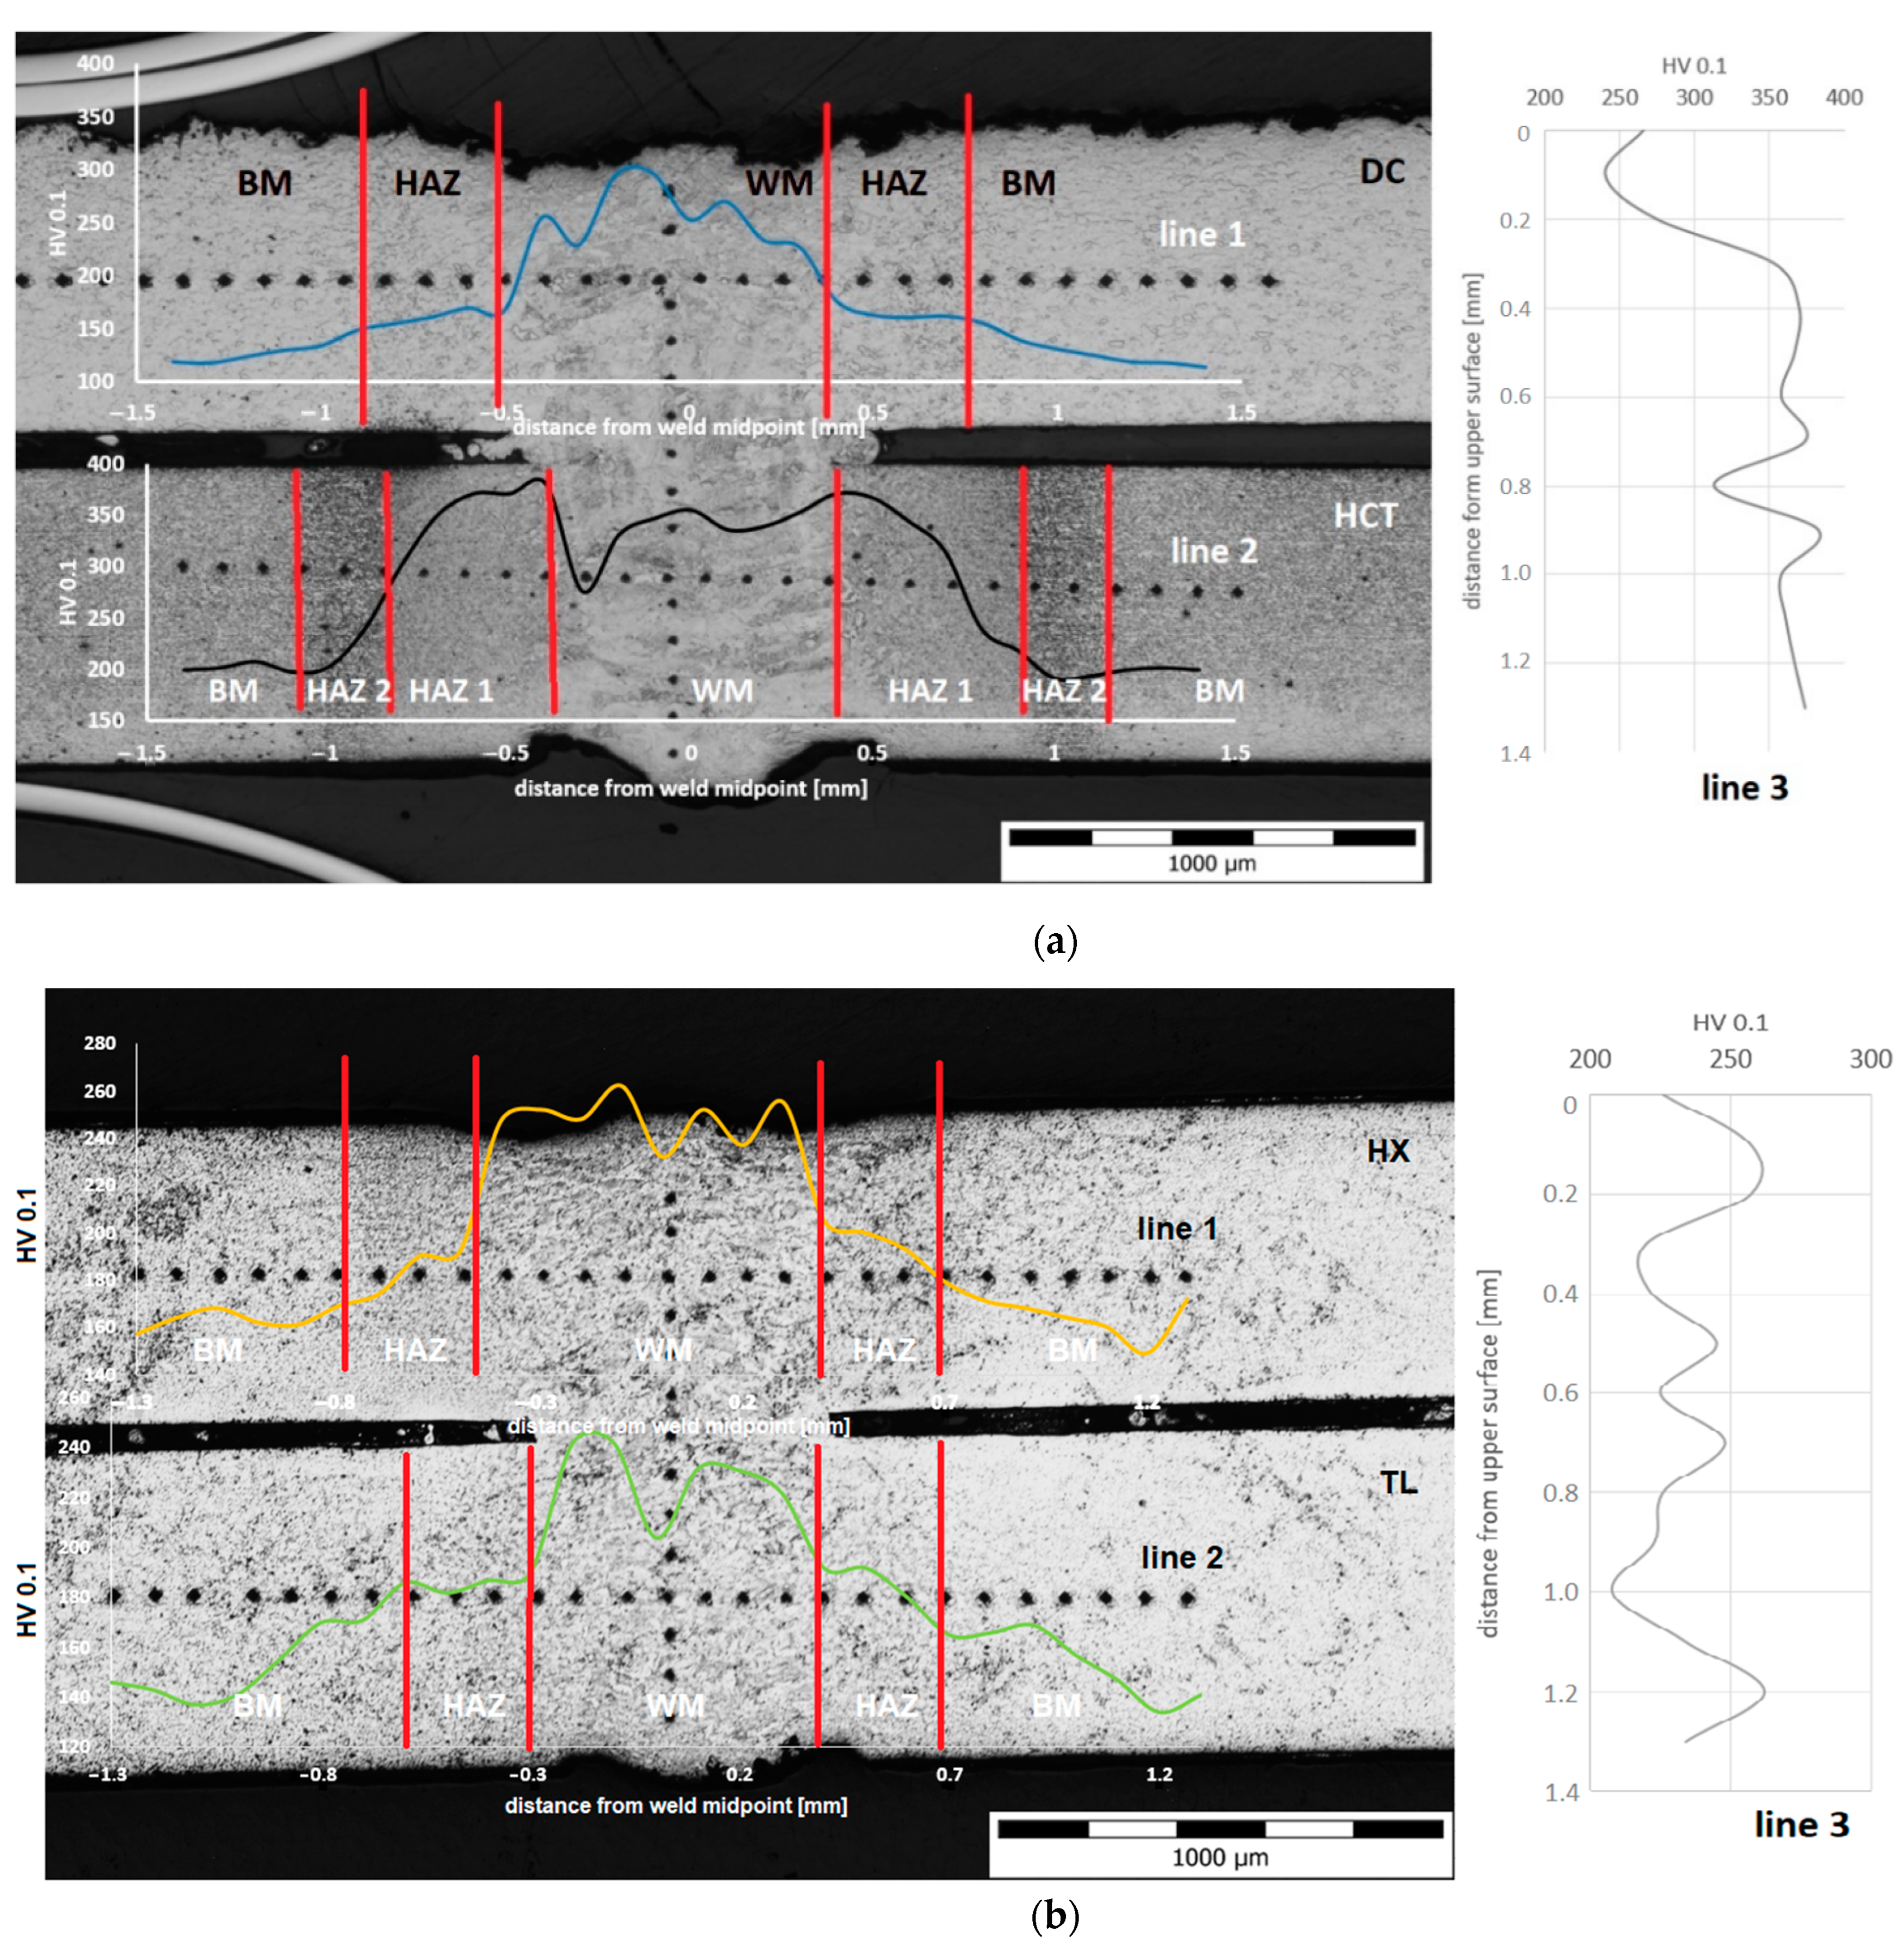
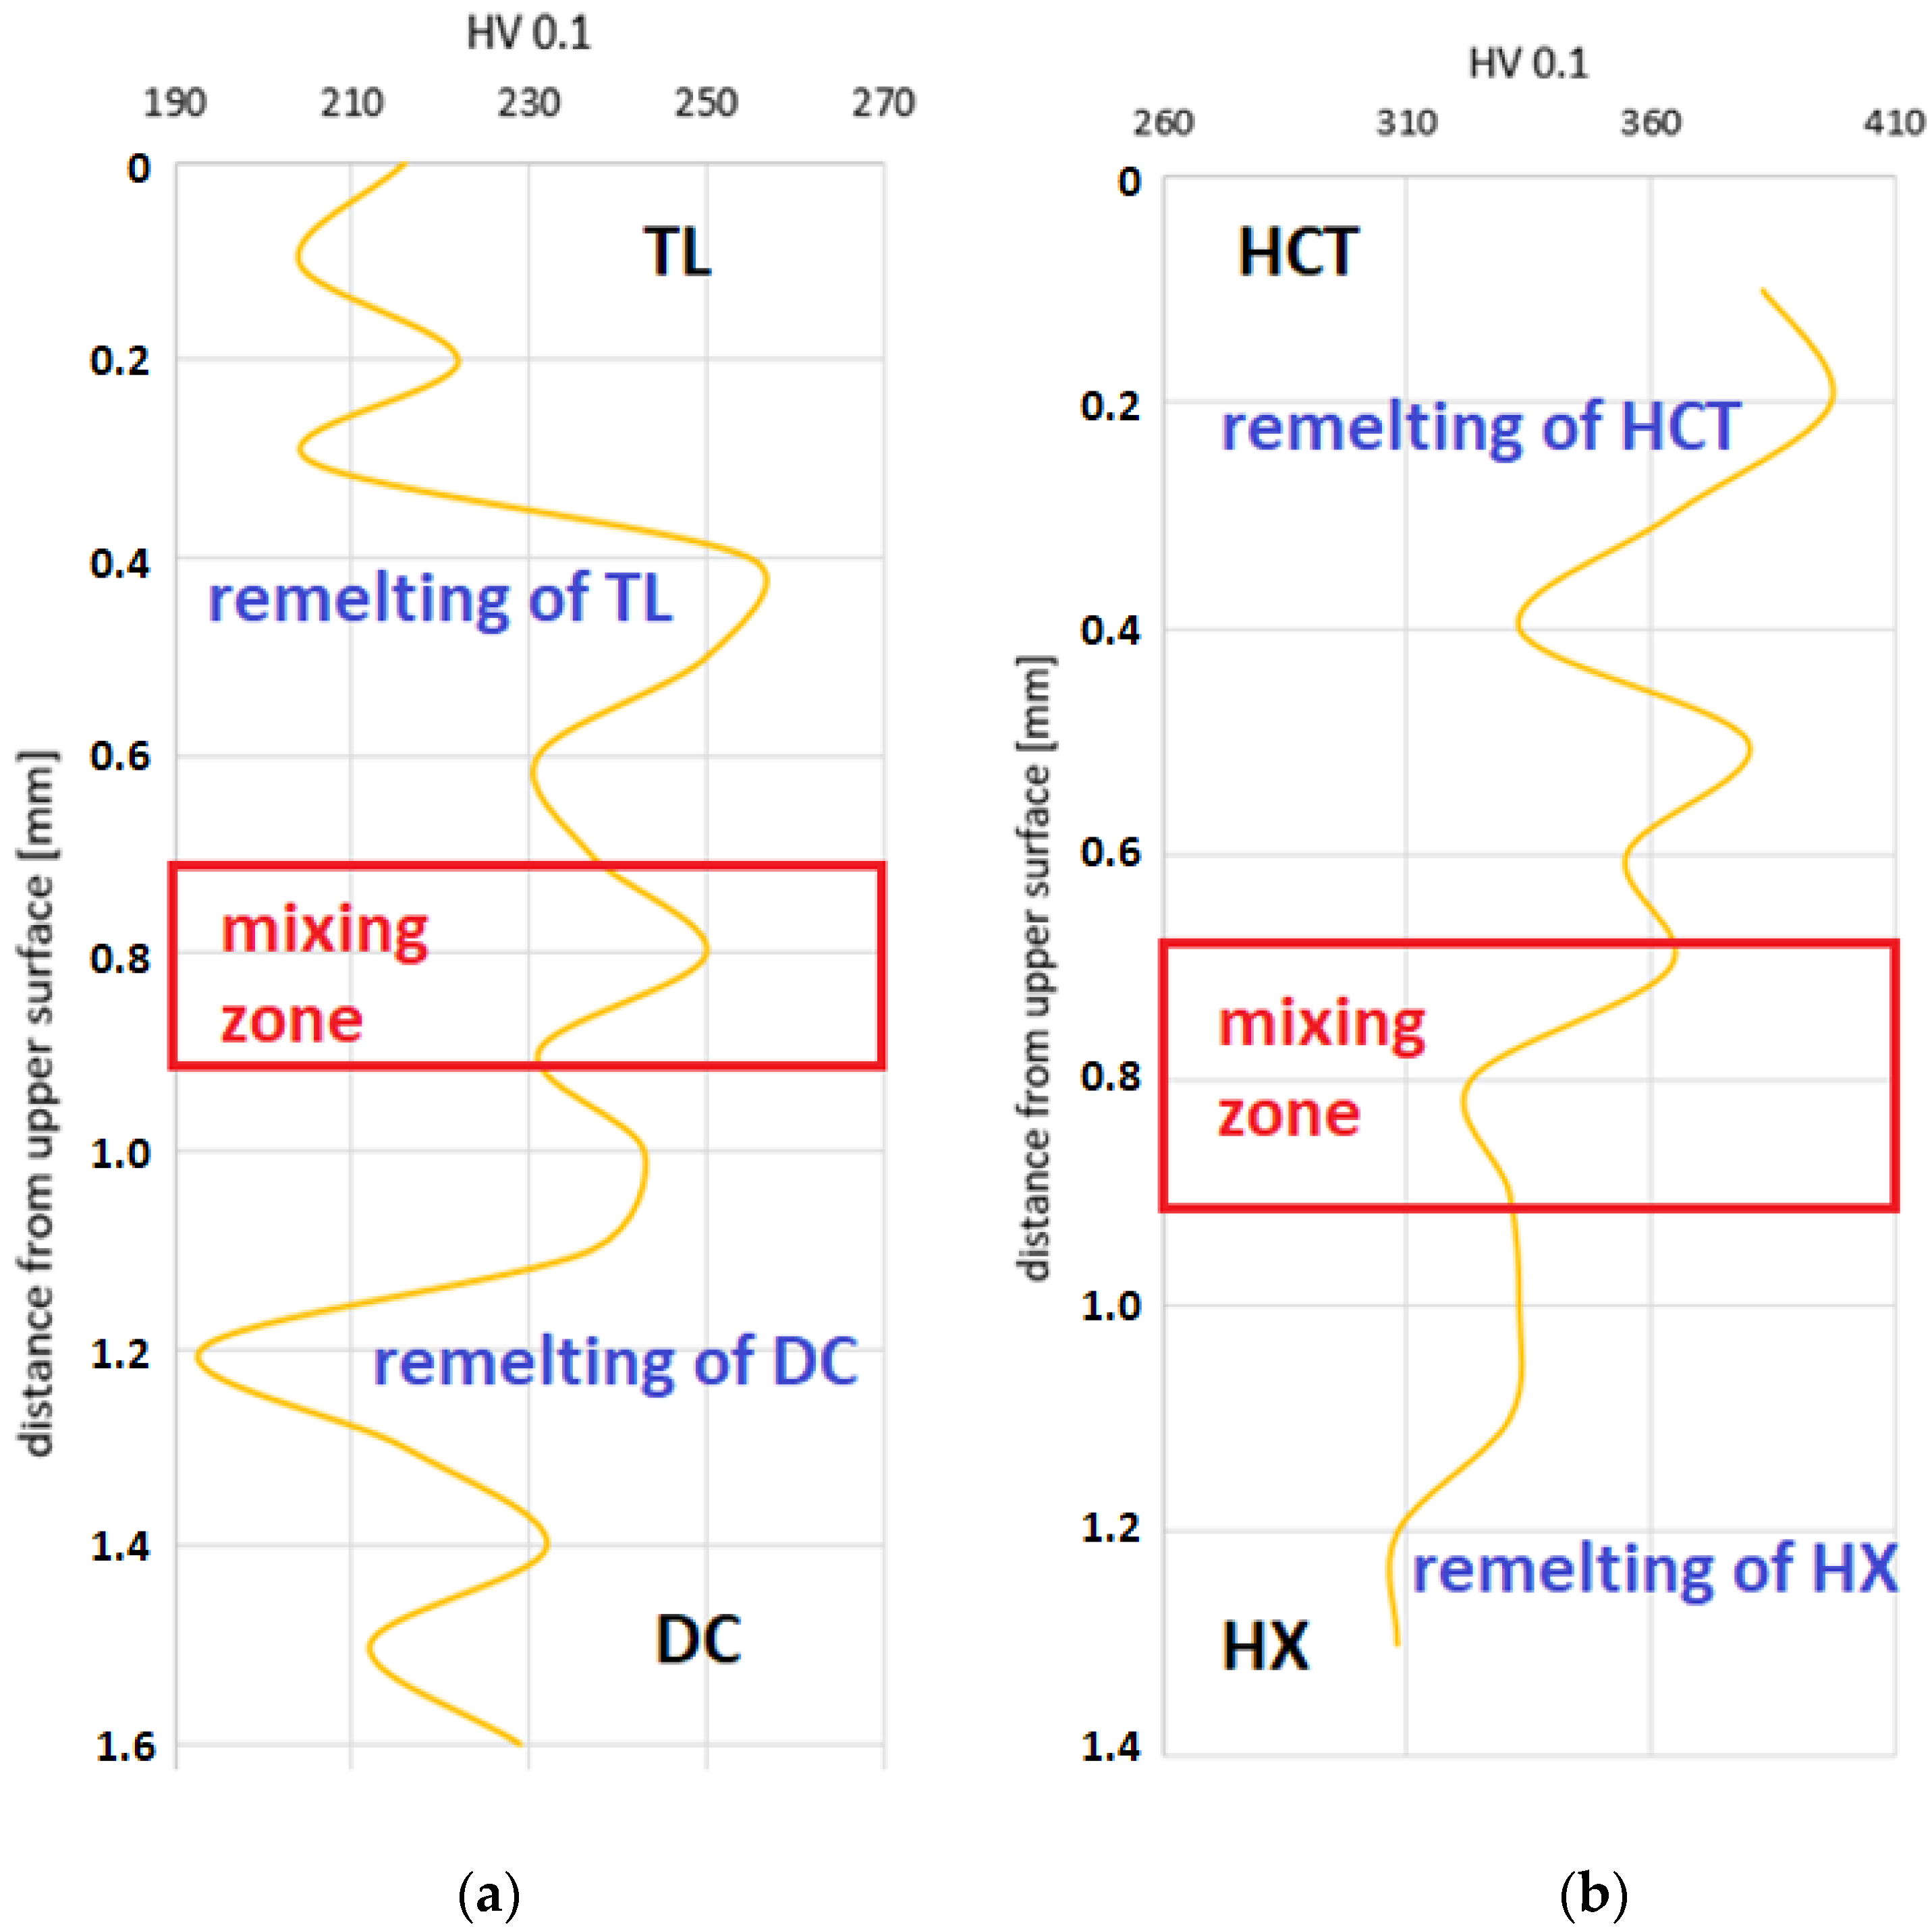
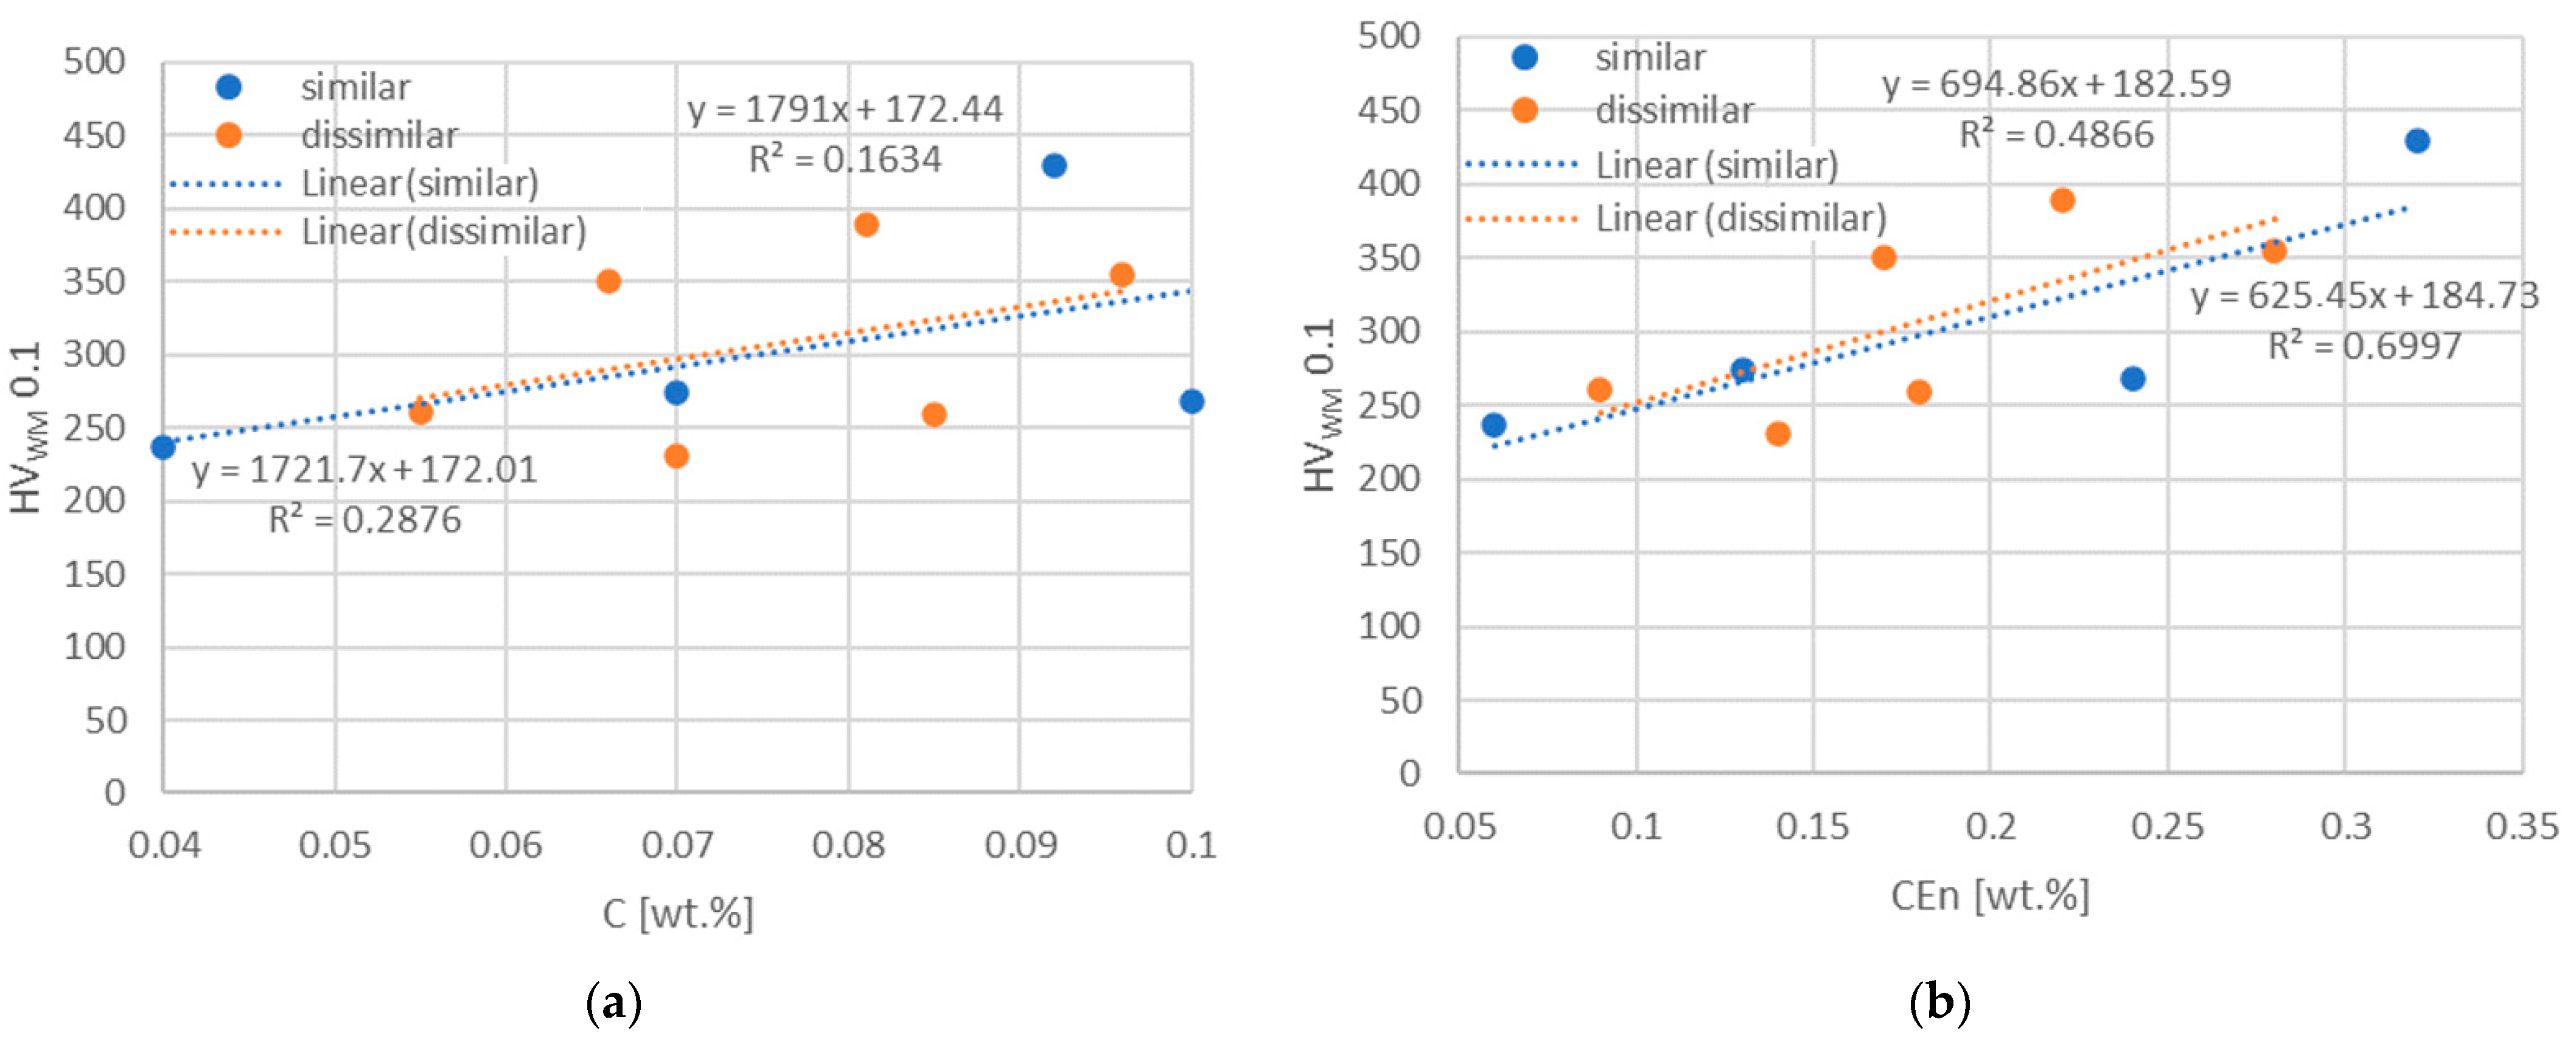
3.4. Hardness of Welds

The hardness across all areas of the weld was measured in three lines, Figure 5. If we consider the processes of melting and solidification in a simple overlapped joint, then the microhardness in line 1 actually reflects the change in microstructure of the base material 1 remelted by the laser, without mixing with other material. Line 2 similarly reflects the change in microstructure in base material 2 caused by laser remelting, and line 3 passes through the dendritic structure of remelted BM1, through the dendritic zone of intermixing of the materials to the dendritic structure of remelted BM2. Therefore, the hardness measured in line 3 shows large fluctuation. For the same reasons, the different types of materials show approximately the same characteristic hardness profiles whether they are located in the top or bottom position, Figure 13.
The deep drawing steel DC as well as the HSLA steels TL and HX exhibit maximum hardness at 300, 240 and 260 HV 0.1, respectively, and we observe a single HAZ on the sides of the remelted zone. From the remelting zone, the hardness of these materials gradually decreases through the HAZ to the hardness of the unaffected base metal (BM). In DP steel HCT, two macroscopically distinguishable HAZs are observed. HAZ 1, which is immediately adjacent to the remelted zone, is a highly heated coarse-grained zone, while HAZ 2 is a fine-grained recrystallized zone. The fine grain, Figure 13a bottom plate, appears darker in color on the metallographic section due to the higher density of grain boundaries. In DP steels, we often observe valleys on the outside of the HAZ (see Figure 13a, HCT, HAZ 2), where the hardness locally dropped below the BM hardness. This phenomenon is called HAZ softening, occurs in various welding technologies and is attributed to local tempering of the martensitic phase by the welding heat cycle.
Weld Zone consists of the WM and the HAZ. As can be seen in Figure 13, these zones within a single joint of dissimilar materials have different widths, which is due to the different chemical compositions of the materials involved, production history of these materials, the welding thermal cycle used and the cooling conditions. The widest weld zone area was exhibited by HCT (DP steel), which has a richer chemistry compared to the other materials used, and already contains ferrite and martensite in the initial structure, achieving higher hardnesses than the other materials. In joints with HCT material, it is this material that provides the strength of the joint, which is also evident later, in the tensile test. Also based on the static tensile test, it can be seen that the destruction of the test specimens appears in the weaker material.
The mechanism responsible for hardness variation within the weld zone is related to the epitaxial growth of grains as the weld metal solidifies. The dendrites grow in the direction of the maximum temperature gradient from both sides of the weld and meet in the weld axis, forming a so-called dihedral angle. Their arrangement is influenced by the heat dissipation conditions. The dihedral angle should be rather acute in order to allow gases and impurities—welding products—to be more easily expelled from the solidifying melt. The dendritic structure of the weld is inhomogeneous and causes dispersion of the measured hardness values in the weld metal, since each indentation hits a random region of the dendrite, or the inter-dendritic region. The increased hardness in the weld area is due to metallurgical processes resulting from the solidification conditions of the weld metal. Rapid cooling of the melt leads to the formation of a martensitic structure and increased hardness, which decreases from WM through HAZ to the hardness level of the base material.
An example of some of the hardness profiles in line 3 is shown in Figure 14.
The hardness of welded joints measured in line 3 has a fluctuating character because the whole measuring line passes through the heterogeneous dendritic structure of the remelted zones of the base materials and the zone of their intermixing.
To elucidate the relationship between the chemical composition of the materials and the maximum hardness of the weld metal for welds of similar and dissimilar materials, the C—HVWM and CEn—HVWM dependences were plotted, Figure 15.
From Figure 15, a linear dependence between WM hardness and C content or CEn value is evident. The regression coefficients point to the fact that the dependence of HV on CEn is stronger than that on C content. The trend shows that hardness increases with richer chemistries producing higher CEn values. The above dependence (Figure 15b) can help in predicting the hardness of welds formed from different AHSS steels since it contains an accommodation factor for a wide range of chemistries (CEn).

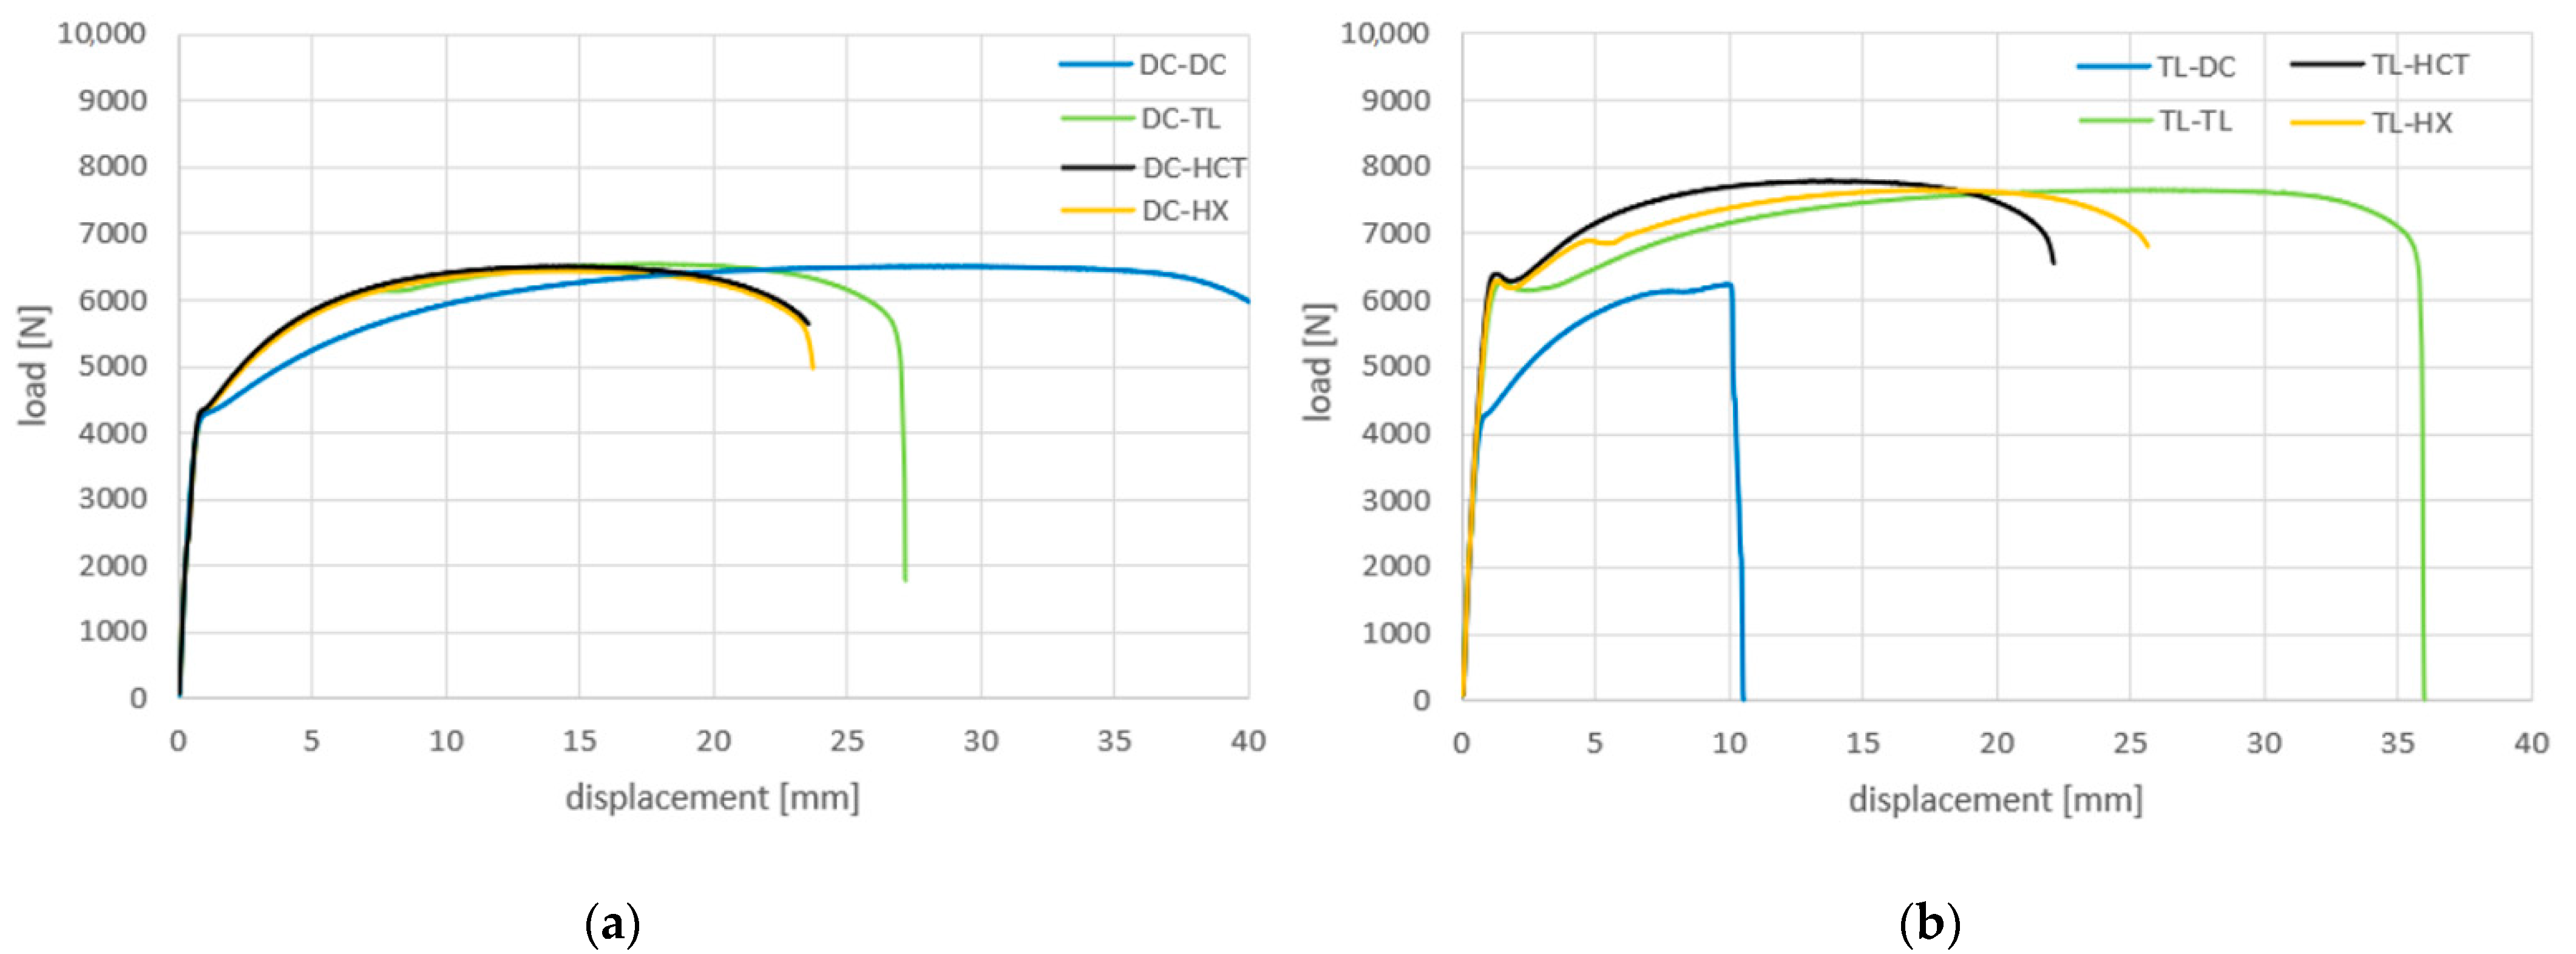
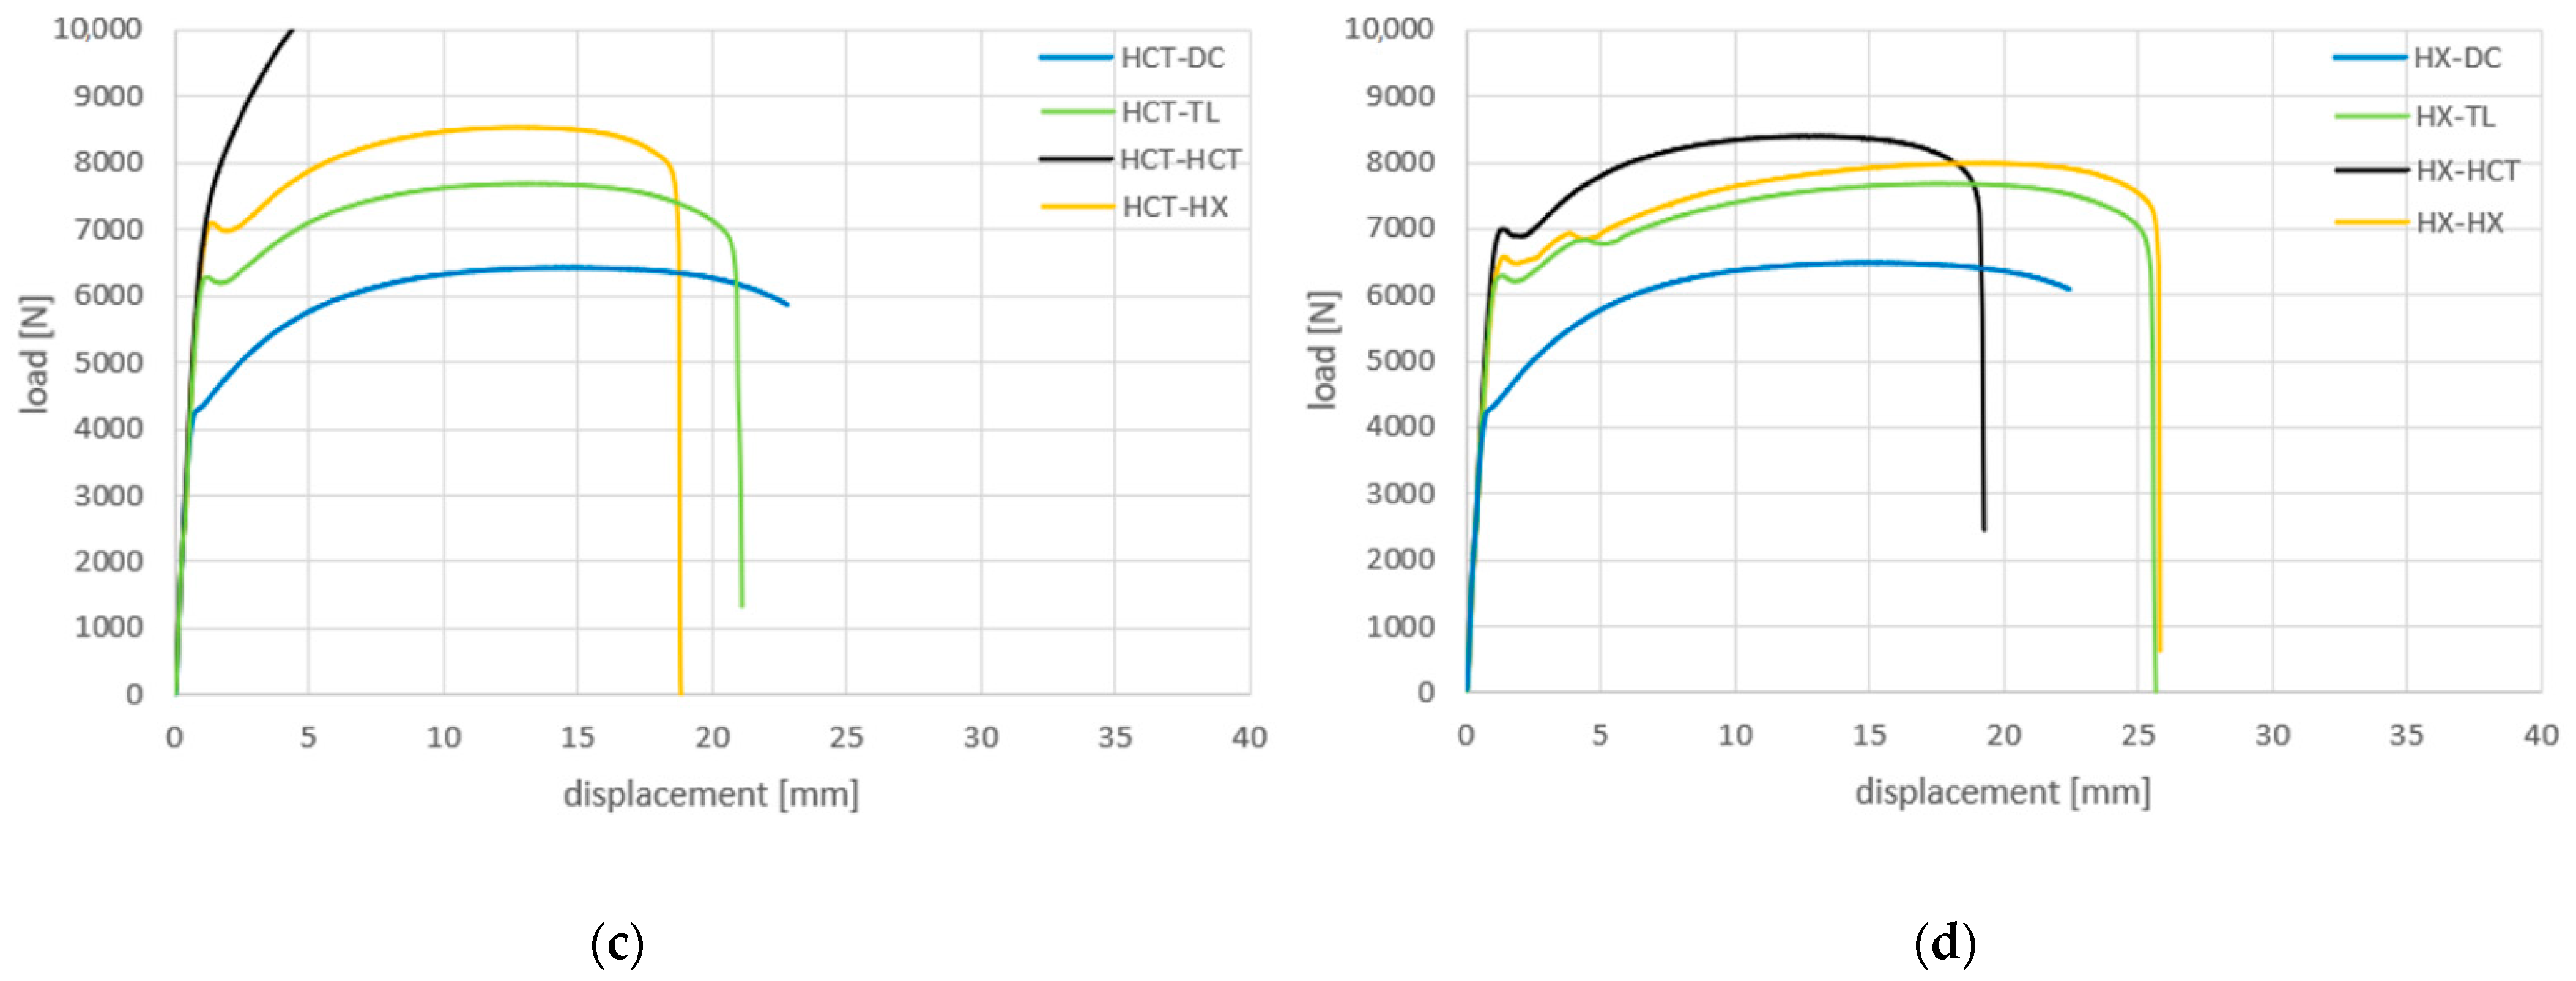
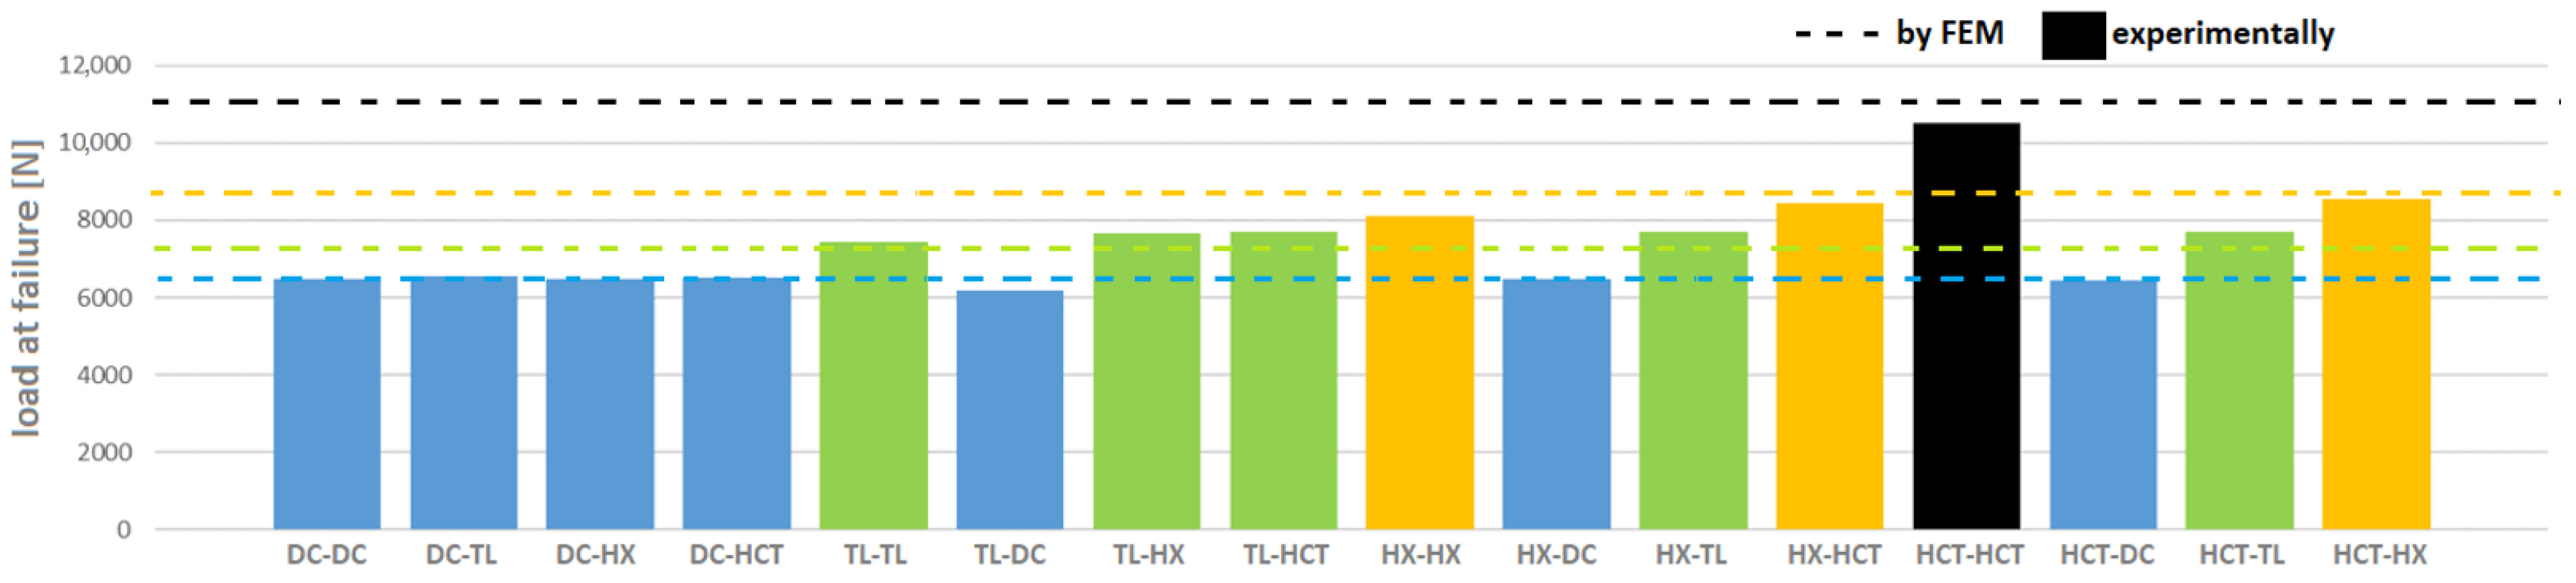
3.5. Load-Bearing Capacity of Welds

The graphical load course of the welded joints is shown in Figure 16.
Except for one case (TL-DC), all welded joints failed in the base material of the less strength material of the welded pair. The failure in the base material is ductile, accompanied by the formation of a neck and oriented in the direction of the active shear planes in accordance with Schmid’s law, Figure 17.
Figure 18 shows a summary graph of the load capacity of the tested welded joints and a comparison of their load capacity with the simulation results.
From Figure 18, it is clear that the load capacity of welded joints is always limited by the weaker material in the pair being joined. At the same time, the position of the materials in the joint is shown to have no effect on the quality of the weld design and its final load capacity.
The maximum force at failure of the joints obtained by FEM and by experimental testing of the welds agree best for weaker materials (DC, TL), for higher strength steels (HX, HCT), the differences are more pronounced. The differences between the simulation and the real weld result from the presence of internal defects and geometric irregularities in the joint, which reduce the resulting load carrying capacity of the joints.
The TL-DC weld joint has failed in the weld metal. The cause is a small weld width, see Table 6, the smallest of all tested joints (0.51 mm). The HCT-HCT joint did not fail during testing because the testing machine was limited by the 10 kN force that the joint could withstand. A greater force was required to break it.
From the above results, it is clear that the final load carrying capacity of the joint will depend mainly on the weld width and the mechanical properties of the material in the mixing zone. The presence of imperfections in the shape of the weld—undercuts, saggings, etc.—did not show an effect on the load capacity of the joint under the given loading regime.
Simple logic implies that if the welded joint was not failed in the joint testing, but an unaffected base material with a width of 25 mm and a thickness of 0.8 mm and known mechanical properties (especially Rm, see Table 2), then the weld (if it had the same UTS as the unaffected base material) made on the same 25 mm long section must have had a width exceeding the thickness of the plate, Figure 19.
From Table 6, however, it is evident that in many cases the weld penetration width was less than the sheet thickness and yet the failure occurred out of the weld. This indicates, and the hardness measurements confirm, that the increased hardness in the mixing zone of the materials indicates higher mechanical properties in the weld, which is why the joint withstood the stresses even with a penetration width less than the thickness of the base materials used. Therefore, to dimension the load carrying capacity of such joints, it would be necessary to know the local mechanical properties in the mixing zone and use them to determine the minimum penetration width that would ensure the reliability of the welded joint.
Dividing Fmax by the cross-section of the test bar (25 × 0.8) gives the tensile strength (TS) of the base material and hence of the welded joint. The dependence of TS on C and CEn is shown in Figure 20.
Analogously to Figure 15, a stronger linear dependence of TS on CEn than on C is evident here for the same reasons as discussed in Figure 15. Higher carbon content in WM forms a martensitic microstructure, which is reflected in higher strength, while lower carbon content decreases the strength due to it forming a microstructure predominantly containing ferrite with small fractions of martensite. It can be generalized that higher carbon and alloying element content linearly increases the strength of welds. Stronger dependencies were shown especially for joints of dissimilar materials.

4. Conclusions

From the metallographic study of welds of dissimilar materials produced by laser welding technology and from the subsequent testing of the load-bearing capacity of the welded joints, the following findings emerge:
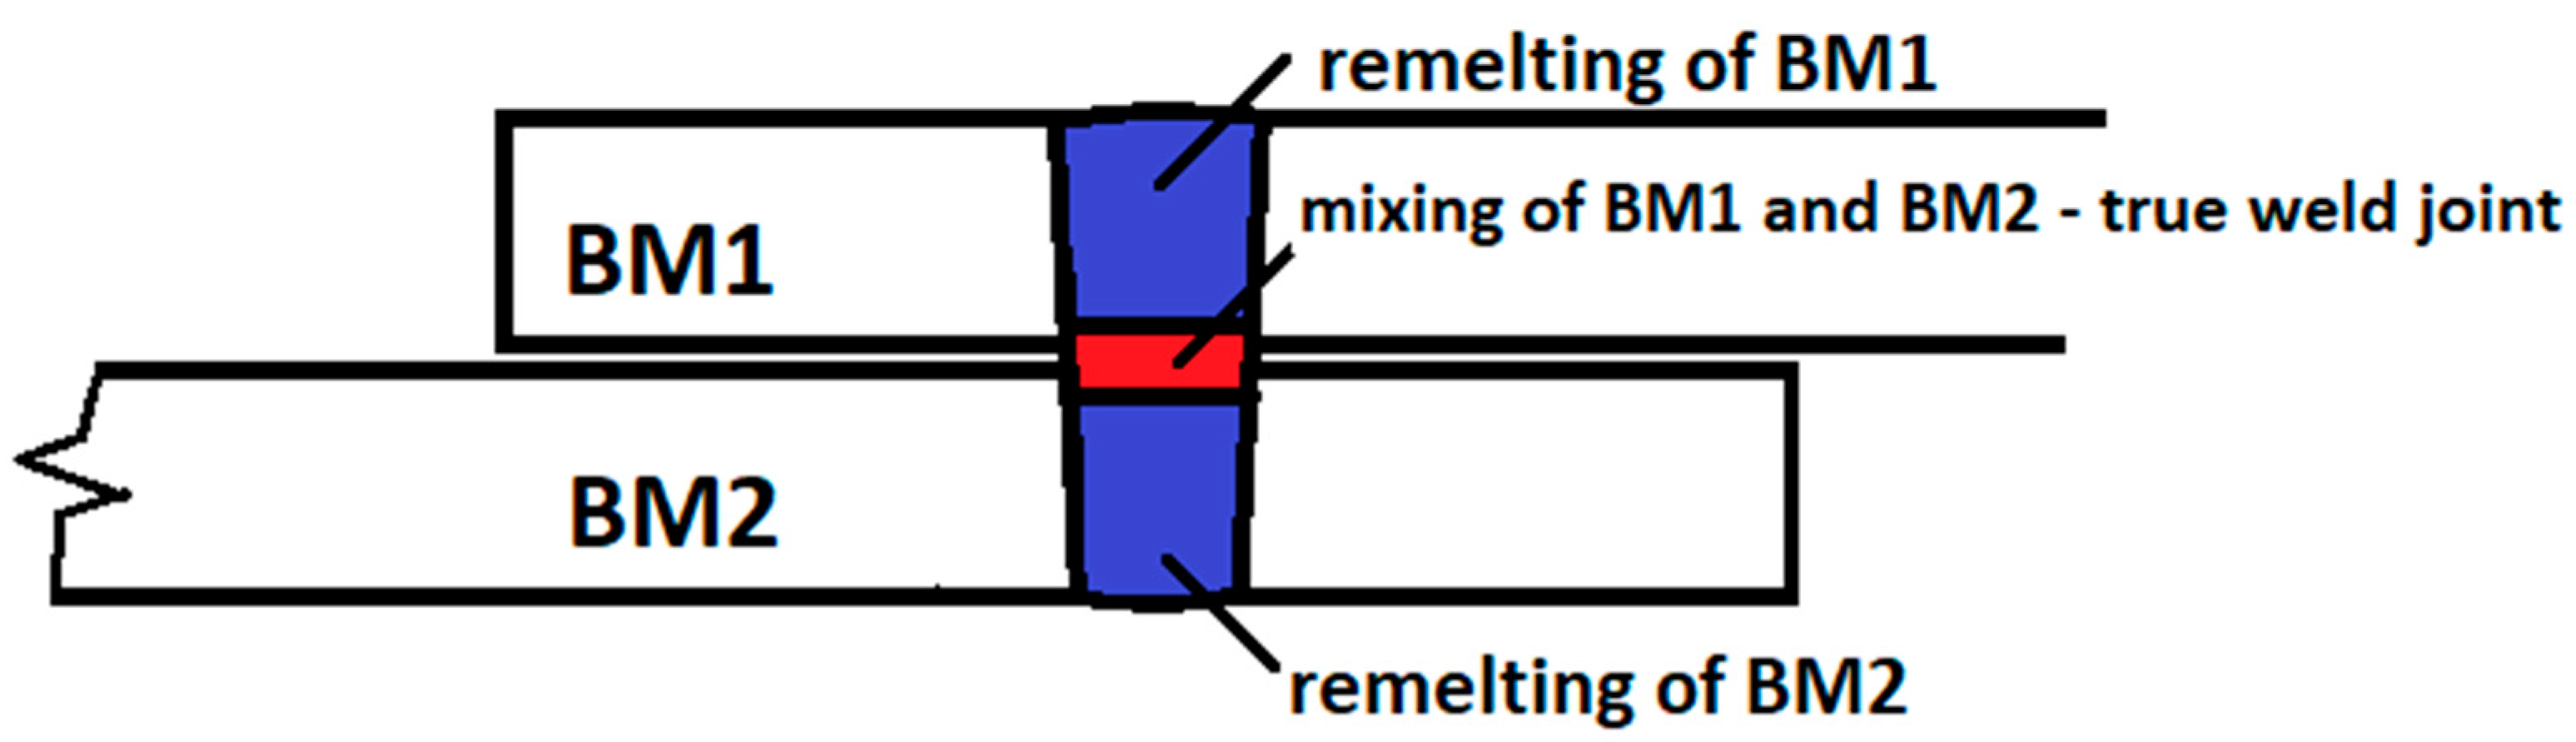
  • The welds of overlapped unequal materials have a characteristic macrostructure and they contain fusion zones of materials as well as a zone of mixing, both with a characteristic dendritic microstructure. The intermixing of the materials is perfect and the chemical composition of the weld metal changes continuously from the composition corresponding to one material to the other. The zinc has evaporated from the weld site and does not enter the joint chemistry. The main structural constituents are ferrite, martensite and acicular ferrite.
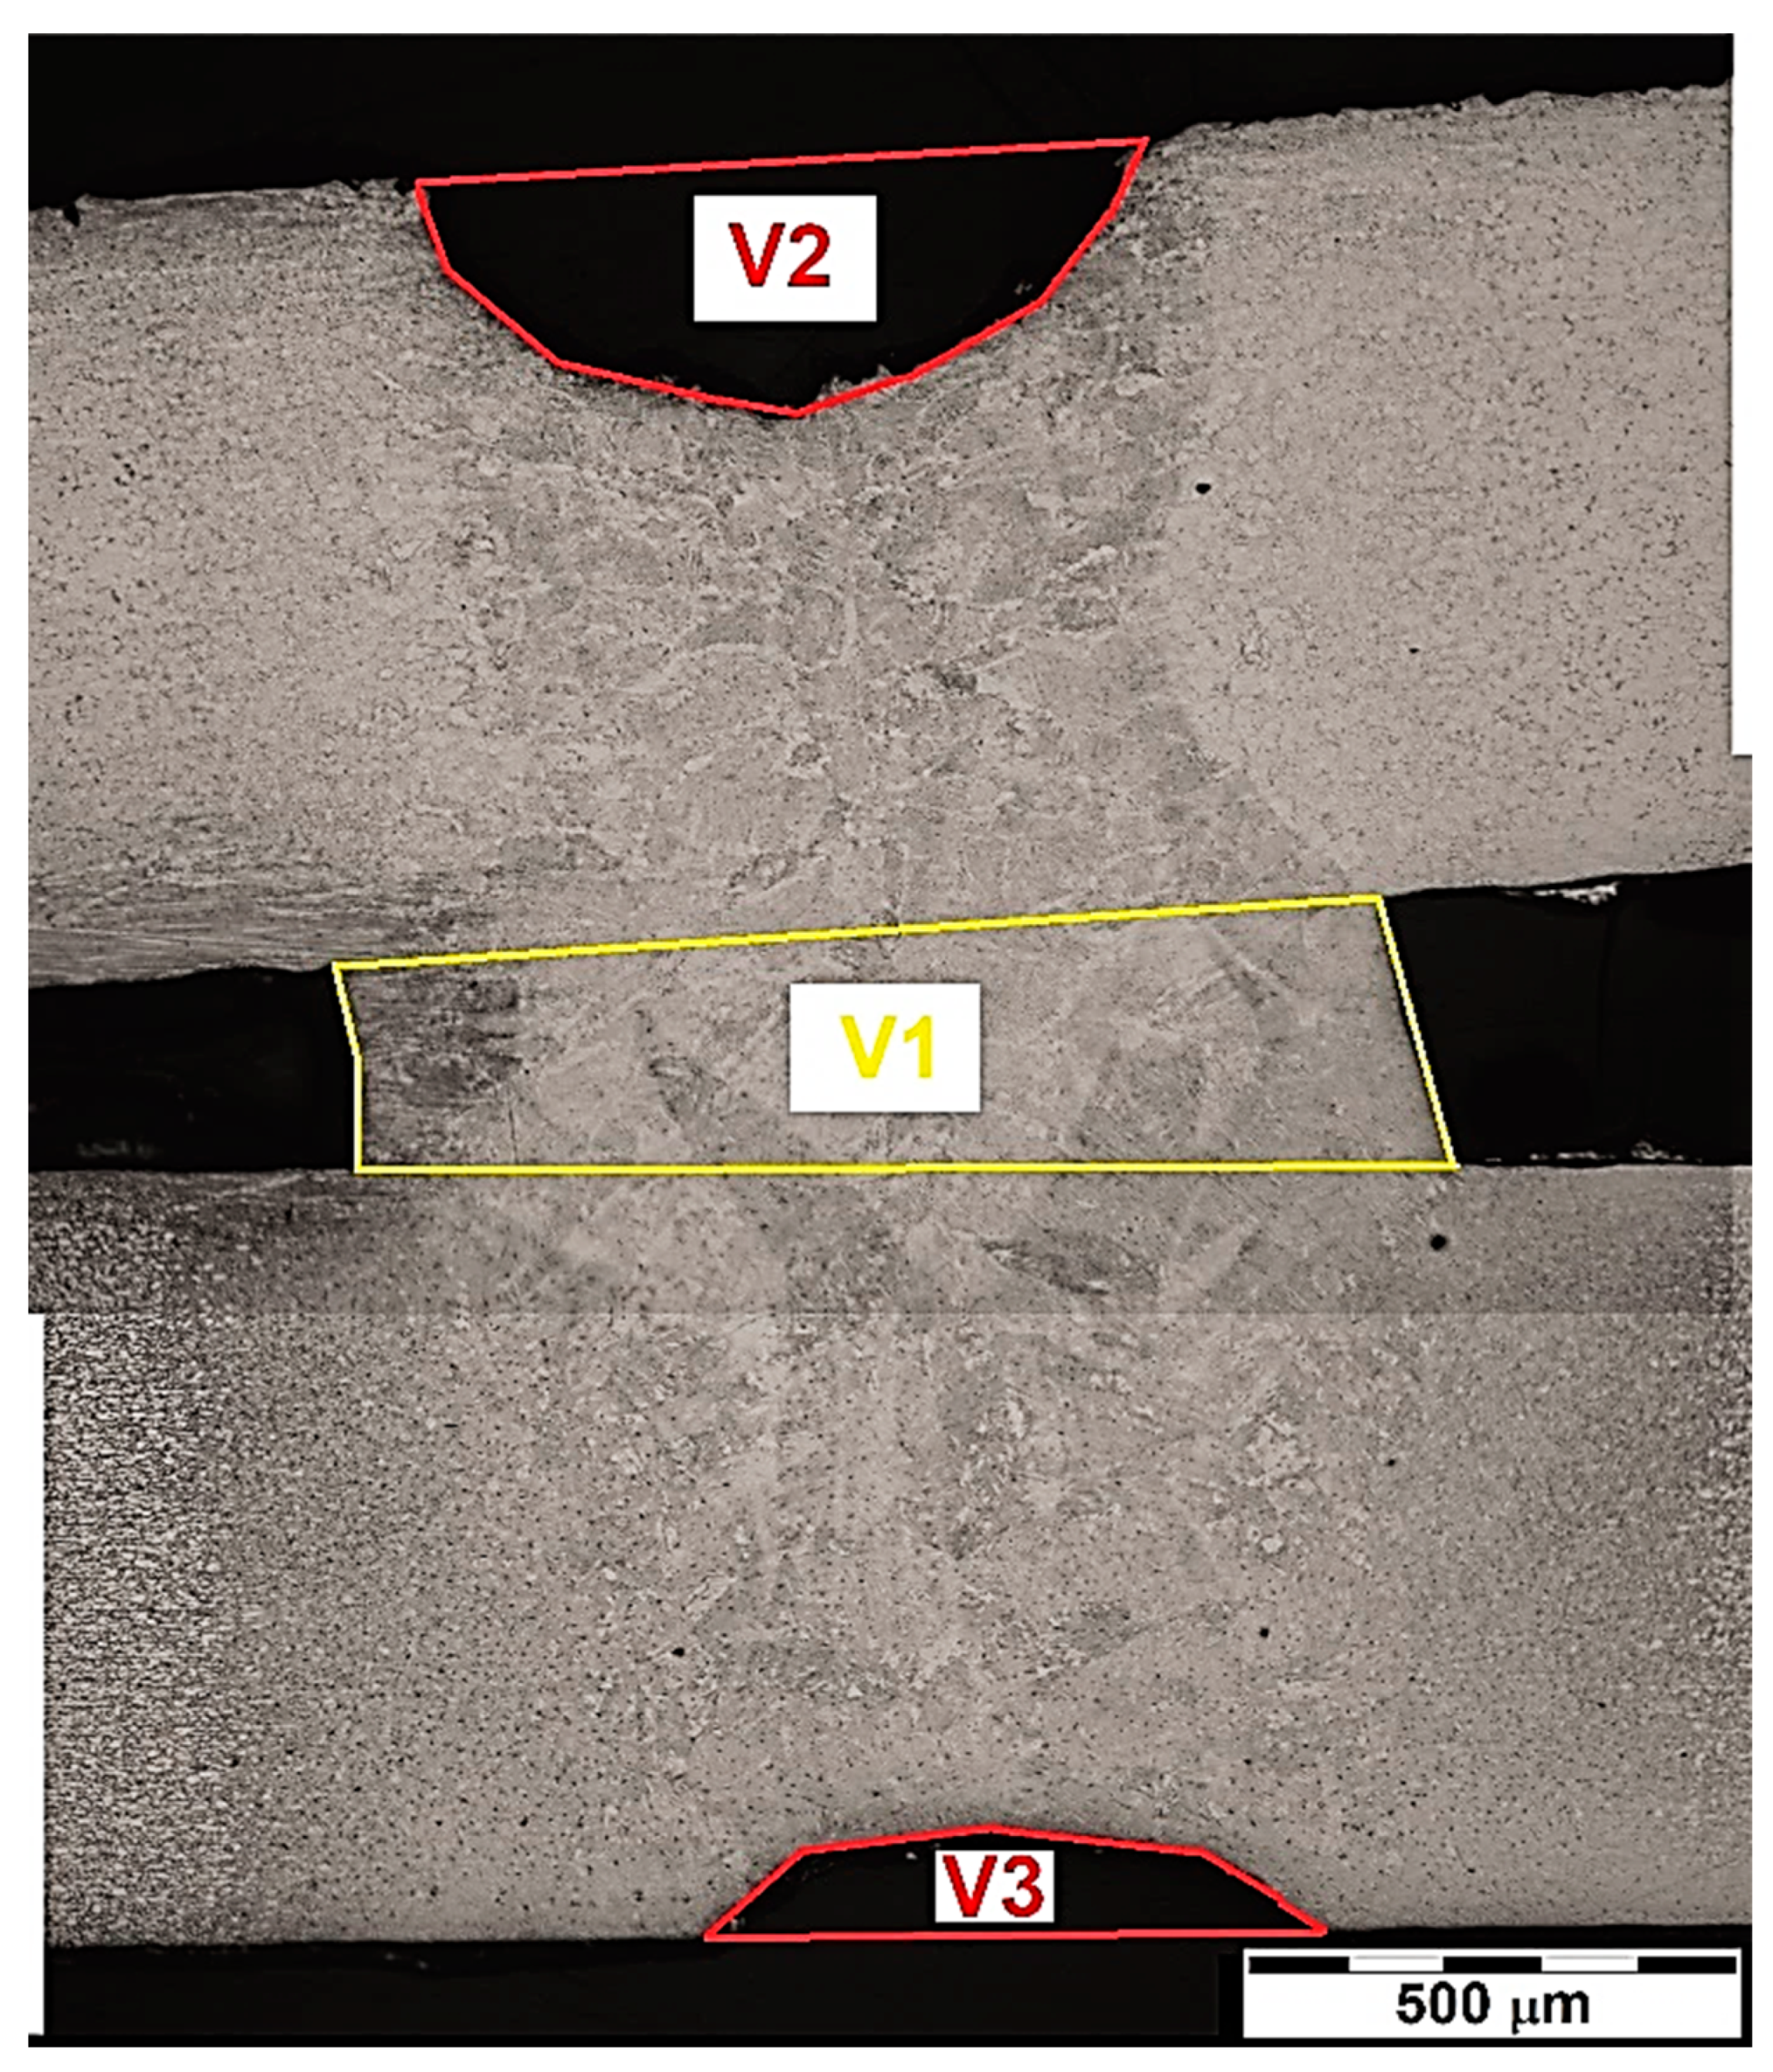
  • The welds exhibited shape imperfections—undercuts in both, surface and root, sagging in surface, root concavity, which were related to both shrinkage processes during melt solidification and weld gap filling.
  • The weld metal is able to bridge the weld gap up to a sheet metal distance of 0.2 mm.
  • The shape imperfections detected do not have a negative effect on the load capacity of the welds under tensile stress.
  • In order to predict the load carrying capacity of the joint and to determine the minimum weld width, it is necessary to know the local mechanical properties of the weld metal in the mixing zone.
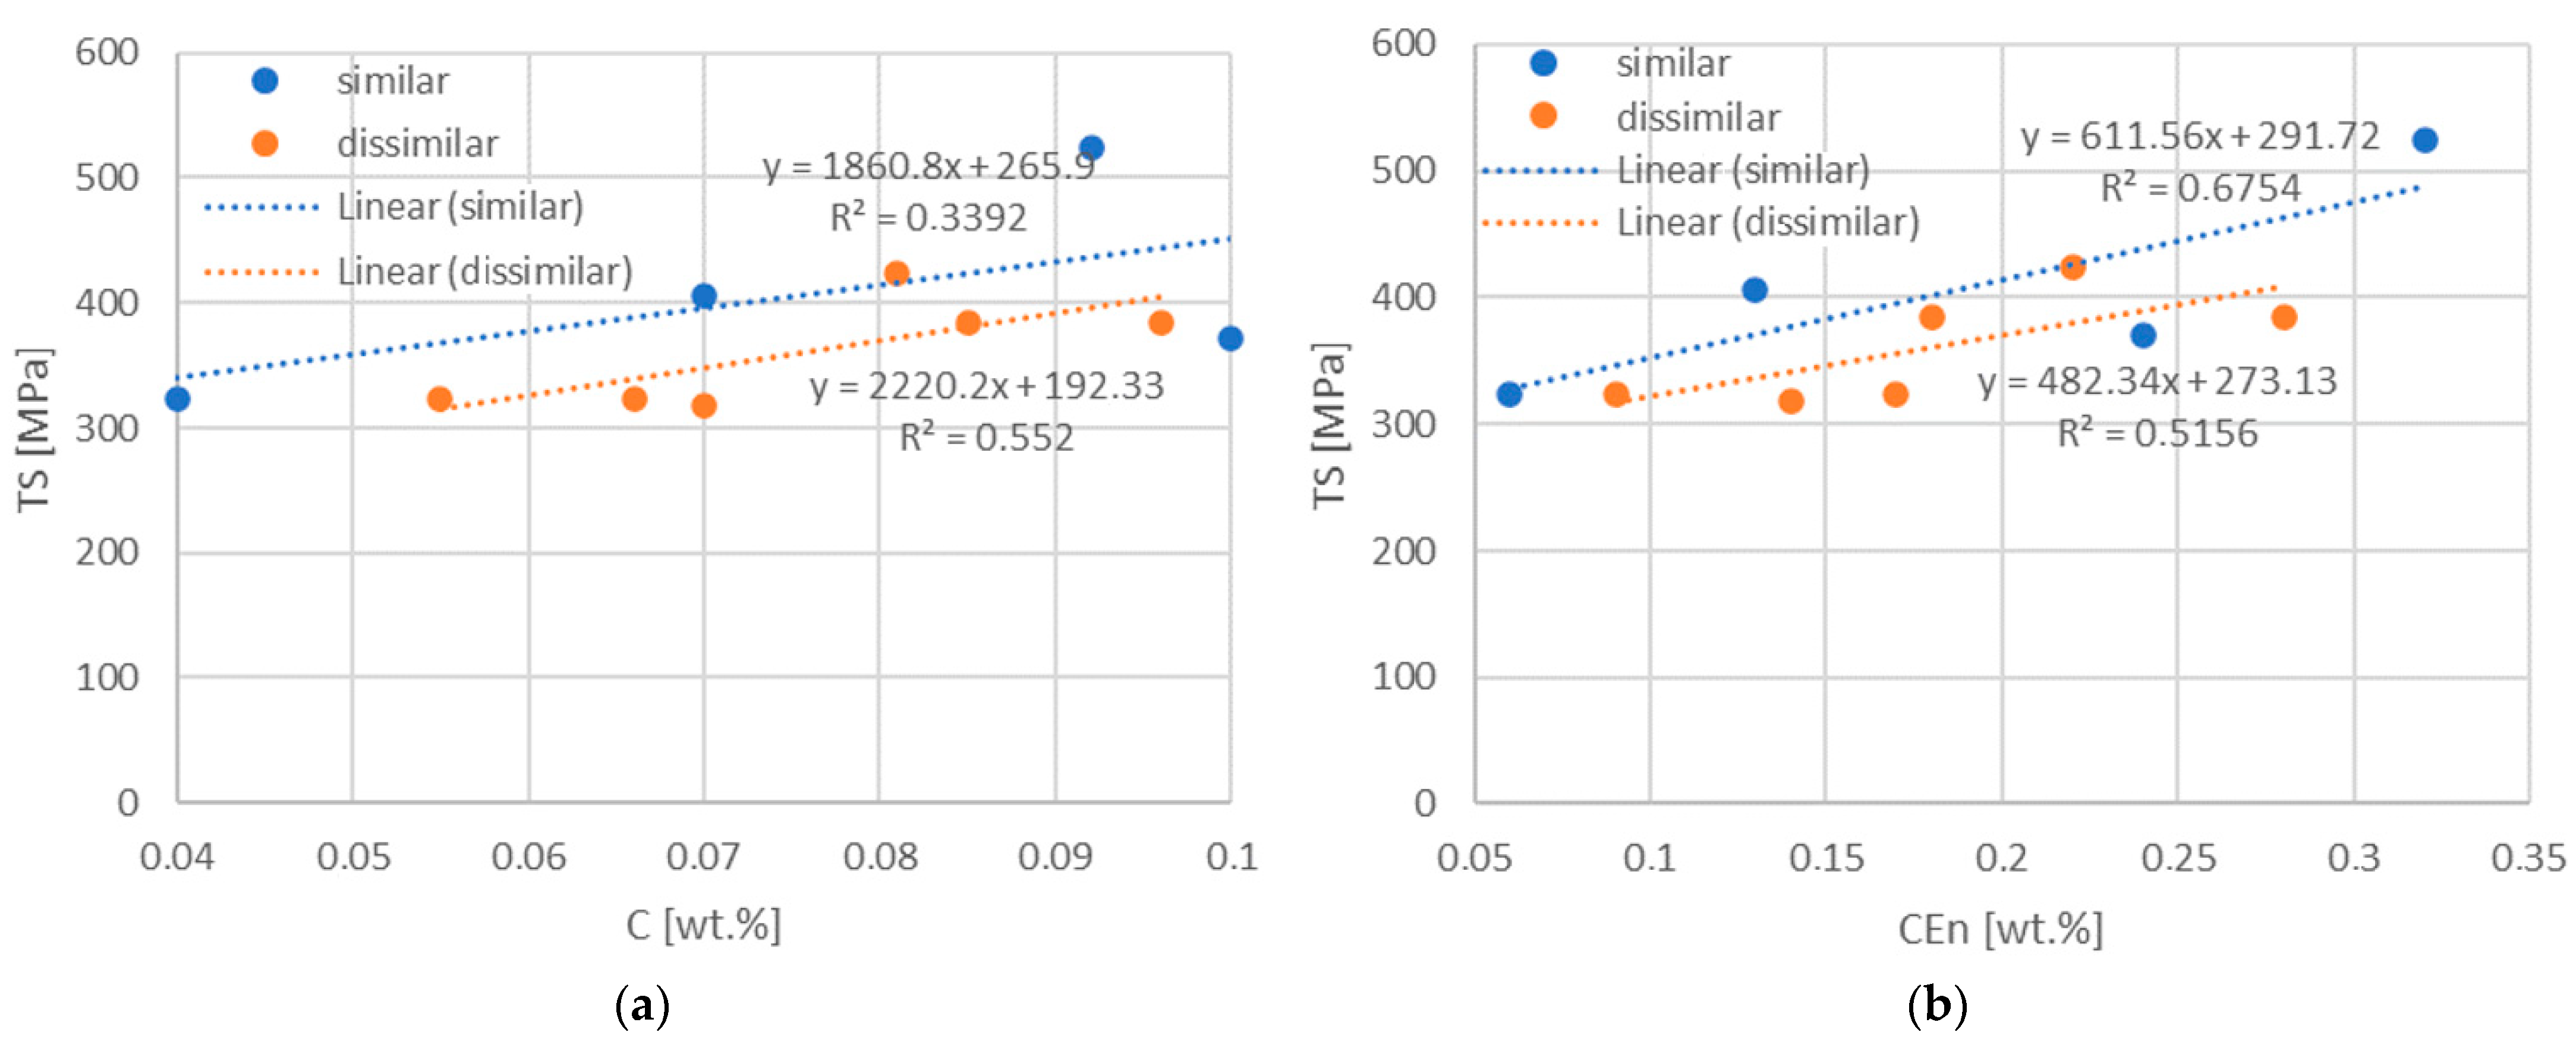
  • A strong linear dependence between weld metal hardness and CEn as well as between tensile strength and CEn has been found.

Author Contributions

Conceptualization, A.G., J.V. and E.J.; methodology, A.G. and J.V.; software, S.M.; validation, D.D. and J.B.; formal analysis, J.B. and E.J.; investigation, A.G., E.J., M.T., S.M., M.D. and M.V.; data curation, M.T. and E.J.; writing—original draft preparation, A.G. and E.J.; writing—review and editing, A.G. and D.D.; visualization, M.D. and M.V.; project administration, A.G.; funding acquisition, A.G. All authors have read and agreed to the published version of the manuscript.

Funding

This research was funded by the Scientific Grant Agency of the Ministry of Education, Science, Research and Sports of the Slovak Republic under project VEGA 1/0154/19: Research into the combined technologies of joining dissimilar materials for automotive industry.

Conflicts of Interest

The authors declare no conflict of interest.

References

  1. Sirisalee, P.; Ashby, M.F.; Parks, G.T.; Clarkson, J.P. Multi-criteria material selection of monolithic and multi—Materials in engineering design. Adv. Eng. Mater. 2006, 8, 48–56. [Google Scholar] [CrossRef]
  2. Martinsen, K.; Hu, S.J.; Carlson, B.E. Joining of dissimilar materials. CIRP Ann. Manuf. Technol. 2015, 64, 679–699. [Google Scholar] [CrossRef] [Green Version]
  3. Yang, J.; Oliviera, J.P.; Li, Y.; Tan, C.; Gao, C.; Zhao, Y.; Yu, Z. Laser techniques for dissimilar joining of aluminum alloys to steels: A critical review. J. Mater. Process. Technol. 2022, 301, 117443. [Google Scholar] [CrossRef]
  4. Oliviera, J.P.; Shamsolhodaei, A.; Shen, J.; Lopes, J.G.; Gonçalves, R.M.; de Brito Ferraz, M.; Piçarra, L.; Zeng, Z.; Schell, N.; Zhou, N.; et al. Improving the ductility in laser welded joints of CoCrFeMnNi high entropy alloy to 316 stainless steel. Mater. Des. 2022, 219, 110717. [Google Scholar] [CrossRef]
  5. Xue, X.; Wu, X.; Liao, J. Hot-cracking susceptibility and shear fracture behavior of dissimilar Ti6Al4V/AA6060 alloys in pulsed Nd:YAG laser welding. Chin. J. Aeronaut. 2021, 34, 375–386. [Google Scholar] [CrossRef]
  6. Evdokimov, A.; Doynov, N.; Ossenbrink, R.; Obrosov, A.; Weiß, S.; Michailov, V. Thermomechanical laser welding simulation of dissimilar steel-aluminum overlap joints. Int. J. Mech. Sci. 2021, 190, 106019. [Google Scholar] [CrossRef]
  7. Kashani, H.T.; Kah, P.; Martikainen, J. Laser overlap welding of zinc-coated steel on aluminum alloy. Phys. Procedia 2015, 78, 265–271. [Google Scholar] [CrossRef] [Green Version]
  8. Kurian, A.; Rakeshnath, T.R. Dissimilar laser welding of commercially pure copper and stainless steel 316L. Mater. Today Proc. 2020, 26, 369–372. [Google Scholar] [CrossRef]
  9. Chen, X.; Wang, X.; Liu, Z.; Hu, Z.; Huan, P.; Yan, Q.; Hiromi, N. Effect of Cu content on microstructure transformation and mechanical properties of Fe-Al dissimilar laser welded joints. Opt. Laser Technol. 2020, 126, 106078. [Google Scholar] [CrossRef]
  10. Malikov, A.; Vitoshkin, I.; Orishich, A.; Filippov, A.; Karpov, E. Effect of the aluminum alloy composition (Al-Cu-Li or Al-Mg-Li) on structure and mechanical properties of dissimilar laser welds with the Ti-Al-V alloy. Opt. Laser Technol. 2020, 126, 106135. [Google Scholar] [CrossRef]
  11. Chandran, S.; Rajesh, R.; Dev, M.A. Analysis of mechanical properties and optimization of laser beam welding parameters on dissimilar metal titanium (Ti6Al4V) and aluminium (A6061) by factorial and ANOVA techniques. Mater. Today Proc. 2021, 42, 508–514. [Google Scholar] [CrossRef]
  12. Dai, W.; Wenjun, S.; Xin, J.; Wang, S.; Fang, C.; Wei, J.; Song, Y. Weldability and mechanical properties of IC10 single crystal and GH3039 super alloy dissimilar laser beam welding joint. Mater. Sci. Eng. A 2020, 791, 139797. [Google Scholar] [CrossRef]
  13. Chen, L.; Wang, C.; Xiong, L.; Zhang, X.; Mi, G. Microstructural, porosity and mechanical properties of lap joint laser welding for 5182 and 6061 dissimilar aluminum alloys under different place configurations. Mater. Des. 2020, 191, 108625. [Google Scholar] [CrossRef]
  14. Geng, Y.; Akbari, M.; Karimipour, A.; Karimi, A.; Soleimani, A.; Afrand, M. Effects of the laser parameters on the mechanical properties and microstructure of weldjoint in dissimilar pulsed laser welding of AISI 304 and AISI 420. Infrared Phys. Technol. 2019, 103, 103081. [Google Scholar] [CrossRef]
  15. Ramakrishnan, H.; Veluchamy, B.; Rajaram, S.; Ravichandran, M. Experimental investigation on properties of dissimilar laser welding of AISI 316L to Monel 400. Mater. Today Proc. 2020, 33, 4059–4064. [Google Scholar] [CrossRef]
  16. Zhang, L.J.; Ma, R.Y.; Zhang, Y.B.; Guo, Q.; Wang, C.H.; Zhang, J.X.; Na, S.J. Investigation on dissimilar laser beam welding of molybdenum to zirconium via pure titanium interlayer. Opt. Laser Technol. 2020, 131, 106327. [Google Scholar] [CrossRef]
  17. Shen, J.; Gonçalves, R.; Choi, Y.T.; Lopes, J.G.; Yang, J.; Schell, N.; Kim, H.S.; Oliviera, J.P. Microstructure and mechanical properties of gas metal arc welded CoCrFeMnNi joints using a 410 stainless steel filler metal. Mater. Sci. Eng. A 2022, 144025, in press. [Google Scholar] [CrossRef]
  18. Shen, J.; Gonçalves, R.; Choi, Y.T.; Lopes, J.G.; Yang, J.; Schell, N.; Kim, H.S.; Oliviera, J.P. Microstructure and mechanical properties of gas metal arc welded CoCrFeMnNi joints using a 308 stainless steel filler metal. Scr. Mater. 2023, 222, 115053. [Google Scholar] [CrossRef]
  19. Yang, B.; Hongyun, Z.; Wu, L.; Tan, C.; Hongbo, X.; Bo, C.; Xiaoguo, S. Interfacial microstructure and mechanical properties of laser-welded 6061Al/AISI304 dissimilar lap joints via beam oscillation. J. Mater. Res. Technol. 2020, 9, 14630–14644. [Google Scholar] [CrossRef]
  20. Akhiri Ardakani, H.; Naffakh-Moosavy, H. The effect of pulsed Nd:YAG laser welding parameters on defects of Kovar to AISI 304L dissimilar joint. Opt. Laser Technol. 2019, 118, 62–68. [Google Scholar] [CrossRef]
  21. Junjie, M.; Fanrong, K.; Blair, C.; Kovacevic, R. Two-pass laser welding of galvanized highstrength dual-phase steel for a zero-gap lap joint configuration. J. Mater. Process. Technol. 2013, 213, 495–507. [Google Scholar] [CrossRef]
  22. Nguyen, Q.; Azadkhou, A.; Akbari, M.; Panjehpour, A.; Karimipour, A. Experimental investigation of temperature field and fusion zone microstructure in dissimilar pulsed laser welding of austenitic stainless steel and copper. J. Manuf. Process. 2020, 56, 206–215. [Google Scholar] [CrossRef]
  23. Huang, W.; Wang, H.; Rinker, T.; Tan, W. Investigation of metal mixing in laser keyhole welding of dissimilar metals. Mater. Des. 2020, 195, 109056. [Google Scholar] [CrossRef]
  24. Lišková, A.; Mihaliková, M.; Dragošek, L.; Kočiško, R.; Bidulský, R. Mechanical properties laser welding automotive steel sheets. Acta Metall. Slovaca 2015, 21, 195–202. [Google Scholar] [CrossRef] [Green Version]
  25. Švec, P.; Schrek, A.; Hrnčiar, V.; Csicsó, T. Fibre laser welding of dual phase steels. Acta Metall. Slovaca 2015, 21, 311–320. [Google Scholar] [CrossRef] [Green Version]
  26. Evin, E.; Németh, S.; Tomáš, M. Effect of laser welding on safety characteristics of high strength steels sheets. Acta Metall. Slovaca 2015, 21, 184–194. [Google Scholar] [CrossRef]
  27. Mei, L.; Yan, D.; Chen, G.; Xie, D.; Zhang, M.; Ge, X. Comparative study on CO2 laser overlap welding and resistance spot welding for automotive body in white. Mater. Des. 2015, 78, 107–117. [Google Scholar] [CrossRef]
  28. Mei, L.; Yan, D.; Yi, J.; Chen, G.; Ge, X. Comparative analysis on overlap welding properties of fiber laser and CO2 laser for body-in-white sheets. Mater. Des. 2013, 49, 905–912. [Google Scholar] [CrossRef]
  29. Chen, G.; Mei, L.; Zhang, M.; Zhang, Y.; Wang, Z. Research on key influence factors of laser overlap welding of automobile body galvanized steel. Opt. Laser Technol. 2013, 45, 726–733. [Google Scholar] [CrossRef]
  30. Mei, L.; Chen, G.; Yan, D.; Xie, D.; Ge, X.; Zhang, M. Impact of inter-sheet gaps on laser overlap welding performance for galvanised steel. J. Mater. Process. Technol. 2015, 226, 157–168. [Google Scholar] [CrossRef]
  31. Hao, Y.; Wang, H.P.; Sun, Y.; Li, L.; Wu, Y.; Lu, F. The evaporation behavior of zinc and its effect on spattering in laser overlap welding of galvanized steels. J. Mater. Process. Technol. 2022, 306, 117625. [Google Scholar] [CrossRef]
  32. Yurioka, N.; Kasuya, T. A chart method to determine necessary preheat in steel welding. Weld. World 1995, 35, 327–334. [Google Scholar] [CrossRef] [Green Version]
  33. Dearden, J.; O’Neil, H. A guide to the selection and welding of low alloy structural steel. Trans. Inst. Weld. 1940, 3, 203–214. [Google Scholar]
  34. Ito, Y.; Bessyo, K. Cracking Parameter of High Strength Steels related to Heat Affected Zone Cracking (Report 2). J. Jpn. Weld. Soc. 1969, 38, 1134–1144. [Google Scholar] [CrossRef] [Green Version]
  35. Yurioka, N.; Suzuki, H.; Ohshita, S.; Saito, S. Determination of necessary preheating temperature in steel welding. Weld. Res. 1983, 62, 147–153. Available online: https://app.aws.org/wj/supplement/WJ_1983_06_s147.pdf (accessed on 12 September 2022).
  36. Santillan Esquivel, A.; Nayak, S.S.; Xia, M.S.; Zhou, Y. Microstructure, hardness and tensile properties of fusion zone in laser welding of advanced high strength steels. Can. Metall. Q. 2012, 51, 328–335. [Google Scholar] [CrossRef]
  37. Mwema, F.M. Transient Thermal Modeling in Laser Welding of Metallic/Nonmetallic Joints Using SolidWorks® Software. Int. J. Nonferr. Metall. 2017, 6, 1–16. [Google Scholar] [CrossRef] [Green Version]
  38. ISO 6520-1:2007; Welding and Allied Processes—Classification of Geometric Imperfections in Metallic Materials—Part 1: Fusion Welding. CEN: Brusel, Belgium, 2007.
  39. Evin, E.; Tomáš, M.; Výrostek, M. Quasistatic strain rates’ effect to the properties of advanced steels for automotive industry. Acta Metall. Slovaca 2016, 22, 14–23. [Google Scholar] [CrossRef] [Green Version]
  40. Aderibigbe, I.; Popoola, P.; Sadiku, E.; Biro, E. Low-Temperature Deformation Mechanism and Strain-Hardening Behaviour of Laser Welded Dual-Phase Steels. Metals 2022, 12, 1317. [Google Scholar] [CrossRef]
Figure 1. Zones of remelting and mixing in an overlapped weld joint of dissimilar steels.
Metals 12 01682 g001
Figure 2. Formation of laser welds: (a) shape and dimensions of welded plates, (b) shape and dimensions of test specimens for testing the load carrying capacity of welds.
Metals 12 01682 g002
Figure 3. Computer model of weld. Green—boundary conditions for fixation, removing all degrees of freedom from assembly, purple—force boundary conditions—linear movement of elements under load.
Metals 12 01682 g003
Figure 4. Example of FEM analysis for a pair of TL-TL materials.
Metals 12 01682 g004
Figure 5. Positioning of weld microhardness measurement.
Metals 12 01682 g005
Figure 6. Metallography cross-sections of weld joints with DC steel in upper position. (a) DC-DC. (b) DC-TL. (c) DC-HCT. (d) DC-HX.
Metals 12 01682 g006aMetals 12 01682 g006b
Figure 7. Metallography cross-sections of weld joints with TL steel in upper position. (a) TL-DC. (b) TL-TL. (c) TL-HCT. (d) TL-HX.
Metals 12 01682 g007
Figure 8. Metallography cross-sections of weld joints with HCT steel in upper position. (a) HCT-DC. (b) HCT-TL. (c) HCT-HCT. (d) HCT-HX.
Metals 12 01682 g008
Figure 9. Metallography cross-sections of weld joints with HX steel in upper position. (a) HX-DC. (b) HX-TL. (c) HX-HCT. (d) HX-HX.
Metals 12 01682 g009
Figure 10. Relocation of the weld metal volume into the weld gap (V1 > V2 + V3).
Metals 12 01682 g010
Figure 11. Selected geometric characteristics of welded joints (L1—maximum height of surface irregularity, L2—maximum height of irregularity at the weld root, L3—weld width, L4—gap between plates, L5—width of macroscopically distinguishable HAZ).
Metals 12 01682 g011
Figure 12. Surface and line EDX analyses of the weld (a) HCT-DC, (b) HCT-TL, the content of individual elements is given in wt.%.
Metals 12 01682 g012aMetals 12 01682 g012b
Figure 13. Characteristic microhardness profiles through individual materials in the weld: (a) DC (blue)-HCT(black), (b) HX(yellow)-TL(green).
Metals 12 01682 g013
Figure 14. Illustration of the hardness profile in line 3 for TL-DC and HCT-HX joints. (a) TL-DC. (b) HCT-HX.
Metals 12 01682 g014
Figure 15. Dependence of WM hardness on (a) carbon content C and (b) carbon equivalent CEn.
Metals 12 01682 g015
Figure 16. Load-displacement curves of weld joints with (a) DC, (b) TL, (c) HCT and (d) HX in upper position.
Metals 12 01682 g016aMetals 12 01682 g016b
Figure 17. Failure of materials when testing the load capacity of welded joints.
Metals 12 01682 g017
Figure 18. Load-bearing capacity of the weld joints: Blue—material combinations where one of the materials is DC, Green—material combinations where one of the materials is TL (DC excluded), Yellow—material combinations where one of the materials is HX (DC and TL excluded), Black—connection of the same materials with the highest strength.
Metals 12 01682 g018
Figure 19. Determination of minimum weld width. Blue—thickness and cross-section of the material, red—width of material and weld width.
Metals 12 01682 g019
Figure 20. Dependence of TS of welds on (a) carbon content C and (b) carbon equivalent CEn.
Metals 12 01682 g020
Table 1. Chemical composition of materials used, wt.%.
MaterialCMnSiPSAlNbTiVMoCrFe
DC0.0400.25 0.0090.008 balance
TL0.11.00.50.080.030.0150.10.15 balance
HCT0.0921.880.2500.0120.0030.0260.0010.0020.0010.0020.210balance
HX0.0700.600.0070.0160.0070.0340.0250.001 balance
Table 2. Mechanical properties of the materials used, transversal to rolling direction.
MaterialYS [MPa]UTS [MPa]A80 [%]Zn Layer [g/m2]rn
DC19732739.0-1.9000.220
TL29237334.01041.3500.190
HCT34665423.5105-0.230
HX41447328.4111--
Table 3. Carbon equivalent in wt.% calculated for individual materials using particular formulas.
MaterialCE(IIW) (1)PCM (2)CEn (3)
DC0.080.050.06
TL0.280.180.24
HCT0.450.210.32
HX0.170.10.13
Table 4. Carbon equivalent CEn values for joints in wt.%.
Material CombinationsDC-TLDC-HCTDC-HXTL-HCTTL-HXHCT-HX
CEn0.140.170.090.280.180.22
Table 5. Material combinations.
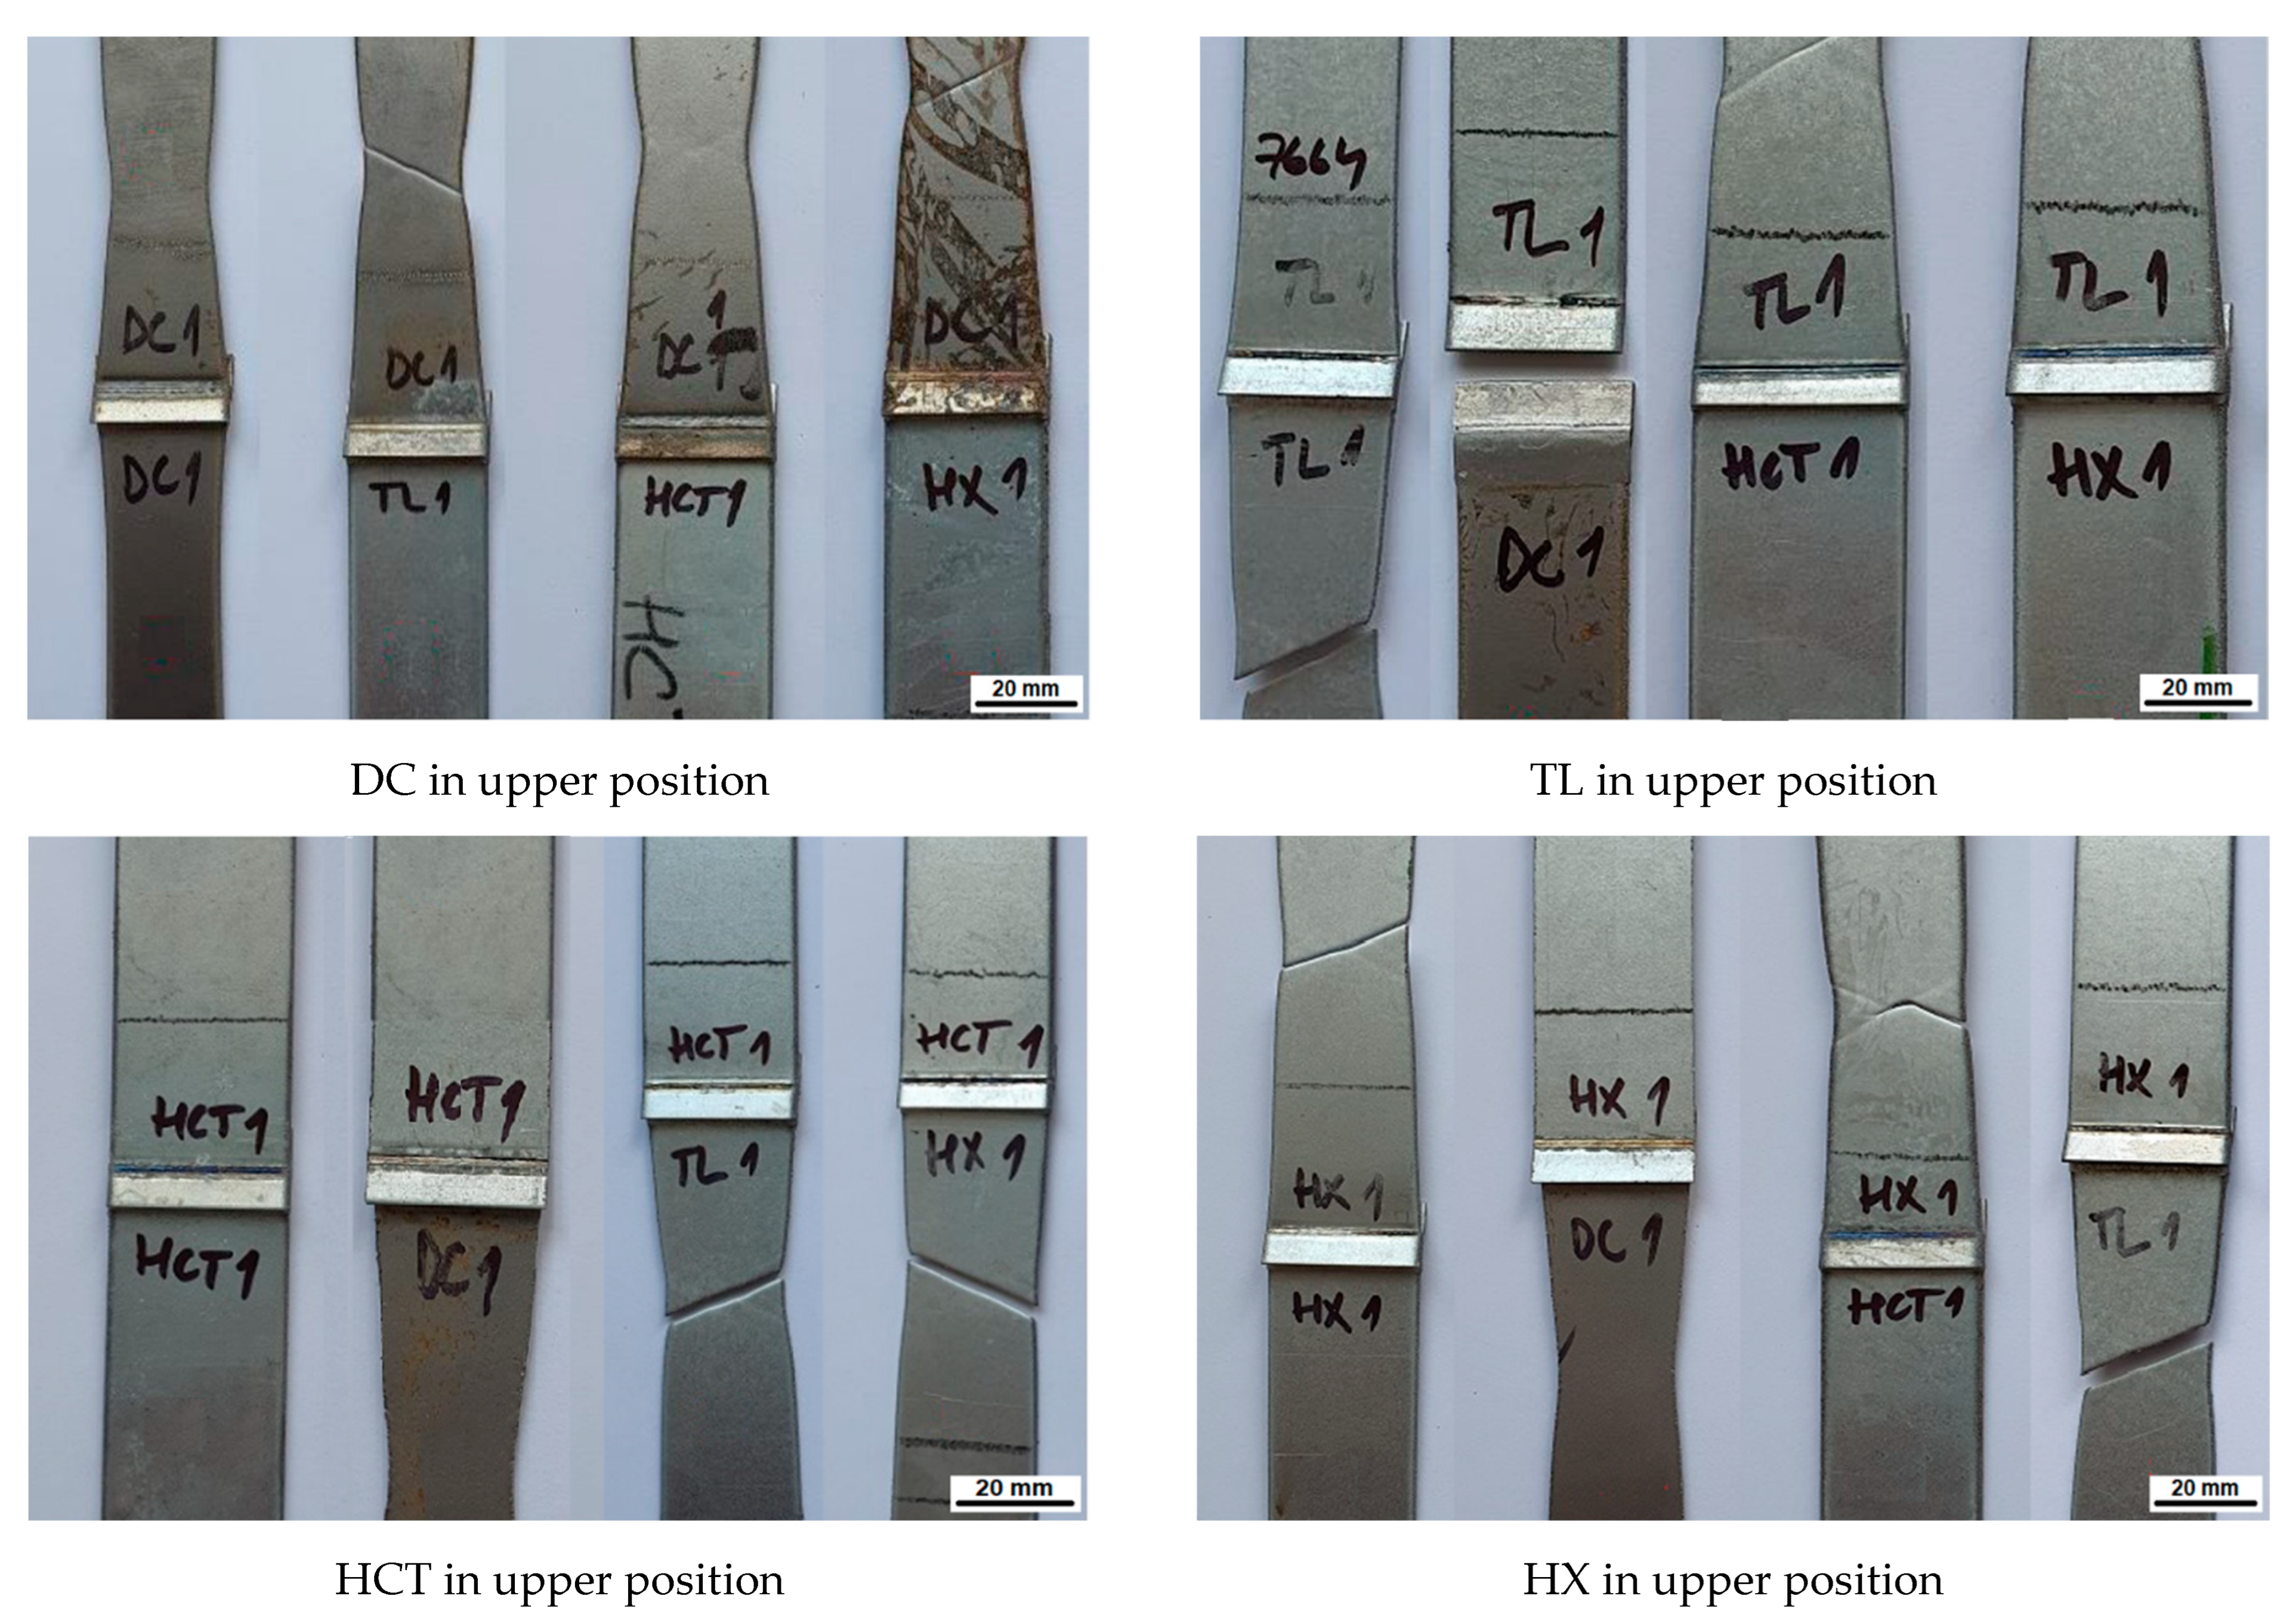
Upper Sheet–Lower Sheet
DC in Upper PositionTL in Upper PositionHCT in Upper PositionHX in Upper Position
DC-DCTL-DCHCT-DCHX-DC
DC-TLTL-TLHCT-TLHX-TL
DC-HCTTL-HCTHCT-HCTHX-HCT
DC-HXTL-HXHCT-HXHX-HX
Table 6. Selected geometric characteristics of welds in [mm].
Material CombinationMaximum Height of Weld IrregularityWeld Width (L3)Weld Gap (L4)Width of HAZ (L5)
Surface (L1)Root (L2)
DC-DC0.080.110.620.011.45
DC-TL0.040.070.820.141.12
DC-HCT0.110.150.680.081.62
DC-HX0.060.110.750.151.54
TL-DC0.030.090.510.010.96
TL-TL0.060.060.720.101.46
TL-HCT−0.27−0.111.070.191.7
TL-HX0.050.060.890.081.5
HCT-DC0.020.090.840.141.75
HCT-TL0.120.030.720.011.58
HCT-HCT0.050.090.620.041.37
HCT-HX0.150.070.720.001.58
HX-DC0.070.040.750.141.66
HX-TL0.070.080.730.061.58
HX-HCT0.180.130.730.011.5
HX-HX0.200.170.650.031.3
Publisher’s Note: MDPI stays neutral with regard to jurisdictional claims in published maps and institutional affiliations.

