Article

Effect of the Initial Texture, Recrystallization and Re-Dissolution Process on the Evolution of Texture during Solution Treatment of the 7A65 Hot Rolled Plate

1
Department of Materials Science and Engineering, Beihang University, Beijing 100191, China
2
Research Center for Lightweight Materials, Ningbo Institute of Technology, Beihang University, Ningbo 315100, China
3
The First Aircraft of Institute of AVIC, Xi’an 710089, China
*
Authors to whom correspondence should be addressed.
Metals 2022, 12(1), 8; https://doi.org/10.3390/met12010008
Submission received: 24 November 2021 / Revised: 15 December 2021 / Accepted: 18 December 2021 / Published: 21 December 2021

Abstract

:
The evolution of textures, the degree of recrystallization and the mechanical properties of 7A65 hot rolled plates during re-dissolution were studied with different thicknesses (25 mm, 65 mm, 120 mm) and different degrees of deformation. It was found that different plates exhibited different trends of re-dissolution because the degrees of deformation increased and the degrees of recrystallization were different during the solution treatment. With the increase of deformation and static recrystallization degrees, texture types changed from Cube, R-Cube to Brass, R, Cube and Copper during the re-dissolution process. The value of the Schmid factor ( µ ¯ ) was calculated and the value along the rolling direction was significantly larger than along the transverse direction, which led to a lower yield strength along the rolling direction. In terms of the average contribution of the yield strength, the strengthening of the grain boundary including LAGBs (low-angle grain boundaries) was found to play a more significant role than the effect of solid atoms and dislocation densities. Therefore, the 25 mm plate exhibits the best mechanical properties, with a yield strength of 565.7 MPa along the rolling direction.

1. Introduction

In the field of aeronautical materials, especially in the aircraft manufacturing field, Al-Zn-Mg-Cu hot rolled plates with different heat treatment conditions have been used extensively in recent years [1,2]. Nonetheless, mechanical anisotropy is often a problem that exists in hot rolled plates [3,4,5,6]. Different plates with different degrees of deformation exhibit contrasting extents of mechanical anisotropy [7,8,9,10,11]. Texture type and orientation density are the main factors that affect mechanical anisotropy, and texture evolution will occur in the process of solution treatment [12,13,14,15]. Thus, it is crucial to observe the relationship between the texture and mechanical anisotropy in different solid solution stages [16,17,18,19].
Owing to the deformation of the plates differing greatly, the initial textures and degrees of recrystallization are different which leads the evolution process to be slightly different [20,21,22,23,24]. Han et al. [25] investigated the effect of the initial texture on dissimilar channel angular pressing (DCAP). The results showed that the <110>//ND (the normal direction) texture accelerated the formation of the <111>//ND, and the Cube texture accelerated the formation of R-Cube. In the previous investigations of the solution process, different solution treatments affected texture evolution to different degrees [26,27]. However, almost no research has focused on the influence of the initial texture of the hot rolled plates during the solution process at the same solution temperature. Thus, this subject is certainly interesting and important.
In addition to considering the effect of initial texture and recrystallization, the influence of the re-dissolution should be investigated as well. The reason is that the solution process is complex and involves a mass of changes including re-dissolution of the second phase, recrystallization and texture evolution [16,18]. Thus, it is of great significance to analyze the whole re-dissolution process and observe the relationship among re-dissolution, recrystallization and texture evolution. Diffusion is the main factor that affects the re-dissolution process, and temperature and defect density are the two factors that influence the diffusion process [28]. Thus, due to the plates having different deformation, the defect density is different and there are contrasts in the diffusion process during solution treatment, which may affect texture evolution in the following solution treatment. In this research, the re-dissolution process was studied and the evolution of textures was discussed to clarify the effects of the initial texture, recrystallization and the re-dissolution process on texture evolution for plates of different thickness. Mechanical properties and anisotropy after different solution treatments were also found to be related to the texture and the degree of recrystallization.

2. Materials and Methods

Different thicknesses (25 mm, 65 mm, 120 mm) of 7A65 hot rolled plates with a nominal composition of Al-7.7Zn-1.65 Mg-1Cu-0.1Zr were selected for the experiment. To examine the evolution trends of re-dissolution and orientation density with the extension of solution time, samples were taken from the center thickness of the plates. The solid solution temperature in this study was 477 °C; 30 min, 90 min, 210 min and 330 min were adopted as the solution times in this study. In order to eliminate the impacts of the quenching sensitivity, samples were tested in the same size. Samples (75 mm × 60 mm × 25 mm) were cut from the plates continuously and then the solid solution treatment was conducted in the box furnace. After water quenching at room temperature, the same T74 (121 °C/6 h + 152 °C/25 h) ageing treatment was accomplished for all the samples.
Optical microscopy (OM) images were obtained after the samples were etched with Keller reagent. The scanning electron microscope (SEM) was applied to observe the phase morphology and distribution, and energy dispersive spectroscopy (EDS) was adopted to confirm the phase composition. Samples for electron backscatter diffraction (EBSD) were prepared after being mechanically polished and electrolytically polished. The grain orientation and the percentage of low-angle grain boundaries (LAGBs) and high angle grain boundaries (HAGBs) were identified by using EBSD results after being analyzed by TSL OIM Analysis software (version 5.3, EDAX, Beijing, China). The Schulz back reflection method was adopted to perform the macro texture tests using X-ray diffraction (XRD), and the results were processed by the JTEX software (developed by J.-J. Fundenberger and B. Beausir) to obtain the orientation distribution function (ODF) and the inverse pole figure (IPF) results. The orientation densities of all textures were obtained through picture scales, after gathering statistics. Meanwhile, the volume fraction of Brass texture was obtained through calculating the proportion of Brass orientation density in all orientation densities. Samples for texture and conductivity tests (10 mm × 10 mm × 10 mm) were cut after solution treatment and the surface of rolling was tested. Conductivity tests were performed using an eddy current conductivity meter, and the mean of five test results was considered the final result. Conductivity was measured to analyze the degree of second phase re-dissolution. Tensile tests were performed along the rolling direction (RD) and the transverse direction (TD) to analyze the relationship between the mechanical properties and the texture (including the types and orientation density).

3. Results

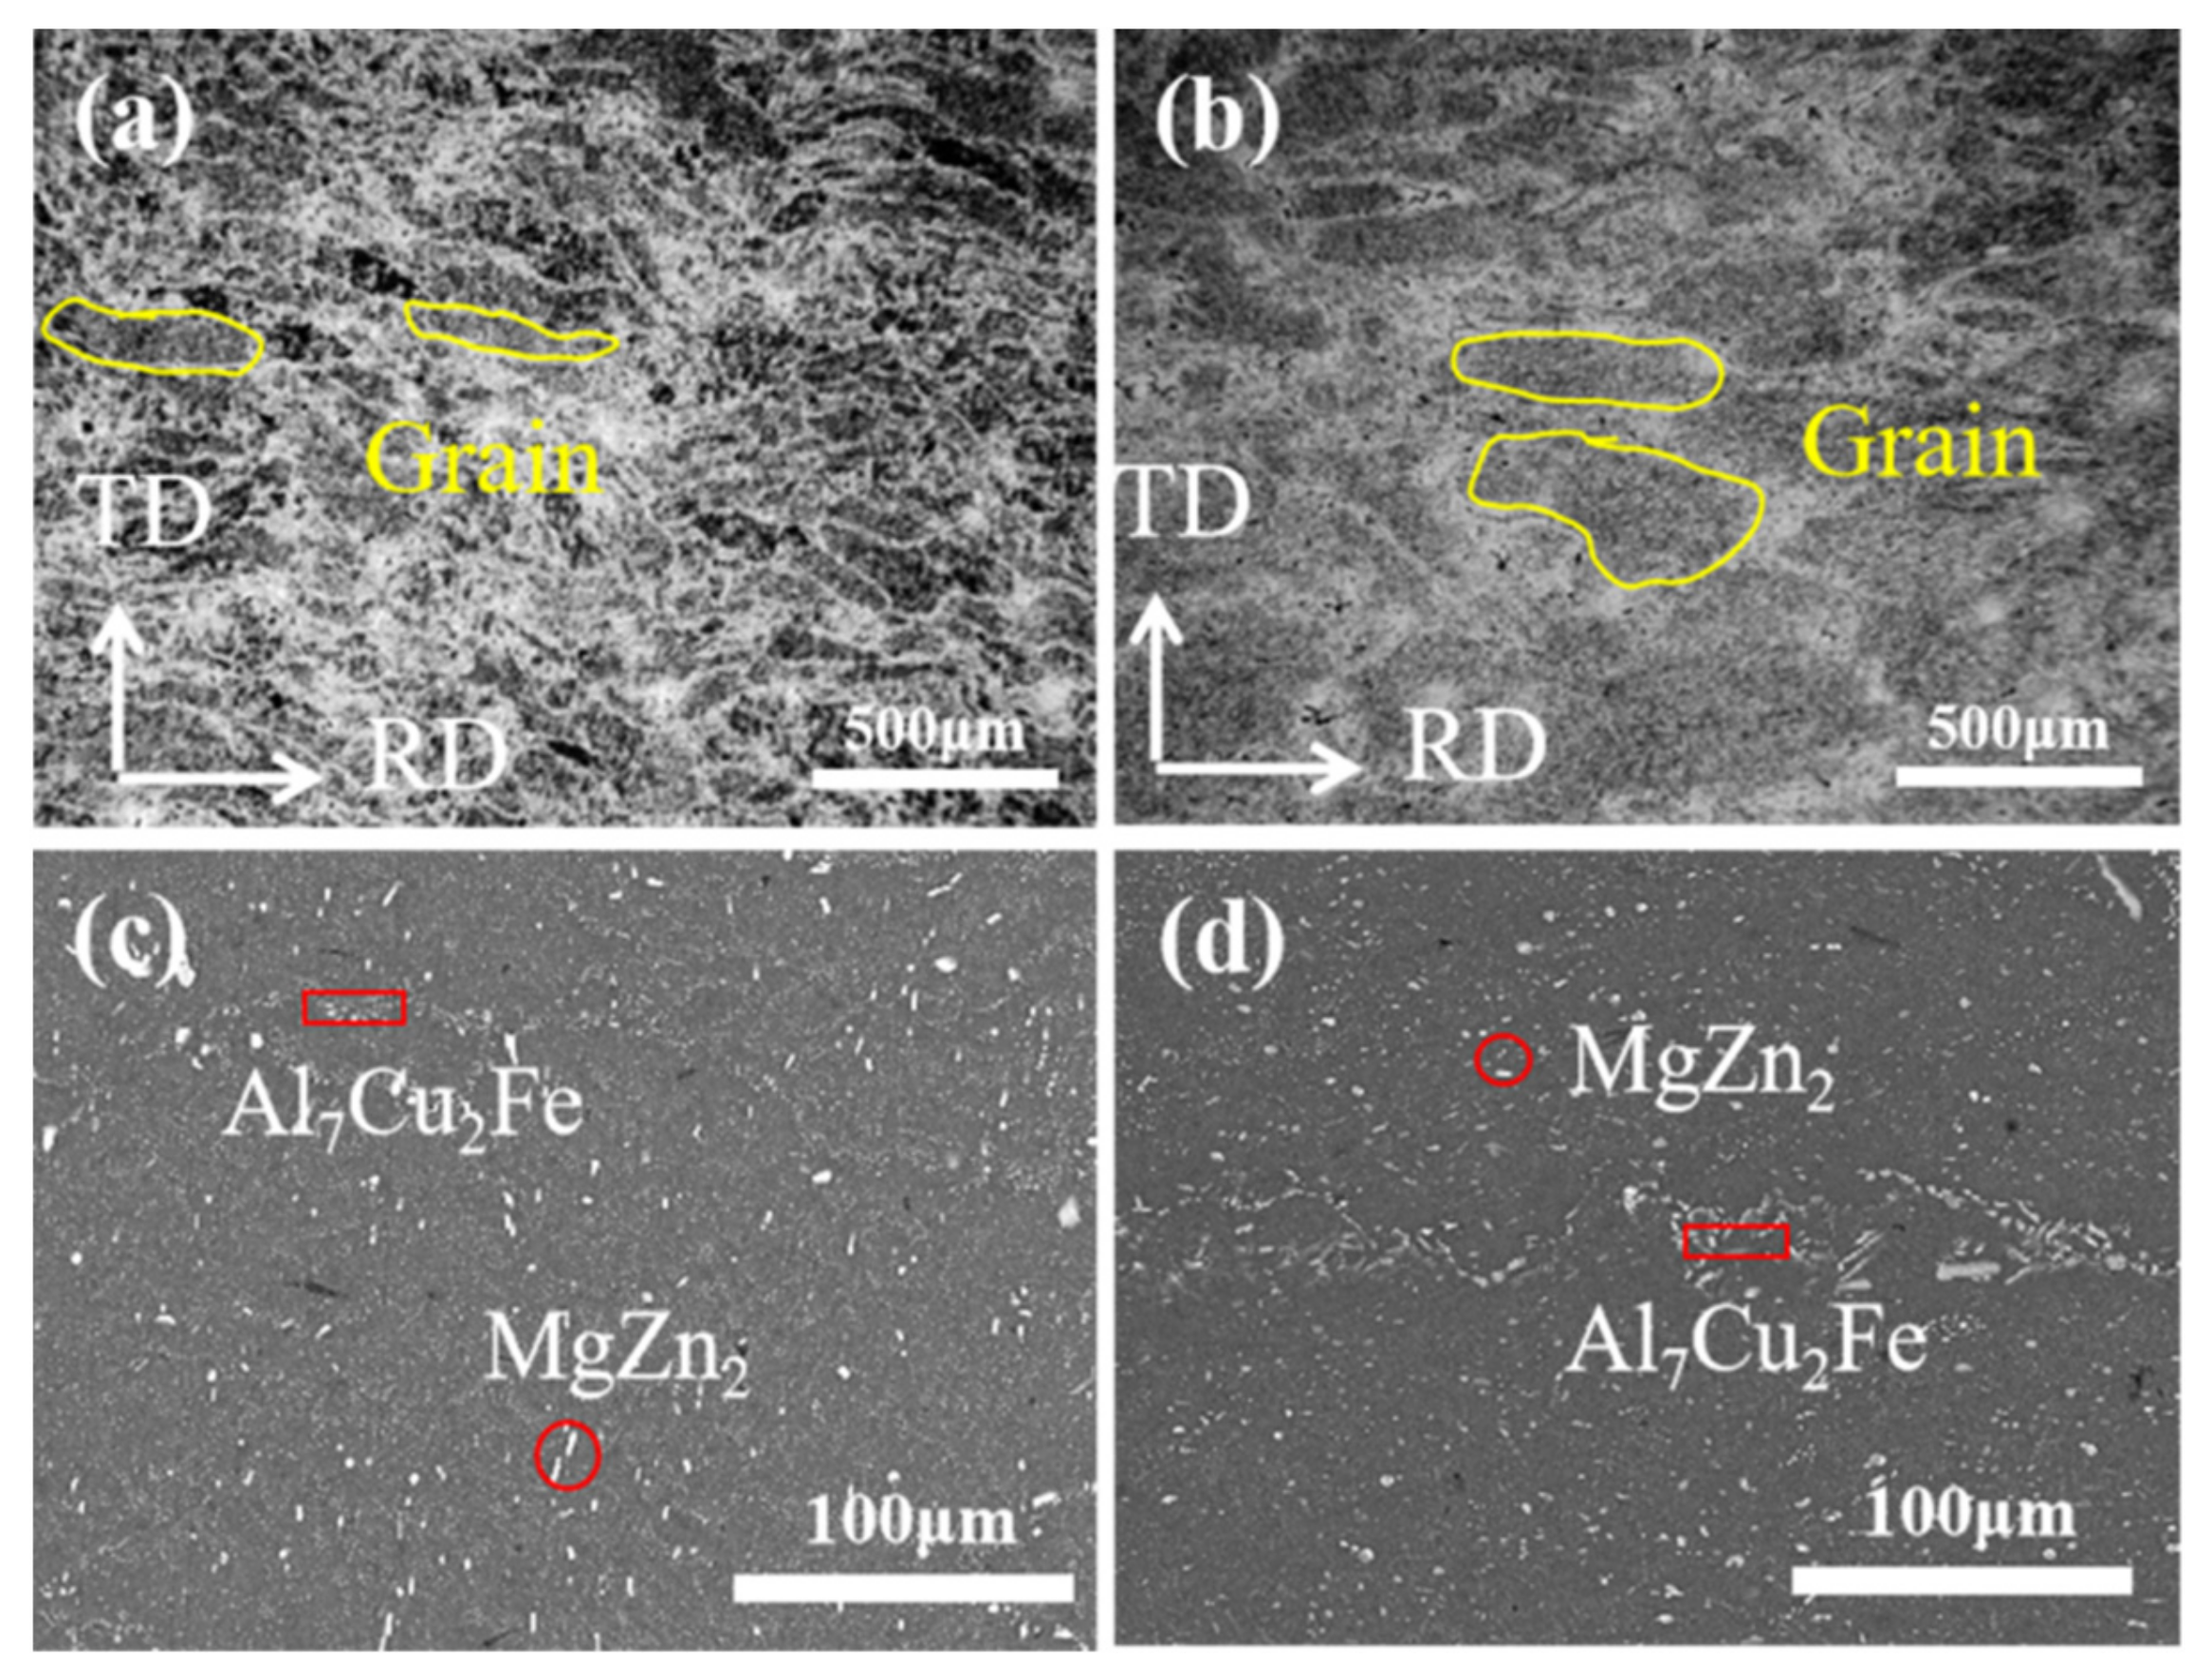
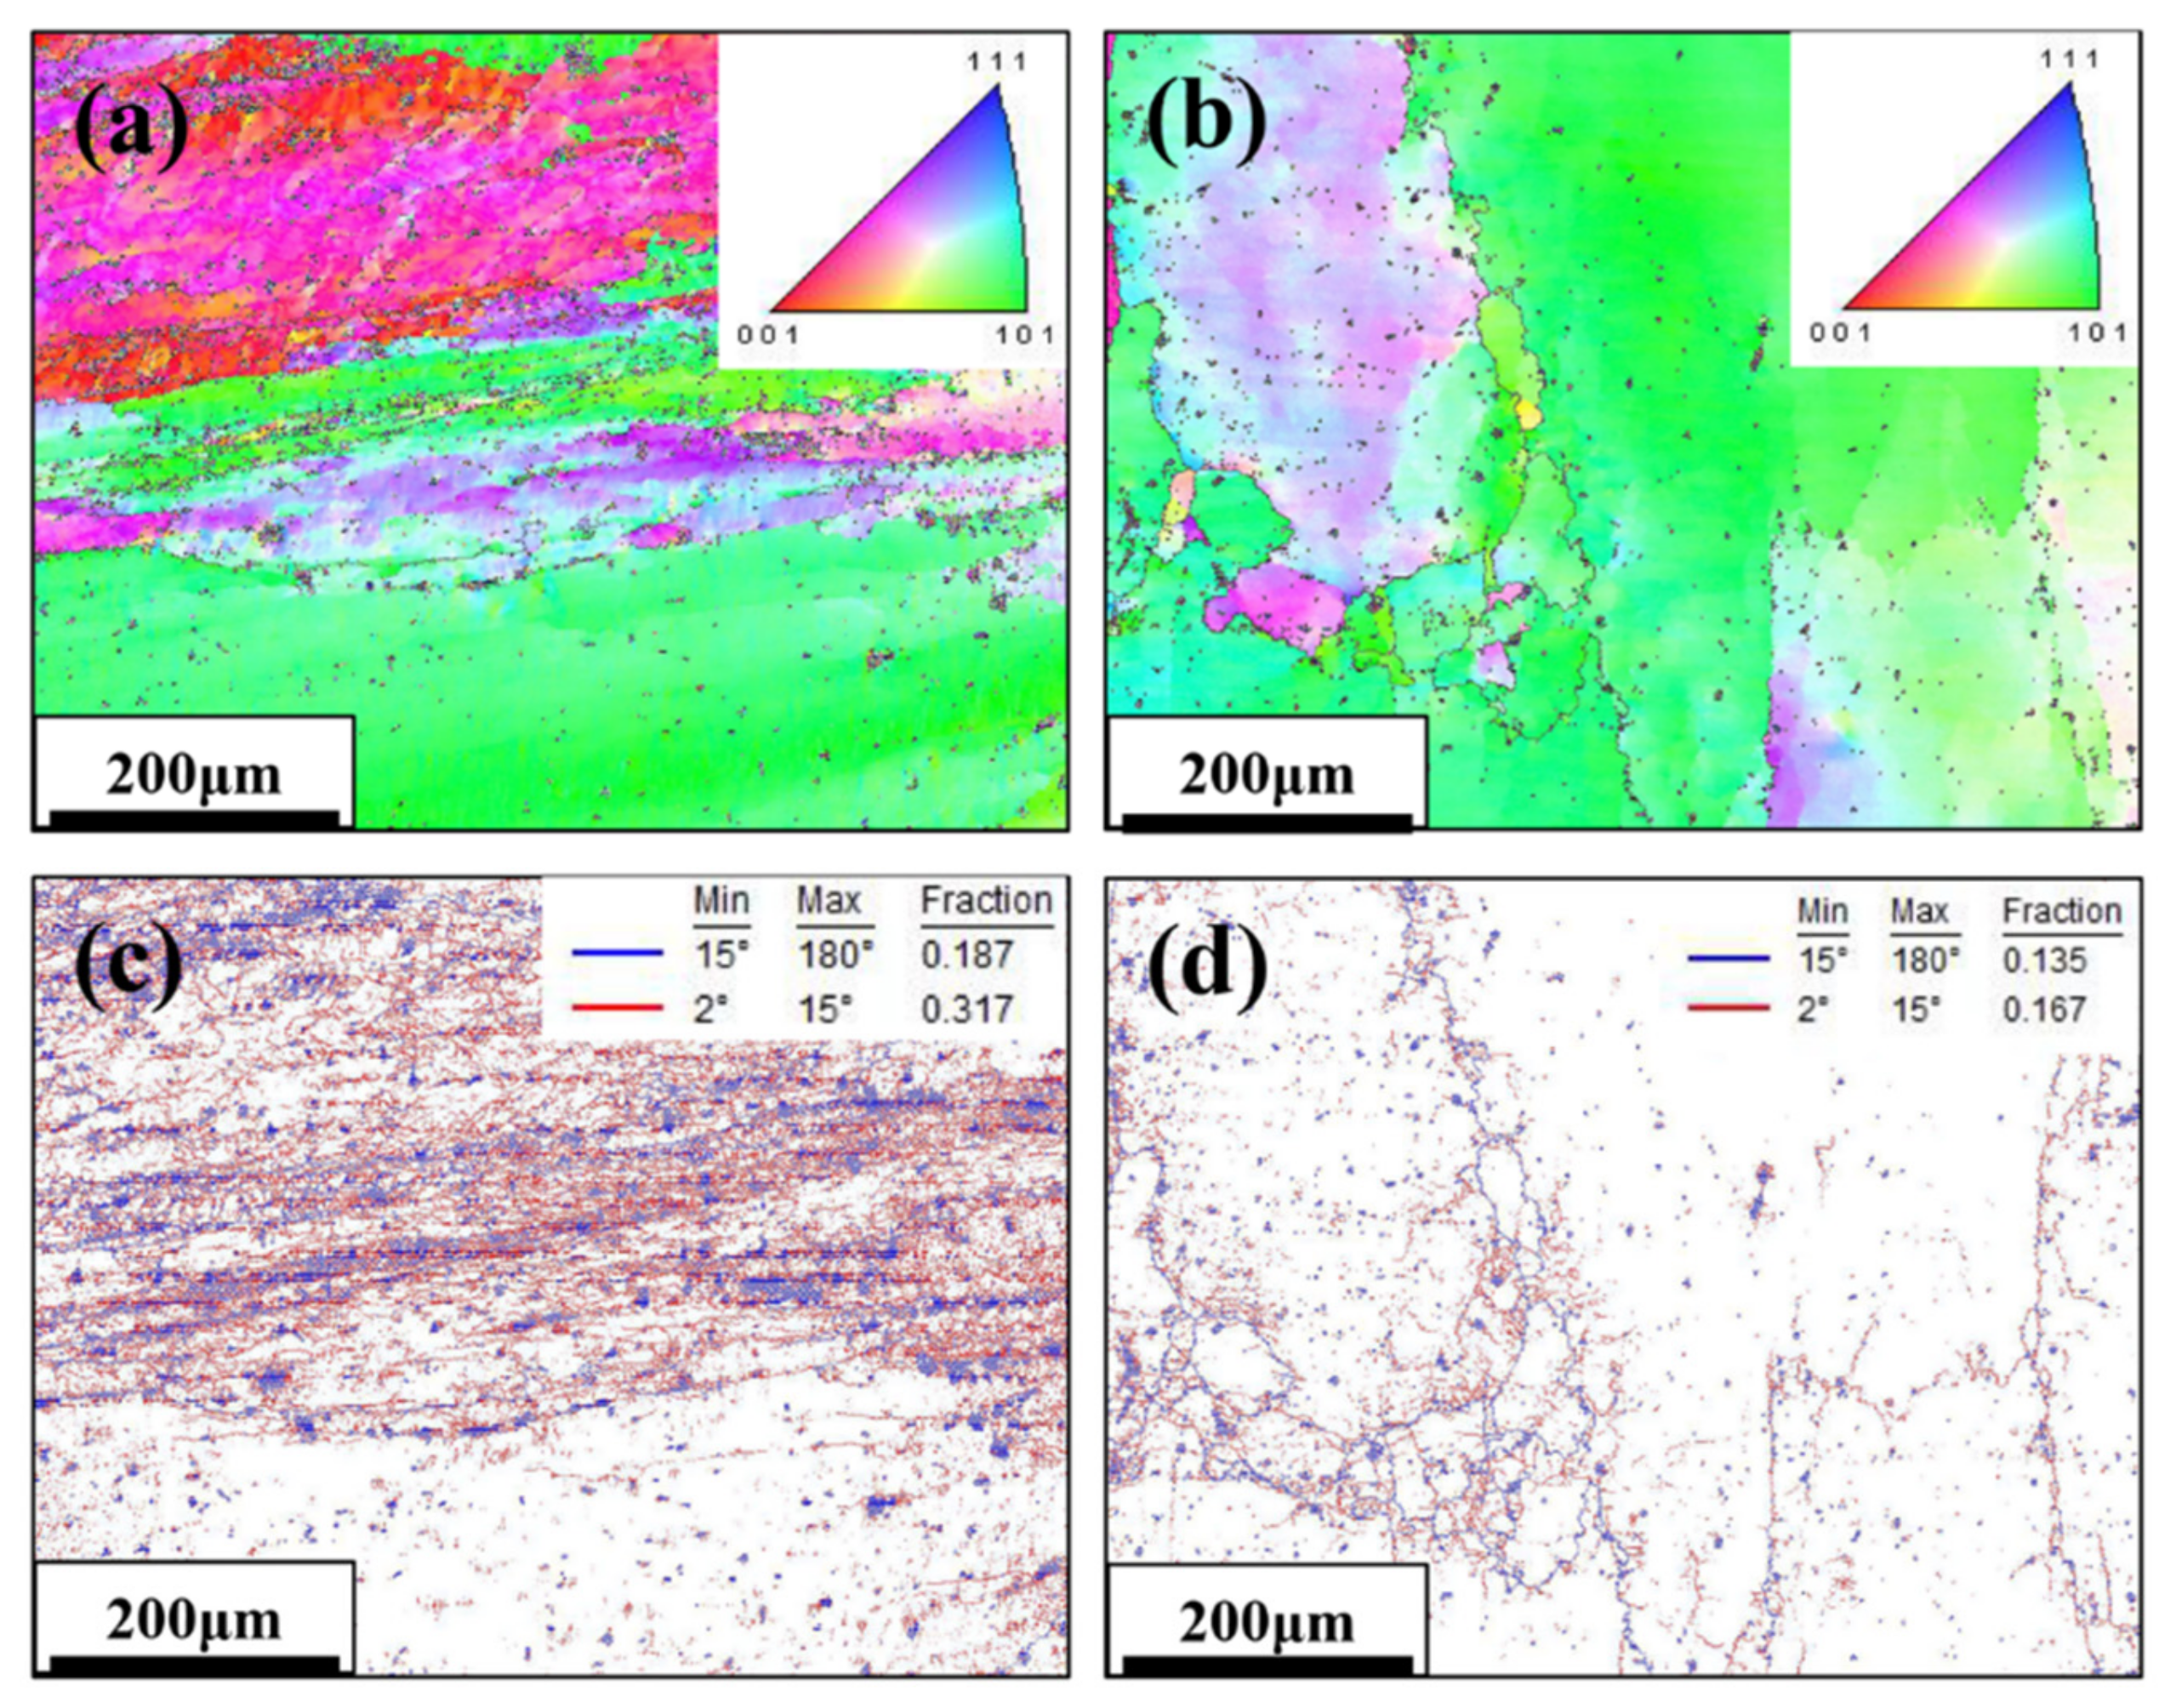
3.1. Microstructure of Hot Rolled Plates

Figure 1 shows the grain structure and the phase composition of the hot rolled plates. The degree of grain deformation of the 25 mm hot rolled plate is greater than that of the 65 mm plate. The same shifting trend can be observed in the experiments with the 120 mm hot rolled plate. The phase composition does not change significantly in the microstructure of the 25 mm and 65 mm plate compared with the 120 mm plate. The phenomenon that the Al7Cu2Fe phase distributes along the grain boundaries can be observed in the microstructure of the 25 mm and 65 mm plates, which is similar to the microstructure of the 120 mm plate.
Figure 2 presents the IPF and BC images of the 25 mm and 65 mm plates. As can be observed from Figure 2a,c, the grain orientation of the 25 mm plate can be divided into two categories. Grains with lower degrees of LAGBs tend to the orientation of [101] along the ND, and grains that have higher degrees of LAGBs tend to the orientation between [001] and [111]. It is obvious that the density of the LAGBs in the 65 mm plate (with the fraction 0.167) is significantly lower than that in the 25 mm (with the fraction 0.317) plate. The results indicate that with the increase of degrees of deformation, the density of the LAGBs increases rapidly. Meanwhile, the LAGBs always exist in the broken small grains and around grain boundaries. A similar discovery was discussed in previous experiments with the 120 mm plate.
To characterize texture types and orientation densities of the plates in different thicknesses, ODF maps are shown in Figure 3. In the 25 mm plate, the main textures are Brass {011} <211>, R {124} <211>, Cube {001} <100>, Copper {112} <111> and Goss {011} <100>. The Goss texture almost disappears in the 65 mm plate (Figure 3b) and disappears completely in the 120 mm plate (Figure 3c). Texture types change significantly when the thickness of the plate increases to 120 mm. The main textures in the 120 mm plate change from Brass, R to Cube, R-Cube. Meanwhile, the value of orientation density decreases dramatically. The texture types and orientation density of the plates are shown in Table 1.

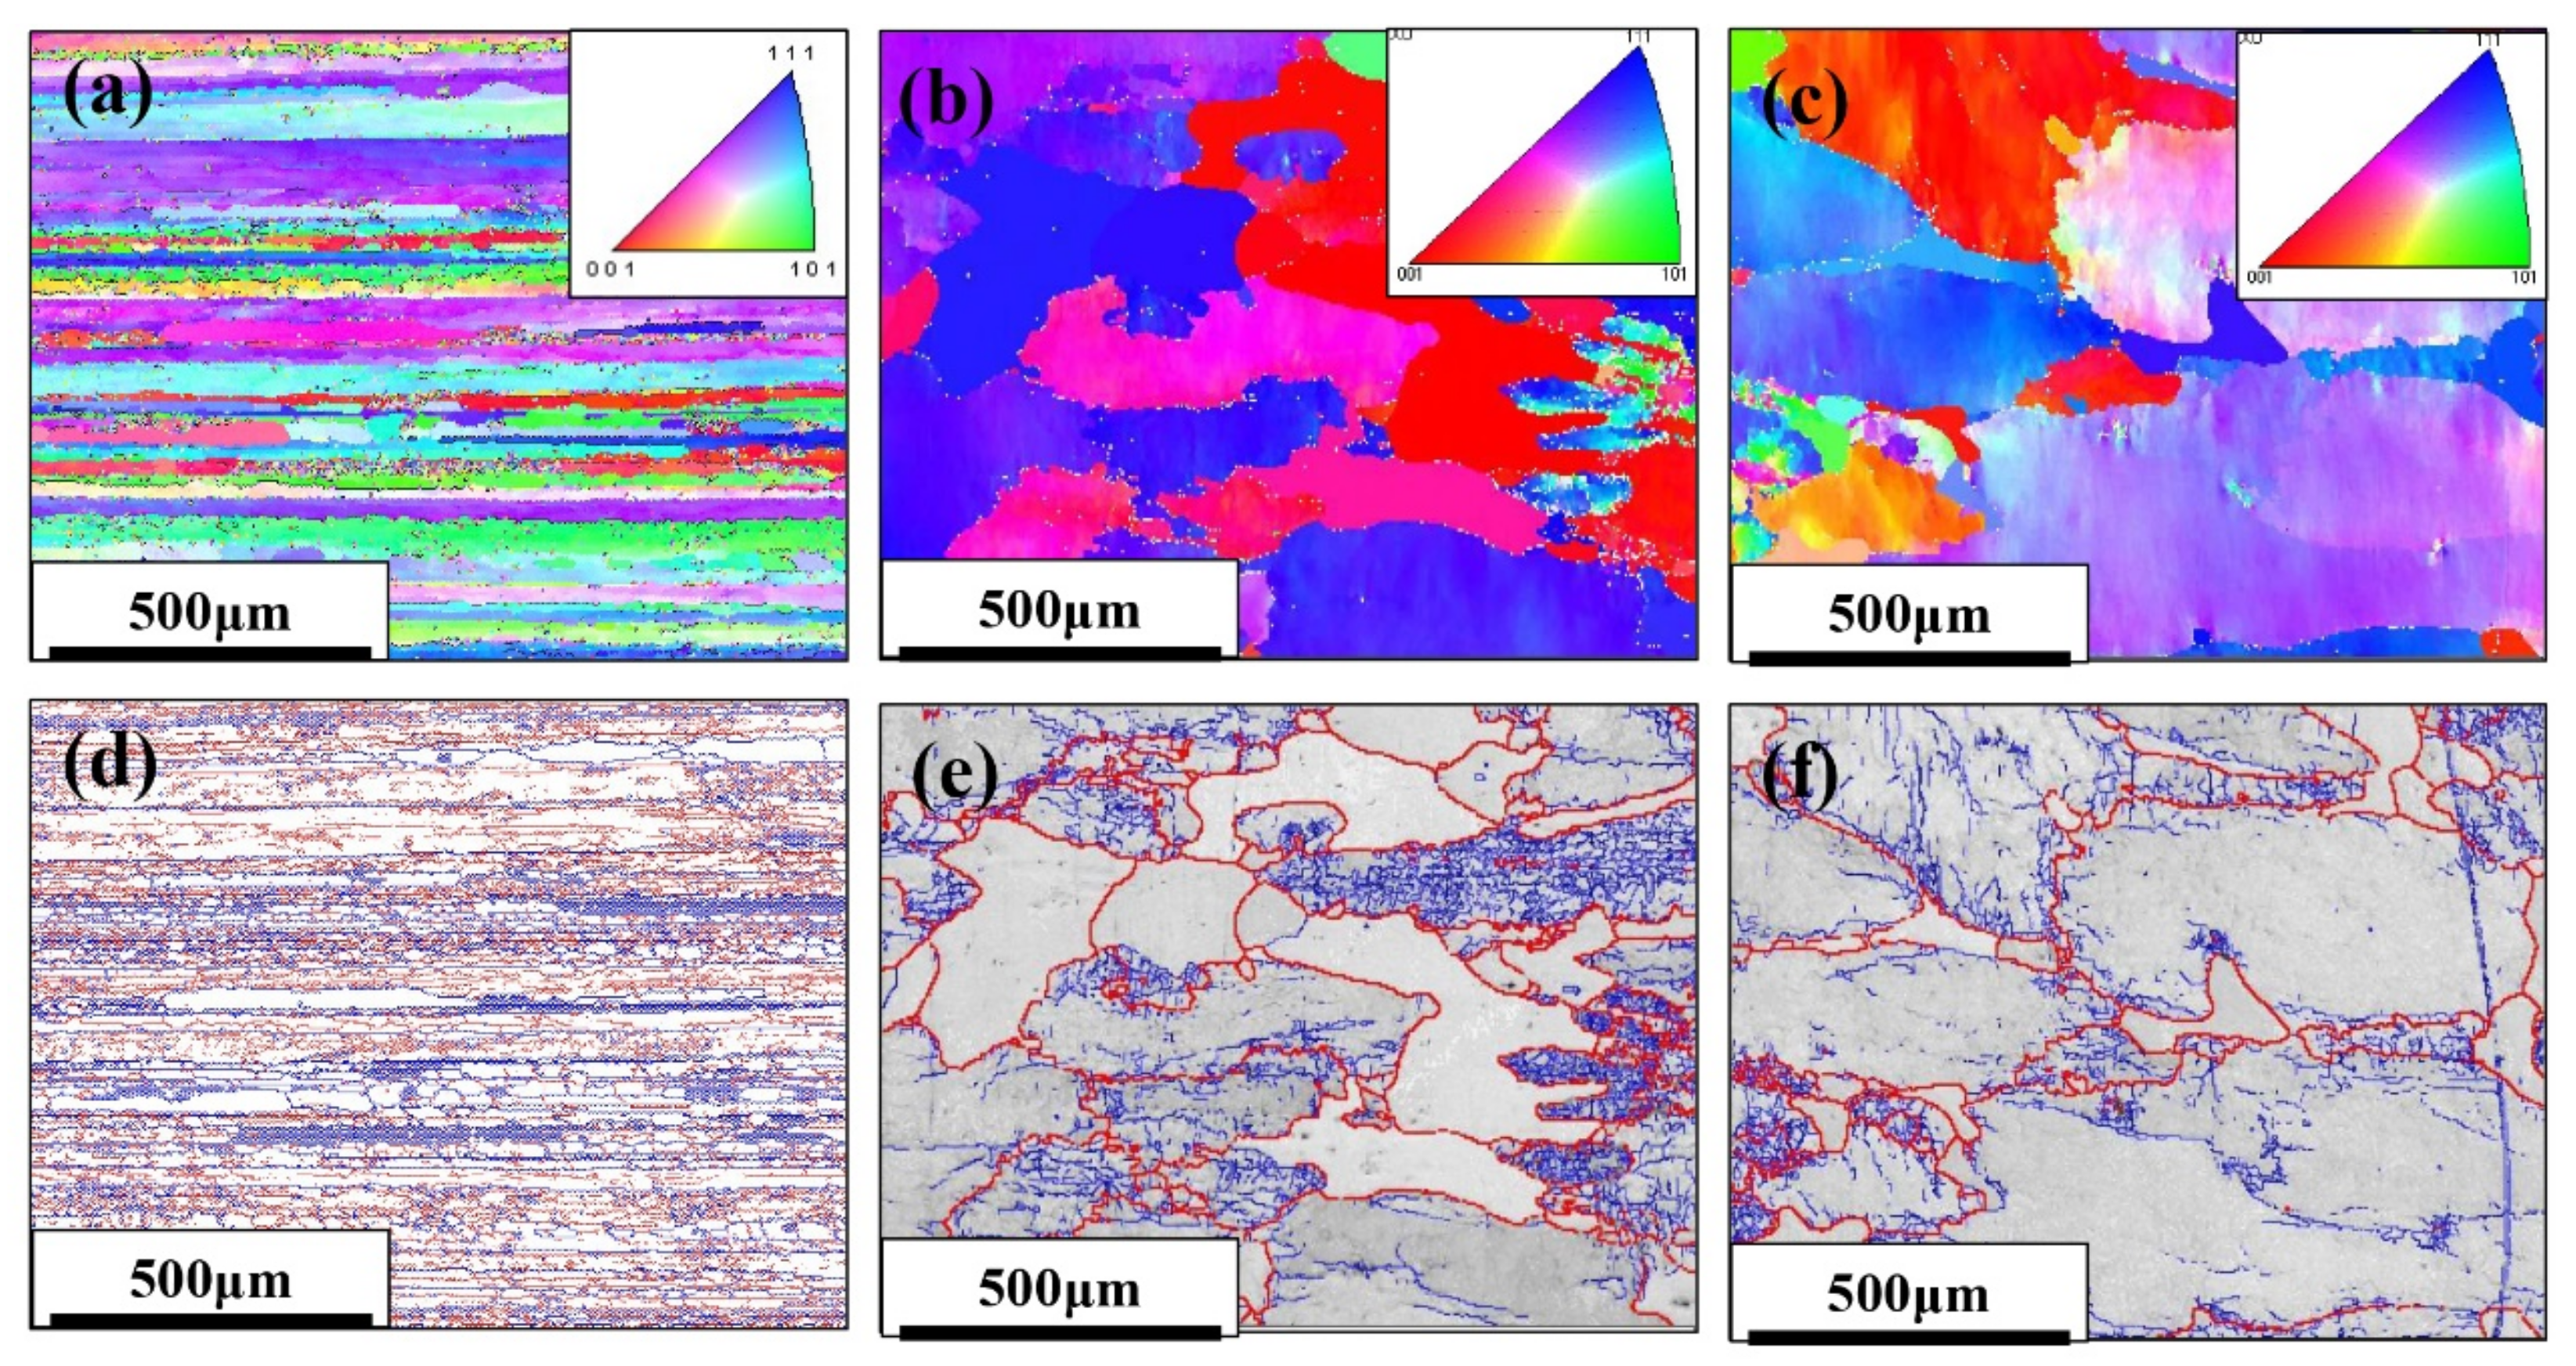
3.2. Microstructure of Hot Rolled Plates after Different Solution Time

Figure 4 presents SEM images of different plates after different solution times. It can be observed that the MgZn2 phase redissolves into the Al matrix partially after 30 min solution treatment, and the plate almost completes the re-dissolution process after 90 min solution treatment, as shown in Figure 4a,b (microstructure in the 25 mm plate) and Figure 4e,f (microstructure in the 120 mm plate). The MgZn2 phase almost redissolves into the matrix after 30 min solution treatment (as shown in Figure 4c,d) indicating that the re-dissolution process in the 65 mm plate is faster than in the other two plates. Compared with the re-dissolution speed of the 25 mm and 120 mm plates, the MgZn2 phase is difficult to dissolve in the 120 mm plate at the beginning of the solution.
Figure 5 shows IPF and BC images of the different plates after different solution times. As shown in Figure 5a,d, grain orientation changes acutely and is more complex compared with the microstructure in the hot rolled state for the 25 mm plate (Figure 2a). Most of the grains are in the process of recrystallization and a fraction of new recrystallized grains can be observed. The new recrystallized grains remain in the deformed structure. For the 65 mm plate (Figure 5b,e), the degree of recrystallization is lower than that of the 25 mm plate after the solution treatment. Simultaneously, grains that have already been recrystallized remain in the deformed structure. A similar phenomenon can be observed in the 120 mm plate (Figure 5c,f). The grain morphology of the 65 mm and 120 mm plates remains unchanged after the MgZn2 phase is basically dissolved; however, that of the 25 mm plate changes to a distinctly banded shape.
Figure 6 shows the ODF maps of the 25 mm plate after solution at 477 °C for different times. Compared with the texture before solution treatment (as shown in Figure 3a), texture types do not change significantly and the main discrepancy is orientation density. The main textures are as follows: high orientation density of Brass, R and low orientation density of Copper, Cube, Goss. In the re-dissolution process (0–90 min), the volume fraction of Brass texture decreases (the volume fraction changes from 44.0% to 41.1%). After the re-dissolution process, the volume fraction of Brass texture first increases (the volume fraction changes from 41.1% to 43.6%) and then decreases (the volume fraction changes from 43.6% to 39.7%).
As can be observed from Figure 7, texture types for the 65 mm plate do not change after solution treatment at different times which is the same as the 25 mm plate. The main texture is a high orientation density of Brass and a low orientation density of R, Cube, Copper. Goss texture does not occur during solution treatment, indicating that it is mainly controlled by the deformation process. The volume fraction of Brass texture decreases in the re-dissolution process (0–30 min), and the volume fraction changes from 60.3% to 54.3%. The same phenomenon that the volume fraction of Brass texture first increases (the volume fraction changes from 54.3% to 66.0%) and then decreases (the volume fraction changes from 66.0% to 62.4%) can be observed in the 65 mm plate as well.
The ODF results of the 120 mm plate are shown in Figure 8 to confirm the texture evolution after the solution treatment. The texture types change dramatically at the beginning of the solution treatment (as shown in Figure 3c and Figure 8a), which is contrary to other plates. R-Cube texture disappears and Brass, Copper, R texture appear after the solution treatment for 30 min. The texture types do not change but the orientation density has different changes with the extension of solution time. The volume fraction of Brass texture goes through a similar process of the 25 mm plate in the re-dissolution process (the volume fraction increases from 0 to 47.9% and then decreases to 41.5%). After the re-dissolution process, the volume fraction of Brass texture also goes through the comparable process like the trend in the re-dissolution process (the volume fraction transforms from 41.5% to 49.9% and then decreases to 49.6%). The evolution trends of other textures are discussed in Figure 9.
Figure 9 shows the curves of the orientation density after different solution times. The mean of the orientation density range is adopted as the nominal orientation density to draw the curves of the orientation density after treatment for different solution times. The orientation density of texture shows different trends for the three plates owing to their distinction in the initial texture and re-dissolution process. The solution process can be divided into the re-dissolution process and the process after re-dissolution.
For the 25 mm plate, as shown in Figure 9a, the orientation density of Goss texture basically remains the same in the whole process. In the re-dissolution process, the variation trend in the orientation density of Copper and Cube texture is similar to that for Brass texture. However, the orientation density of R texture exhibits the opposite trend compared with other textures. The orientation densities of Brass and R textures experience a slight increase and then decrease after re-dissolution, which is opposite to the trend of Cube and Copper.
As presented in Figure 9b, for the 65 mm plate, the orientation density of Copper remains low in the process of solution treatment. The orientation density of Cube and R fluctuates within a certain range and the value ranges from 6 to 10. The Brass texture is still the main texture in the 65 mm plate which is greatly affected by the solution time. In particular, the orientation density of Brass peaks after 210 min solution treatment (the orientation density is 29.36) and then decreases.
The orientation density of the 120 mm plate is shown in Figure 9c. The evolution of texture is different from other plates in the solution process. At the preliminary stage of solution, textures change extraordinarily in the first 30 min and then remain basically unchanged in the following 60 min. The evolution trend of Brass texture is similar to that of the 65 mm plate after the re-dissolution process. The orientation densities of Copper and Cube texture decrease while the orientation density of R texture remains unchanged, with the deepening of the solid solution process.
The IPF results of different hot rolled plates after different solution treatments are shown in Figure 10. The orientation of the 25 mm plate along the RD is mainly <112> (the orientation density is 6.54) and <001> (the orientation density ranges from 4.37 to 4.97), and the orientation along the TD is <111> (the orientation density ranges from 4.97 to 5.65). The orientation of the 65 mm plate is analogous to that of the 25 mm plate, as shown in Figure 10a,b. It is apparent from Figure 10c that the orientation of the 120 mm plate along the rolling direction is chiefly <111> (the value ranges from 4.81–5.47) and <001> (the value ranges from 4.23–4.81). However, the orientation along the TD is not obvious.

3.3. Properties of Hot Rolled Plates after Different Solution Times

To further analyze the re-dissolution process, conductivity was measured after different solution times, as presented in Figure 11. In the first 30 min, the conductivity value decreases rapidly, indicating that re-dissolution has occurred. In the following 60 min, the conductivity further decreases for the 25 mm and 120 mm plates; however, for the 65 mm plate, it remains approximately unchanged. With longer solution treatments, the conductivity does not change significantly.
Figure 12 shows the mechanical properties of the plates after solution and ageing treatment. For the 25 mm plate, the mechanical performance after 90 min solution treatment is distinctly better than that after 30 min treatment. The tensile strength is increased by about 90 MPa and the elongation after fracture is improved especially along the TD. The same tendency can be observed in the 120 mm plate: the tensile strength is increased by about 130 MPa which is more obvious than that for the 25 mm plate. As shown in Figure 9b, the orientation density of Brass rises to the maximum after 210 min solution treatment. Thus, the mechanical properties after 210 min treatment were tested for the 65 mm plate. The elongation after fracture of the 65 mm plate decreased rapidly under the 477 °C/210 min solution treatment compared with the treatment of 477 °C/30 min (the value changes from ~10.5 to ~1.5). Meanwhile, the tensile strength decreases by about 35 MPa.

4. Discussion

4.1. Analysis of the Potential Slip Systems in Theory during Tension

According to the results of IPF, as shown in Figure 10, the slip systems of different plates can be calculated under the method of Schmidt’s law [29]. Schmidt’s law can be estimated by:
τ = σ cos α cos β = σ μ ,
where τ is the sheer stress, σ is the normal stress, α is the angle between the direction of σ and slip, β is the angle between the direction of σ and the normal direction of the slip surface and µ is the Schmid factor. For FCC metals, there are four equivalent slip planes and three equivalent slip directions. The value of µ changes greatly along different directions in different plates. The orientation and density along RD and TD of different plates are shown in Table 2. The activated slip systems are dependent on the stretching orientations. When the direction of extrusion is <112>, the confirmed slip system should be the one with the largest μ value. The slip systems and the value of µ are shown in Table 3. On account of the [111] orientation being perpendicular to the slip directions, the slip systems start with difficulty and the value of µ is 0. At the beginning of the stretch process, the slip systems of grains with the orientation of [112] and [001] start first and other slip systems start in the subsequent plastic deformation process. The orientation and densities are different in different plates along RD and TD, and the average value of µ ( µ ¯ ) can be calculated to reflect the mechanical behavior of the plates. In the process of calculation, only the main orientations are considered. The values of µ ¯ in the plates with different thicknesses are shown in Table 4. In general, the value of µ is inversely proportional to the yield strength [30]. Thus, the yield strength along the RD is smaller than that along the TD for the 25 mm and 65 mm plates. For the 120 mm plate, the yield strength along the RD and TD has a great difference on account of the inconspicuous fiber texture along the TD (Figure 10c). Owing to the value of µ being related to the value of M (the Taylor factor), the analysis of the value of the µ ¯ is the basis to analyze the theoretical yield strength in the following discussion in Section 4.3.

4.2. Influence of Different Solution Times on the Texture Evolution and Mechanical Properties

For the hot rolled plates, textures play a significant role in their mechanical anisotropy, and the different evolution of textures during solution treatment affects the mechanical properties dissimilarly [26,27]. According to the results above, the changes of textures in the plates are affected by two main factors: one is the initial textures of the plates, the other is the re-dissolution of the second phase.
For the 25 mm and 65 mm plate, the main texture is Brass {011} <211> and R {124} <211> with high orientation density due to the influence of deformation. However, the texture in the 120 mm plate is not obvious since the degree of deformation is not high, and the main texture is R-Cube {001} <110> and Cube {001} <100> (Figure 3). Different trends are shown at the beginning of the solution process for the different initial textures. It can be observed that no matter what the initial textures are, textures change to the combination of Brass, R, Cube and Copper {112} <111> after solution treatments (Figure 5, Figure 6 and Figure 7). According to the analysis above, with the increase of deformation degrees, textures change to Brass, R, Cube and Copper which is the same trend caused by static recrystallization. In the solution process, the force from static recrystallization makes the texture evolution occur and develop rapidly in 30 min. To sum up, with the increase of deformation and static recrystallization, texture types change from Cube, R-Cube to Brass, R, Cube and Copper during the re-dissolution process. Meanwhile, the evolution of texture occurs simultaneously in the process of re-dissolution. However, it is difficult to identify the relationship between re-dissolution and texture evolution.
After the re-dissolution process is completed, similar trends can be observed in the three plates, namely, that the orientation density of Brass texture first increases and then decreases. As shown in Figure 12, the elongation after fracture of the 65 mm plate decreases rapidly because the orientation density of Brass texture increases greatly, which is seldom reported by other researchers. According to the analysis in Section 4.1, in the process of tensile experiments, the Schmid factor (µ) is related to the mechanical properties [29]. According to previous research, the Schmid factor of the Brass texture along the TD is larger than that along the RD. Generally speaking, the yield strength is inversely proportional to the Schmid factor [30]. Therefore, the value of yield strength is smaller along the TD. The slip systems are difficult to operate as the orientation density of Brass texture rises to a specific level, so that the elongation after fracture decreases sharply. As a result, there is almost no theoretical foundation about the reason why the high orientation density of Brass leads to the sharp decrease in the elongation in the previous studies. Thus, in order to improve the mechanical properties of the plates, the solution time should be selected as the moment when the microstructure has just completed the re-dissolution process. When the solution time is too long, the elongation decreases greatly on account of the orientation density of Brass increases.

4.3. Influence of Re-Dissolution and Recrystallization

In general, the second phases in the hot rolled plate are mainly MgZn2 and Al7Cu2Fe, as shown in Figure 1. As the deformation increases, the Al7Cu2Fe phase is separated and does not distribute along grain boundaries. The re-dissolution of the second phase exhibits different trends as the deformation increases as well. For the 25 mm and 120 mm plates, the rate of re-dissolution is slower than that of the 65 mm plate, as can be observed in Figure 4. The same conclusion can be obtained from the conductivity results, which confirm the accuracy of the re-dissolution process. The degree of lattice distortion of the Al matrix is the main factor that affects the conductivity in the re-dissolution process [31]. At the beginning of the re-dissolution process (0–30 min), a large amount of MgZn2 phases dissolve into the matrix, which causes an increase in the degree of lattice distortion. The increase in lattice distortion leads to the scattering of the electrons during conduction which causes the conductivity to decrease rapidly. In the following 60 min (30–90 min), the conductivity decreases in the 25 mm and 120 mm plate and remains unchanged in the 65 mm plate, indicating that the MgZn2 phase further dissolves in the 25 mm and 120 mm plate. The existence of the MgZn2 phase affects the mechanical properties, as presented in Figure 12. The analyses above indicate that to obtain better mechanical properties, the first step is to make sure that the re-dissolution process is mainly completed.
After the re-dissolution process is completed, different plates exhibit different degrees of recrystallization. The theoretical yield strength can be described as [32]:
σ 0.2 = σ 0 + σ ss + σ g s + σ d   ,
where σ0 represents the yield strength of pure Al matrix, σss is the strength affected by the solid solution, σgs is the strengthening effect of grain boundaries and σd is the strength affected by the dislocation density. In addition to the above four factors, the strength affected by age hardening is also an important factor for all solution-treated and aged Al-Zn-Mg-Cu alloys. However, since the aging treatment is unchanged in this study, the effect caused by age hardening in this study is considered to be similar.
For the plates analyzed in the experiment, σ0 is a constant value. σss can be expressed as [32]:
σ ss = M ( τ 1 3 2 + τ 2 3 2 + τ 3 3 2 + ) 2 3   ,
where M represents the Taylor factor and τ represents the strength contribution caused by the solute atoms. The value of τ is affected by many factors, such as temperature, the concentration of the solute elements, the strain rate and the energy barrier to overcome dislocation motion. In general, the energy to overcome dislocation motion decreases as deformation increases. Meanwhile, the value of σss is positively correlated with the value of the energy barrier. Thus, the τ value of the 25 mm plate is slightly smaller than that of the 65 mm and 120 mm plates. According to the plates tested, other factors above are approximate due to the second phase being mainly dissolved into the matrix; therefore, the main factors that affect the σss are the value of M and the energy barrier. The value of σgs can be estimated by the Hall–Petch formula (σgs = σ0 + kd−1/2). It is obvious that with the increase of thickness, grain sizes increase. The value of σd can be expressed as [33]:
σ d = α G M B ρ 1 2   ,
where α is a constant value, G is the shear modulus of aluminum, B is the Burgers vector, ρ is the dislocation density and M is the Taylor factor. On account of the plates having different degrees of deformation and recrystallization, the value of M, ρ is different. Grain boundaries can absorb dislocation and then the dislocation density decreases. Thus, the dislocation density decreases with the increase of the LAGBs percentage (ρ (25 mm) < ρ (65 mm) < ρ (120 mm)). Meanwhile, the effect of LAGBs should be considered and the formula is [34]:
Δ σ gb α 2 G B ( 1 f rex ) ( 1 δ ) ,
where frex represents the recrystallization fraction and δ represents the subcrystalline size.
In conclusion, different factors affect the yield strength to different degrees. When stretched along the RD, µ (25 mm) ≈ µ (65 mm) > µ (120 mm) as shown in Table 4. In general, the value of M is inversely proportional to the value of µ. Thus, M (25 mm) ≈ M (65 mm) < M (120 mm). For the value of σss, τ (25 mm) < τ (65 mm) < τ (120 mm), so σss (25 mm) < σss (65 mm) < σss (120 mm). For the value of σgs, σgs (25 mm) > σgs (65 mm) > σgs (120 mm). For the value of σd, σd (25 mm) < σd (65 mm) < σd (120 mm). The degree of recrystallization fraction and the subcrystalline size are smaller for the 25 mm plate, so Δσgb (25 mm) > Δσgb (65 mm) > Δσgb (120 mm). As shown in Figure 12, σ0.2 (25 mm) > σ0.2 (65 mm) > σ0.2 (120 mm); the mechanical results above indicate that the strengthening effect of grain boundaries (including LAGBs) plays more significant roles in the strengthening of σ0.2 than the effect of the solid atoms and dislocation density. Thus, decreasing the degree of recrystallization and grain growth (increasing the percentage of the grain boundaries and low-angle grain boundaries) are the main methods to improve the yield strength.
In this work, the evolution of textures, the degree of recrystallization and mechanical properties during the process of re-dissolution of different plates were discussed. The slip systems that may be actuated and the factors that affect the yield strength in different degrees of different plates were also analyzed. Meanwhile, the phenomenon that the high orientation density of Brass texture caused the elongation after fracture to decrease rapidly was seldom reported by other reviewers. This work will provide many ideas for other researchers. For example, in order to enhance the mechanical properties of the plates, the optimal solution time is the moment when the redissolution process is mainly completed. Considering the intrinsic influence of different strengthening methods, increasing the strengthening effects of the grain boundaries (including LAGBs) is an effective means to improve the mechanical properties. However, there are additional factors affecting the mechanical properties and formability. First, although the aging temperature is low in this study and textures are assumed unchanged in the aging treatment, texture changes may be influenced by the aging time. Meanwhile, different deformation may affect texture changes to different degrees during aging treatments. Secondly, since the plates investigated are all rather thick, localized thinning may not be a problem during processing. Therefore, in order to solve localized thinning problems, texture evolution trends for thin plates (thickness less than 6 mm) during solution and aging treatments need to be investigated in the future.

5. Conclusions

(1)
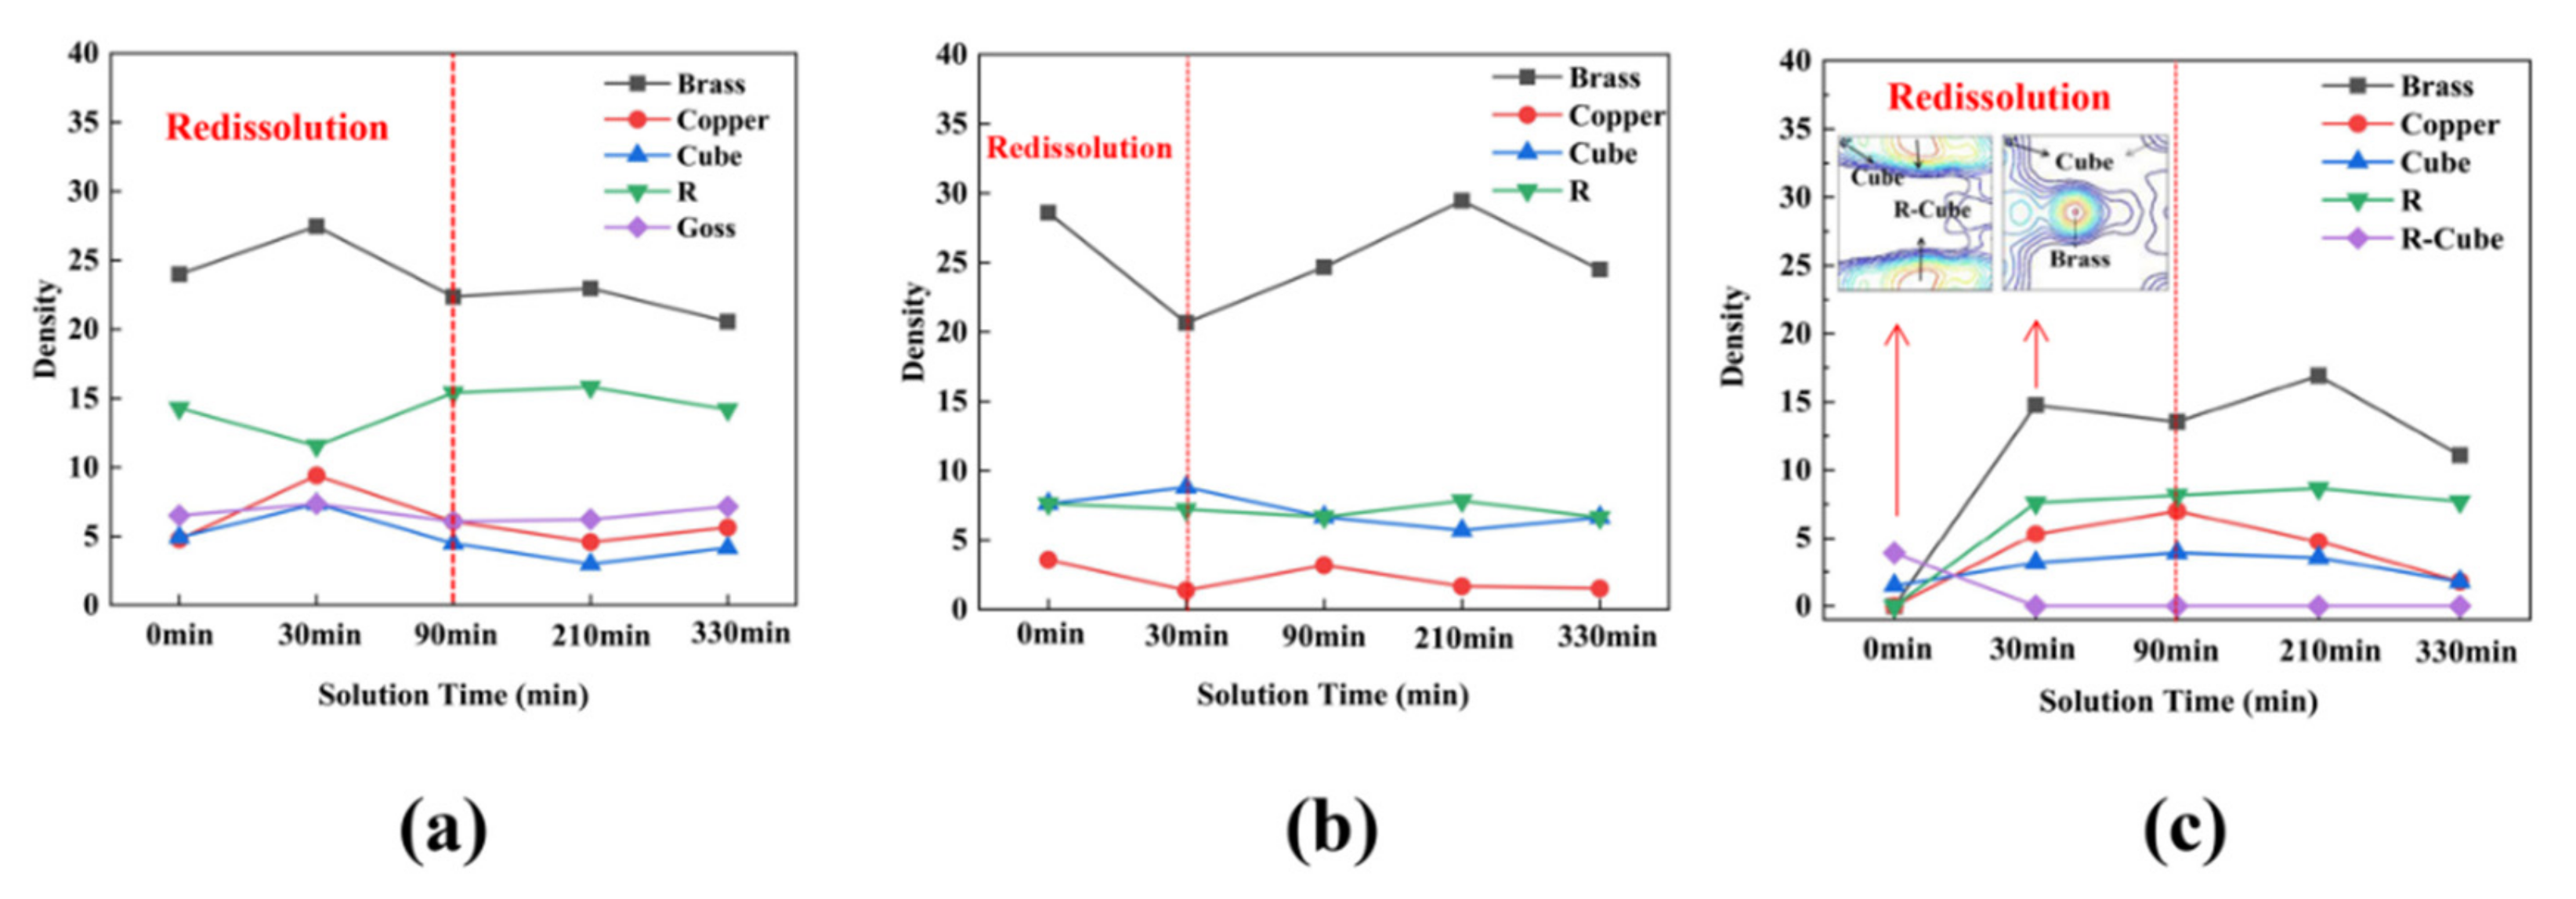
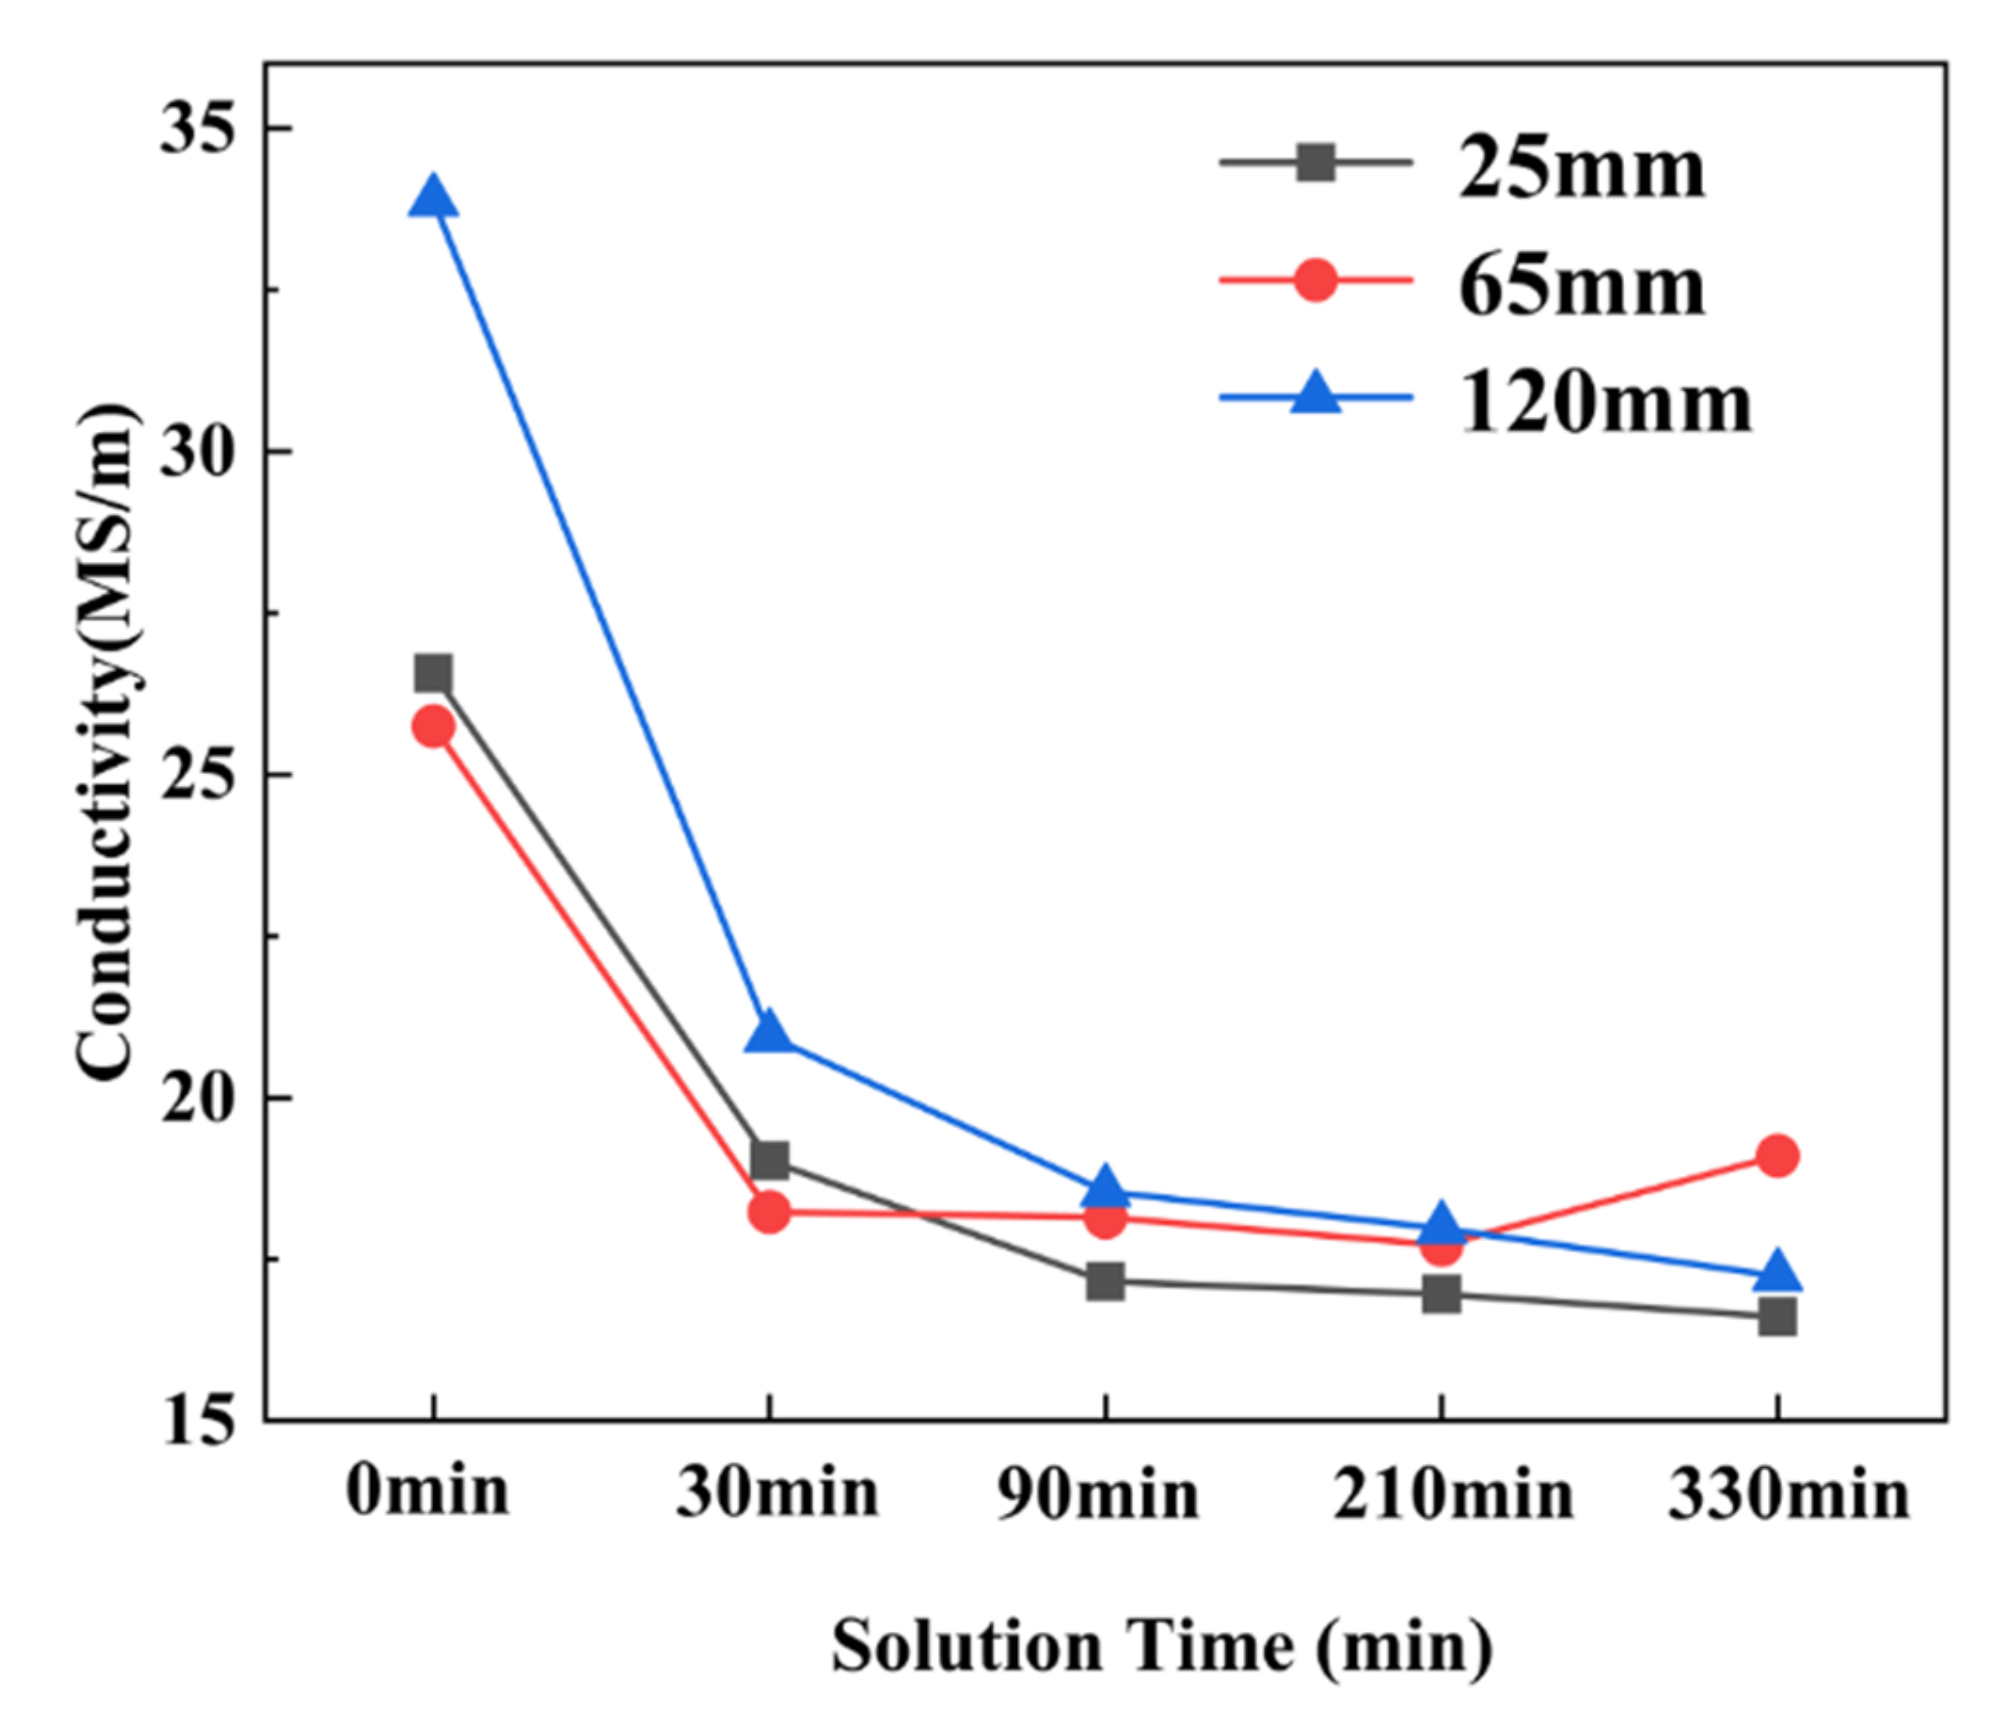
Different plates exhibit different processes of re-dissolution. For the 25 mm and 120 mm plates, the re-dissolution is almost completed in 90 min at 477 °C. However, the re-dissolution time of the 65 mm plates is shorter (30 min) compared with the other plates at the same temperature.
(2)
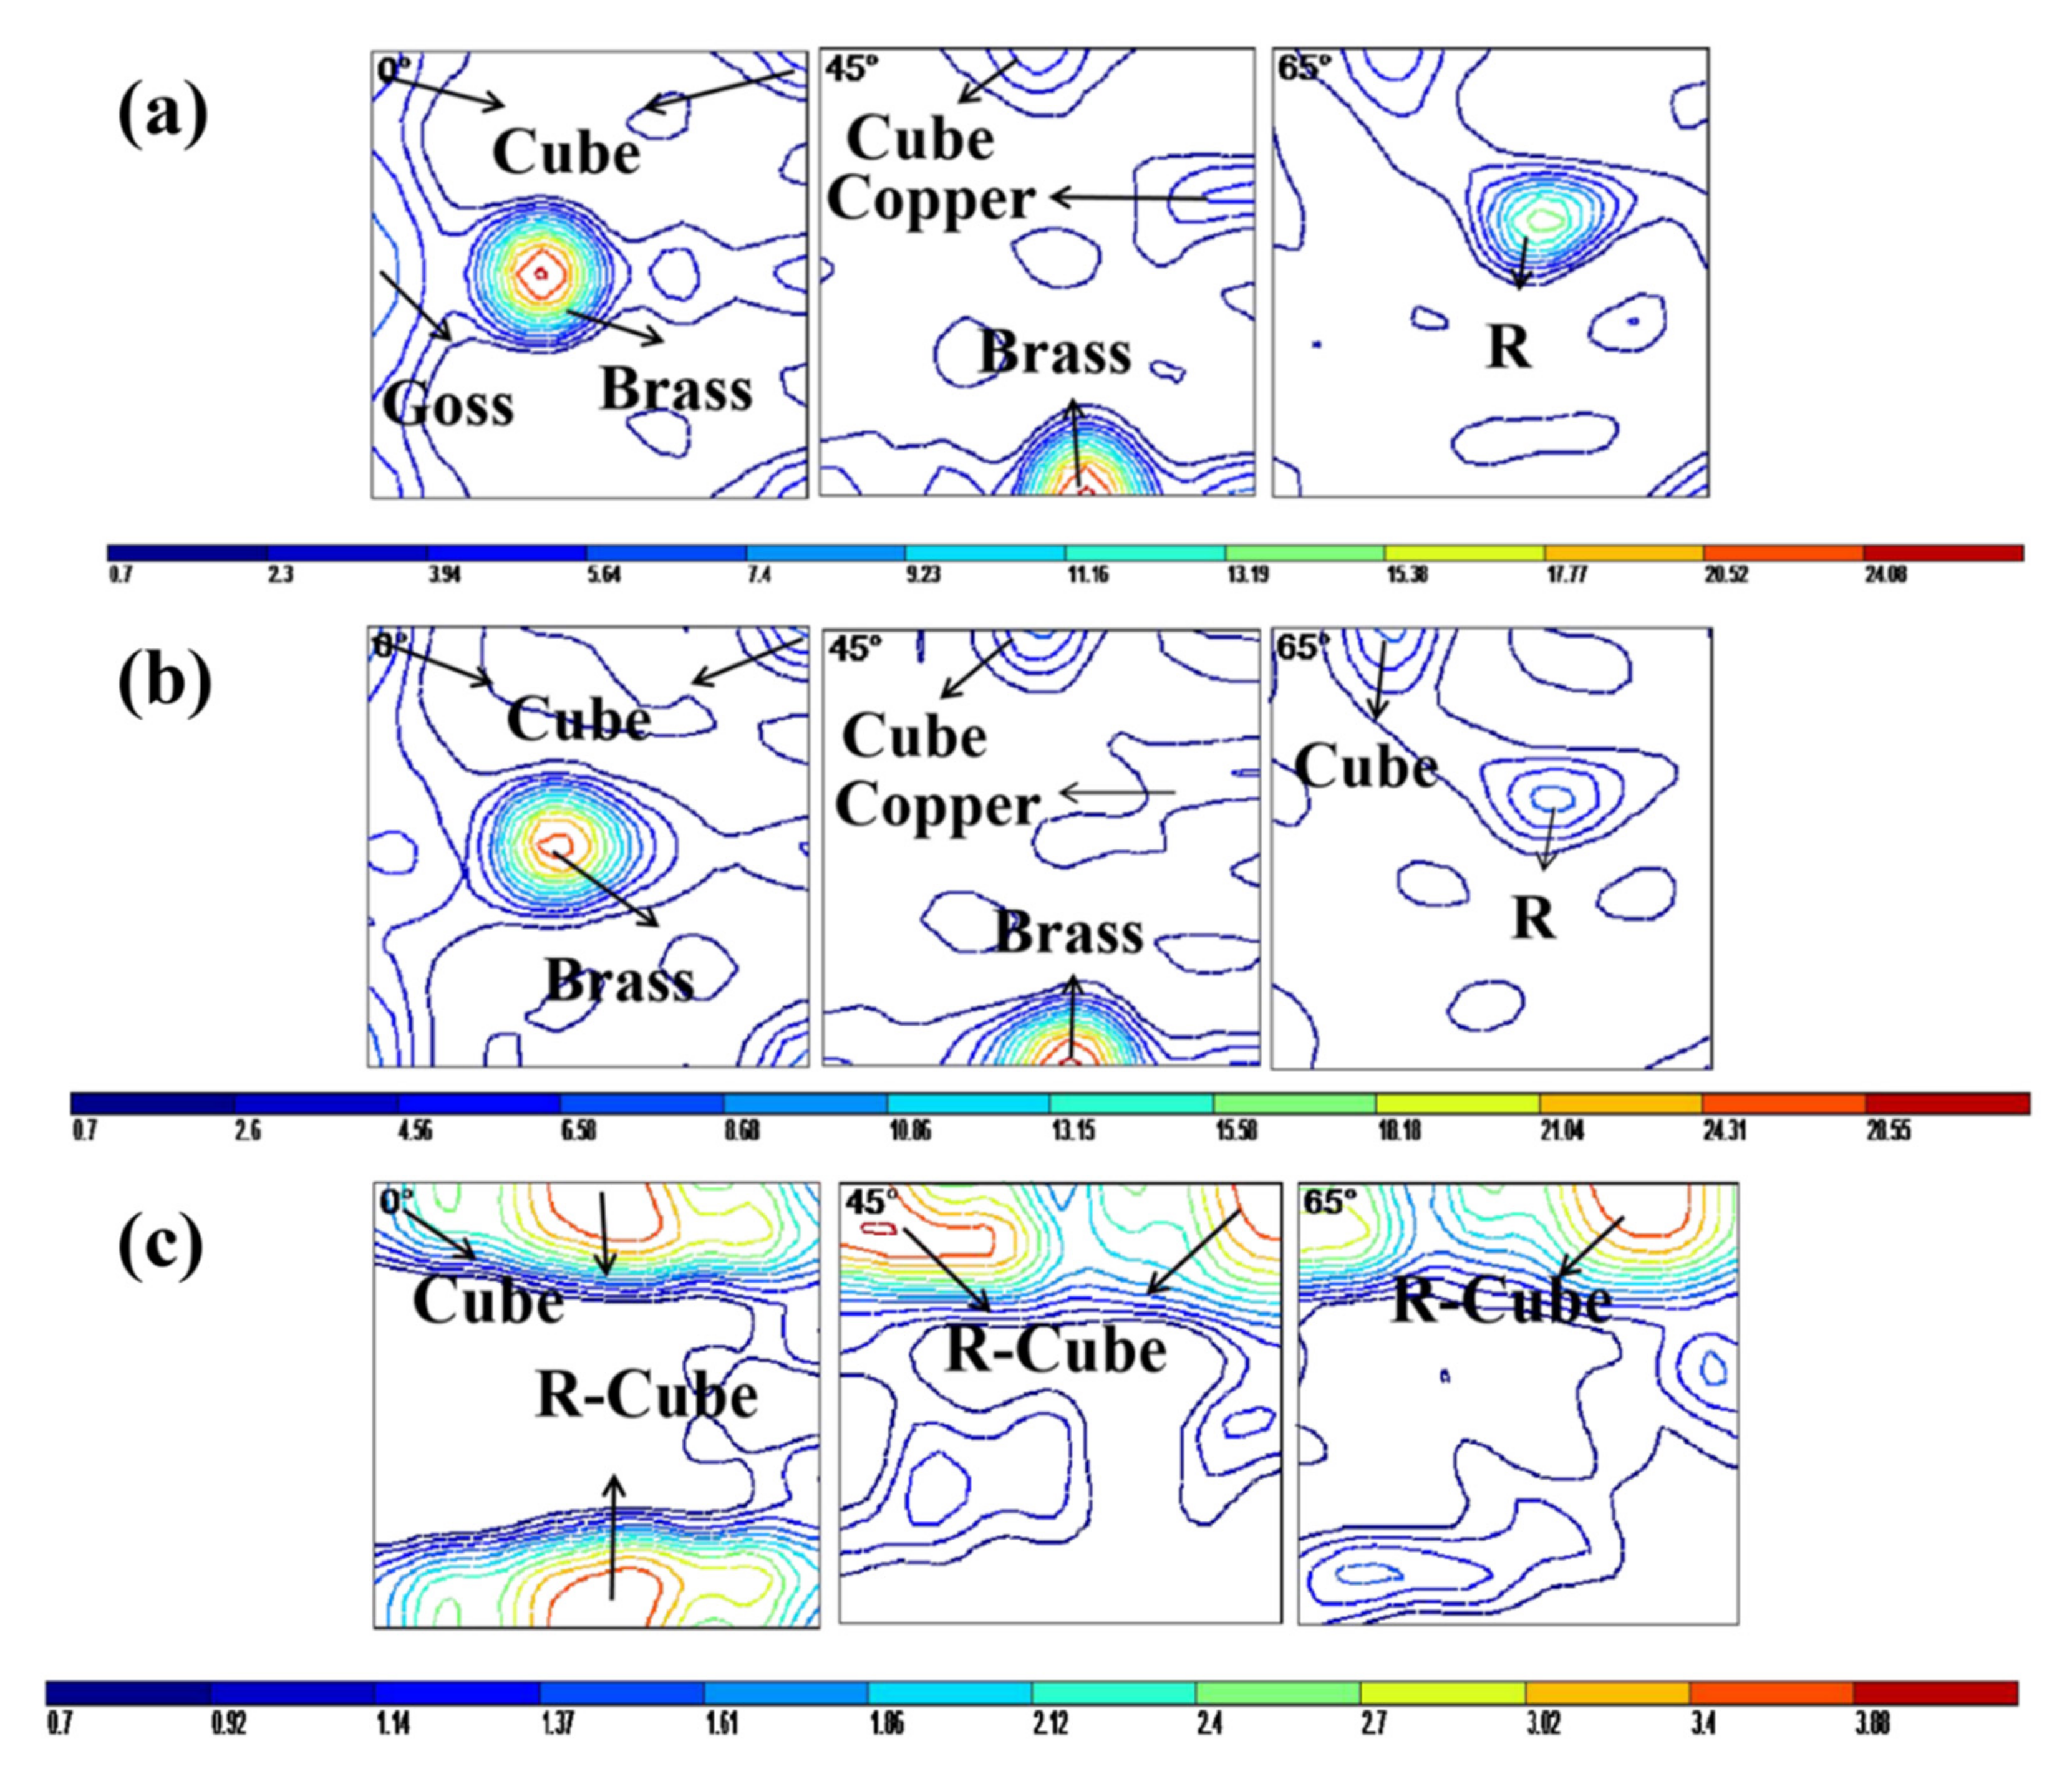
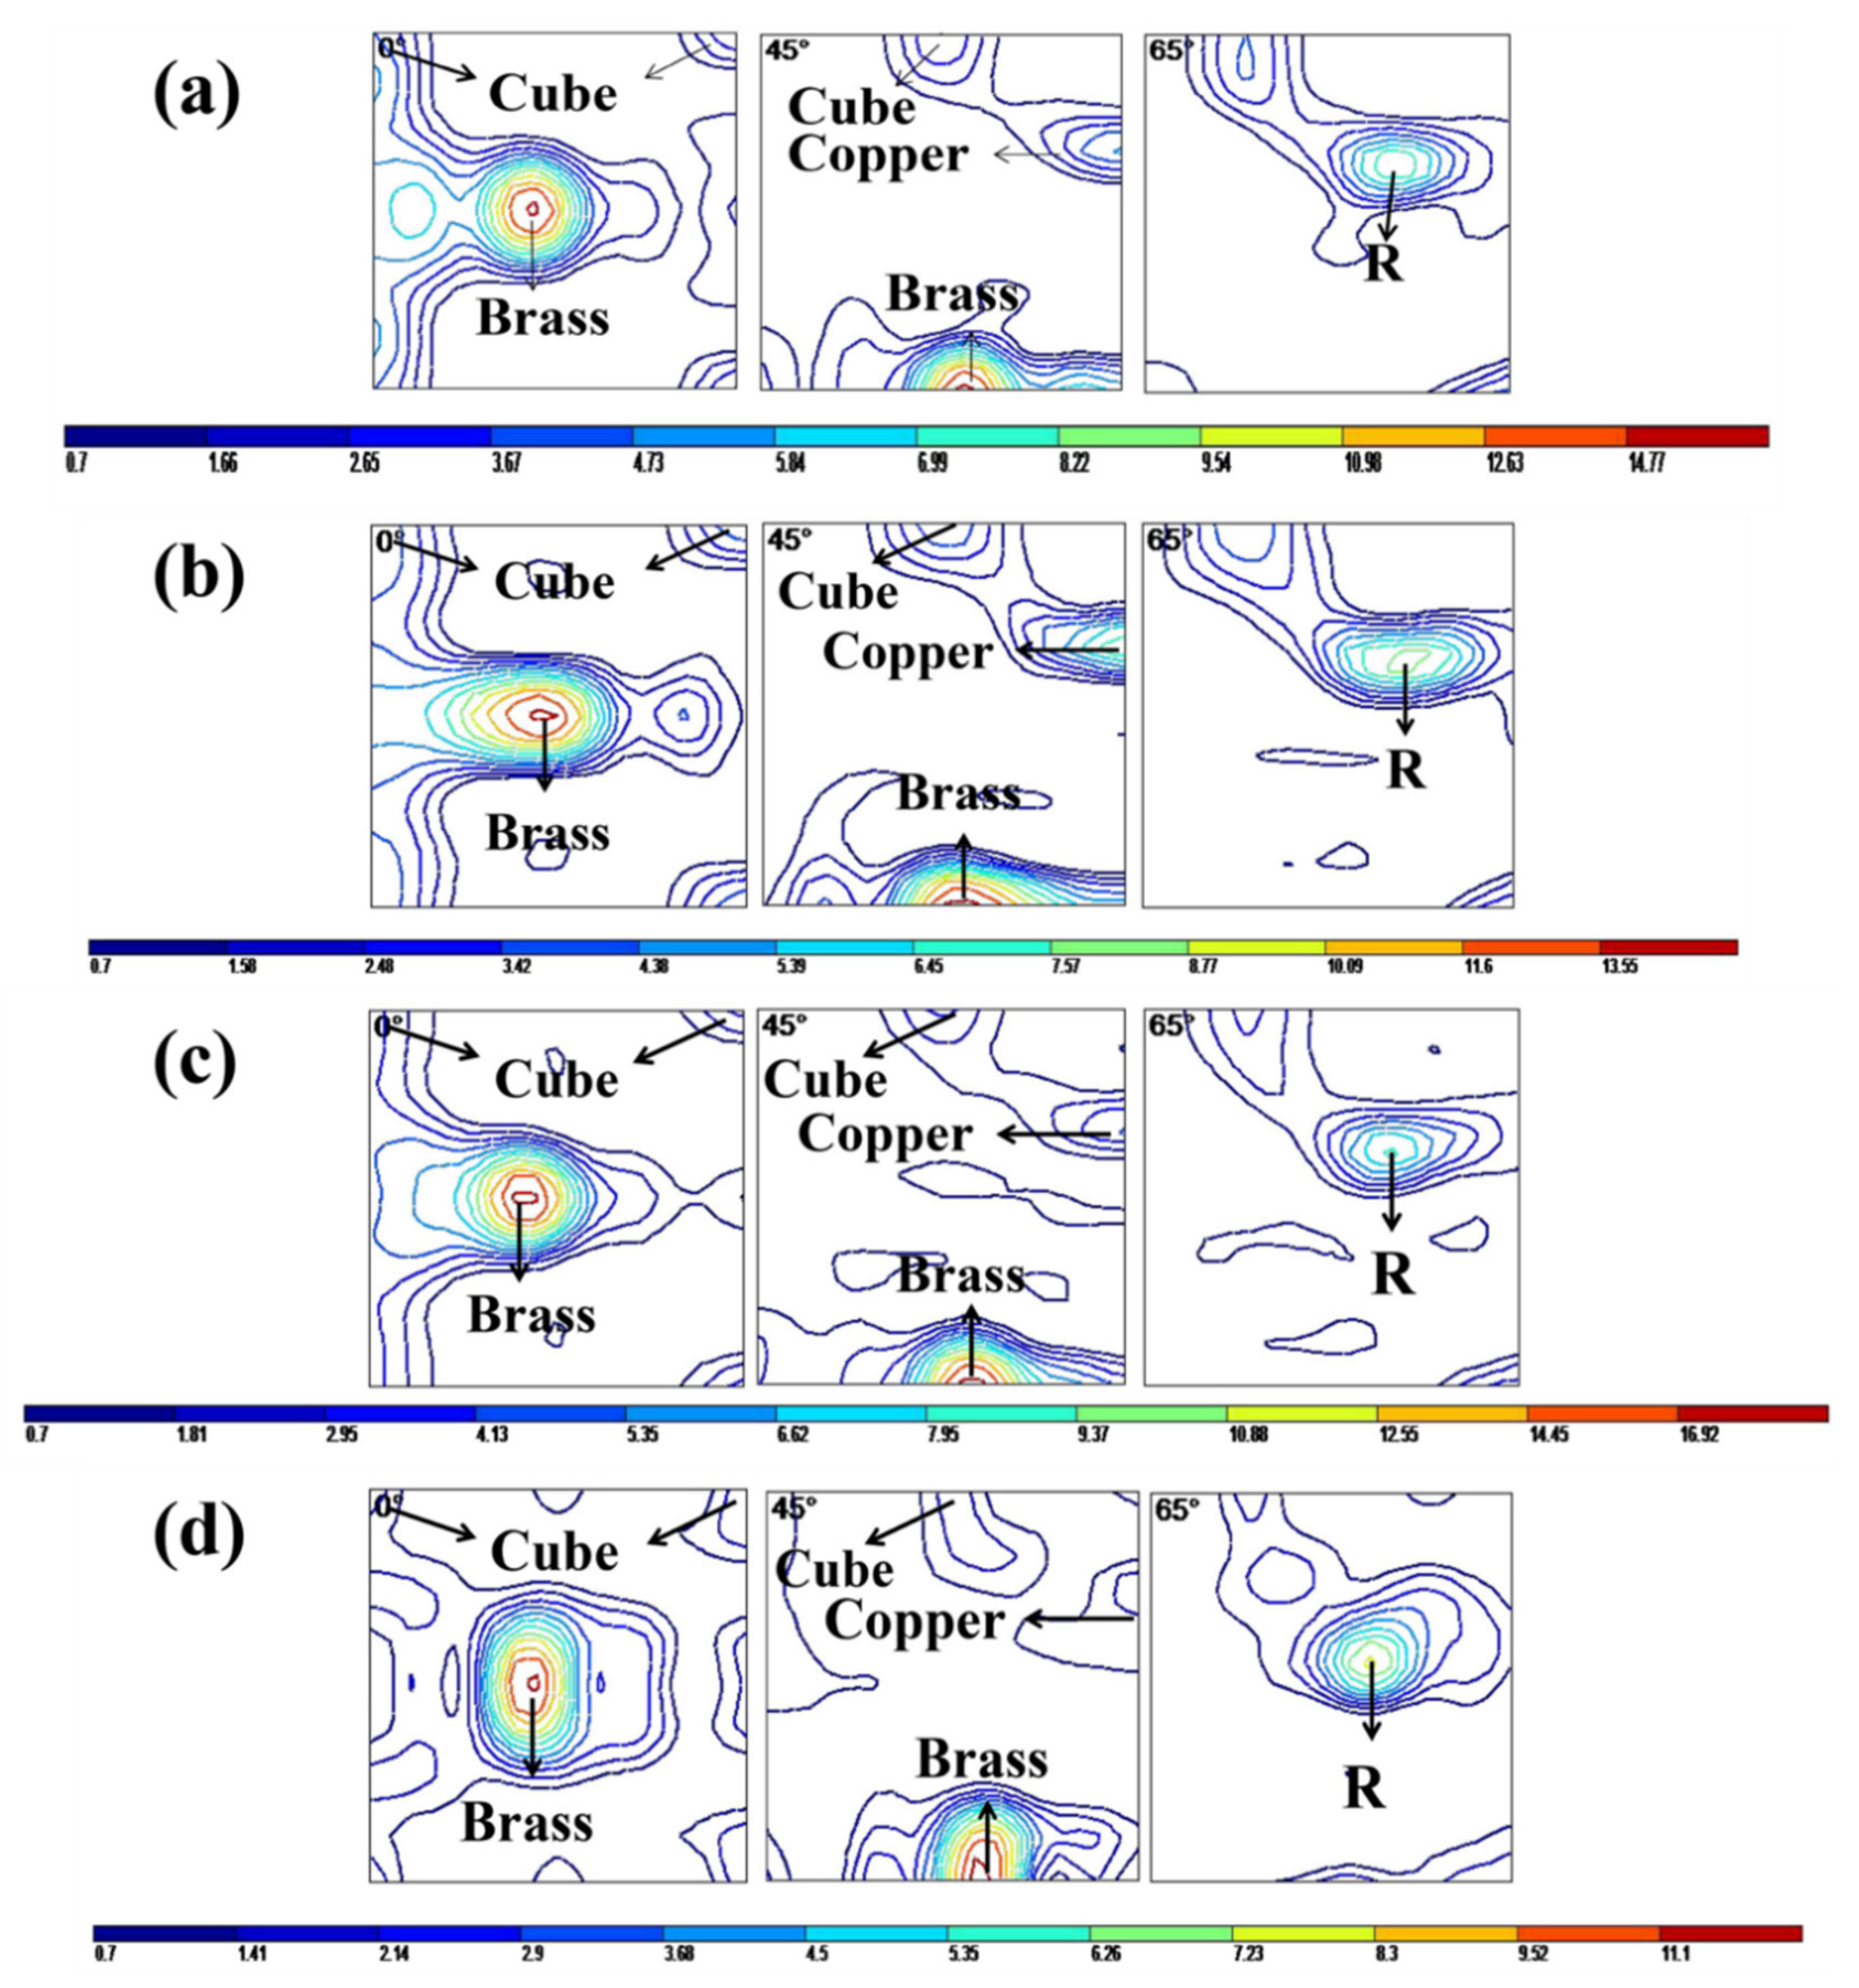
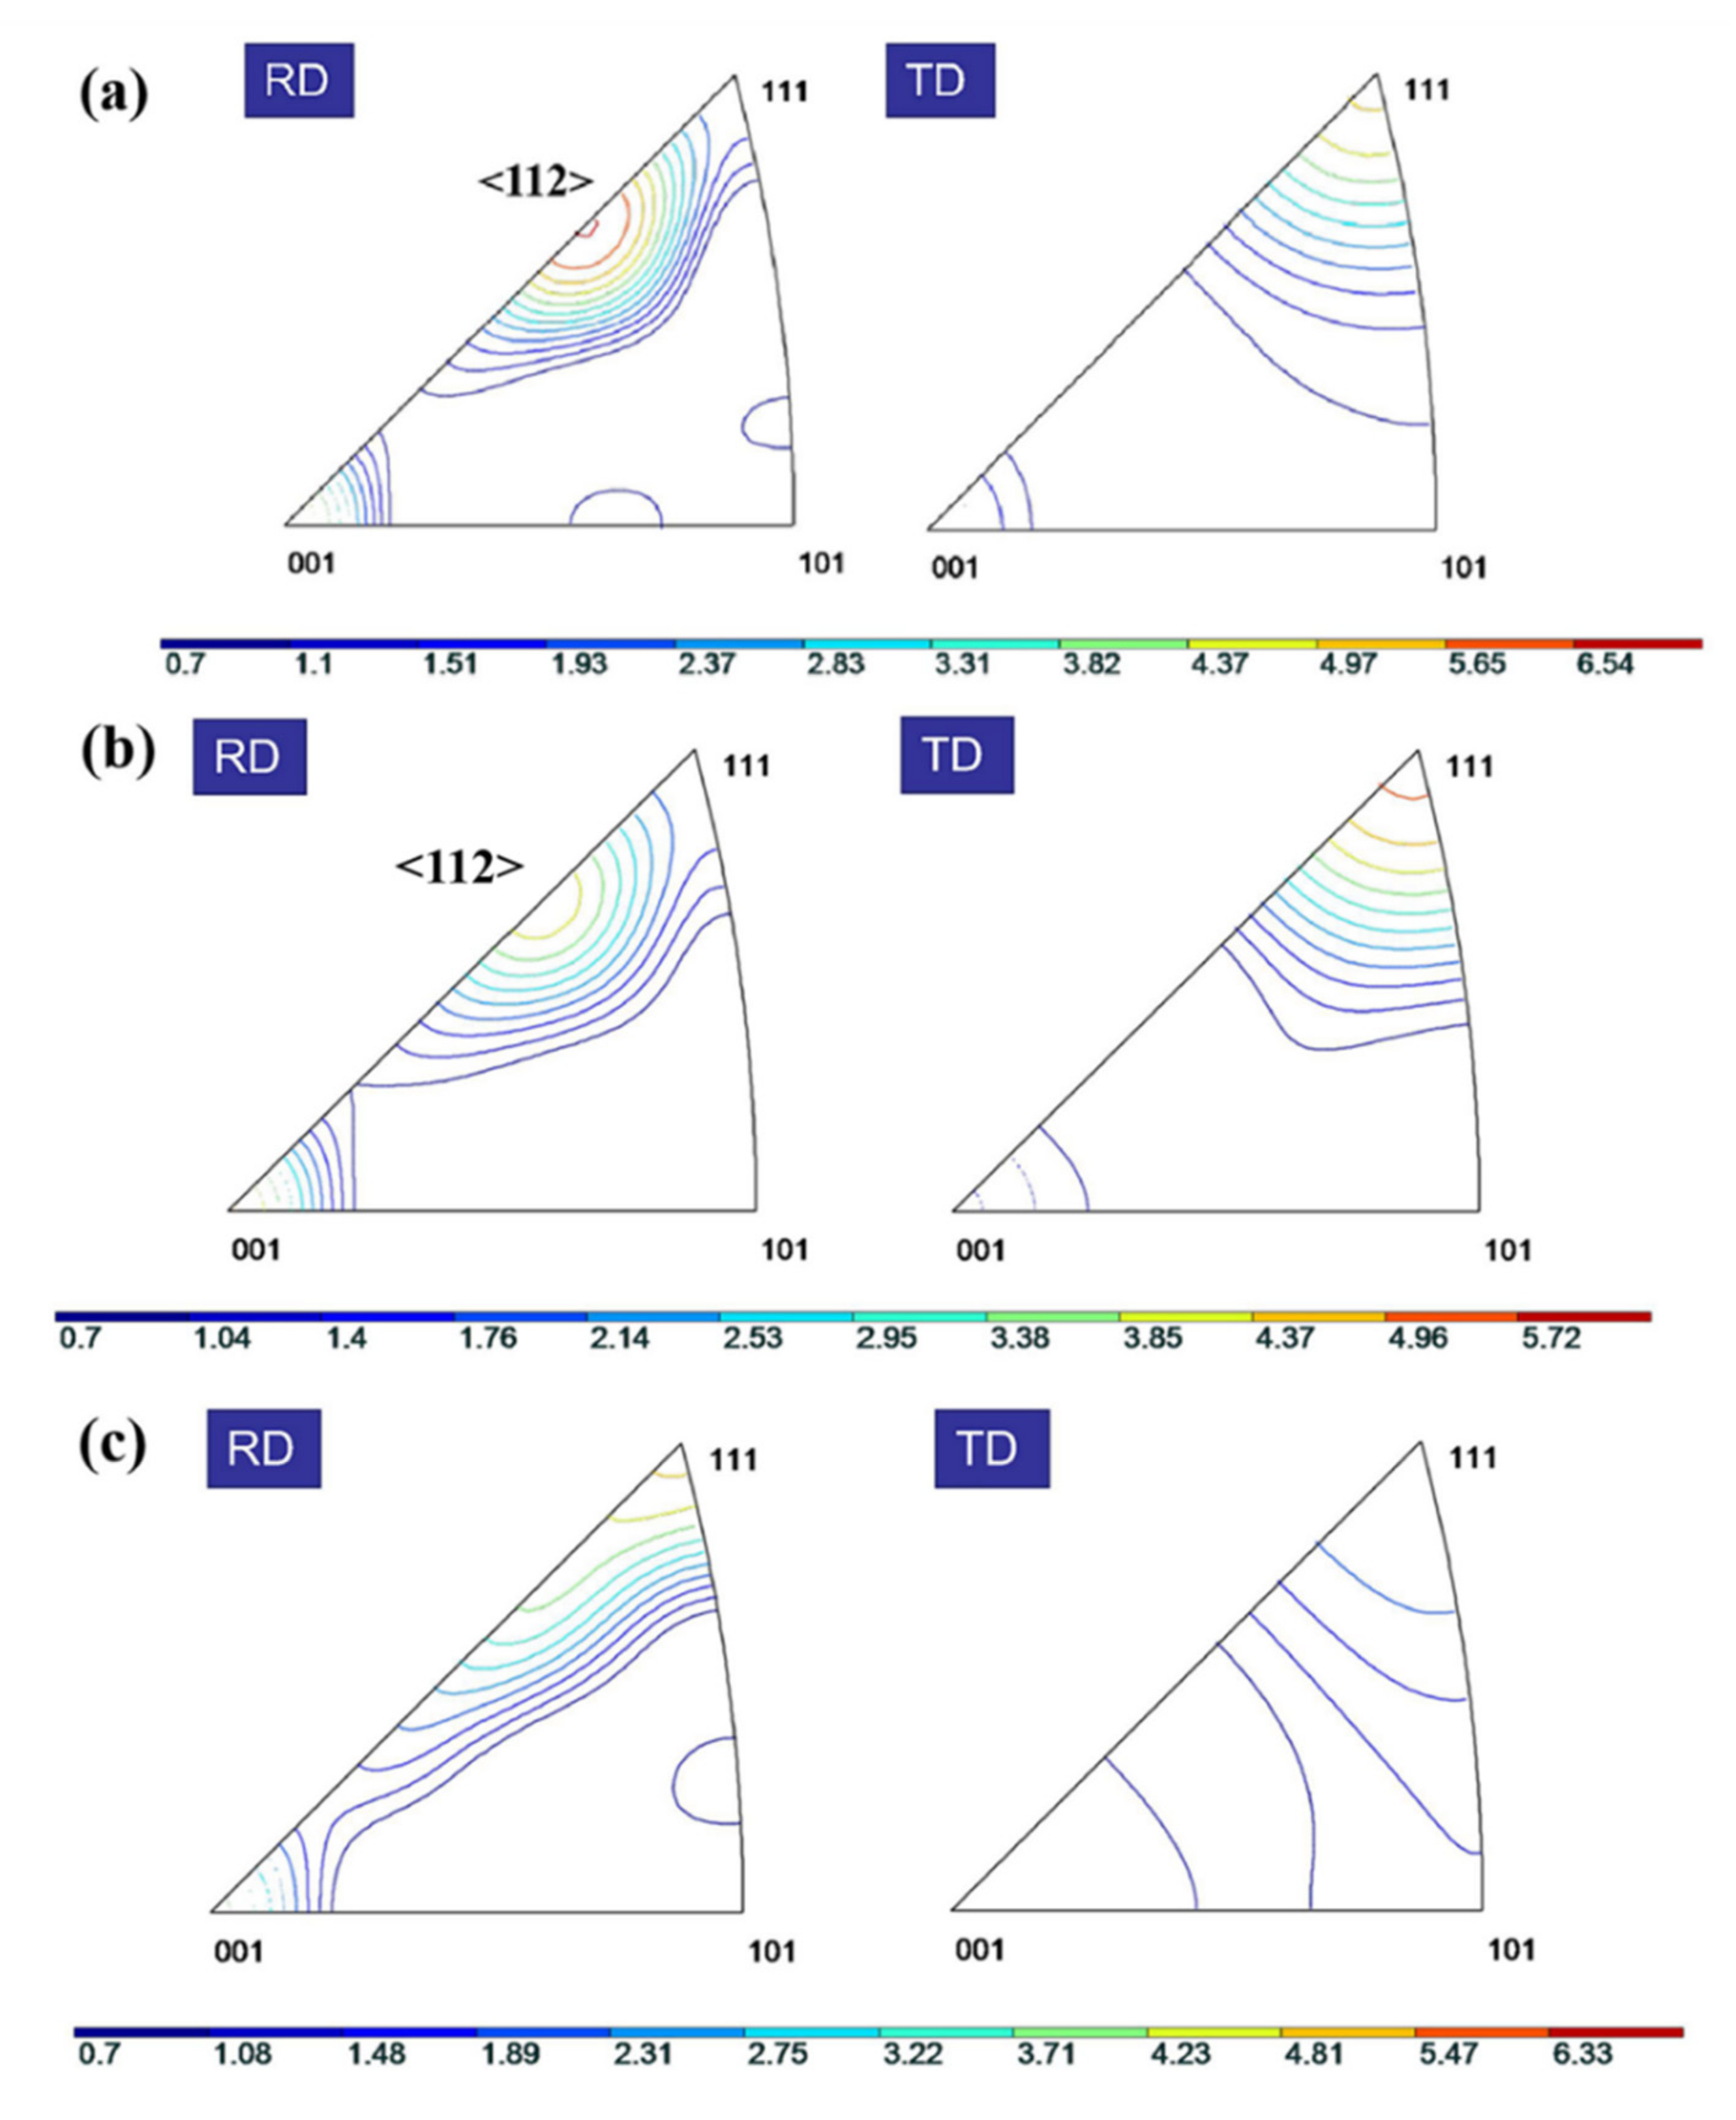
The 25 mm and 65 mm plates exhibit significant fiber textures along the RD and TD, while the fiber texture is not obvious for the 120 mm plate along the TD. The value of µ ¯ along the RD is significantly larger than that along the TD, which leads to a lower yield strength along the RD.
(3)
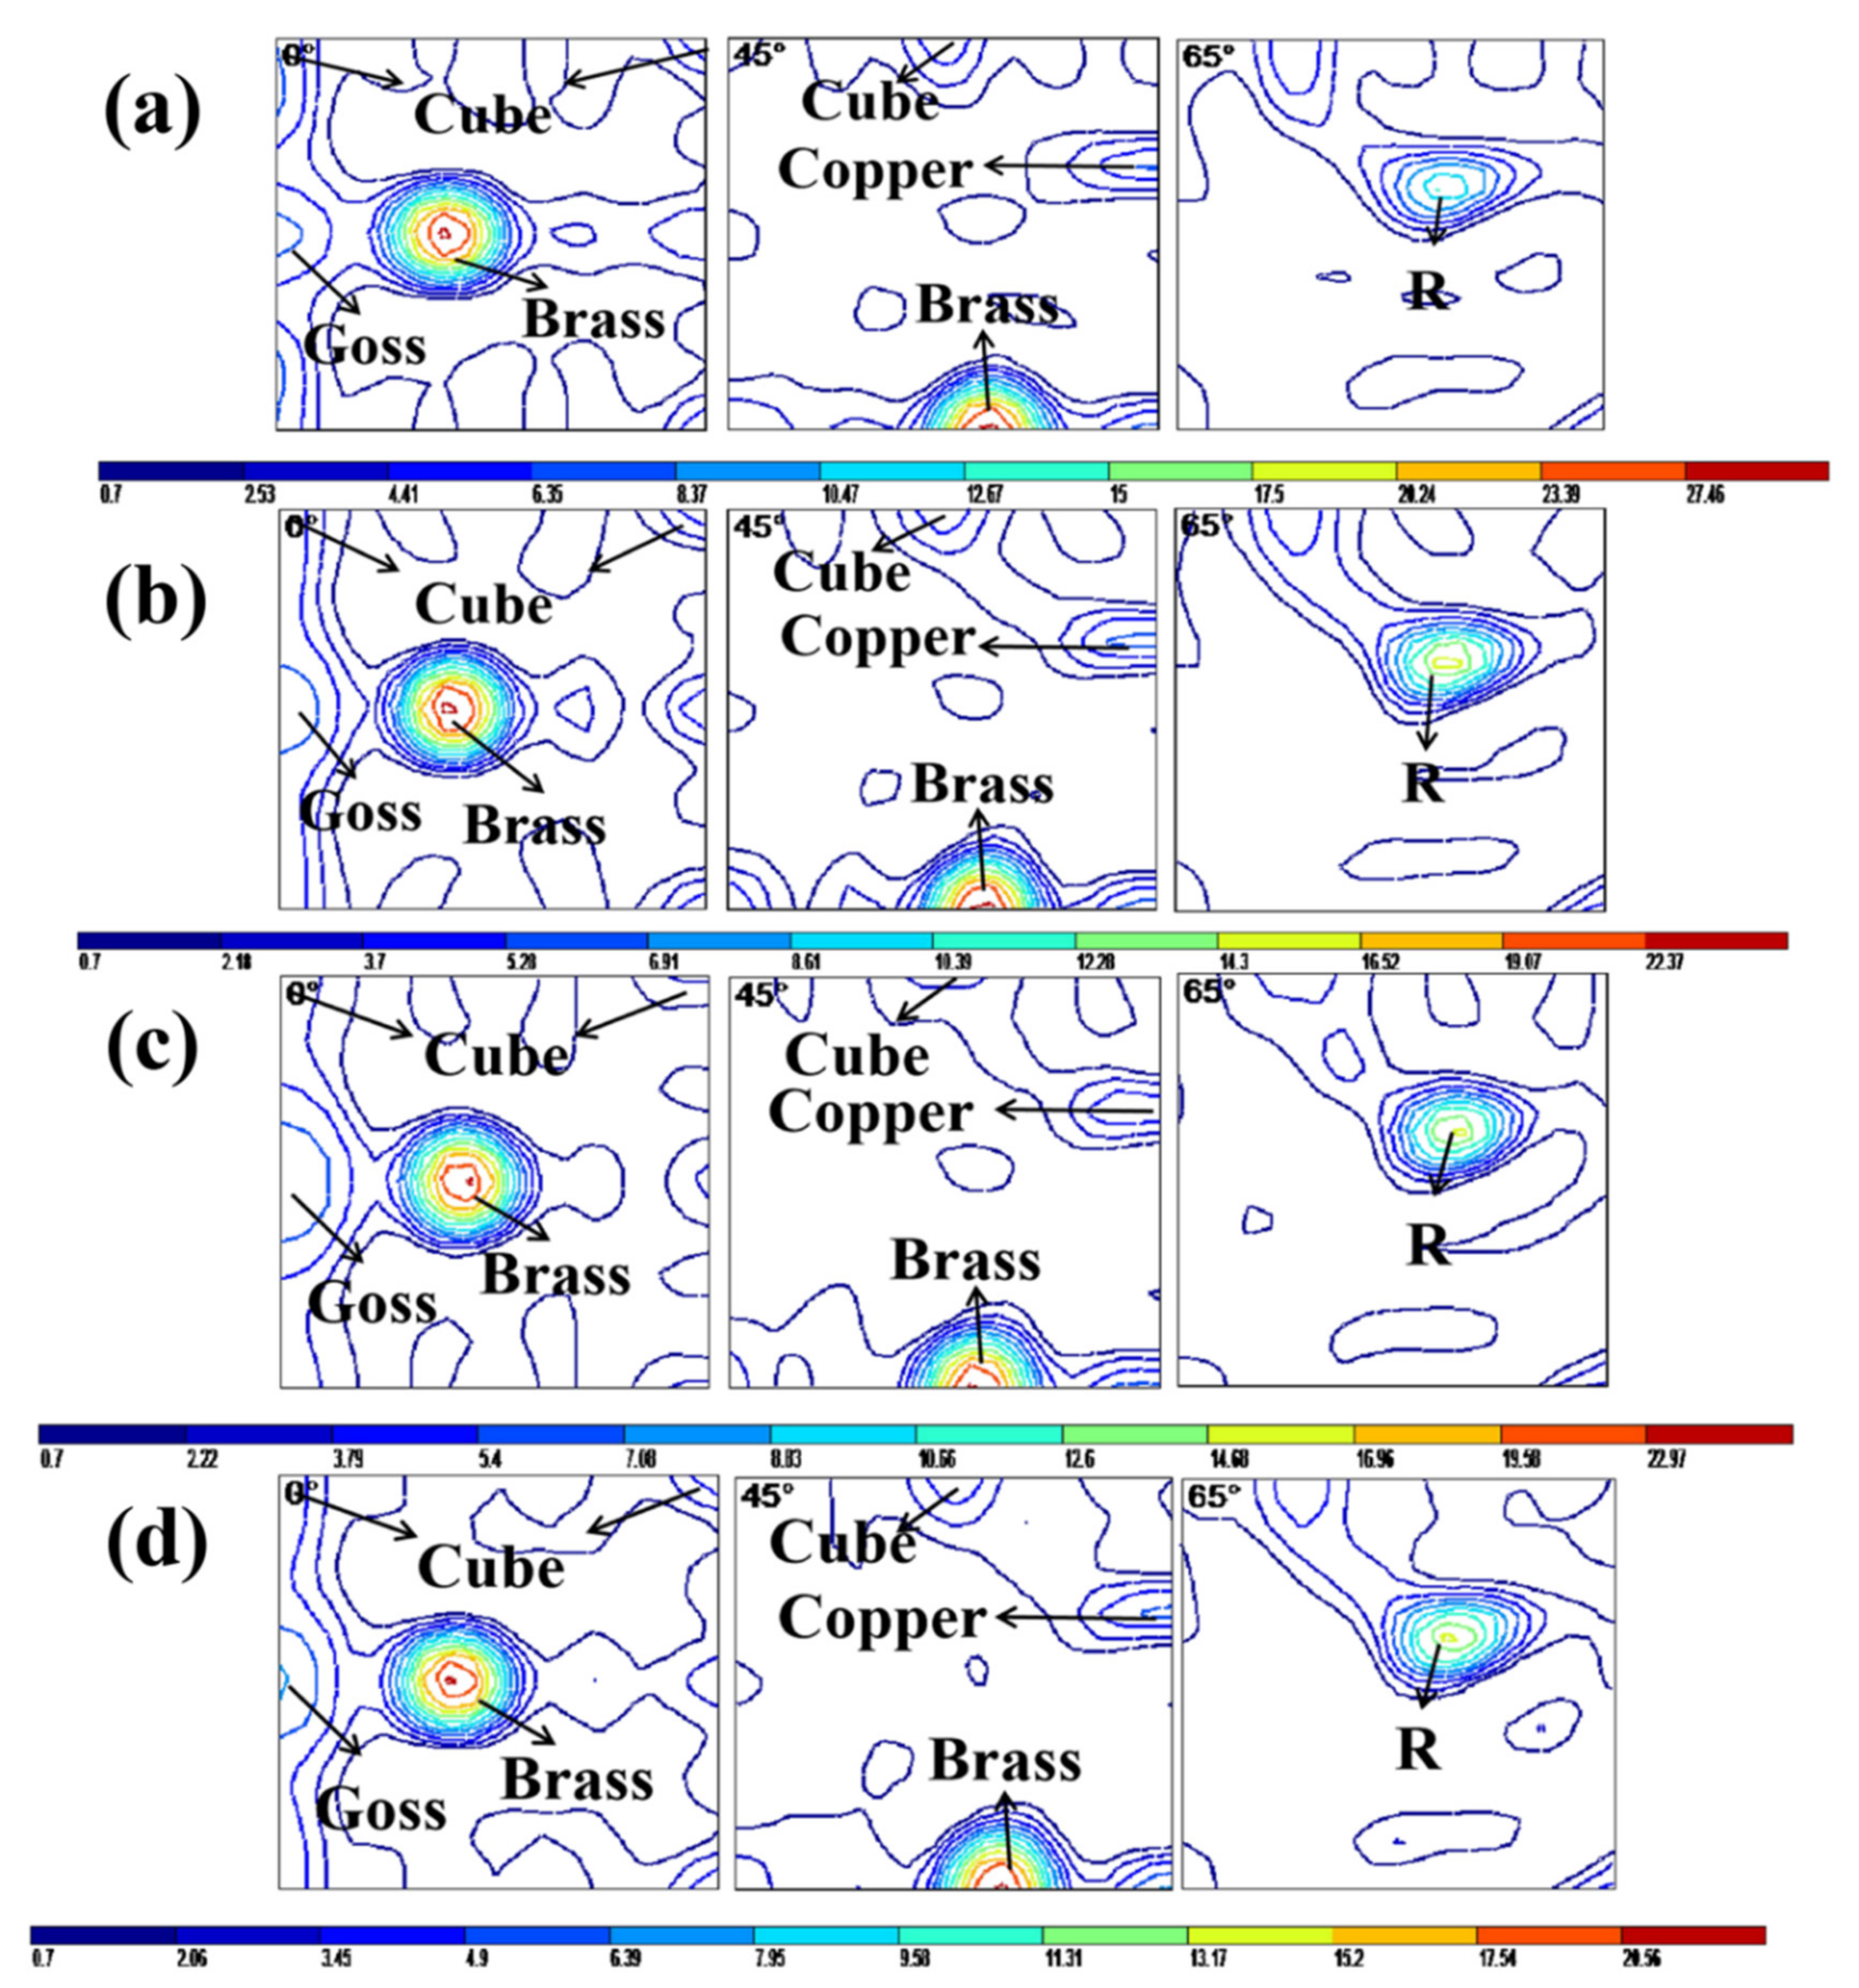
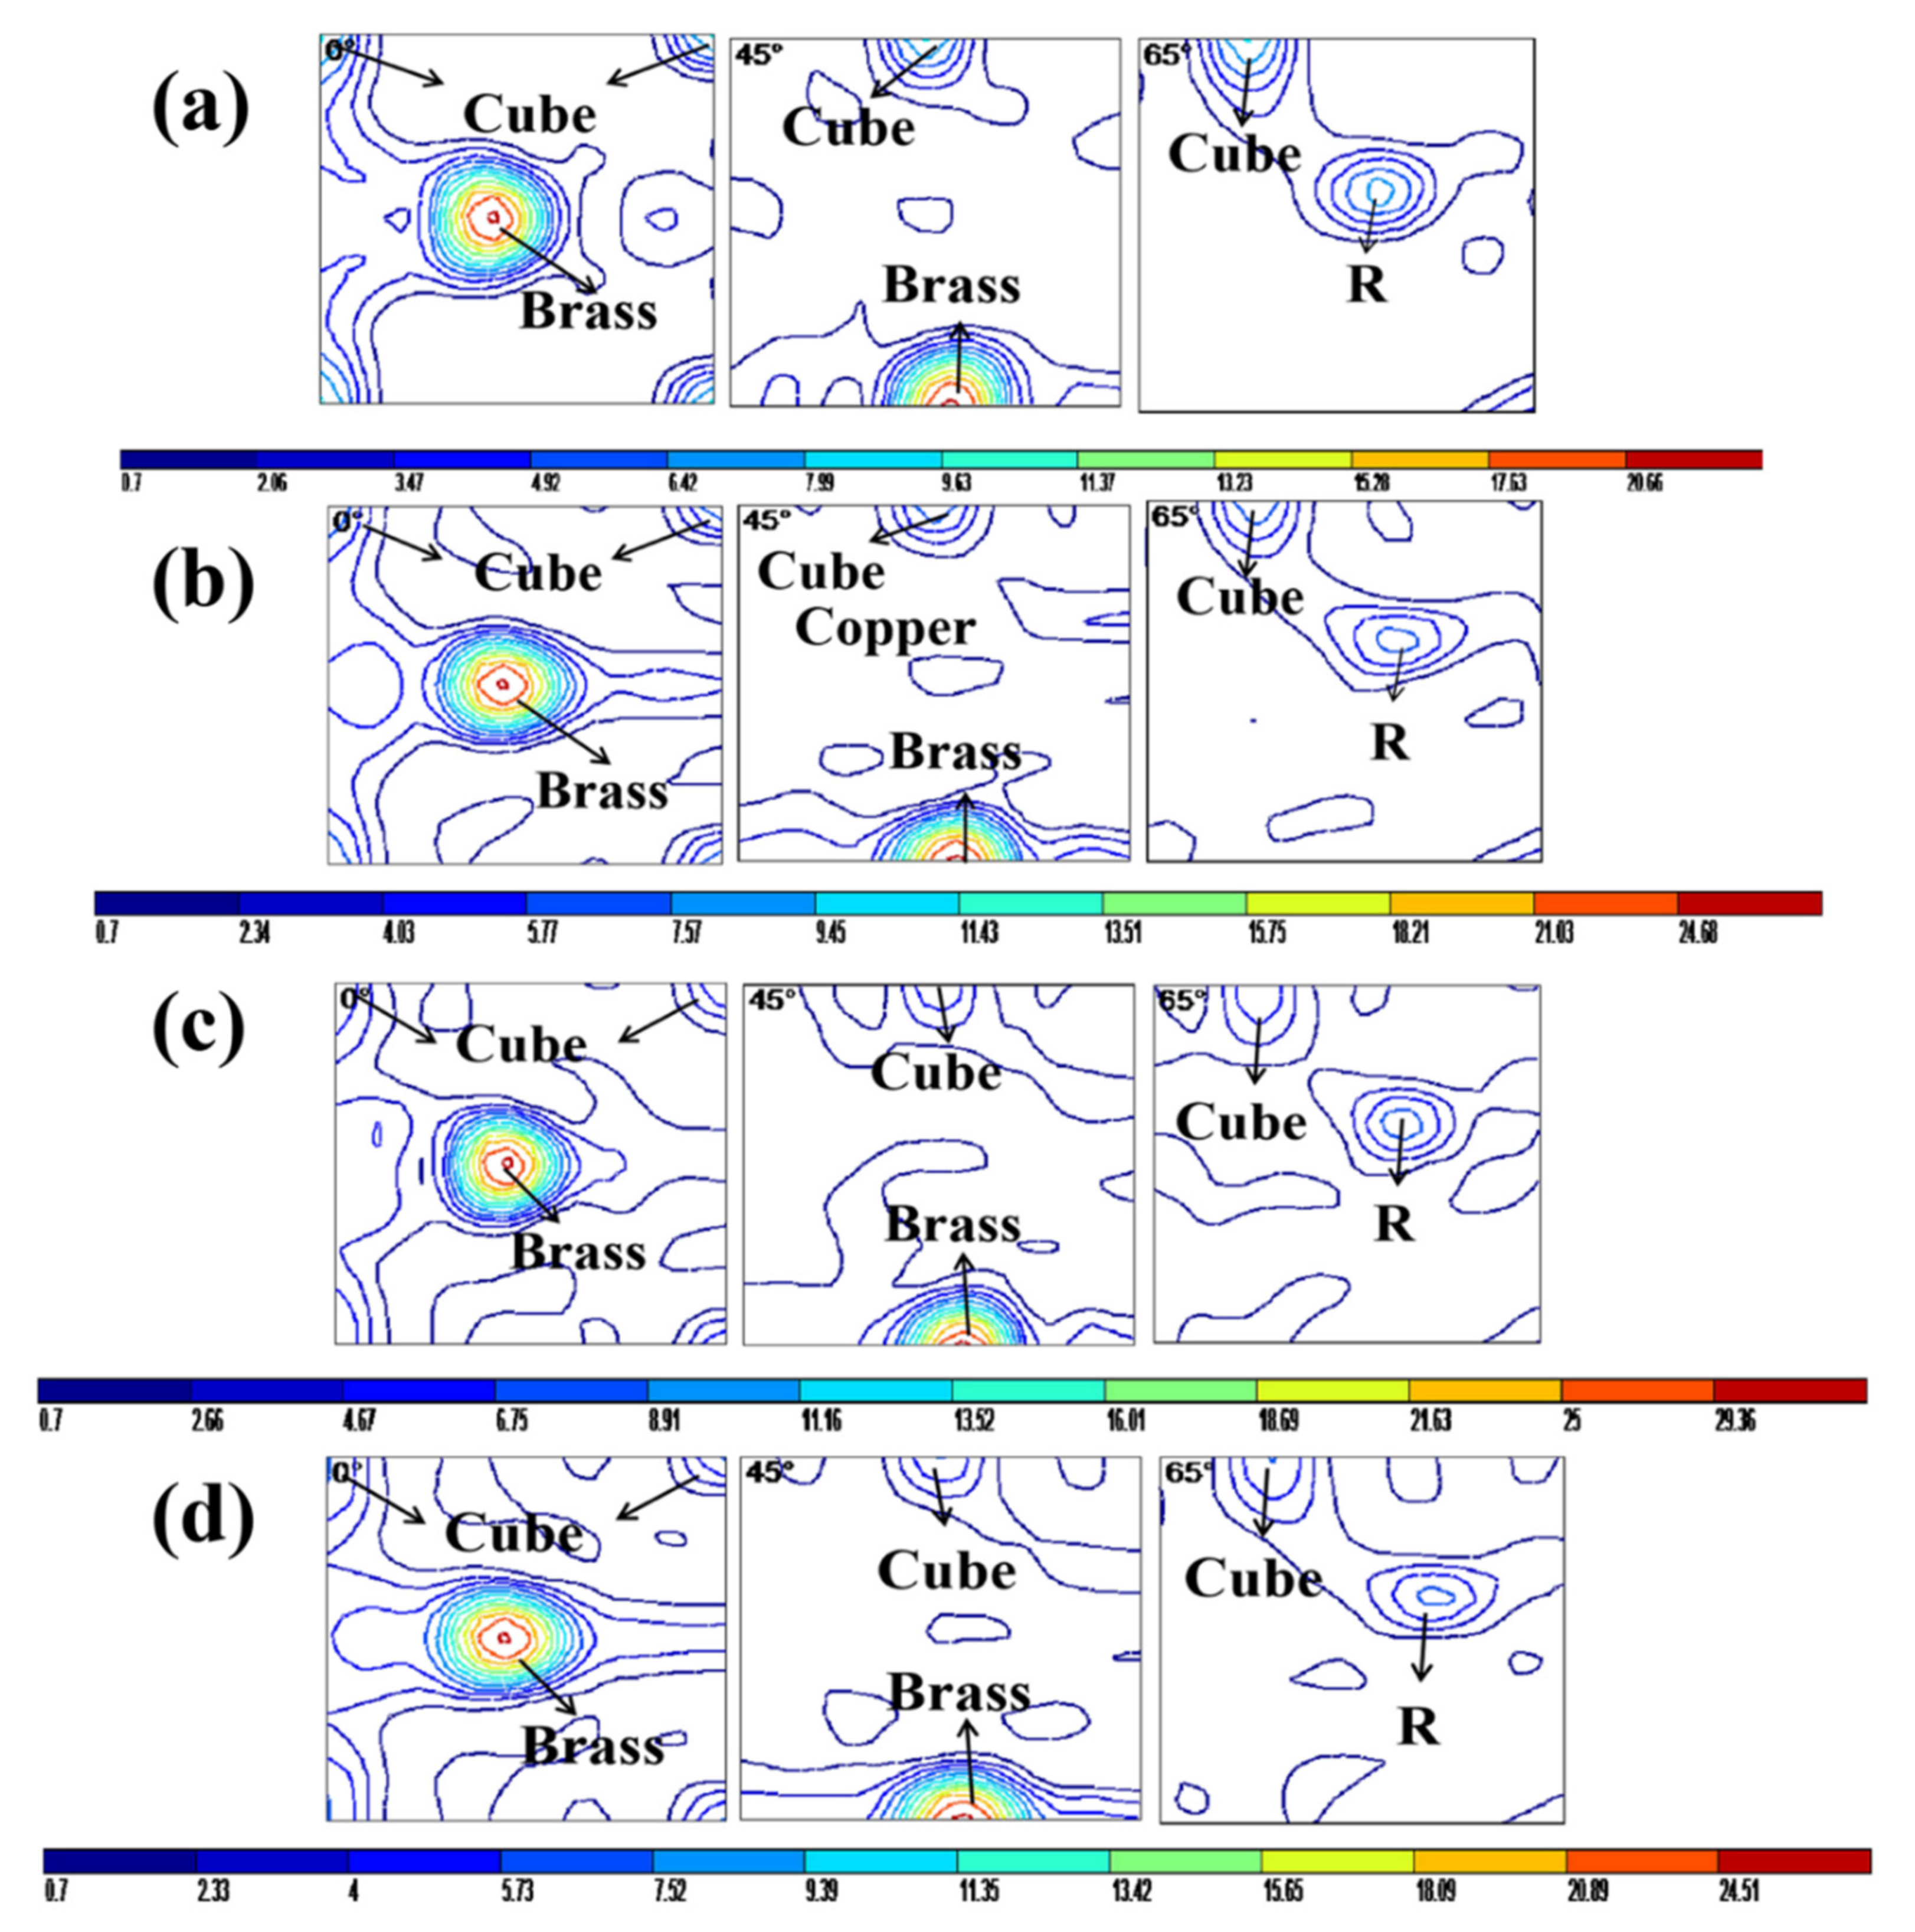
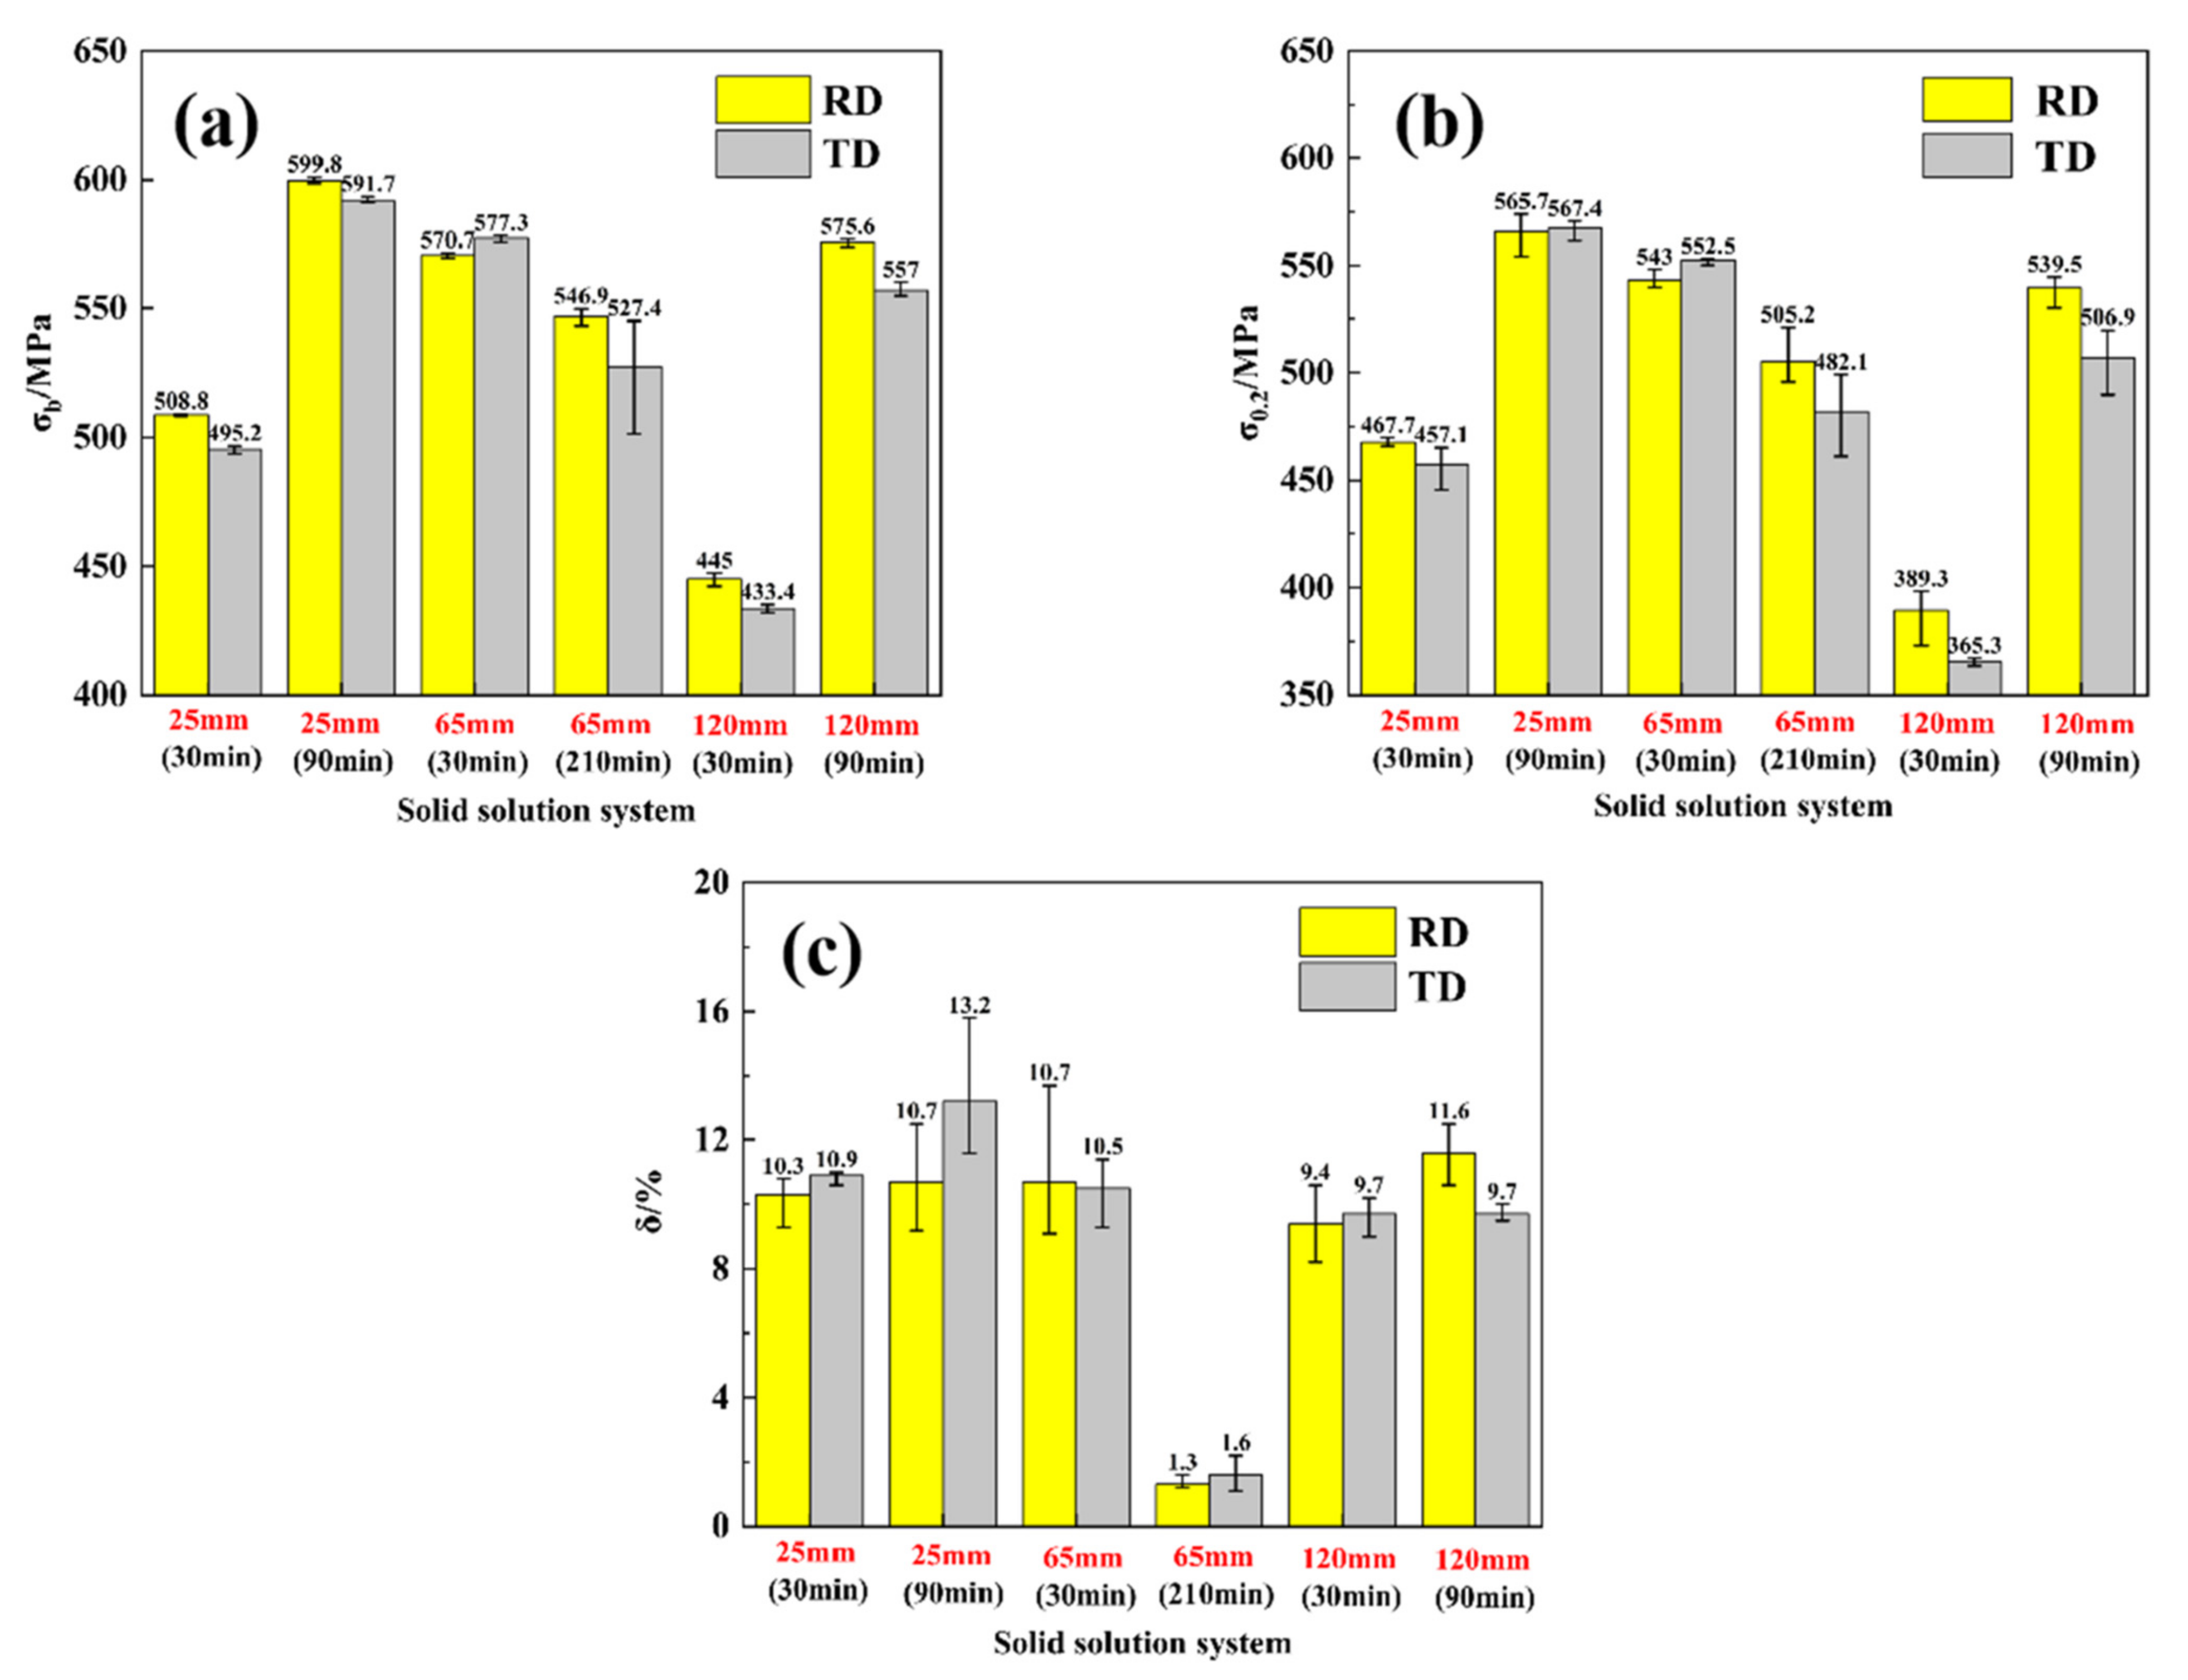
With the increase of deformation and static recrystallization degrees, texture types change from Cube, R-Cube to Brass, R, Cube and Copper during the re-dissolution process. After the dissolution of the second phase, the orientation density of Brass texture first increases and then decreases in the three plates. With the maximum of the Brass orientation density, the elongation after fracture decreases sharply to ~1.4%.
(4)
In terms of the contribution of the yield strength, grain boundary strengthening including LAGBs plays more significant roles than the effect of solid atoms and dislocation densities. The 25 mm plate exhibits the best mechanical properties, with a yield strength of 565.7 MPa along the rolling direction.

Author Contributions

Conceptualization, L.J. and H.Z.; methodology, L.J. and H.Z.; formal analysis, H.W. and L.J.; resources, C.L. and X.Z.; writing—original draft preparation, H.W.; writing—review and editing, W.W., C.Y. and L.J.; funding acquisition, C.L. and H.Z. All authors have read and agreed to the published version of the manuscript.

Funding

The project received financial support, and the project number is: JZKG20190099.

Data Availability Statement

The datasets generated during and/or analyzed during the current study are available from the corresponding author on reasonable request.

Conflicts of Interest

On behalf of all authors, the corresponding author states that there is no conflict of interest.

Nomenclature

BBurgers vector
BCboundary contrast
DCAPdissimilar channel angular pressing
EDSenergy dispersive spectroscopy
Gshear modulus
HAGBshigh angle grain boundaries
IPFinverse pole figure
LAGBslow-angle grain boundaries
MTaylor factor
NDnormal direction
ODForientation distribution function
OMoptical microscopy
RDrolling direction
SEMscanning electron microscope
TDtransverse direction
XRDX-ray diffraction
µSchmid factor
µ ¯ average value of µ
σ0yield strength of pure Al matrix
σssstrength affected by the solid solution
σgsstrengthening effect of grain boundaries
σdstrength affected by the dislocation density
τstrength contribution caused by the solute atoms
ρdislocation density
Frexrecrystallization fraction
δsubcrystalline size
Δσgbeffect of LAGBs

References

  1. Czerwinski, F. Thermal Stability of Aluminum Alloys. Materials 2020, 13, 3441. [Google Scholar] [CrossRef] [PubMed]
  2. Peng, H.; Chen, C.; Ren, X.; Wu, J. Development of clinching process for various materials. Int. J. Adv. Manuf. Technol. 2021, 1–19. [Google Scholar] [CrossRef]
  3. Fan, X.; Li, Y.; Xu, C.; Wang, B.; Peng, R.; Chen, J. Improved mechanical anisotropy and texture optimization of a 3xx alu-minum alloy by differential temperature rolling. Mater. Sci. Eng. A 2021, 799, 140278. [Google Scholar] [CrossRef]
  4. Li, Y.; Xu, G.; Liu, S.; Wang, B.; Peng, X. Study on anisotropy of Al-Zn-Mg-Sc-Zr alloy sheet. Mater. Charact. 2021, 172, 110904. [Google Scholar] [CrossRef]
  5. She, X.-W.; Jiang, X.-Q.; Wang, P.-Q.; Tang, B.-B.; Chen, K.; Liu, Y.-J.; Cao, W.-N. Relationship between microstructure and mechanical properties of 5083 aluminum alloy thick plate. Trans. Nonferrous Met. Soc. China 2020, 30, 1780–1789. [Google Scholar] [CrossRef]
  6. Zang, Q.; Feng, D.; Lee, Y.-S.; Chen, H.; Kim, M.-S.; Kim, H.-W. Microstructure and mechanical properties of Al-7.9Zn-2.7Mg-2.0Cu (wt%) alloy strip fabricated by twin roll casting and hot rolling. J. Alloy. Compd. 2020, 847, 156481. [Google Scholar] [CrossRef]
  7. Jia, L.; Ren, X.; Hou, H.; Zhang, Y. Microstructural evolution and superplastic deformation mechanisms of as-rolled 2A97 alloy at low-temperature. Mater. Sci. Eng. A 2019, 759, 19–29. [Google Scholar] [CrossRef]
  8. Li, S.; Zhao, Q.; Liu, Z.; Li, F. A Review of Texture Evolution Mechanisms During Deformation by Rolling in Aluminum Alloys. J. Mater. Eng. Perform. 2018, 27, 3350–3373. [Google Scholar] [CrossRef]
  9. Nam, S.K.; Lee, J.-H.; Kim, G.-H.; Lee, D.N.; Kim, I. Texture Analysis for Enhancement of R-value in Asymmetrically Rolled Al Alloy Sheet. J. Mater. Eng. Perform. 2019, 28, 5186–5194. [Google Scholar] [CrossRef]
  10. Shen, F.; Zhou, Z.; Li, W.; Sun, Z.; Tian, J.; Xie, C.; Guo, J.; Liao, Z.; Yi, D.; Zhang, J.; et al. Mi-cro-mechanism of texture evolution during isochronal annealing of as-annealed hot rolled Al-Cu-Mg sheet. Mater. Des. 2019, 165, 107575. [Google Scholar] [CrossRef]
  11. Venkatachalam, P.; Roy, S.; Ravisankar, B.; Paul, V.T.; Vijayalakshmi, M.; Suwas, S. Texture evolution in an Al–Cu alloy during equal channel angular pressing: The effect of starting microstructure. J. Mater. Sci. 2011, 46, 6518–6527. [Google Scholar] [CrossRef]
  12. Deng, Y.-L.; Wan, L.; Zhang, Y.; Zhang, X.-M. Evolution of microstructures and textures of 7050 Al alloy hot-rolled plate during staged solution heat-treatments. J. Alloy. Compd. 2010, 498, 88–94. [Google Scholar] [CrossRef]
  13. Xu, X.; Mao, Q.; Jiang, Z.; Vitus, T.; Zhang, T.; Jia, W.; Zhu, C.; Wang, H. Effect of multi-stage solution and aging process on mi-crostructure and properties of Al-11.2Zn-3.0Mg-1.3Cu-0.2Zr aluminum alloy extrusion. Mater. Lett. 2019, 254, 375–378. [Google Scholar] [CrossRef]
  14. Zhang, K.; He, Q.; Rao, J.H.; Wang, Y.; Zhang, R.; Yuan, X.; Feng, W.; Huang, A. Correlation of textures and hemming performance of an AA6XXX aluminium alloy. J. Alloy. Compd. 2021, 853, 157081. [Google Scholar] [CrossRef]
  15. Khan, M.A.; Wang, Y.; Cheng, H.; Yasin, G.; Malik, A.; Nazeer, F.; Ahmad, T.; Khan, W.Q.; Kamran, M.; Afifi, M.A. Microstructure evolution of an artificially aged Al-Zn-Mg-Cu alloy subjected to soft- and hard-steel core projectiles. J. Mater. Res. Technol. 2020, 9, 11980–11992. [Google Scholar] [CrossRef]
  16. Wang, X.; Guo, M.; Cao, L.; Luo, J.; Zhang, J.; Zhuang, L. Effect of heating rate on mechanical property, microstructure and texture evolution of Al–Mg–Si–Cu alloy during solution treatment. Mater. Sci. Eng. A 2015, 621, 8–17. [Google Scholar] [CrossRef]
  17. Zuiko, I.; Mironov, S.; Kaibyshev, R. Microstructural evolution and strengthening mechanisms operating during cryogenic rolling of solutionized Al-Cu-Mg alloy. Mater. Sci. Eng. A 2019, 745, 82–89. [Google Scholar] [CrossRef]
  18. Moghanaki, S.K.; Kazeminezhad, M.; Logé, R. Mechanical behavior and texture development of over-aged and solution treated Al-Cu-Mg alloy during multi-directional forging. Mater. Charact. 2018, 135, 221–227. [Google Scholar] [CrossRef]
  19. Tang, J.; Wang, J.; Teng, J.; Wang, G.; Fu, D.; Zhang, H.; Jiang, F. Effect of Zn content on the dynamic softening of Al–Zn–Mg–Cu alloys during hot compression deformation. Vacuum 2021, 184, 109941. [Google Scholar] [CrossRef]
  20. Suo, C.; Ma, P.; Jia, Y.; Liu, X.; Shi, X.; Yu, Z.; Prashanth, K. Annealing of Al-Zn-Mg-Cu Alloy at High Pressures: Evolution of Microstructure and the Corrosion Behavior. Materials 2021, 14, 2076. [Google Scholar] [CrossRef] [PubMed]
  21. Chae, W.; Kim, B.-K.; Lee, J.; Han, J.H. Effects of Initial Precipitate on Shear Deformation during Asymmetric Rolling of Al-Mg-Si Alloy: Texture and Formability. Korean J. Met. Mater. 2020, 58, 703–714. [Google Scholar] [CrossRef]
  22. Mei, L.; Chen, X.; Ren, P.; Nie, Y.; Huang, G.; Liu, Q. Effect of warm deformation on precipitation and mechanical properties of a cryorolled Al-Zn-Mg-Cu sheet. Mater. Sci. Eng. A 2020, 771, 138608. [Google Scholar] [CrossRef]
  23. Poole, W.; Wang, X.; Embury, J.; Lloyd, D. The effect of manganese on the microstructure and tensile response of an Al-Mg-Si alloy. Mater. Sci. Eng. A 2019, 755, 307–317. [Google Scholar] [CrossRef]
  24. Sadeghi, A.; Kyokuta, N.; Inoue, J.; Koseki, T. Effect of initial texture and microstructure of Mg on mechanical properties of Mg—Stainless steel laminated metal composites. Mater. Charact. 2017, 127, 171–178. [Google Scholar] [CrossRef]
  25. Han, J.-H.; Huh, M.; Suh, J.-Y.; Lee, J.-C. Controlling the textures of the Al alloy sheet via dissimilar channel angular pressing. Mater. Sci. Eng. A 2005, 394, 60–65. [Google Scholar] [CrossRef]
  26. Wang, L.; Yang, X.; Robson, J.D.; Sanders, R.E.; Liu, Q. Microstructural Evolution of Cold-Rolled AA7075 Sheet during Solution Treatment. Materials 2020, 13, 2734. [Google Scholar] [CrossRef]
  27. Feng, S.; Sun, L.M.; Chen, Z.G.; Zheng, Z.Q.; Li, J.F. Microstructure and mechanical properties of 7056 aluminum alloy thick plates. Rare Met. Mater. Eng. 2018, 47, 3088–3095. (In Chinese) [Google Scholar]
  28. Li, P.; Ding, C.; Wang, B.; Wu, G.; Xue, K. Dissolution of secondary phase in novel Al-Zn-Mg-Cu alloy reduced by high pressure torsion. Chin. J. Nonferrous Met. 2019, 29, 11–17. (In Chinese) [Google Scholar]
  29. Shackelford, J.F. Introduction to Materials Science for Engineers, 3rd ed.; Mcmillan Pub Co: New York, NY, USA, 1992. [Google Scholar]
  30. Yang, G.; Chen, L.; Wang, J.; Wang, J.; Shi, Q. Influences of Texture of FCC Metals on Their Mechanical Properties. J. Kunming Univ. Sci. Technol. 2012, 37, 24–27. [Google Scholar]
  31. Zhang, P.; Li, Y.; Liu, Y.; Zhang, Y.; Liu, J. Analysis of the microhardness, mechanical properties and electrical conductivity of 7055 aluminum alloy. Vacuum 2020, 171, 109005. [Google Scholar] [CrossRef]
  32. Hu, Z.; Zhang, H.; Zhu, H.; Xiao, Z.; Nie, X.; Zeng, X. Microstructure, mechanical properties and strengthening mechanisms of AlCu5MnCdVA aluminum alloy fabricated by selective laser melting. Mater. Sci. Eng. A 2019, 759, 154–166. [Google Scholar] [CrossRef]
  33. Chen, Z.G.; Ren, J.K.; Yuan, Z.G.; Ringer, S.P. Enhanced strength-plasticity combination in an Al–Cu–Mg alloy—Atomic scale microstructure regulation and strengthening mechanisms. Mater. Sci. Eng. A 2020, 787, 139447. [Google Scholar] [CrossRef]
  34. Ma, K.K.; Hu, T.; Yang, H.; Topping, T.; Yousefiani, A.; Lavernia, E.J.; Schoenung, J.M. Coupling of dislocations and precipitates: Impact on the mechanical behavior of ultrafine grained Al–Zn–Mg alloys. Acta Mater. 2016, 103, 153–164. [Google Scholar] [CrossRef]
Figure 1. Grain structure and SEM results of hot rolled plates: (a,c) 25 mm; (b,d) 65 mm.
Metals 12 00008 g001
Figure 2. IPF results and boundary contrast (BC) images of hot rolled plates: (a,c) 25 mm; (b,d) 65 mm.
Metals 12 00008 g002
Figure 3. ODF maps of hot rolled plates: (a) 25 mm, (b) 65 mm, (c) 120 mm.
Metals 12 00008 g003
Figure 4. SEM figures of 25/65/120 mm hot rolled plates after solution at: (a,c,e) 477 °C/30 min; (b,d,f) 477 °C/90 min.
Metals 12 00008 g004
Figure 5. IPF and BC images of the different plates after different solution times: (a,d) the 25 mm plate treated for 90 min; (b,e) the 65 mm plate treated for 30 min; (c,f) the 120 mm plate treated for 90 min.
Metals 12 00008 g005
Figure 6. ODF results of the 25 mm hot rolled plate after solution at 477 °C for: (a) 30 min, (b) 90 min, (c) 210 min, (d) 330 min.
Metals 12 00008 g006
Figure 7. ODF results of 65 mm hot rolled plates after solution at 477 °C for: (a) 30 min, (b) 90 min, (c) 210 min, (d) 330 min.
Metals 12 00008 g007
Figure 8. ODF results of the 120 mm hot rolled plate after solution at 477 °C for: (a) 30 min, (b) 90 min, (c) 210 min, (d) 330 min.
Metals 12 00008 g008
Figure 9. Curves of the texture orientation density after different solution times: (a) 25 mm, (b) 65 mm, (c) 120 mm.
Metals 12 00008 g009
Figure 10. IPF results of hot rolled plates after different solution treatments: (a) 25 mm plates treated for 90 min; (b) 65 mm plates treated for 30 min; (c) 120 mm plates treated for 90 min.
Metals 12 00008 g010
Figure 11. Conductivity results after different solution times.
Metals 12 00008 g011
Figure 12. Mechanical properties of the plates after solution and ageing treatments: (a) σb, (b) σ0.2, (c) δ.
Metals 12 00008 g012
Table 1. The texture types and orientation density of the plates.
Plate ThicknessCubeBrassCopperRR-CubeGoss
25 mm3.94–5.9424.00-3.94–5.6413.19–15.38----------5.64–7.4
65 mm6.58–8.6828.6-2.6–4.566.58–8.68-------------------
120 mm1.37–1.61--------------------------3.88----------
Table 2. The orientations and orientation densities of different plates.
Plate ThicknessRDTD
25 mm[112]6.54[111]4.97–5.65
[001]4.37–4.97[001]1.11–1.51
65 mm[112]3.85–4.37[111]4.96–5.72
[001]3.85–4.37[001]1.4–1.76
120 mm[111]4.81–5.47----------------
[001]4.23–4.81
Table 3. The orientations, slip systems and the value of µ.
OrientationSlip Systemsµ
[112](111)< 1 ¯ 01>,(111)<01 1 ¯ > 0.27
[001](111)< 1 ¯ 01>,( 1 ¯ 11)< 1 ¯ 01>,(1 1 ¯ 1)< 1 ¯ 01>,(11 1 ¯ )< 1 ¯ 01>0.41
(111)<01 1 ¯ >,( 1 ¯ 11)<01 1 ¯ >,(1 1 ¯ 1)<01 1 ¯ >,(11 1 ¯ )<01 1 ¯ >
[111]------------------0
Table 4. The value of µ ¯ in the plates with different thicknesses.
Plate Thickness µ ¯ / RD µ ¯ / TD
25 mm0.330.08
65 mm0.340.09
120 mm0.19--------
Publisher’s Note: MDPI stays neutral with regard to jurisdictional claims in published maps and institutional affiliations.

