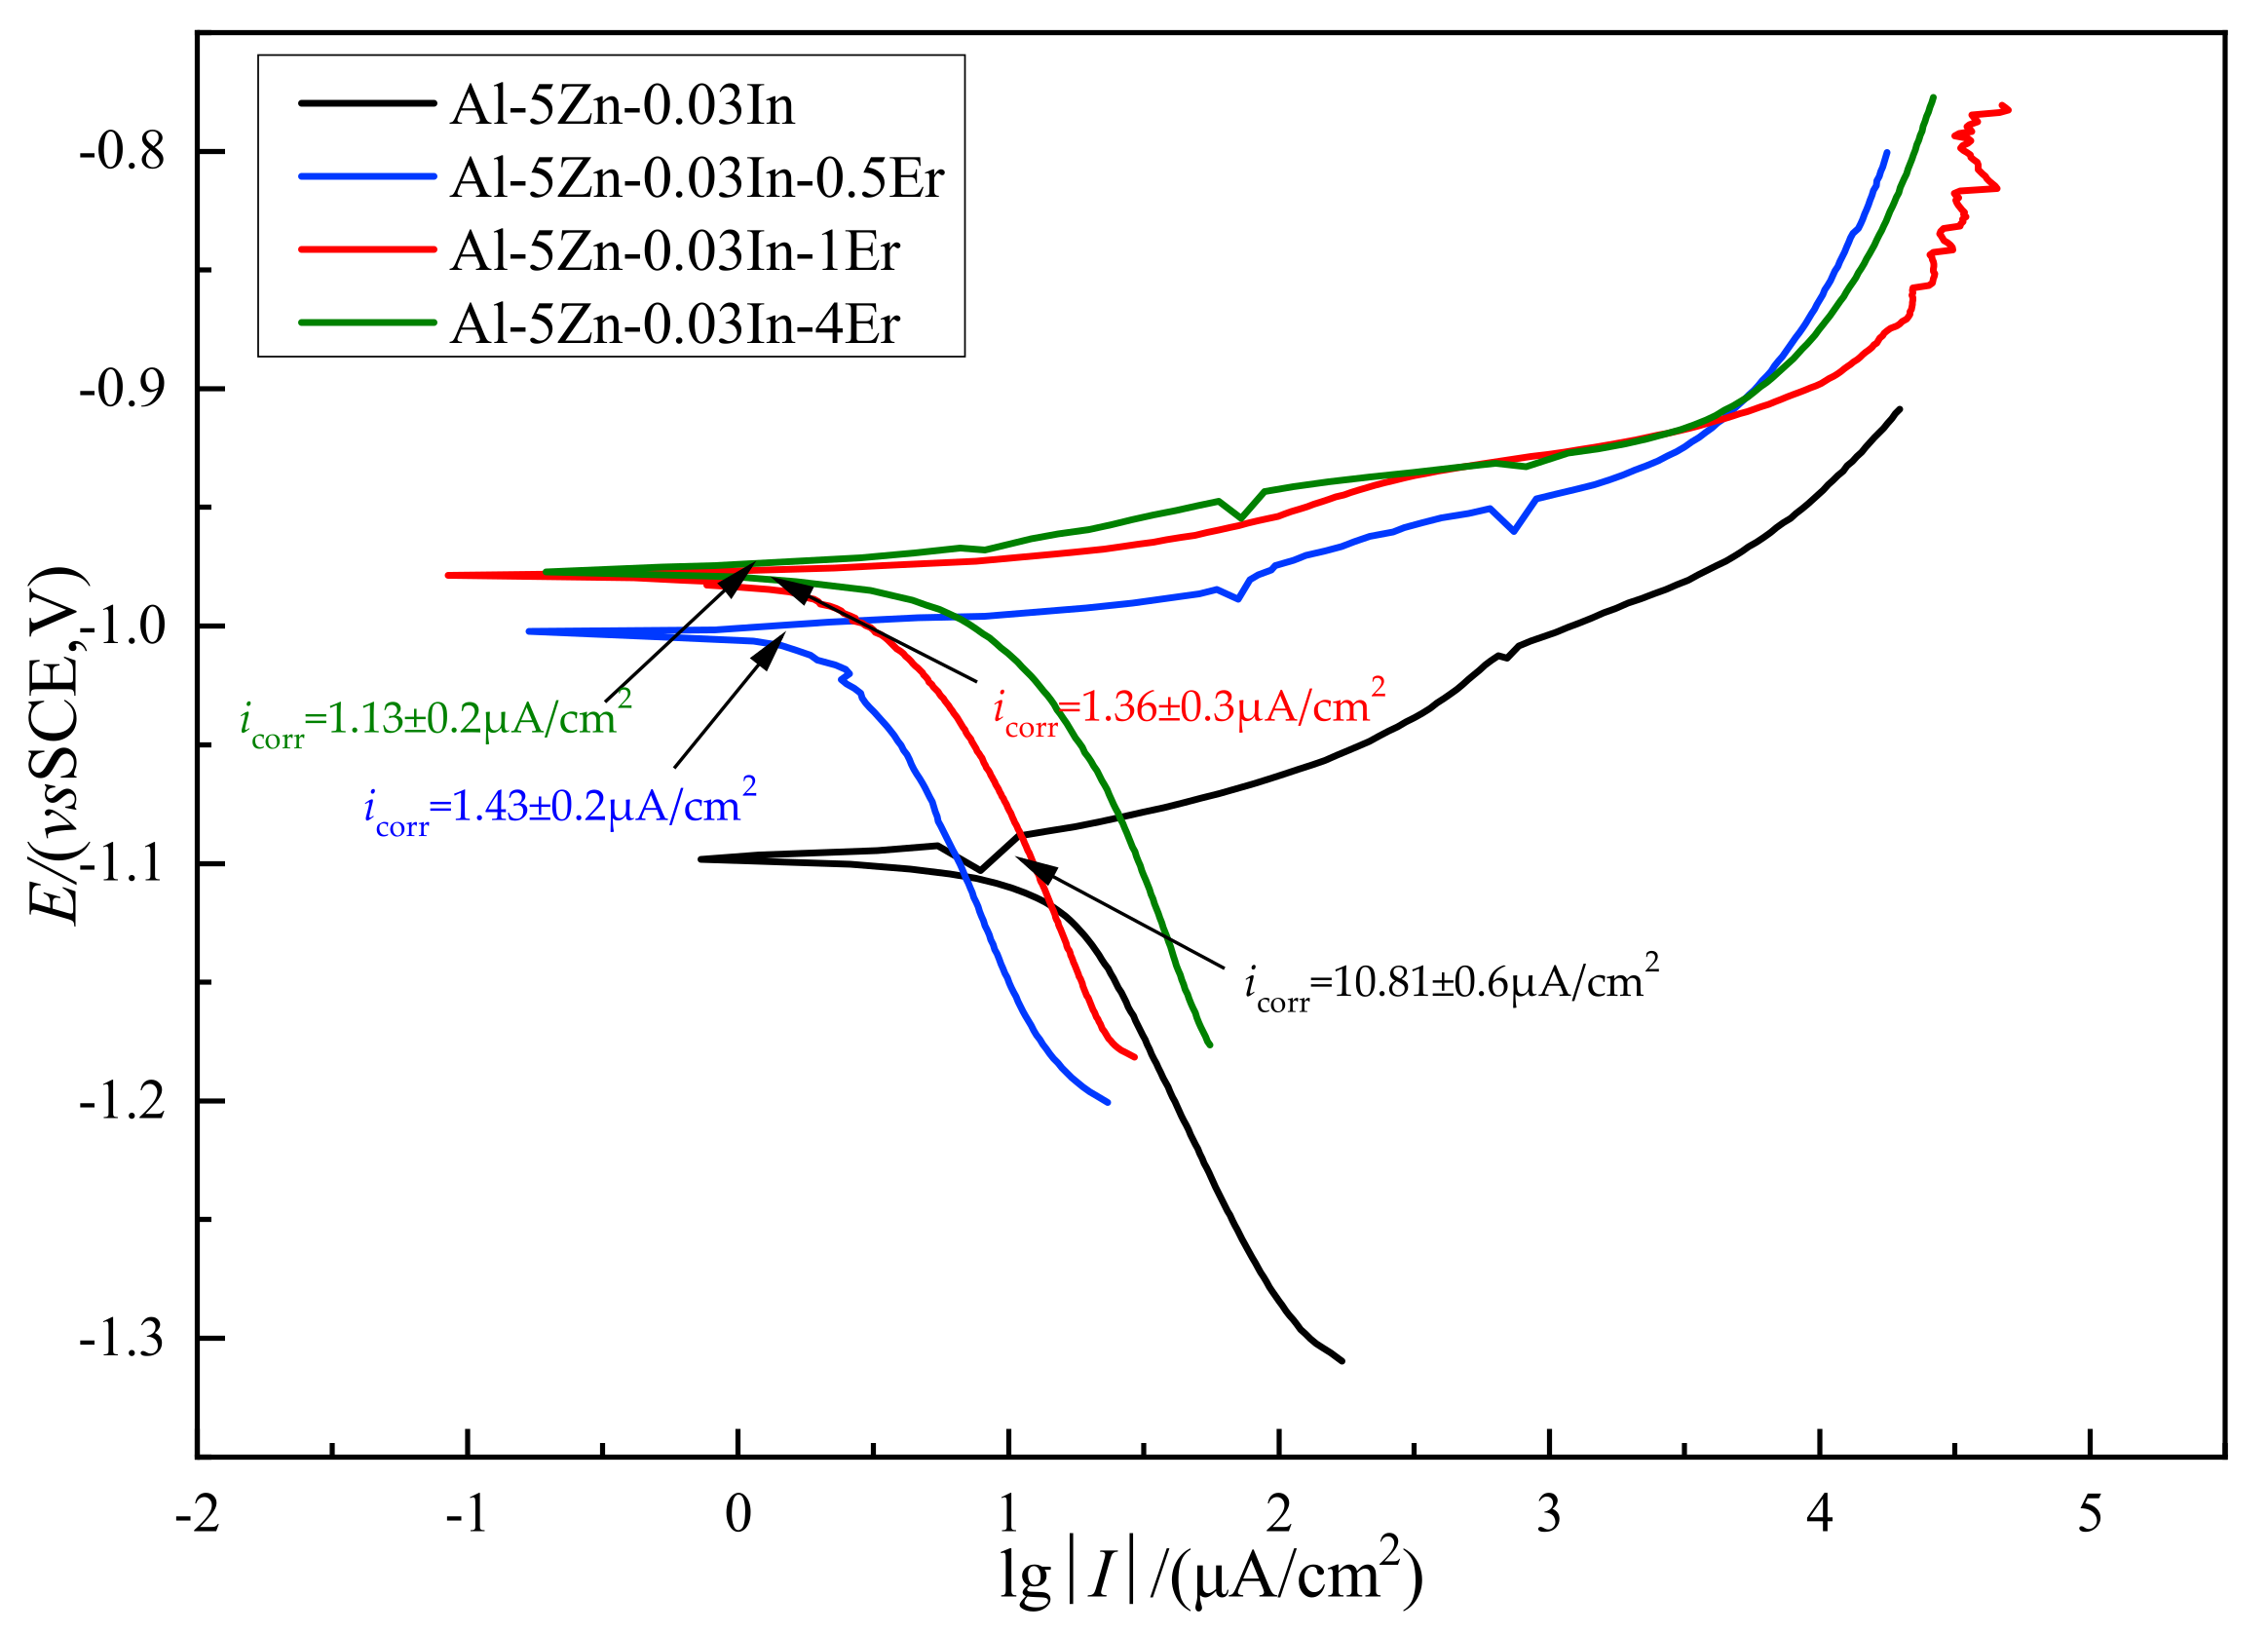
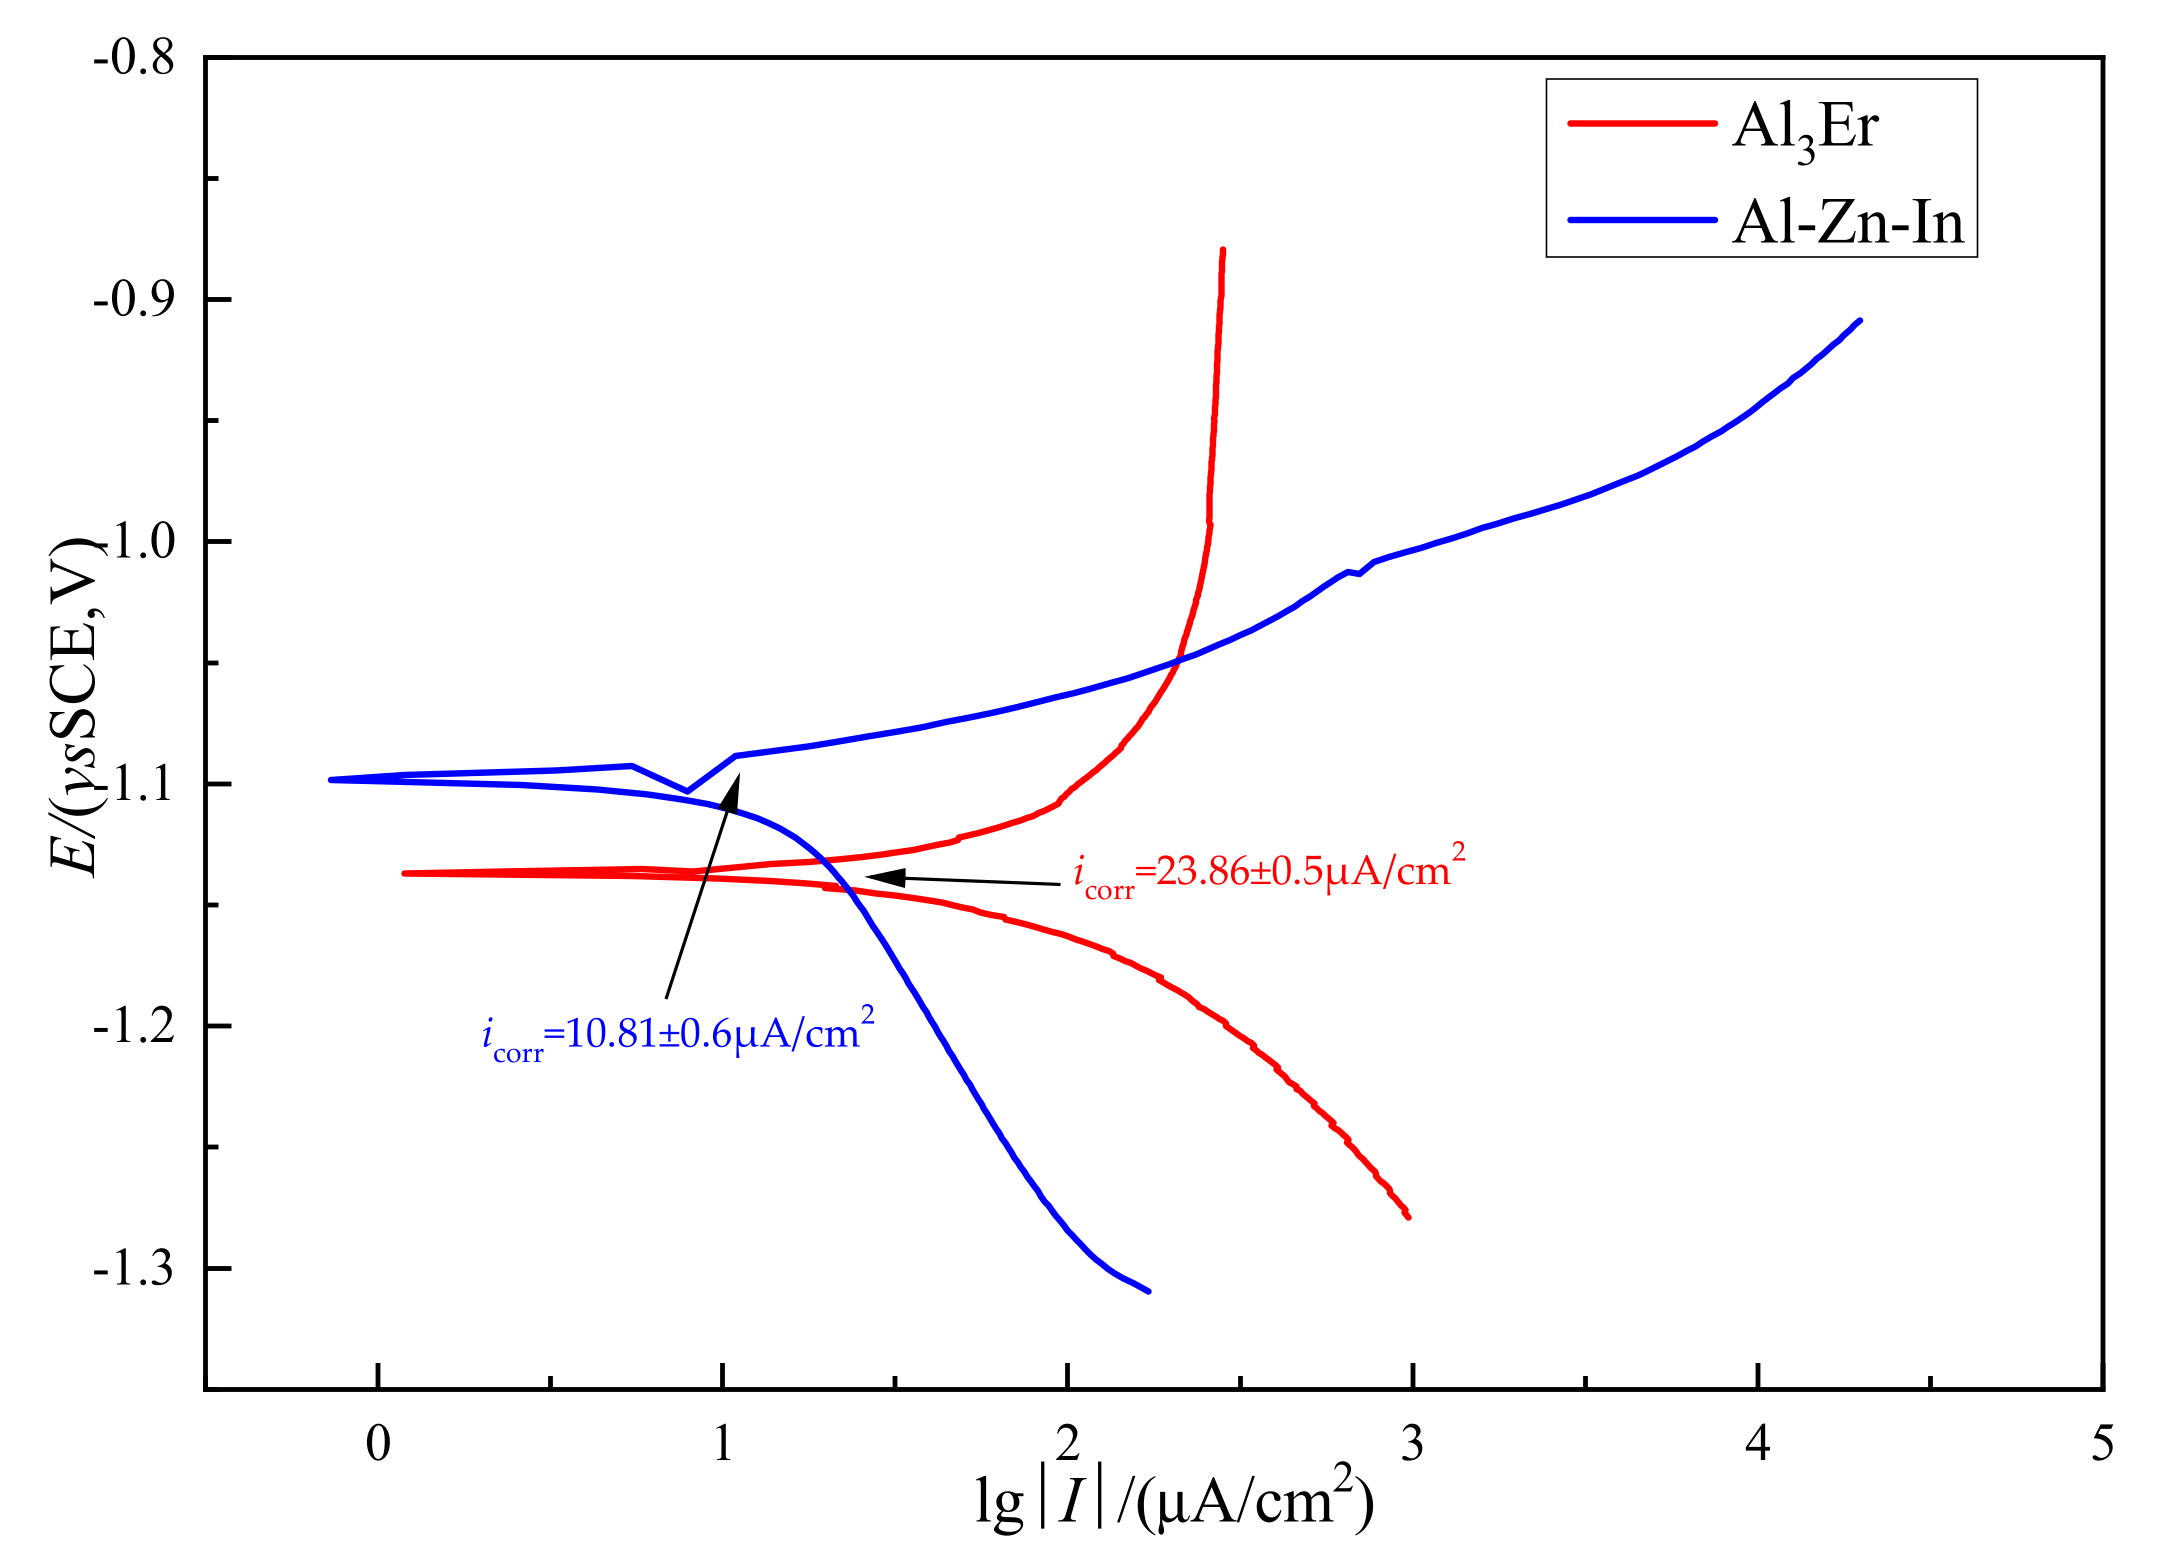
3.2.1. Polarization Curve Test of Al–5Zn–0.03In–xEr Alloy
Figure 6 shows the polarization curve of the Al–5Zn–0.03In–
xEr experimental alloy. With respect to the Al–5Zn–0.03In–
xEr alloy, the anodic polarization curve during electrode polarization reflects the rate of positive movement of alloy potential and its passivation trend when the current changes. Generally speaking, the lower the slope of the anode curve is, the lower the degree of polarization will be and the stronger the surface dissolution activity of the alloy will be. On the contrary, the higher the slope of the anode curve, the greater the degree of polarization will be, the stronger the tendency of passivation will be, and the lower the surface activity will be. The shape of the polarization curves of the Al–5Zn–0.03In–
xEr experimental alloy is generally similar, the anodic polarization trend of the alloy is weak, and there is no obvious passivation phenomenon. The anodic current density of the alloy increases rapidly with the increase in anodic polarization potential, indicating that the four components of the Al–5Zn–0.03In–
xEr alloy can be actively dissolved in the overpotential range of the polarization curve test.
The measured polarization curves were fitted by Echem Analyst software (Gamry Instruments, Warminster, PA, USA). The fitting values are shown in
Table 2, with the increase in Er content in the Al–5Zn–0.03In–
xEr alloy, the self-corrosion potential
Ecorr of the Al–5Zn–0.03In–
xEr alloy gradually moves positively, indicating that the increase in Er content decreases the activation properties of the Al–5Zn–0.03In–
xEr alloy.
When the Er content is in the range of 1 wt.%, with the increase in Er content, the alloy’s self-corrosion potential Ecorr moves positively, and the potential difference between Al–5Zn–0.03In and Al–5Zn–0.03In-1Er reaches 119.1 mV. When the Er content exceeds 1 wt.%, the positive move of the self-corrosion potential begins to slow down, and the potential difference between Al–5Zn–0.03In–1Er and Al–5Zn–0.03In–4Er is only 2.3 mV. Compared with the protection potential of steel (−850 mV), the Al–5Zn–0.03In–xEr alloy samples of all components have a lower corrosion potential than that of, which is still anode material compared to steel materials.
For most metal materials, the self-corrosion potential (Ecorr) represents the tendency of thermodynamics; a lower value of the self-corrosion potential means a greater corrosion tendency of the alloy in the electrochemical reaction. The self-corrosion current density (icorr) characterizes the kinetics of the alloy reaction, and its value is positively correlated with the corrosion rate of the material. The higher the self-corrosion current, the greater the corrosion tendency of the material will be. For specific alloy materials, the lower the Ecorr and the higher the icorr lead to a better anode performance and more obvious protection effect on the cathode material. However, if the self corrosion potential (Ecorr) is too low, the protected material will fall into “over protection state”, and the cathode material will have hydrogen evolution reaction, which seriously reduces the protection effect.
Combined with microscopic observation, the addition of Er can obviously improve the microstructure of the Al–5Zn–0.03In–xEr alloy, although it will cause a positive move of the Ecorr of the alloy’s self-corrosion potential. Thus, its potential is still within the applicable range. The decrease in self-corrosion current density reduces the reactivity of the alloy to some extent. On the other hand, the corrosion resistance of the alloy is enhanced, the service life of the Al–5Zn–0.03In–xEr alloy is prolonged, and the probability of current efficiency loss is reduced.
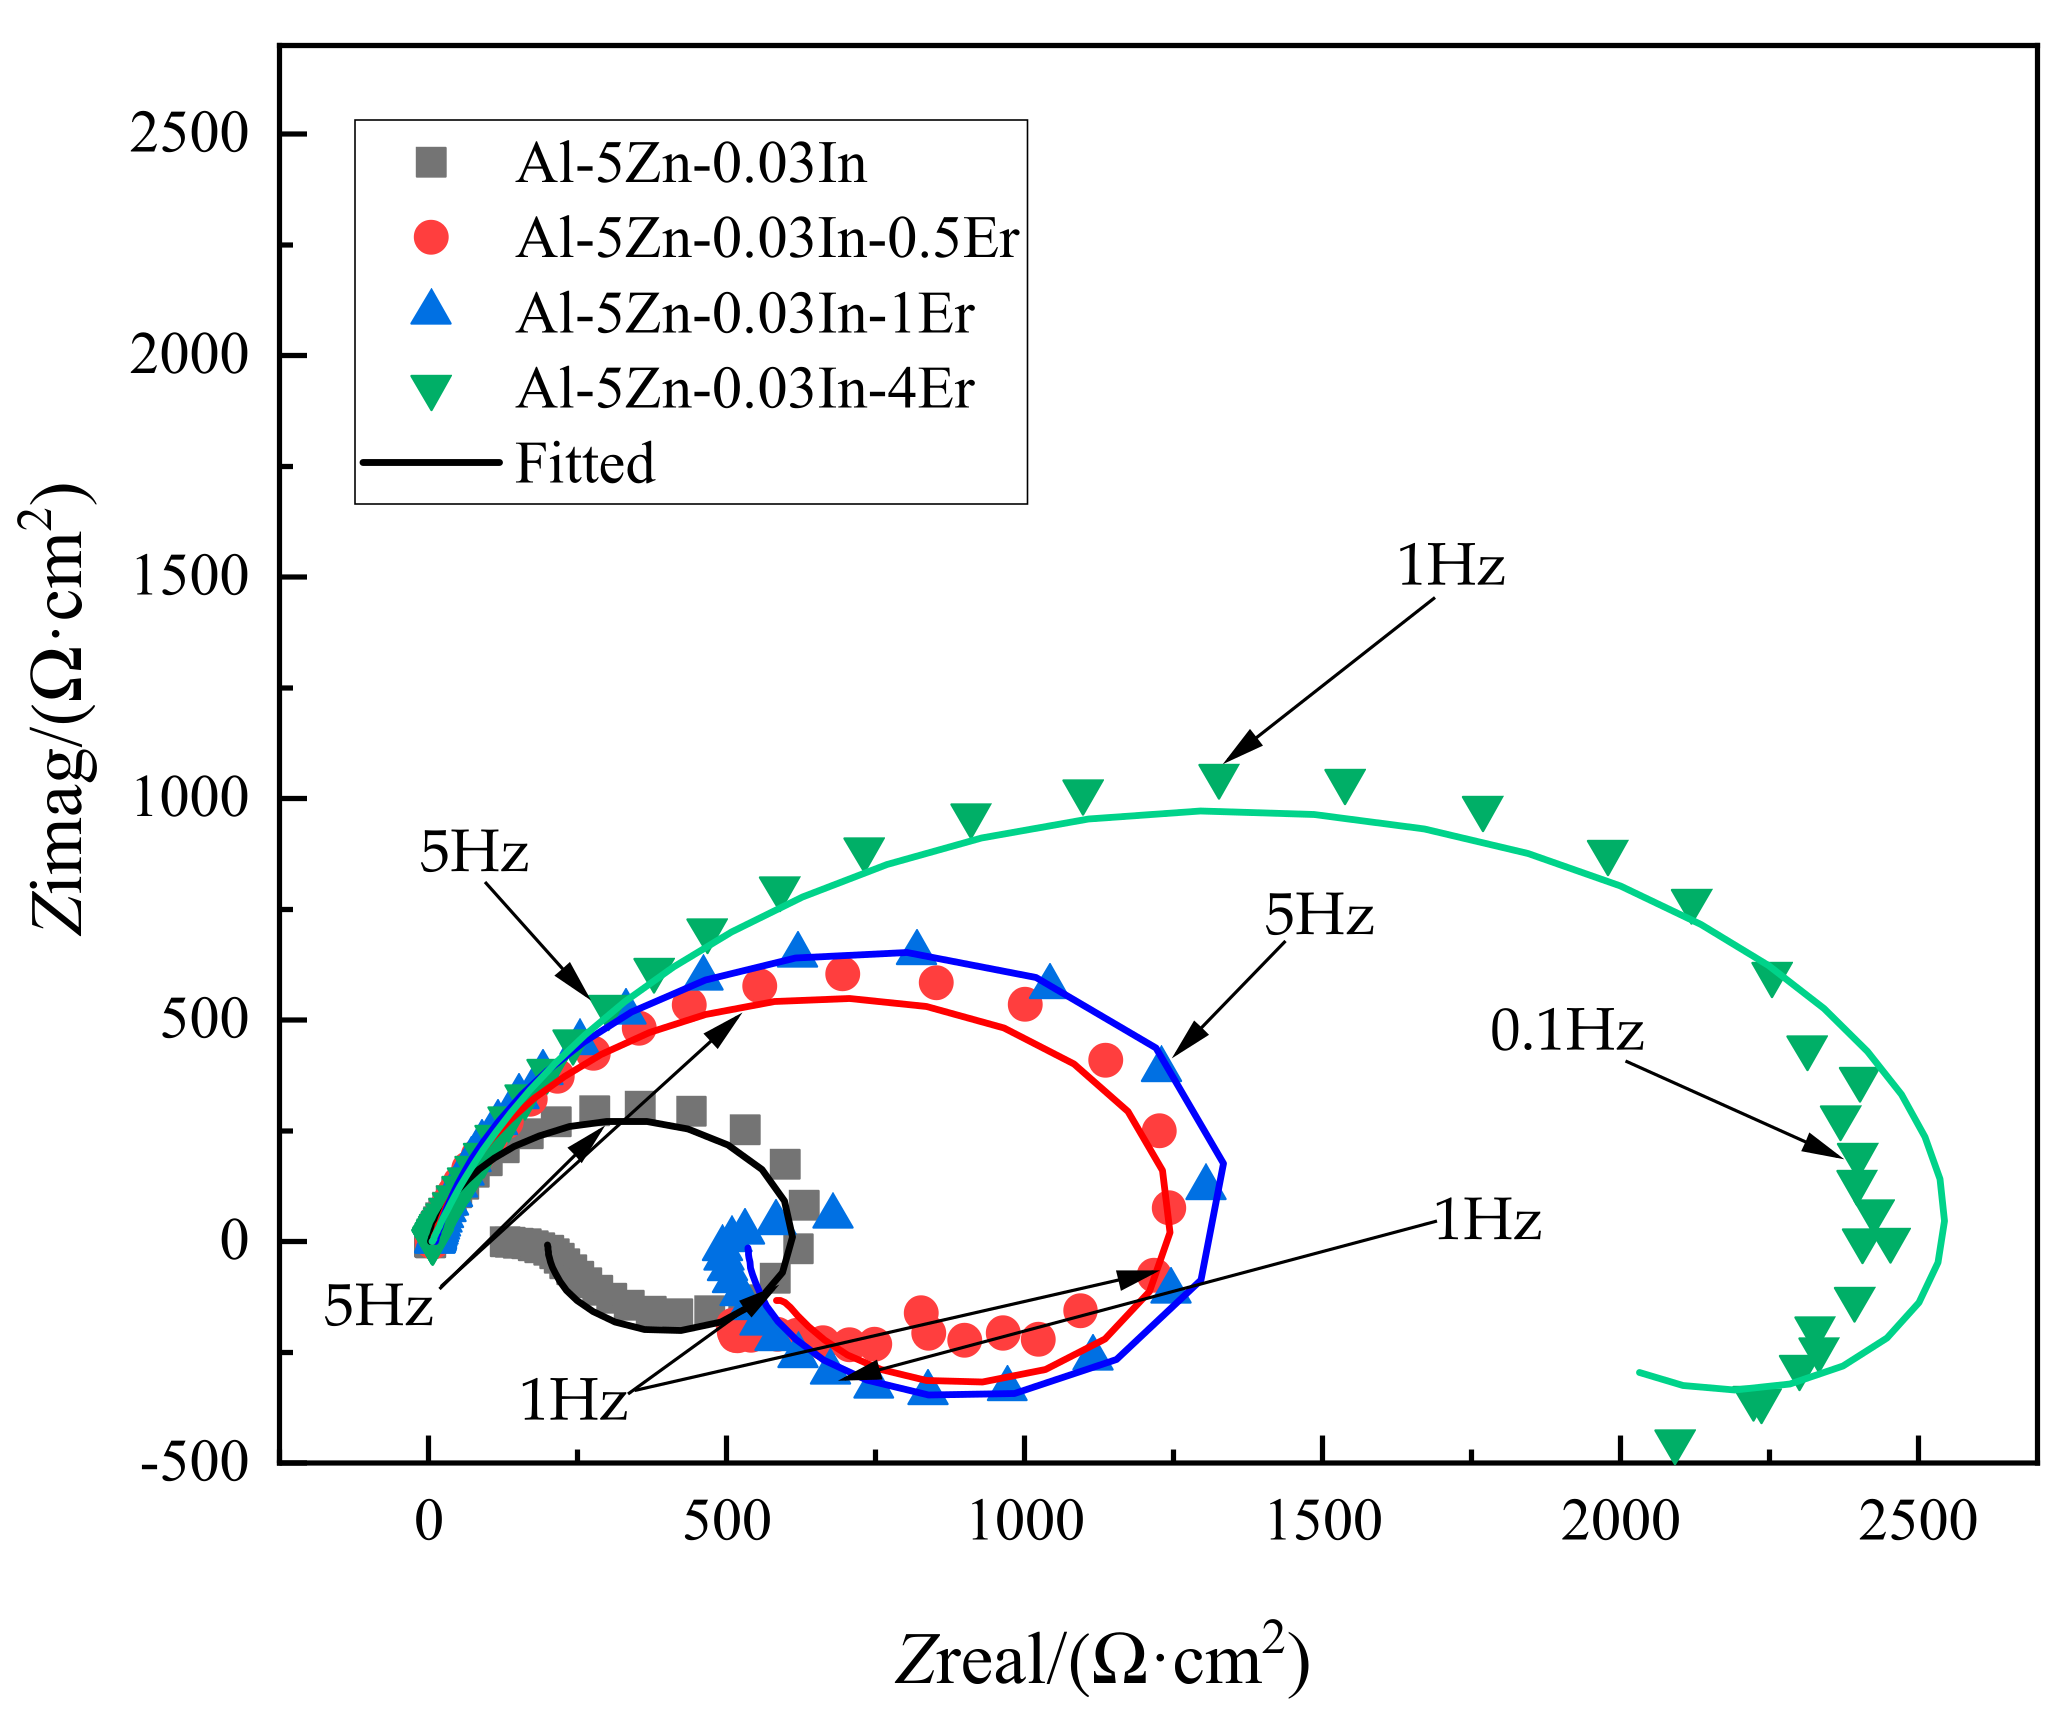
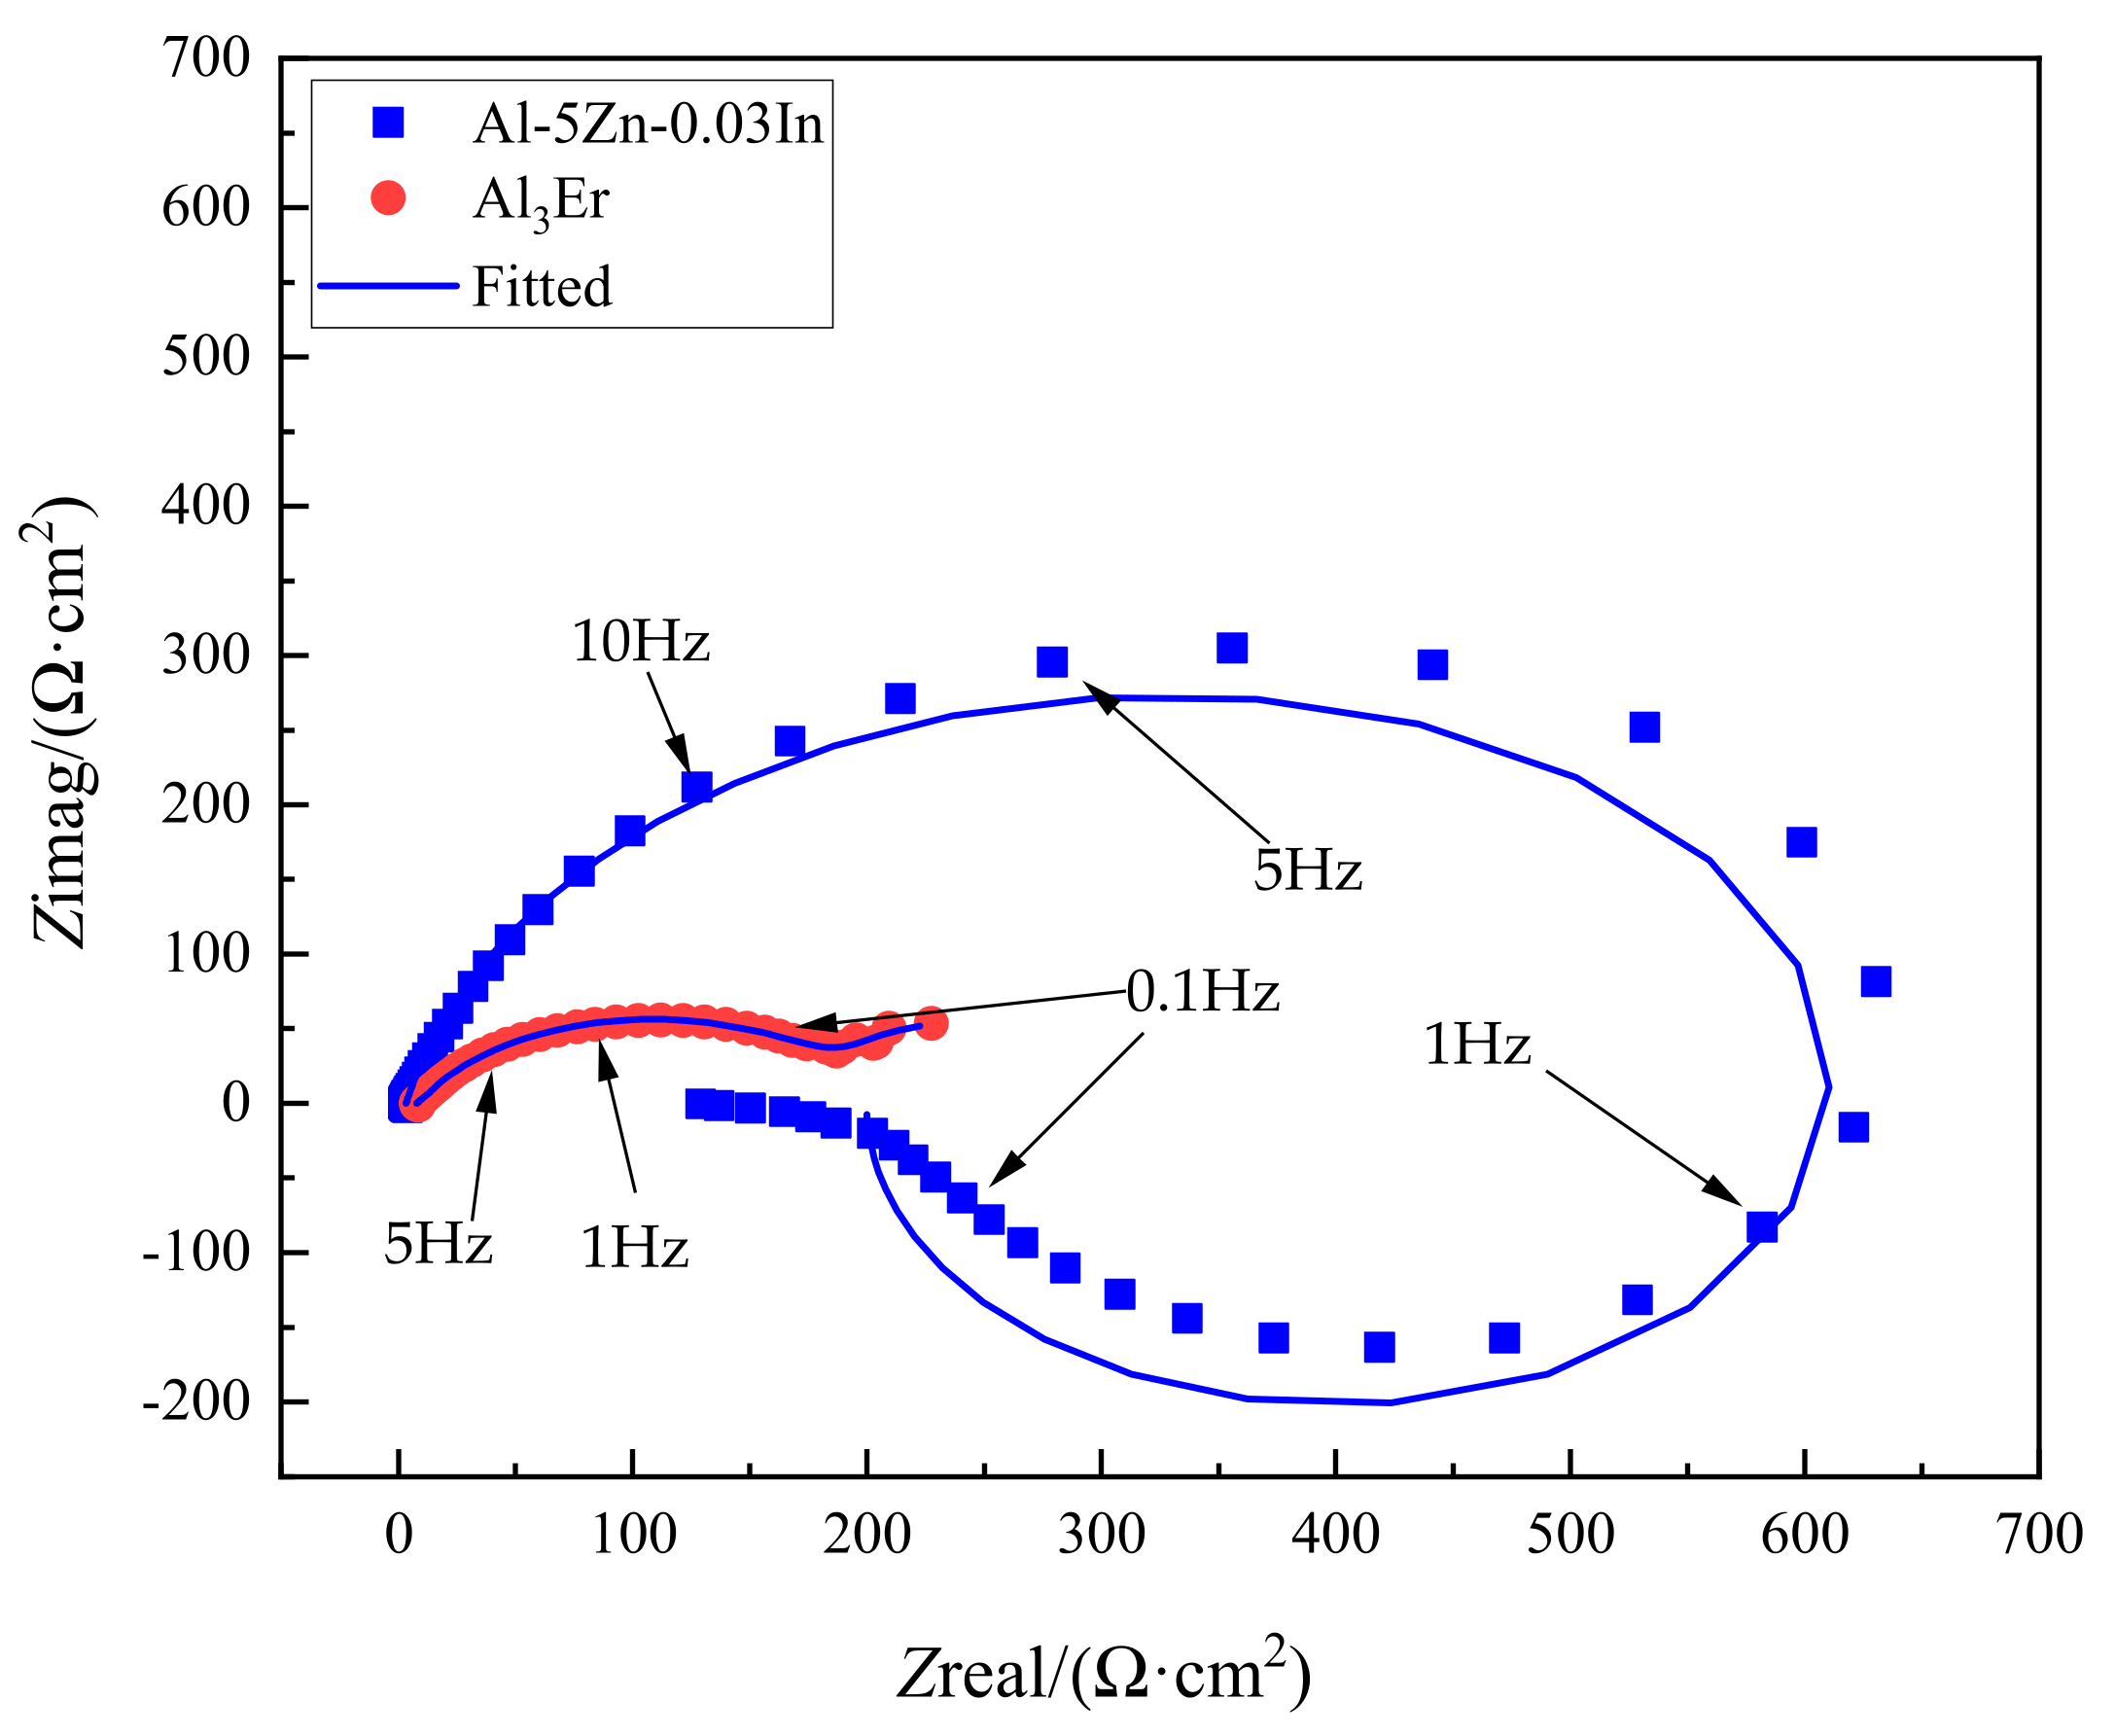
3.2.2. AC Impedance Test of the Al–5Zn–0.03In–xEr Alloy
The electrochemical impedance spectroscopy reflects the reaction kinetics information of the alloy material in the electrochemical dissolution process, which is the corrosion reaction mechanism of the alloy. It can be seen from
Figure 7 that the electrochemical impedance spectra of Al–5Zn–0.03In–
xEr alloys all show capacitive reactance arcs at high frequencies and inductive reactance arcs at low frequencies. According to the study of J.L.Ma et al. [
41], it can be considered that, if the shape of the electrical impedance spectrum is similar, the dissolution process of the experimental alloy is similar to, or even the same as, kinetic mechanism. Furthermore, the size of high-frequency capacitive arc resistance of four Al–5Zn–0.03In–
xEr alloys increases with the addition of the Er element. In summary, it can be concluded that the addition of Er has no effect on the electrochemical corrosion mechanism of the Al–5Zn–0.03In–
xEr alloy. In other words, the four alloys have the same corrosion kinetic mechanism in 3.5% NaCl solution, and the pitting corrosion is dominant. In the impedance spectrum, the low-frequency inductive reactance arc characterizes the pitting corrosion of the alloy. The pitting corrosion of the alloy is caused by the adsorption of corrosive anion Cl
− on surface defects, such as dislocations and precipitation [
42]. In this paper, it can be considered that the interaction between in
+ and electrons in oxidation increases the defects in the oxide film, and these defects are mainly distributed at the thermodynamically unstable grain boundary and precipitated phase interface. The addition of Er will refine the dendrite structure, increase the interface area, and increase the number of precipitated phases, which further promotes the adsorption process of Cl
− on the surface, resulting in typical pitting characteristics of the anode alloy, and a complete inductive reactance arc appears at low frequency in the electrochemical impedance spectrum.
The addition of Er changes the impedance value of the Al–5Zn–0.03In–xEr alloy. With the increase in Er content, the impedance value of the Al–5Zn–0.03In–xEr alloy increased gradually. The original surface of the alloy without Er element is covered with a very thin passivation film, but due to the existence of Zn, the oxidation film is relatively loose, and the presence of In increases the activity of the alloy. In addition, the charge transfer resistance become smaller, the relaxation process of double-layer capacitance is weaker, and the radius of capacitive arc curvature is smaller. With the increase in Er content, the segregation of Zn decreases, and Er itself is enriched in the interdendrite, which refines the alloy dendrite on the one hand. Additionally, the segregation phase increases and distributes evenly, and the alloy dissolves evenly. The addition of Er increases the transfer resistance of the alloy in the electrochemical process of the solution system, strengthens the bilayer capacitance relaxation process, and increases the radius of capacitive arc curvature. Compared with the alloy without Er, the dissolution rate of the alloy with Er is slowed down, and the corrosion resistance of the alloy is improved, which is consistent with the fitting results of the polarization curve.
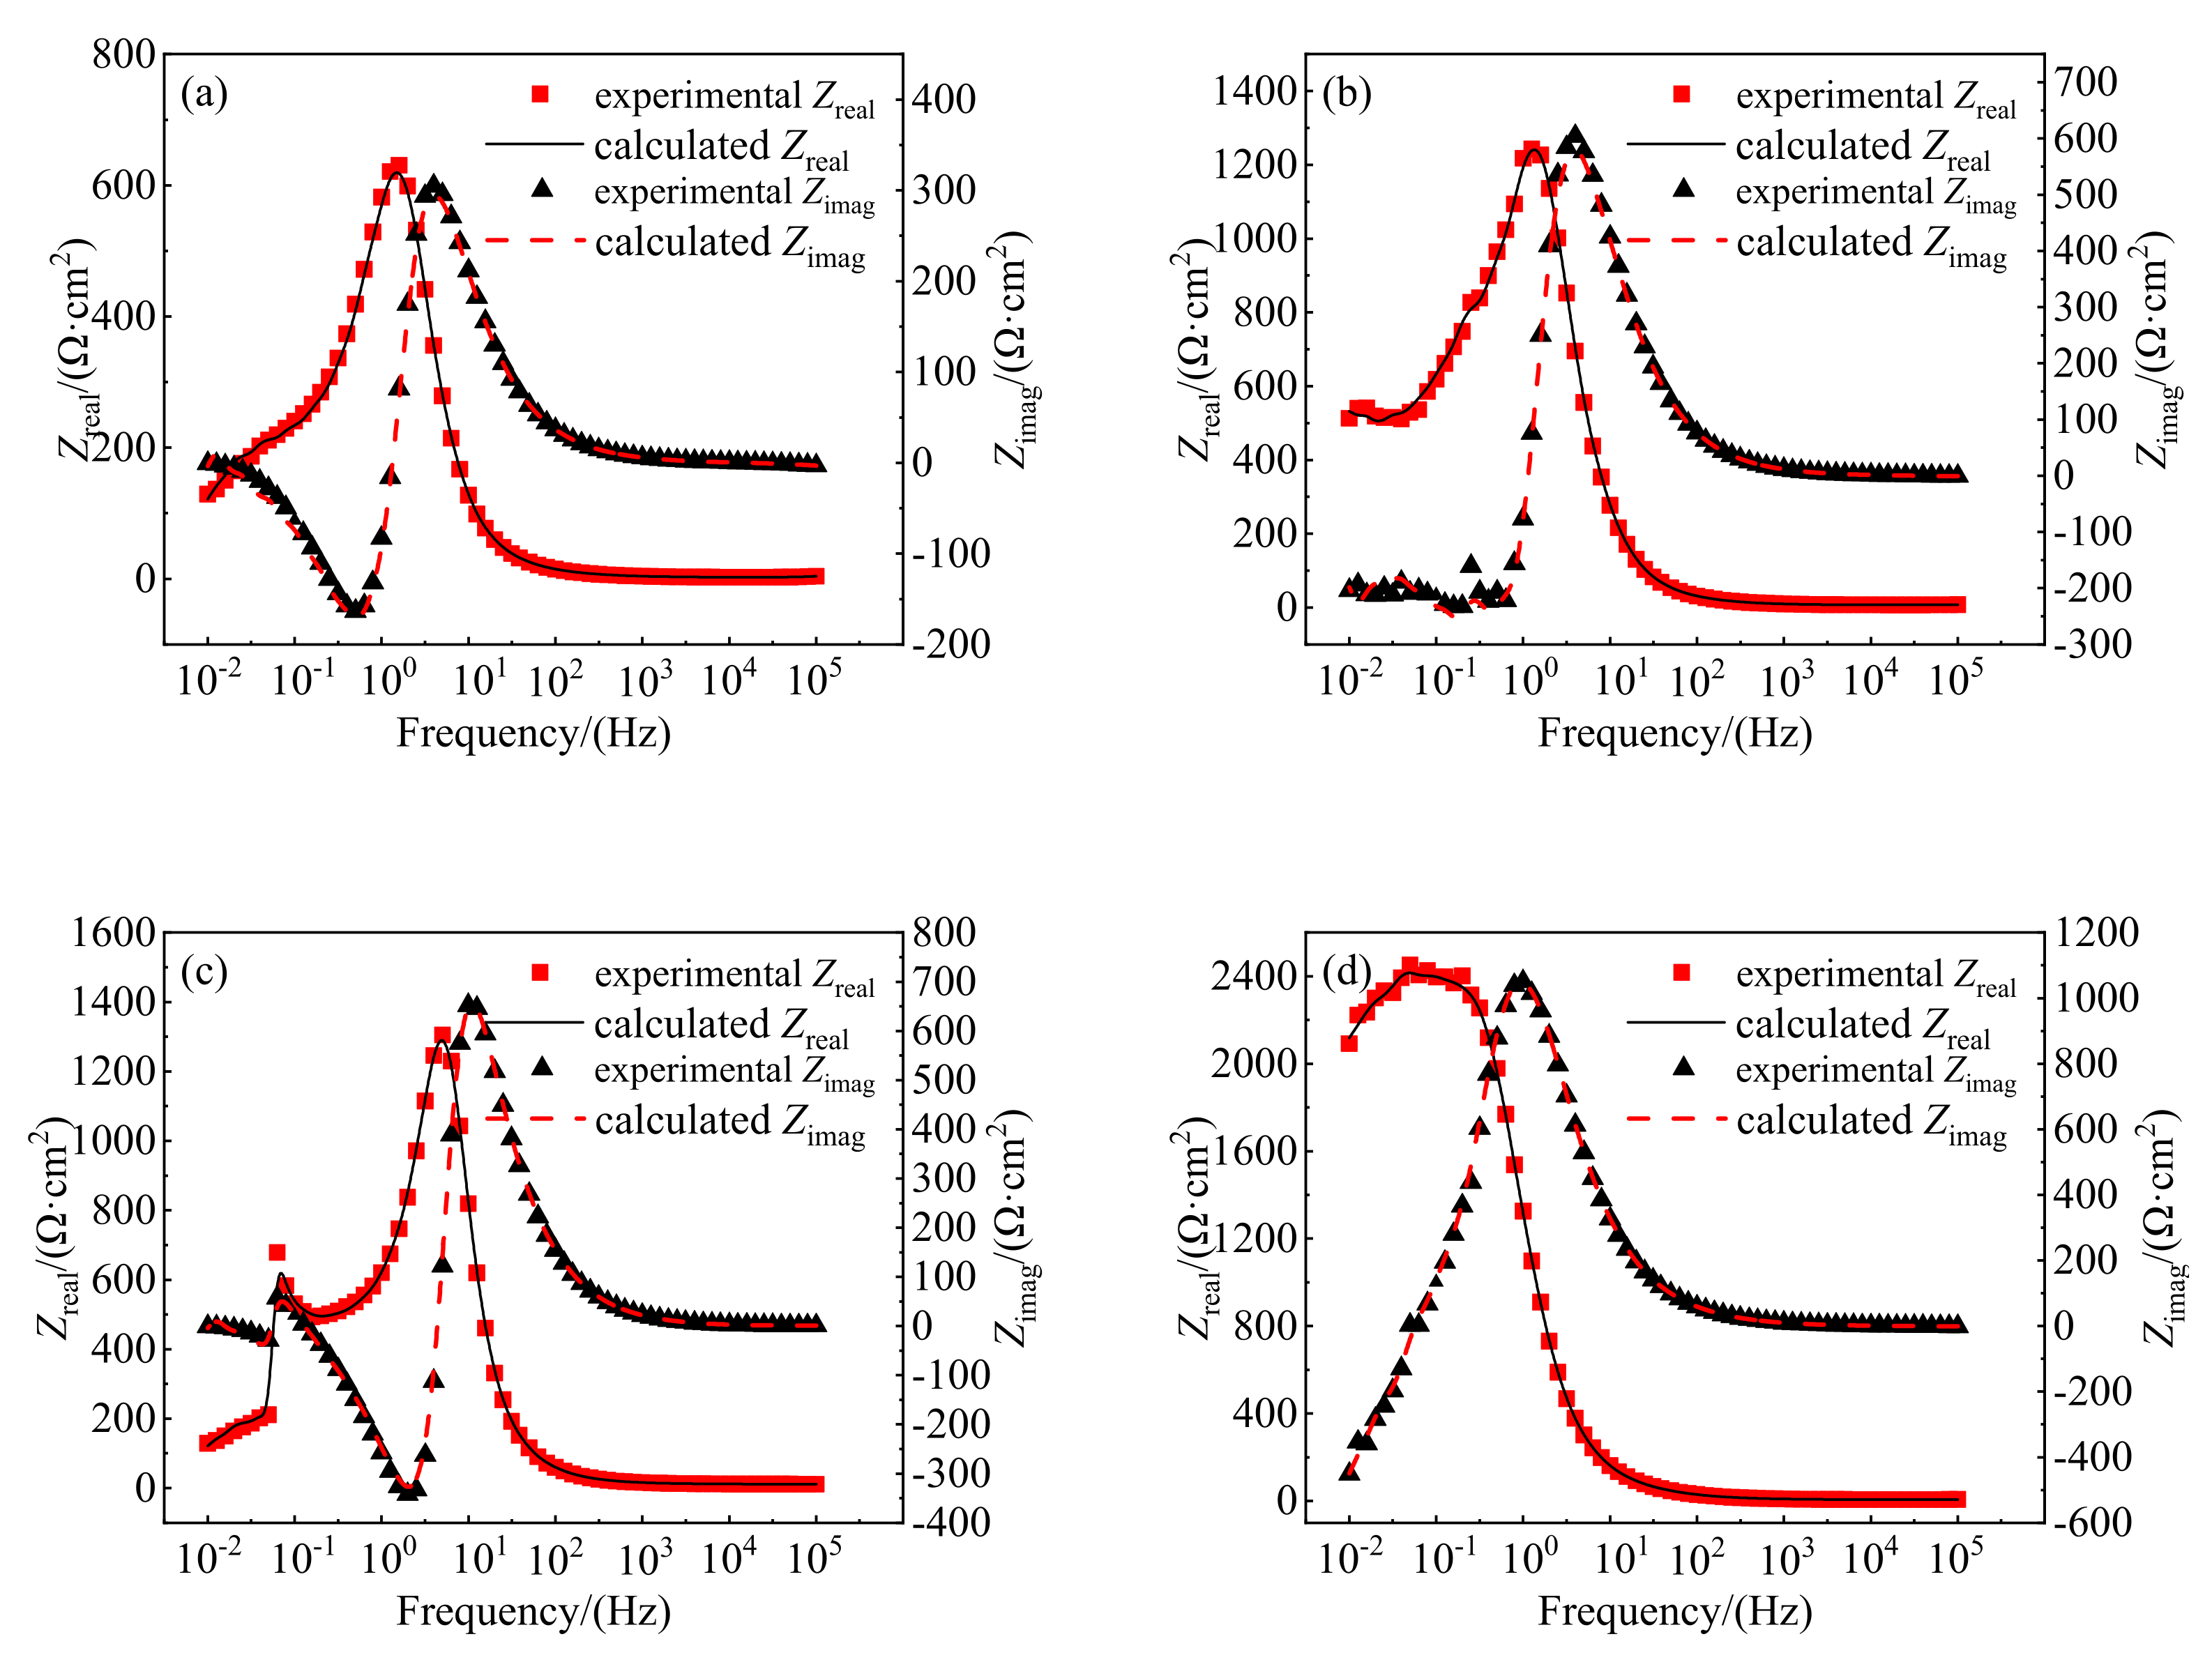
After the AC impedance (EIS) test, the reliability of the measured data shall be verified before further data analysis. According to Kramers–Kronig (K-K) rules [
43,
44,
45], the experimental impedance data were evaluated using Echem Analyst software.
Figure 8 shows the K-K conversion results of the real part (Zreal) and imaginary part (Zimag) of the test data. The K-K curve is highly consistent with the experimental results, as seen in
Figure 8, which indicates that the electrochemical impedance data obtained in this study are reliable and can be used for further analysis.
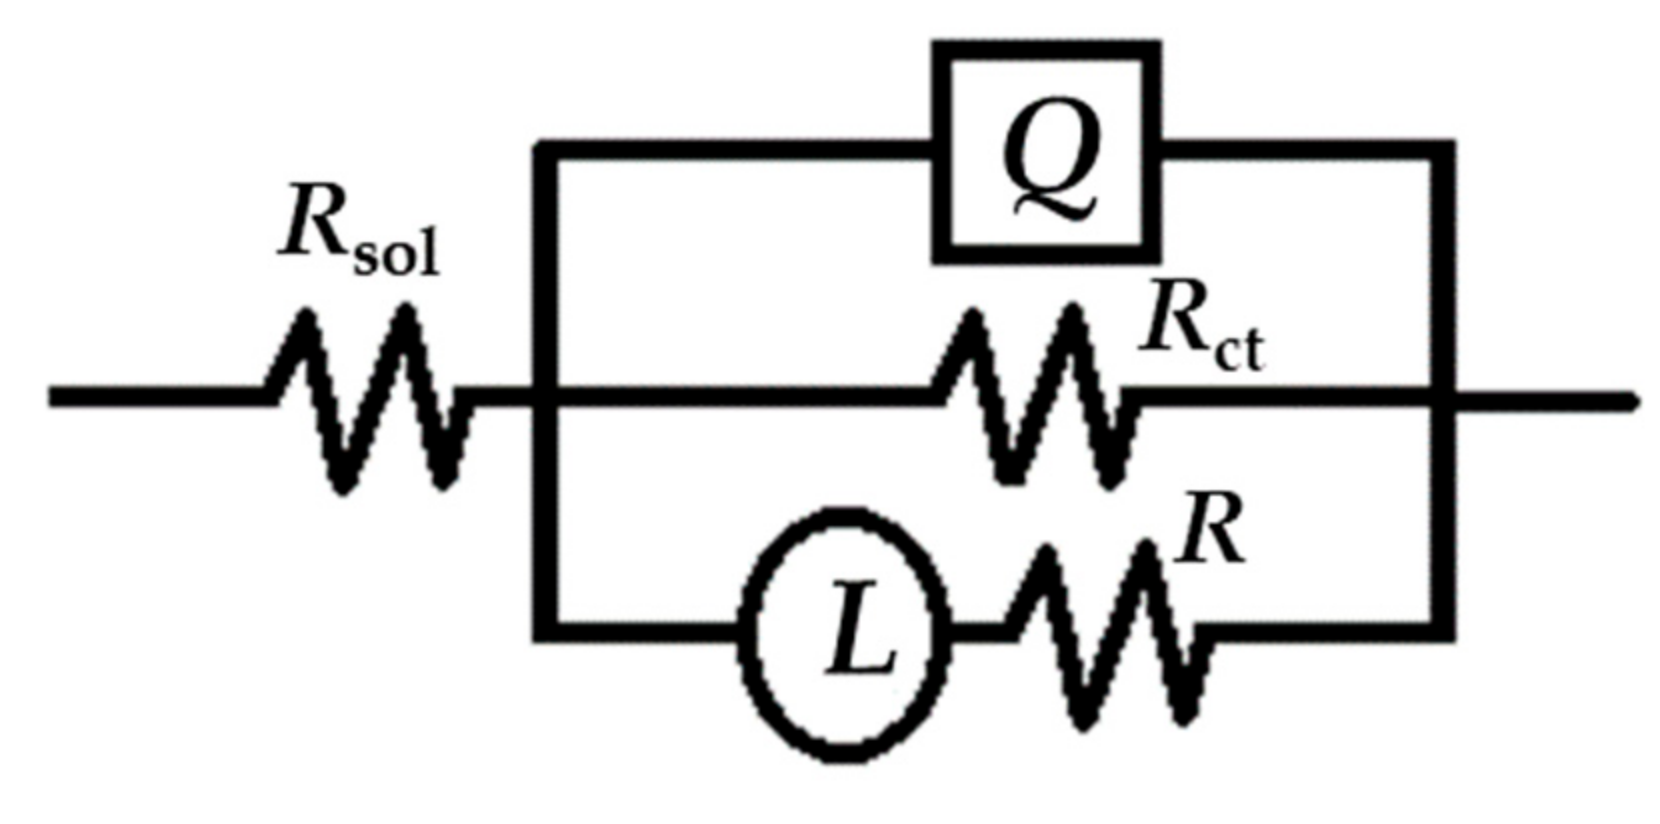
The equivalent circuit fitting of the electrochemical impedance spectrum of Al–5Zn–0.03In–
xEr is carried out using the ZSimpwin software (AMETEK, Oak Ridge, TN, USA), and the results are shown in
Figure 9. When fitting the equivalent circuit of the electrochemical impedance spectrum of the alloy, the three electrical components commonly used are resistance
R, capacitance
C, and inductance
L.
Figure 9 is described by circuit symbol
Rsol (
QRct (
LR)), where
Rsol represents the resistance of the solution,
Rct represents the charge transfer resistance between the electric double layers on the alloy surface,
Q is K-K curve constant phase element, and the range of parameter
n is −1~1. When
n = 1,
Q is equivalent to a capacitive element, when
n = 0,
Q is equivalent to a resistive element, and when
n = −1,
Q is equivalent to an inductive element.
R represents the diffusion resistance of pitting corrosion, i.e., the resistance to the diffusion of intermediate products, and
L represents the adsorption behavior of intermediate corrosion products.
Table 3 shows the values of the equivalent elements fitted by the equivalent circuit
Rsol (
QRct (
LR)). It can be seen from
Table 3 that all of the solution resistance
Rsol of the four Al–5Zn–0.03In–
xEr alloys is less than 10 Ω cm
2. Thus, it can be considered that the solution resistance has a limited effect on the dissolution process of the alloy. Generally speaking, the charge transfer resistance
Rct of the alloy is inversely proportional to the corrosion current of the alloy; thus, the smaller the charge transfer resistance
Rct, the faster the corrosion rate of the alloy.
It can be seen that the charge transfer resistance of the Al–5Zn–0.03In–xEr alloy Rct increases with the increase in Er content. The charge transfer resistance Rct of the Al–5Zn–0.03In alloy without Er is the smallest, only 684.1 Ω·cm2. The charge transfer resistance (Rct) of Al–5Zn–0.03In–0.5Er, Al–5Zn–0.03In–1Er, and Al–5Zn–0.03In–4Er alloys with Er addition is 1356 Ω cm2, 1801 Ω cm2, and 2528 Ω cm2, respectively. Moreover, the value raises with the increase in Er content, which was consistent with the fitting result of polarization curve that the corrosion resistance of the alloy is enhanced. In addition, the service life of the Al–5Zn–0.03In–xEr alloy is prolonged, and the probability of current efficiency loss is reduced.
3.2.3. Electrochemical Properties
Table 4 shows the electrochemical properties of the alloys with various Er contents, compared with Al–5Zn–0.03In without Er. The open circuit potentials of the other three groups of samples with Er were all positively shifted to different degrees, and the open circuit potentials ranged from −960mV to ~1150 mV.
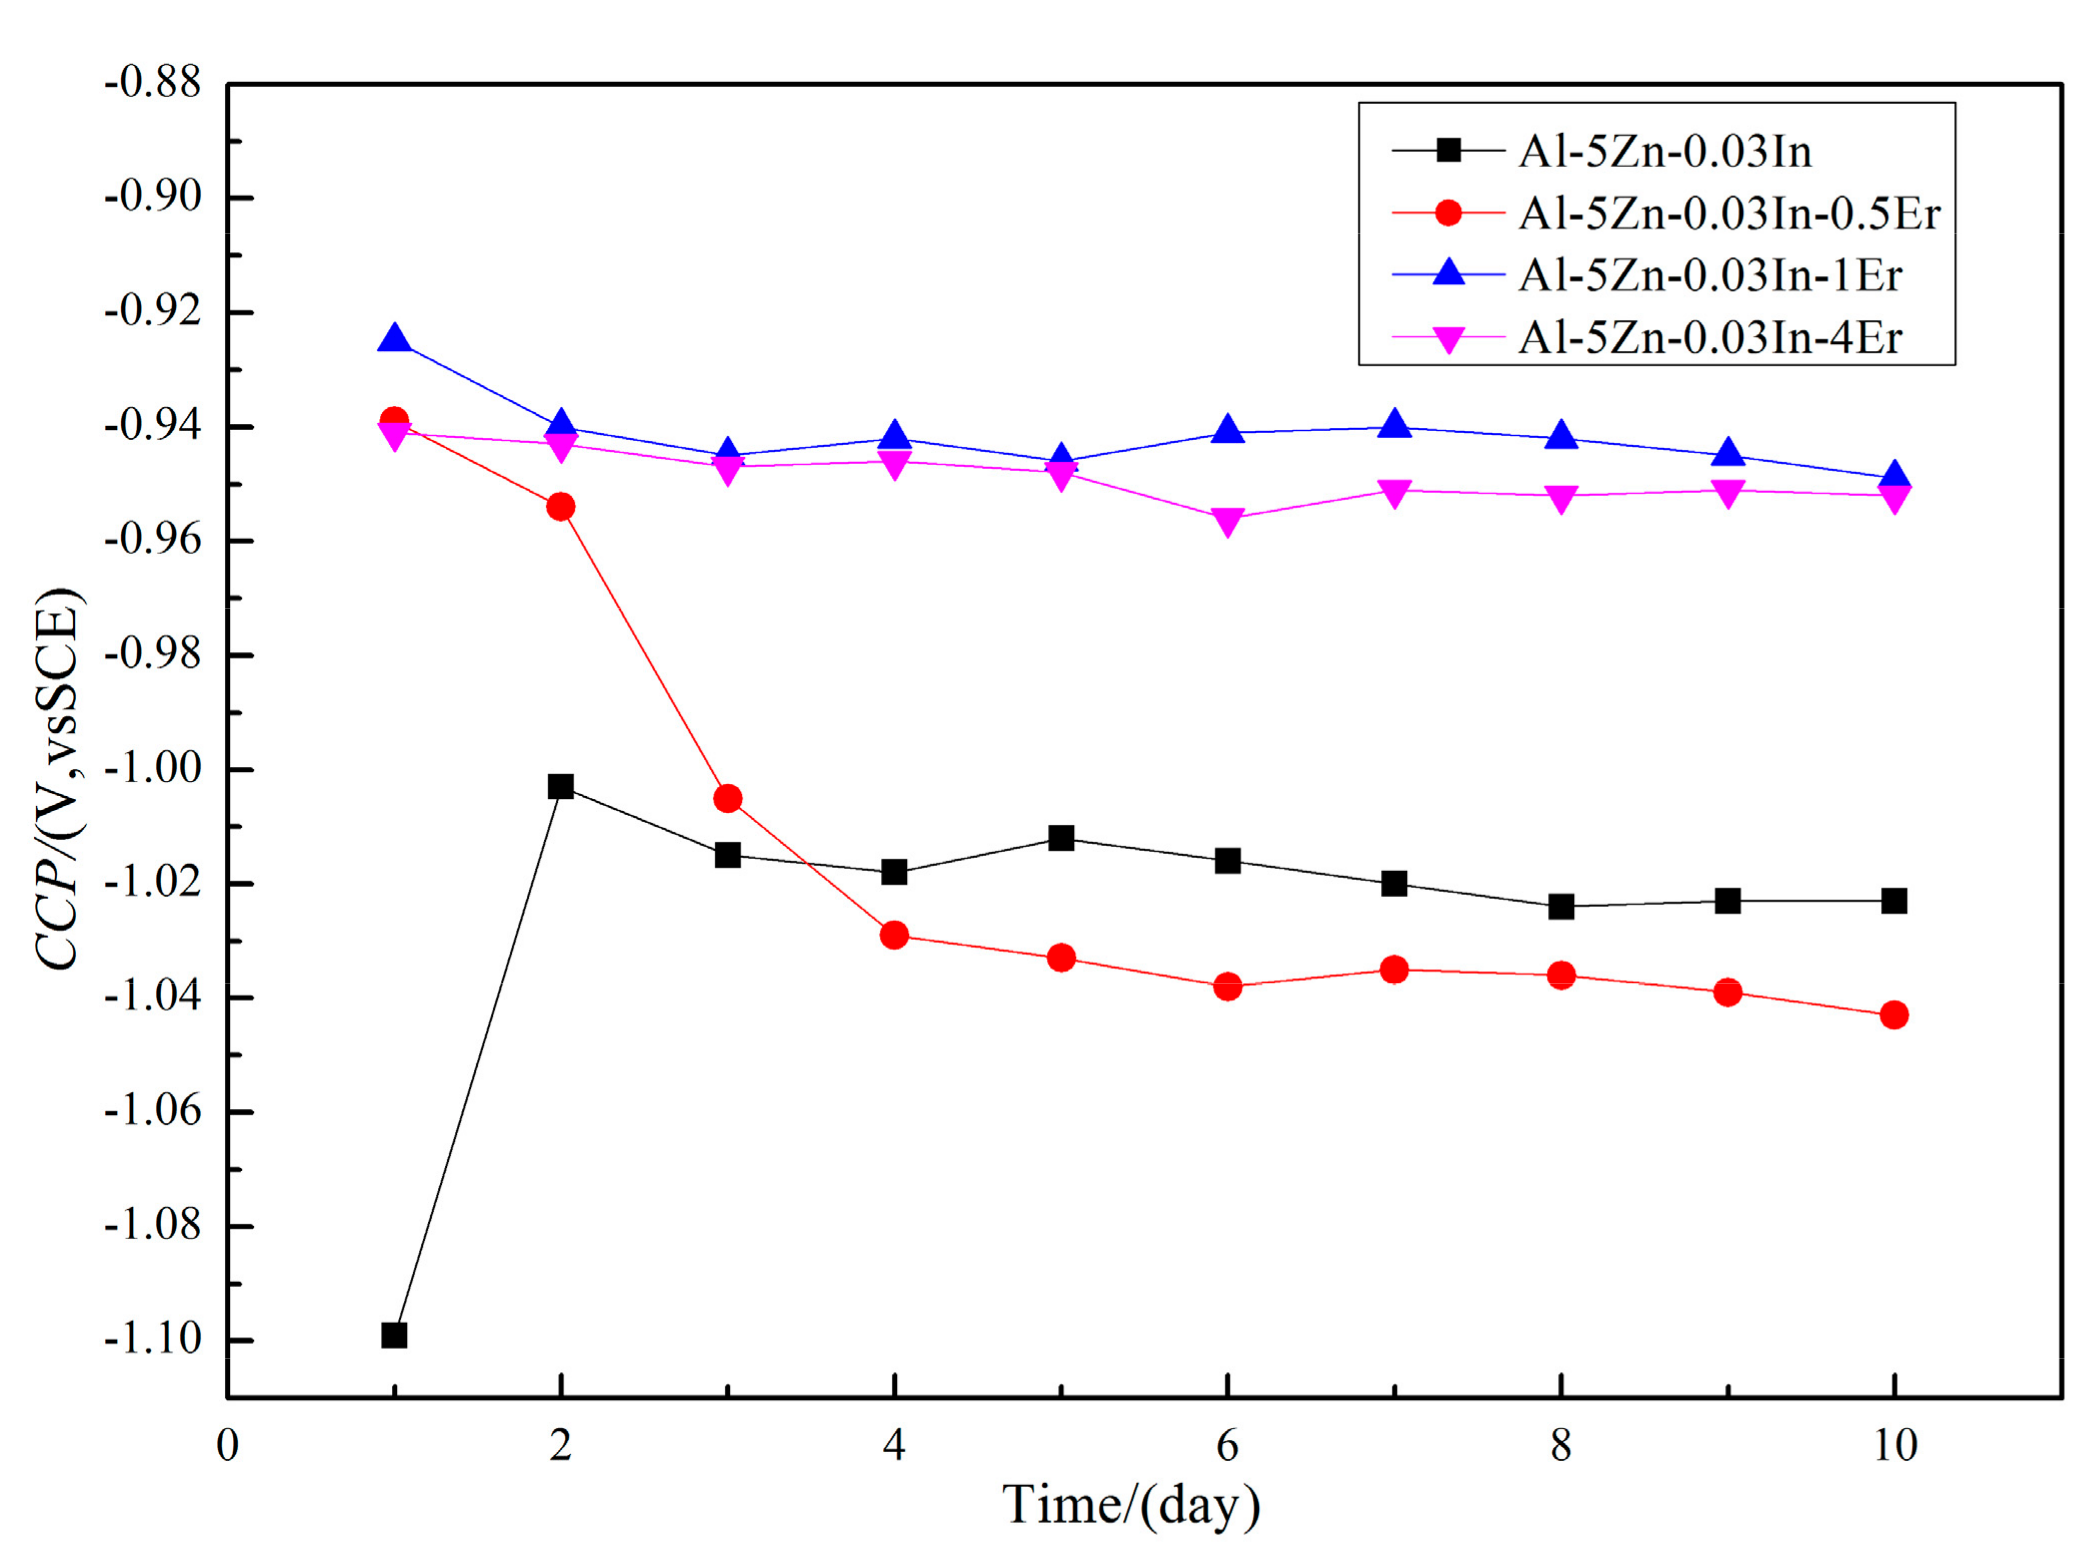
The working potential of the Al–5Zn–0.03In–
xEr alloy after galvanostatic current has a relatively positive shift compared with its open circuit potential.
Figure 10 shows the variation trend of the working potential of the Al–5Zn–0.03In–
xEr alloy with time. It can be seen that, compared with the initial experiment using an extended immersion time, the working potential of most Al–5Zn–0.03In–
xEr alloy has a positive trend. Since the Al–5Zn–0.03In–
xEr alloy was exposed to static artificial seawater during the whole experiment, in the corrosion process of the alloy, the corrosion products cannot quickly diffuse into the experimental solution, and the concentration of corrosion products in the solution also increases with the extension of time. Therefore, the adsorption phenomenon of corrosion products will appear on the surface of the Al–5Zn–0.03In–
xEr alloy, which is the main reason for the positive shift of the working potential of the alloy. The working potential of Al–5Zn–0.03In–1Er and Al–5Zn–0.03In–4Er alloys has a significantly positive shift after electrification, but the fluctuation of the working potential was small. The working potential of Al–5Zn–0.03In and Al–5Zn–0.03In–0.5Er alloys was negative and kept below −1 V for most of the time. However, its working potential fluctuates more seriously at the beginning of electrification and gradually stabilizes after a period of electrification.
The theoretical capacitance of Al, Zn, In, and Er are 2980 A/(h·kg), 820 A/(h·kg), 700 A/(h·kg), and 481 A/(h·kg). The low theoretical capacitance of Er may be the reason of theoretical capacitance decrease in the experimental alloy with Er contents.
Generally, the current efficiency of the anode alloy is calculated as follows:
where
Q0 is the theoretical capacitance of anode,
A·h/kg;
A,
B,
C represent the percentage of alloying elements %;
X,
Y,
Z represent the theoretical capacitance of alloying elements,
A·h/kg.
Actual capacity:
where
Q is the actual capacity of anode,
A·h/kg;
C is total amount of electricity passed during the test cycle, A·h;
m1 represents the quality of a sample before testing, g;
m2 represents the quality of a sample before testing, g.
Calculation of current efficiency:
where
η is the current efficiency of anode alloy, %.
According to the current efficiency formula, the current efficiency is the quotient of the actual capacitance and the theoretical capacitance; thus, the lower the theoretical capacitance is, the higher the current efficiency is. However, due to the actual addition of Er changes in the microstructure morphology of the alloy, its actual capacity will also change, so the actual current efficiency of the alloy must be determined by experiment.
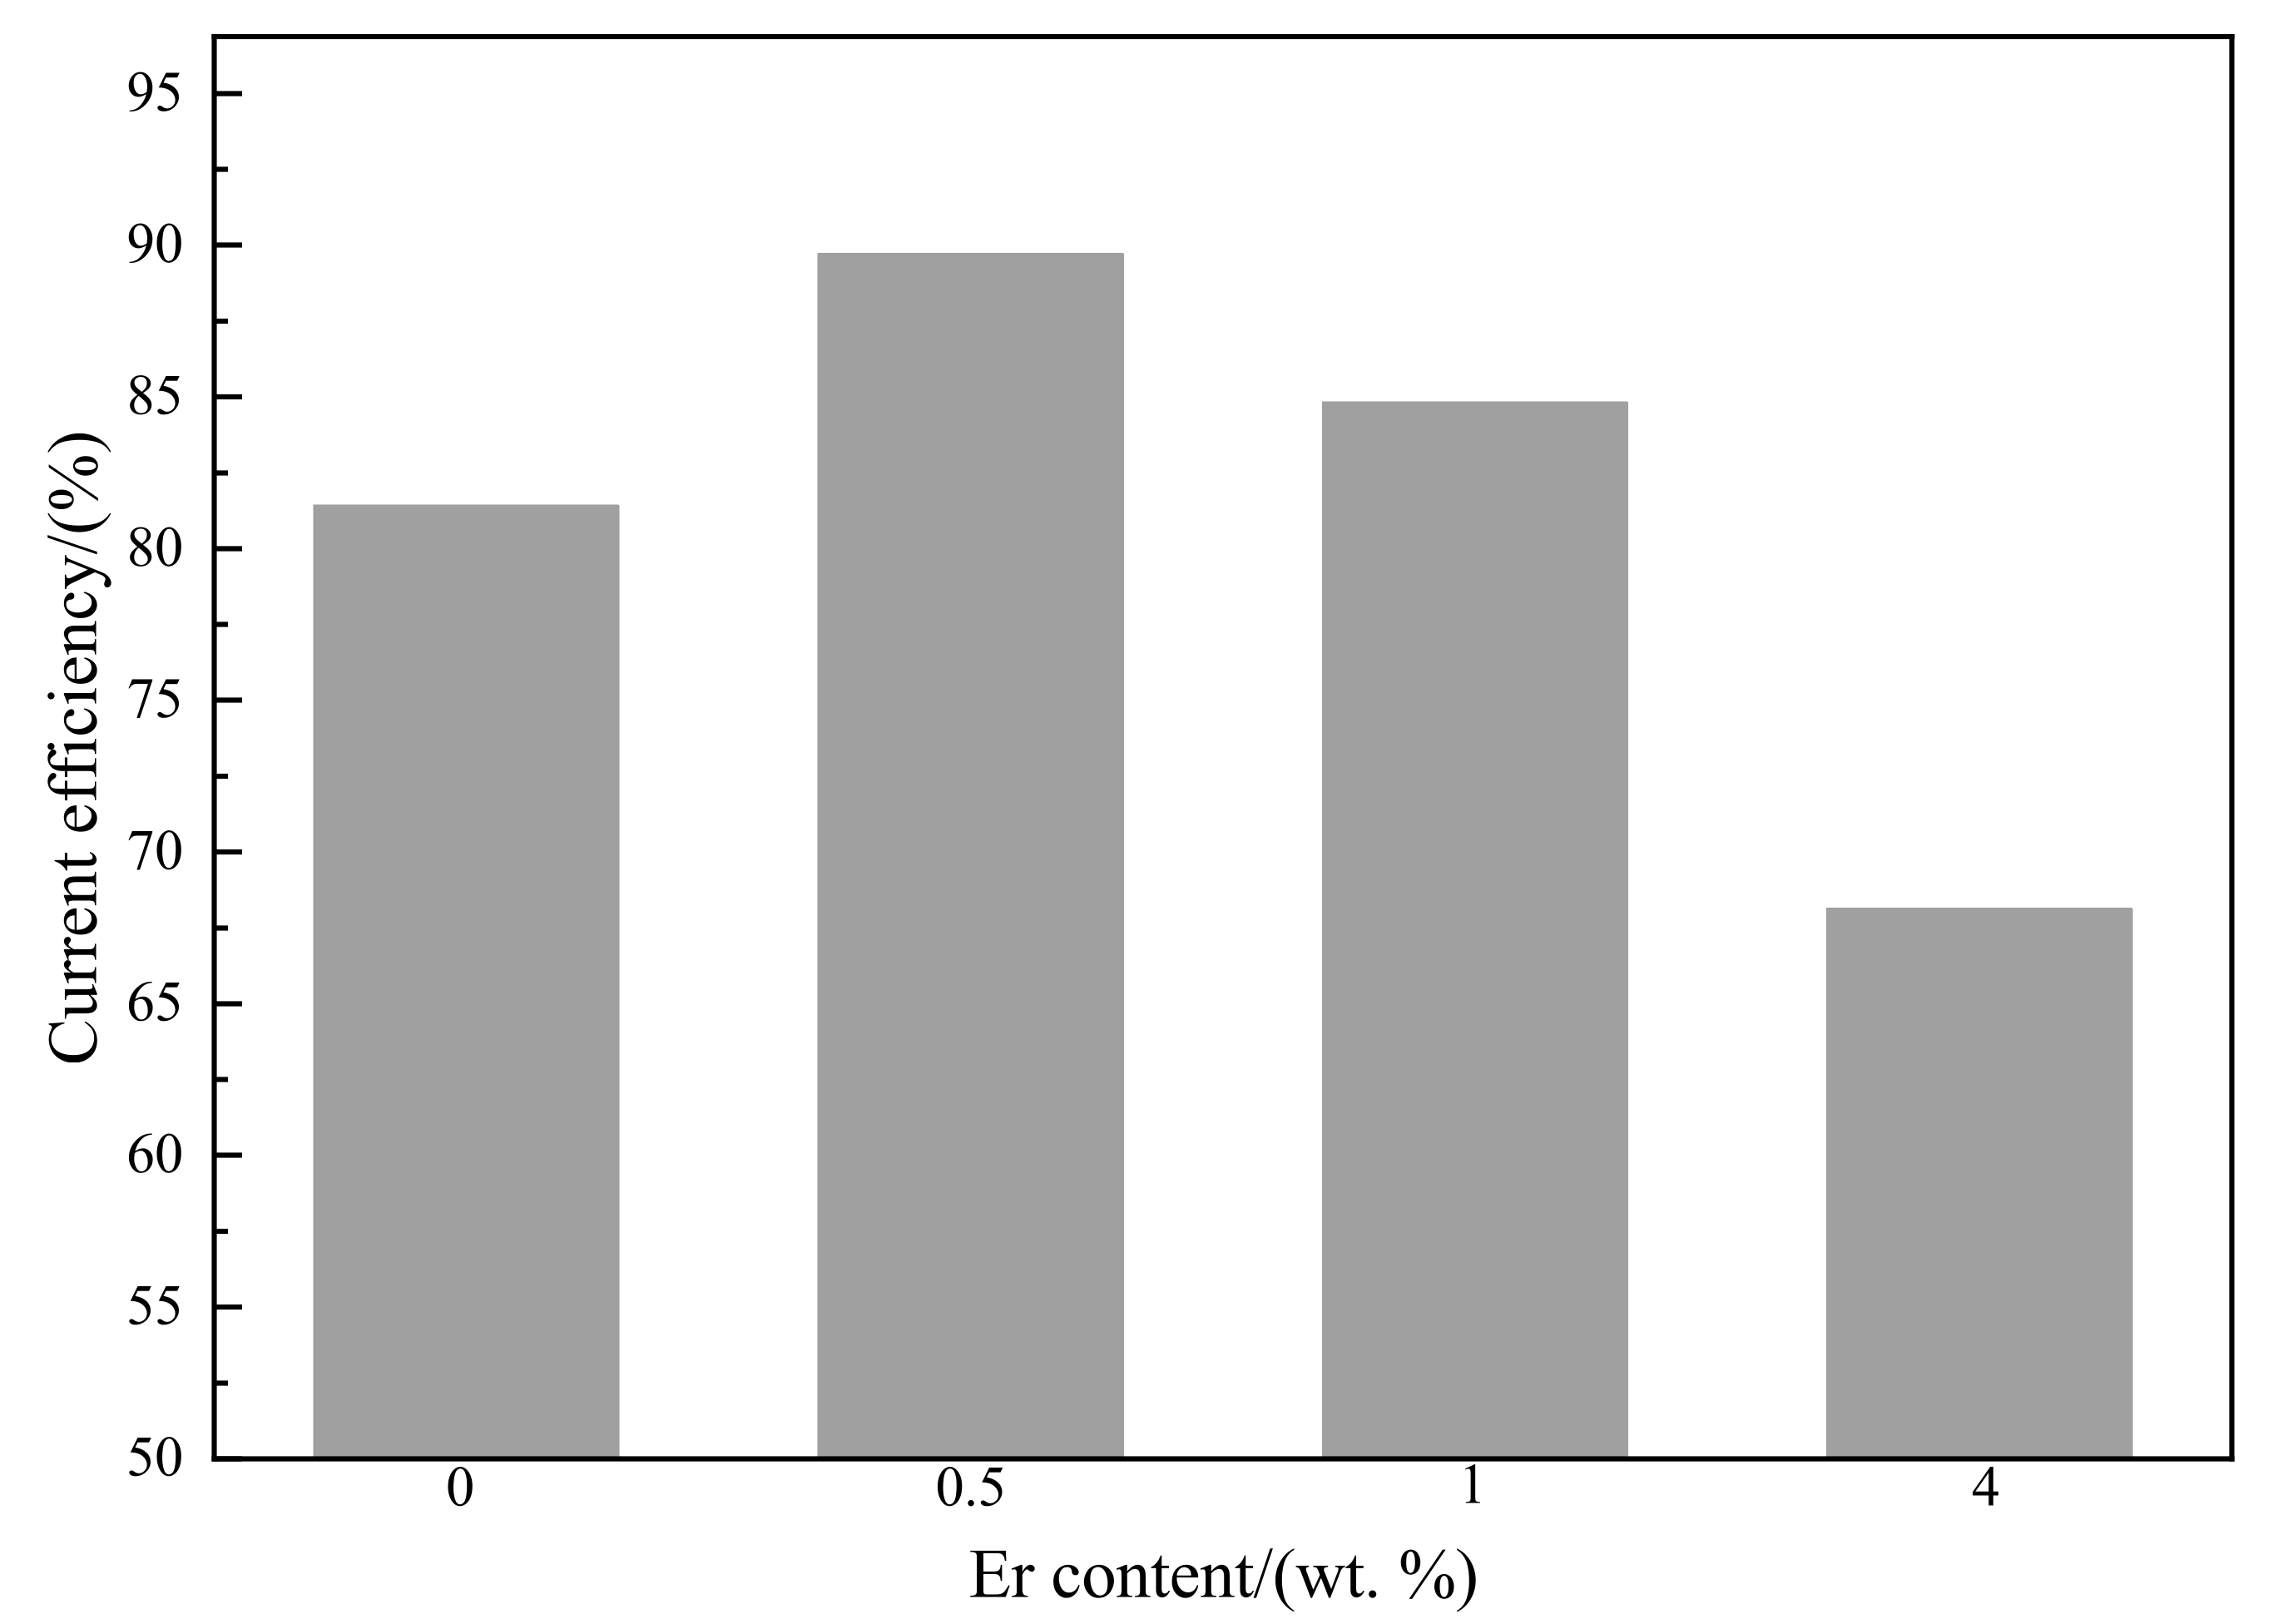
Figure 11 shows the histogram of current efficiency of the Al–5Zn–0.03In–
xEr alloy. The current efficiency of the Al–5Zn–0.03In–0.5Er alloy is the highest, and that of the Al–5Zn–0.03In–4Er alloy with the most Er addition is the lowest (only 68.1%). It can be seen that the addition of a small amount of Er can increase the current efficiency of the Al–5Zn–0.03In–
xEr alloy. When the addition amount of Er reaches 1%, the increase in current efficiency decreases. However, when the addition amount of Er is too high, the current efficiency of Al–5Zn–0.03In–
xEr alloy decreases significantly. A small amount of Er can refine the grain size of Al–5Zn–0.03In–
xEr alloy, improve its dissolution uniformity, and enhance the current efficiency of the alloy. At this time, grain refinement is the main factor affecting the current efficiency of the Al–5Zn–0.03In–
xEr alloy. When excessive Er exists as the form of intergranular segregation in the Al–5Zn–0.03In–
xEr alloy, the self-corrosion and grain shedding of Al–5Zn–0.03In–
xEr alloy increase, and the preferential dissolution of Er-rich precipitates leads to the loss of current efficiency.
Through the above comprehensive analysis, when the Er content is about 1%, the microstructure of the alloy has been remarkably refined, the surface dissolution is improved, and the current efficiency is increased. Although the current efficiency of Al–5Zn–0.03In–1Er is slightly lower than that of Al–5Zn–0.03In–0.5Er, the higher corrosion resistance prolongs the service life of the alloy, which saves the cost and avoids potential safety hazards caused by alloy failure in use.


 ,
, 


