Article

Characterisation of Compressive Behaviour of Low-Carbon and Third Generation Advanced High Strength Steel Sheets with Freely Movable Anti-buckling Bars

1
Gyeongbuk Research Institute of Vehicle Embeded Technology, Yeongcheon-si 38822, Korea
2
School of Mechanical Engineering, Pusan National University, Busan 46241, Korea
3
Department of Integrated Systems Engineering, Ohio State University, Columbus, OH 43210, USA
4
Department of Materials Processing, Korea Institute of Materials Science, Changwon 51508, Korea
*
Authors to whom correspondence should be addressed.
These authors contributed equally to this work.
Metals 2022, 12(1), 161; https://doi.org/10.3390/met12010161
Submission received: 11 December 2021 / Revised: 11 January 2022 / Accepted: 15 January 2022 / Published: 17 January 2022
(This article belongs to the Section Metal Casting, Forming and Heat Treatment)

Abstract

:
Measuring the compressive behaviour of sheet materials is an important process for understanding the material behaviour and numerical simulation of metal forming. The application of side force on both surfaces of a specimen in the thickness direction is an effective way to prevent buckling when conducting compressive tests. However, the side effects of side forces (such as the biaxial stress state and non-uniform deformation) make it difficult to interpret the measured data and derive the intrinsic compressive behaviour. It is even more difficult for materials with tension–compression asymmetry such as steels that undergo transformation-induced plasticity. In this study, a novel design for a sheet compression tester was developed with freely movable anti-buckling bars on both sides of the specimen to prevent buckling during in-plane compressive loading. Tensile and compressive tests under side force were conducted for low-carbon steel using the digital image correlation method. The raw tensile and compressive stress–strain data of the low-carbon steel showed apparent flow stress asymmetry of tension and compression, originating from the biaxial and thickness effects. A finite element method-based data correction procedure was suggested and validated for the low-carbon steel. The third generation advanced high strength steels showed intrinsic tension–compression asymmetry at room temperature whereas the asymmetry was significantly reduced at 175 °C.

1. Introduction

Sheet metal forming processes may be classified as cutting, stretching, bending, and deep drawing. In bending and deep drawing processes, sheet metals experience tension and compression. The residual stress caused by the forming process affects the shape of the formed products due to springback. For accurate analysis of springback in sheet metal forming, it is important to measure the tensile and compressive behaviour precisely and use appropriate models to describe the behaviour [1,2,3,4,5,6,7,8,9,10]. The characterisation of compressive behaviour is even more important in the sheet-bulk metal forming processes where three-dimensional material flow is involved [11,12]. Out-of-plane compressive behaviour can be measured using the stack compression test [13,14]. In-plane sheet compression tests have been used to measure material behaviour under tensile and compressive loading [5,7,9,10,15,16,17]. The major issue with the in-plane sheet compression test is the avoidance of buckling during compression.
Several approaches have been proposed to avoid buckling during in-plane compressive tests, as summarised in Table 1. A comb-like anti-buckling device was used where a side force was applied to a dog bone-shaped specimen by a hydraulic actuator through the anti-buckling device [9,18,19,20,21] or bolts [22]. Plate type anti-buckling devices have also been used [1,23,24,25,26,27,28,29]. Two hydraulic actuators were used to apply side force to both sides of the specimen [29]. Instead of a hydraulic actuator, bolts and coil springs have also been used to apply side force [1,25,26,27,28]. A specimen with a single-sided groove was used to prevent buckling without the application of side force [30].
Strains were measured using various methods depending on the experimental setup: strain gauges [18,19,20], laser extensometer [9,23,24,26], ex situ cross-section measurements [22], digital image correlation [25,28,29,30], and mechanical extensometer [1,27].
The measured data may need to be corrected. In some studies, it was claimed that the low friction caused by lubrication rarely affects material behaviour, and that correction was therefore not needed [16,17,18]. In other studies, the friction force was subtracted from the measured load for correction [9,19,20,27]. The biaxial stress effect caused by the side forces was considered [21,22,23].
For steels with an austenitic phase, the strength-differential effect in the tensile and compressive modes has been attributed to the martensitic phase transformation from the austenitic phase, or the transformation-induced plasticity (TRIP) effect [10,16,31,32,33]. The TRIP effect depends on the stress state and causes an asymmetry in the tensile and compressive strengths, where the compressive strength is usually larger than the tensile strength. The asymmetry is caused by the faster transformation rate (and thus slower hardening) in tensile loading than in compressive loading.
In this study, a novel design for a sheet compression tester was developed using freely movable anti-buckling bars. The proposed design does not resemble any of the previous comb and plate type designs, and to the best of the authors’ knowledge, has not been previously presented. Tension and compression tests under side force were conducted for low-carbon steel and third generation advanced high strength steels (3G AHSS) using the digital image correlation method for strain measurement. The apparent stress–strain curves obtained for low-carbon steel were analysed, and the origin of the apparent flow stress asymmetry of tension and compression was examined using finite element simulations. A data correction procedure based on the finite element method was proposed and applied to the correction of the stress–strain curves of the 3G AHSS at room temperature and 175 °C.

2. Methods

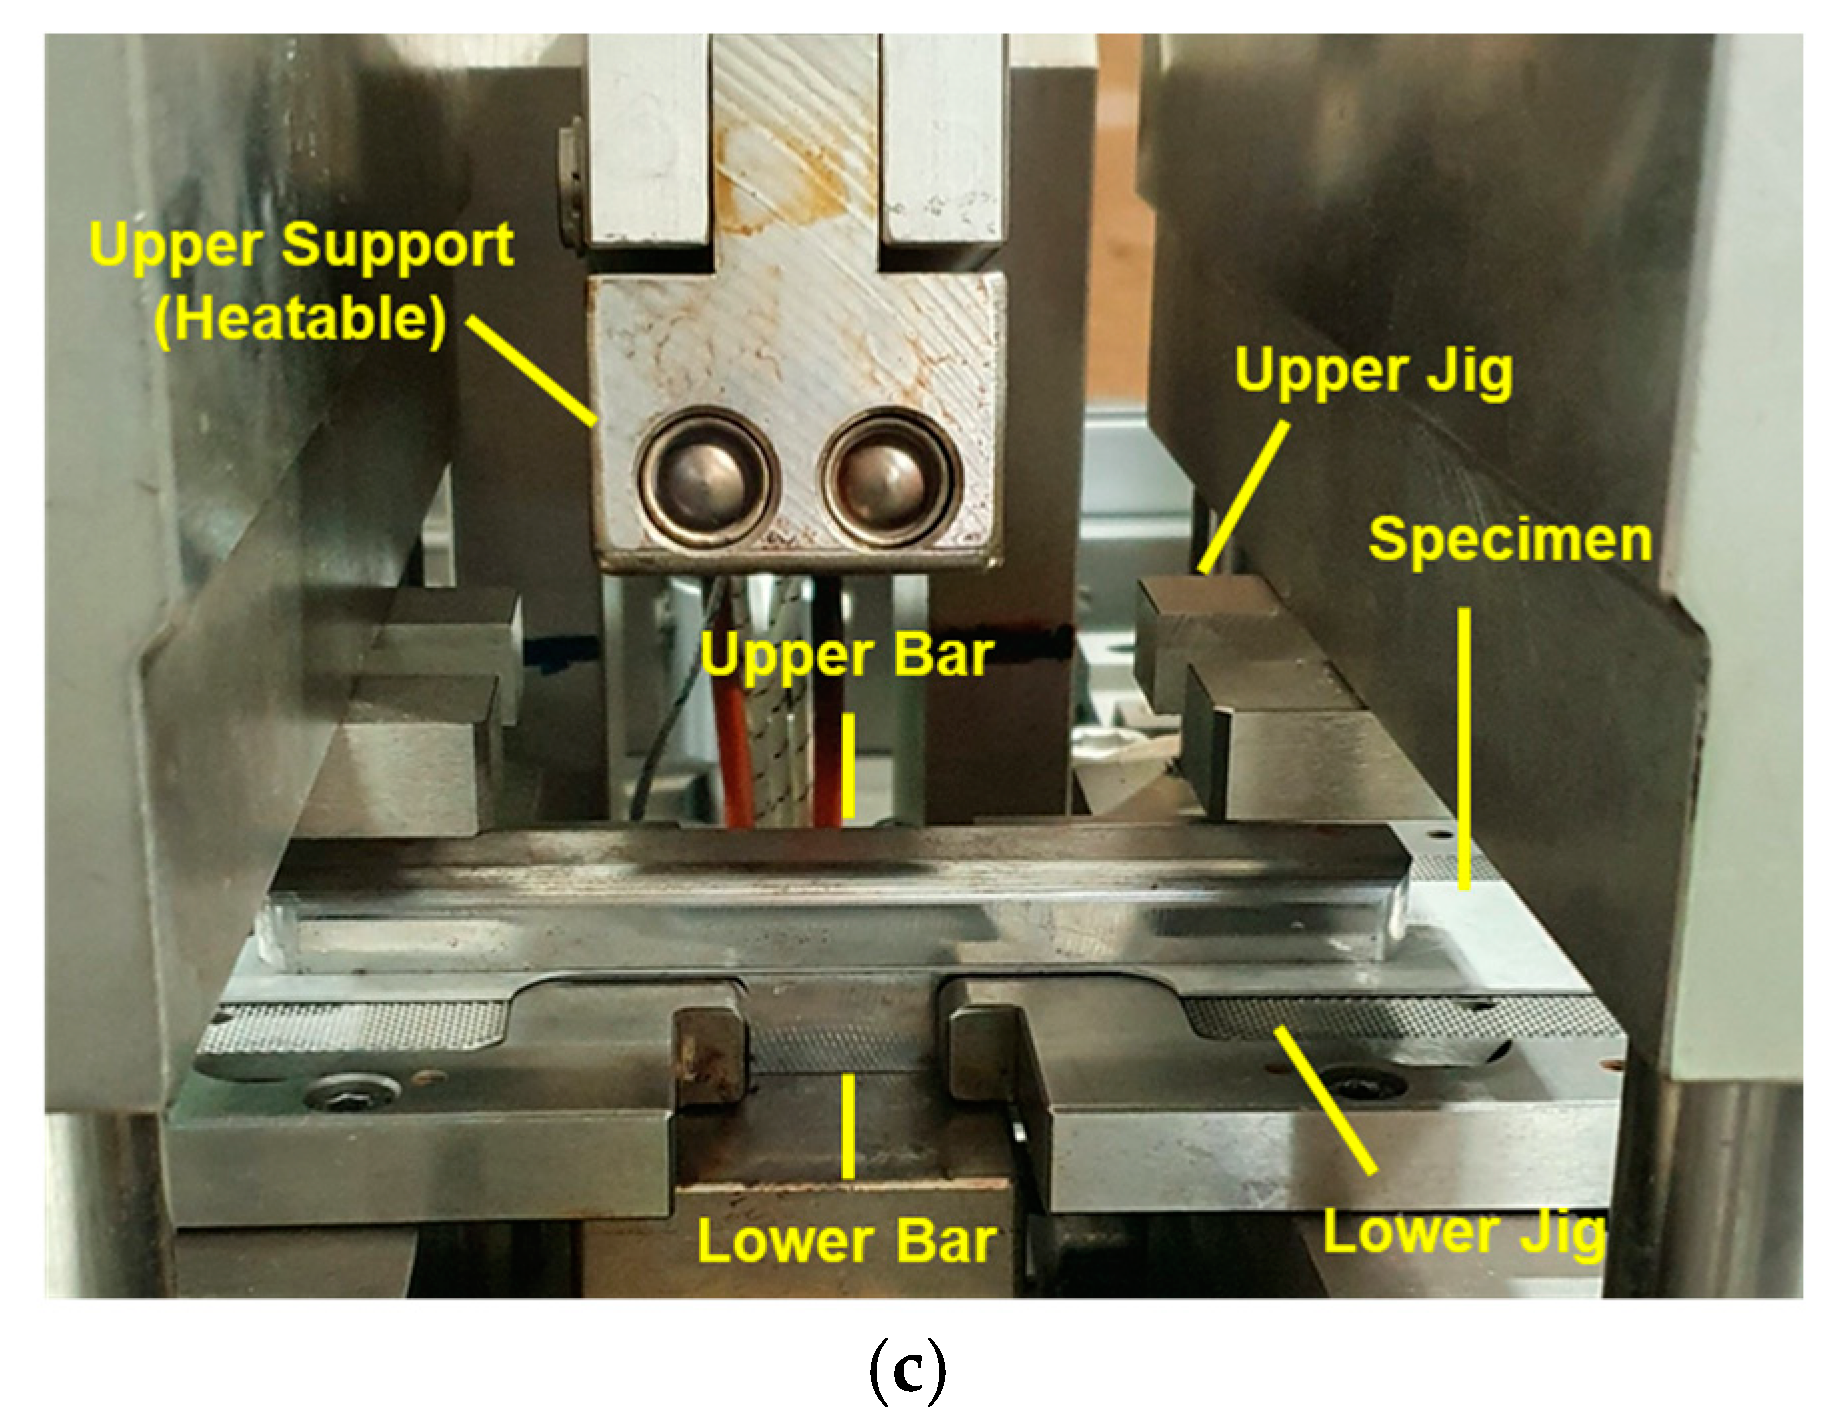
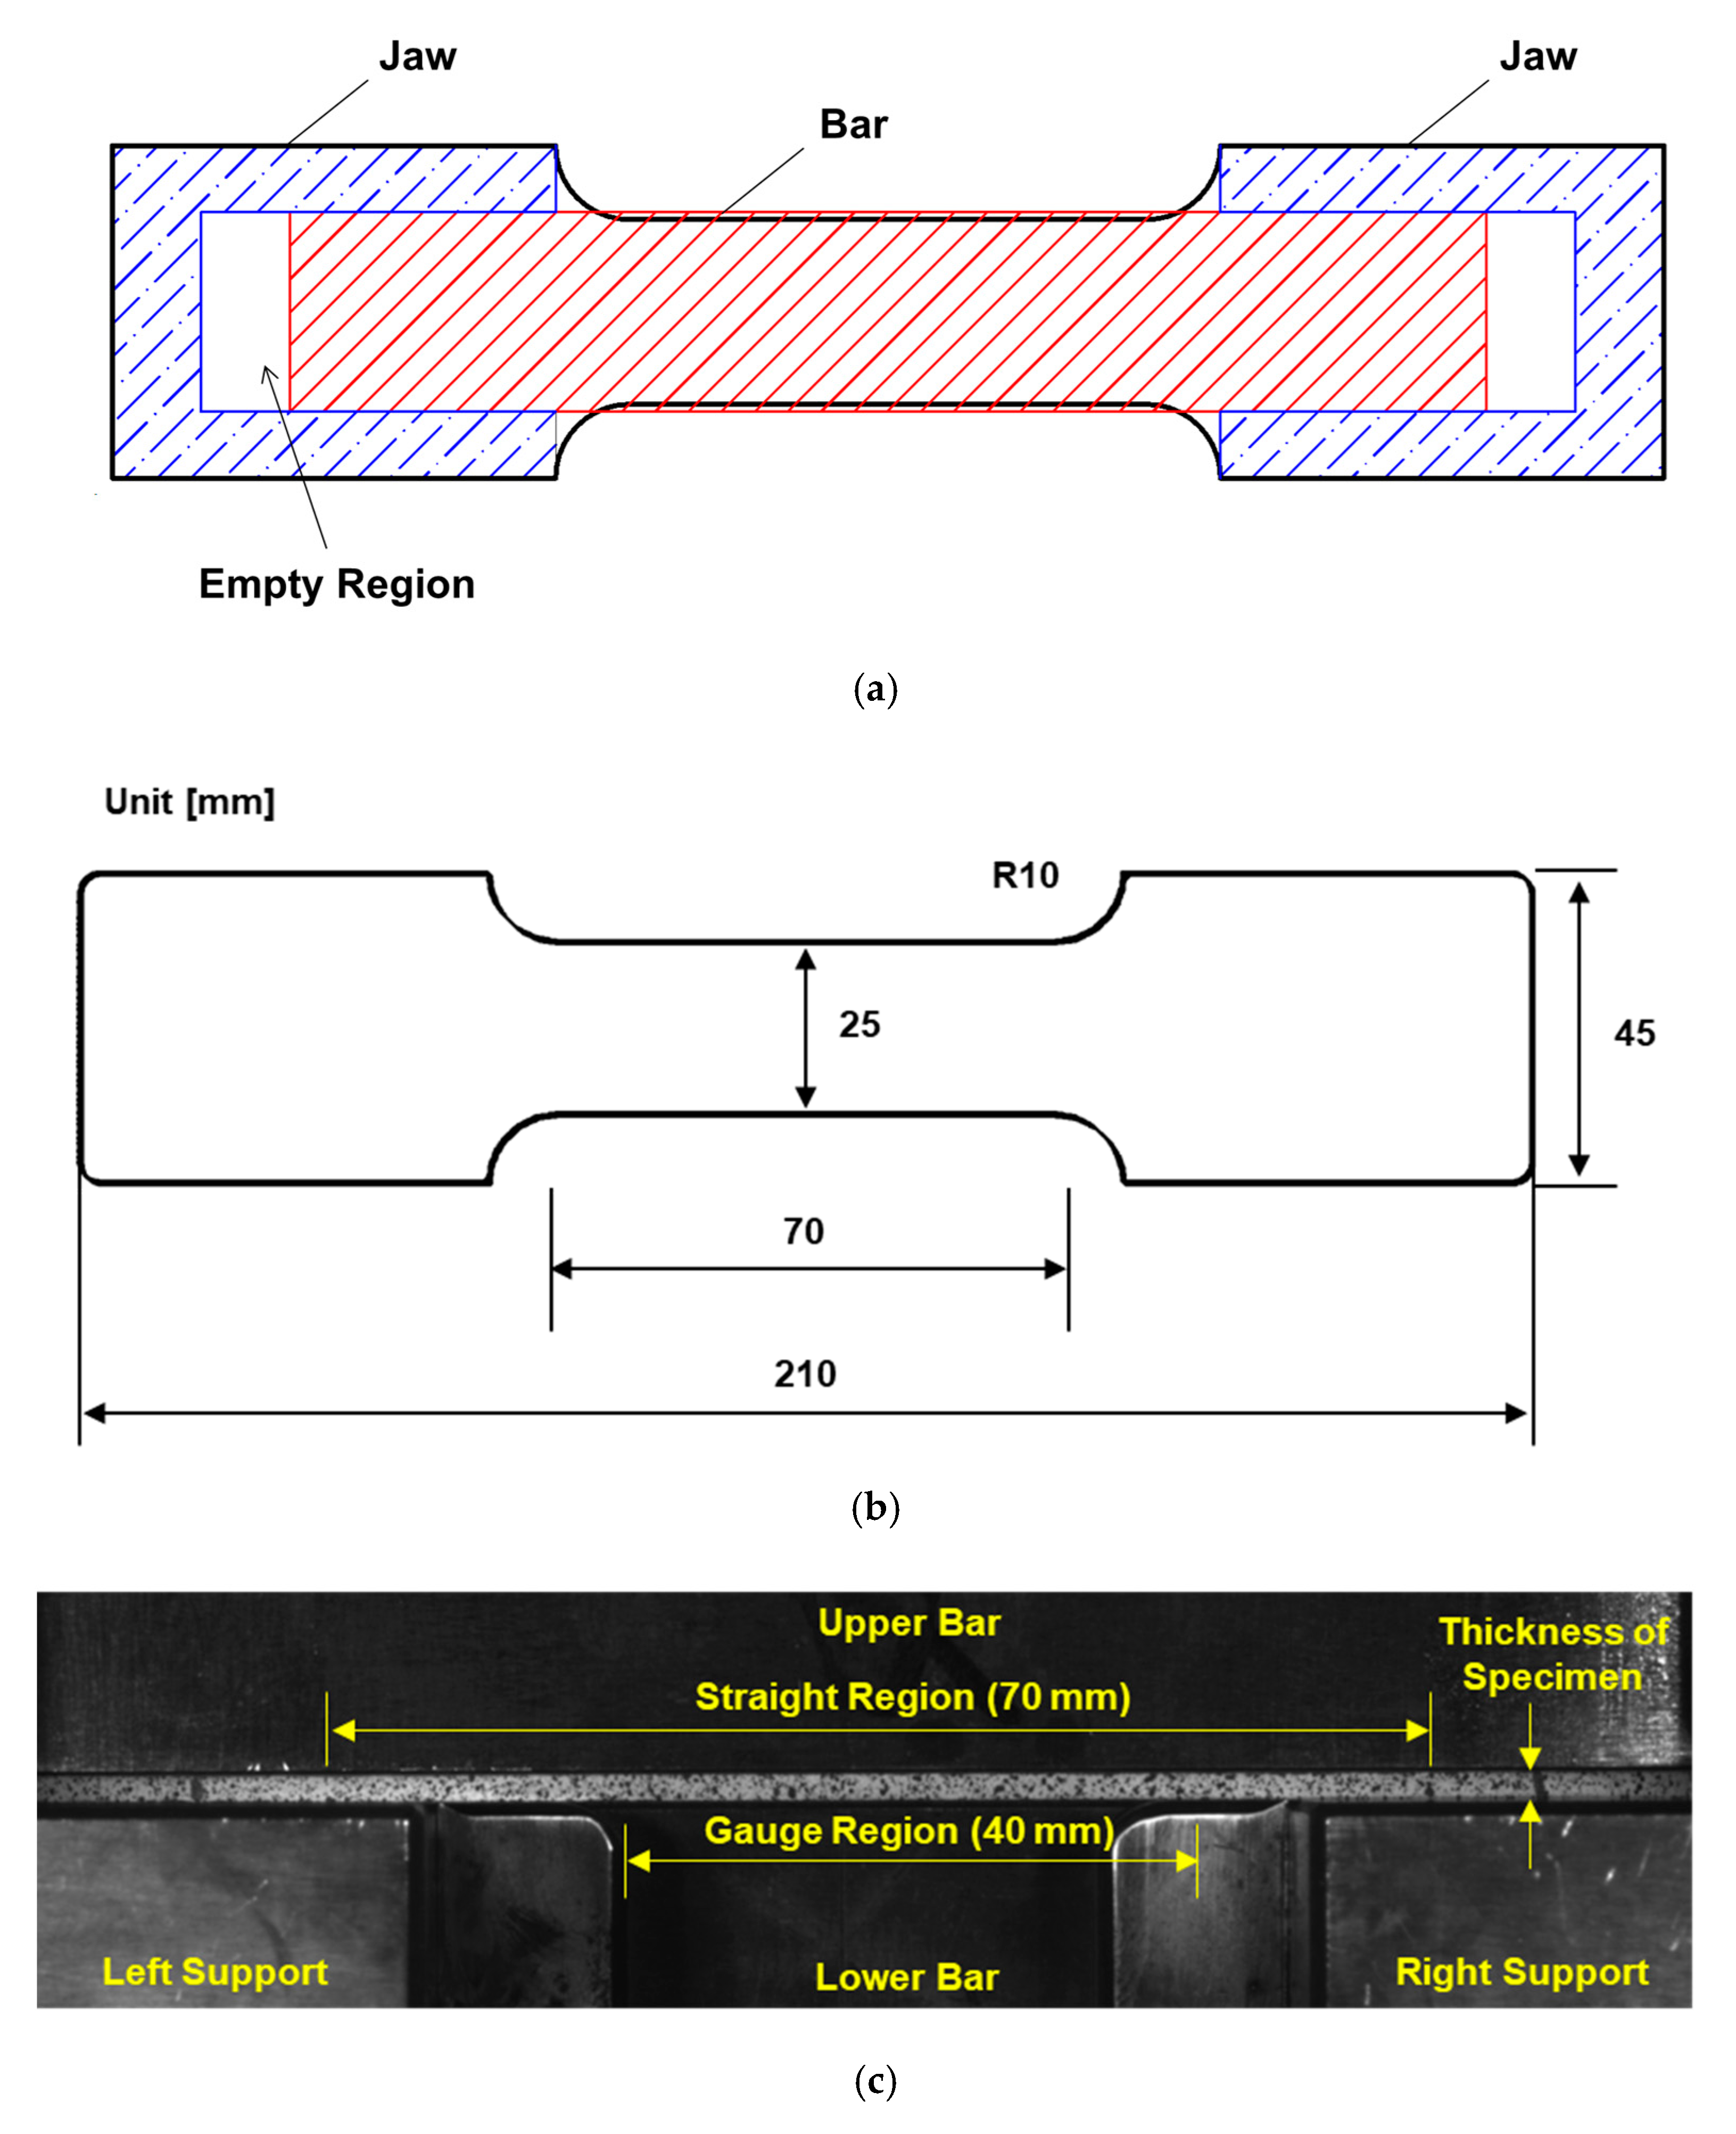
2.1. Horizontal Sheet Compression Tester with Moving Anti-Buckling Bars

Previous designs of sheet compression testers (shown in Table 1) can be classified largely into comb (or fork) and plate types in terms of the anti-buckling device. During compression testing of a sheet specimen, the length of the specimen decreases, whereas the anti-buckling device does not. Therefore, an empty space is initially required so that the device can move during compression. In the plate design, the shoulder region or some part of the grip region of the specimen is not covered by the device for this purpose, but this region is prone to buckling. In the comb design, the space between the interlocking comb teeth enables movement of the device during compression, but may cause uneven stress distribution and uneven temperature distribution for elevated temperature tests.
In this study, a novel design for a sheet compression tester was developed, as shown in Figure 1. Rectangular anti-buckling bars were placed on both sides of the specimen to prevent buckling during in-plane compressive loading. The bars can move freely in the socketed jaw grips so that all the specimen surfaces, except for small regions inside the grips, are in contact with the anti-buckling bars during the tensile or compressive tests, as shown in Figure 2a. In addition to the prevention of buckling, the new design is also beneficial for keeping the specimen temperature uniform in elevated temperature tests where the bars are heated by cartridge heaters.

2.2. Materials

The in-plane compressive behaviour of low-carbon steel and 3G AHSS sheets was measured in this study. Low-carbon steel was chosen because it does not have the strength differential effect and will be used for the validation of the test and correction method. 3G AHSS exhibited transformation-induced plasticity (TRIP) and showed the tension–compression strength differential effect because of the martensitic transformation of the austenite phase [10,16,31,32,33]. The thickness of each of the two steel sheets was 1.4 mm.

2.3. Uniaxial Tensile Test

Uniaxial tensile tests without side forces were conducted using a universal testing machine (UTM). ASTM E8 standard size specimens with a gauge length of 50 mm were prepared in the rolling direction by wire cutting. The crosshead speed was 5 mm/min. The strain was measured using the digital image correlation (DIC) method. The images of the specimen were taken using the 5 mega-pixel camera positioned perpendicular to the top surface of the tensile specimen, and the strain was measured between the two points in the gauge length using the commercial GOM Correlate Professional software. All tests were conducted at least three times to ensure reproducibility.

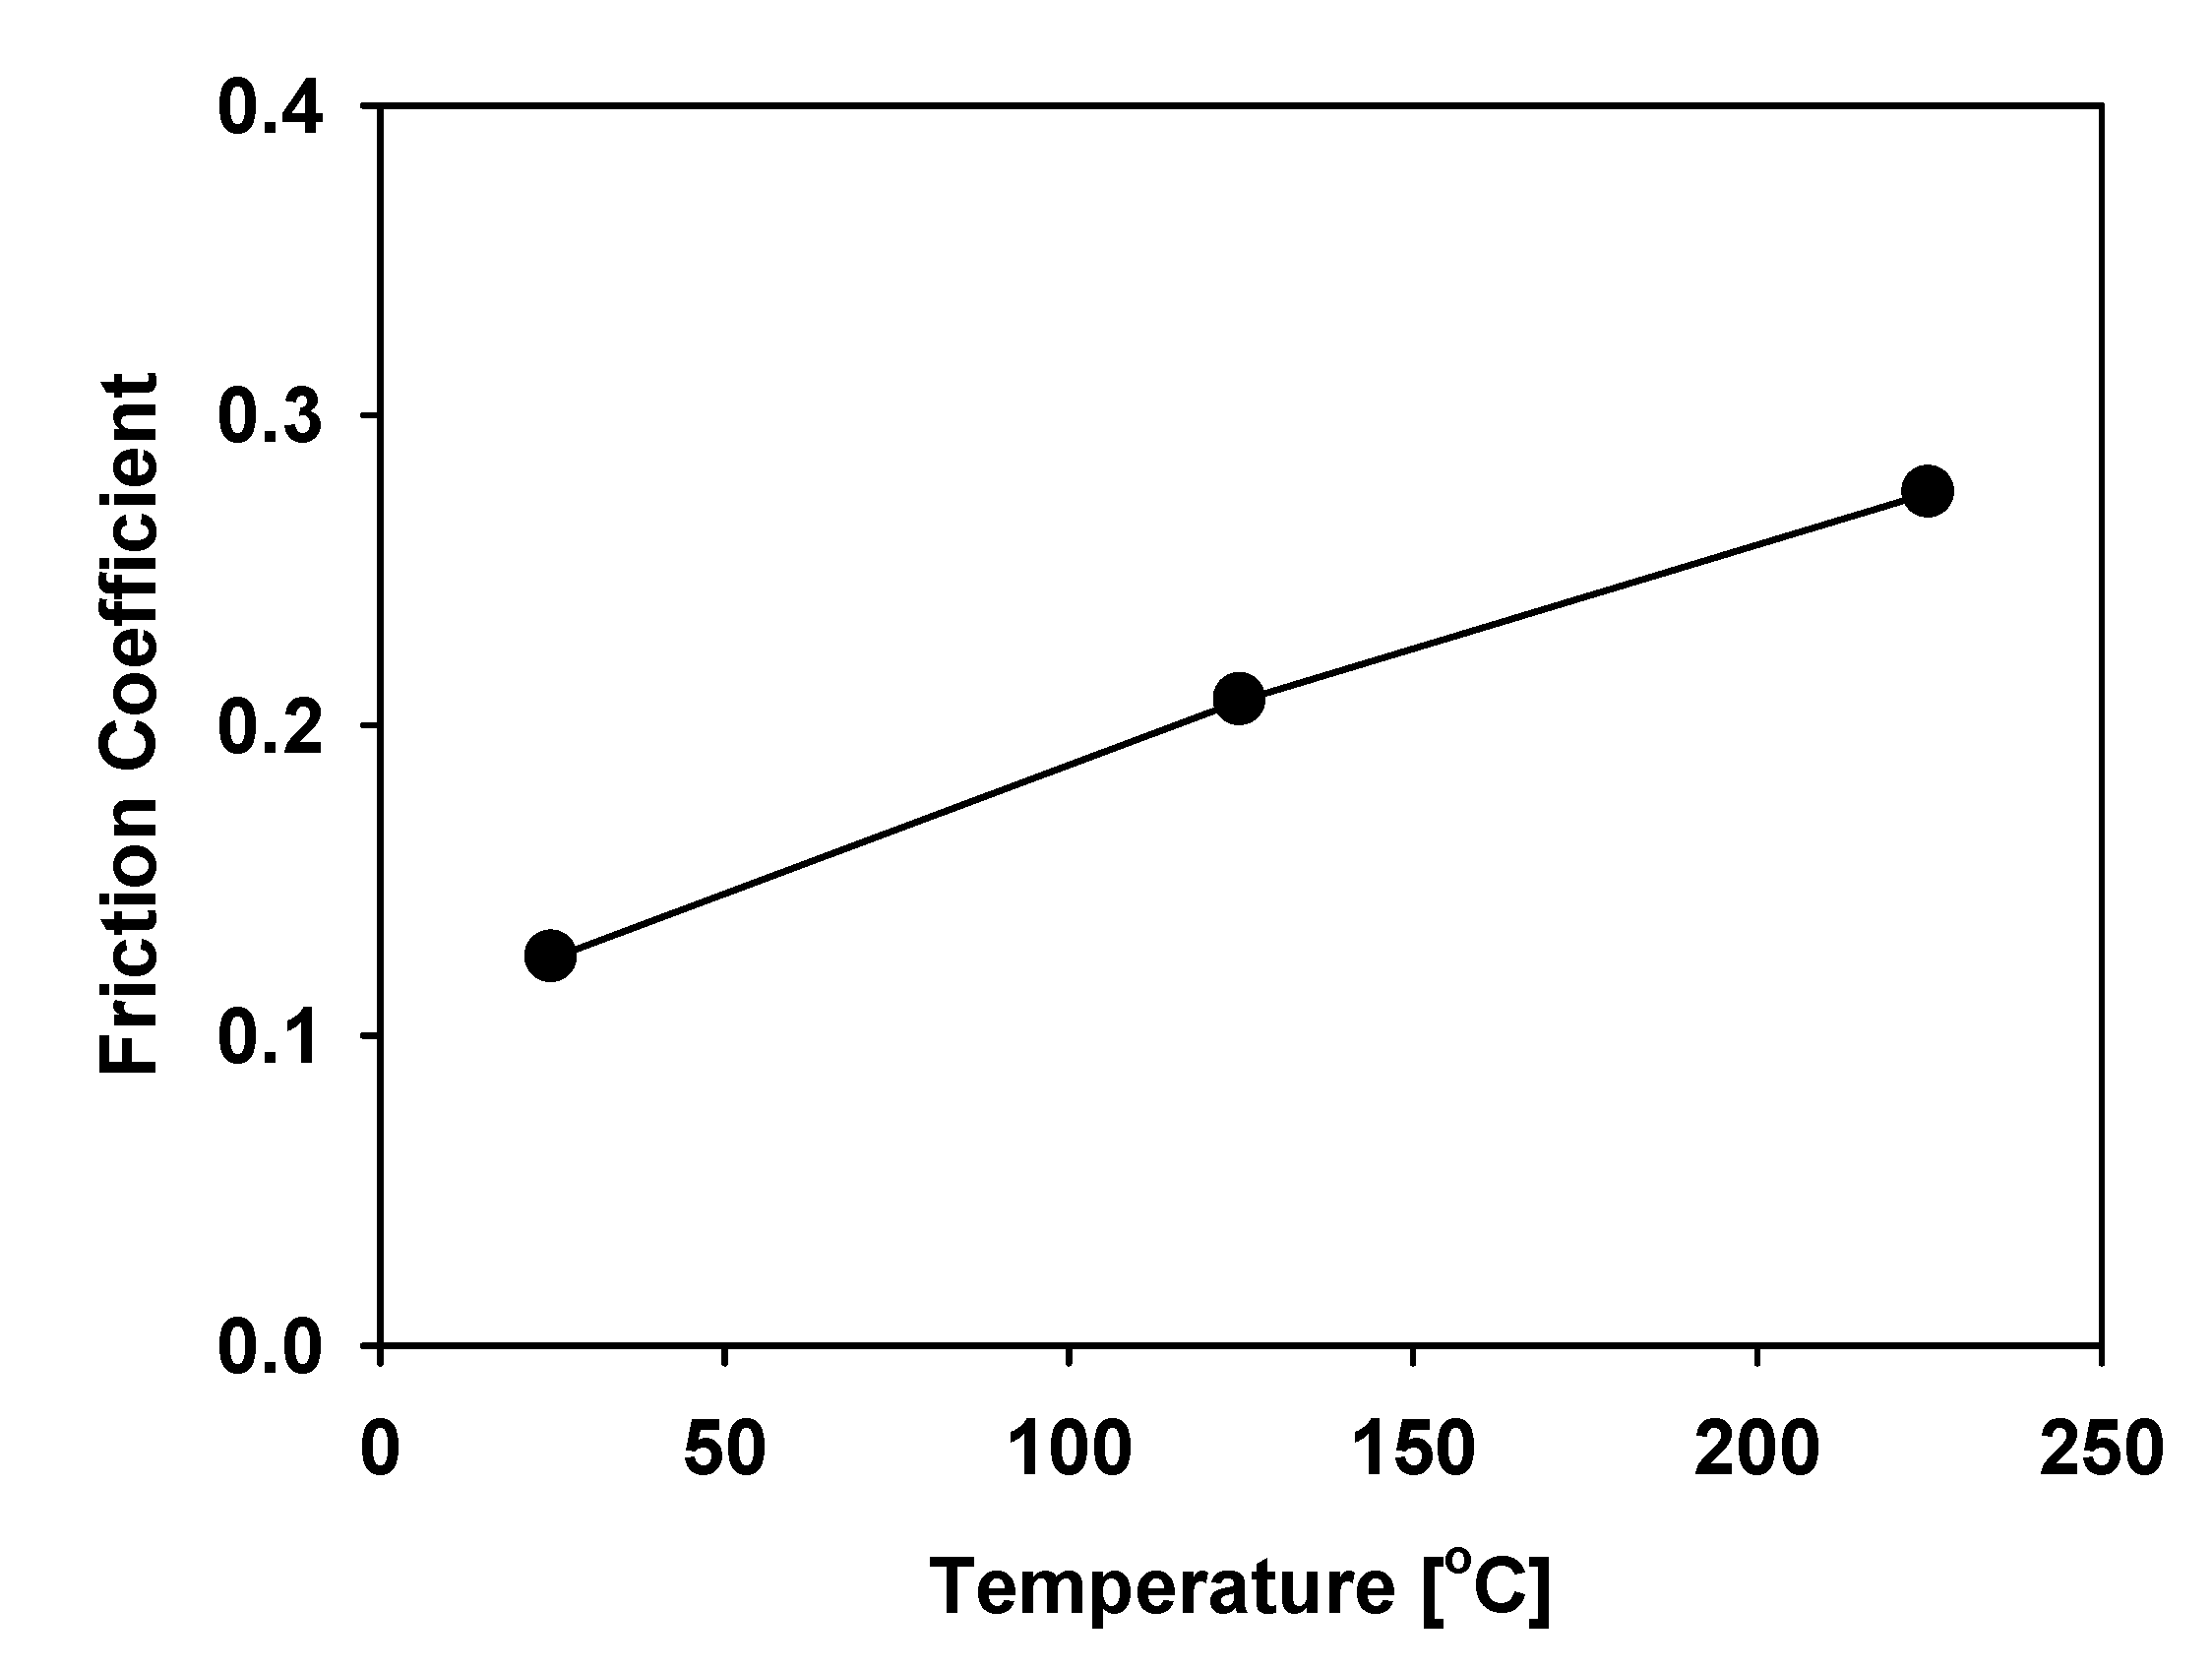
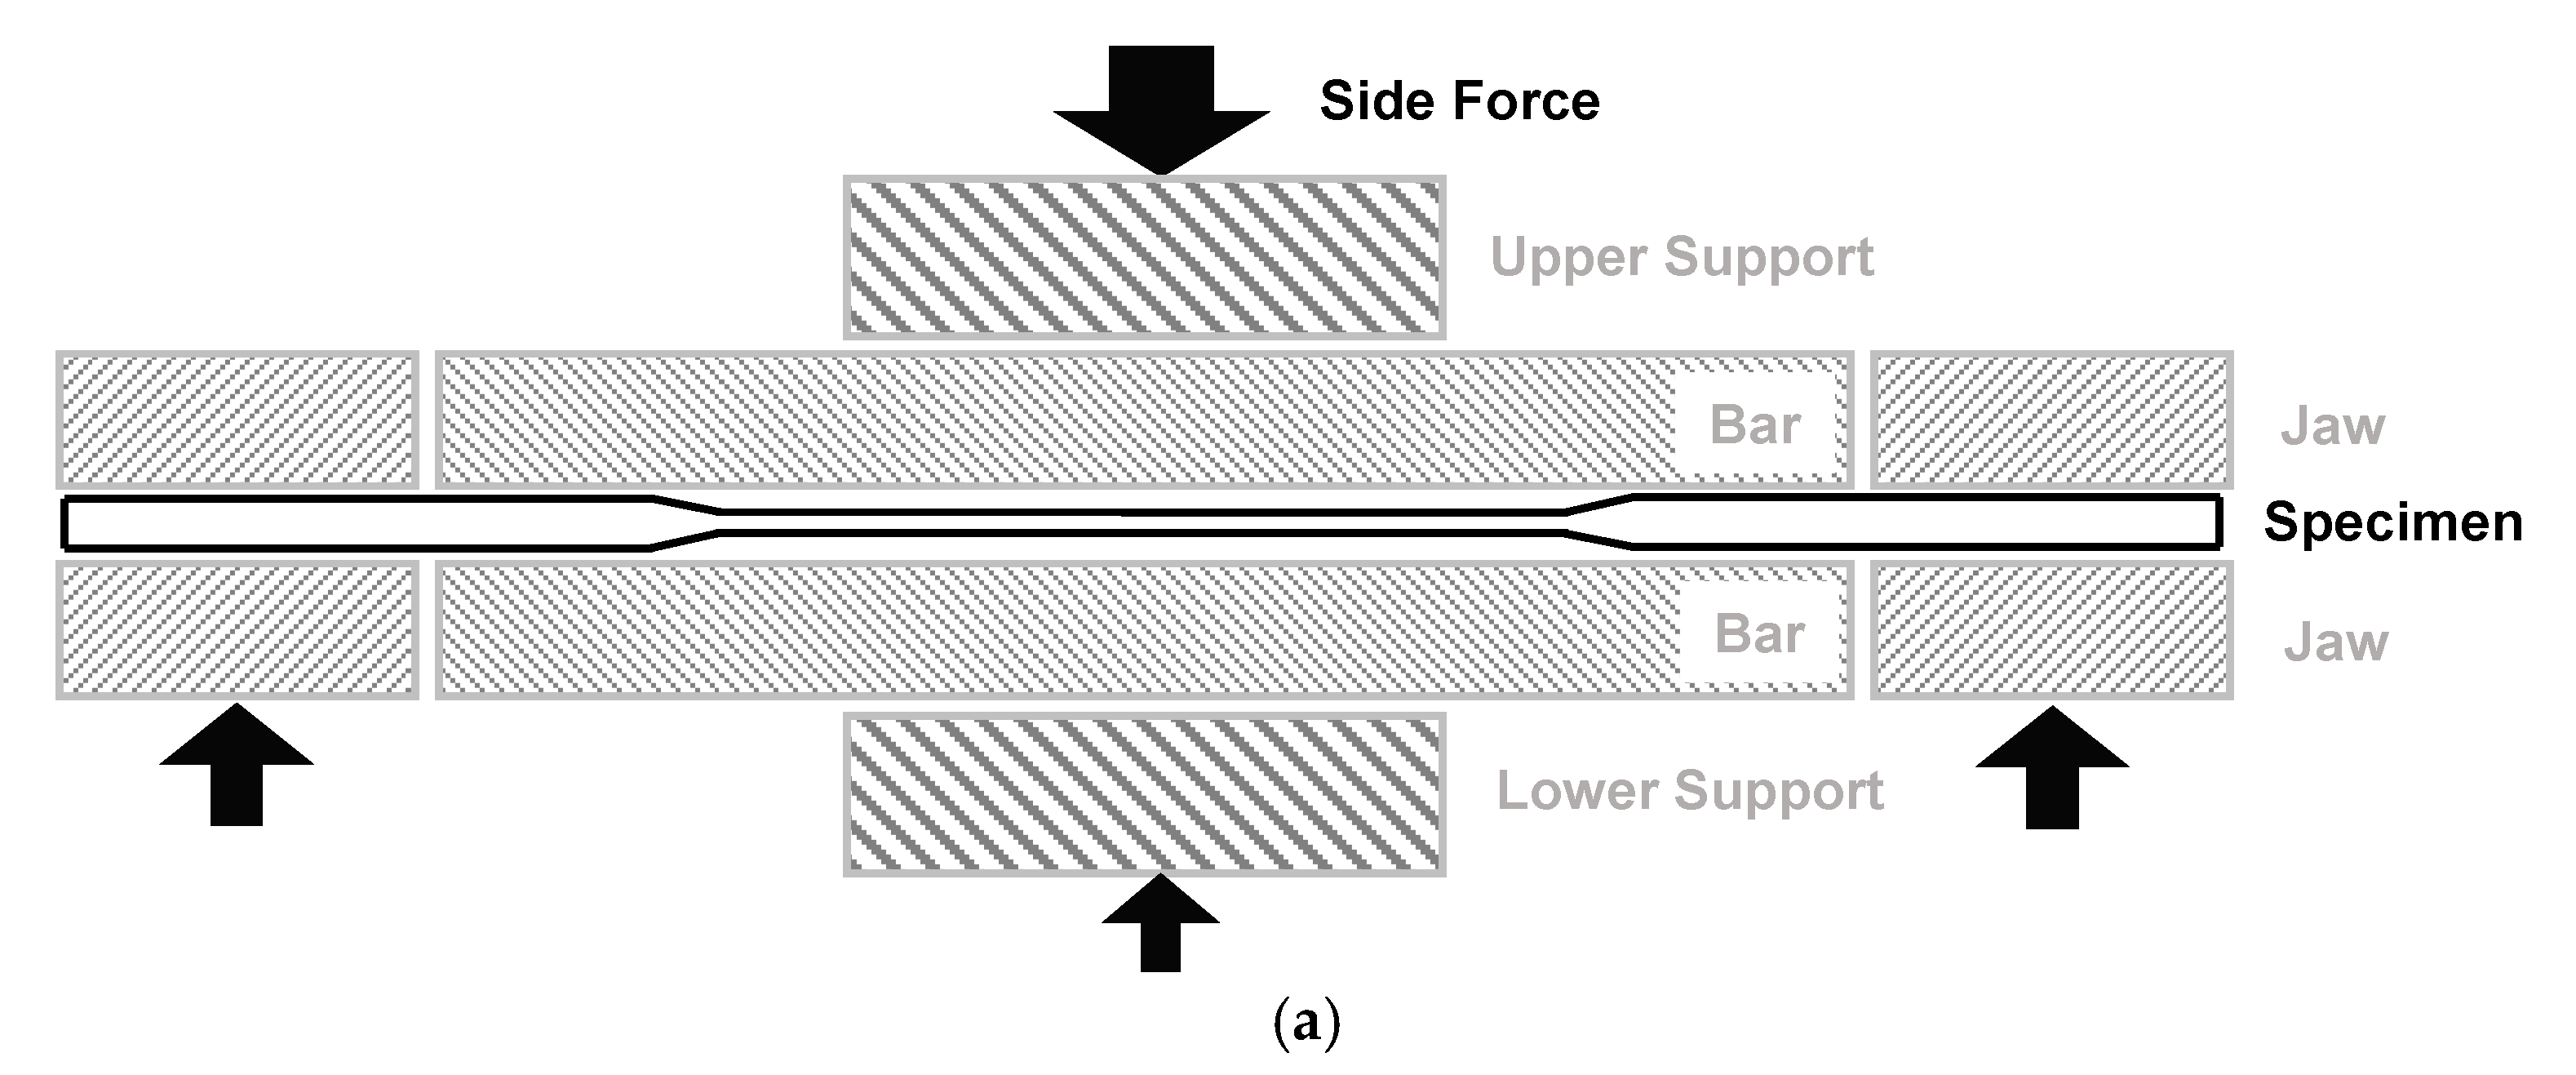
2.4. Tensile and Compressive Tests under Side Force

For tensile and compressive tests using the developed test setup, dog bone-type customised specimens with a 70 mm long straight region were used, as shown in Figure 2b. Similar specimens have previously been used for measuring tension–compression behaviour [10,16,34].
The strain was measured in the 40 mm-long gauge region using the DIC method. The images of the specimen were taken using the 5 mega-pixel camera positioned perpendicular to the side surface of the specimen, as shown in Figure 2c, and the strain was measured between the two points in the gauge length using the commercial GOM Correlate Professional software. The gauge length of 40 mm was chosen to reduce the effect of the non-uniform deformation in the specimen on the strain measurement.
For testing, the specimen was placed between the lower and upper anti-buckling bars. The grip regions were clamped using hydraulic grips. The lower bar was placed on a fixed plate, while the upper bar was controlled by a hydraulic actuator, which exerted a given side force (SF). During the test, the left grip was fixed, and the right grip was moved at a speed of ±5 mm/min for the tension and compression tests. In addition to the room temperature (RT, 25 °C) tests for low-carbon steel and 3G AHSS, tests were conducted at 175 °C for 3G AHSS to investigate the effect of temperature on the tension–compression strength asymmetry. The temperature of 175 °C was chosen because the effect of phase transformation is expected to be reduced at that temperature.
Pre-tests were conducted to determine the minimum side force necessary to prevent buckling while minimising side effects such as biaxial and thickness effects, which will be explained later. The minimum side force was determined by trial and error. It is known that the minimum side force is related to the thickness and strength of the sheet specimen [21,23]. In this work, side forces of 2.9 kN and 8.8 kN were used for the low-carbon steel and 3G AHSS, respectively.
Friction coefficients were measured using a cut specimen with only one grip region. The grip region on the left side of the specimen was cut so that the specimen can slide between the anti-buckling bars with the movement of the grip on the right. The friction coefficient was calculated as the half of the force measured at the jaws divided by the applied side force. Figure 3 shows the measured friction coefficient at various temperatures.

2.5. Finite Element Analysis

Finite element (FE) simulations were conducted for the tensile and compressive tests with side force using the commercial finite element software Abaqus/Standard (V2018, Dassault Systèmes, Vélizy-Villacoublay, France). A half finite element model of the test was used with symmetric boundary conditions, as shown in Figure 4. The specimen and the upper and lower bars were modelled as deformable bodies with an 8-node linear hexahedral element (C3D8R). An element size of 0.5 mm in the in-plane directions and five layers in the thickness direction were used for the specimen. The jaws and supports were modelled as rigid bodies. A jaw force of 98 kN was applied.
The stress and strain were measured using the same method used in the experiment. The reaction forces from the lower and upper jaws were used to calculate the stress. The strain was measured in a 40 mm-long gauge region.
The measured friction coefficients of 0.12 and 0.24 were used for simulations between the specimen and the anti-buckling bars at room temperature and 175 °C, respectively. The friction coefficient between the specimen and the jaws was assumed to be 1.0. A Young’s modulus of 210 GPa and Poisson’s ratio of 0.3 were used.

3. Results and Discussion

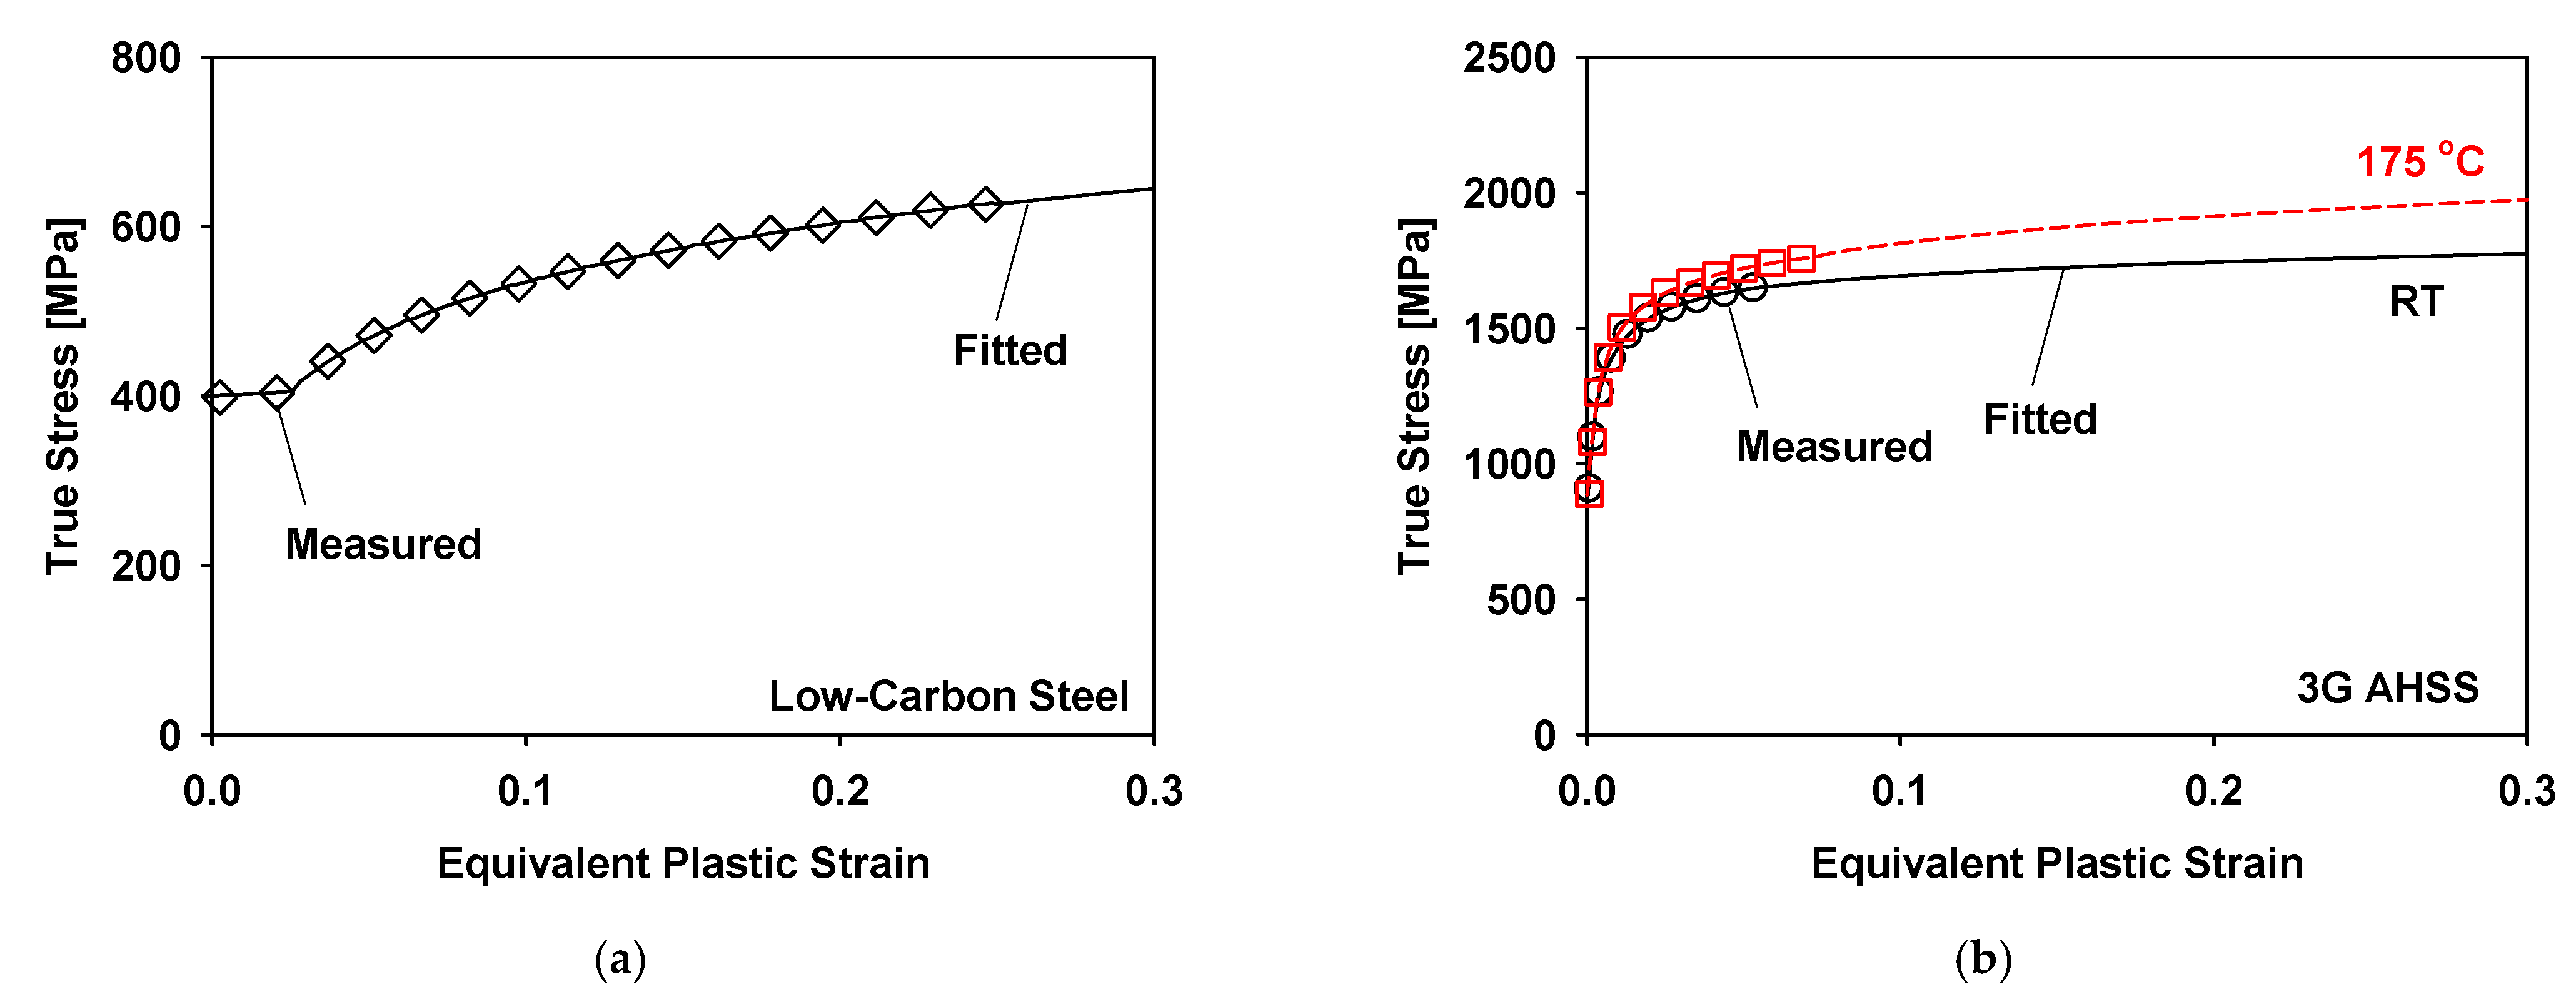
3.1. Uniaxial Behaviour

The tensile stress–strain curves of the low-carbon steel and 3G AHSS measured from the uniaxial tensile test are shown in Figure 5. The material properties measured from the stress–strain curves are listed in Table 2. It is notable that the flow stress of the 3G AHSS at 175 °C was higher than that at RT because of the TRIP effect [32,33,35]. For the finite element simulations, the measured flow stress–plastic strain data were used in the tabular form up to the limit strain. After the limit strain, the Voce-type hardening law was used to extrapolate the data:
σ ¯ = σ ¯ 0 + Q ( 1 e x p ( b ε ¯ ) )
The limit strains and hardening parameters are listed in Table 2. The flow stress-equivalent plastic strain curves are shown in Figure 6.

3.2. Tension and Compression Behaviour of the Low-Carbon Steel

The apparent absolute true stress–strain curves for the tensile and compressive tests of the low-carbon steel under side force are shown in Figure 7. The apparent stress–strain curve represents the raw stress–strain curve obtained from the load cell and the DIC extensometer data. The true stress–strain curve of the tensile test without side force (measured using the UTM) is also plotted for comparison. In both the tensile and compressive stress–strain curves, the stresses with side force were larger than those without side force. However, the average difference between the compressive curves with and without side force (20.1 MPa) was much larger than that between the tensile curves (3.1 MPa). This apparent flow stress asymmetry between tension and compression may be attributed to mechanical factors (such as friction, biaxial stress state, non-uniform deformation) and/or the intrinsic tension–compression asymmetry of the material. In the following section, the origin of the difference is analysed using FE simulations.
Finite element simulations were performed for the tensile and compressive tests under a side force. In the FE simulation, the flow stress curve obtained from the tensile test was used in both tensile and compressive tests, assuming tension–compression symmetry. The FE calculated true stress–strain curves under side force were in good agreement with the measured stress–strain curves, as shown in Figure 8. They showed an asymmetric difference between the stress–strain curves with and without side force. This implies that the difference can be explained by mechanical factors, rather than material asymmetry.
The difference can be explained by two major factors: the biaxial effect and the thickness effect. The biaxial effect represents the change in the magnitude of the flow stress under stress normal to the loading direction [23,25]. The compressive normal stress decreased the magnitude of the tensile flow stress, whereas it increased the magnitude of the compressive flow stress, as shown in Figure 9. The biaxial effect is generally negligible because the average normal stress (the side force divided by the area of the anti-buckling bar) is usually small. For example, the average normal stress of the low-carbon steel test was 1.68 MPa, and the effect of the average normal stress on the flow stress was 0.2%. However, the effect is not trivial if the deformation is not uniform, particularly in the early stages of the test. Figure 10 shows the normal stress distribution at the beginning of plastic yielding (at a strain of 0.005). The rounded corner induced stress concentration near the shoulder of the specimen; hence, plastic yielding occurred in that region first. In the compression test, the thickness of the region became greater than that of the other regions, which caused a larger compressive stress in the normal direction at the region, and the local normal stress decreased to −31 MPa. On the other hand, in the tensile test, the thickness of the region became less than that of the other regions, and the magnitude of the normal stress decreased. This caused the asymmetry of the apparent flow stresses of tension and compression under side force.
In the horizontal loading system, the upper side of the specimen was pressed by an upper anti-buckling bar on which a given amount of force was applied by the hydraulic actuator. On the other hand, the lower side of the specimen was supported by a fixed plate. During the tensile test under side force, the central region of the specimen became relatively thinner than the other regions, as schematically shown in Figure 11, and most of the side force was transmitted to the jaws. Therefore, the normal force between the specimen and the lower bar became smaller than the side force applied by the actuator, as shown in Figure 12. On the other hand, during compression, the thickening of the central region of the specimen localised the normal force to the central region, thus increasing the normal force between the specimen and the lower bar. The decrease and increase in the normal force during tension and compression, respectively, can cause a difference in the frictional force and hence a difference in the apparent flow stress. Therefore, the strength difference between the tension and compression shown in Figure 7 is not intrinsic to low-carbon steel. Rather, it originated from mechanical factors.
The effects of the friction coefficient and side force on the material flow stress were analysed using a finite element simulation of low-carbon steel. Figure 13 shows the FE calculated apparent absolute true stress–strain curves obtained using various friction coefficients. The increase in the friction coefficient increased the magnitude of the apparent flow stress for both tension and compression. However, the effect of the friction coefficient was more pronounced for compression than for tension. This implies that it is beneficial to reduce the friction between the specimen and the anti-buckling bars to minimise the apparent asymmetry of tension and compression. Figure 14 shows the FE calculated apparent absolute true stress–strain curves obtained using various side forces. It also shows that the effect of the side force is more pronounced for compression than tension. The effect of the side force is larger than the effect of the friction coefficient because it also influences the biaxial stress state. This shows the necessity of using minimal side force to reduce the side effects.
Through the analysis, it was found that the friction and thickness effects can cause apparent flow stress asymmetry between tension and compression. Therefore, the raw data should be corrected for these effects using finite element simulations. The suggested correction procedure is as follows:
(1) Measure the friction coefficient using a cut specimen;
(2) Conduct tensile tests using UTM (without side force);
(3) Conduct compressive tests using a compression tester with side force;
(4) Perform an FE simulation of the compressive test with side force and the friction coefficient using the stress–strain data from the UTM as an initial guess; and
(5) If the result of (4) does not match the experimental result, adjust the input stress–strain data until they match.
The above correction procedure was applied to low-carbon steel, as shown in Figure 15. The corrected compressive stress–strain curve agreed well with the tensile stress–strain curve for this material.

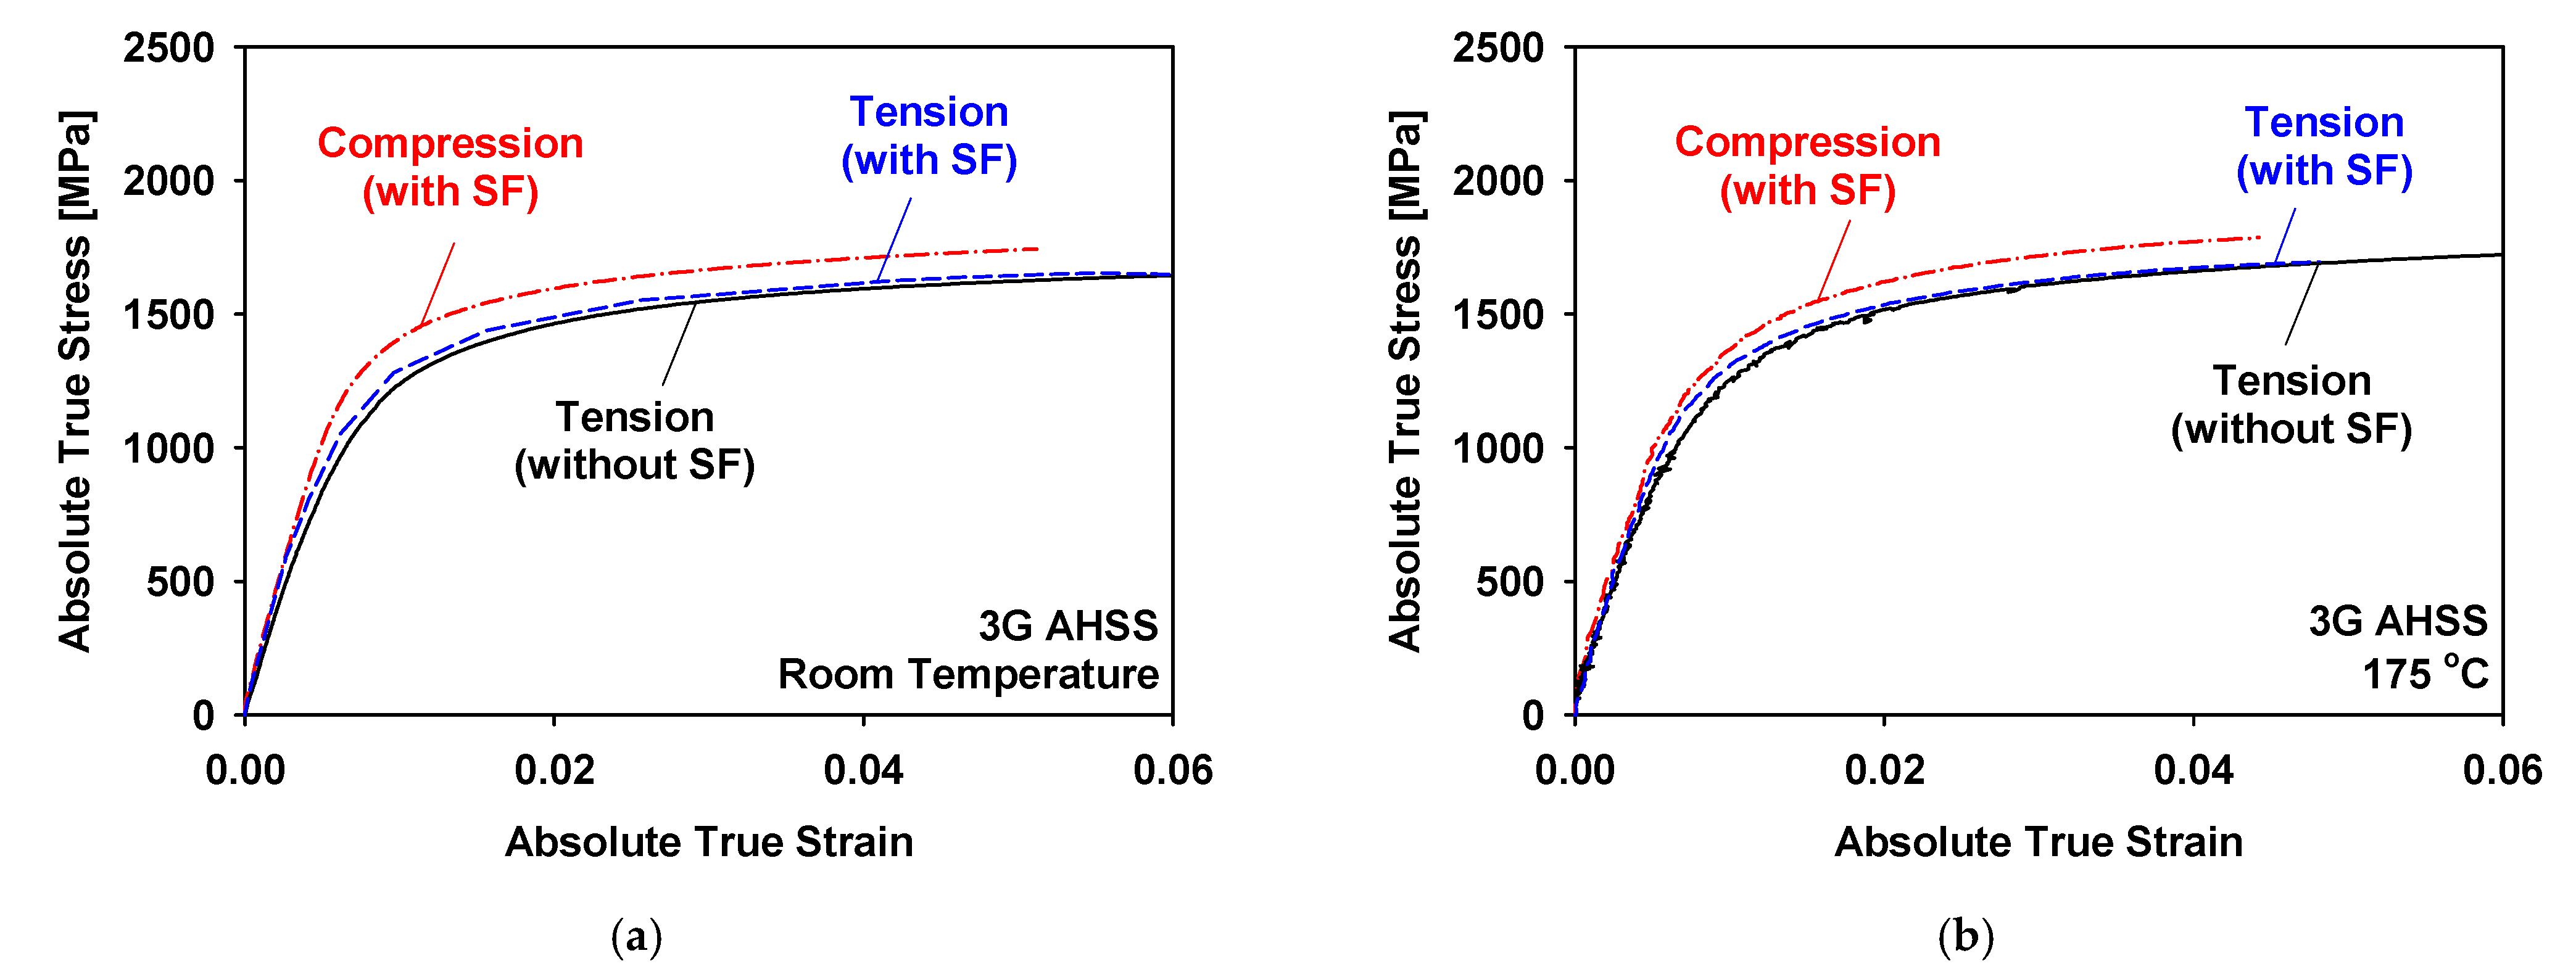
3.3. Tension and Compression Behaviour of the 3G AHSS

The apparent absolute true stress–strain curves for the tensile and compressive tests of 3G AHSS under side force are shown in Figure 16. The true stress–strain curve of the tensile test without side force (measured using the UTM) is also plotted for comparison. Similar to low-carbon steel, the tensile flow stresses with side force were larger than those without side force at room temperature and 175 °C. The compressive curves with side force were much larger than the tensile curves with side force. Part of the difference may be attributed to the biaxial and thickness effects. However, the 3G AHSS is also known to exhibit the TRIP effect, and thus, an intrinsic flow stress asymmetry of tension and compression [9,16,31,32,33]. The phase transformation generates hard martensite from soft austenite, which is thought to cause hardening. However, the fraction of the transformed martensite is usually very small considering the small retained-austenitic phase fraction and the small amount of plastic strain, which cannot explain the strength differential effect of the material. On the other hand, the transformation in tension occurs at a lower stress level than the stress at which slip occurs in compression (i.e., the phase transformation controls the flow stress in uniaxial tension), while the flow stress is controlled by the slip mechanism in uniaxial compression [31].
The correction procedure presented in Section 3.2 was performed to eliminate the artificial side effects and determine the actual material properties. The compressive flow stress curves were obtained and the measured and predicted apparent flow stress curves agreed with each other, as shown in Figure 17. To obtain the corrected compressive flow stress curves, the tensile flow stress curve shifted up by 88 MPa at room temperature. No adjustment was required for the flow stress curve at 175 °C.
The corrected absolute true stress–strain curves of the 3G AHSS at room temperature and 175 °C are shown in Figure 18. Unlike low-carbon steel, 3G AHSS exhibited an intrinsic flow stress asymmetry of tension and compression after correction at room temperature. This is attributed to the TRIP effect, where additional plastic strains (Bain strain and transformation strain) are generated from the martensitic transformation from the retained austenite [17,33]. However, the flow stress asymmetry was significantly reduced at 175 °C. The average differences between the tensile and compressive curves were 98.1 and 6.9 MPa at room temperature and 175 °C, respectively. This result is consistent with the observation that the TRIP effect is reduced at elevated temperatures [32,33,35,36].

4. Conclusions

To measure the compressive behaviour of sheet metals, a novel design for a sheet compression tester was developed with freely movable anti-buckling bars to prevent buckling. Tensile and compressive tests under side force were conducted for low-carbon steel and 3G AHSS using the digital image correlation method. A finite element method-based data correction procedure was suggested to obtain the tensile and compressive behaviour from the test results under side force. The following conclusions were drawn from the analysis:
  • The tensile and compressive stress–strain curves under side force were successfully measured at room temperature and 175 °C using a novel sheet compression tester. The freely movable anti-buckling bars removed open regions in the specimen, which may cause buckling.
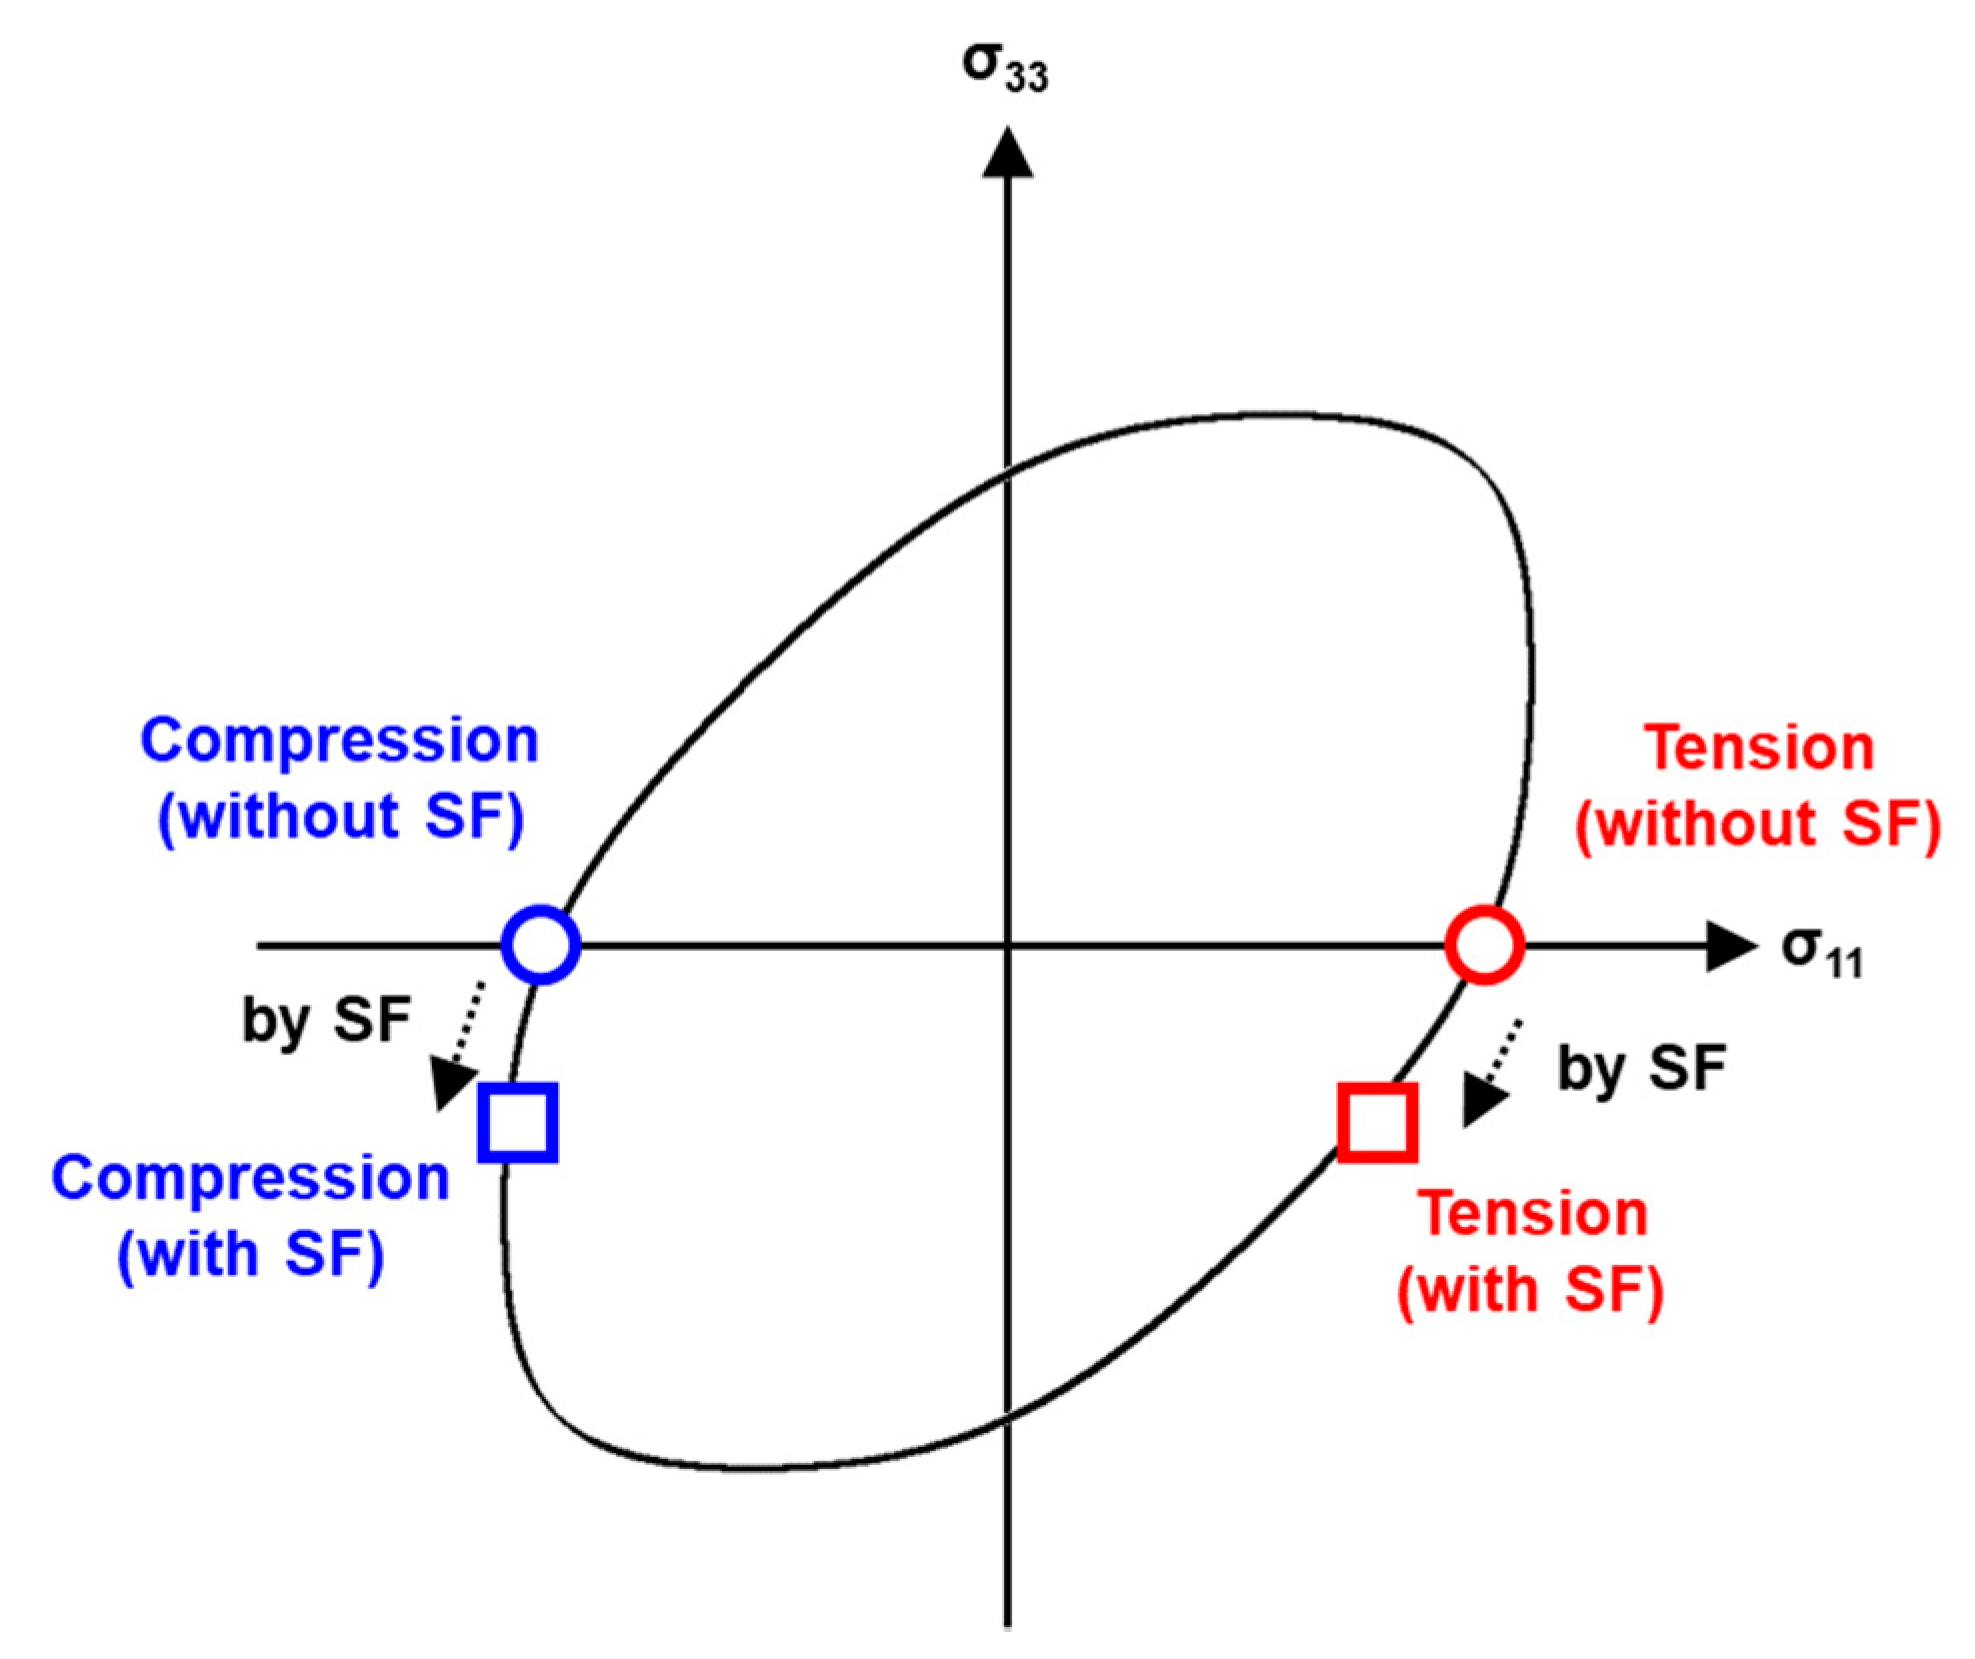
  • The measured apparent stress–strain curves of the low-carbon steel under side force showed the flow stress asymmetry of tension and compression, although low-carbon steel is known to have symmetric tension–compression strengths.
  • The finite element simulations confirmed that the flow stress asymmetry of the low-carbon steel originated from the biaxial stress effect (localisation of normal stress in the thickness direction because of non-uniform deformation) and the thickness effect (the change in the actual side force and thus the friction force due to thinning and thickening).
  • Decreasing the friction coefficient and side force is beneficial for the reduction in the apparent asymmetry.
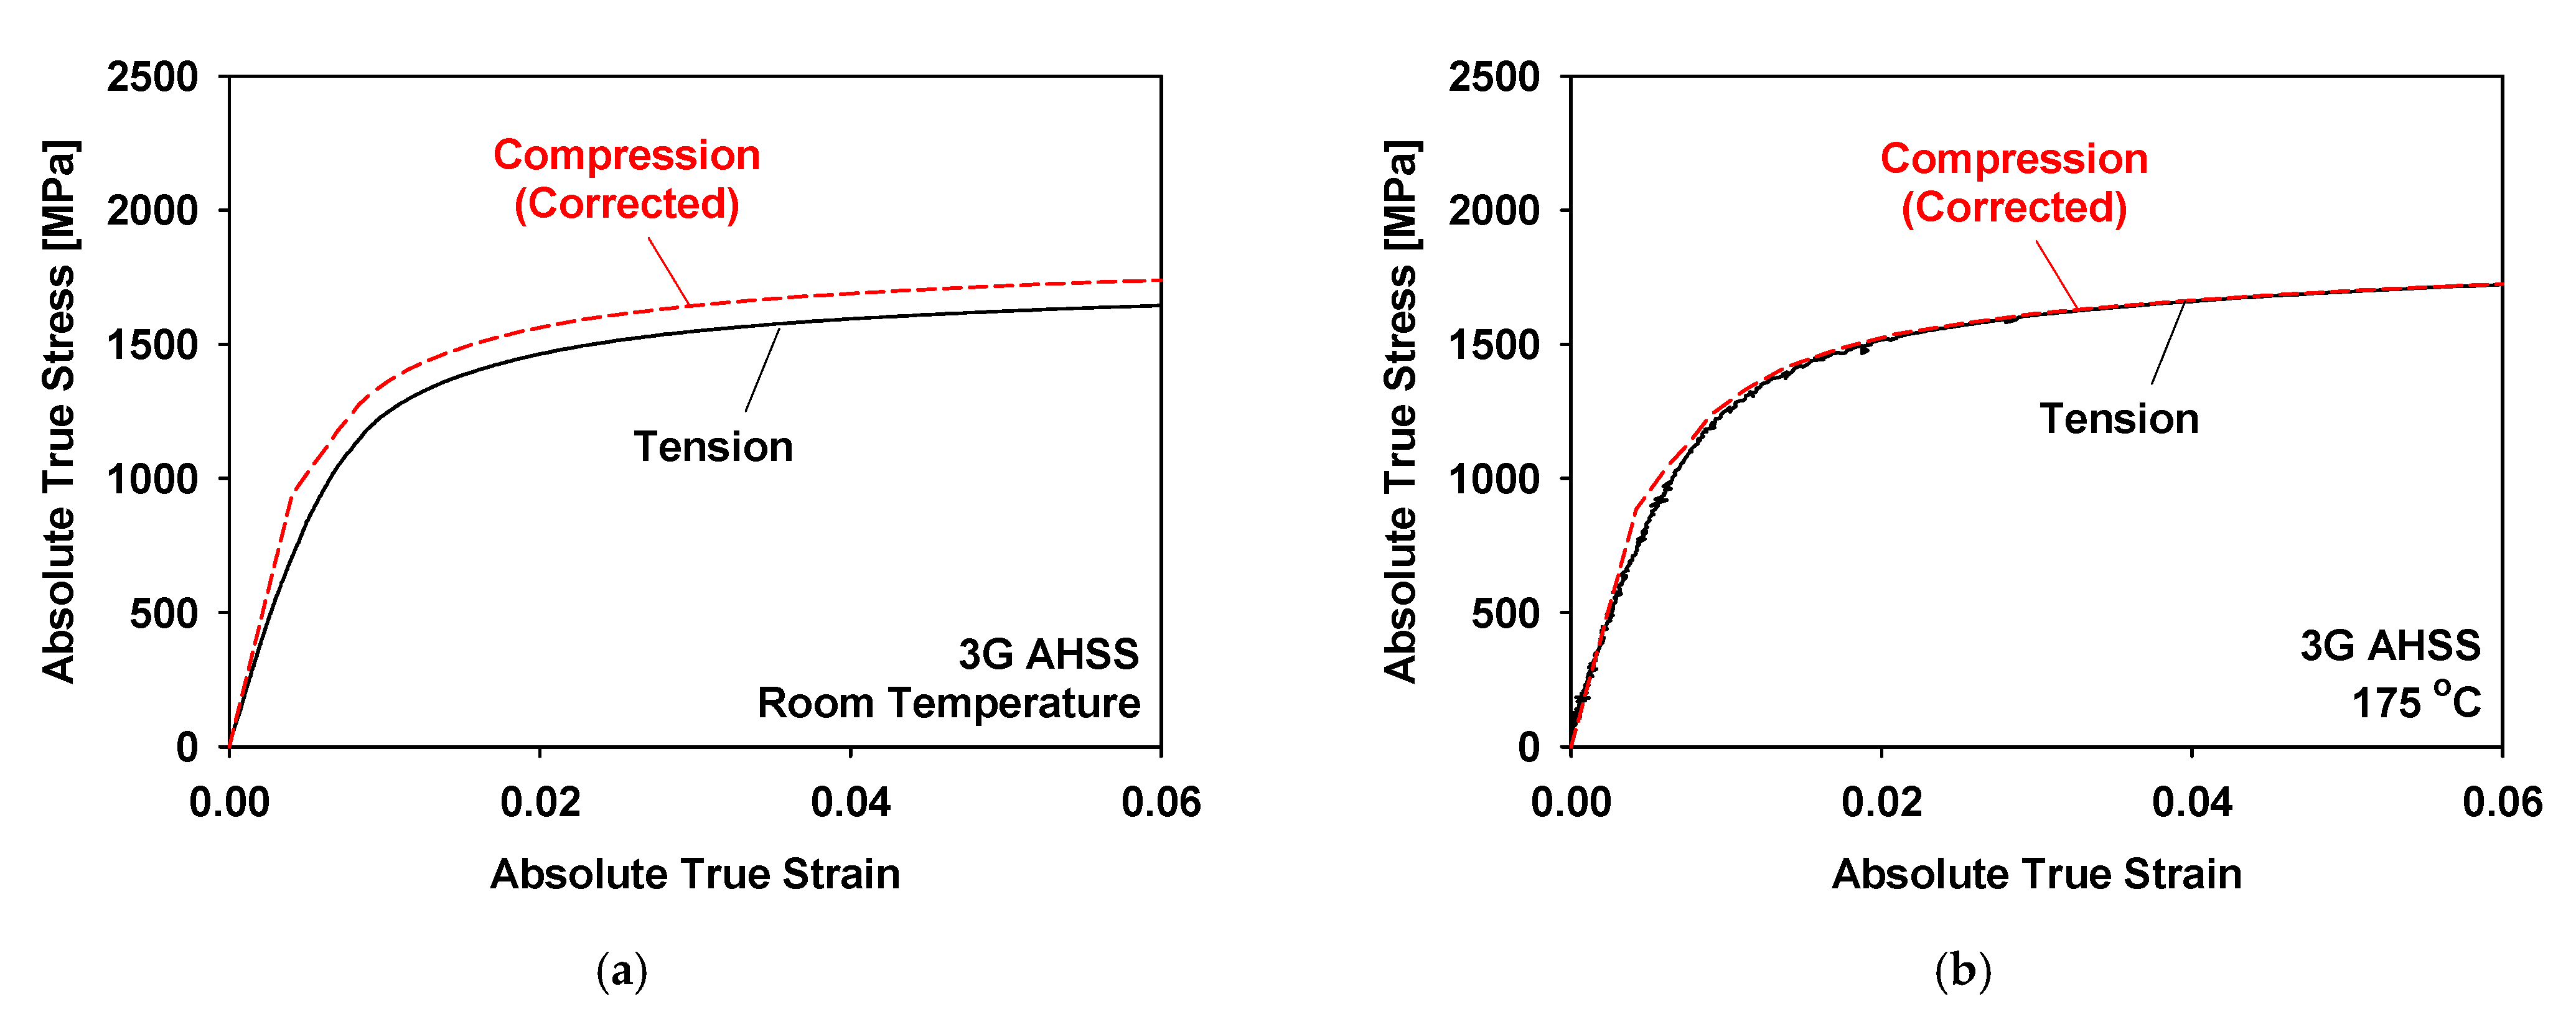
  • A data correction procedure based on the finite element method was proposed, and the corrected stress–strain curves of the low-carbon steel were symmetric.
  • The correction procedure was applied to the 3G AHSS at room temperature and 175 °C. The corrected compressive stress–strain curve was larger in magnitude than the tensile curve at room temperature, which is attributed to the TRIP effect. However, the asymmetry was significantly reduced at 175 °C.

Author Contributions

Conceptualisation, T.P. and J.H.K.; Investigation, J.K., J.J. and J.H.K.; Resources, D.K., Y.H.M., F.P. and J.H.K.; Writing—original draft, J.K., J.J. and J.H.K.; Writing—review & editing, J.J. and J.H.K. All authors have read and agreed to the published version of the manuscript.

Funding

This research was funded by the Financial Supporting Project of Long-term Overseas Dispatch of PNU’s Tenure-track Faculty, 2019.

Institutional Review Board Statement

Not applicable.

Informed Consent Statement

Not applicable.

Data Availability Statement

Not applicable.

Conflicts of Interest

The authors declare no conflict of interest.

References

  1. Yoshida, F.; Uemori, T.; Fujiwara, K. Elastic-plastic behavior of steel sheets under in-plane cyclic tension-compression at large strain. Int. J. Plast. 2002, 18, 633–659. [Google Scholar] [CrossRef]
  2. Chung, K.; Lee, M.G.; Kim, D.; Kim, C.; Wenner, M.L.; Barlat, F. Spring-back evaluation of automotive sheets based on isotropic-kinematic hardening laws and non-quadratic anisotropic yield functions part I: Theory and formulation. Int. J. Plast. 2005, 21, 861–882. [Google Scholar]
  3. Lee, M.G.; Kim, D.; Kim, C.; Wenner, M.L.; Wagoner, R.H.; Chung, K. Spring-back evaluation of automotive sheets based on isotropic-kinematic hardening laws and non-quadratic anisotropic yield functions part II: Characterization of material properties. Int. J. Plast. 2005, 21, 883–914. [Google Scholar]
  4. Kim, J.H.; Lee, M.G.; Kim, S.J.; Chung, K.; Wagoner, R.H. Reverse effect of tensile force on sidewall curl for materials with tensile/compressive strength difference. Metals Mater. Int. 2009, 15, 353–363. [Google Scholar] [CrossRef]
  5. Sun, L.; Wagoner, R.H. Complex unloading behavior: Nature of the deformation and its consistent constitutive representation. Int. J. Plast. 2011, 27, 1126–1144. [Google Scholar] [CrossRef]
  6. Lee, J.W.; Lee, M.G.; Barlat, F. Finite element modeling using homogeneous anisotropic hardening and application to spring-back prediction. Int. J. Plast. 2012, 29, 13–41. [Google Scholar] [CrossRef]
  7. Lee, J.; Lee, J.Y.; Barlat, F.; Wagoner, R.H.; Chung, K.; Lee, M.G. Extension of quasi-plastic-elastic approach to incorporate complex plastic flow behaviour—Application to springback of advanced high-strength steels. Int. J. Plast. 2013, 45, 140–159. [Google Scholar] [CrossRef]
  8. Lee, E.H.; Stoughton, T.B.; Yoon, J.W. A new strategy to describe nonlinear elastic and asymmetric plastic behaviors with one yield surface. Int. J. Plast. 2017, 98, 217–238. [Google Scholar] [CrossRef]
  9. Jung, J.; Jun, S.; Lee, H.S.; Kim, B.M.; Lee, M.G.; Kim, J.H. Anisotropic hardening behaviour and springback of advanced high-strength steels. Metals 2017, 7, 480. [Google Scholar] [CrossRef] [Green Version]
  10. Jung, J.; Hur, Y.C.; Jun, S.; Lee, H.S.; Kim, B.M.; Kim, J.H. Constitutive modeling of asymmetric hardening behavior of transformation-induced plasticity steels. Int. J. Automot. Technol. 2019, 20, 19–30. [Google Scholar] [CrossRef]
  11. Merklein, M.; Lechner, M.; Gröbel, D.; Löffler, M.; Schneider, T.; Schulte, R.; Hildenbrand, P. Innovative approaches for controlling the material flow in sheet-bulk metal forming processes. Manuf. Rev. 2016, 3, 2. [Google Scholar] [CrossRef] [Green Version]
  12. Ahmed, S.; Lyu, T.; Löhnert, S.; Wriggers, P. Multilevel Material Modeling to Study Plastic Deformation for Sheet-Bulk Metal Forming Under Different Loading Histories. In Sheet Bulk Metal Forming; TCRC73 2020. Lecture Notes in Production Engineering; Merklein, M., Tekkaya, A.E., Behrens, B.A., Eds.; Springer: Cham, Switzerland, 2021; pp. 334–353. [Google Scholar]
  13. Alves, L.; Nielsen, C.; Martins, P. Revisiting the Fundamentals and Capabilities of the Stack Compression Test. Exp. Mech. 2011, 51, 1565–1572. [Google Scholar] [CrossRef]
  14. Martínez, A.; Miguel, V.; Coello, J.; Manjabacas, M. Determining stress distribution by tension and by compression applied to steel: Special analysis for TRIP steel sheets. Mater. Des. 2017, 125, 11–25. [Google Scholar] [CrossRef]
  15. Sun, L.; Wagoner, R.H. Proportional and non-proportional hardening behavior of dual-phase steels. Int. J. Plast. 2013, 45, 174–187. [Google Scholar] [CrossRef]
  16. Seo, K.Y.; Kim, J.H.; Lee, H.S.; Kim, J.H.; Kim, B.M. Effect of constitutive equations on springback prediction accuracy in the TRIP1180 cold stamping. Metals 2017, 8, 18. [Google Scholar] [CrossRef] [Green Version]
  17. Park, T.; Hector, L.G.; Hu, X.; Abu-Farha, F.; Fellinger, M.R.; Kim, H.; Esmaeilpour, R.; Pourboghrat, F. Crystal plasticity modeling of 3G multi-phase AHSS with martensitic transformation. Int. J. Plast. 2019, 120, 1–46. [Google Scholar] [CrossRef]
  18. Kuwabara, T.; Kumano, Y.; Ziegelheim, J.; Kurosaki, I. Tension–compression asymmetry of phosphor bronze for electronic parts and its effect on bending behavior. Int. J. Plast. 2009, 25, 1759–1776. [Google Scholar] [CrossRef]
  19. Maeda, T.; Noma, N.; Kuwabara, T.; Barlat, F.; Korkolis, Y.P. Experimental verification of the tension-compression asymmetry of the flow stresses of a high strength steel sheet. Int. Conf. Technol. Plast. 2017, 207, 1976–1981. [Google Scholar] [CrossRef]
  20. Maeda, T.; Noma, N.; Kuwabara, T.; Barlat, F.; Korkolis, Y.P. Measurement of the strength differential effect of DP980 steel sheet and experimental validation using pure bending test. J. Mater. Process. Technol. 2018, 256, 247–253. [Google Scholar] [CrossRef]
  21. Lee, M.G.; Kim, J.H.; Kim, D.; Seo, O.S.; Nguyen, N.T.; Kim, H.Y. Anisotropic hardening of sheet metals at elevated temperature: Tension-compressions test development and validation. Exp. Mech. 2013, 53, 1039–1055. [Google Scholar] [CrossRef]
  22. Ayllón, J.; Miguel, V.; Martínez-Martínez, A.; Coello, J.; Naranjo, J.A. A new approach for obtaining the compression behavior of anisotropic sheet metals application to a wide range of test conditions. Metals 2020, 10, 1374. [Google Scholar] [CrossRef]
  23. Boger, R.K.; Wagoner, R.H.; Barlat, F.; Lee, M.G.; Chung, K. Continuous, large strain, tension/compression testing of sheet material. Int. J. Plast. 2005, 21, 2319–2343. [Google Scholar] [CrossRef]
  24. Piao, K.; Lee, J.K.; Kim, J.H.; Kim, H.Y.; Chung, K.; Barlat, F.; Wagoner, R.H. A sheet tension/compression test for elevated temperature. Int. J. Plast. 2012, 38, 27–46. [Google Scholar] [CrossRef]
  25. Bae, G.H.; Huh, H. Tension/compression test of auto-body steel sheets with the variation of the pre-strain and the strain rate. Mater. Charact. 2011, 72, 213–225. [Google Scholar]
  26. Cao, J.; Lee, W.; Cheng, H.S.; Seniw, M.; Wang, H.P.; Chung, K. Experimental and numerical investigation of combined isotropic-kinematic hardening behavior of sheet metals. Int. J. Plast. 2009, 25, 942–972. [Google Scholar] [CrossRef]
  27. Barienti, K.; Klein, M.; Wackenrohr, S.; Herbst, S.; Nurnberger, F.; Maier, H.J. Influence of pre-strain on very-low-cycle stress-strain response and springback behavior. J. Mater. Eng. Perform. 2021, 30, 33–41. [Google Scholar] [CrossRef]
  28. Joo, G.; Huh, H. Rate-dependent isotropic—Kinematic hardening model in tension—Compression of TRIP and TWIP steel sheets. Int. J. Mech. Sci. 2018, 146–147, 432–444. [Google Scholar] [CrossRef]
  29. Stoudt, M.R.; Levine, L.E.; Ma, L. Designing a uniaxial tension/compression test for springback analysis in high-strength steel sheets. Exp. Mech. 2017, 57, 155–163. [Google Scholar] [CrossRef] [Green Version]
  30. Zhou, P.; Beeh, E.; Friedrich, H. Influence of tension-compression asymmetry on the mechanical behavior of AZ31B magnesium alloy sheets in bending. J. Mater. Eng. Perform. 2016, 25, 853–865. [Google Scholar] [CrossRef] [Green Version]
  31. Olson, G.B.; Cohen, M. Stress-assisted isothermal martensitic transformation: Application to TRIP steels. Metall. Trans. A 1982, 13, 1907–1914. [Google Scholar] [CrossRef]
  32. Iwamoto, T.; Tsuta, T.; Tomita, Y. Investigation on deformation mode dependence of strain-induced martensitic transformation in TRIP steels and modelling of transformation kinetics. Int. J. Mech. Sci. 1998, 40, 173–182. [Google Scholar] [CrossRef]
  33. Tomita, Y.; Iwamoto, T. Computational prediction of deformation behavior of TRIP steels under cyclic loading. Int. J. Mech. Sci. 2001, 43, 2017–2034. [Google Scholar] [CrossRef] [Green Version]
  34. Lee, J.; Ha, J.; Bong, H.J.; Kim, D.; Lee, M.G. Evolutionary anisotropy and flow stress in advanced high strength steels under loading path changes. Mater. Sci. Eng. A 2016, 672, 65–77. [Google Scholar] [CrossRef]
  35. Stringfellow, R.G.; Parks, D.M.; Olson, G.B. A constitutive model for transformation plasticity accompanying strain-induced martensitic transformations in metastable austenitic steels. Acta Metall. Mater. 1992, 40, 1703–1716. [Google Scholar] [CrossRef]
  36. Kim, H.; Lee, J.; Barlat, F.; Kim, D.; Lee, M. Experiment and modeling to investigate the effect of stress state, strain and temperature on martensitic phase transformation in TRIP-assisted steel. Acta Mater. 2015, 97, 435–444. [Google Scholar] [CrossRef]
Figure 1. Tension–compression tester: (a) the exploded and (b) assembled views, and (c) the experimental setup.
Metals 12 00161 g001aMetals 12 00161 g001b
Figure 2. Specimen for tension-compression testing: (a) arrangement of the specimen, bar, and jaws, (b) dimensions, and (c) side surface for DIC measurement.
Metals 12 00161 g002
Figure 3. Measured friction coefficients at various temperatures.
Metals 12 00161 g003
Figure 4. Finite element model of the sheet compression test.
Metals 12 00161 g004
Figure 5. Engineering stress–strain curves of the sheet materials: (a) the low-carbon steel and (b) the 3G AHSS.
Metals 12 00161 g005
Figure 6. Flow stress–equivalent plastic strain curves of the sheet materials: (a) low-carbon steel and (b) 3G AHSS.
Metals 12 00161 g006
Figure 7. Apparent absolute true stress–strain curves of the low-carbon steel.
Metals 12 00161 g007
Figure 8. Comparison of the measured and FE calculated absolute true stress–strain curves of the low-carbon steel: (a) tensile and (b) compressive tests.
Metals 12 00161 g008
Figure 9. Schematic representation of the biaxial effect.
Metals 12 00161 g009
Figure 10. Normal stress distribution during the tensile and compressive tests under side force at the strain of 0.005.
Metals 12 00161 g010
Figure 11. Schematic representation of the (a) thinning and (b) thickening of the specimen during tension and compression, respectively.
Metals 12 00161 g011aMetals 12 00161 g011b
Figure 12. Comparison of the forces acting on the lower anti-buckling bar during tension and compression.
Metals 12 00161 g012
Figure 13. FE calculated stress–strain curves with various friction coefficients for (a) tensile and (b) compressive tests.
Metals 12 00161 g013
Figure 14. FE calculated stress–strain curves with various side forces for (a) tensile and (b) compressive tests.
Metals 12 00161 g014
Figure 15. Corrected absolute true stress–strain curves of the low-carbon steel for tension and compression.
Metals 12 00161 g015
Figure 16. Apparent absolute true stress–strain curves of 3G AHSS at (a) room temperature, and (b) 175 °C.
Metals 12 00161 g016
Figure 17. Comparison of the measured and FE calculated absolute true stress–strain curves of 3G AHSS: (a) tensile and (b) compressive tests.
Metals 12 00161 g017
Figure 18. Corrected absolute true stress-strain curves of 3G AHSS at (a) room temperature, and (b) 175 °C for tension and compression.
Metals 12 00161 g018
Table 1. In-plane sheet compression test designs.
TypeOpeningSide ForceStrain MeasurementCorrectionSource
CombShoulderHydraulic actuatorStrain gaugeNone[18,19,20]
ShoulderHydraulic actuatorLaser extensometerFriction [9,21]
None Bolt Ex-situ cross-section measurement Friction[22]
PlateShoulderCoil-springClip-on extensometerNone[1]
GripHydraulic actuatorLaser extensometerFriction and biaxial stress effect [23,24]
GripCoil-springDigital image correlationFriction and biaxial stress effect[25]
NoneBoltLaser extensometerNone[26]
GripBoltClip-on extensometerNone[27]
GripCoil-springDigital image correlationNone[28]
GripHydraulicDigital image correlationFriction [29]
GrooveGauge regionNoneDigital image correlationNone[30]
Table 2. Tensile properties and hardening parameters.
MaterialLow-Carbon Steel3G AHSS
TemperatureRTRT175 °C
Yield Strength [MPa]390.410261109
Tensile Strength [MPa]495.015461622
Elongation [%]34.0611.1311.84
Equivalent plastic strain limit for tabular input0.240.060.07
σ ¯ 0 [MPa]545.416111632
Q [MPa]156,185223.8414.5
b0.00214.4735.696
Publisher’s Note: MDPI stays neutral with regard to jurisdictional claims in published maps and institutional affiliations.

