Review

E-Waste Recycling and Resource Recovery: A Review on Technologies, Barriers and Enablers with a Focus on Oceania

by
Jonovan Van Yken
1,2,
Naomi J. Boxall
1,
Ka Yu Cheng
1,3,
Aleksandar N. Nikoloski
3,
Navid R. Moheimani
2 and
Anna H. Kaksonen
1,4,*
1
Commonwealth Scientific and Industrial Research Organisation (CSIRO) Land and Water, 147 Underwood Avenue, Floreat, WA 6014, Australia
2
Algae R & D Centre, Environmental and Conservation Sciences, College of Science, Health, Engineering and Education, Murdoch University, 90 South Street, Murdoch, WA 6150, Australia
3
Harry Butler Institute (Centre for Water, Energy and Waste), College of Science, Health, Engineering and Education, Murdoch University, Murdoch, WA 6150, Australia
4
School of Biomedical Sciences, University of Western Australia, Crawley, WA 6009, Australia
*
Author to whom correspondence should be addressed.
Metals 2021, 11(8), 1313; https://doi.org/10.3390/met11081313
Submission received: 5 July 2021 / Revised: 6 August 2021 / Accepted: 16 August 2021 / Published: 19 August 2021
(This article belongs to the Special Issue Processing and Characterization of Metal Containing Wastes)

Abstract

:
Electronic e-waste (e-waste) is a growing problem worldwide. In 2019, total global production reached 53.6 million tons, and is estimated to increase to 74.7 million tons by 2030. This rapid increase is largely fuelled by higher consumption rates of electrical and electronic goods, shorter life cycles and fewer repair options. E-waste is classed as a hazardous substance, and if not collected and recycled properly, can have adverse environmental impacts. The recoverable material in e-waste represents significant economic value, with the total value of e-waste generated in 2019 estimated to be US $57 billion. Despite the inherent value of this waste, only 17.4% of e-waste was recycled globally in 2019, which highlights the need to establish proper recycling processes at a regional level. This review provides an overview of global e-waste production and current technologies for recycling e-waste and recovery of valuable material such as glass, plastic and metals. The paper also discusses the barriers and enablers influencing e-waste recycling with a specific focus on Oceania.

1. Introduction

When electrical and electronic equipment (EEE) reaches the end of its lifecycle it becomes electronic waste (e-waste). A total of 54 different product types are classified as e-waste, and these are grouped into six categories: large equipment, small equipment, temperature exchange equipment, screens and monitors, small information exchange equipment and lamps (Figure 1) [1]. The demand for EEE is increasing worldwide, fueled by a rapid increase in technological advancement, increasing dependence on technology and increasing disposable income [2,3]. Economies of scale in production have resulted in a dynamic change, where EEE is more easily accessible and often more affordable to replace than to repair [4]. The generation of e-waste varies significantly worldwide, depending on economic, social and political factors [1,3]. Countries producing the most e-waste include China, the United States of America (USA), India, Japan, and Brazil (Figure 2). In 2019, a total of 53.6 million tons (Mt) of e-waste was generated globally, exceeding previously predicted numbers. It is estimated that annual e-waste generation will increase to 74.7 Mt by 2030 [1]. In addition, the rate of e-waste generation is also increasing, with a current generation of 3–5% [5].
Globally, only 17.4% of e-waste was recycled properly in 2019, with the remaining 82.6% either not recycled or not formally tracked [1]. The recycling rate has only slightly improved from the rate calculated in 2014 (17%) [1], which indicates that measures employed to improve global e-waste recycling [6] have not been able to compete with the increased generation rate. The e-waste recycling rates are highest in Europe (Figure 3), with countries such as Germany and the United Kingdom (UK) recycling more than 50% of the e-waste generated in 2017 [5]. In contrast, countries in Asia and South America, such as India (0.92%), Russia (5%), and Brazil (0.006%) have low e-waste recycling rates [5]. Often, poor recycling rates are due to the lack of legislation governing the collection, processing and recovery of materials from e-waste, as well as the lack of infrastructure for e-waste processing [1,5]. This can be seen in the European Union, which has a Waste Electrical and Electronic Equipment (WEEE) directive that covers the entire population and sets the standards for e-waste recycling. This is one of the factors enabling the European Union to have the highest recycling rate globally in 2019 [1].
E-waste from high quantities of post-consumer products is among the most complex and persistent type of municipal waste generated by society [7]. Technological advancement enables the manufacture of electronic products that are more efficient and less resource-intensive yet are more complex in nature consisting of a diverse range of materials [8]. Often, the heterogeneity of materials is governed by the application, as well as its structure such as the type, thickness and layers of plastic, soldering and adhesive used [9]. A key hurdle in recycling e-waste lies in the highly heterogeneous and complex nature of its composition, which makes it more difficult to process when it is mixed with general household waste. Following separation and collection, a typical composition of materials present in a clean e-waste stream is shown in Figure 4 [10]. Collectively, e-waste can contain up to 69 different metals, including base metals, precious metals and rare earth elements (61% for all metals) [1,8,9,11], as well as plastics (20%), ceramic (2%), glass (5%), wood (3%), rubber (1%) and pollutants (5%) [10]. The construction of products that form e-waste, including combining different materials in a single part, further complicates the processing and recovery of materials from these wastes. The increase in the complexity of technology also makes it more difficult to repair existing electronic goods resulting in shorter life cycles [4].
Resource recovery from e-waste is often referred to as urban mining, as the metals in e-waste represent a significant monetary value that is permanently lost from the market. The estimated value of all raw materials in global e-waste was approximately US $57 billion in 2019 [1]. Printed circuit boards (PCB) are the most valuable component of e-waste due to their high precious and base metal content, but they only comprise approximately 3–6% of all e-waste [12]. As with most e-waste, PCBs are highly heterogeneous, with the composition depending on the original function. PCBs are composed of a mixture of metals (40%), plastics (30%) and ceramics (30%) [13]. Of the metals, most PCBs comprise copper (10–27%), nickel (0.3–2%), zinc (0.03–0.42%), tin (0.08–0.9%), aluminium (2–19%) and iron (8–38%) [12,14,15,16]. In addition, high-grade PCB’s can also contain metals of high value such as gold (250–2050 ppm), silver (110–4500 ppm) and palladium (40–4000 ppm) [16,17].
As primary metal resources are depleted [18], it will be critical to recovery and reuse many metals and rare earth elements from secondary resources, like e-waste. For example, the demand for copper is expected to increase by 275–300% by the year 2050, and this is unlikely to be met through mining of current virgin minerals [19]. Metals such as iron and aluminum are also in demand for the manufacture of electronic goods [11]. Based on the waste generation data for 2019, it would be possible to recover metals with a combined value of US $57 billion, which could be used to meet the metal demand created by the manufacture of new electrical equipment Table 1 [1].
Recycling e-waste is important from an energy conservation perspective as well. Using materials recycled from e-waste to supplement virgin resources can result in major energy savings and can also lessen the environmental impact associated with the mining and refining of raw materials. This could result in up to 95% energy savings for aluminium, 85% for copper and 74% for lead and steel [4,19]. There are also considerably lower CO2 emissions from recycling e-waste compared to processing virgin materials, which was shown in 2019, where e-waste recycling reduced global CO2 by an equivalent of 15 Mt by providing an alternative to mining and processing virgin minerals [1]. It was also estimated that by recycling all e-waste generated in 2019, CO2 emissions could be reduced by an additional 83 Mt [1].
In addition to the economic benefits of e-waste recycling, it is also important to consider the impact that unrecycled or improperly treated e-waste has on the environment. In particular, PCBs are composed of a range of hazardous materials, including lead, mercury, brominated flame retardants (BFR), chlorofluorocarbons and hydrochlorofluorocarbons [20]. If improperly handled and disposed of in unlined landfills, these compounds contaminate groundwater and pose a significant risk to the environment and human health [21]. In some circumstances, PCBs are processed by uncontrolled burning, and in the absence of proper infrastructure to contain dangerous gas emissions, e-waste can cause water and air contamination [2,22]. It was estimated that in 2019, a total of 50 t of mercury and 71 kt of brominated flame retardants were present in undocumented and untracked e-waste, which would largely be released into the environment [1].
Because of its positive economic and environmental impacts, recycling of e-waste supports the United Nations Sustainable Development Goals (SDGs). These include goals of good health and wellbeing (SDG3), clean water and sanitation (SDG 6) decent work and economic growth (SDG8), sustainable cities and communities (SDG 11) as well as responsible consumption and production (SDG14) [23]. In response to the SDGs, much effort has been targeted at developing (i) new strategies to minimise the generation of e-waste, through reuse or repurposing where possible, and (ii) technologies for e-waste recycling to enable recovery of valuable minerals and minimise risks to human health and the environment.
The development and application of new technologies for e-waste recycling is dependent on the techno-economic feasibility of the process, and largely depends on geographic, economic, social and legislative circumstances [1,9]. Therefore, these factors need to be considered when selecting and implementing technologies for e-waste recycling. A number of reviews have been published investigating the use of pyrometallurgy and hydrometallurgy (including biohydrometallurgy) in recycling e-waste, particularly for the recovery of metal content from these wastes [8,9,24,25,26,27]. In addition, the environmental impact of e-waste has been well documented, with many studies providing a life cycle assessment of technology applications for e-waste recycling in specific countries such as China [28] and regions such as Asia, Europe and North America [29]. These studies are often waste-specific, focusing on a single stream of e-waste, such as mobile phones [30] or PCBs [31].
Although there is plenty of research focusing on the fate, recycling options and potential recoverable value from e-waste generated globally or in high e-waste generating regions such as Asia and Europe, there is little work investigating the Oceania region, which comprises Australia, New Zealand and the Pacific island region (PIR) [1]. This region has one of the highest per capita generations of e-waste, as well as one of the lowest recycling rates. Despite being the lowest e-waste generating region globally, the volume of e-waste generated has increased by 14.2% since 2014 [1]. In 2019, this region generated 0.7 Mt of e-waste, which had an estimated value of US $0.7 billion [1]. Despite this economic incentive, only 8.8% of e-waste was collected and properly recycled [1]. Therefore, there is potential for significant growth of the recycling industry in this region. In this article, we review the barriers and enablers that affect e-waste recycling, with a focus on the Oceania region.

2. Barriers and Enablers for E-Waste Recycling with a Focus on Oceania

The collection and recycling of e-waste vary significantly globally (Figure 2). For example, Europe generates the most e-waste per capita (16.2 kg) yet it excels at collecting and recycling e-waste (42.5%), setting the standard worldwide [1]. In contrast, Oceania generates similar amounts of e-waste per capita (16.1 kg) as Europe but in comparison, has one of the lowest recycling rates in the world (8.8%) [1]. It is therefore important to investigate the variables that affect the collection and recycling of e-waste in Oceania. Political, economic, social, technological, legal and environmental factors that influence e-waste collection and recycling in Oceania were reviewed using the PESTLE framework [32].

2.1. Political, Legal, and Social Factors
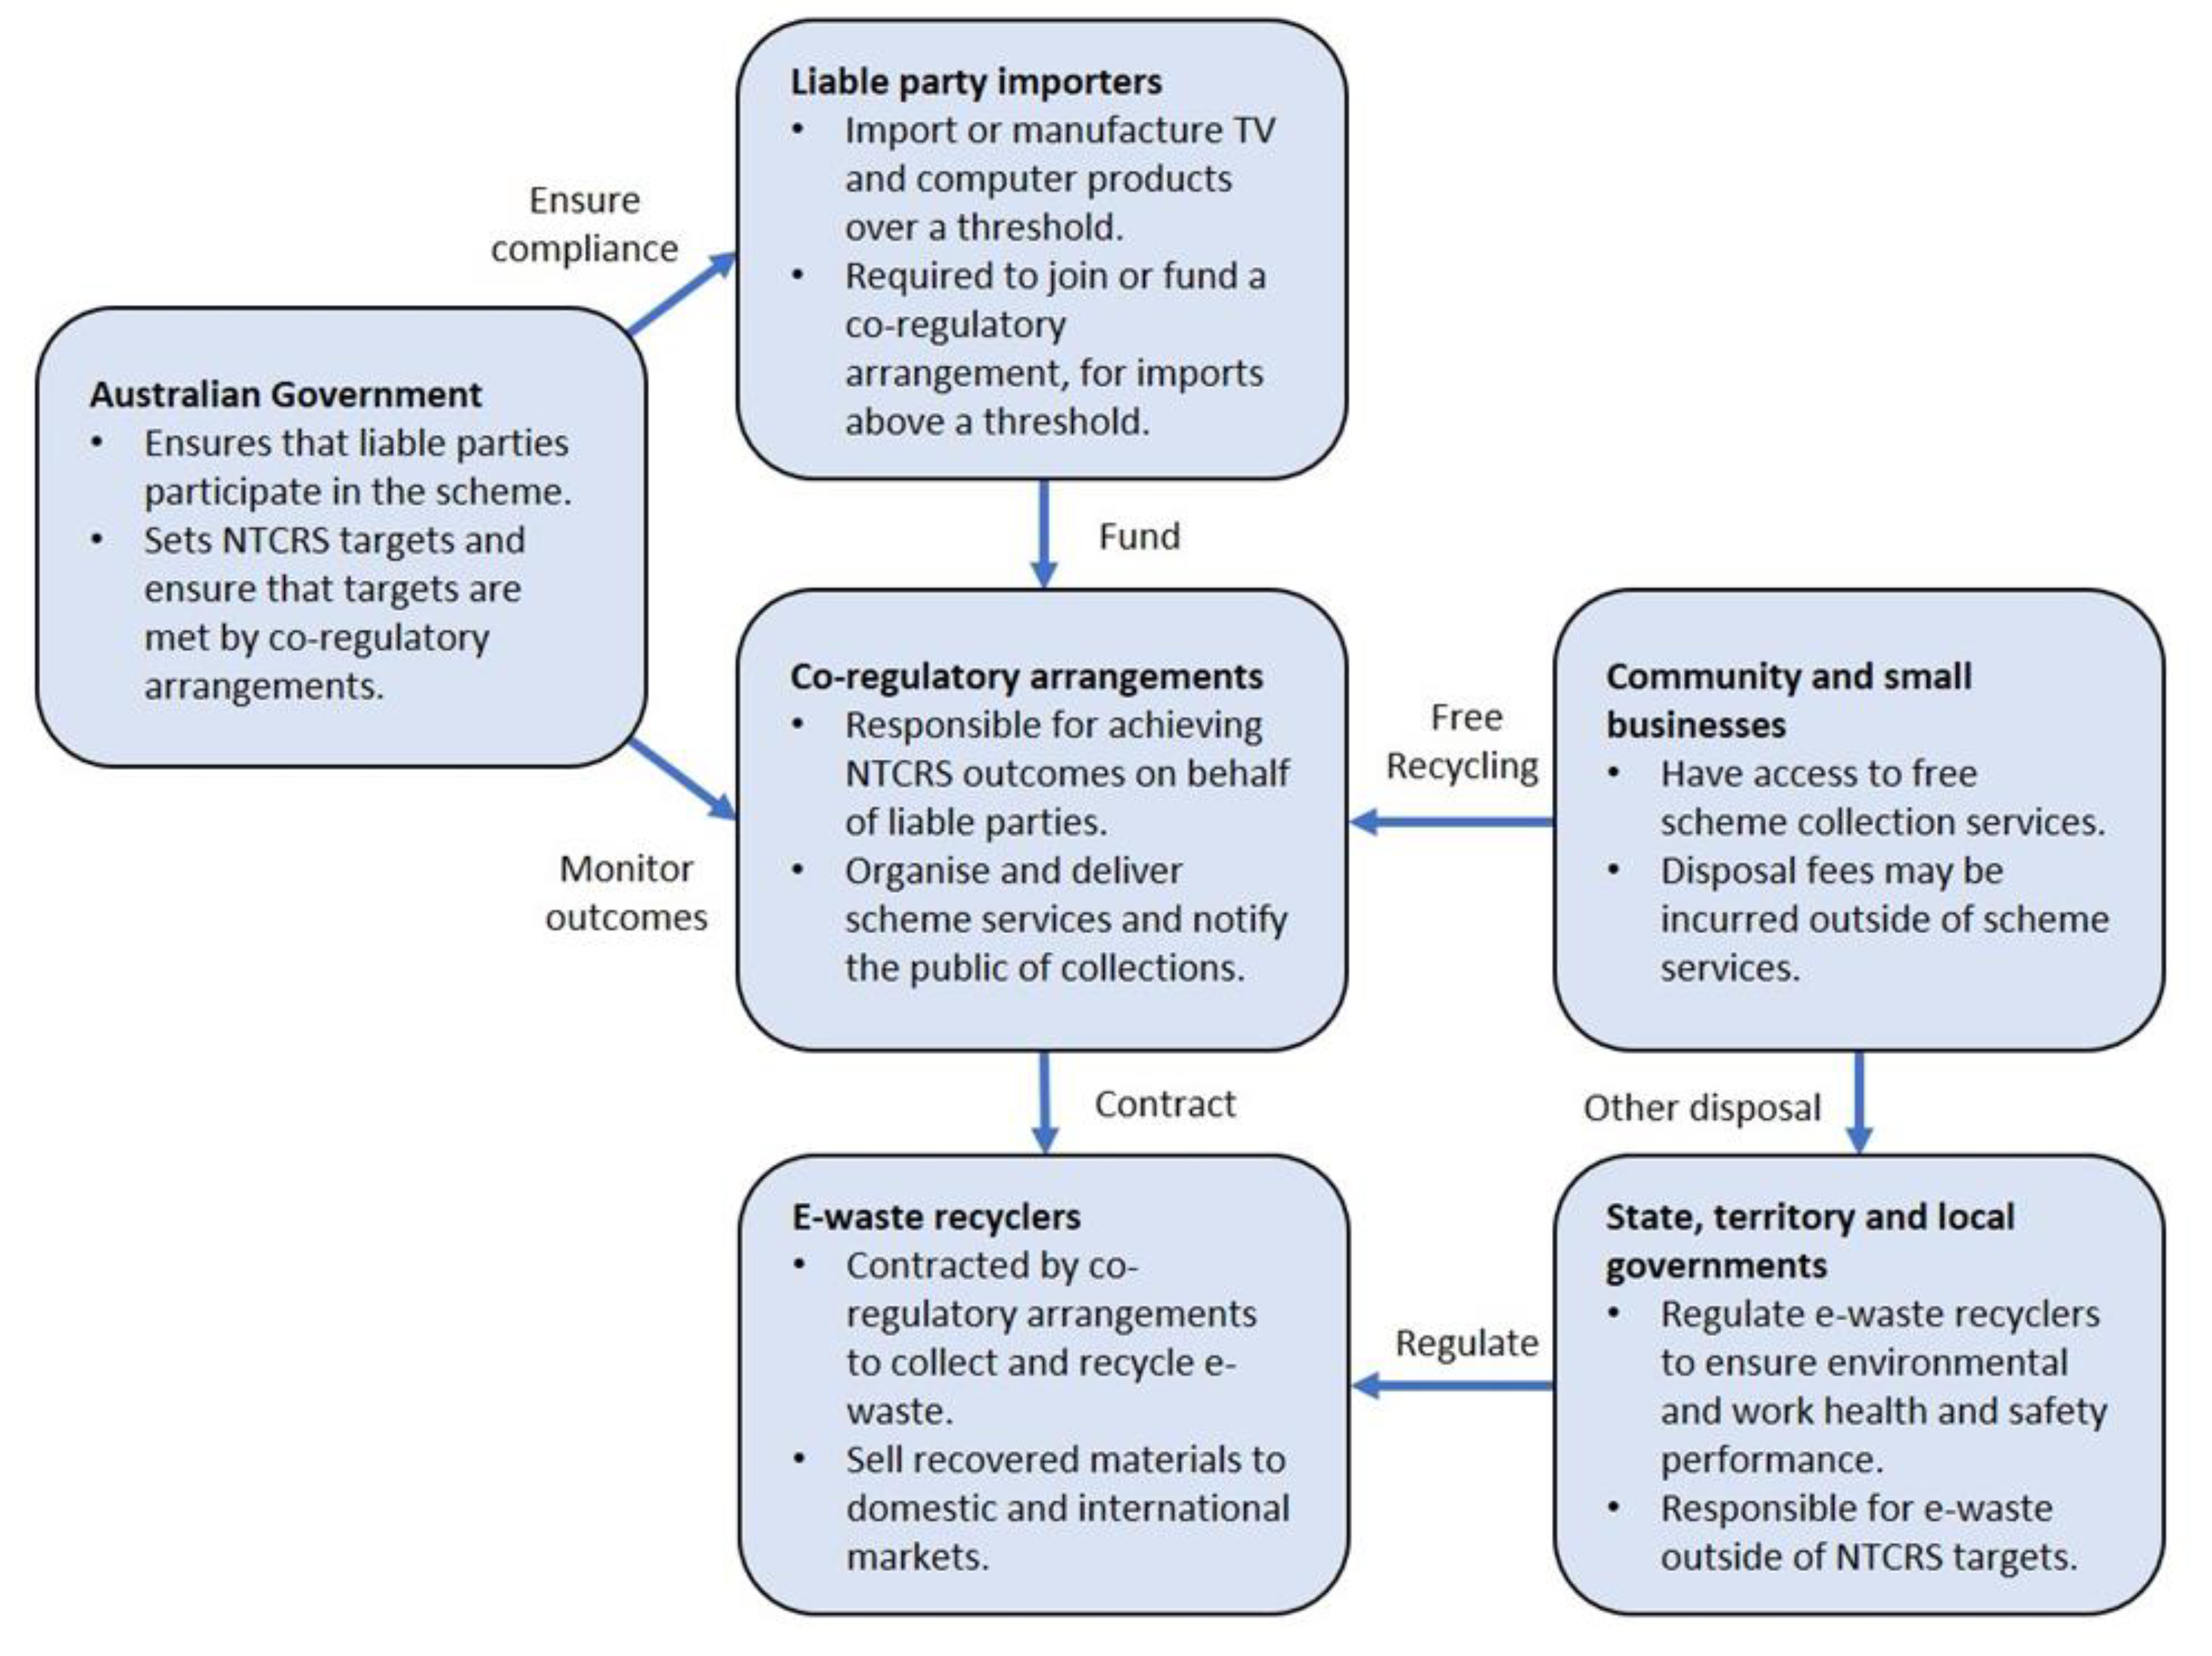
Oceania consists of Australia, New Zealand and the PIR, which can be divided into Melanesia, Micronesia and Polynesia. The total population of this region is approximately 41.5 million people, with Australia and New Zealand contributing 98% of this population [1]. Consequently, they also generate the most e-waste in the region. Some of the barriers and enablers influencing the collection and recycling of e-waste in this region are the political, legal and social factors, and these will be discussed as relevant for the member countries of Oceania.

2.1.1. Australia

Australia is the only country in Oceania with an e-waste management policy. This policy is known as the Product Stewardship Act and was established in 2011 [33]. The policy is a form of extended producer responsibility (EPR), which aims “to effectively manage the environmental, health and safety impacts of products, and in particular, those impacts associated with the disposal of products and their associated waste” [33]. Under this policy, the National Television and Computer Recycling Scheme (NTCRS) was established in 2012 [34], ensuring that all manufacturers and importers with an EEE import volume of more than 5000 products or 15,000 peripherals are liable partners and are required to help fund the NTCRS and the recycling and recovery of materials from television and computer wastes [35]. The amount of e-waste recycled since the scheme was implemented has steadily increased, and a total of 230,000 tons of e-waste were recycled up to 2018 [34].The NTCRS is now regulated by the Recycling and Waste Reduction Act 2020, and the Product Stewardship (TV and Computer) Regulations 2011.
The NTCRS aims to recycle 80% of computers and televisions by 2022 [36]. In 2015 there were more than 1200 collection points available across Australia where obsolete televisions and computers were collected [36]. In addition, Local Government Authorities (LGA) manage drop-off days, curbside collections as well as permanent site collections [37]. The collected waste is sent to co-regulatory arrangements (CRA), which store the waste and may conduct the first stage of recycling (sorting, dismantling, sizing), before transportation to licensed international recyclers [34]. The CRA manages the transportation of e-waste and audits the amount collected as well as the material recovered [34]. These CRAs are partially funded by liable partners as determined by the Product Stewardship Act 2011, in return for the safe and effective management of e-waste [34]. Some examples of CRAs in Australia are the Australian and New Zealand Recycling Platform (ANZRP), E-cycle Solutions, Sustainable Product Stewards, and the Activ Group Solutions [38]. An overview of the roles and responsibilities of the stakeholders of the NTCRS is shown in Figure 5.
Usually, after the initial processing, the CRA sends approximately 90% of the material to international recycling facilities that complete the recycling process. China is the major recipient of e-waste from Australia, receiving over 40% of e-waste collected since the start of the NTCRS, followed by Indonesia and Japan [37]. Australian e-waste export destinations in 2016 are shown in Figure 6.
Even though the NTCRS has notably promoted e-waste recycling in Australia, more effective efforts are required to further increase the e-waste recycling rate in Australia. In particular, the role and responsibility of stakeholders need to be more clearly defined. Currently, State and Local Governments are managing any e-waste collected outside of the targets set by the NTCRS and are under no obligation to assist CRAs [34]. In addition, there is significant variation between federal and state regulations. For example, currently only South Australia, the Australian Capital Territory and Victoria have a ban on e-waste in landfill. If a federal decision was made to ban e-waste in landfill, the entire country would have to enforce the regulation, not just specific states. Clearer definitions of responsibility are likely to be useful for increasing e-waste recycling at a local government level by reducing any confusion present.
Under the NTCRS, it is stated that reasonable access to collection points must be ensured for all citizens covered by the scheme. However, in regional towns, this requirement is difficult to achieve, as often a collection point is only avaialbe per 100 km radius [37]. In Western Australia, there was approximately one collection point for every 500,000 people in 2018 [37]. Studies have shown that one of the reasons that many customers do not recycle e-waste is because the collection points are too difficult to access, and the inconvenience outweighs the rewards [40,41,42] Accordingly, an increase in easy access points in metro areas, as well as collection points or services specifically targeting regional and rural areas are required [37]. It has been suggested that retailer-based drop-off points could work in regional and rural areas, an approach that would be suitable for the wider Oceania region considering the decentralized populations that are common throughout the region [34,43].
Additional efforts could be made to increase public awareness of the importance of e-waste recycling and highlight the location of collection points. It has been shown that lack of awareness of the issue is one of the major reasons why customers do not recycle e-waste [40,41,42]. There have been only a few public education campaigns in Australia on e-waste recycling [34]. For example, MobileMuster is a voluntary collection program that is managed by the Australian Mobile Telecommunication Association that aims to collect waste mobile phones before landfill [44]. MobileMuster has been collecting and recycling mobile phones since 1999 [44]. However, MobileMuster reported that only 46% of the public were aware of the program in 2005 [45]. This has only increased to 74% in 2018, despite $45 million investment from the telecommunications industry [44].
Although the recycling rate of e-waste in Australia has improved, it is still low and improvements can be made. Particularly, the scope of e-waste products included in the NTCRS of Australia needs to be expanded [34]. Currently, the NTCRS covers approximately only 10% of e-waste products generated in Australia [34,43]. Many e-waste categories, such as small equipment, temperature exchange equipment, and lamps, are not covered by any recycling schemes [34]. By expanding the scope of the NTCRS, more products will be covered and thereby the funding from liable partners under the co-regulatory product stewardship act will also be increased. In addition, more consumer recycling may occur as this would reduce confusion as to which products can be recycled [34].
As Australia is the only oceanic country with any product stewardship in place for consumer products, the development and application of schemes such as the NTCRS can be used as a regional model for other countries.

2.1.2. New Zealand

Despite being a high per capita e-waste generator (19.2 kg) [5], New Zealand does not have any e-waste management or regulated product stewardship policies [46]. Instead, New Zealand currently manages its e-waste via voluntary product stewardship schemes [47]. Examples of these include service provider take-back schemes and trade-in schemes, supplier trade back and trade-in schemes, as well as voluntary recycling drop-off points [47,48,49]. Depending on the product, this is most commonly a free service but can incur a charge from certain providers. E-waste generation in New Zealand is driven by the large purchasing power of the population, the steady population growth and increased dependence on technology, as well as the lack of ability to repair products [1,47].
There are numerous barriers to the recycling of e-waste in New Zealand. Lack of data is often considered one of the largest barriers, preventing the declaration of e-waste as a priority product by the Minister for the Environment, which would encourage the enforcement of mandatory product stewardship [46,47]. The New Zealand government also states that the cost of manual labour required for the disassembling and initial processing of e-waste is prohibitive [46]. This is unsurprising, as a study investigating e-waste recycling in Australia found that labour can account for up to 90% of the process cost [50]. It has been suggested that the adoption of mandatory product stewardship, which would facilitate proper tracking and collection of e-waste, could be a potential solution. Moreover, by enforcing a co-regulatory product stewardship policy similar to that of Australia, the cost of recycling e-waste in New Zealand could likely be reduced [47].

2.1.3. Pacific Islands Region (PIR)

The recycling of e-waste in the PIR is challenging. The region consists of 22 countries and territories, and like Australia, it has a highly decentralised population. E-waste generation in this region is one of the lowest in the world, largely due to low income and the small population [1]. The islands have limited land, making it difficult to build large-scale waste management and recycling infrastructure [1]. As a result, there are large stockpiles of e-waste that are not being recycled or disposed of in a safe manner [51]. The establishment of any e-waste management system is complicated due to the various governments from different countries that would need to be included in decision making [52]. In addition, the economic, social and environmental factors can vary significantly across the region. Some islands, like Palau, are members of the Basel Convention and have some private recycling companies starting to take an interest in e-waste recycling [52]. Others, like the Solomon Islands, are not members of the Basel Convention, have an underdeveloped recycling sector and have a mixture of both highly urbanised and rural areas [52].
The Secretariat of the Pacific Regional Environment Program (SPREP) has the lead responsibility for regional coordination and delivery of waste management in the Oceania region [51]. The program uses Cleaner Pacific 2025 as a management framework in guiding the actions of the various governments in the region. SPREP also works with key international and regional partners to combine sustainable funding sources and to support mechanisms for waste management [51,52]. For example, in conjunction with PacWaste, it conducted an in-depth analysis of 4 of the region’s islands to determine the various challenges faced by each island, as well as developing an initial management plan and budget and identifying potential industrial partners [52]. Some of the major issues identified are the lack of government-enforced acts and regulations, lack of industry knowledge on how to establish recycling facilities and lack of public awareness [51,52]. It was proposed that a mandatory product stewardship policy along with an advance recycling fee would incentivise both local and international industry to work in this region. Collaboration across the islands should be encouraged and promoted, by sharing both resources such as equipment and expertise and the best techniques to employ these.

2.1.4. Policy Recommendations for Oceania

Effective policy enforcement underpins the success of the recycling practices in Oceania. Australia is an example of both the challenges faced by this region as well as the incentives for recycling. Australia has shown success in collecting and recycling of e-waste, specifically computers and televisions, largely attributed to the important role of EPR. Presumably, a similar system could be employed across Oceania. However, there are conceivable barriers specific to the region.
One of the largest barriers is collecting a sufficient amount of e-waste to sustain a recycling industry. Although New Zealand and Australia have a high per capita generation of e-waste, the total generation is still low due to the low population of these regions [5]. The PIR typically has much lower generation of e-waste due to the lower purchasing power of these countries as well as the low population [1,5]. This results in low amounts of feedstock for recycling e-waste across the region [5]. One option to ensure sufficient feedstock is to extend the scope of EPR [34]. Currently, only televisions and computers are covered by the EPR in Australia, which only account for 10% of all e-waste generated [34]. If the EPR was extended to include all e-waste, this would significantly increase the total e-waste collection.
Clarification of the role of different levels of government would also better facilitate the collection of e-waste. In Japan and Switzerland, which have a similar EPR as Australia, all levels of government have an active role in maintaining the system [43]. In Australia, the EPR is only managed by the federal government and state governments have their own regulations regarding landfill [34]. If a clear EPR was enforced across the region it would increase the collection of e-waste. This would be a significant change in New Zealand and the PIR. By forming a coalition between governments, the EPR could also be easier to manage and coordinate.
Another barrier specific to Oceania is the decentralized population of the region. Even if an EPR was instituted across the region, countries in the PIR are not likely to generate sufficient feedstock to support a domestic recycling industry [5]. New Zealand, which currently has a pilot facility to recycle e-waste, could also encounter feedstock limitations due to the low population resulting in overall low generation compared to global generation [5]. Transporting e-waste across the region can also be cost prohibitive, especially with current import and export licenses required by New Zealand and Australia [53,54]. An option is for Australia to become an e-waste processing hub for the region. It already has some infrastructure that could be expanded to process e-waste and Australia is the highest generator of e-waste in the region [5,55]. EPR enforcement in the PIR and New Zealand could help offset the cost of transportation, especially if allowances on import and export licenses are made for the region.
Although there are barriers to the collection and recycling of e-waste in the region, a clear comprehensive policy enforced across Oceania could facilitate sufficient feedstock collection across the region and potentially support new domestic end stage recycling facilities in Australia. A better understanding of e-waste generation in New Zealand and Oceania is required followed by an in-depth techno-economic analysis of various recycling processes before specific recommendations could be made.

2.2. Economic Factors

One of the largest incentives for the recycling of e-waste is the monetary value of the recycled material. In Oceania, it was estimated that 0.7 Mt of e-waste was generated in 2018. However, only 8.8% was recycled, with the total value of e-waste sent to landfill estimated at approximately US $0.63 billion [1]. This represents a significant monetary loss and if recovered, could be used to offset the cost of recycling. The economic value of the raw material in e-waste is a large enabler for the recycling of the material [9].
There are economic barriers to the recycling of e-waste that are prominent in the Oceania region. Among them is the security of feedstock supply. Oceania has the lowest generation of e-waste globally (Figure 3A) [5]. Although Australia and New Zealand have a high per capita generation, they have low populations, reducing the total e-waste generated [1]. In Australia, the EPS act only covers limited products, and there are no government-enforced e-waste management systems in New Zealand and the PIR [34]. This limits the amount of e-waste collected, reducing the ability for recyclers to enter the market [9,32]. With a low supply of e-waste as feedstock, recycling processes such as pyrometallurgy, which require high and consistent feedstock, might be unsuitable. To overcome this barrier, more governments in the region could enact e-waste management policies such as the EPS act in Australia as well as increasing the scope of products included to increase the amount of e-waste collected.
High transportation and collection costs are another economic barrier that needs to be considered for the Oceania region. Because of the decentralised populations in Oceania, e-waste needs to be transported across long distances to recycling facilities to ensure that processing is economically feasible. Since e-waste is classified as hazardous waste, export, import and transit permits may be required to transport e-waste to recycling facilities. The cost of transportation along with the cost of permits can be prohibitive [9,32]. For example, in Australia, export permits cost $13,080 in 2021 for operations in compliance with the Basel Convention [54]. Due to the cost of transportation and the lack of recycling facilities, it can be more feasible to ship waste to international recyclers [18,32].
The lack of a well-developed recycling industry limits the possible integration of e-waste recycling in Oceania [9]. In other countries such as Belgium [56], Germany [57], Canada [58], Sweden [24] and Japan [59], e-waste have been blended with conventional feed material into the existing metallurgical process with relatively low additional infrastructure investments [9]. However, there are no metal extraction and recovery processes operated at full scale in Australia and the PIR, with only pilot scale operations in New Zealand.
The pilot scale facility operated by Mint Innovation in New Zealand uses a hydrometallurgical approach to process collected e-waste. The first unit process leaches base metals from e-waste and the base metals are then recovered using electrolysis. Biosorption using the species Cupriavidus metallidurans is used to recover gold from the leachates. The gold is then liberated from the biomass with ashing and other established gold refining techniques. Mint Innovation is also planning to commence a refinery in Australia by 2021, with a capacity to process up to 3500 tons e-waste per annum [34,51]. Nonetheless, although the Mint Innovation process has shown promise, it is still limited by the low collection rate of e-waste and the high labour cost associated with collecting and dismantling [47]. However, if proper e-waste management processes are enforced by the government, such as co-regulatory product stewardship enforced in Australia, it could help offset the cost of processing [34]. In addition, economic modelling could be conducted to provide more information on current barriers and enablers as well as more accurate information on feedstock generation and collection. This would breach current knowledge gaps and better inform stakeholders prior to investment [32]. If properly managed, the recycling of e-waste can be a highly profitable process and help promote a circular economy.

2.3. Technological Factors

EEE has become an intrinsic part of everyday life [2,3]. Sales of EEE are at a record high and EEE is recognised to be the greatest "value-adding" high technology industry [60]. The use of EEE has gone beyond stand-alone equipment in households and businesses and has been increasingly used in other applications [61]. This includes the use of temperature exchange equipment, lighting, displays and security monitoring in buildings and transportation [61]. EEE has extended to wearables such as medical monitoring, smartwatches and other crossover products such as electronically integrated clothing (such as e-textiles) [61]. In attempts to improve performance, stay up-to-date and get smaller, these products have inherently become more complex, and more difficult to process at the end of life. This increased complexity makes repairing and recycling e-waste more difficult. Fortunately, research in the collection and recycling of e-waste has also increased, with options such as pyrometallurgical, hydrometallurgical and biohydrometallurgical treatment being explored. The advancement of recycling technologies is an important factor in regional e-waste recycling as often a tailored approach utilising a range of different techniques might be needed to create an efficient process.

2.3.1. Technological Factors Affecting the Repair of EEE

While becoming more compact, EEE devices are often more difficult to repair, and the rapid advancement of technology reduces the effective, if not operational, lifespan of current models [1]. Moreover, business strategies of EEE companies can influence the reuse and repair of e-waste. For example, Apple, a major supplier of smartphones and other EEE devices, was found guilty of deliberately slowing down older smartphones due to declining battery life in 2017 [62]. However, Apple did not inform customers at the time that their device might need a battery replacement, leading to unnecessary device replacements. Similarly, Sonos, a global manufacturer of speakers, stopped issuing software updates for some of the older models, significantly reducing their long term viability and compatibility [62]. The EU has adopted measures to help prevent this from occurring and to increase product reuse and repair [63]. Under the Right-To-Repair standard, there is a new ecodesign requirement for manufacturers. This includes designing products for easy disassembly to facilitate part replacement, ensuring that manufacturers replace spare parts within 15 days when key components stop working and ensuring repair manuals are easy to access [64].
Up to 18 states in the USA have adopted the Right-to-Repair Bill as a result of its success in the EU [65]. In addition, some manufacturers have used this as an opportunity to be innovative and create products that are easily repaired. For example, FairPhone supplies customisable phones that are easily disassembled. In addition, they sell a range of spare parts through their online store that can be used to either repair a product or upgrade specific parts, increasing the lifespan of their devices [66]. To create more sustainable devices, Apple created the Apple Daisy, a disassembly robot that is capable of using a four-step process to remove the battery from old iPhones and remove the screws and haptic modules, which can then be sent to recyclers [67]. While these initiatives are important, they do not address the repair or replace issue with most portable electronic devices. EEE that are difficult to repair and have a reduced lifecycle contributes to the e-waste problem. This is especially significant in developing countries. For example, older EEE products from Australia can be gifted to developing countries such as those in the PIR [68]. Without access to parts or the technology to repair the EEE, the life cycle is severely reduced and the EEE contributes to the growing e-waste problem in the region.

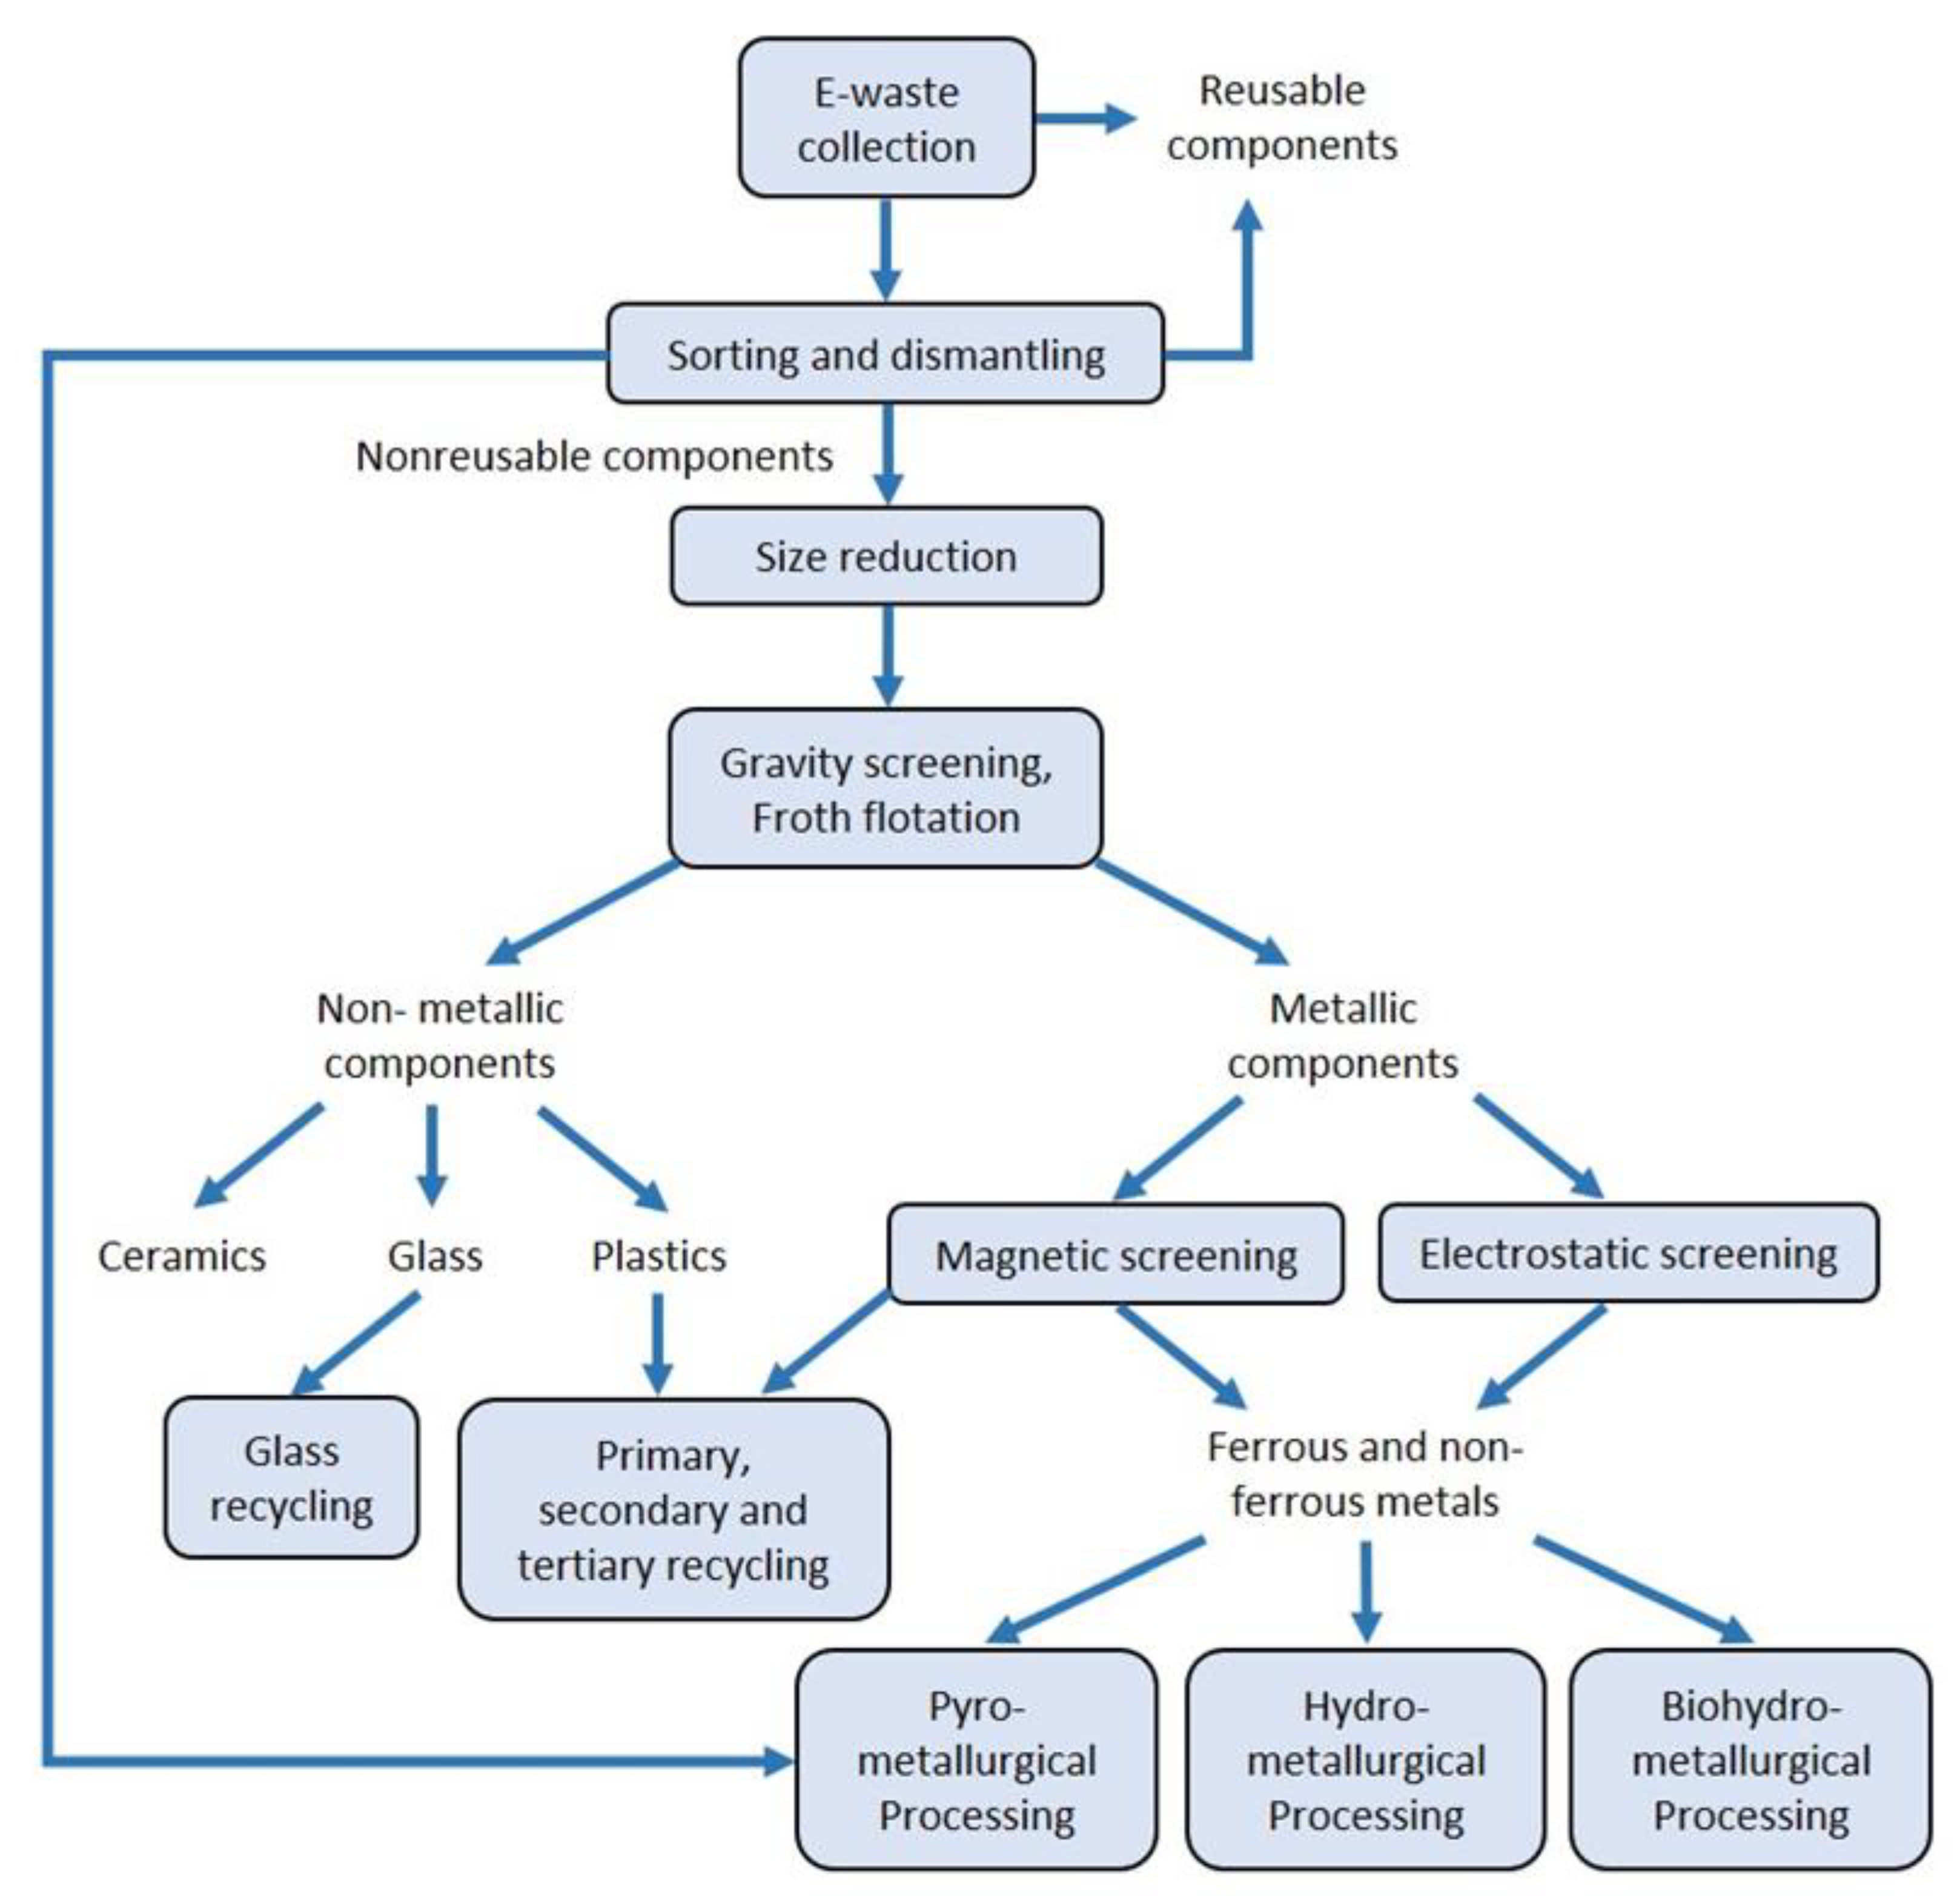
2.3.2. E-Waste Recycling Technologies

If EEE cannot be reused or repaired, it becomes e-waste that needs to be collected and recycled. The recovery of valuable materials from e-waste generally comprises three main steps: Collection, pre-processing and processing [9]. Options for each of these steps are discussed in the following sections. A schematic overview of possible processing pathways can be seen in Figure 7. E-waste is heterogenous in composition and consists of a range of materials, including plastics, glass and metals. In order to achieve a circular economy, all these materials need to be collected and recycled.

2.3.3. Collection and Preprocessing

Official e-waste collection is controlled by government legislation and policy and is managed by various levels of local government as well as industry [5]. Currently, 78 countries around the world have some legislation governing the collection and recycling of e-waste. This usually involves collection facilities at public places [9] or local businesses collecting e-waste [24]. In the Oceana region, only Australia has a government regulated collection scheme [33].
Once e-waste is collected, the pre-processing of e-waste is one of the most important steps [9]. E-waste is generally sorted by type prior to processing, as some components present in e-waste, such as batteries, cathode ray tubes (CRTs) and mercury-containing lamps require specific measures to mitigate hazards [69]. For example batteries need special preprocessing to prevent spontaneous discharge that can lead to combustion [32]. The next stage of pre-processing involves the systematic dismantling, disassembly and removal of components or parts prior to further processing [16]. Dismantling can be divided into manual dismantling and mechanical dismantling, depending on the construction of the equipment. Improper manual dismantling poses a significant environmental and health concern due to the release of fumes and hazardous substances and should be banned if proper safety precautions are not in place [1]. Improper handling of e-waste is more common in developing countries, where workplaces are generally informal and occupational health and safety standards do not protect the workers [70]. Instances of improper handling and storage of e-waste have been reported in the PIR. This has largely been attributed to the lack of regulations, insufficient infrastructure to process the quantity of e-waste generated and the lack of technical expertise [71].
Dismantling can be a simple process of removing fasteners such as screws and bolts, but if the materials are fused together using coating, welding, or encapsulation, this process becomes more complex and requires additional mechanical processing for material separation [72]. During the first stage of dismantling, housing, wiring boards, drives and other components are removed. This can be referred to as a “look and pick” principle [16]. Components marked for further recycling are subjected to size reduction using shredders, hammer mills, rotary crushers, disc crushers and ball mills [72]. Size reduction can also involve heating electrical components to above the melting point of commonly used solder (240–250 °C) and subjecting the material to external forces such as impact, shearing and vibration. Using this approach, it is possible to achieve a disassembly ratio of 94% [73]. Most of the machinery used in dismantling is equipped with a sieve to collect the resulting particles [16].
Following size reduction, the material can either be sent directly to recycling processes or can undergo additional pre-processing for further separation of metallic and non-metallic components. This can include gravity separation, magnetic separation, electrostatic separation, or froth flotation. Gravity separation concentrates particles based on their specific gravity. It is dependent on the density of particles as well as the size [74]. Water, air, heavy media and sifting have been used to separate metals from plastics and ceramics [16]. Magnetic separation is used to separate magnetic metallic components from non-magnetic components. This method excels in separating ferrous material from nonferrous material using high-intensity magnets [75]. Size reduction is critical for magnetic separation to prevent the agglomeration of particles that could prevent efficient separation of ferrous and non-ferrous material [76]. Electrostatic separation can be used to sort material of different electrical conductivities. It can be divided into corona electrostatic separation, triboelectric separation and eddy current separation [16,75]. Froth flotation uses the natural hydrophobicity of particles to separate metallic and non-metallic components [75]. It has been shown to be successful in processing particles from size reduction of PCBs with a metal recovery rate of 95.6% for base metals. Although this process is efficient for the recovery of copper, it can result in up to 24.5% loss of gold [74].
Any of the above processes, or a combination of processes, can be used to concentrate base metals and precious metals in e-waste for further recycling [16,77]. Upgrading of the metal content is crucial for downstream hydrometallurgical and biohydrometallurgical processing as particle size can influence leaching efficiency [72,78,79]. It is also critical to categorise the composition of the e-waste to determine the concentration of leaching agents required, and this is only possible once pre-processing has been completed [9,24]. Pre-processing is not as essential for the pyrometallurgical treatment of e-waste, but it can improve the process efficiency by concentrating metals for recovery and removing components such as ceramics to reduce the volume of the final slag [9]. An overview of possible recycling pathways can be seen in Figure 7.
Australia recycles the largest amount of e-waste in Oceania, up to 83.3% of all e-waste recycled in the region in 2019 [1]. This is accomplished using 31 different recycling facilities which dismantles the e-waste before putting it through size reduction [34]. No end-stage recycling occurs in Australia, and instead the pre-processed e-waste is transported to international recycling facilities [34]. A list of some of the recycling companies that partner with CRA can be found in Table 2. New Zealand recycles approximately 14.4% of the total e-waste recycled in the region; however, there are only a few recycling facilities that process the collected e-waste, with an estimated 97,000 ton of e-waste sent to landfill in 2019 [47]. The majority of the e-waste that is recycled undergoes dismantling and size reduction, before being transported to international recycling facilities for end processing. Only approximately 2% of the collected e-waste undergoes end processing in New Zealand. In the PIR, the majority of e-waste is sent to landfill, and as there is little if any tracking of e-waste, very little information is available on the end destination of e-waste [1]. The manual collecting and the dismantling of e-waste is the most expensive component in the recycling of e-waste in New Zealand and Australia, with the cost of labour accounting for up to 90% of the total processing costs [43]. Improvements in dismantling and processing technology is critical to reduce the costs of processing and to promote recycling within this region.

2.3.4. Plastic Recycling

Depending on the polymeric composition, plastics can have widely different strength and chemical resistance properties [91]. It is this versatility that makes plastics suitable for use in electronics, construction, packaging material and many other applications. Plastics are a major component of e-waste, accounting for up to 20% (by weight) of all e-waste [92]. There can be up to 15 different plastics found in e-waste, depending on the original product and function [93]. The recycling of plastics in e-waste is complicated by the presence of BFRs and persistent organic pollutants (POPs) [92]. Under the Stockholm Convention, BFRs and POPs are regulated wastes, and the recycling of plastics with these components is to be carried out in an environmentally sound manner [94]. Given the increasing growth of e-waste worldwide, it is essential to develop technology capable of recycling the plastic component of e-waste safely.
As mentioned previously, the first step of e-waste is typically manual dismantling and sorting. The dismantling process is essential for the removal and recovery of e-waste plastics, and to prevent the environmental release of regulated waste such as BFRs and POPs, and the contamination of other materials recovered during processing [95]. Once e-waste is sorted and plastics are recovered, they can undergo melt processing [91,96], after which the molten plastic can be extruded or molded into new materials for re-use. These techniques are well researched and employed globally, but the inherent drawback of this technology is the limited number of times plastic can undergo thermal or melt processing before the quality of the polymers are irreversibly reduced [97]. Typically, this results in end-of-life disposal of the plastic as waste via landfilling [91]. In the PIR, the lack of available land area makes landfilling an unattractive option. Recently, the SPREP has worked with countries under the Moana Taka partnership to export recyclable waste from these countries free of charge to recycling centres in the Asia-Pacific region [98]. This includes waste plastic from e-waste [98].
Although recovering the chemical components from the polymers in plastic e-waste is desirable [91], the presence of BFRs and POPs complicates this process when recycling e-waste [99]. New technologies have been developed to separate BFRs from plastic e-waste prior to processing. Notably, the CREASolv technology uses a combination of solvents that separate the BFRs from polymers. The polymers are recovered and re-extruded as new materials [100]. This technology has already been employed to recycle food packaging and research has shown promising results when processing plastics that are more difficult to recycle such as acrylonitrile butadiene styrene (ABS) and polycarbonate (PC) plastics [100], as well as polymer-metal composites commonly found in PCBs and other e-waste [101].
Plastics that cannot be reprocessed any further can be used in waste-to-energy plants, providing processes with a feedstock with uniform caloric intake [91,102,103]. However, the presence of BFRs makes plastics from e-waste unsuitable as feedstock for most incineration plants. Nonetheless, Alphakat GmbH from Germany has developed a new low-temperature catalytic depolymerisation technology (The KDV Process) that allows the processing of feedstocks without the formation of dioxins, converting them into energy carrier as diesel fuels [104]. Waste-to-energy is a linear process, that results in the permanent loss of materials from the economy, but the production of value-added by-products such as fuels, chemicals and gases still makes it an attractive option for the disposal of end-of-life plastics. This technology could be adopted in the Oceania region to process BFR containing waste.
Currently, in Australia, there is one existing waste-to-energy plant with a second plant to be constructed in late 2021 [105]. Currently, there are no waste-to-energy facilities in New Zealand or the PIR [106]. Given the location and the Moana Taka partnership, this could allow Australia to become a recycling hub if existing facilities are expanded.
Another approach to recycling plastic from e-waste is to transform and repurpose the plastic as a completely different product without recovering the polymers. This is a new concept that shows promise and is slowly being embraced and adopted by industry [91]. This approach utilises the properties of plastics including the carbon content, binding properties, chain structure and thermal properties, to find uses for them in manufacturing industries [91]. Using this approach, it is possible to recycle plastic that is no longer suitable for repurposing. Examples of this include the use of resin that contains e-waste, such as toner powder, as an alternative source of carbon in metallurgical industries [107]. PCB plastic can be transformed into 3D filaments and carbon microfibers [108]. Computer casing can be used as a carbon source for the manufacturing of silicon carbide [109]. The plastics in e-waste can also be used as coarse aggregate in concrete [110]. Re-use of plastics to make new products is more favourable compared to using virgin plastic products, when considering the waste hierarchy and the push towards circular economy. More recently, alternative processes for plastics recycling including bioprocessing using plastic-degrading microorganisms have been investigated [111]. The most common plastics in e-waste include high impact polystyrene (HIPS) and acrylonitrile-butadiene-styrene (ABS), which can account for up 55% of all e-waste plastic. Microbial assisted HIPS degradation has been demonstrated using Bacillus sp., achieving a 23% degradation in 30 days [112]. In another study, Anabaena spiroides, a photosynthetic algae, was found to be able to degrade polyethylene plastic (PE) sheets by 8.18% in 30 days [93]. Trichoderma viride and Aspergillus nomius have degraded low density polyethylene (LDPE) by 5.13% and 6.63%, respectively in 45 days [113]. Although plastics biodegradation is not currently employed for large scale degradation of plastics, further research could facilitate the possible implementation of the approach as an alternative pathway for managing end of life plastics in the future.
E-waste plastics is a growing concern in the Oceania region. Currently, only minimal collection of e-waste plastics occurs in New Zealand and the PIR. If not properly recycled, the BFR containing plastics could be a significant environmental concern. Australia has shown expertise in researching new ways to recycle e-waste plastics [91,114,115] and a dedication to increase existing treatment facilities [105]. This could make it possible for the country to become a recycling hub for the treatment of e-waste plastics.

2.3.5. Glass Recycling

Glass is another major component in e-waste, predominantly found in screens, monitors and lamps, which collectively constitute up to 12% of e-waste generated worldwide [1]. Of particular concern CRT that were historically used in monitors and televisions. CRTs are classified as hazardous waste because of the lead content of the glass, and a growing concern over the potential for toxic metal leaching from CRTs has increased the development of potential recycling pathways [116,117]. Advances in display technology have slowly replaced CRTs with liquid crystal displays (LEDs) and organic light-emitting diodes (OLEDs) [1]. However, this has resulted in large numbers of CRTs becoming obsolete and discarded [118]. Globally in 2016, only 26% of end-of-life CRTs are recycled, with a further 59% sent to landfills [119].
Previously, CRTs were recycled using a closed-loop system in which the glass was reused as a raw material in the manufacturing of new CRTs [120]. However, with the development of new, safer and more efficient technology such as LEDs and OLEDs, the demand for CRT monitors has significantly diminished, and as such manufactures of CRTs have gradually decreased or ceased operation [121,122]. As with plastics in e-waste, attempts have been made to repurpose the raw material as a component to be used in other industries. One possible pathway is the use of CRT glass in the construction industry [118] for the production of foam glass [123], ceramic glazes [123], glass tiles [124,125] and concrete [126]. In some cases, such as the use of CRTs in concrete, the composite material containing the glass has a superior quality than the original material [127]. However, often contaminants, predominately lead, are still present in these materials, and the long-term usage of these products could be problematic depending on the mobility of the contaminant [128].
Recent investigations have focused on the removal and recovery of lead from CRTs to provide a safe recycling pathway for the glass, including the use of ultrasound to facilitate lead leaching, recovering up to 90% of the lead [129]. In addition, it has been shown that mechanical activation followed by dilute nitric acid leaching can recover up to 92.5% of lead in the glass [129]. Once the lead has been extracted, the remaining silica-rich glass can undergo additional processes for recycling. Using a combination of the above approaches might provide a sustainable pathway for the recycling of this hazardous waste.
In addition to CRTs, a rapidly growing contributor to glass in e-waste are photovoltaic (PV) panels. PV panels have become popular due to the demand for alternative cleaner energy sources [1]. Asia experienced a 50% increase in solar power capacity in 2015, and the global PV capacity is expected to increased from 222 GW in 2015 to 954 GW in 2025 [130]. The global PV capacity is estimated to further increase to 4500 GW by 2050 [130]. Although the increased use of solar PV is a big step towards sustainable energy generation, it also creates a large waste stream that will soon become an issue as more PV cells come in early installations reach their end of life. Globally in 2016, a total of up to 250 000 tons of PV waste was generated. This is expected to reach 5.5 to 6 million tons by the year 2050 [130,131]. Currently, panels have a life expectancy of 40 years, however, the development of new, more efficient PV panels and the increasing demand for electricity leads to many panels being discarded before this point [130].
PV panels are composed of 75–95% glass, with the remaining material comprising metal, sealant and polymers [131,132,133]. It is estimated that 960,000 tons of glass arising from discarded PV will be generated by 2030 [130,132]. Even though the secondary market value of glass is low, the recoverable value is still expected to be above US $28 million [130]. Therefore, there is a strong financial incentive for recycling glass from waste PV panels. Currently, 85% of these panels are collected and 80% are recycled under the WEEE directive in the European Union [130]. This is an example of how effective policy can be in enforcing the recycling of these products. However, given the expected rapid increase in PV panel waste globally, close monitoring and tracking of this e-waste will be necessary to ensure that they are recycled worldwide.
In Oceania, the generation of waste glass from e-waste is a growing concern. In Australia, it is estimated that less than 2% of CRTs are collected [134]. In New Zealand, the collection of CRTs is not tracked, however, it estimated that over 2 million old CRT televisions needed to be collected in 2011 [134]. Due to the large drop off cost at recycling centers in New Zealand, it is more cost effective for the general public to dispose of old televisions in landfill [47]. PV panels are also a growing waste stream across the region. Australia has the largest uptake of PV panels globally, with more than 21% of residential homes having rooftop PV panels [135]. In New Zealand, PV panels are also becoming more popular with an estimated 13% houses having PV panels in 2017 [136]. In PIR, PV panels are extensively used to provide electricity throughout the region and are promoted by both government and private investors as an alternative to fossil fuels [137]. As such, the leakage from land-full of hazardous substances from CRTs and the loss of potentially valuable resources from PV panels is a strong incentive to ensure recycling processes are enforced across the region.

2.3.6. Metal Recycling

As mentioned previously, the metal content of e-waste is of great economical value (Table 1). As such, it is the focus of significant amount of research aimed at recycling the metals present in the waste. Currently, various metal recycling options are available for e-waste [9,16]. Pyrometallurgical and hydrometallurgical processes are commonly used to extract base metals and precious metals [8,9,24]. The use of microorganisms and their metabolites through biohydrometallurgical processing, or bioleaching, has also been investigated to extract metals from e-waste [27]. All these technologies have advantages and disadvantages that affect their suitability for practical implementation.

Pyrometallurgy

Pyrometallurgy is the traditional and most common approach for base metal and precious metal recovery from e-waste [13,138,139]. Pyrometallurgy uses high-temperature processes in oxidative or reductive conditions to bring about physical and chemical transformations and to recover the metals of interest [140]. Pyrometallurgical treatment of e-waste commonly involves smelting in furnaces, incineration, combustion and pyrolysis [9]. In these processes, metals are separated based on their chemical and metallurgical properties. Examples of pyrometallurgical smelters that use e-waste as a feedstock include the Aurubis smelter in Germany [141], the Noranda smelter in Quebec, the Ronnskar smelter in Sweden [8], the Umicore smelter in Belgium [56] and the DOWA smelter in Japan [24]. The details for these smelters can be seen in Table 3.
The largest pyrometallurgical facility that processes e-waste is the Umicore smelter in Belgium [24]. It processes 350,000 tons of e-waste/annum and recovers over 100 tons of gold and 2400 tons of silver per annum [9,56]. Given the increase in e-waste generation, there are plans to expand the plant capacity to 500,000 ton/annum [24]. The material sent to the Umicore smelter has typically been dismantled or pre-processed to remove large plastic parts, iron and aluminium [56]. In the first step of the smelting process, precious metals are extracted from the e-waste in a process known as precious metals operations (PMO) [56]. The e-waste is smelted in an ISA SMELTTM furnace. During this process, the plastics and other organic substances that are contained in the feed substitute for coke as reducing agents and the energy source [56]. In the smelting, precious metals and copper are separated from other base metals into copper bullion with most other metals separated into a lead slag. The copper bullion undergoes further processing using electrowinning and precious metal recovery [9,56]. The lead slag undergoes further treatment using base metal operations (BMO). The slag is processed using a lead blast furnace, lead refinery and special metals plants [56]. Using the above processes, the plant can recover base metals, precious metals as well as special metals such as indium, selenium and tellurium [8]. It should be noted that in addition to pyrometallurgical techniques, the plant utilises hydrometallurgical and electrochemical processes [56].
Pyrometallurgical processing is efficient and one of the main advantages is its ability to accept many forms of scrap. Some e-waste types can be used as a part of feedstock in smelters for the recovery of metals with relatively simple pre-treatment such as mechanical separation [142]. Larger e-wastes, such as large appliances and temperature exchange equipment, are typically dismantled to remove large plastics and the remaining components of interest can be shredded for size reduction [9,56] Smelters can process large quantities of highly complex waste without major alterations of the process [9].
However, even with state-of-the-art facilities, there are drawbacks associated with this type of processing for e-waste recycling. The recovery of plastics is not possible in pyrometallurgical processing as plastics replace coke as an energy source and are completely combusted in the process [56]. Given the potential of recycling plastic, this is a large monetary loss as well as potentially detrimental to the environment [91]. In addition, any ceramic components in the feed material would increase the volume of slag generated, increasing the risk of metal loss during the process [143]. Specialized infrastructure is required to contain hazardous compounds, such as dioxins, that can be formed and released during the processing. For example, at the Umicore facility, the process is coupled with emission control systems that have to meet the European and Flemish environmental control requirements [9,56]. Due to the complexity of pyrometallurgical processes, these treatment facilities require a significant capital investment and a centralized location due to the demand for a large and consistent feedstock [9].
In Oceania, there are many hurdles in the use of pyrometallurgy to treat e-waste. These facilities require large infrastructure, a large and consistent feedstock as well as access to large amounts of electricity [9]. In Australia, it might be possible to use e-waste as an additional feedstock in existing pyrometallurgical facilities. There is currently one copper smelter and refinery that has recently been extended in Queensland, Australia, which could potentially supplement its feedstock with e-waste [55]. Nyrstar, one of the largest metal processing companies globally, has two smelters located in Australia. The Port Pirie smelter (South Australia) is a multi-metal recovery plant which is a potential option for feedstock supplementation with e-waste [144]. However, there are other factors such as collection costs and transportation costs that need to be considered before such operations become financially viable [9]. In New Zealand, the only aluminium smelter recently shut down due to the increasing cost of electricity [145]. The facility consumed 13% of the country’s total electricity production and became financially unviable due to increases in electricity prices [145]. Currently, there are no pyrometallurgical facilities in the PIR. The infrastructure and electricity demand are possible reasons why these facilities might be too costly.

Hydrometallurgy

Hydrometallurgy is a branch of extractive metallurgy involving the use of aqueous solution chemistry to extract metals from a solid feedstock. Chemical leaching involves the use of acids, alkali or ligand-supported complexes as lixiviants [146]. Lixiviants are chosen based on their selectivity to the target metal, minimal downstream processing requirements, their lower environmental impact, and lower cost.
Research is centred around optimising the use of leaching agents that meet these criteria [147]. Numerous studies have focused on the application of hydrometallurgy for the recovery of base and precious metals from e-wastes [148,149,150,151,152,153,154,155,156,157,158].
Hydrometallurgical processes can offer good process control [147], low environmental impact [16] and low infrastructure requirements [9].
Following pre-processing including dismantling and size reduction, there are a number of possible processing conditions for the solubilisation of metals from e-waste. These have been explored in the literature. Metal solubilisation reactions for some of the more common conditions for the hydrometallurgical processing of e-wastes are summarised in Table 4. Other leaching parameters that can be varied include temperature [159,160], e-waste pulp density [161], the concentration of lixiviant [162], and leaching time [163]. Examples of leaching studies are shown in Table 5.

Base Metal Leaching

E-waste contains a range of base metals that are of significant monetary interest. These include copper, iron, cobalt, nickel, zinc, tin, lead and aluminum. Although they are of lower value compared to precious metals, they are present in much larger quantities and account for most of the metal in e-waste. The estimated combined value of these metals in all e-waste in 2019 is over US $46 million. Therefore, a significant amount of research has focused on finding optimal leaching conditions for these metals.
An overview of leaching agents used in hydrometallurgy can be seen in Table 4. Strong inorganic acids, including sulfuric acid, hydrochloric acid and aqua regia are commonly investigated for the leaching of base metals from e-wastes [156,166,167]. Hydrochloric acid has the highest dissociation constant and excels at dissolving base metals [24,171]. However, neutralisation with sodium hydroxide to recover metal values after solubilisation produces sodium chloride, which complicates subsequent copper recovery through electrowinning [24]. Copper is one of the most valuable components in mid- and low-grade PCBs [56]. If leaching with hydrochloric acid significantly reduces copper recovery, the process could become uneconomical. Alternatively, sulfuric acid is a strong proton donor that is inexpensive and rapidly dissolves copper [24]. However, sulfuric acid can be corrosive to some reactor linings and requires elevated temperatures for leaching. The need for corrosion resistant lining in reactors would increase the initial capital cost, which needs to be considered when developing process flow sheets for e-waste leaching. Aqua regia has relatively quick reaction kinetics and high base metal yields, but is expensive and has low selectivity [24]. All of the above acids require neutralisation and can lead to adverse environmental impacts if not handled correctly [172]. Studies with organic acids, such as citric acid [160] and glycine [169] have shown some potential for e-waste processing. Other organic acids that have been studied include methanosulfonic acid [150] and oxalic acid [173].

Precious Metal Leaching

Following base metal extraction, the residue is further processed to recover precious metals [8]. Although precious metals are present in lower quantities, they are typically of a high grade and are of significant economic worth. The estimated value of gold, silver and platinum in all e-waste in 2019 globally is estimated to be over US $10 billion with a total weight of 1.4 kt [1]. The total value present in e-waste might be less than that of base metals, however, per ton these metals are significantly more valuable. This makes precious metals of high economic interest.
Traditionally, precious metals are extracted with cyanide [176]. Although cyanidation is effective, it has significant environmental impacts and has led to severe groundwater and river contamination [177,178]. As such, several substitutes have been investigated. These include thiourea, thiosulfate and halides [148,149,151,152,153,154].
Thiourea has been shown to be effective for gold extraction from ores as well as e-waste [152]. At low pH conditions, thiourea forms cationic complexes with gold resulting in high extraction yields (>90%) after base metal leaching [168,179]. It has been demonstrated that at a pulp density of 10% and in the presence of ferric iron as an oxidizing agent and at a pH of 1.5 it is possible to achieve high yields of both gold (91.4%) and silver (80.2%) from PCBs [152]. Despite its effectiveness, there are also some limitations to this process. Thiourea is a more expensive reagent compared to cyanide and requires a higher concentration in solution to achieve similar yields to those that can be achieved by cyanidation [180]. The thiourea leaching process is also more complex as the reagent is not stable and decomposes in alkaline environments [181]. However, thiosulfate leaching of gold ore has been employed at an industrial scale [8,182], and with further research in optimising leaching conditions, the process may prove to be an effective alternative to cyanidation for leaching gold from e-waste [179]. When taking into account the economic feasibility and environmental impacts, thiourea is one of the most promising alternatives to cyanide leaching [180].
Thiosulfate has high selectivity for gold, and is non-toxic and non-corrosive [24]. Both sodium thiosulfate and ammonia thiosulfate have been investigated for the extraction of gold and silver from PCBs [183,184]. Thiosulfate requires the addition of oxidising ions, such as Cu2+ and Fe2+, along with co-leaching agents such as ammonia or thiourea [185,186]. The solubilised metals form stable anionic complexes with ammonia, preventing the formation of additional oxides. Both sodium thiosulfate and ammonia thiosulfate are stable under alkaline conditions, the process can achieve high gold yields (>90%) [179] and approximately 60% of the oxidation product of thiosulfate, tetrathionate, will reduce back to thiosulfate under alkaline conditions. However if the pH is too high, thiosulfate is prone to disproportionation reactions [180]. The largest hurdle in thiosulfate application at an industrial scale is the cost [180]. Thiosulfate consumption is higher compared to cyanide leaching ,and the process is slower [154,187]. The solution needs to be kept under alkaline conditions and at a stable temperature to prevent the degradation of thiosulfate during the leaching process [176]. These factors reduce the economic feasibility of this reagent [180].
Halide leaching offers an effective alternative to cyanide leaching [148,149,176,188]. The most common halide leaching agents are iodide, bromide and chloride [8]. All three reagents form complexes with gold in both the monovalent (Au1+) and trivalent (Au3+) forms, depending on the leaching conditions [147]. The halide leaching rate of gold is high (>95%) [189], leaching is selective to gold and the lixiviants are generally non-toxic [190]. Chloride leaching has been shown to be effective in leaching gold from ore (98%) [191] as well as in leaching palladium (93%) [155] and silver (95.29%) [192] from PCBs. However, this process is still hindered by several technical challenges including the emission of toxic chlorine gas, the need for specialised corrosion-resistant reactors and the consumption of high volumes of reagents [16]. Of the halides, the use of iodide for leaching is the most promising as it offers quick leaching and high selectivity, while the leaching solutions are only mildly alkaline and are non-corrosive [180]. In addition, the gold iodine complex is the most stable amongst all the halide complexes, simplifying the recovery of gold [147]. However, iodide leaching consumes large amounts of reagent and iodine is expensive [180]. Bromine leaching has been shown to be effective in recovering gold from PCBs [149], however, it is less selective and requires special equipment to reduce health risks which somewhat restricts its industrial application [16].
The use of amino acids as a reagent for the leaching of base metals and precious metals has also been investigated [193,194,195,196,197]. Amino acids can effectively dissolve base and precious metals in alkaline environments, resulting in high yields. In Australia, glycine has recently been explored to extract base metals from PCBs as a greener alternative to traditional leaching reagents. A combination of glycine and cyanide was able to extract 99.1% of copper, 92.1% of gold and 85.3% of silver [169]. Amino acids, such as glycine, are non-toxic, non-volatile, and low cost and can be generated through chemical or biological synthesis at an industrial scale [198].
Following hydrometallurgical leaching, the metals of interest are concentrated through solvent extraction, adsorption and/or ion exchange processes. Finally, metals are recovered from the solution through electrorefining (electrometallurgy) or chemical reduction processes [78,199].
Hydrometallurgical processing has the benefit of being exact, predictable, energy-efficient and easily controllable [9]. However, hydrometallurgical processing is relatively slow and time-consuming compared to pyrometallurgical processing [200]. Mechanical pre-treatment required for hydrometallurgical processing increases the overall cost and requires sophisticated infrastructure and skilled personnel, potentially limiting its use in developing nations [8,9]. The chemicals used in hydrometallurgical processing can be dangerous and have significant environmental impacts. For example, cyanide can cause water contamination, which can be a significant health risk to nearby inhabitants [155,177]. In addition, the costs of reagents can be high and can significantly reduce the profits from e-waste recycling [8].

Biohydrometallurgy

Biohydrometallurgy is a subset of hydrometallurgical processing that utilizes microorganisms, such as bacteria, archaea and fungi, to facilitate the extraction and recovery of metals from ores, concentrates and waste materials in an aqueous environment [201]. Industrial scale applications of biohydrometallurgy include bioleaching of ores [202,203], bio-oxidation of refractory sulfidic gold minerals [204] and treatment of water from mining and metallurgical operations [27,205,206]. In addition, biohydrometallurgy has been explored to recover valuable metals from mine wastes as well as consumer waste in an effort to move towards a circular economy [207,208,209]. Biohydrometallurgical processes are considered a green alternative with lower energy costs and environmental impacts when compared to traditional metallurgical processes [210].
Biohydrometallurgical processing utilises microbially catalysed processes such as bioleaching, biooxidation, bioreduction, bioflotation, bioprecipitation, biosorption, bioaccumulation and biodegradation [27]. These processes occur in nature and can be harnessed to promote the solubilisation and cycling of various metals and compounds under mineral processing conditions. Bioleaching utilises redoxolysis, acidolysis and/or complexolysis to dissolve metals from solid materials. Redoxolysis is based on biologically catalysed oxidation reduction processes to dissolve metals [166]. Acidolysis is the process of proton-promoted dissolution of metals by biogenic inorganic and organic acids [27]. In complexolysis metal dissolution is facilitated by complexation with biogenic reagents [27]. Examples of these processes are shown in Table 6.
The most common bioleaching processes involve the use of biogenic sulfuric acid and biogenic ferric iron generated by sulfur- and iron-oxidising microorganisms, respectively. These reagents have been used in laboratory scale trials to extract base metals from PCBs [162] and lithium-ion batteries [221] as well as gallium, copper and nickel from light-emitting diodes [222]. Previously, the toxicity of heavy metals and/or other components in e-waste has limited the potential application of one-step contact bioleaching of e-waste with iron and sulfur-oxidising microorganisms [223]. However, recent research has shown that bacteria can be gradually adapted to e-waste allowing one-step bioleaching, although leaching efficiency is still lower than what can be achieved through conventional leaching [212]. Non-contact leaching using biogenic ferric sulfate lixiviants has also been investigated for base metals bioleaching [162]. A recent study has shown that a combination of chemical thiourea and biogenic ferric iron is an effective combination for the extraction of gold and silver [224].
More recent work has explored the use of biogenic organic acids for e-waste leaching. Fungi such as Phanerochaete chrysosporium have been used to extract base metals such as copper using organic acids such as oxalic acid, gluconic acid and citric acid [218,225]. Aspergillus niger has been shown to leach not only base metals [219], but also to bioaccumulate gold and silver from solutions containing cyanide [226]. Microorganisms, such as Gluconobacter oxydan, have also been shown to be capable of extracting rare earth elements (REE) from retorted phosphor powder derived from recycled fluorescent bulbs using biogenic gluconic acid [227]. In this study, leaching solutions with active microbial cells achieved higher yields than abiotic solutions with higher concentrations of organic acid, indicating that the presence of cells or their metabolites were important in the leaching process.
Cyanide leaching has long been used to recover gold from ores and, more recently, explored for e-waste. Microorganisms can also produce cyanide and cyanogenic microbes have been shown to be capable of leaching gold from PCBs [214,215]. However, without first removing the base metals from the PCB waste, the consumption of biogenic cyanide was high, and the efficiency of gold leaching was reduced. A more recent study showed that by first leaching the base metals with ferric iron and sulfuric acid and then using biogenic cyanide to leach the gold, higher yields are achievable, for example a yield of 44% [216] compared to the 13% previously reported [215]. However, even biogenic cyanide is still not considered environmentally friendly and biological lixiviants for gold leaching require further exploration.
One alternative biological leaching agent is iodide. Although previous hydrometallurgical studies have shown the effectiveness of iodide leaching, it was only recently suggested and validated by Australian researchers that iodide-oxidising microbes could be applied for gold leaching [204]. Kudpeng et al. [164] explored gold bioleaching with two iodide oxidising bacteria (Roseovarius tolerans and Roseovarius mucosus) from sulfidic ore concentrate and milled PCBs. However, yields obtained for PCBs were lower than those for ore concentrate, and additional process optimisation is required.
Reductive bioleaching with iron- and manganese-reducing bacteria has been explored for oxide ores and ocean ores [228], but does not appear to have been evaluated for e-wastes. However, biologically catalysed reductive processes have been utilised to produce thiosulfate for leaching gold and copper from e-waste. Hong and coworkers (2018) evaluated the use of sulfate reducing bacteria for the generation of thiosulfate in an integrated process that combines biological and chemical steps [229].
Phosphate solubilising microorganisms have been evaluated for bioleaching REE from phosphate ores [230], and this pathway has been investigated for the recycling of e-waste. Marappa and coworkers (2020) investigated the use of phosphate solubilising microorganisms (Frankia sp. DDNSF-01 and Frankia casuarinae DDNSF-02) for the bioleaching of PCBs. These species can generate organic acids and phosphatase enzymes that were capable of leaching 75% gold at a pulp density of 0.2% [220].
An emerging new field applicable to biohydrometallurgy is synthetic biology [27]. The application of microorganisms in biohydrometallurgy can be limited by the presence of inhibiting compounds found in the ore or wastes treated [223]. Synthetic biology, which is the design and construction of improved or novel biological systems using engineering principles, could provide the tools to overcome these limitations [231]. This includes engineering the microorganisms with resistance to various stresses such as high metal concentrations [232], high salt stress [233], and extreme temperature [234] as well as engineering the microorganism with improved metabolic pathways such as iron and sulfur oxidation [235]. This approach has already been proven to be an effective in improving gold bioleaching from electronic scrap with cyanogenic microorganisms [236]. An engineered strain of Chromobacterium violaceum, which produces and detoxifies cyanide, was engineered to contain an additional operon for cyanide production. The engineered strain exhibited the highest cyanide production and correspondingly the highest gold recovery at 30% at a 0.5% w/v pulp density. This is a significant improvement on the wild strain which enabled markable recovery (11%) of gold. Although engineered microorganisms have not yet been applied at an industrial scale, mining companies as well as research institutions in the Oceanic region (e.g., CSIRO) have already shown interest in their potential applicationt [27].
Biohydrometallurgy has already been practiced at industrial scale for processing low-grade ores and gold concentrates for several decades. However, it has only recently been explored for metal recovery from e-waste [27,237]. Although it faces similar limitations to hydrometallurgical treatment in being a slow process and requiring the pre-treatment of e-waste [9,238], it is considered to be more environmentally friendly than chemical leaching [147] and typically has low reagent costs [8]. Advances have been made in developing integrated process flow sheets with various biological and chemical unit processes [27]. Such integrated processes may have potential for recovering valuable resources, especially from complex wastes such as e-waste.

2.3.7. Technological Barriers Affecting the Recycling of E-Waste in Oceania

One of the technical barriers affecting the recycling of e-waste is the lack of knowledge in creating integrated recycling facilities [9]. E-waste has a high degree of heterogeneity and is difficult to characterize, hindering the identification of possible processing options and potential final products of processing [9]. Most research has approached e-waste recycling using the same technology used in the processing of natural ores. However, the behaviour of e-waste is much more complex, and as such, product-centric recycling is considered to be critical for efficient recycling of these materials [239].
To extract metals of interest, thermodynamic knowledge of multiple base and precious metals is required [9]. In the PIR, lack of relevant technical knowledge has been identified as one of the largest barriers [52]. However, in Australia and New Zealand, this is less of a barrier due to the increasing presence of e-waste recycling facilities [37], and technical expertise associated with mining and mineral processing, including pyrometallurgy, hydrometallurgy and biohydrometallurgy [9,27,50,197,240]. Multiple first stage recycling facilities exist in Australia, and the New Zealand company Mint Innovation is testing an innovative and first-of-its kind pilot biohydrometallurgy-based recycling facility for e-waste [34,47,237]. Australia also has potential infrastructure that could be adapted to processing e-waste to recover metals, including a copper smelter and refinery [55], and four aluminum smelters [241]. These facilities offer the opportunity to integrate e-waste recycling into existing processes with potentially only limited infrastructure changes [9], enabling Australia to become a regional e-waste recycling hub.
Since total e-waste collection in Oceania is still low [5], economy of scale is a barrier to the economic processing of e-wastes. Generally, pyrometallurgical facilities require large and consistent feedstock, and low volumes of highly variable e-waste feedstocks could impact process kinetics and economics [9]. However, as e-waste generation and collection continue to increase, this barrier will be less of a concern in the future [5]. Low volumes of waste also mean that there are significant opportunities to establish small-to-medium scale recycling facilities [237]. Mint innovation has recently raised sufficient capital to deploy their biorefinery in the greater Sydney area in Australia, with plans to process up to 3500 tons of e-waste per annum, demonstrating that small-scale facilities can overcome economies of scale.

2.3.8. The Importance and Challenges Associated with Flow Sheet Design for Recycling of Complex End-of-Life Materials

As discussed previously, PCBs have significant economic interest because of their high concentration of base metals and precious metals. However, there are other products, such as plastic, glass and pollutants, that potentially require downstream processing and integration into the existing economy. This complicates the comparison of various recycling methods. For example, hydrometallurgical treatment is often considered as being more environmentally friendly in comparison to pyrometallurgical treatment [24], because hydrometallurgical processes typically operate at lower temperatures, are technologically simpler and often no gaseous emissions are produced that require special containment and processing [6]. However, when looking at the entire process, the comparison is less simple, especially when feedstocks comprise a complex mix of materials. Reuter (2013) suggests that a more comprehensive comparison should also consider the energy and exergy balances, economic considerations, the generation of different waste streams as well as the specific policy and legislation in place [242]. For example, hydrometallurgy often utilises electrowinning to recover copper from the leach solution [6]. This process uses considerable energy, whereas smelting can reduce its external energy demand by using combustion energy from the organics present in e-waste [9]. In addition, it is possible to harness the waste heat generated by pyrometallurgical treatment and convert it into electricity for use in the process, reducing the environmental impact [243]. Pyrometallurgical processes can also be coupled with a series of hydrometallurgical downstream processes for the separation of metals [6].
Generally, hydrometallurgical and biohydrometallurgical processes do not release hazardous gasses, but these processes often produce large amounts of waste acid liquid that needs downstream purification, neutralisation and recycling [244]. In the literature, most hydrometallurgical and biohydrometallurgical studies are primarily designed to determine immediate process performance such as metal extraction rates and yields of the process, whereas the potential impacts associated with effluent treatment are largely neglected [6]. Determining how effluent or associated downstream treatment requirements may affect the applicability of hydrometallurgical and biohydrometallurgical processes for e-waste is difficult, given their lack of industrial integration compared to pyrometallurgical applications. The focus should therefore not be on the individual process. Rather, it seems more meaningful to evaluate specific packages of technologies involved in a process as a full process flow sheet at a local, regional scale [6]. To do so it is necessary to create a thorough process flow sheet that examines all the material inputs, tracks the material recovery throughout the process and factors in the downstream processing that may be required [245]. This would enable the entire process to be evaluated on a total efficiency basis, not purely based on recovery of material of interest. This will facilitate a better understanding of which processes might be suitable for a specific local region with distinct socio-economic, industrial and environmental characterististics [1].

2.4. Environmental Factors

The impact of e-waste on the environment has been well documented [246]. E-waste contains many hazardous compounds, including heavy metals such as lead, mercury and arsenic, in addition to POPs and BFRs [21,246]. Improper management of e-waste is the most common reason that e-waste leads to contamination of the environment. Examples includes open burning [247], dust released during mechanical treatment [248], crude recycling processes [249], open disposal [246], and illegal dumping [250]. This can cause air, soil and water contamination and bioaccumulation of contaminants in the food chain [246,251]. The human health effect of this contamination has also been documented [21]. This includes impacting thyroid function [252,253,254,255], lung function [256], reproductive health [257,258], growth [256,259] and mental health [260,261]. This is most common in countries without proper recycling processes or regulations, including India, China and Guana [246].
In Australia and New Zealand, environmental impacts from e-waste have not been monitored or tracked but can be less severe compared to other regions such as Africa. In Australia, this is likely a result of the combination of regulation schemes, such as the NTCRS, exporting of e-waste to licensed recyclers under the basal convention and proper landfilling, all of which reduce the negative impact of this waste [1]. In New Zealand, there is no regulatory e-waste management scheme in place, but controlled landfilling is enforced, and there have not been any cases of open burning of e-waste, the most common source of e-waste environmental impact. However, this does not mean that e-waste originating from these countries do not impact the environment at all. Under the Basel Convention, it is illegal to transport e-waste to countries that do not have the facilities to safely recycle the waste [262]. However, this still occurs across the world, with an estimated 7–20% of global e-waste transported illegally in 2019 [1]. This is not limited to third world countries but also highly regulated regions such as the EU [263]. E-waste originating in Australia has been found in West Africa [264], China [265] and Thailand [266]. E-waste from New Zealand has also been documented in illegal dumping sites in South East Asia [267]. This untracked and unregulated e-waste would likely be improperly managed and result in detrimental environmental and health impacts [1,246].
In addition to the environmental impact of uncontrolled e-waste recycling, the decreased environmental impact of using recycled material over virgin material needs to be considered. Globally in 2019, 98 Mt of CO2 was estimated to be released from inferior recycling of undocumented fridges and air conditioners [1]. In contrast, an estimated reduction of 15 Mt of CO2 was achieved in 2019 due to reusing the metals and plastics in e-waste as secondary products. In Oceania, it is estimated that 1 Mt of CO2 was released due to the recycling of undocumented e-waste in 2019. Although the amount of e-waste collected in Oceania is still very low, when taking into account the predicted increase in e-waste generated [5], as well as the predicted increase in demand for metals [268], this energy saving could become significant. These environmental impacts are an additional incentive to recycle e-waste [36,269].
In addition to the environmental impact of e-waste, it is also important to consider the environmental barriers to recycling. Specifically, the geographical barriers that hinder the transportation of e-waste. Oceania is characterised by largely decentralised populations [1]. For example, although Australia has a large landmass, it has a scattered population [9]. This decentralisation is also common in New Zealand and the PIR. E-waste, although valuable, can be bulky and not economic to transport [9]. A solution for this is city-based preprocessing facilities that can perform sorting, dismantling and shredding to reduce e-waste size and concentrate the metals of interest [9]. This would decrease the cost of transportation, but it requires a stable feedstock [8]. This can be difficult in the PIR, which has limited e-waste production [1]. In Australia and New Zealand, there is sufficient production, but the cost of labour can be a significant barrier in preprocessing [34,46]. However, technological advancement in preprocessing and changes in policy and legislation could make e-waste recycling more economically viable [9].

3. Conclusions

The generation of e-waste is a growing concern worldwide, with many governments and organisations such as the UN highlighting the need to recycle e-waste and the importance of government-enforced management [1,6]. Previously, it was not uncommon for e-waste to be transported to developing countries to avoid stringent hazardous waste disposal regulations in developed countries [6]. This transboundary movement to unregulated recycling facilities is now illegal, and the focus has shifted to recycling and reuse of these products. The raw material value of e-waste makes it a valuable commodity, often being referred to as an urban mine [1,58]. When viewed in combination with the adverse environmental impact stemming from unrecycled or unregulated recycling of e-waste, there is a strong incentive to recycle these products [246].
A significant amount of research has investigated a range of e-waste recycling methods such as pyrometallurgy, hydrometallurgy and biohydrometallurgy. Each of these methods have benefits and limitations. E-waste is a complex waste stream and political, legal, economic, technological and environmental factors affect the collection and recycling of this waste. These factors vary significantly from region to region and need to be considered in order to implement an effective e-waste recycling strategy.
It is therefore necessary to assess the suitability of these technologies in specific regions and recognise the factors that can influence the efficiency and economic feasibility of processes. For example, pyrometallurgical treatment of e-waste is efficient and capable of processing large volumes of e-waste annually [56]. However, it requires complex infrastructure and a consistent feedstock [9]. Therefore it is less suitable for regions that do not have an existing pyrometallurgical industry into which e-waste processing can be integrated as the local economy may not be able to support the high initial capital investment [6]. In addition, decentralised regions or regions with low populations may struggle to provide sufficient feedstock for such facilities. In order to improve e-waste management globally the attention should be shifted to developing a recycling method tailored to the specific region in which the technology is to be implemented. This would account for the unique variables of that region and optimise the collection and recycling of e-waste accordingly.
This should include the enforcement of clear legislative frameworks to ensure that sufficient e-waste is collected for recycling [244]. These regulations, such as EPR, can be established and adopted by the local governments on the basis that they provide benefits for the local economy and all stakeholders [34,270]. The adoption of these regulations could help offset the cost of proper e-waste collection and recycling. With sound regulations in place, the development of a process flow sheet that is specific to the local region would become possible. For example, smaller, less densely populated regions may benefit more from hydrometallurgical or biohydrometallurgical processing due to the smaller volume of e-waste that in needed for these processing facilities to be viable [6]. This could include regions such as Oceania, which has a largely decentralised population and lower total e-waste production compared to other countries. Australia has an opportunity to become an e-waste processing hub for the region if the proper processes and infrastructure are in place. It already has some regulation in place that could be expanded upon. In addition, it has technical experience in the field of pyrometallurgy as well as some infrastructure that could be expanded upon to process e-waste. Currently, no end-stage e-waste recycling processes are carried out in Australia. The implementation of a proper process flowsheet that accounts for the specific limitations and enablers for the region would offer the opportunity for local economic growth as well as reducing the environmental impact of this hazardous waste. In doing so, it could set the standard for the region as well as be an example of overcoming the pressing challenges associated with e-waste globally.

Author Contributions

Conceptualization, J.V.Y., N.J.B., K.Y.C. and A.H.K.; methodology, J.V.Y., N.J.B., K.Y.C. and A.H.K.; formal analysis, J.V.Y.; investigation, J.V.Y.; writing—original draft preparation, J.V.Y.; writing—review and editing, J.V.Y., N.J.B., K.Y.C., A.N.N. and N.R.M.; visualization, J.V.Y.; supervision, N.J.B., K.Y.C., A.N.N., N.R.M. and A.H.K.; project administration, N.R.M. and A.H.K.; funding acquisition, J.V.Y., N.J.B., K.Y.C., A.N.N., N.R.M. and A.H.K. All authors have read and agreed to the published version of the manuscript.

Funding

This research was funded by New South Wales Government, through its Environmental Trust, The State of Western Australia, through its New Industries Fund and CSIRO Land and Water. Jonovan Van Yken was funded by Murdoch University through Research Training Scholarship and CSIRO Research Office through top up scholarship.

Institutional Review Board Statement

Not applicable.

Informed Consent Statement

Not applicable.

Data Availability Statement

Not applicable.

Acknowledgments

The Department of Jobs, Tourism, Science and Innovation does not endorse any information, product, process or outcome arising from or in relation to the project.

Conflicts of Interest

The authors declare no conflict of interest.

References

  1. Baldé, C.P.; Bel, G.; Forti, V.; Kuehr, R. The Global E-Waste Monitor 2020; United Nations Institute for Training and Research, International Telecommunication Union, and International Solid Waste Association: Bonn, Germany, 2020; ISBN 9789280891140. [Google Scholar]
  2. Robinson, B.H. E-waste: An assessment of global production and environmental impacts. Sci. Total Environ. 2009, 408, 183–191. [Google Scholar] [CrossRef]
  3. Babu, B.R.; Parande, A.K.; Basha, C.A. Electrical and electronic waste: A global environmental problem. Waste Manag. Res. 2007, 25, 307–318. [Google Scholar] [CrossRef]
  4. Widmer, R.; Oswald-Krapf, H.; Sinha-Khetriwal, D.; Schnellmann, M.; Böni, H. Global perspectives on e-waste. Environ. Impact Assess. Rev. 2005, 25, 436–458. [Google Scholar] [CrossRef]
  5. Forti, V.; Balde, C.P.; Kuehr, R.; Bel, G. The Global E-Waste Monitor 2020: Quantities, Flows and the Circular Economy Potential; United Nations University/United Nations Institute for Training and Research, International Telecommunication Union, and International Solid Waste Association: Bonn, Germany; Geneva, Switzerland; Rotterdam, The Netherland, 2020; ISBN 9789280891140. [Google Scholar]
  6. Ilankoon, I.M.S.K.; Ghorbani, Y.; Chong, M.N.; Herath, G.; Moyo, T.; Petersen, J. E-waste in the international context—A review of trade flows, regulations, hazards, waste management strategies and technologies for value recovery. Waste Manag. 2018, 82, 258–275. [Google Scholar] [CrossRef]
  7. Rene, E.R.; Sahinkaya, E.; Lewis, A.; Lens, P.N.L. Sustainable Heavy Metal Remediation Volume 2: Case Studies; Springer: Berlin/Heidelberg, Germany, 2017; Volume 8, ISBN 978-3-319-58621-2. [Google Scholar]
  8. Cui, J.; Zhang, L. Metallurgical recovery of metals from electronic waste: A review. J. Hazard. Mater. 2008, 158, 228–256. [Google Scholar] [CrossRef] [PubMed]
  9. Khaliq, A.; Rhamdhani, M.; Brooks, G.; Masood, S. Metal extraction processes for electronic waste and existing industrial routes: A review and australian perspective. Resources 2014, 3, 152–179. [Google Scholar] [CrossRef] [Green Version]
  10. Kaya, M. Current WEEE Recycling Solutions; Elsevier Ltd.: Amsterdam, The Netherlands, 2018; ISBN 9780081020579. [Google Scholar]
  11. Tansel, B. From electronic consumer products to e-wastes: Global outlook, waste quantities, recycling challenges. Environ. Int. 2017, 98, 35–45. [Google Scholar] [CrossRef] [PubMed]
  12. Pinho, S.; Ferreira, M.; Almeida, M.F. A wet dismantling process for the recycling of computer printed circuit boards. Resour. Conserv. Recycl. 2018, 132, 71–76. [Google Scholar] [CrossRef]
  13. Sum, E. The recovery of metals from electronic scrap. Rev. Extr. Metall. 1991, 43, 53–61. [Google Scholar] [CrossRef]
  14. Perkins, D.N.; Brune Drisse, M.N.; Nxele, T.; Sly, P.D. E-waste: A global hazard. Ann. Glob. Health 2014, 80, 286–295. [Google Scholar] [CrossRef]
  15. Carvalho, R.R.V.; Coelho, J.A.O.; Santos, J.M.; Aquino, F.W.B.; Carneiro, R.L.; Pereira-Filho, E.R. Laser-induced breakdown spectroscopy (LIBS) combined with hyperspectral imaging for the evaluation of printed circuit board composition. Talanta 2015, 134, 278–283. [Google Scholar] [CrossRef]
  16. Kaya, M. Recovery of metals and nonmetals from electronic waste by physical and chemical recycling processes. Waste Manag. 2016, 57, 64–90. [Google Scholar] [CrossRef] [PubMed]
  17. Charles, R.G.; Douglas, P.; Dowling, M.; Liversage, G.; Davies, M.L. Resources, conservation & recycling towards increased recovery of critical raw materials from WEEE—Evaluation of CRMs at a component level and pre-processing methods for interface optimisation with recovery processes. Resour. Conserv. Recycl. 2020, 161, 104923. [Google Scholar] [CrossRef]
  18. Calvo, G.; Mudd, G.; Valero, A.; Valero, A. Decreasing ore grades in global metallic mining: A theoretical issue or a global reality? Resources 2016, 5, 36. [Google Scholar] [CrossRef] [Green Version]
  19. Cui, J.; Forssberg, E. Mechanical recycling of waste electric and electronic equipment: A review. J. Hazard. Mater. 2003, 99, 243–263. [Google Scholar] [CrossRef]
  20. Morf, L.S.; Tremp, J.; Gloor, R.; Schuppisser, F.; Stengele, M.; Taverna, R. Metals, non-metals and PCB in electrical and electronic waste—Actual levels in Switzerland. Waste Manag. 2007, 27, 1306–1316. [Google Scholar] [CrossRef] [PubMed]
  21. Grant, K.; Goldizen, F.C.; Sly, P.D.; Brune, M.N.; Neira, M.; van den Berg, M.; Norman, R.E. Health consequences of exposure to e-waste: A systematic review. Lancet Glob. Health 2013, 1, e350–e361. [Google Scholar] [CrossRef] [Green Version]
  22. Li, J.; Duan, H.; Shi, P. Heavy metal contamination of surface soil in electronic waste dismantling area: Site investigation and source-apportionment analysis. Waste Manag. Res. 2011, 29, 727–738. [Google Scholar] [CrossRef]
  23. WHO. Sustainable Development Goals: Guidelines for the Use of the SDG Logo; United Nations: New York, NY, USA, 2020; pp. 1–68. [Google Scholar]
  24. Kaya, M. Electronic Waste and Printed Circuit Board Recycling Technologies; Springer: Berlin/Heidelberg, Germany, 2019; ISBN 978-3-030-26592-2. [Google Scholar]
  25. Pant, D.; Joshi, D.; Upreti, M.K.; Kotnala, R.K. Chemical and biological extraction of metals present in E waste: A hybrid technology. Waste Manag. 2012, 32, 979–990. [Google Scholar] [CrossRef] [PubMed]
  26. Islam, A.; Ahmed, T.; Awual, M.R.; Rahman, A.; Sultana, M.; Aziz, A.A.; Monir, M.U.; Teo, S.H.; Hasan, M. Advances in sustainable approaches to recover metals from e-waste—A review. J. Clean. Prod. 2020, 244, 118815. [Google Scholar] [CrossRef]
  27. Kaksonen, A.H.; Deng, X.; Bohu, T.; Zea, L.; Khaleque, H.N.; Gumulya, Y.; Boxall, N.J.; Morris, C.; Yu, K. Prospective directions for biohydrometallurgy. Hydrometallurgy 2020, 195, 105376. [Google Scholar] [CrossRef]
  28. Hong, J.; Shi, W.; Wang, Y.; Chen, W.; Li, X. Life cycle assessment of electronic waste treatment. Waste Manag. 2015, 38, 357–365. [Google Scholar] [CrossRef]
  29. Xue, M.; Xu, Z. Application of life cycle assessment on electronic waste management: A review. Environ. Manag. 2017, 59, 693–707. [Google Scholar] [CrossRef]
  30. Soo, V.K.; Doolan, M. Recycling mobile phone impact on life cycle assessment. Procedia CIRP 2014, 15, 263–271. [Google Scholar] [CrossRef] [Green Version]
  31. Pokhrel, P.; Lin, S.; Tsai, C. Environmental and economic performance analysis of recycling waste printed circuit boards using life cycle assessment. J. Environ. Manag. 2020, 276, 111276. [Google Scholar] [CrossRef] [PubMed]
  32. King, S.; Boxall, N.J.; Bhatt, A.I. Lithium Battery Recycling in Australia; CSIRO: Canberra, Australia, 2018. [Google Scholar]
  33. Australian Government Product Stewardship Act 2011 (Commonwealth). 2011. Available online: https://www.environment.gov.au/protection/waste/product-stewardship/consultation-review-ps-act-incl-ntcrs (accessed on 18 August 2021).
  34. Islam, M.T.; Huda, N. E-Waste Management Practices in Australia. In Handbook of Electronic Waste Management; Butterworth-Heinemann: Oxford, UK, 2020; pp. 553–576. ISBN 9780128170304. [Google Scholar]
  35. Local Government Association of South Australia. Regulatory Requirements for the Collection, Handling, Transporting and Recycling of E-Waste—Circular 23.4. Available online: www.lga.sa.gov.au/page.aspx?c=28933 (accessed on 18 August 2021).
  36. Australian Bureau of Statistics. Electronic and Electrical Waste; Australian Bureau of Statistics: Canberra, Australia, 2013.
  37. Dias, P.; Bernardes, A.M.; Huda, N. Waste electrical and electronic equipment (WEEE) management: An analysis on the australian e-waste recycling scheme. J. Clean. Prod. 2018, 197, 750–764. [Google Scholar] [CrossRef]
  38. Co-Regulatory Arrangements—NTCRS. Available online: https://www.environment.gov.au/protection/waste/product-stewardship/products-schemes/television-computer-recycling-scheme/coreg-arrangements (accessed on 26 July 2021).
  39. Australian Government. The National Television and Computer Recycling Scheme—Operational Review. 2014. Available online: https://www.environment.gov.au/system/files/pages/1de81785-ce48-4671-8182-9f1d9490b5ce/files/operational-review-national-television-and-computer-recycling-scheme.pdf (accessed on 18 August 2021).
  40. Arain, A.L.; Pummill, R.; Adu-Brimpong, J.; Becker, S.; Green, M.; Ilardi, M.; Van Dam, E.; Neitzel, R.L. Analysis of e-waste recycling behavior based on survey at a Midwestern US University. Waste Manag. 2020, 105, 119–127. [Google Scholar] [CrossRef]
  41. Martinho, G.; Magalhães, D.; Pires, A. Consumer behavior with respect to the consumption and recycling of smartphones and tablets: An exploratory study in Portugal. J. Clean. Prod. 2017, 156, 147–158. [Google Scholar] [CrossRef]
  42. Wang, Z.; Zhang, B.; Yin, J.; Zhang, X. Willingness and behavior towards e-waste recycling for residents in Beijing city, China. J. Clean. Prod. 2011, 19, 977–984. [Google Scholar] [CrossRef]
  43. Morris, A.; Metternicht, G. Assessing effectiveness of WEEE management policy in Australia. J. Environ. Manag. 2016, 181, 218–230. [Google Scholar] [CrossRef]
  44. MobileMuster—Annual Report. 2018. Available online: https://www.mobilemuster.com.au/wp-content/uploads/2018/11/MOB_AnnualReport2018_AMEND02.WEB_.pdf (accessed on 18 August 2021).
  45. Westcott, M. E-Waste; Queensland Parliamentary Library: Brisbane, Australia, 2012.
  46. Recycling WEEE. Available online: https://www.mfe.govt.nz/publications/waste/waste-electrical-and-electronic-equipment-guidance-collection-reuse-and-recycli-5 (accessed on 23 March 2021).
  47. Blake, V.; Farrelly, T.; Hannon, J. Is voluntary product stewardship for e-waste working in New Zealand? A Whangarei case study. Sustainability 2019, 11, 3063. [Google Scholar] [CrossRef] [Green Version]
  48. Vodafone New Zealand. Trade-in Your Old Mobile for a New Smart Phone. Available online: http://tradein.vodafone.co.nz/ (accessed on 30 May 2021).
  49. Gertsakis, J.; Hannon, J.; MacGibbon, J.; Nixon, C.; Tripathi, N.; Wilkinson, S.; Zwimpfer, L. E-Waste in New Zealand: Five Years on; Ministry for the Environment: Wellington, New Zealand, 2011; ISBN 9780986468520.
  50. Huda, N.; Dias, P. Ensuring best E-waste recycling practices in developed countries: An Australian example. J. Clean. Prod. 2019, 209, 846–854. [Google Scholar] [CrossRef]
  51. E-Waste. Available online: https://www.sprep.org/pacwaste/e-waste (accessed on 30 May 2021).
  52. E-Waste Country Assessments. Available online: www.sprep.org/attachments/Publications/WMPC/Summary_Rep_PacWaste_TAP_Ewaste_Country_Assess.pdf (accessed on 18 August 2021).
  53. Hazardous Waste including E-Waste. Available online: https://www.epa.govt.nz/industry-areas/hazardous-substances/hazardous-waste/hazardous-waste-types/ (accessed on 7 April 2020).
  54. Hazardous Waste Permits. Available online: http://www.environment.gov.au/protection/hazardous-waste/permits (accessed on 23 May 2021).
  55. Reuters Glencore to Extend Life of Australian Copper Smelter Refinery Beyond 2022. Available online: https://www.reuters.com/article/us-australia-glencore-copper-idUSKCN26E0X4 (accessed on 24 April 2021).
  56. Hagelüken, C. Recycling of electronic scrap at Umicore’s integrated metals smelter and refinery. Erzmetall 2006, 59, 152–161. [Google Scholar]
  57. Aurubis Environmental Protection at Lünene. Available online: https://www.aurubis.com/en/responsibility-x/environmental-protection-at-sites/environmental-protection-at-lunen (accessed on 9 March 2021).
  58. Tesfaye, F.; Lindberg, D.; Hamuyuni, J.; Taskinen, P.; Hupa, L. Improving urban mining practices for optimal recovery of resources from e-waste. Miner. Eng. 2017, 111, 209–221. [Google Scholar] [CrossRef]
  59. DOWA. E-Waste Recycling at DOWA. Available online: http://www.env.go.jp/en/recycle/asian_net/Annual_Workshops/2018_PDF/Day2_KeynoteLecture/23Day2_S3_03_UpdatedDOWAEcosystem_ANWS2018.pdf (accessed on 9 March 2021).
  60. Zeng, X.; Li, J. Measuring the recyclability of e-waste: An innovative method and its implications. J. Clean. Prod. 2016, 131, 156–162. [Google Scholar] [CrossRef]
  61. Parajuly, K.; Kuehr, R.; Awasthi, A.K.; Fitzpatrick, C.; Lepawsky, J.; Smith, E.; Widmer, R.; Zeng, X. Future E-Waste Scenarios; UNU-Vie Scyle: Tokyo, Japan, 2019. [Google Scholar]
  62. Mahy, E. Can We Fix Our Way Out of the Growing E-Waste Problem? Available online: https://www.bbc.com/news/business-51385344 (accessed on 25 March 2020).
  63. Mikolajczak, C. European Parliament Calls for Ambitious Right to Repair. Available online: https://repair.eu/news/european-parliament-calls-for-ambitious-right-to-repair/#:~:text=YesterdaytheEuropeanParliamentvoted,setofcirculareconomymeasures (accessed on 25 March 2021).
  64. Harrabin, R. EU Brings in “Right to Repair” Rules for Appliances. Available online: https://www.bbc.com/news/business-49884827 (accessed on 25 March 2021).
  65. Gartenberg, C. California Becomes the 18th State to Introduce Right to Repair Bill. Available online: https://www.theverge.com/2018/3/8/17097256/california-right-to-repair-bill-apple-microsoft-service-replace-parts (accessed on 25 March 2021).
  66. Reuter, M.A.; Van Schaik, A.; Ballester, M. Limits of the circular economy: Fairphone modular design pushing the limits. World Metall. Erzmetall 2018, 71, 68–79. [Google Scholar]
  67. Scheyder, E.; Nellis, S. Apple Ups Phone Recycling with “Daisy” Robot But Still Relies on Mines. Available online: https://www.smh.com.au/technology/apple-ups-phone-recycling-with-daisy-robot-but-still-relies-on-mines-20200114-p53r8u.html#:~:text=Daisy%2Clessthan18metres,tobeextractedandrefined (accessed on 25 March 2021).
  68. Darmadi, M. Problem of E-Waste Continues to Grow in the Pacific. Available online: www.abc.net.au/radio-australia/programs/pacificbeat/global-and-pacific-e-waste-growing/12432844 (accessed on 18 August 2021).
  69. Meskers, C.E.M.; Hagelüken, C.; Salhofer, S.; Spitzbart, M. Impact of Pre-Processing Routes on Precious Metal Recovery from PCs. In Proceedings of the European Metallurgical Conference, Innsbruck, Austria, 28 June–1 July 2009; Volume 7. [Google Scholar]
  70. Chi, X.; Streicher-porte, M.; Wang, M.Y.L.; Reuter, M.A. Informal electronic waste recycling: A sector review with special focus on China. Waste Manag. 2011, 31, 731–742. [Google Scholar] [CrossRef] [PubMed]
  71. E-Waste|Pacific Environment. Available online: https://www.sprep.org/pacwaste/e-waste (accessed on 30 March 2021).
  72. Zhang, S.; Forssberg, E. Mechanical separation-oriented characterization of electronic scrap. Resour. Conserv. Recycl. 1997, 21, 247–269. [Google Scholar] [CrossRef]
  73. Park, S.; Kim, S.; Han, Y.; Park, J. International Journal of Mineral Processing Apparatus for electronic component disassembly from printed circuit board assembly in e-wastes. Int. J. Miner. Process. 2015, 144, 11–15. [Google Scholar] [CrossRef]
  74. Sarvar, M.; Salarirad, M.M.; Shabani, M.A. Characterization and mechanical separation of metals from computer Printed Circuit Boards (PCBs) based on mineral processing methods. Waste Manag. 2015, 45, 246–257. [Google Scholar] [CrossRef]
  75. Yamane, L.H.; de Moraes, V.T.; Espinosa, D.C.R.; Tenório, J.A.S. Recycling of WEEE: Characterization of spent printed circuit boards from mobile phones and computers. Waste Manag. 2011, 31, 2553–2558. [Google Scholar] [CrossRef] [PubMed]
  76. Veit, H.M.; Diehl, T.R.; Salami, A.P.; Rodrigues, J.S.; Bernardes, A.M.; Tenório, J.A.S. Utilization of magnetic and electrostatic separation in the recycling of printed circuit boards scrap. Waste Manag. 2005, 25, 67–74. [Google Scholar] [CrossRef] [PubMed]
  77. Yoo, J.-M.; Jeong, J.; Yoo, K.; Lee, J.; Kim, W. Enrichment of the metallic components from waste printed circuit boards by a mechanical separation process using a stamp mill. Waste Manag. 2009, 29, 1132–1137. [Google Scholar] [CrossRef]
  78. Tuncuk, A.; Stazi, V.; Akcil, A.; Yazici, E.Y.; Deveci, H. Aqueous metal recovery techniques from e-scrap: Hydrometallurgy in recycling. Miner. Eng. 2012, 25, 28–37. [Google Scholar] [CrossRef]
  79. Duan, C.; Wen, X.; Shi, C.; Zhao, Y.; Wen, B.; He, Y. Recovery of metals from waste printed circuit boards by a mechanical method using a water medium. J. Hazard. Mater. 2009, 166, 478–482. [Google Scholar] [CrossRef]
  80. Walker, T.; Terry, P. Recycle or Retune for the Switch off. Available online: https://www.abc.net.au/local/stories/2013/04/04/3729658.htm (accessed on 5 August 2021).
  81. Aspitech Australia. Available online: http://www.aspitech.com.au/ (accessed on 5 August 2021).
  82. Total Green Recycling. Available online: https://www.totalgreenrecycling.com.au/ (accessed on 5 August 2021).
  83. E-Cycle SA. Available online: http://www.ecyclesa.com.au/ (accessed on 5 August 2021).
  84. E-Recycling. Available online: https://www.endeavour.com.au/Business-Solutions/Recycling-Solutions/E-Recycling (accessed on 5 August 2021).
  85. Sims Metal Recycling. Available online: https://www.simsmm.com/ (accessed on 5 August 2021).
  86. Sustainable & Compliant Electronic Equipment Recycling. Available online: https://www.tes-amm.com/it-recycling/e-waste-recycling (accessed on 5 August 2021).
  87. E-Waste Recycling USR. Available online: http://usr.net.au/ (accessed on 5 August 2021).
  88. E-Waste Services Provider Quantum Recycling Solutions. Available online: http://quantumrecyclingsolutions.com.au/ (accessed on 5 August 2021).
  89. Buyequip—E-Waste Recycling. Available online: https://buyequip.com.au/ (accessed on 5 August 2021).
  90. E-Waste Recycling—eWastec. Available online: https://ewastec.com.au/ (accessed on 5 August 2021).
  91. Sahajwalla, V.; Gaikwad, V. The present and future of e-waste plastics recycling. Curr. Opin. Green Sustain. Chem. 2018, 13, 102–107. [Google Scholar] [CrossRef]
  92. Ma, C.; Yu, J.; Wang, B.; Song, Z.; Xiang, J.; Hu, S.; Su, S.; Sun, L. Chemical recycling of brominated flame retarded plastics from e-waste for clean fuels production: A review. Renew. Sustain. Energy Rev. 2016, 61, 433–450. [Google Scholar] [CrossRef]
  93. Vimal Kumar, R.; Kanna, G.R.; Elumalai, S. Biodegradation of polyethylene by green photosynthetic microalgae. J. Bioremediation Biodegrad. 2017, 8, 2. [Google Scholar] [CrossRef] [Green Version]
  94. Stockholm Convention: Protecting Human Health and the Enviroment from Presitent Organic Pollutants. Available online: http://www.pops.int/TheConvention/Overview/TextoftheConvention/tabid/2232/Default.aspx (accessed on 3 May 2021).
  95. Hennebert, P.; Filella, M. WEEE plastic sorting for bromine essential to enforce EU regulation. Waste Manag. 2018, 71, 390–399. [Google Scholar] [CrossRef]
  96. Garcia, J.M.; Robertson, M.L. The future of plastics recycling. Science (80-.) 2017, 358, 870–872. [Google Scholar] [CrossRef]
  97. Ramesh, V.; Mohanty, S.; Biswal, M.; Nayak, S.K. Effect of reprocessing and accelerated weathering on impact-modified recycled blend. J. Mater. Eng. Perform. 2015, 24, 5046–5053. [Google Scholar] [CrossRef]
  98. Shipping Partnership Advances Waste Management in Pacific Islands. Available online: https://sdg.iisd.org/commentary/policy-briefs/shipping-partnership-advances-waste-management-in-pacific-islands/ (accessed on 27 July 2021).
  99. Imai, T.; Hamm, S.; Rothenbacher, K.P. Comparison of the recyclability of flame-retarded plastics. Environ. Sci. Technol. 2003, 37, 652–656. [Google Scholar] [CrossRef]
  100. Schlummer, M.; Wolff, F.; Maurer, A. Recovery of PC/ABS from WEEE Plastic Shred by the CreaSolv® Process. In Proceedings of the 2016 Electronics Goes Green 2016+ (EGG), Berlin, Germany, 6–9 September 2017; pp. 5–10. [Google Scholar] [CrossRef]
  101. Knappich, F.; Hartl, F.; Schlummer, M.; Mäurer, A. Complete recycling of composite material comprising polybutylene terephthalate and copper. Recycling 2017, 2, 9. [Google Scholar] [CrossRef] [Green Version]
  102. Ikhlayel, M. Environmental impacts and benefits of state-of-the-art technologies for e-waste management. Waste Manag. 2017, 68, 458–474. [Google Scholar] [CrossRef] [PubMed]
  103. Tange, L.; Drohmann, D. Waste electrical and electronic equipment plastics with brominated flame retardants—From legislation to separate treatment—Thermal processes. Polym. Degrad. Stab. 2005, 88, 35–40. [Google Scholar] [CrossRef]
  104. Ragaert, K.; Delva, L.; Van Geem, K. Mechanical and chemical recycling of solid plastic waste. Waste Manag. 2017, 69, 24–58. [Google Scholar] [CrossRef]
  105. Second Waste-to-Energy Plant Gets Green Light—Australian Renewable Energy Agency. Available online: https://arena.gov.au/blog/second-waste-to-energy-plant-gets-green-light/ (accessed on 27 July 2021).
  106. Borrelle, S.; Fuller, S.; Farrelly, T. Plastic Pollution Prevention in Pacific Island Countries: Gap Analysis of Current Legislation, Policies and Plans. Available online: https://reports.eia-international.org/wp-content/uploads/sites/6/2020/09/Plastic-Prevention-Gap-Analysis-2020.pdf (accessed on 27 July 2021).
  107. Gaikwad, V.; Kumar, U.; Pahlevani, F.; Piadasa, A.; Sahajwalla, V. Thermal transformation of waste toner powder into a value-added rerrous resource. ACS Sustain. Chem. Eng. 2017, 5, 11543–11550. [Google Scholar] [CrossRef]
  108. Rajagopal, R.R.; Rajarao, R.; Cholake, S.T.; Sahajwalla, V. Sustainable composite panels from non-metallic waste printed circuit boards and automotive plastics. J. Clean. Prod. 2017, 144, 470–481. [Google Scholar] [CrossRef]
  109. Maroufi, S.; Mayyas, M.; Sahajwalla, V. Novel synthesis of silicon carbide nanowires from e-waste. ACS Sustain. Chem. Eng. 2017, 5, 4171–4178. [Google Scholar] [CrossRef]
  110. Manjunath, B.T.A. Partial replacement of e-plastic waste as coarse-aggregate in concrete. Procedia Environ. Sci. 2016, 35, 731–739. [Google Scholar] [CrossRef]
  111. Amobonye, A.; Bhagwat, P.; Singh, S.; Pillai, S. Plastic biodegradation: Frontline microbes and their enzymes. Sci. Total Environ. 2020, 759, 143536. [Google Scholar] [CrossRef]
  112. Mohan, A.J.; Sekhar, V.C.; Bhaskar, T.; Nampoothiri, K.M. Microbial assisted High Impact Polystyrene (HIPS) degradation. Bioresour. Technol. 2016, 213, 204–207. [Google Scholar] [CrossRef] [PubMed]
  113. Munir, E.; Harefa, R.S.M.; Priyani, N.; Suryanto, D. Plastic degrading fungi Trichoderma viride and Aspergillus nomius isolated from local landfill soil in Medan. IOP Conf. Ser. Earth Environ. Sci. 2018, 126, 012145. [Google Scholar] [CrossRef]
  114. Sahajwalla, V.; Zaharia, M.; Kongkarat, S.; Khanna, R.; Rahman, M.; Saha-Chaudhury, N.; O’Kane, P.; Dicker, J.; Skidmore, C.; Knights, D. Recycling end-of-life polymers in an electric arc furnace steelmaking process: Fundamentals of polymer reactions with slag and metal. Energy Fuels 2012, 26, 58–66. [Google Scholar] [CrossRef]
  115. Sahajwalla, V.; Zaharia, M.; Kongkarat, S.; Khanna, R.; Saha-Chaudhury, N.; O’Kane, P. Recycling plastics as a resource for electric arc furnace (EAF) steelmaking: Combustion and structural transformations of metallurgical coke and plastic blends. Energy Fuels 2010, 24, 379–391. [Google Scholar] [CrossRef]
  116. Townsend, T.G. Leaching of lead from computer printed wire boards and cathode ray tubes by municipal solid waste landfill leachates. Environ. Sci. Technol. 2003, 37, 4778–4784. [Google Scholar]
  117. Spalvins, E.; Dubey, B.; Townsend, T. Impact of electronic waste disposal on lead concentrations in landfill leachate. Environ. Sci. Technol. 2008, 42, 7452–7458. [Google Scholar] [CrossRef] [PubMed]
  118. Yao, Z.; Ling, T.C.; Sarker, P.K.; Su, W.; Liu, J.; Wu, W.; Tang, J. Recycling difficult-to-treat e-waste cathode-ray-tube glass as construction and building materials: A critical review. Renew. Sustain. Energy Rev. 2018, 81, 595–604. [Google Scholar] [CrossRef]
  119. Yao, Z.; Wu, D.; Liu, J.; Wu, W.; Zhao, H.; Tang, J. Recycling of typical difficult-to-treat e-waste: Synthesize zeolites from waste cathode-ray-tube funnel glass. J. Hazard. Mater. 2017, 324, 673–680. [Google Scholar] [CrossRef] [PubMed]
  120. Hreglich, S.; Falcone, R.; Vallotto, M. The recycling of end of life panel glass from TV sets in glass fibres and ceramic productions. In Recycling and Reuse of Glass Cullet; Thomas Telford Publishing: London, UK, 2001; pp. 123–134. [Google Scholar]
  121. Mueller, J.R.; Boehm, M.W.; Drummond, C. Direction of CRT waste glass processing: Electronics recycling industry communication q. Waste Manag. 2020, 32, 1560–1565. [Google Scholar] [CrossRef]
  122. Mostaghel, S.; Samuelsson, C. Metallurgical use of glass fractions from waste electric and electronic equipment (WEEE). Waste Manag. 2010, 30, 140–144. [Google Scholar] [CrossRef]
  123. Mucsi, G.; Csőke, B.; Kertész, M.; Hoffmann, L. Physical characteristics and technology of glass foam from waste cathode ray tube glass. J. Mater. 2013, 2013, 696428. [Google Scholar] [CrossRef] [Green Version]
  124. Minay, E.J.; Desbois, V.; Boccaccini, A.R. Innovative manufacturing technique for glass matrix composites: Extrusion of recycled TV set screen glass reinforced with Al2O3 platelets. J. Mater. Process. Technol. 2003, 142, 471–478. [Google Scholar] [CrossRef]
  125. Raimondo, M.; Zanelli, C.; Matteucci, F.; Guarini, G.; Dondi, M.; Labrincha, J.A. Effect of waste glass (TV/PC cathodic tube and screen) on technological properties and sintering behaviour of porcelain stoneware tiles. Ceram. Int. 2007, 33, 615–623. [Google Scholar] [CrossRef] [Green Version]
  126. Romero, D.; James, J.; Mora, R.; Hays, C.D. Study on the mechanical and environmental properties of concrete containing cathode ray tube glass aggregate. Waste Manag. 2013, 33, 1659–1666. [Google Scholar] [CrossRef]
  127. Ma, J.; Reben, M.; Rzepa, K. Mechanical properties of concrete mortar based on mixture of CRT glass cullet and fluidized fly ash. Procedia Eng. 2015, 108, 453–458. [Google Scholar] [CrossRef] [Green Version]
  128. Ling, T.; Poon, C. Feasible use of recycled CRT funnel glass as heavyweight fine aggregate in barite concrete. J. Clean. Prod. 2012, 33, 42–49. [Google Scholar] [CrossRef]
  129. Saterlay, A.J.; Wilkins, S.J.; Compton, R.G. Towards greener disposal of waste cathode ray tubes via ultrasonically enhanced lead leaching. Green Chem. 2001, 3, 149–155. [Google Scholar] [CrossRef]
  130. Weckend, S.; Wade, A.; Heath, G.A. End-of-Life Management: Solar Photovoltaic Panels; International Renewable Energy Agency and the International Energy Agency Photovoltaic Power Systems: Golden, CO, USA, 2016; ISBN 9789295111981. [Google Scholar]
  131. Labouret, A.; Villoz, M. Solar photovoltaic energy. Sol. Photovolt. Energy 2010, 1–373. [Google Scholar] [CrossRef]
  132. Marini, C.; Blanc, I.; Sinha, P.; Wade, A. A Prospective Mapping of Environmental Impacts of Large Scale Photovoltaic Ground Mounted Systems Based on the Cdte Technology at 2050 Time Horizon. In Proceedings of the European Photovoltaic Solar Energy Conference and Exhibition, Amsterdam, The Netherlands, 22–24 September 2014; pp. 3394–3398. [Google Scholar] [CrossRef]
  133. Sander, K. Study on the Development of a Take Back and Recovery System for Photovoltaic Modules; European Photovoltaic Industry Association: Berlin, Germany, 2007. [Google Scholar]
  134. CRT Recycling. Available online: https://mri.com.au/recycling/crt-recycling/ (accessed on 21 April 2021).
  135. Solar PV and Batteries. Available online: https://www.energy.gov.au/households/solar-pv-and-batteries#:~:text=Australiahasthehighestuptake,Australia(source%3ACER) (accessed on 24 April 2021).
  136. Miller, A.; Williams, J.; Wood, A.; Santos-martin, D.; Lemon, S.; Watson, N.; Pandey, S. Photovoltaic Solar Power Uptake in New Zealand. In Proceedings of the Electricity Engineers’ Association Conference 2014 (EEA), Auckland, New Zealand, 18–20 June 2014; pp. 1–11. [Google Scholar]
  137. Raturi, A.; Singh, A.; Prasad, R.D. Grid-connected PV systems in the pacific island countries. Renew. Sustain. Energy Rev. 2016, 58, 419–428. [Google Scholar] [CrossRef]
  138. Hoffmann, J.E. Recovering precious metals from electronic scrap. JOM 1992, 44, 43–48. [Google Scholar] [CrossRef]
  139. Lee, J.C.; Song, H.T.; Yoo, J.M. Present status of the recycling of waste electrical and electronic equipment in Korea. Resour. Conserv. Recycl. 2007, 50, 380–397. [Google Scholar] [CrossRef]
  140. Ebin, B.; Isik, M.I. Pyrometallurgical processes for the recovery of metals from WEEE. In WEEE Recycling Research, Development, and Policies; Chagnes, A., Cote, G., Ekberg, C., Nilsson, M., Retegan, T., Eds.; Elsevier: Amsterdam, The Netherlands, 2016; pp. 107–137. ISBN 978-0-12-803363-0. [Google Scholar]
  141. Kahhat, R.; Williams, E. Product or waste? Importation and end-of-life processing of computers in Peru. Environ. Sci. Technol. 2009, 43, 6010–6016. [Google Scholar] [CrossRef]
  142. Zamzow, K.; Tsukamoto, T.K.; Miller, G.C. Biodiesel Waste Fluid as An Inexpensive Carbon Source for Bioreactors Treating Acid Mine Drainage (California-Nevada, United States). In Proceedings of the MWA Symposium 2007: Water in Mining Environments, Cagliari, Italy, 27–31 May 2007; pp. 3–6. [Google Scholar]
  143. Hageluken, C. Improving Metal Returns and Eco-Efficiency in Electronics Recycling. In Proceedings of the 2006 IEEE International Symposium on Electronics and the Environment, Scottsdale, AZ, USA, 8–11 May 2006; pp. 218–223. [Google Scholar]
  144. South Australian Recycler Plans to Take on E-Waste. Available online: https://wastemanagementreview.com.au/biggest-e-waste-recycling-plant-australia-destined-port-pirie/ (accessed on 27 July 2021).
  145. Rio Tinto Smelter in New Zealand to Slose with Loss of 1000 Jobs. Guardian. 2020. Available online: https://www.theguardian.com/world/2020/jul/09/rio-tinto-smelter-in-new-zealand-to-close-with-loss-of-1000jobs#:~:text=More%20than%201%2C000%20jobs%20will,the%20business%20was%20not%20viable (accessed on 18 August 2021).
  146. Varjani, S.J.; Gnansounou, E.; Gurunathan, B.; Pant, D.; Zakaria, Z.A. Waste Bioremediation; Springer Singapore: Singapore, 2018; ISBN 9789811074127. [Google Scholar]
  147. Ashiq, A.; Kulkarni, J.; Vithanage, M. Hydrometallurgical Recovery of Metals from E-Waste; Elsevier Inc.: Amsterdam, The Netherlands, 2019; ISBN 9780128161906. [Google Scholar]
  148. Sahin, M.; Akcil, A.; Erust, C.; Altynbek, S.; Gahan, C.S.; Tuncuk, A. A potential alternative for precious metal recovery from e-waste: Iodine leaching. Sep. Sci. Technol. 2015, 50, 2587–2595. [Google Scholar] [CrossRef]
  149. Cui, H.; Anderson, C. Hydrometallurgical treatment of waste printed circuit boards: Bromine leaching. Metals 2020, 10, 462. [Google Scholar] [CrossRef] [Green Version]
  150. Zhang, X.; Zhang, C.; Zheng, F.; Ma, E.; Wang, R.; Bai, J.; Yuan, W.; Wang, J. Alkaline electrochemical leaching of Sn and Pb from the surface of waste printed circuit board and the stripping of gold by methanesulfonic acid. Environ. Prog. Sustain. Energy 2020, 39, e13324. [Google Scholar] [CrossRef]
  151. Jing-ying, L.; Xiu-li, X.; Wen-quan, L. Thiourea leaching gold and silver from the printed circuit boards of waste mobile phones. Waste Manag. 2012, 32, 1209–1212. [Google Scholar] [CrossRef] [PubMed]
  152. Juna, W. Gold and silver selectively leaching from printed circuit boards scrap with acid thiourea solution. Nonferrous Met. 2009. [Google Scholar]
  153. Oh, C.J.; Lee, S.O.; Yang, H.S.; Ha, T.J.; Kim, M.J. Selective leaching of valuable metals from waste printed circuit boards. J. Air Waste Manag. Assoc. 2003, 53, 897–902. [Google Scholar] [CrossRef]
  154. Ha, V.H.; Lee, J.C.; Jeong, J.; Hai, H.T.; Jha, M.K. Thiosulfate leaching of gold from waste mobile phones. J. Hazard. Mater. 2010, 178, 1115–1119. [Google Scholar] [CrossRef] [PubMed]
  155. Quinet, P.; Proost, J.; Van Lierde, A. Recovery of precious metals from electronic scrap by hydrometallurgical processing routes. Min. Metall. Explor. 2005, 22, 17–22. [Google Scholar] [CrossRef]
  156. Bas, A.D.; Deveci, H.; Yazici, E.Y. Treatment of manufacturing scrap TV boards by nitric acid leaching. Sep. Purif. Technol. 2014, 130, 151–159. [Google Scholar] [CrossRef]
  157. Jha, M.K.; Kumari, A.; Choubey, P.K.; Lee, J.; Kumar, V.; Jeong, J. Leaching of lead from solder material of waste printed circuit boards (PCBs). Hydrometallurgy 2012, 121–124, 28–34. [Google Scholar] [CrossRef]
  158. Birloaga, I.; Michelis, I.D.; Ferella, F.; Buzatu, M.; Vegliò, F. Study on the influence of various factors in the hydrometallurgical processing of waste printed circuit boards for copper and gold recovery. Waste Manag. 2013, 33, 935–941. [Google Scholar] [CrossRef]
  159. Yazici, E.Y.; Deveci, H. Ferric sulphate leaching of metals from waste printed circuit boards. Int. J. Miner. Process. 2014, 133, 39–45. [Google Scholar] [CrossRef]
  160. Torres, R.; Segura-Bailón, B.; Lapidus, G.T. Effect of temperature on copper, iron and lead leaching from e-waste using citrate solutions. Waste Manag. 2018, 71, 420–425. [Google Scholar] [CrossRef] [PubMed]
  161. Sheng, P.; Etsell, T. Recovery of gold from computer circuit board scrap using aqua regia. Waste Manag. Res. 2007, 25, 380–383. [Google Scholar] [CrossRef] [PubMed]
  162. Van Yken, J.; Cheng, K.Y.; Boxall, N.J.; Nikoloski, A.N.; Moheimani, N.; Valix, M.; Sahajwalla, V.; Kaksonen, A.H. Potential of metals leaching from printed circuit boards with biological and chemical lixiviants. Hydrometallurgy 2020, 196, 105433. [Google Scholar] [CrossRef]
  163. Xu, Y.; Li, J.; Liu, L. Current status and future perspective of recycling copper by hydrometallurgy from waste printed circuit boards. Procedia Environ. Sci. 2016, 31, 162–170. [Google Scholar] [CrossRef] [Green Version]
  164. Kudpeng, K.; Bohu, T.; Morris, C.; Thiravetyan, P.; Kaksonen, A.H. Bioleaching of gold from sulfidic gold ore concentrate and electronic waste by Roseovarius tolerans and Roseovarius mucosus. Microorganisms 2020, 8, 1783. [Google Scholar] [CrossRef] [PubMed]
  165. Montero, R.; Guevara, A.; dela Torre, E. Recovery of gold, silver, copper and niobium from printed circuit boards using leaching column technique. J. Earth Sci. Eng. 2012, 2, 590. [Google Scholar]
  166. Lee, J.C.; Pandey, B.D. Bio-processing of solid wastes and secondary resources for metal extraction—A review. Waste Manag. 2012, 32, 3–18. [Google Scholar] [CrossRef]
  167. Havlik, T.; Orac, D.; Petranikova, M.; Miskufova, A.; Kukurugya, F.; Takacova, Z. Leaching of copper and tin from used printed circuit boards after thermal treatment. J. Hazard. Mater. 2010, 183, 866–873. [Google Scholar] [CrossRef]
  168. Torres, R.; Segura-Bailón, B.; Lapidus, G.T. Copper leaching from electronic waste for the improvement of gold recycling. Waste Manag. 2016, 57, 131–139. [Google Scholar] [CrossRef] [PubMed]
  169. Oraby, E.A.; Li, H.; Eksteen, J.J. An alkaline glycine-based leach process of base and precious metals from powdered waste printed circuit boards. Waste Biomass Valorization 2020, 11, 3897–3909. [Google Scholar] [CrossRef]
  170. Wang, J.; Bai, J.; Xu, J.; Liang, B. Bioleaching of metals from printed wire boards by Acidithiobacillus ferrooxidans and Acidithiobacillus thiooxidans and their mixture. J. Hazard. Mater. 2009, 172, 1100–1105. [Google Scholar] [CrossRef]
  171. Marsh, A.R.W.; McElroy, W.J. The dissociation constant and Henry’s law constant of HCl in aqueous solution. Atmos. Environ. 1985, 19, 1075–1080. [Google Scholar] [CrossRef]
  172. Iannicelli-Zubiani, E.M.; Giani, M.I.; Recanati, F.; Dotelli, G.; Puricelli, S.; Cristiani, C. Environmental impacts of a hydrometallurgical process for electronic waste treatment: A life cycle assessment case study. J. Clean. Prod. 2017, 140, 1204–1216. [Google Scholar] [CrossRef]
  173. Zhou, J.; Zhu, N.; Liu, H.; Wu, P.; Zhang, X.; Zhong, Z. Recovery of gallium from waste light emitting diodes by oxalic acidic leaching. Resour. Conserv. Recycl. 2019, 146, 366–372. [Google Scholar] [CrossRef]
  174. Li, L.; Lu, J.; Ren, Y.; Xiao, X.; Jie, R.; Wu, F.; Amine, K. Ascorbic-acid-assisted recovery of cobalt and lithium from spent Li-ion batteries. J. Power Sources 2012, 218, 21–27. [Google Scholar] [CrossRef]
  175. Verma, A.; Hait, S. Chelating extraction of metals from e-waste using diethylene triamine pentaacetic acid. Process Saf. Environ. Prot. 2019, 121, 1–11. [Google Scholar] [CrossRef]
  176. Hilson, G.; Monhemius, A.J. Alternatives to cyanide in the gold mining industry: What prospects for the future? J. Clean. Prod. 2006, 14, 1158–1167. [Google Scholar] [CrossRef]
  177. Korte, F.; Spiteller, M.; Coulston, F. The cyanide leaching gold recovery process is a nonsustainable technology with unacceptable impacts on ecosystems and humans: The disaster in Romania. Ecotoxicol. Environ. Saf. 2000, 46, 241–245. [Google Scholar] [CrossRef] [PubMed]
  178. Gökelma, M.; Birich, A.; Stopic, S.; Friedrich, B. A review on alternative gold recovery reagents to cyanide. J. Mater. Sci. Chem. Eng. 2016, 4, 8–17. [Google Scholar]
  179. Xu, X.-L.; Li, J.-Y. Experimental study of thiourea leaching gold and silver from waste circuit boards. J. Qingdao Univ. Technol. Ed. 2011, 26, 69–73. [Google Scholar]
  180. Zhang, Y.; Liu, S.; Xie, H.; Zeng, X.; Li, J. Current status on leaching precious metals from waste printed circuit boards. Procedia Environ. Sci. 2012, 16, 560–568. [Google Scholar] [CrossRef] [Green Version]
  181. Go, N.; Ko, E.; Yıldırım, M.E.; Selengil, U. Leaching and CIL processes in gold recovery from refractory ore with thiourea solutions. Miner. Eng. 2007, 20, 559–565. [Google Scholar] [CrossRef]
  182. Brooy, S.R.L.; Linge, H.G.I.; Walker, G.S. Review of gold extraction from ores. Miner. Eng. 1994, 7, 1213–1241. [Google Scholar] [CrossRef]
  183. Petter, P.M.H.; Veit, H.M.; Bernardes, A.M. Evaluation of gold and silver leaching from printed circuit board of cellphones. Waste Manag. 2014, 34, 475–482. [Google Scholar] [CrossRef]
  184. Tripathi, A.; Kumar, M.; Sau, D.; Agrawal, A.; Chakravarty, S.; Mankhand, T. Leaching of gold from the waste mobile phone printed circuit boards (PCBs) with ammonium thiosulphate. Int. J. Metall. Eng. 2012, 1, 17–21. [Google Scholar] [CrossRef]
  185. Jeffrey, M.I.; Watling, K.; Hope, G.A.; Woods, R. Identification of surface species that inhibit and passivate thiosulfate leaching of gold. Miner. Eng. 2008, 21, 443–452. [Google Scholar] [CrossRef]
  186. Aylmore, M.G.; Muir, D.M. Thermodynamic analysis of gold leaching by ammoniacal thiosulfate using Eh/pH and speciation diagrams. Min. Metall. Explor. 2002, 18, 221–227. [Google Scholar] [CrossRef]
  187. Zipperian, D.; Raghavan, S. Gold and silver extraction by ammoniacal thiosulfate leaching from a rhyolite ore. Hydrometallurgy 1988, 19, 361–375. [Google Scholar] [CrossRef]
  188. Seisko, S.; Lampinen, M.; Aromaa, J.; Laari, A.; Koiranen, T.; Lundström, M. Kinetics and mechanisms of gold dissolution by ferric chloride leaching. Miner. Eng. 2018, 115, 131–141. [Google Scholar] [CrossRef]
  189. Liang, X.Q.C.D.C.; Manhong, H. Iodine leaching process for recovery of gold from waste PCB. Chin. J. Environ. Eng. 2009, 5. [Google Scholar]
  190. Manigandan, S.; Rajmohan, K.S.; Varjani, S. Current Trends in Gold Recovery from Electronic Wastes; Elsevier: Amsterdam, The Netherlands, 2020; ISBN 9780444643216. [Google Scholar]
  191. Liu, J.Q.; Nicol, M.J. Thermodynamics and kinetics of the dissolution of gold under pressure oxidation conditions in the presence of chloride. Can. Metall. Q. 2002, 41, 409–415. [Google Scholar] [CrossRef]
  192. Pereira, M.M.; Costa, F.O.; Gomes, R.F.; Rodrigues, M.L.M.; da Silva, G.A.; Leão, V.A. Multivariate study of a novel hydrometallurgical route employing chloride/hypochlorite for leaching silver from printed circuit boards. Chem. Eng. Res. Des. 2020, 163, 115–124. [Google Scholar] [CrossRef]
  193. Oraby, E.A.; Eksteen, J.J. The selective leaching of copper from a gold–copper concentrate in glycine solutions. Hydrometallurgy 2014, 150, 14–19. [Google Scholar] [CrossRef]
  194. Eksteen, J.J.; Oraby, E.A. The leaching and adsorption of gold using low concentration amino acids and hydrogen peroxide: Effect of catalytic ions, sulphide minerals and amino acid type. Miner. Eng. 2015, 70, 36–42. [Google Scholar] [CrossRef]
  195. Oraby, E.A.; Eksteen, J.J. The leaching of gold, silver and their alloys in alkaline glycine–peroxide solutions and their adsorption on carbon. Hydrometallurgy 2015, 152, 199–203. [Google Scholar] [CrossRef]
  196. Tanda, B.C.; Eksteen, J.J.; Oraby, E.A. An investigation into the leaching behaviour of copper oxide minerals in aqueous alkaline glycine solutions. Hydrometallurgy 2017, 167, 153–162. [Google Scholar] [CrossRef]
  197. Oraby, E.A.; Eksteen, J.J. Gold leaching in cyanide-starved copper solutions in the presence of glycine. Hydrometallurgy 2015, 156, 81–88. [Google Scholar] [CrossRef]
  198. González-López, J.; Rodelas, B.; Pozo, C.; Salmerón-López, V.; Martínez-Toledo, M.V.; Salmerón, V. Liberation of amino acids by heterotrophic nitrogen fixing bacteria. Amino Acids 2005, 28, 363–367. [Google Scholar] [CrossRef]
  199. Ilyas, S.; Lee, J.C. Bioleaching of metals from electronic scrap in a stirred tank reactor. Hydrometallurgy 2014, 149, 50–62. [Google Scholar] [CrossRef]
  200. Zhang, L.; Xu, Z. A review of current progress of recycling technologies for metals from waste electrical and electronic equipment. J. Clean. Prod. 2016, 127, 19–36. [Google Scholar] [CrossRef]
  201. Kaksonen, A.H.; Boxall, N.J.; Gumulya, Y.; Khaleque, H.N.; Morris, C.; Bohu, T.; Yu, K.; Usher, K.M.; Lakaniemi, A. Recent progress in biohydrometallurgy and microbial characterisation. Hydrometallurgy 2018, 180, 7–25. [Google Scholar] [CrossRef]
  202. Brierley, J.A.; Brierley, C.L. Present and future commercial applications of biohydrometallurgy. Hydrometallurgy 2001, 59, 233–239. [Google Scholar] [CrossRef]
  203. Watling, H.R. The bioleaching of sulphide minerals with emphasis on copper sulphides—A review. Hydrometallurgy 2006, 84, 81–108. [Google Scholar] [CrossRef]
  204. Kaksonen, A.H.; Madhu, B.; Hackl, R. Hydrometallurgy The role of microorganisms in gold processing and recovery—A review. Hydrometallurgy 2014, 142, 70–83. [Google Scholar] [CrossRef]
  205. Paques Metal & Mining Industry—Sustainable Metal Recovery and Water Treatment. Available online: https://en.paques.nl/mediadepot/184210ea7803/WEBSectorbrochureMetalMining.pdf (accessed on 11 May 2021).
  206. Paques Anglo Coal. Acidic Mine Water Treatment without Lime. Available online: https://en.paques.nl/about-us/subpages/cases/anglo-coal-en/3 (accessed on 11 May 2021).
  207. Boxall, N.J.; King, S.; Yu, K.; Gumulya, Y.; Bruckard, W.; Kaksonen, A.H. Urban mining of lithium-ion batteries in Australia: Current state and future trends. Miner. Eng. 2018, 128, 45–55. [Google Scholar] [CrossRef]
  208. Kinnunen, H.; Kaksonen, A.H. Towards circular economy in mining: Opportunities and bottlenecks for tailings valorization. J. Clean. Prod. 2019, 228, 153–160. [Google Scholar] [CrossRef]
  209. Bryan, C.G.; Williamson, B.J.; Całus-Moszko, J.; van Haute, Q.; Guezennec, A.-G.; Gaydardzhiev, S.; Wavrer, P.; Frączek, R. CEReS—Co-processing of coal mine & electronic wastes: Novel resources for a sustainable future. Hydrometallurgy 2020, 197, 105444. [Google Scholar] [CrossRef]
  210. Kaya, M. Waste printed circuit board (WPCB) recovery technology: Disassembly and desoldering approach. In Electronic Waste and Printed Circuit Board Recycling Technologies; The Minerals, Metals & Materials Series; Springer: Cham, Switzerland, 2020. [Google Scholar]
  211. Yang, Y.; Chen, S.; Li, S.; Chen, M.; Chen, H.; Liu, B. Bioleaching waste printed circuit boards by Acidithiobacillus ferrooxidans and its kinetics aspect. J. Biotechnol. 2014, 173, 24–30. [Google Scholar] [CrossRef] [PubMed]
  212. Hubau, A.; Minier, M.; Chagnes, A.; Joulian, C.; Silvente, C.; Guezennec, A.G. Recovery of metals in a double-stage continuous bioreactor for acidic bioleaching of printed circuit boards (PCBs). Sep. Purif. Technol. 2020, 238, 116481. [Google Scholar] [CrossRef]
  213. Zhu, N.; Xiang, Y.; Zhang, T.; Wu, P.; Dang, Z.; Li, P.; Wu, J. Bioleaching of metal concentrates of waste printed circuit boards by mixed culture of acidophilic bacteria. J. Hazard. Mater. 2011, 192, 614–619. [Google Scholar] [CrossRef]
  214. Pradhan, J.K.; Kumar, S. Metals bioleaching from electronic waste by Chromobacterium violaceum and Pseudomonads sp. Waste Manag. Res. 2012, 30, 1151–1159. [Google Scholar] [CrossRef] [PubMed]
  215. Tran, C.D.; Lee, J.C.; Pandey, B.D.; Jeong, J.; Yoo, K.; Huynh, T.H. Bacterial cyanide generation in the presence of metal ions (Na+, Mg2+, Fe2+, Pb2+) and gold bioleaching from waste PCBs. J. Chem. Eng. Jpn. 2011, 44, 692–700. [Google Scholar] [CrossRef]
  216. Işıldar, A.; van de Vossenberg, J.; Rene, E.R.; van Hullebusch, E.D.; Lens, P.N.L. Two-step bioleaching of copper and gold from discarded printed circuit boards (PCB). Waste Manag. 2016, 57, 149–157. [Google Scholar] [CrossRef]
  217. Brandl, H.; Bosshard, R.; Wegmann, M. Computer-munching microbes: Metal leaching from electronic scrap by bacteria and fungi. Process Metall. 1999, 9, 569–576. [Google Scholar] [CrossRef]
  218. Liu, Q.; Bai, J.F.; Gu, W.H.; Peng, S.J.; Wang, L.C.; Wang, J.W.; Li, H.X. Leaching of copper from waste printed circuit boards using Phanerochaete chrysosporium fungi. Hydrometallurgy 2020, 196, 105427. [Google Scholar] [CrossRef]
  219. Trivedi, A.; Hait, S. Bioleaching of selected metals from e-waste using pure and mixed cultures of Aspergillus species BT–measurement, analysis and remediation of environmental pollutants. In Measurement, Analysis and Remediation of Environmental Pollutants; Gupta, T., Singh, S.P., Rajput, P., Agarwal, A.K., Eds.; Springer: Singapore, 2020; pp. 271–280. ISBN 978-981-15-0540-9. [Google Scholar]
  220. Marappa, N.; Ramachandran, L.; Dharumadurai, D.; Nooruddin, T. Recovery of gold and other precious metal resources from environmental polluted e-waste printed circuit board by bioleaching Frankia. Int. J. Environ. Res. 2020, 14, 165–176. [Google Scholar] [CrossRef]
  221. Calvert, G.; Kaksonen, A.H.; Cheng, K.Y.; Van Yken, J.; Chang, B.; Boxall, N.J. Recovery of metals from waste lithium ion battery leachates using biogenic hydrogen sulfide. Minerals 2019, 9, 563. [Google Scholar] [CrossRef] [Green Version]
  222. Pourhossein, F.; Mousavi, S.M. A novel step-wise indirect bioleaching using biogenic ferric agent for enhancement recovery of valuable metals from waste light emitting diode. J. Hazard. Mater. 2019, 378, 120648. [Google Scholar] [CrossRef]
  223. Bryan, C.G.; Watkin, E.L.; McCredden, T.J.; Wong, Z.R.; Harrison, S.T.L.; Kaksonen, A.H. The use of pyrite as a source of lixiviant in the bioleaching of electronic waste. Hydrometallurgy 2015, 152, 33–43. [Google Scholar] [CrossRef]
  224. Rizki, I.N.; Tanaka, Y.; Okibe, N. Thiourea bioleaching for gold recycling from e-waste. Waste Manag. 2019, 84, 158–165. [Google Scholar] [CrossRef]
  225. Yang, H.; Liu, Q.; Chen, G.; Tong, L.; Ali, A. Bio-dissolution of pyrite by Phanerochaete chrysosporium. Trans. Nonferrous Met. Soc. China 2018, 28, 766–774. [Google Scholar] [CrossRef]
  226. Argumedo-Delira, R.; Gómez-Martínez, M.J.; Soto, B.J. Gold bioleaching from printed circuit boards of mobile phones by Aspergillus niger in a culture without agitation and with glucose as a sarbon source. Metals 2019, 9, 521. [Google Scholar] [CrossRef] [Green Version]
  227. Reed, D.W.; Fujita, Y.; Daubaras, D.L.; Jiao, Y.; Thompson, V.S. Bioleaching of rare earth elements from waste phosphors and cracking catalysts. Hydrometallurgy 2016, 166, 34–40. [Google Scholar] [CrossRef] [Green Version]
  228. Aishvarya, V.; Mishra, G.; Pradhan, N.; Ghosh, M.K. Hydrometallurgy bioleaching of indian ocean nodules with in situ iron precipitation by anaerobic Mn reducing consortia. Hydrometallurgy 2016, 166, 130–135. [Google Scholar] [CrossRef]
  229. Hong, Y. Bioleaching of Gold and Copper from Electronic Waste Using Sulphate Reducing Bacteria. Ph.D. Thesis, University of Sydney, Sydney, Australia, 2018. [Google Scholar]
  230. Corbett, M.K.; Eksteen, J.J.; Niu, X.-Z.; Croue, J.-P.; Watkin, E.L.J. Interactions of phosphate solubilising microorganisms with natural rare-earth phosphate minerals: A study utilizing Western Australian monazite. Bioprocess Biosyst. Eng. 2017, 40, 929–942. [Google Scholar] [CrossRef]
  231. Gumulya, Y.; Kaksonen, A.H. Engineering resilience to biomining microorganisms. Enviroment 2018, 12, 36–38. [Google Scholar]
  232. Sedlak, R.H.; Hnilova, M.; Grosh, C.; Fong, H.; Baneyx, F.; Schwartz, D.; Sarikaya, M.; Tamerler, C.; Traxler, B. Engineered Escherichia coli silver-binding periplasmic protein that promotes silver tolerance. Appl. Environ. Microbiol. 2012, 78, 2289–2296. [Google Scholar] [CrossRef] [PubMed] [Green Version]
  233. Schubert, T.; Maskow, T.; Benndorf, D.; Harms, H.; Breuer, U. Continuous synthesis and excretion of the compatible solute ectoine by a transgenic, nonhalophilic bacterium. Appl. Environ. Microbiol. 2007, 73, 3343–3347. [Google Scholar] [CrossRef] [Green Version]
  234. Khaskheli, G.B.; Zuo, F.; Yu, R.; Chen, S. Overexpression of Small Heat Shock Protein Enhances Heat- and Salt-Stress Tolerance of Bifidobacterium longum NCC2705. Curr. Microbiol. 2015, 71, 8–15. [Google Scholar] [CrossRef] [PubMed]
  235. Jensen, H.M.; Albers, A.E.; Malley, K.R.; Londer, Y.Y.; Cohen, B.E.; Helms, B.A.; Weigele, P.; Groves, J.T.; Ajo-Franklin, C.M. Engineering of a synthetic electron conduit in living cells. Proc. Natl. Acad. Sci. USA 2010, 107, 19213–19218. [Google Scholar] [CrossRef] [PubMed] [Green Version]
  236. Natarajan, G.; Tay, S.B.; Yew, W.S.; Ting, Y.P. Engineered strains enhance gold biorecovery from electronic scrap. Miner. Eng. 2015, 75, 32–37. [Google Scholar] [CrossRef]
  237. Caballar, R.D. A New Zealand Startup Is Using Microbes to Suck Solid Gold Out of E-Waste. Available online: https://onezero.medium.com/a-new-zealand-startup-is-using-microbes-to-suck-solid-gold-out-of-e-waste-48814d425eef (accessed on 11 May 2021).
  238. Gu, W.; Bai, J.; Lu, L.; Zhuang, X.; Zhao, J.; Yuan, W.; Zhang, C.; Wang, J. Improved bioleaching efficiency of metals from waste printed circuit boards by mechanical activation. Waste Manag. 2019, 98, 21–28. [Google Scholar] [CrossRef] [PubMed]
  239. Reuter, M.A.; van Schaik, A. Product-centric simulation-based design for recycling: Case of LED lamp recycling. J. Sustain. Metall. 2015, 1, 4–28. [Google Scholar] [CrossRef] [Green Version]
  240. Boxall, N.J.; Cheng, K.Y.; Bruckard, W.; Kaksonen, A.H. Application of indirect non-contact bioleaching for extracting metals from waste lithium-ion batteries. J. Hazard. Mater. 2018, 360, 504–511. [Google Scholar] [CrossRef]
  241. Australian Aluminium. Available online: https://aluminium.org.au/australian-aluminium/ (accessed on 26 April 2021).
  242. Reuter, M.A. Letter to the editor. Miner. Eng. 2013, 40, 81. [Google Scholar] [CrossRef]
  243. Mucciardi, F.; Razavinia, N. The Capture and Conversion of Low Grade Waste Heat in Pyrometallurgical Operations. In Proceedings of the 6th International Symposium on Waste Processing and Recycling in the Mineral and Metallurgical Industries: WALSIM: Water, Air and Land Sustainability Issues in Mineral and Metal Extraction, Winnipeg, MB, Canada, 24–27 August 2008. [Google Scholar]
  244. Huang, J.; Chen, M.; Chen, H.; Chen, S.; Sun, Q. Leaching behavior of copper from waste printed circuit boards with Brønsted acidic ionic liquid. Waste Manag. 2014, 34, 483–488. [Google Scholar] [CrossRef]
  245. Reuter, M.A.; Van Schaik, A.; Gutzmer, J.; Bartie, N.; Abadías-llamas, A. Challenges of the circular economy: A material, metallurgical, and product design perspective. Annu. Rev. Mater. Res. 2019, 49, 253–274. [Google Scholar] [CrossRef]
  246. Rautela, R.; Arya, S.; Vishwakarma, S.; Lee, J.; Kim, K.-H.; Kumar, S. E-waste Management and its Effects on the Environment and Human Health. Sci. Total Environ. 2021, 773, 145623. [Google Scholar] [CrossRef]
  247. Deng, W.J.; Louie, P.K.K.; Liu, W.K.; Bi, X.H.; Fu, J.M.; Wong, M.H. Atmospheric levels and cytotoxicity of PAHs and heavy metals in TSP and PM 2.5 at an electronic waste recycling site in southeast China. Atmos. Environ. 2006, 40, 6945–6955. [Google Scholar] [CrossRef]
  248. Tue, N.M.; Takahashi, S.; Suzuki, G.; Isobe, T.; Viet, P.H.; Kobara, Y.; Seike, N.; Zhang, G.; Sudaryanto, A.; Tanabe, S. Contamination of indoor dust and air by polychlorinated biphenyls and brominated flame retardants and relevance of non-dietary exposure in Vietnamese informal e-waste recycling sites. Environ. Int. 2013, 51, 160–167. [Google Scholar] [CrossRef]
  249. Ha, N.N.; Agusa, T.; Ramu, K.; Tu, N.P.C.; Murata, S.; Bulbule, K.A.; Parthasaraty, P.; Takahashi, S.; Subramanian, A.; Tanabe, S. Contamination by trace elements at e-waste recycling sites in Bangalore, India. Chemosphere 2009, 76, 9–15. [Google Scholar] [CrossRef] [PubMed]
  250. Singh, M.; Thind, P.S.; John, S. Health risk assessment of the workers exposed to the heavy metals in e-waste recycling sites of Chandigarh and Ludhiana, Punjab, India. Chemosphere 2018, 203, 426–433. [Google Scholar] [CrossRef]
  251. Luo, C.; Liu, C.; Wang, Y.; Liu, X.; Li, F.; Zhang, G.; Li, X. Heavy metal contamination in soils and vegetables near an e-waste processing site, south China. J. Hazard. Mater. 2011, 186, 481–490. [Google Scholar] [CrossRef]
  252. Ju, Y.; Xu, G.; Chen, L.; Shi, J. Effects of the electronic waste pollution on the levels of thyroid hormone and its receptor expression in the parturient woman and the newborn. Wei Sheng Yan Jiu J. Hyg. Res. 2008, 37, 536–539. [Google Scholar]
  253. Yuan, J.; Chen, L.; Chen, D.; Guo, H.; Bi, X.; Ju, Y.; Jiang, P.; Shi, J.; Yu, Z.; Yang, J. Elevated serum polybrominated diphenyl ethers and thyroid-stimulating hormone associated with lymphocytic micronuclei in Chinese workers from an E-waste dismantling site. Environ. Sci. Technol. 2008, 42, 2195–2200. [Google Scholar] [CrossRef]
  254. Zhang, J.; Jiang, Y.; Zhou, J.; Wu, B.; Liang, Y.; Peng, Z.; Fang, D.; Liu, B.; Huang, H.; He, C. Elevated body burdens of PBDEs, dioxins, and PCBs on thyroid hormone homeostasis at an electronic waste recycling site in China. Environ. Sci. Technol. 2010, 44, 3956–3962. [Google Scholar] [CrossRef] [PubMed]
  255. Wang, H.; Zhang, Y.; Liu, Q.; Wang, F.; Nie, J.; Qian, Y. Examining the relationship between brominated flame retardants (BFR) exposure and changes of thyroid hormone levels around e-waste dismantling sites. Int. J. Hyg. Environ. Health 2010, 213, 369–380. [Google Scholar] [CrossRef] [PubMed]
  256. Zheng, G.; Xu, X.; Li, B.; Wu, K.; Yekeen, T.A.; Huo, X. Association between lung function in school children and exposure to three transition metals from an e-waste recycling area. J. Expo. Sci. Environ. Epidemiol. 2013, 23, 67–72. [Google Scholar] [CrossRef]
  257. Guo, Y.; Huo, X.; Li, Y.; Wu, K.; Liu, J.; Huang, J.; Zheng, G.; Xiao, Q.; Yang, H.; Wang, Y. Monitoring of lead, cadmium, chromium and nickel in placenta from an e-waste recycling town in China. Sci. Total Environ. 2010, 408, 3113–3117. [Google Scholar] [CrossRef]
  258. Guo, Y.; Huo, X.; Wu, K.; Liu, J.; Zhang, Y.; Xu, X. Carcinogenic polycyclic aromatic hydrocarbons in umbilical cord blood of human neonates from Guiyu, China. Sci. Total Environ. 2012, 427, 35–40. [Google Scholar] [CrossRef]
  259. Huo, X.; Peng, L.; Xu, X.; Zheng, L.; Qiu, B.; Qi, Z.; Zhang, B.; Han, D.; Piao, Z. Elevated blood lead levels of children in Guiyu, an electronic waste recycling town in China. Environ. Health Perspect. 2007, 115, 1113–1117. [Google Scholar] [CrossRef]
  260. Li, Y.; Xu, X.; Wu, K.; Chen, G.; Liu, J.; Chen, S.; Gu, C.; Zhang, B.; Zheng, L.; Zheng, M. Monitoring of lead load and its effect on neonatal behavioral neurological assessment scores in Guiyu, an electronic waste recycling town in China. J. Environ. Monit. 2008, 10, 1233–1238. [Google Scholar] [CrossRef] [PubMed]
  261. Liu, J.; Xu, X.; Wu, K.; Piao, Z.; Huang, J.; Guo, Y.; Li, W.; Zhang, Y.; Chen, A.; Huo, X. Association between lead exposure from electronic waste recycling and child temperament alterations. Neurotoxicology 2011, 32, 458–464. [Google Scholar] [CrossRef] [PubMed]
  262. Basel Convention. 2019. Available online: www.basel.int/TheConvention/Overview/TextoftheConvention/tabid/1275/Default.aspx (accessed on 18 August 2021).
  263. Illés, A.; Geeraerts, K. Illegal Shipments of E–waste from the EU to China. In Fighting Environmental Crime in Europe and Beyond; Springer: Berlin/Heidelberg, Germany, 2016; pp. 129–160. [Google Scholar]
  264. Tourneau, L.; Le Tourneau, R. Australian E-Waste Ending Up in Toxic African Dump, Torn Apart By Children. ABC News. 2017. Available online: https://www.abc.net.au/news/2017-03-10/australian-e-waste-ending-up-in-toxic-african-dump/8339760 (accessed on 18 August 2021).
  265. Cubby, B. Toxic Australian E-Waste Dumped on China. Available online: https://www.smh.com.au/environment/toxic-australian-ewaste-dumped-on-china-20090521-bh6f.html#:~:text=ILLEGALshipmentsofelectronicwaste,andtoxicpollutioninChina (accessed on 24 March 2021).
  266. Salleh, A. E-Waste Exports Highlight Need for Tighter Controls on “Unethical And Irresponsible” Trade. Available online: https://www.abc.net.au/news/science/2018-08-16/australian-e-waste-exports-to-developing-countries-unethical/10119000 (accessed on 24 March 2021).
  267. Woolf, A.-L. “No Doubt” That NZ’s Recycling Is Ending Up in Illegal Dumping Sites Overseas. Available online: https://www.stuff.co.nz/environment/109142425/no-doubt-that-nzs-recycling-is-ending-up-in-illegal-dumping-sites-overseas (accessed on 24 March 2021).
  268. Elshkaki, A.; Graedel, T.E.; Ciacci, L.; Reck, B. Copper demand, supply, and associated energy use to 2050. Glob. Environ. Chang. 2016, 39, 305–315. [Google Scholar] [CrossRef] [Green Version]
  269. Victoria State Government. E-Waste in Victoria. Available online: https://www.environment.vic.gov.au/sustainability/e-waste-in-victoria (accessed on 24 March 2021).
  270. Patil, R.A.; Ramakrishna, S. A comprehensive analysis of e-waste legislation worldwide. Environ. Sci. Pollut. Res. 2020, 27, 14412–14431. [Google Scholar] [CrossRef] [PubMed]
Figure 1. The six categories of e-waste: (A) Large equipment, (B) Small equipment, (C) Temperature exchange equipment, (D) Screens and monitors, (E) Small information technology and telecommunication equipment and (F) Lamps [1].
Metals 11 01313 g001
Figure 2. Annual generation of e-waste in top ten countries and the corresponding recycling data from Forti, 2018 [5].
Metals 11 01313 g002
Figure 3. (A) Total e-waste generation, (B) e-waste generated per capita and (C) recycling rate in various regions in 2019 [5].
Metals 11 01313 g003
Figure 4. Average percent of various materials found in e-waste (Adapted from Kaya, 2018).
Metals 11 01313 g004
Figure 5. Overview of the roles and responsibilities for various stakeholders of the Australian National TV and Computer Recycling Scheme (NTCRS) modified from [39].
Metals 11 01313 g005
Figure 6. Relative quantities (mass-%) of e-waste shipped from Australia to be recycled in various international destinations in 2016. Data obtained from [37].
Metals 11 01313 g006
Figure 7. Overview of possible e-waste recycling pathways [9,16].
Metals 11 01313 g007
Table 1. Potential value of raw materials in e-waste generated globally in 2019 [1].
MetalAmount Present in E-Waste (kt)Potential Value (US $ Million)
Ag1.2579
Al30466061
Au0.29481
Bi0.11.3
Co131036
Cu180810,960
Fe20,46624,645
Ge0.010.4
In0.217
Ir0.0015
Os0.01108
Pd0.13532
Pt0.00271
Rh0.01320
Ru0.00033
Sb76644
Total 57,463.7
Table 2. List of some recyclers partnered with CRA and their operational area in Australia.
Co-Regulatory
Arrangment
RecyclerOperational AreaReference
EPSACity MissionTasmania[80]
AspitechSouth Australia[81]
Total green recyclingWestern Australia[82]
E-cycle SASouth Australia[83]
Endeavour FoundationQueensland[84]
SIMS Recycling SolutionsNational[85]
ANZRPTox FreeNew South Wales[37]
TES-AMMVictoria, New South Wales, Queensland[86]
E-cycle solutionsUnited Star resourcesVictoria[87]
Quantum Recycling SolutionsVictoria[88]
Buyequip Pty LtdQueensland[89]
E-wasteTECVictoria[90]
MobileMustersNational[44]
Table 3. Examples of some major pyrometallurgical facilities that extract metals from e-waste.
FacilityLocationMetals RecoveredProcess OverviewProcess Capacity for E-Waste (kt/annum)Reference
UmicoreHoboken,
Belgium
Ag, As, Au, Bi, Cu, In, Ir, Ni,
Pb, Pd, Pt, Rh, Ru, Sb, Se, Sn
ISA SMELTTM smelting, copper leaching and electrowinning, precious metal refining350[9,24]
AurubisLünen,
Germany
Ag, Au, Cu, Pb, Sn, Zn Top submerged lance bath smelting, black copper processing and electrorefining, precious metal refining300 1[9,57]
NorandaQuebec,
Canada
Ag, Au, Cu, Ni, Pd, Pt, Se, Te Smelting and electrorefining, precious metal refining100[9,24,58]
RönnskäBoliden,
Sweden
Ag, Au, As, Bi, Cu, In, Ir, Ni, Pb, Pd, Pt, Rh, Ru, Sb, Se, Sn,Kaldo reactor smelting, copper refining and purification, precious metal refining120[9,24]
DOWA smelterKosaka,
Japan
Ag, Au, Bi, Cu, Ni, Pb, Sb, Sn, TeTop submerged lance bath smelting and copper refining, precious metal refining150[24,59]
1 Total input of recyclable material, of which only a fraction is e-waste.
Table 4. Common metal solubilisation reactions that can be utilised for extracting metals from e-waste.
Leaching ProcessExample of ReagentReference
Halogen leaching2Au + I3 + I → 2(AuI2)
2Au + 3I3 → 2(AuI4) + I
Au + 2Br → AuBr2 + e
Au + 4Br → AuBr4 + 3e
[149,164]
Thiourea + ferric iron leachingAu + 2SC(NH2)2 + Fe3+ → Au(SC(NH2)2+ + Fe2+
Ag + 3SC(NH2)2 + Fe3+ → Ag(SC(NH2)2)3+ + Fe2+
[151]
Thiosulfate leachingAu + 5S2O32− + Cu(NH3)42+ ↔ Au(S2O3)23 + Cu(S2O3)35 + 4NH3
Ag + 5S2O32− + Cu(NH3)42+ ↔ Ag(S2O3)23 + Cu(S2O3)35 + 4NH3
[153]
Cyanide leaching4Au + 8CN +O2 + 2H2O → 4Au(CN)2 + 4OH
4Ag + 8CN +O2 + 2H2O → 4Ag(CN)2 + 4OH
[165]
Inorganic acid leaching2M + 2H2SO4 + O2 → 2M2+ + 2SO42 + 2H2O
3M + 8HNO3 → 3M(NO3)2 + 4H2O + 2NO(g)
2M + 2HCl → 2MCl2 + H2 (g)
M = metal
[156,166,167]
Organic acid leaching2M + 2H2O2 + 2HCit2− + H+ → M2(Cit)2OH3 + H2O
4M + 4xHL + xO2 → 4MLx + 2xH2O
M = metal, Cit = citric acid, x = valence of metal ions, L = glycine anion
[168,169]
Ferric leaching2Fe3+ + M → 2Fe2+ + M2+
M = metal
[170]
Table 5. Overview of leaching agents used in hydrometallurgy as well as the process conditions.
Leaching ProcessExamples of ReagentspHPulp Density (%)Temperature (°C)Leaching Period (Hours)Metals Recovered (%)Reference
Halogen leachingIodide (3%) + H2O2 (1%)715354Au: 100[148]
Bromine (0.77M) + Sodium Bromide (1.17 M) + HCl (2 M)10523.510Au: 95.6
Cu: 97.9
Ag: 96.5
Ni: 95.2
[149]
Thiourea leachingThiourea (34 g/L) + Fe3+ (0.06%)1-252Au: 90
Ag: 50
[151]
Thiourea (12 g/L) + Fe3+ (0.8%)1.510251Au: 91.4
Ag: 80.2
[152]
Thiosulfate leachingThiosulfate (0.2 M) + CuSO4 (0.02 M)10104024Au: 95
Ag: 100
[153]
Cupric thiosulfate (0.14 M) + NH3 (0.3 M)10–10.56.62510Au: 98
Ag: 100
[154]
Cyanide leachingCyanide (0.1 M)9–1120202Au: 95
Ag: 93
[155]
Inorganic acid leachingNitric acid (5 M)4.87630–702Cu: 99.9
Ag: 85
[156]
HCl acid (3.5 M)-5902Sn: 99.8
Pb: 99.9
[157]
Sulfuric acid (2 M) + H2O2 (0.1 M)1.4–1.710503Cu: 46.3
Sn: 21.1
Zn: 51.1
[158]
Organic acid leachingMethanosulfonic acid (15%) + H2O2 (30%)-25802.5Au: 95[150]
Na-citrate (0.5 M) + H2O2 (0.1 M)4.523050Cu: 95
Fe: 90
Pb: 95
[160]
Ascorbic acid (1.25 M)-2.5700.33Co: 94.8
Li: 98.5
[174]
Oxalic acid (0.7 M)-1901Ga: 90.4[173]
Amino acid leachingGlycine (30 g/L) + Cyanide (300 ppm)110.425216Au: 92.1
Ag: 85.3
Cu: 99.1
Zn: 98.5
Pb: 89.8
[169]
Chelating agentsDTPA (0.5 M) + H2O2 (0.9 M)95050108Cu: 97
Zn: 95
Ni: 95
[175]
Table 6. Overview of some of the microorganisms used in biohydrometallurgy along with the reagents generated and the process conditions.
Species InvolvedLeaching AgentPulp Density (%)pHTemperature (°C)Total Leaching Time (h)Metals Recovered (%)Reference
Acidithiobacillus (A.) ferrooxidansFe3+ + H2SO41.52.253572Cu: 96.8
Zn: 83.3
Al: 75.4
[211]
A. ferrooxidansFe3+ + H2SO411.23548Cu: 86.2
Al: 100
Ni: 100
Zn: 100
[162]
Leptospirillum ferriphilum, Sulfobacillus benefaciensFe3+ + H2SO411.13648Cu: 96
Al: 93
Zn: 85
Ni: 73
[212]
Mixed culture of acidophilic bacteriaFe3+ + H2SO41.223045Cu: 96.8
Al: 88.2
Zn: 91.6
[213]
Chromobacterium violaceum, Pseudomonas (P.) aeruginosaCyanide17.230168Au: 73[214]
Chromobacterium violaceumCyanide1.56.830192Au: 11
Cu: 37
[215]
P. fluorescens,
Ps. putida,
A. ferrivorans,
A. thiooxidans
Cyanide
Fe3+ + H2SO4
11.0–1.630216Au: 44
Cu: 98.4
[216]
Aspergillus niger, Penicillium simplicissimumOrganic acids0.1–0.56–730504Cu: 65
Ni: 95
Zn: 95
Al: 95
[217]
Phanerochaete chrysosporiumOrganic acids + bio enzymes2530336Cu: 61[218]
Aspergillus nigerOrganic acids0.1530792Cu: 71
Ni: 32
Zn: 79
[219]
Frankia casuarinaeOrganic acid + phosphatase
enzymes
0.27.4–828720Cu: 94
Au: 75
[220]
Roseovarius (R.) tolerans,R. mucosusTriiodide +
iodide
17.2–8.830240Au: 0.93
Au: 1.6
[164]
Publisher’s Note: MDPI stays neutral with regard to jurisdictional claims in published maps and institutional affiliations.

