Article

Corrosion Behavior of CW6MC Nickel Cast Alloy (Inconel 625) Welded by Shielded Metal Arc Welding

by
Guilherme dos Santos Vacchi
1,2,*,
Rodrigo Silva
1,2,
Cristie Luis Kugelmeier
1,2,
Claudio Beserra Martins Júnior
1,2,
Isabela Dainezi
1,2,
José Henrique Alano
3,
Anibal de Andrade Mendes Filho
4,
Wislei Riuper Ramos Osório
5,6 and
Carlos Alberto Della Rovere
1,2,*
1
Munir Rachid Corrosion Laboratory, Department of Materials Engineering, Federal University of São Carlos, Rodovia Washington Luis Km 235, São Carlos 13565-905, SP, Brazil
2
Graduate Program in Materials Science and Engineering, Federal University of São Carlos, Rodovia Washington Luis Km 235, São Carlos 13565-905, SP, Brazil
3
School of Engineering, Federal University of Rio Grande, Rio Grande 96203-900, RS, Brazil
4
Engineering, Modeling and Applied Social Sciences Center (CECS), Federal University of ABC, Avenida dos Estados 5001, Santo André 09210-580, SP, Brazil
5
School of Technology, University of Campinas, Limeira 13484-350, SP, Brazil
6
Research Group in Manufacturing Advanced Materials, School of Applied Sciences/FCA, University of Campinas, Limeira 13484-332, SP, Brazil
*
Authors to whom correspondence should be addressed.
Metals 2021, 11(8), 1286; https://doi.org/10.3390/met11081286
Submission received: 14 June 2021 / Revised: 5 August 2021 / Accepted: 12 August 2021 / Published: 15 August 2021

Abstract

:
The aim of this study concerns the effect of multi-pass shielded metal arc welding (SMAW) on the corrosion behavior of CW6MC cast nickel alloy. Using optical and SEM techniques the welded joint is analyzed. Vickers microhardness mapping and potentiodynamic polarization in NaCl and H2SO4 solutions are also evaluated. Both the Laves phase and NbC-type carbides are identified in the base metal (BM) and weld metal (WM) regions. The main microstructural difference observed between these regions is the morphology aspect and fineness of the dendritic arrays. The welding process promotes the finer columnar grains formation with refined intermetallic particles in the WM than equiaxed grains of the BM, which in turn results in higher microhardness values in the former region. However, no substantial changes were observed in the corrosion behavior between the BM and WM regions, considering both acid and saline media. Nevertheless, during the multi-pass SMAW process, some non-metallic micrometric inclusions (Mo and S-rich regions) can be constituted to occur in the WM region. This is associated with a significant drop in the corrosion performance of this region when the electrochemical tests are evaluated.

1. Introduction

Nickel-base superalloys are engineering materials with outstanding high-temperature stability, a good combination of mechanical properties and high pitting corrosion resistance [1,2,3]. These alloys found applications as an alternative to the austenitic stainless steels (300 series), the duplex and super duplex in highly corrosive environments (i.e., medium containing Cl ions, H2S and CO2), such as those found in the crude oil and gas extraction and nuclear power plant operations [4,5,6,7,8]. The aforementioned stainless steel may lack the required corrosion resistance in these environments, being considered economically unviable in some cases. Additionally, in such applications, most of the components have complex geometries and are obtained from casting processes (e.g., pumps and valves). This obtaining route makes difficult the use of thermomechanical processing or surface treatments to improve mechanical and corrosion resistance and to correct existing defects in the resulting as-cast microstructural arrays. On the other hand, the majority of defects found in the casting are designated as inclusions (particles of impurities) and porosities (small holes). These may be corrected by Shielded Metal Arc Welding (SMAW) process. SMAW is the most used processing in the industry due to the low complexity of its equipment, high versatility besides the low cost of consumables (i.e., filler metal). Another issue in nickel cast alloys is the occurrence of cracking during the welding process. These cracks are commonly associated with the chemical composition evolution during the welding, which favors the formation of eutectic with a low melting point, segregating the alloying elements to the grain boundaries or to the interdendritic regions that act as preferred locations for the crack formation [3,9].
Nb addition into cast nickel alloys promotes an increase in hardness, either by solid solution or by precipitation of γ” after heat treatment. Additionally, the cast nickel alloys with Nb additions, such as the CW6MC alloy (similar to Inconel® 625 wrought alloy), have good resistance to hot cracking formation due to their optimized chemical composition. This optimum composition results in low segregation of alloying elements and the formation of NbC instead of the chromium carbides (such as M23C6). This favors the hardening of the alloy and reduces the occurrence of ductility-dip cracking, being associated with the presence of chromium carbides [10,11,12,13]. However, during the final stages of solidification (casting or welding), the segregation of alloying elements (Nb, Mo and Si) promotes the formation of secondary phases, such as the Laves phases, which can degrade the corrosion resistance of the material [9,11,14,15,16].
In stainless steels and wrought nickel alloys containing Nb, the formation of Laves phases is related to the deterioration of corrosion resistance due to the formation of the micro-galvanic cells with the metallic matrix, decreasing the lifetime of the component [17,18]. However, for the nickel alloy welds, the investigations are focused on the solidification path, filler metal composition, and dissimilar welding [19,20,21,22,23,24]. Few investigations consider the influence of the Laves phase formation and the microstructure evolution during the welding process and their effects upon corrosion behavior [14,15,24,25]. Therefore, this study aims to assess the localized and general corrosion resistance of a CW6MC grade cast nickel alloy welded by multi-pass SMAW with ER NiCrMo-3 (Alloy 625) as a filler metal. The microstructural changes on the CW6MC butt-welded joint were assessed by optical microscopy (OM), scanning electron microscopy (SEM), electron backscatter diffraction (EBSD) and hardness measurements. General and localized corrosion resistances were characterized by potentiodynamic polarization measurements in both acid (0.5 M H2SO4) and saline (0.6 M NaCl) media.

2. Experimental Procedure

2.1. Material

CW6MC grade cast nickel alloy (ASTM A494 [26]) plates (with dimensions of 400 mm × 200 mm × 40 mm) and ER NiCrMo-3 wires were used as base and filler metals, respectively. These materials were kindly supplied by Grupo Metal® (Tietê, SP, Brazil). Their chemical compositions are presented in Table 1. In order to avoid contamination of sulfur and phosphor in the weld metal, the surface of workpieces was degreased and properly cleaned before the welding process. Among the welding passes, a cleaning with a stainless-steel wire brush was also carried out. This intending to remove the slag and the possible cracks constituted at the end of the weld bead. The double V groove butt weld joint was prepared by the multi-pass SMAW process. The welding parameters are demonstrated in Table 2. The welding parameters used to join the workpieces had the main purpose to replicate the field conditions that may be found when performing a repair of defects on a cast Ni alloy during a pump construction. Additionally, the literature shows that low heat input values, as used in this work, are recommended for welding nickel alloys, because they considerably reduce the hot cracking formation during the weld solidification [27,28,29,30]. Figure 1 shows a schematic representation of the multi-pass welded joint.

2.2. Microstructure Characterization

The butt joint cross-section was cut and metallographically prepared in order to observe the weld macro and resulting microstructural array. The procedure consisted of grinding the surface with SiC abrasive paper up to #1500 grit and polishing with a 1.0 μm alumina suspension. Subsequently, a stereoscope was used for the macrostructure observation of a sample etched with aqua-regia solution (1:3 mixture of concentrated HNO3 and HCl). An FEI Inspect S50 scanning electron microscope (SEM/EBSD) with an electron beam voltage of 25 kV equipped with an EDAX system was used for the microstructure characterization [14]. Additionally, X-ray diffraction (XRD) analyses using a Bruker diffractometer model D8 Advance ECO operated with Cu Kα at 40 kV and 25 mA and the sweep angle range (2θ) from 30° to 120° with a scanning speed of 2°/min were used to analyze the phases and intermetallics present in the material. The crystalline peaks of the XRD spectra were identified based on powder diffraction files (PDF) 330945, 893890 and 653574, and a literature survey [31,32,33,34]. The percentages of intermetallics in each one of the welding regions were quantified based on the ASTM E1245. For this purpose, 30 images in each region were measured.

2.3. Hardness Measurements

In order to identify the different regions generated by the welding process, Vickers microhardness mapping of the transversal weld cross-section was performed using an indentation load of 300 g and a dwell time of 10 s. A spacing of 0.5 mm between two adjacent indentations was used, and a total area of 34.0 mm × 10.0 mm was measured.

2.4. Corrosion Measurements

The influence of the multi-pass SMAW process on the general and localized corrosion resistance of Ni alloy was evaluated by using the potentiodynamic polarization curves. For this purpose, a three-electrode electrochemical cell composed of a silver/silver chloride reference electrode (Ag/AgCl in saturated KCl), a platinum sheet (area of 5 cm2) counter electrode and the test sample as a working electrode (area of 0.283 cm2). Figure 2a shows a macrograph of the welded joint depicting the sites where the BM and WM cylindrical test samples (ø = 6 mm) were carefully machined using a wire-cut EDM process (dashed red circles). Since the Ni alloy has high thermal stability, the heat-affected zone (HAZ) of the joint was extremely narrow (~35 µm), a fact that did not allow its evaluation. After the electric connection, the samples were cold mounted in epoxy resin to prevent the formation of crevices, leaving a circular area of 0.283 cm2 exposed to the solution for the polarization measurements. Before the immersion in the electrochemical cell, the working electrodes were carefully wet sanded up to a #600 grit silicon carbide (SiC) paper, rinsed in distilled water, and naturally air-dried.
In order to evaluate the localized corrosion resistance (i.e., for pitting potential (Epit) determination) of the BM and WM samples, the potentiodynamic polarization measurements were conducted in 0.6 M sodium chloride (NaCl) solution. Curves were recorded after the corrosion potential (Ecorr) was reached, which occurred in 60 min. Then, a potentiodynamic scan rate of 1 mV/s, from −300 mV in relation to the Ecorr value to +1600 mVAg/AgCl was applied. Pitting potentials (Epit) were taken as the potential at which the current density reached 100 μA/cm2 [35]. To ensure good reproducibility, a minimum of five curves of each sample were taken and an average value was considered. The same setup was used for evaluating the general corrosion resistance in 0.5 M sulfuric acid (H2SO4) solution. This solution was also considered due to Ni alloys are commonly used in the sulfuric acid production industry [24,25]. The transpassive potential (Etp) was assumed when a 100 μA/cm2 is reached.
All polarization measurements were performed in stagnant and naturally aerated aqueous solutions at 25 °C (±2). After the potentiodynamic measurements, the surface morphology of samples was analyzed by OM and/or SEM.

3. Results and Discussion

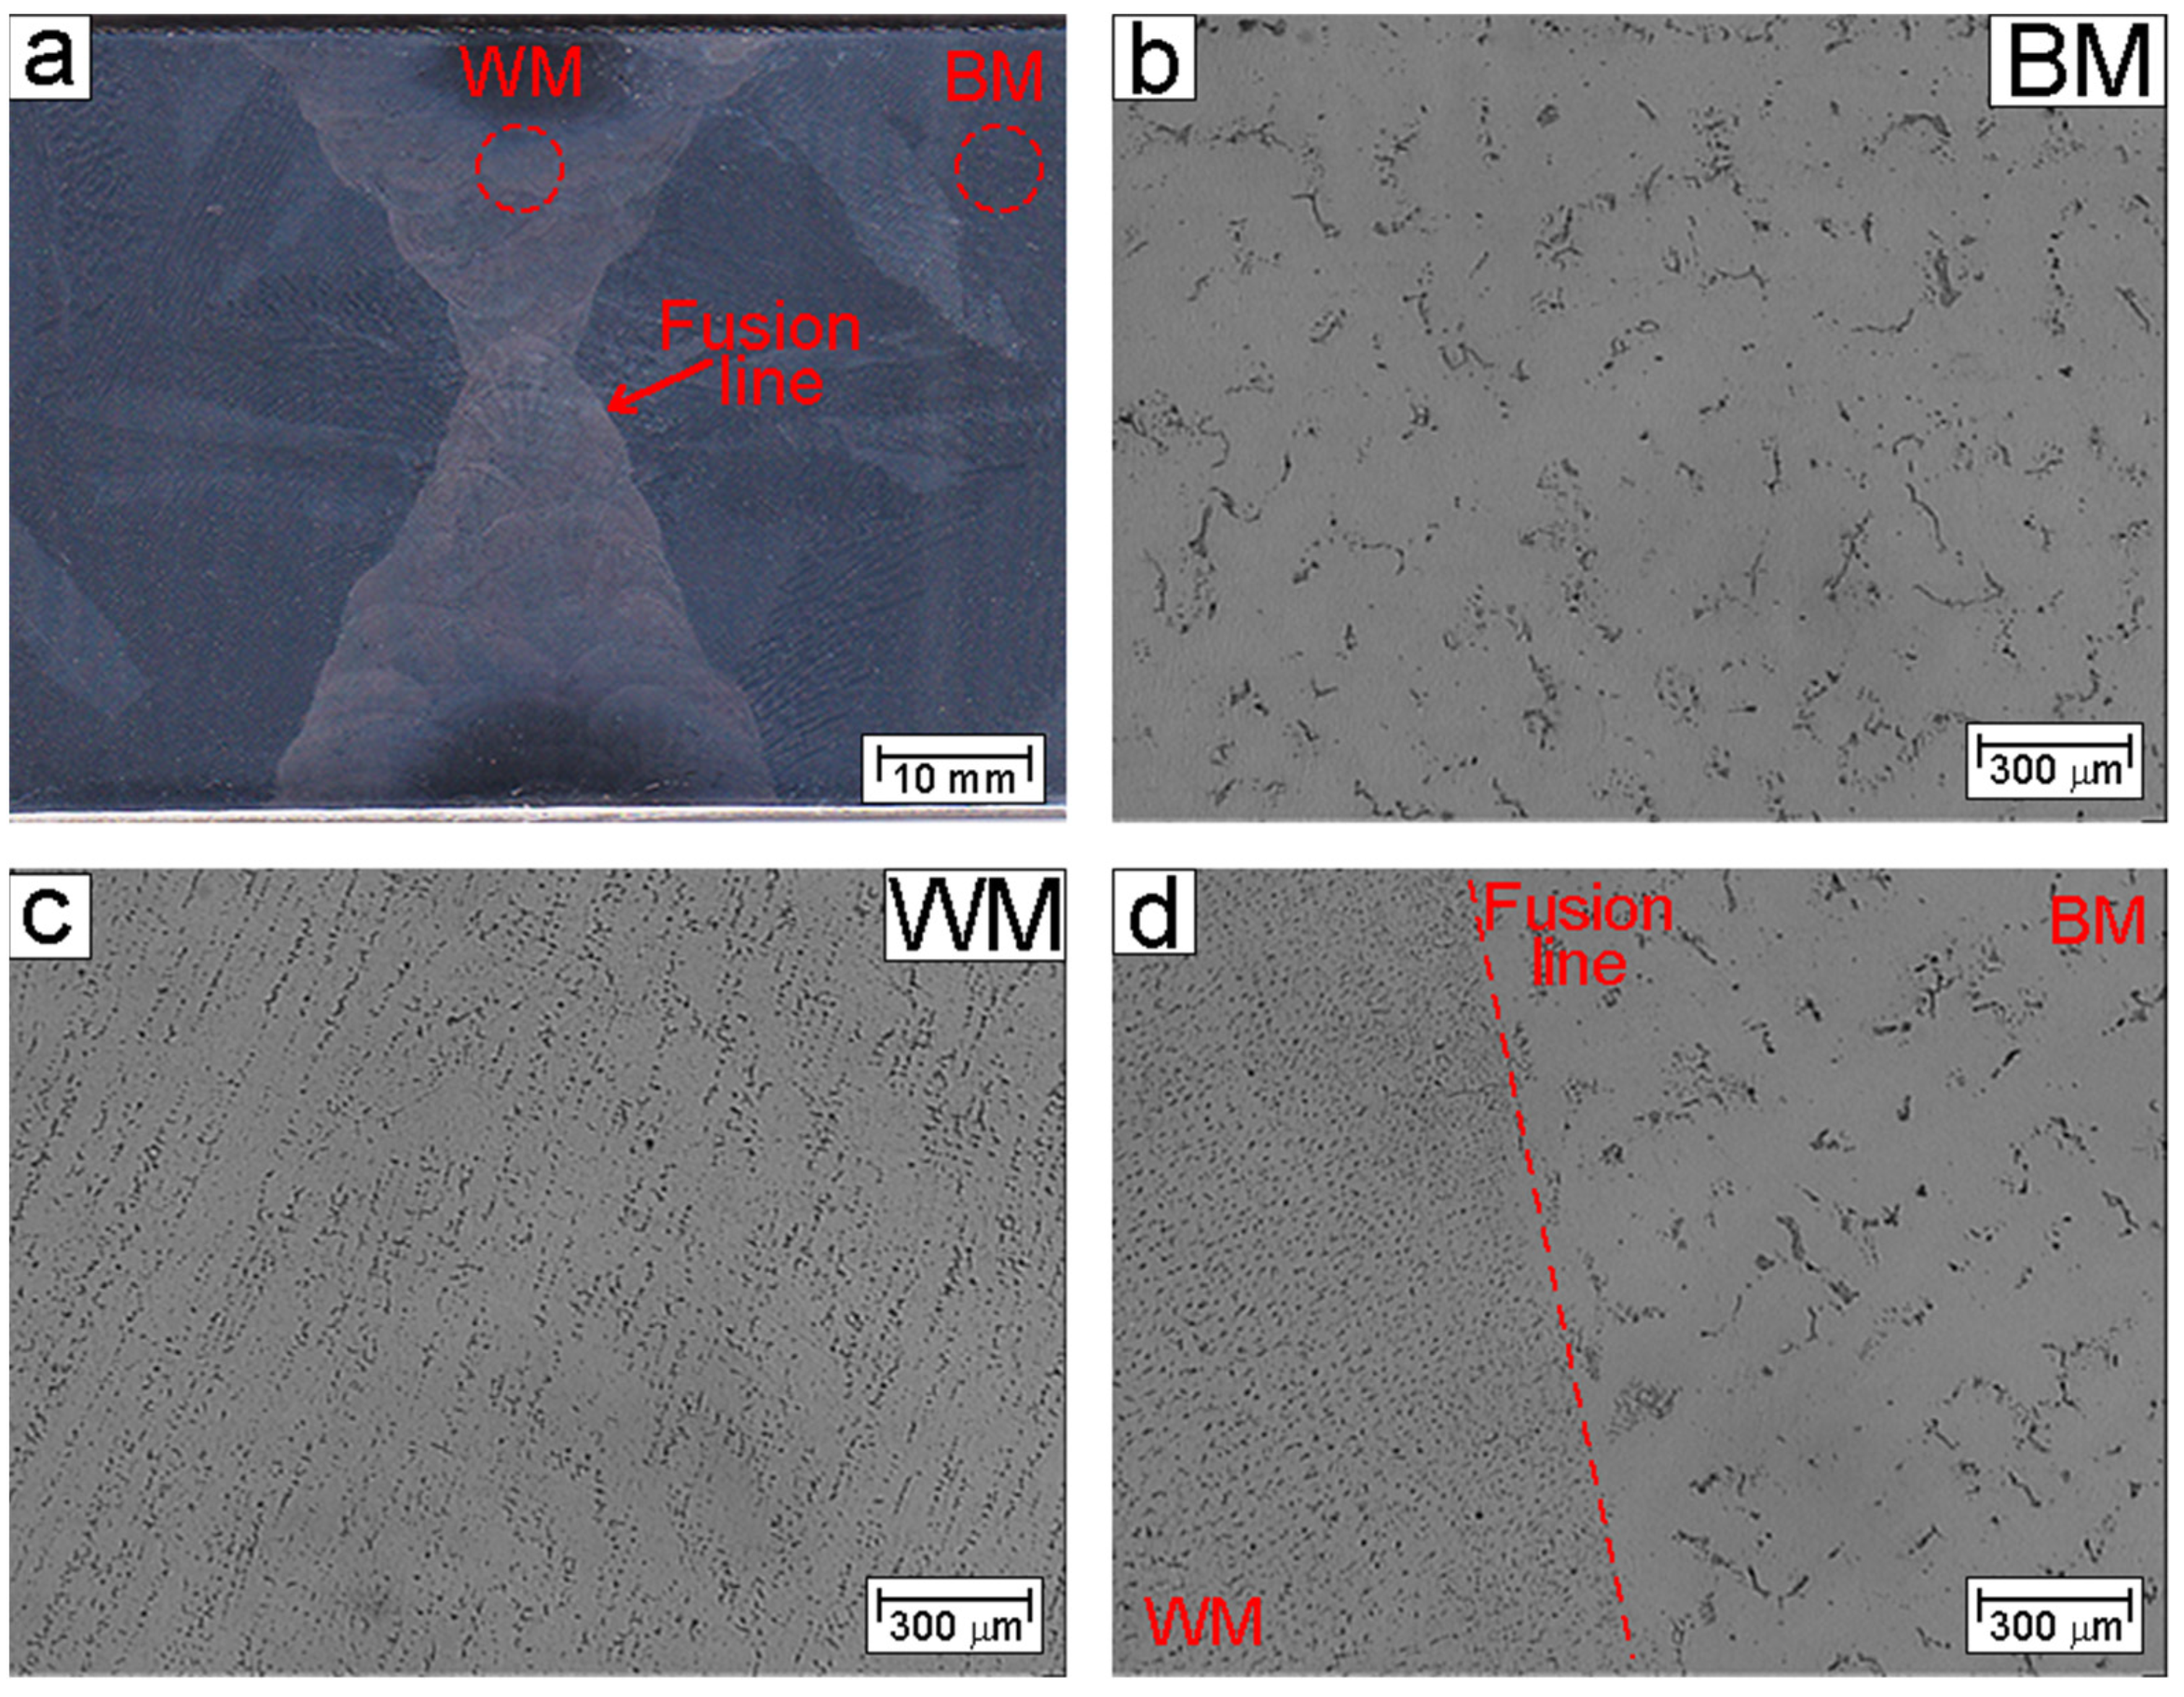
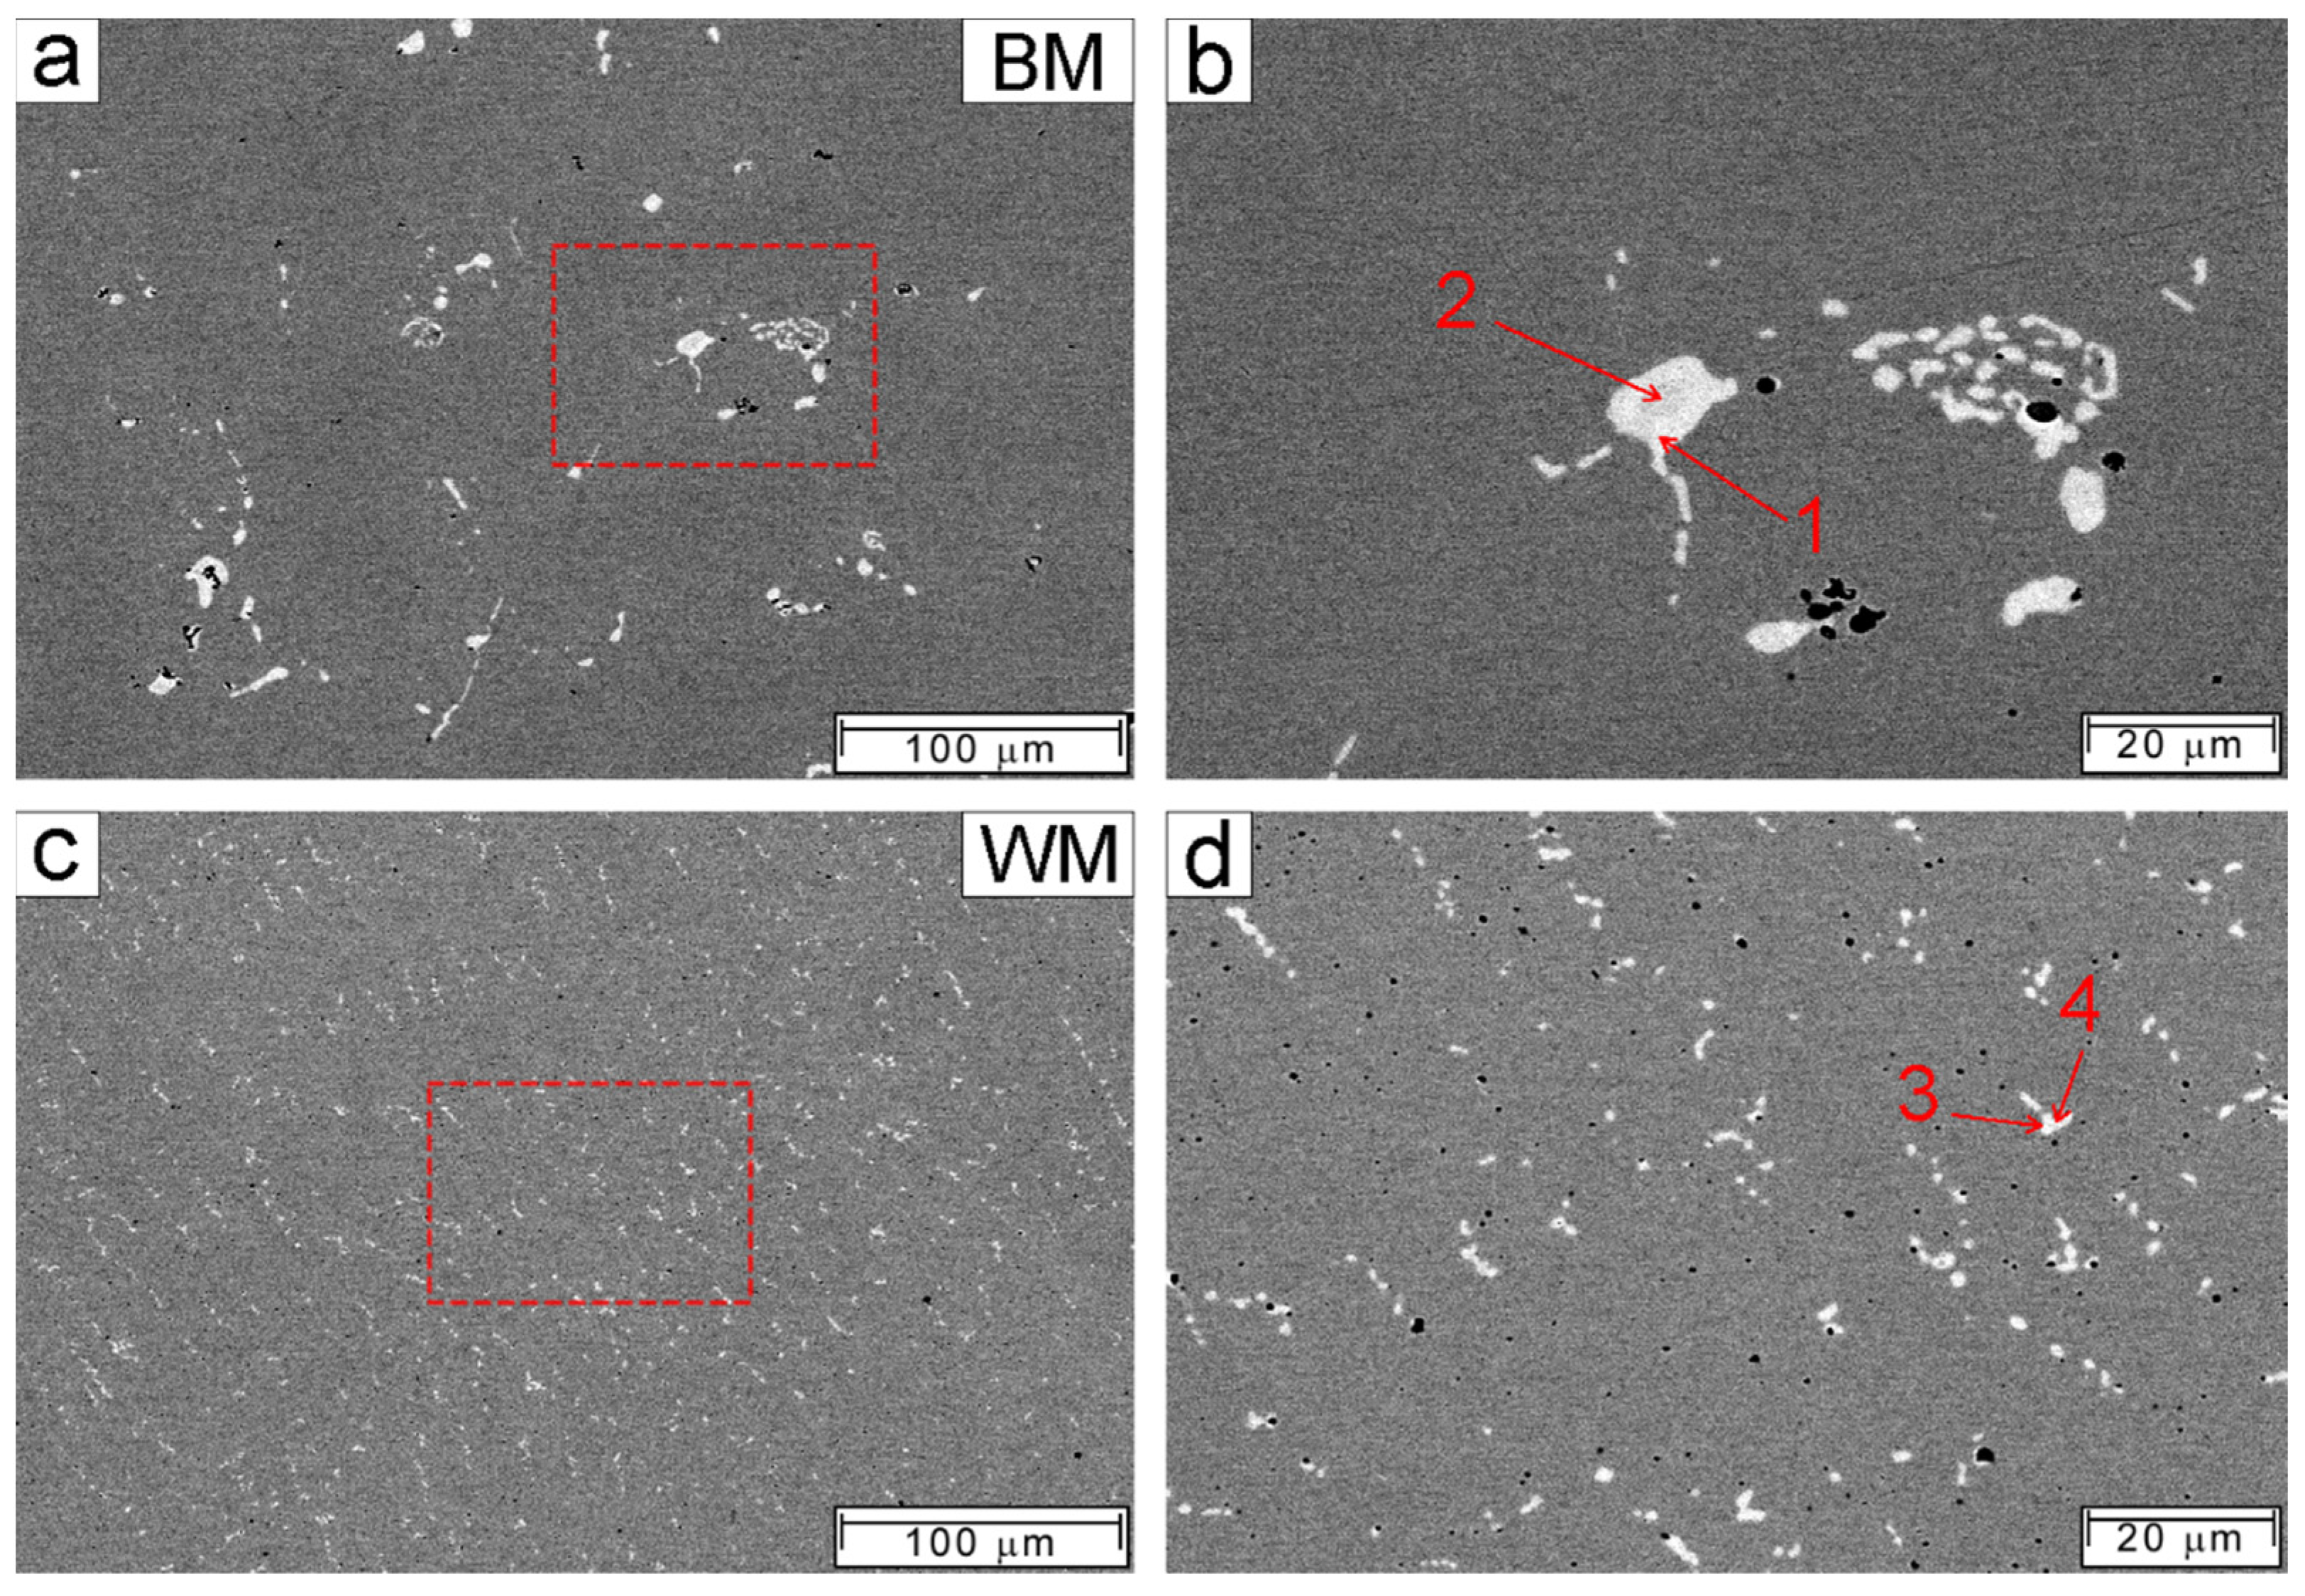
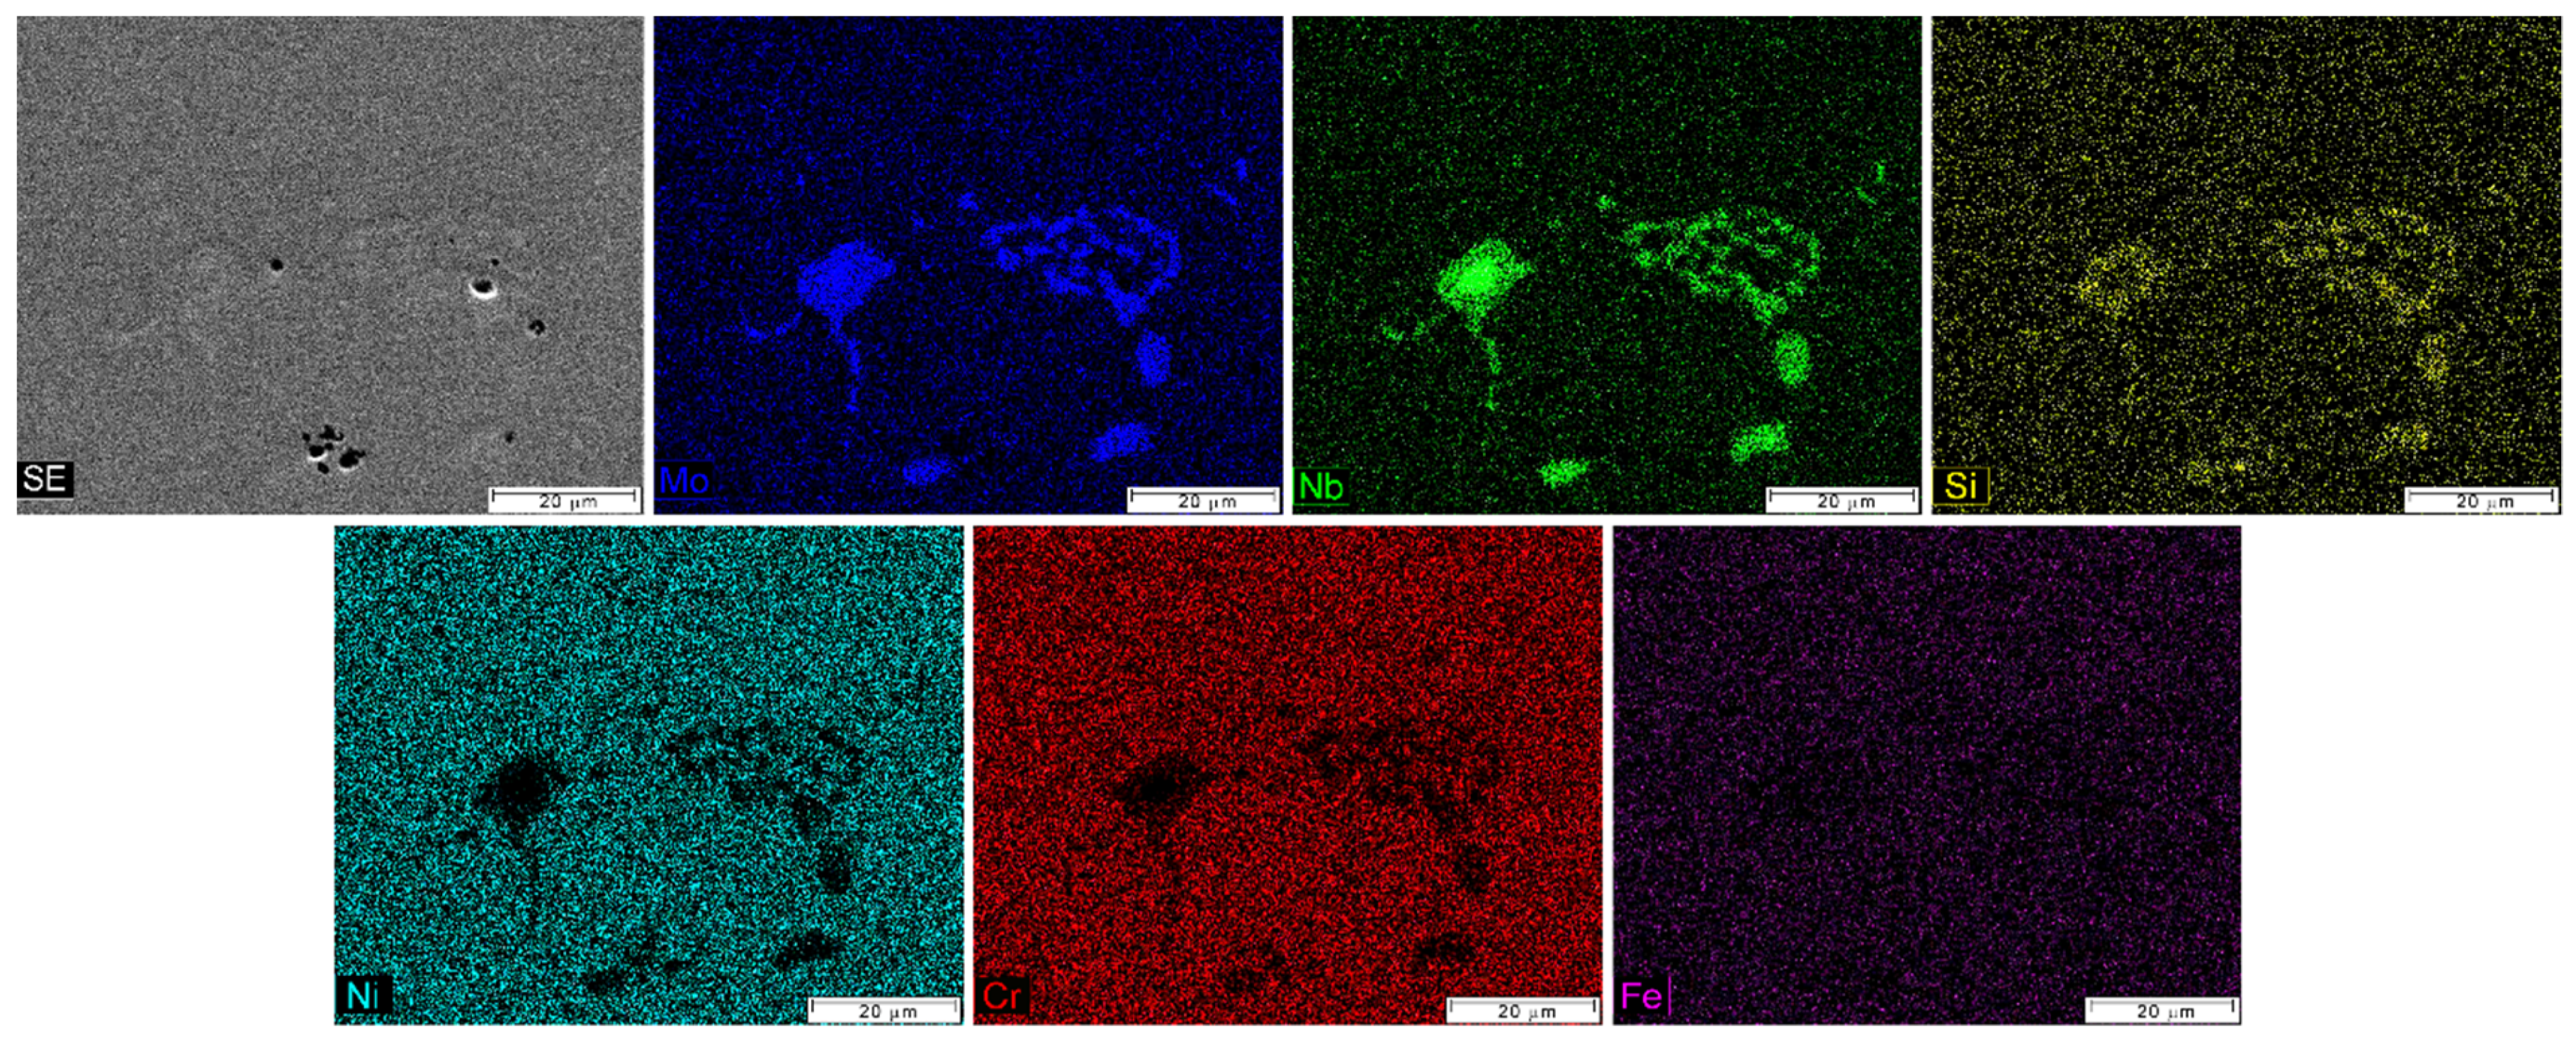
3.1. Microstructural Characterization

Figure 2 shows the macro and microstructure of the cross-section of the multi-pass shielded metal arc welded CW6MC joint. It can be noted that the welding process parameters used in the elaboration of the welded joint were satisfactory, as no defects, such as macroscopic pores or cracks were verified in the macrograph, as shown in Figure 2a. It is also remarked that the BM, shown in Figure 2b, exhibits a less refined dendritic microstructure when compared to the WM region, as depicted in Figure 2c. The BM contains large intermetallics, which are provided from the reduced cooling rate in this region. This also favors the formation of a higher eutectic volume portion in the interdendritic regions at the end of solidification [12]. However, the volumetric fraction of these intermetallics in the BM is relatively lower (5.38% ± 0.71) than the WM (8.84% ± 0.98). This fact can be related to the higher Fe and Cr contents (27.11 wt.% summing both elements) than the BM (24.58 wt.%), as shown in Table 1. Additionally, this also decreases the solubility of Mo, Si and Nb in the austenitic matrix, allowing higher segregation of these elements and the precipitation of intermetallics (Laves phase and NbC) in the interdendritic regions during the WM solidification [14,36,37]. Additionally, analyzing Figure 2, it is not possible to distinguish clearly the HAZ at the interface between the BM and WM, as shown in Figure 2d. This indicates that the CW6MC alloy has high thermal stability and temperatures close to the melting point or long-term heat treatments are required to provoke a significant microstructural modification [12,38].
In order to observe more details of the microstructural differences between the BM and WM, EBSD analyzes at the WM/BM interface were performed and the results are shown in Figure 3. A columnar dendritic microstructure is seen at WM, which is a characteristic for this region due to the directional heat transfer during rapid solidification along the bulk direction [39,40]. Moreover, it is noted a presence of equiaxial dendritic grains on the right side of Figure 3, which is the characteristic structure of the BM, resulting from the slow solidification rates existing in the casting process [41]. In addition, the interface between these two regions (BM and WM) is characterized by a chilled region (refined equiaxial grains), as a result of the high nucleation rate that occurs in the initial stage of the WM solidification.
Figure 4 shows SEM images of the BM ((a) and (b)) and WM ((c) and (d)). In both regions, the intermetallic particles (in bright region) are observed in the austenitic matrix and some microscopic pores are also noted, which are commonly constituted when casting is provided. In addition, it can be seen that the intermetallic particle sizes and the distribution in the BM are different when compared to the WM. This is a fact that is associated with the different solidification paths experienced by each region. The BM experienced a lower cooling rate that promotes a higher enrichment of the eutectic liquid volume at the final solidification stage, resulting in the formation of coarser intermetallic particles (Figure 4). Meanwhile, the higher cooling rate at WM causes low liquid volumes to be segregated in the interdendritic regions, resulting in the formation of small intermetallic particles oriented in the direction of dendrite growth and the columnar structure, as shown in Figure 3b [15,16,41]. Table 3 shows the EDS chemical composition analysis performed on the bright intermetallic particles identified in each welding region (Figure 4). From the EDS results, it can be noted that the intermetallic particles have a characteristic core-shell structure; where the shell is enriched with Nb, Mo and Si, while the core is composed mainly of Nb. The shell intermetallics, rich in Nb, Mo and Si, are Laves phases (points 1 and 3), whereas the core particles, rich in Nb (points 2 and 4), are NbC-type carbides, as reported in the literature [9,34,42,43,44]. Additionally, in good agreement with the mentioned literature, the XRD patterns (Figure 5) of the BM and WM microstructure show the presence of NbC-type carbides and Laves phases in both regions. In addition, the presence of different degrees of textures (i.e., preferred crystalline orientation) between the BM and WM is verified. This constitutes a fact evidencing the difference in the relative intensity of different crystalline peaks for the same phase (e.g., 2θ = 75° in BM and 2θ = 91° in WM for austenite phase). The texture observed in the WM region is due to the columnar grains and the orientation of the intermetallic particles that change the reflection angle of the XRD pattern for each phase [21,31,32,33].
Figure 6 shows the elemental mapping of the intermetallics present in Figure 4b, where the core-shell structure of these particles can be clearly seen, i.e., the enrichment of Nb, Mo and Si in their shells (Laves phase), as well as the Nb enrichment their cores (NbC-type carbides). The presence of NbC-type carbides in the core of some intermetallic particles indicates that these carbides are formed initially due to the high affinity of Nb with C [45]. Then, as solidification progresses, the nucleation of the Laves phases can take place surrounding the NbC-type carbides or homogeneously from the resulting eutectic liquid [12].

3.2. Microhardness Mapping

In order to further characterize the distinct regions of the welded joint, a microhardness mapping (Figure 7) was carried out. These measurements were also intended to accurately discriminate the regions of the weldment in order to assist in the extraction of the samples that would be used in the corrosion tests in saline and acid media. Figure 7c depicts the hardness mapping. It can be seen that the BM presented a hardness of approximately 220 (±5) HV0.3, as a result of the less refined microstructure, as shown in Figure 4b. The hardness of the WM structure is approximately 245 (±5) HV0.3. In addition, associating the observations from Figure 7b with Figure 7c, it is not possible to observe any gradual variation in the hardness values between the BM and WM regions, a fact that occurs in HAZ of welded joints (of other metallic materials) [46,47,48]. As depicted in Figure 7b, this behavior is associated with the narrowness of the HAZ region (~35 µm in thickness), a fact that makes it difficult to discriminate in microhardness mapping and also does not allow the analysis of its corrosion behavior separately during corrosion tests.

3.3. Corrosion Behavior

Figure 8 shows the typical potentiodynamic polarization curves of the BM and WM regions in 0.6 M NaCl solution. It can be noted that, although the WM region has a finer microstructure (i.e., with smaller grain sizes and intermetallics) than the BM, both regions show a similar polarization behavior. Additionally, curves with relatively low passive current densities (in order of magnitude of 10−6–10−5 A/cm2) in broad potential extensions, i.e., passive range (Δpassive = Ecorr − Epit) higher than 1000 mV, are exhibited. Table 4 shows the electrochemical corrosion parameters obtained from the polarization curves, where it is observed that Ecorr, Epit and passive current density (Jpass) values are very close to those two regions. These results indicate that the microstructural changes provided by the multi-pass welding process at WM seem to have no substantial influence on the corrosion resistance of this region. This is the opposite of the expected in a situation where the average grain size of a passive material is changed, as previously reported [46,49,50,51]. Although it is known that the grain size affects the corrosion behavior, it is also recognized that the corrosion response is influenced by other microstructural features from distinctive manufacturing routes (e.g., texture, residual stresses, segregation, secondary phases, etc.) [37]. It should also be mentioned the fact that the effect of grain size on corrosion resistance only becomes increasingly evident with decreasing grain size to values lower than 1 μm (i.e., in ultrafine-grained materials) [52], which is not the case in the present work.
During the polarization measurements, some curves obtained for the WM region have displayed anomalous passive behavior. Additionally, a reproducible Epit value is attained, but lower than values observed in other measurements considering this same region (see samples WM and WM/inclusion in Figure 8 and Table 4). In order to better understand this behavior and to provide an explanation of the reported differences in the corrosion resistance of the WM samples, detailed SEM/EDS characterizations of the microstructures and surface morphologies before and after the polarization tests were carried out. As depicted in Figure 9, this in-depth analysis revealed an inclusion particle in the microstructural array of the WM sample that exhibited the anomalous passive behavior (hereinafter referred to as the WM/inclusion sample). From the EDS chemical elemental mapping, it is also evidenced that the chemistry of inclusion is complex, and their main elements are Mo, Nb, Fe, O and S, as confirmed in Figure 9. From the metallurgical point of view, it is predictable that this particle has not originated from the metallic matrix or the shielded metal core (Table 1). It seems that its origin is associated with the electrode coating and/or the slag residues formed during the welding process. It is remarked that after all cleaning procedures before and after the welding, these micrometric inclusions were not identified or detached. It should also be noted that these inclusions were non-homogeneously distributed and their presence was not frequently detected in the WM. In addition, to the best of the authors’ knowledge, the characterization of this inclusion kind in Ni welded joints has not been reported in literature yet.
Figure 10 shows the surface morphology of the different welding regions after the polarization tests. Note that, in the BM and WM (without the presence of the inclusion rich in Mo, Fe, O and S) regions, the pitting corrosion occurs majority adjacently to intermetallic particles enriched in Nb, Mo and Si, as shown in Table 5. These particles act cathodically with respect to the anodic austenitic matrix [53]. However, there is a difference in the pattern of the localized corrosion attack between these regions, i.e., in the BM region (Figure 10a,b), the pitting corrosion is deeper but less numerous than in the WM (Figure 10c,d). This is associated with the corrosion mechanism, providing a galvanic effect, which depends on the size of the intermetallic particles. Thus, the higher the size of the intermetallic particle (and its surface area), the deeper the pitting corrosion is attained. Additionally, SEM observations of the WM sample (Figure 10c,d) have not characterized any inclusion particles. This confirms the sporadic observation in this region. On the other hand, when the inclusion particles are present (i.e., in the WM/inclusion sample), the pitting mechanism of the Ni as-cast alloy is changed, and the pitting corrosion seems to be triggered through a high-rate dissolution of the inner part of the inclusion, as depicted in Figure 10e,f. Associated with this, a remarkable drop in the Epit value is prevalent, as shown in Figure 8 and Table 4.
It is well established that the pitting corrosion behavior of the passive alloys is strongly affected by the microstructural heterogeneities. In particular, non-metallic inclusions, such as oxides, sulfides and oxysulphides are commonly identified, as previously reported [7,54]. For example, the initiation sites of the pitting corrosion correlated with commercial stainless steels (in several environments) are regularly associated with the sulfide inclusions in their surfaces, as also previously reported [55,56]. According to the literature [7,54,57,58], the anodic dissolution of sulfide inclusions is easily promoted in chloride environments due to their high conductivity in comparison to the surrounding oxide film. Additionally, it was pointed out that, in addition to creating small corrosion pits, the dissolution of sulfide inclusions yields sulfur species that modify the chemistry of the local environment. This provides more aggressive environments that do not allow the passivation of the adjacent metal matrix surface. Among all the sulfide inclusions that may be present in the microstructure of steels, manganese sulfide (MnS) is undoubtedly the most harmful for pitting corrosion; however, other types of sulfides are also able to act as pitting initiation sites at high electrode potentials and/or under concentrated chloride environments [7,54,55,58]. Thus, it is quite probable that a pitting corrosion mechanism similar to that, which operates on stainless steels in chloride environments, takes place in the WM/ inclusion sample during its anodic polarization.
Typical potentiodynamic polarization curves of the BM and WM regions in 0.5 M H2SO4 solution are shown in Figure 11. Similar polarization behavior characterizing passive metallic alloys in the sulfuric acid medium [59] is demonstrated by both the BM and WM samples. Thus, when the potential is shifted in the anodic branch: (i) the samples have shown the active region, where the metallic cations dissolve directly from the matrix into the solution; (ii) then, an active–passive transition followed by a broad passive range, where the dissolution of metallic cations is hindered by the formation of a thin oxide passive film on the electrode surface; (iii) and, at high values of the electrode potential, the transpassive region, where the passive film turns out electrochemically soluble (or seemingly broken-down) and the metal dissolution rate increases substantially, and oxygen evolution reaction also takes place in parallel. The electrochemical corrosion parameters such as the Ecorr, the corrosion current density (Jcorr), the critical anodic current density required for passivation (Jcrit), the primary passivation potential (Epp) as well as the transpassive potential (Etp) are summarized in Table 6. Since the anodic branch of the curves is under passivation control, the values of Jcorr were determined by using the extrapolation of the linear portion of the cathodic branch until the Ecorr. This procedure was performed using Gamry Echem Analyst™ software. As previously observed in the polarization measurements in 0.6 M NaCl solution (Figure 8 and Table 4), when considering the 0.5 M H2SO4 solution, the values of the distinct electrochemical parameters are also close for both welding regions. However, when inclusions, rich in Mo, Fe, O and S, are present in the WM structure, this region exhibits a lower corrosion resistance. Note that, although the Ecorr value does not change significantly, both Jcorr and Jcrit values increase markedly for the WM/inclusion sample. This indicates a higher corrosion rate and a greater difficulty to the surface passivation process when compared to the other tested samples. Additionally, for the WM/inclusion sample, a passivity breakdown is observed at around 400 mVAg/AgCl. This characterizes a behavior that can be ascribed to the selective dissolution and/or anodic oxidation of inclusions enriched in Mo and S. According to the potential–pH diagrams (i.e., Pourbaix diagrams) for the Mo-S-H2O system at room temperature reported in the literature [60,61], the compound MoS2 is not thermodynamically stable at high electrode potentials in acidic solutions (pH < 1) and it dissolves forming ions in which Mo is in the +6 oxidation state. Bonde and coworkers [62] investigating the electrochemical behavior of transition metal sulfides under acidic conditions have also demonstrated that the molybdenum sulfide (MoS2) is oxidized in a 0.5 M H2SO4 solution. This considering anodic potentials above 403 mVAg/AgCl (i.e., 600 mV vs. normal hydrogen electrode-NHE).
Figure 12 shows the surface morphology after potentiodynamic polarization in 0.5 M H2SO4 solution. It can be clearly seen that, owing to the extremely oxidizing conditions to which the samples were subjected, the transpassive dissolution phenomena is prevalent. Besides, the samples are severely attacked, which in turn led to the formation of a thick and loose layer of dark corrosion products on their surfaces. The EDS analyses demonstrated in Table 7 suggest that the dark corrosion products attached to both welding regions are mainly composed of Nb and Mo oxides. Compared with the chemical composition of the CW6MC alloy (reported in Table 1), Nb and Mo contents are substantially higher, which indicates a remarkable enrichment of these elements in the corrosion products. This behavior can be ascribed to two factors: (i) the high thermodynamic stability of Nb oxides (i.e., Nb2O5) at high electrode potentials on the Pourbaix diagram and (ii) the deposition of Mo-rich corrosion products, which are insoluble under acidic conditions. These assumptions are based on observations previously reported in the literature [60,63,64,65,66]. Concerning Nb enrichment, Wang and coworkers [65] have examined the electrochemical dissolution behavior of Inconel 718 (Nb content around 5.13 wt.%) at high electrode potentials in an oxidizing medium. They have verified that an Nb-rich black corrosion product (Nb content around 19.78 wt.%) with a porous aspect was formed on the material’s surface. This was later identified through XRD as niobium carbide and niobium oxides. On the other hand, regarding the Mo enrichment, Henderson et al. [66] have recently demonstrated by atomic emission spectroelectrochemistry how the formation of Mo-rich corrosion products is governed by the pH during the transpassive dissolution of Ni-based alloys. According to thermodynamic data [60,63,64], these Mo-rich deposits would be essentially constituted by molybdic acid, MoO3.H2O, (more properly represented as H2MoO4). On the other hand, Jakupi and coworkers [67] have also reported the formation of polymeric molybdate species (i.e., [Mo7O24]6− and [Mo8O26]4−), besides MoO3, while exposing a commercial Ni–Cr–Mo alloy under specific acidic conditions.
The looseness and the porous aspect of the corrosion products stem from the fact that the Pilling–Bedworth ratio (PBR) for Nb and Mo is much greater than 1, i.e., is 2.7 for Nb and 3.4 for Mo, such that, as the formed oxides thicken under the transpassive region, they do not adhere and exhibit cracks, as observed in Figure 12a–d, resulting in a non-protective character [6]. This fact indicates that a fresh metallic matrix will always be exposed to the acidic environment, and explains the similarity observed on the transpassive region of the potentiodynamic polarization curves for the BM and WM samples (Figure 11). Additionally, it is noted that the refined microstructure of the WM sample gives rise to a more compact corrosion product when compared to that present on the BM sample. This suggests that the oxide formation mechanism is influenced by the material’s microstructure, that is, the grain size as well as the distribution of the present phases. However, further studies should be conducted to understand the individual influences of the matrix grain size and intermetallics particles (Laves phase and NbC-type carbides) on the formation mechanism of transpassive oxides in as-cast nickel alloys.

4. Conclusions

An experimental investigation concerning the corrosion behavior of CW6MC nickel cast alloy (Inconel 625) welded by SMAW was carried out and the following conclusions can be drawn:
(1) The welding parameters used to produce the multi-pass shielded metal arc welded CW6MC butt joint were effective and no macroscopic defects were observed.
(2) Since the microsegregation of alloying elements that take place during the solidification of both the BM and WM promote the formation of the Laves phase and NbC-type carbides in the examined regions. The main microstructural difference observed between these two welding regions lies in the morphology and fineness of the dendritic grains, i.e., the directional heat extraction of the multi-pass SMAW process promotes the formation of both fine columnar and dendritic grains in the WM. On the other hand, a lower cooling rate experienced in the conventional casting process of the BM provides coarser equiaxed dendritic grains. This in turn results in higher microhardness values in the WM region.
(3) The corrosion responses of the BM and WM regions are very similar in terms of the electrochemical parameters Ecorr, Jpass and Epit into the saline environment as well as Ecorr, Epp, Jcrit, Jpass and Etp into the acid sulfuric media. This means that the microstructural changes promoted by the multi-pass SWAM process have a marginal influence on the corrosion resistance of the CW6MC nickel casting alloy.
(4) Non-metallic inclusions were sporadically observed in some points of the WM region, giving rise to anomalous anodic behavior in this region in both NaCl and H2SO4 solutions examined. That is, a significant drop in both the Epit and Etp magnitudes as well as an increase in the Jpass values were recorded in the polarization curves. This means that during the multi-pass SMAW, non-metallic micrometric inclusions can be constituted to occur. These are responsible for a substantial decrease in corrosion behavior of the WM region of the welded CW6MC Ni casting sample. This indicates that this inclusion should be prevented.

Author Contributions

Conceptualization, G.d.S.V. and C.A.D.R.; methodology, G.d.S.V., R.S. and C.L.K.; software, G.d.S.V., R.S., C.L.K.; validation, G.d.S.V.; formal analysis, G.d.S.V., R.S. and C.L.K.; investigation, G.d.S.V.; resources, W.R.R.O. and C.A.D.R.; data curation, G.d.S.V. and C.A.D.R.; writing—original draft preparation, G.d.S.V., R.S. and C.L.K.; writing—review and editing, G.d.S.V., R.S., C.L.K., C.B.M.J., I.D., J.H.A., A.d.A.M.F., W.R.R.O. and C.A.D.R.; visualization, C.A.D.R.; supervision, C.A.D.R.; project administration, C.A.D.R.; funding acquisition, C.A.D.R. All authors have read and agreed to the published version of the manuscript.

Funding

This research was funded by CNPq (National Council for Scientific and Technological Development–rant no. 312614/2020-9) and FAPESP (São Paulo Research Foundation –grant no. 2020/03205-6).

Institutional Review Board Statement

Not applicable.

Informed Consent Statement

Not applicable.

Data Availability Statement

The data presented in this study are available on request from the corresponding author.

Acknowledgments

The authors gratefully acknowledge CNPq (National Council for Scientific and Technological Development–rant no. 312614/2020-9) and FAPESP (São Paulo Research Foundation –grant no. 2020/03205-6). We also acknowledge the LCE/UFSCar (Structural Characterization Laboratory at the Federal University of São Carlos) for the usage of their facilities. This study was financed in part by the Coordenação de Aperfeiçoamento de Pessoal de Nível Superior-Brasil (CAPES)-Finance Code 001.

Conflicts of Interest

The authors declare no conflict of interest.

References

  1. Donachie, M.J.; Donachie, S.J. Superalloys: A Technical Guide; ASM International: Materials Park, OH, USA, 2002; ISBN 978-1-62708-267-9. [Google Scholar]
  2. Reed, R.C. The Superalloys: Fundamentals and Applications; Cambridge University Press: Cambridge, UK, 2006; ISBN 9780511541285. [Google Scholar]
  3. DuPont, J.N.; Lippold, J.C.; Kiser, S.D. Welding Metallurgy and Weldability of Nickel-Base Alloys; John Wiley & Sons, Inc.: Hoboken, NJ, USA, 2009; ISBN 9780470500262. [Google Scholar]
  4. Alano, J.H.; Siqueira, R.L.; de Oliveira, A.D.; dos Santos Vacchi, G.; Della Rovere, C.A.; Kuri, S.E. Effect of TCP phase formation on the electrochemical corrosion behavior of the nickel-based superalloy UNS N26455. Corros. Sci. 2020, 177, 108965. [Google Scholar] [CrossRef]
  5. Henrique Alano, J. Corrosion Resistance of the UNS N26455 Superalloy in Simulated Environment Containing Chloride and CO2. Int. J. Electrochem. Sci. 2020, 15, 9707–9719. [Google Scholar] [CrossRef]
  6. International, A.S.M.; Committee, H. Corrosion: Fundamentals, Testing, and Protection. In Metals Handbook; Cramer, S.D., Covino, B.S., Eds.; ASM International: Materials Park, OH, USA, 2003; ISBN 978-1-62708-182-5. [Google Scholar]
  7. Szklarska-Smialowska, Z. Pitting and Crevice Corrosion; NACE International: Houston, TX, USA, 2005; ISBN 9781575901855. [Google Scholar]
  8. Arata, Y.; Terai, K.; Nagai, H.; Shimizu, S.; Aota, T.; Arata, Y.; Terai, K.; Nagai, H.; Shimizu, S.; Aota, T. Fundamental studies on electron beam welding of heat-resistant superalloys for nuclear plants. II Correlation between susceptibility to weld cracking and characteristics in hot ductility and Trans-Varestraint test. Trans. JWRI 1977, 6, 69–79. [Google Scholar]
  9. Cieslak, M.J. The welding and solidification metallurgy of Alloy 625. Weld. J. 1991, 70, 49–56. [Google Scholar]
  10. Alexandrov, B.T.T.; Lippold, J.C.C.; Nissley, N.E.E. Evaluation of Weld Solidification Cracking in Ni-Base Superalloys Using the Cast Pin Tear Test. In Hot Cracking Phenomena in Welds II; Springer: Berlin/Heidelberg, Germany, 2008; pp. 193–213. ISBN 9783540786276. [Google Scholar]
  11. Jeng, S.L.; Chang, Y.H. Microstructure and flow behavior of Ni-Cr-Fe welds with Nb and Mo additions. Mater. Sci. Eng. A 2013, 560, 343–350. [Google Scholar] [CrossRef]
  12. Cieslak, M.J.; Headley, T.J.; Romig, A.D.; Kollie, T.; Romig, A.D. A melting and solidification study of alloy 625. Metall. Trans. A 1988, 19, 2319–2331. [Google Scholar] [CrossRef]
  13. Zhang, X.; Li, D.Z.; Li, Y.Y.; Lu, S.P. Effect of Nb and Mo on the microstructure, mechanical properties and ductility-dip cracking of Ni-Cr-Fe weld metals. Acta Metall. Sin. Engl. Lett. 2016, 29, 928–939. [Google Scholar] [CrossRef] [Green Version]
  14. Silva, C.C.; de Miranda, H.C.; Motta, M.F.; Farias, J.P.; Afonso, C.R.M.; Ramirez, A.J. New insight on the solidification path of an alloy 625 weld overlay. J. Mater. Res. Technol. 2013, 2, 228–237. [Google Scholar] [CrossRef] [Green Version]
  15. Won Han, J. Investigation of the Weld Properties of Inconel 625 based on Nb Content. Int. J. Electrochem. Sci. 2018, 13, 2829–2841. [Google Scholar] [CrossRef]
  16. DuPont, J.N. Solidification of an alloy 625 weld overlay. Metall. Mater. Trans. A 1996, 27, 3612–3620. [Google Scholar] [CrossRef]
  17. Mortezaie, A.; Shamanian, M. An assessment of microstructure, mechanical properties and corrosion resistance of dissimilar welds between Inconel 718 and 310S austenitic stainless steel. Int. J. Press. Vessel. Pip. 2014, 116, 37–46. [Google Scholar] [CrossRef]
  18. Huang, C.A.; Wang, T.H.; Han, W.C.; Lee, C.H. A study of the galvanic corrosion behavior of Inconel 718 after electron beam welding. Mater. Chem. Phys. 2007, 104, 293–300. [Google Scholar] [CrossRef]
  19. Ogborn, J.S.; Olson, D.L.; Cieslak, M.J. Influence of solidification on the microstructural evolution of nickel base weld metal. Mater. Sci. Eng. A 1995, 203, 134–139. [Google Scholar] [CrossRef]
  20. Pang, M.; Yu, G.; Wang, H.-H.; Zheng, C.-Y. Microstructure study of laser welding cast nickel-based superalloy K418. J. Mater. Process. Technol. 2008, 207, 271–275. [Google Scholar] [CrossRef] [Green Version]
  21. Silva, C.C.; de Albuquerque, V.H.C.; Miná, E.M.; Moura, E.P.; Tavares, J.M.R.S. Mechanical Properties and Microstructural Characterization of Aged Nickel-based Alloy 625 Weld Metal. Metall. Mater. Trans. A 2018, 49, 1653–1673. [Google Scholar] [CrossRef] [Green Version]
  22. Hayes, J.R.; Gray, J.; Szmodis, A.W.; Orme, C.A. Influence of chromium and molybdenum on the corrosion of nickel based alloys. Corrosion 2005, 62, 491–500. [Google Scholar] [CrossRef]
  23. Naffakh Moosavy, H.; Aboutalebi, M.-R.; Seyedein, S.H.; Mapelli, C. Microstructural, mechanical and weldability assessments of the dissimilar welds between γ′- and γ″-strengthened nickel-base superalloys. Mater. Charact. 2013, 82, 41–49. [Google Scholar] [CrossRef]
  24. Mithilesh, P.; Varun, D.; Reddy, A.R.G.; Ramkumar, K.D.; Arivazhagan, N.; Narayanan, S. Investigations on Dissimilar Weldments of Inconel 625 and AISI 304. Procedia Eng. 2014, 75, 66–70. [Google Scholar] [CrossRef] [Green Version]
  25. Yin, Z.F.; Zhao, W.Z.; Lai, W.Y.; Zhao, X.H. Electrochemical behaviour of Ni-base alloys exposed under oil/gas field environments. Corros. Sci. 2009, 51, 1702–1706. [Google Scholar] [CrossRef]
  26. ASTM Norma A 744; ASTM A494/A494M-18a Standard Specification for Castings, Nickel and Nickel Alloy. Stand. ASTM 2018, 1–7. [CrossRef]
  27. Karlsson, L.; Bergquist, E.L.; Rigdal, S.; Thalberg, N. Evaluating hot cracking susceptibility of Ni-base SAW consumables for welding of 9% Ni steel. Hot Crack. Phenom. Welds II 2008, 329–347. [Google Scholar] [CrossRef]
  28. Yin, X.; He, G.; Meng, W.; Xu, Z.; Hu, L.; Ma, Q. Comparison Study of Low-Heat-Input Wire Arc-Fabricated Nickel-Based Alloy by Cold Metal Transfer and Plasma Arc. J. Mater. Eng. Perform. 2020, 29, 4222–4232. [Google Scholar] [CrossRef]
  29. Sivakumar, J.; Nanda Naik, K. Optimization of weldment in bead on plate welding of nickel based superalloy using Activated flux tungsten inert gas welding (A-TIG). Mater. Today Proc. 2019, 27, 2718–2723. [Google Scholar] [CrossRef]
  30. Wilson, I.L.W.; Gourle, R.G.; Walkosak, R.M.; Bruck, G.J. The Effect of Heat Input on Microstructure and Cracking in Alloy 625 Weld Overlays. In Proceedings of the Superalloys 718, 625 and Various Derivatives, Pittsburgh, PA, USA, 23–26 June 1991; Volume 1, pp. 735–747. [Google Scholar]
  31. Manikandan, S.G.K.; Sivakumar, D.; Prasad Rao, K.; Kamaraj, M. Laves phase in alloy 718 fusion zone—microscopic and calorimetric studies. Mater. Charact. 2015, 100, 192–206. [Google Scholar] [CrossRef]
  32. Ravi, G.; Murugan, N.; Arulmani, R.; Ravi, G.; Murugan, N. Microstructure and mechanical properties of Inconel-625 slab component fabricated by wire arc additive manufacturing. Mater. Sci. Technol. 2020, 36, 1785–1795. [Google Scholar] [CrossRef]
  33. Chang, K.-M.; Lai, H.-J.; Hwang, J.-Y. Existence of Laves Phase in Nb-Hardened Superalloys. In Proceedings of the Superalloys 718, 625, 706 and Various Derivatives, Pittsburgh, PA, USA, 26–29 June 1994; pp. 683–694. [Google Scholar]
  34. Garcia, R.P.; Luz, T.; Canobre, S.C.; Costa, H.L. Corrosion resistance of plasma transferred arc (PTA) Inconel 625 deposits. Surf. Topogr. Metrol. Prop. 2021, 9, 25008. [Google Scholar] [CrossRef]
  35. Man, H.C.; Gabe, D.R. The determination of pitting potentials. Corros. Sci. 1981, 21, 323–326. [Google Scholar] [CrossRef]
  36. DuPont, J.N.; Notis, M.R.; Marder, A.R.; Robino, C.V.; Michael, J.R. Solidification of Nb-bearing superalloys: Part I. Reaction sequences. Metall. Mater. Trans. A 1998, 29, 2785–2796. [Google Scholar] [CrossRef]
  37. Banovic, S.W.; Dupont, J.N.; Marder, A.R. Dilution and microsegregation in dissimilar metal welds between super austenitic stainless steel and nickel base alloys. Sci. Technol. Weld. Join. 2002, 7, 374–383. [Google Scholar] [CrossRef]
  38. Tawancy, H.M. Thermal stability of an Ni-Cr-Mo-Nb alloy. Mater. Charact. 1992, 28, 221–240. [Google Scholar] [CrossRef]
  39. Petrzak, P.; Kowalski, K.; Blicharski, M. Analysis of Phase Transformations in Inconel 625 Alloy during Annealing. Acta Phys. Pol. A 2016, 130, 1041–1044. [Google Scholar] [CrossRef]
  40. Li, C.; White, R.; Fang, X.Y.; Weaver, M.; Guo, Y.B. Microstructure evolution characteristics of Inconel 625 alloy from selective laser melting to heat treatment. Mater. Sci. Eng. A 2017, 705, 20–31. [Google Scholar] [CrossRef]
  41. Wang, W.; Lee, P.D.; McLean, M. A model of solidification microstructures in nickel-based superalloys: Predicting primary dendrite spacing selection. Acta Mater. 2003, 51, 2971–2987. [Google Scholar] [CrossRef]
  42. Floreen, S.; Fuchs, G.E.; Yang, W.J. The Metallurgy of Alloy 625. In Proceedings of the Superalloys 718, 625, 706 and Various Derivatives, Pittsburgh, PA, USA, 26–29 June 1994; pp. 13–37. [Google Scholar]
  43. Alvarães, C.P.; Madalena, F.C.A.; De Souza, L.F.G.; Jorge, J.C.F.; Araújo, L.S.; Mendes, M.C. Performance of the INCONEL 625 alloy weld overlay obtained by FCAW process. Rev. Mater. 2019, 24. [Google Scholar] [CrossRef] [Green Version]
  44. Cieslak, M.J.; Knorovsky, G.A.; Headley, T.J.; Romig, A.D., Jr. The Solidification Metallurgy of Alloy 718 and Other Nb-Containing Superalloys. In Proceedings of the Superalloys 718 Metallurgy and Applications, Pittsburgh, PA, USA, 12–14 June 1989; pp. 59–68. [Google Scholar]
  45. Smith, G.D.; Patel, S.J. The Role of Niobium in Wrought Precipitation-Hardened Nickel-Base Alloys. In Proceedings of the Superalloys 718, 625, 706 and Various Derivatives, Pittsburgh, PA, USA, 2–5 August 2005; pp. 135–154. [Google Scholar]
  46. Vacchi, G.S.; Plaine, A.H.; Silva, R.; Sordi, V.L.; Suhuddin, U.F.H.; Alcântara, N.G.; Kuri, S.E.; Rovere, C.A.D. Effect of friction spot welding (FSpW) on the surface corrosion behavior of overlapping AA6181-T4/Ti-6Al-4V joints. Mater. Des. 2017, 131, 127–134. [Google Scholar] [CrossRef]
  47. Della Rovere, C.A.; Ribeiro, C.R.; Silva, R.; Baroni, L.F.S.; Alcântara, N.G.; Kuri, S.E. Microstructural and mechanical characterization of radial friction welded supermartensitic stainless steel joints. Mater. Sci. Eng. A 2013, 586, 86–92. [Google Scholar] [CrossRef]
  48. Sharma, S.K.; Maheshwari, S. A review on welding of high strength oil and gas pipeline steels. J. Nat. Gas Sci. Eng. 2017, 38, 203–217. [Google Scholar] [CrossRef]
  49. Ralston, K.D.; Birbilis, N. Effect of grain size on corrosion: A review. Corrosion 2010, 66, 075005–075005-13. [Google Scholar] [CrossRef]
  50. Prasad Rao, K.; Janaki Ram, G.D.; Stucker, B.E. Effect of friction stir processing on corrosion resistance of aluminum–copper alloy gas tungsten arc welds. Mater. Des. 2010, 31, 1576–1580. [Google Scholar] [CrossRef]
  51. Liu, Q.; Ma, Q.; Chen, G.; Cao, X.; Zhang, S.; Pan, J.; Zhang, G.; Shi, Q. Enhanced corrosion resistance of AZ91 magnesium alloy through refinement and homogenization of surface microstructure by friction stir processing. Corros. Sci. 2018, 138, 284–296. [Google Scholar] [CrossRef]
  52. Miyamoto, H. Corrosion of ultrafine grained materials by severe plastic deformation, an overview. Mater. Trans. 2016, 57, 559–572. [Google Scholar] [CrossRef] [Green Version]
  53. Guo, L. Effect of Heat Treatment Temperatures on Microstructure and Corrosion Properties of Inconel 625 Weld Overlay Deposited by PTIG. Int. J. Electrochem. Sci. 2016, 11, 5507–5519. [Google Scholar] [CrossRef]
  54. Sedriks, A.J. Corrosion of Stainless Steels, 2nd ed.; Wiley: New York, NY, USA, 1996; ISBN 978-0-471-00792-0. [Google Scholar]
  55. Eklund, G.S. Initiation of Pitting at Sulfide Inclusions in Stainless Steel. J. Electrochem. Soc. 1974, 121, 467. [Google Scholar] [CrossRef]
  56. Wranglen, G. Pitting and sulphide inclusions in steel. Corros. Sci. 1974, 14, 331–349. [Google Scholar] [CrossRef]
  57. Ryan, M.P.; Williams, D.E.; Chater, R.J.; Hutton, B.M.; McPhail, D.S. Why stainless steel corrodes. Nature 2002, 415, 770–774. [Google Scholar] [CrossRef]
  58. Virtanen, S.; Schmuki, P.; Frankel, G.S. Critical Factors in Localized Corrosion IV; The Electrochemical Society: Pennington, NJ, USA, 2003. [Google Scholar]
  59. Richardson, J.A. Corrosion in sulfuric acid. In Shreir’s Corrosion; Cottis, B., Graham, M., Lindsay, R., Lyon, S., Richardson, T., Scantlebury, D., Stott, H., Eds.; Elsevier: Oxford, UK, 2010; pp. 1226–1249. ISBN 9780444527875. [Google Scholar]
  60. Lyon, S.B. Corrosion of Molybdenum and its Alloys. In Shreir’s Corrosion; Cottis, B., Graham, M., Lindsay, R., Lyon, S., Richardson, T., Scantlebury, D., Stott, H., Eds.; Elsevier: Oxford, UK, 2010; pp. 2157–2167. ISBN 978-0-444-52787-5. [Google Scholar]
  61. Aracena, A.; Azocar, A.; Ibáñez, J.P.; Jerez, O. Mechanism and leaching kinetics of molybdenite concentrate in a hydrogen peroxide-acid system. Physicochem. Probl. Miner. Process. 2019, 55, 140–152. [Google Scholar] [CrossRef]
  62. Bonde, J.; Moses, P.G.; Jaramillo, T.F.; Nørskov, J.K.; Chorkendorff, I. Hydrogen evolution on nano-particulate transition metal sulfides. Faraday Discuss. 2009, 140, 219–231. [Google Scholar] [CrossRef]
  63. Pourbaix, M. Atlas of Electrochemical Equilibria in Aqueous Solutions; National Association of Corrosion Engineers: Houston, TX, USA, 1974; ISBN 9780915567980. [Google Scholar]
  64. Saji, V.S.; Lee, C. Molybdenum, Molybdenum Oxides, and their Electrochemistry. ChemSusChem 2012, 5, 1146–1161. [Google Scholar] [CrossRef]
  65. Wang, D.; Zhu, Z.; Wang, N.; Zhu, D.; Wang, H. Investigation of the electrochemical dissolution behavior of Inconel 718 and 304 stainless steel at low current density in NaNO3 solution. Electrochim. Acta 2015, 156, 301–307. [Google Scholar] [CrossRef]
  66. Henderson, J.D.; Li, X.; Shoesmith, D.W.; Noël, J.J.; Ogle, K. Molybdenum surface enrichment and release during transpassive dissolution of Ni-based alloys. Corros. Sci. 2019, 147, 32–40. [Google Scholar] [CrossRef]
  67. Jakupi, P.; Wang, F.; Noël, J.J.; Shoesmith, D.W. Corrosion product analysis on crevice corroded Alloy-22 specimens. Corros. Sci. 2011, 53, 1670–1679. [Google Scholar] [CrossRef]
Figure 1. Schematic representation evidencing the double V groove geometry, dimensions and the number of passes of the multi-pass shielded metal arc welded CW6MC joint.
Metals 11 01286 g001
Figure 2. Macrograph of the cross-section of the multi-pass shielded metal arc welded CW6MC butt joint (a), BM (b), WM (c) and the interface BM/WM microstructure (d).
Metals 11 01286 g002
Figure 3. EBSD images mapping of the interface between WM and BM regions. Each square in the red matrix in (a) corresponds to each EBSD image in (b). The EBSD scale is the same for all EBSD images.
Metals 11 01286 g003
Figure 4. SEM micrographs of distinct welding regions of the multi-pass shielded metal arc welded CW6MC butt joint: BM (a,b); WM (c,d).
Metals 11 01286 g004
Figure 5. XRD patterns of distinct welding regions of the multi-pass shielded metal arc welded CW6MC butt joint: BM (a) and WM (b).
Metals 11 01286 g005
Figure 6. EDS chemical distribution mapping of Mo, Nb, Si, Ni, Cr and Fe elements in intermetallic particles present in Figure 4b.
Metals 11 01286 g006
Figure 7. Microhardness mapping region (a), the SEM image of the interface BM/WM (b) and the microhardness mapping results (c).
Metals 11 01286 g007
Figure 8. Potentiodynamic polarization curves obtained in 0.6 M NaCl solution for the distinct regions of the multi-pass shielded metal arc welded CW6MC butt joint.
Metals 11 01286 g008
Figure 9. SEM micrograph and EDS chemical distribution mapping of Mo, S, Nb, Si, Ni, Cr and Fe elements for the inclusion particle located at WM region.
Metals 11 01286 g009
Figure 10. Pitting corrosion morphologies of the BM (a,b), WM (c,d) and WM/Inclusion (e,f) samples after potentiodynamic polarization in 0.6 M NaCl solution.
Metals 11 01286 g010
Figure 11. Polarization potentiodynamic curves obtained in 0.5 M H2SO4 solution for the distinct regions of the multi-pass shielded metal arc welded CW6MC butt joint.
Metals 11 01286 g011
Figure 12. SEM images of the surface morphologies after potentiodynamic polarization in 0.5 M H2SO4 solution for the BM and WM samples. Signal of secondary electrons–SE (a,b) and backscatter electrons–BSE (c,d), respectively.
Metals 11 01286 g012
Table 1. Chemical composition of the base metal and filler metal.
MaterialElement (wt.%)
NbMoCrFeNiSiCMn
CW6MC3.978.3521.123.4661.700.690.0540.70
ERNiCrMo-33.908.7022.214.9059.460.490.0580.22
Table 2. Shielded Arc Welding parameters.
Welding ParametersMagnitude
Welding typeSMAW (CC+)
Filler wireERNiCrMo-3
Peak current (A)92–135
Voltage (V)21–26
Filler wire dia. (mm)3.25
Welding speed (mm/min)200
Heat input a (KJ/mm)0.87
a Heat input was calculated considering an efficiency of 65%.
Table 3. EDS chemical composition analyses of the regions highlighted in Figure 4.
Weldment RegionPointComposition (wt.%)
NbMoCrFeNiSi
BM130.722.411.00.831.53.60
BM294.22.80.90.11.90.1
WM319.620.815.92.238.72.8
WM493.22.70.90.13.00.1
Table 4. Electrochemical corrosion parameters obtained from potentiodynamic polarization curves in a stagnant and naturally aerated 0.6M NaCl solution at environmental temperature.
Weldment RegionEcorr (mVAg/AgCl)Epit (mVAg/AgCl)Jpass (μA/cm2) aJpass (μA/cm2) b
BM−301 ± 18864 ± 717 ± 322 ± 3
WM−277 ± 23865 ± 513 ± 223 ± 4
WM/Inclusion−273 ± 25475 ± 4019 ± 8304 ± 127
Passive current density value taken at +300 mVAg/AgCl (a) and +600 mVAg/AgCl (b).
Table 5. EDS chemical composition analyses of the regions highlighted in Figure 10.
Weldment RegionPointComposition (wt.%)
NbMoCrFeNiSi
BM126.222.811.21.434.44.0
WM218.424.014.72.437.43.0
WM/Inclusion34.642.813.92.934.61.2
Table 6. Electrochemical corrosion parameters obtained from potentiodynamic polarization curves in a stagnant and naturally aerated 0.5 M H2SO4 solution at environmental temperature.
Weldment RegionEcorr (mVAg/AgCl)Jcorr (μA/cm2)Epp (mVAg/AgCl)Jcrit (μA/cm2)Jpass (μA/cm2) aEtp
(mVAg/AgCl)
c|
(mV/decade)
Corrosion Rate (mpy) b
BM−186 ± 89 ± 3−145 ± 1012 ± 432 ± 41035 ± 1645 ± 24 ± 1
WM−178 ± 511 ± 2−123 ± 1113 ± 236 ± 41041 ± 1452 ± 25 ± 1
WM/inclusion−192 ± 1636 ± 5−112 ± 1120 ± 6-427 ± 8460 ± 615 ± 2
Passive current density value taken at +600 mVAg/AgCl (a); estimated value considering Equiv. wt. = 29.35 and ρ = 8.9 g/cm3 (b).
Table 7. EDS chemical composition analyses of the corrosion product layers attached to the surface of each weld region after potentiodynamic polarization in 0.5 M H2SO4 solution.
Weldment RegionPointComposition (wt.%)
NbMoCrFeNiSiSO
BM125.030.310.21.55.81.10.425.8
WM223.429.39.792.28.80.60.825.2
Publisher’s Note: MDPI stays neutral with regard to jurisdictional claims in published maps and institutional affiliations.

