Article

Towards Greener Industry: Modelling of Slag Heat Recovery

1
Primary and Secondary Steelmaking Group, Process Metallurgy Department, Swerim AB, SE-974 37 Luleå, Sweden
2
Division of Applied Process Metallurgy, Department of Material Science and Engineering, KTH Royal Institute of Technology, SE-100 44 Stockholm, Sweden
3
SFTec Oy, FI-90570 Oulu, Finland
*
Authors to whom correspondence should be addressed.
Metals 2021, 11(7), 1144; https://doi.org/10.3390/met11071144
Submission received: 22 June 2021 / Revised: 15 July 2021 / Accepted: 16 July 2021 / Published: 20 July 2021

Abstract

:
The steel industry, in accordance with the momentum of greener industry, has welcomed the changes and is actively pursuing that objective. One such activity is the commitment to energy recovery from by-products such as slag since the average energy content of ferrous slags is around 1 to 2 GJ/tslag. The recovered energy could, then, be used in heating or drying process among others. The RecHeat was designed and modelled iteratively to achieve an optimised heat recovery apparatus. The model shows that the temperature of different sections of the heat exchanger part varies from 170 to 380 °C after slag pouring while the average air temperature at the entrance of the heat exchanger is less than 150 °C. Furthermore, the temperature of the fluid medium changes from 125–140 °C to 260–340 °C from one end of the heat exchanger part to the other at the end of the simulation. The outlet temperature at the end of the simulation is calculated to be around 340 °C, which shows an increase by at least 200 °C in the temperature of the air entering the apparatus.

1. Introduction

Production of iron and steel is a CO2- and energy-intensive activity. The global steel industry is responsible for one-quarter of industrial CO2 emissions and 7 to 9% (2020) of global anthropogenic CO2 emissions. Furthermore, during 2019, 22% of globally used industrial energy was used in steel production. Typically, the cost of energy is around 10–20% of the total production costs of steel [1,2,3,4].
Improved energy efficiency is one of the approaches of greener steel production. This is generally seen as one of the major short-term methods of CO2 emission reduction in the steel industry.
To be able to meet the Sustainable Development Scenario (SDS) set for the industry sector, the energy intensity of crude steel production needs to achieve a 1.2% annual reduction between 2018 and 2030 [5]. Energy or heat recovery, as one of the main fields of a four-stage efficiency methodology of the Step-up program launched by the World Steel association [3], shows the importance of this process.

1.1. Slag Heat Recovery

Energy recovery from hot liquid slag is one of the underused candidates for increasing energy efficiency in steel production. In 2018, around 330 to 375 million tons of blast furnace slag (BFS) and around 250 million tons of steelworks slags (65% basic oxygen furnace (BOF) and ladle furnace (LF) slag, and 35% electric arc furnace (EAF) slag) were produced. It is expected that global steel consumption will increase, meaning that slag volumes will increase in the future [6].
In iron and steel production, slags are the main by-product in terms of mass (90%). These molten slags carry a great amount of unused waste heat and are considered to be value-added products with extra energy output, which raises environmental concerns while offering cost-saving opportunities for industrial applications [2].
Molten slag forms at 1300–1700 °C, and when discharged, a great deal of high-grade heat is carried with it. In the steel industry, slag accounts for 10% of waste energy and 35% of high-temperature waste heat [2]. Therefore, technology development is vital to the recovery of this high-temperature waste heat, which immediately leads to energy savings and emission reduction in the iron and steel industry.
Generally, the current heat recovery technologies can be classified into physical and chemical methods. Lots of research efforts have been directed towards physical methods, like mechanical crushing, air blast and centrifugal granulation process [7,8]. Of the chemical methods, the CH4 reforming reaction and the coal gasification processes have been widely investigated [3]. For blast furnace (BF) slag, the two European pilot plants with recovery of heat during granulation are the most promising developed technologies [9].
Typically, the energy content of ferrous slags is around 1 to 2 GJ/tslag at the tapping temperature, and part of this is lost due to discharge of the hot slag. The discharged slag is processed either by granulating it directly from the process (typical method for BFS) or tapped to a slag pot and transported to slag handling area. The transported slag, then, is poured on the slag dump area. It is important to emphasise that currently, the energy of the dumped slag is mainly wasted as the slags are cooled down by the atmosphere or by means of water-cooling with no heat recovery.
Over the decades, different types of methods have been developed to recover this unused energy/heat. The heat recovery methods can be divided into two groups, direct contact with slag or indirect contact through air, mist/vapor, or water. Despite the several different types of approaches, there are no widely commercialised use of heat recovery processes available. Wang et al. published an extensive review of the research technologies, indicating that all of them are in the demonstration or experimental phase [2]. The majority of the physical methods concentrate on the development of BFS heat recovery. Less attention has been paid to the development of heat recovery from steelmaking slags; electric arc furnace (EAF), basic oxygen furnace (BOF) and ladle furnace (LF) slag.

1.2. RecHeat Techonology

The RecHeat (Recovery of Heat from molten slag) technology innovation is based on the idea of an “as simple as possible to use”, heat exchanger type of technology for molten slag heat recovery. Therefore, the apparatus is constructed of simple metal sheets to enhance the energy exchange through a semi-direct contact of slag with the heat exchange structure surface. Moreover, such a construction benefits from a not-so-expensive recyclable material and localised rebuilding-patching in the case of minor damage. Furthermore, safety, simplicity and practical reason led to the use of air as an energy-transport medium instead of water, even though water has better thermal properties.
In practice, the slag from the steel plant will be carried to the RecHeat using a slag truck. The slag truck, then, tilts the slag pot over the designated area of the RecHeat. As can be imagined, the slag might not be distributed uniformly over the thin steel plate. In such a case, a metallic arm will be used to spread the slag as uniformly as possible so that there will not be any uncovered area. With this arrangement, the slag starts to radiate its energy to the surroundings, where the air will be sucked in into the apparatus through two separate entrances. Of course, since the system should be in an open environment due to security risks and for practical purposes (slag truck accessibility) part of this energy will be lost.
The heated air can, then, be used for drying purposes. This could be a significant gain considering the energy for drying medium covers 50–70% of the operational costs of drying process. Therefore, it can be said that utilization of slag heats is a cost-efficient source of heat for drying. At the same time, coupling of a drying station to the RecHeat draws a path of direct utilization of the recovered heat.

2. Geometry, Modelling and Model Setup
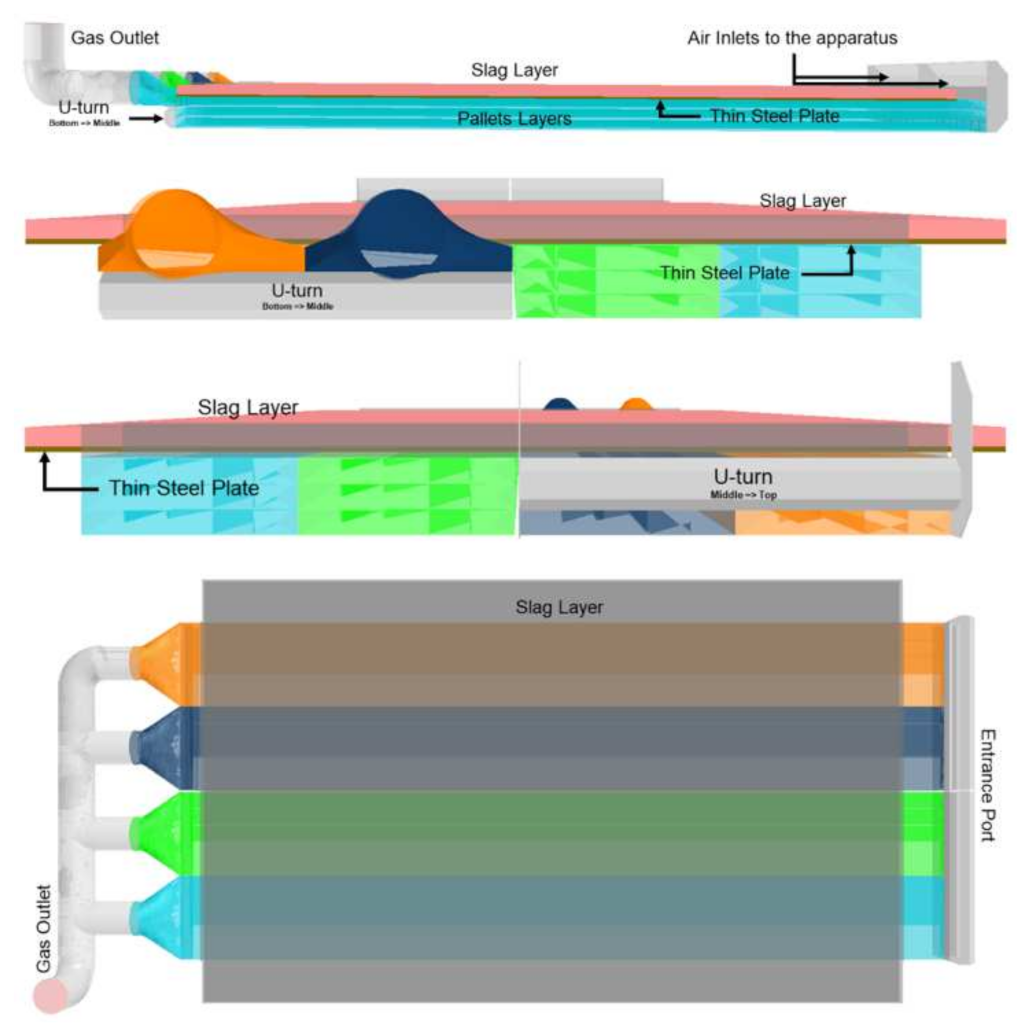
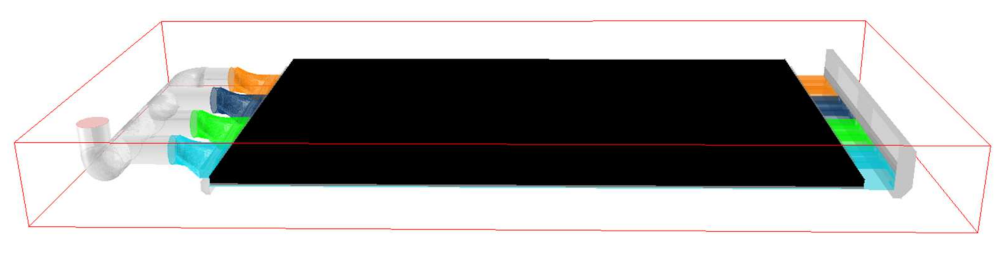
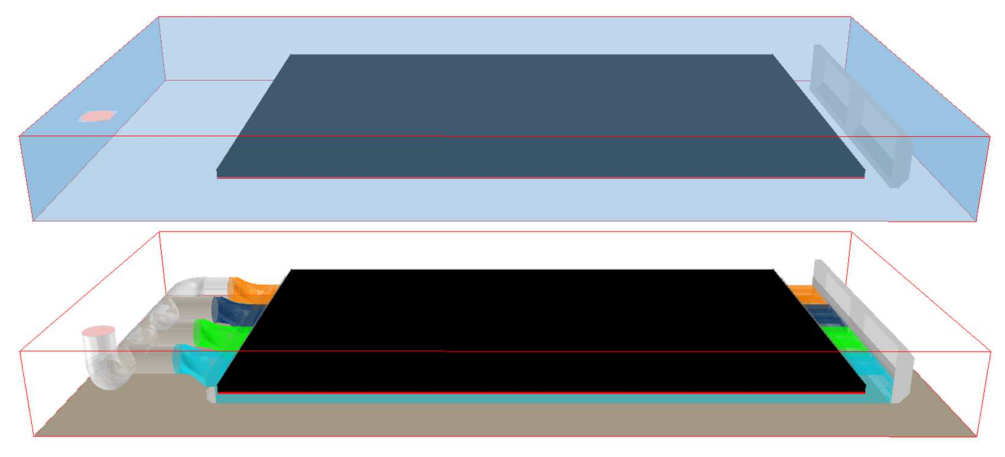
It might not be far from the truth to say that one of the most popular approaches in transferring heat from one medium to another is to use a heat exchanger. This method has proven itself reliable and practical in many industrial and domestic sectors. In addition, with the increasing notion of green industry, recovering heat energy of by-products, e.g., slag in the steel-making process, has become an objective of many industries. Therefore, as mentioned, RecHeat was designed with the notion that it should be usable with minimum effort while recovering tangible energy from the slag.
The objective of the current study, then, is to design an optimum apparatus based on the heat exchanger concept that can retrieve the energy of the slag using air as the medium for the purpose of drying, as mentioned previously. Therefore, the focus of the modelling activity has been to predict the system efficiency by means of computational fluid dynamic (CFD). This approach has the advantage of reducing the cost of construction and the risk involved with multiple design tests. Such a system can be easily modelled using Navier-Stokes and energy equations without any further modification by means of commercial CFD codes. A description of the equations is given below.

2.1. Geometry

Figure 1 shows the overall setup of the RecHeat in practice. As can be seen, the RecHeat is formed of a heat exchanger part which is then connected to a collector. The heat exchanger part is formed of three layers which are stacked on top of each other; each layer consists of four metallic pallets with five channels each. Moreover, as can be seen in the figure, the outlet of the heat exchanger is at the end of the collecting pipe (in the left-bottom corner of the figure) while the air is sucked in through the open ports at the other end (the right side of the figure).
As mentioned, the heat exchanger section is formed of three stacked layers where the air must travel through the layers (from one side to the other and back) to reach the collecting sections. By looking at the side and the back views, it can be seen that the air enters the heat exchanger section of the apparatus though the bottom channels. Then, the medium will travel towards the other end and with a U-turn, it enters the middle layer. This is visualised in the front-view of the apparatus. Of course, the same happens at the end of the middle layer, where the medium makes a U-turn, entering the top layer (back-view). At the end of the top layer, the air exits the heat exchanger and will be collected and mixed in the piping section.
Moreover, a thin steel plate is placed over the heat exchanger section. This is to prevent the direct contact of the slag with the apparatus which can cause damages to the construction. Of course, the apparatus is also protected by sand on its side to make a pool-shaped area where the liquid slag should be poured in. Then, the liquid slag is transported by the slag truck and poured over, into the designated area. Of course, in real practice, if the slag does not uniformly spread over the surface, it is possible, to a certain degree, to spread it using a mechanical arm.
With such a setup, the structure of the apparatus heats up, extracting energy from the slag on top while the entering air to the system warms up at the two bottom layers until reaching the top layer.

2.2. Modelling Approach

Of course, the next logical question will be “what model setup will, most realistically, represent the current arrangement”. To answer this question, one should consider that the apparatus is designed to suck in the air from the surrounding. This medium, in turn, should be affected by the radiative and convective heat due to slag cooling process. Therefore, it is safe to say that the temperature of the air entering the system could naturally differ as the cooling of the slag progresses. Therefore, it can be seen that the generic Navier-Stokes and energy equations could describe the system. These equations are given below.
. U = 0
ρ D U D t = p + . τ + ρ g
ρ c p T t + ρ c p U . T = . k T
In the above, D D t represents the material derivative, U is the velocity,   ρ is the density, p is the pressure, τ is the viscous stress tensor, g is the gravitational acceleration, c p is the specific heat capacity, k is the thermal conductivity and T denotes the temperature. The thermal properties of the slag were reported by Gonzalez-Fernandez et al. [10].
To be able to more realistically set up the model, commercial CFD PHOENICS (v. 2019, Concentration, Heat and Momentum Limited (CHAM), London, UK), which uses the cut-cell method, proved to be a suitable choice. In this application, the numerical domain always consists of a box shown with red lines in Figure 2. In this model setup, the outer faces of the red box are treated as pressure boundary with temperature fixed at the ambient temperature (surrounding environment), while the bottom face of the exterior is treated as a wall mimicking the ground. Hence, the cooling behaviour of the slag and the transient nature of the air entering the RecHeat could be modelled more realistically.

2.3. Initial and Boundary Conditions

The initial values and boundary conditions for the model can be summarised in Table 1 as follow:
The side and top faces of the domain (light blue faces of the outer box in Figure 3) are assumed to be pressure boundary faces where the pressure and temperature are equal to the ambient pressure and temperature. It should be noted that since the modelling was to be followed up by a pilot trial, the ambient temperature was set to 20 °C. This is in consideration of the location of the test site and planned season of the trial. However, the pilot trial was delayed due to the pandemic that engulfed all nations, and by the time of the test, the ambient temperature had dropped to a lower magnitude. The bottom face (brown face in Figure 3), then, was treated as an adiabatic wall.
Furthermore, the air flow rate was set to 2.5 kg/s, which is equivalent to the expected flow rate that the fan could operate (red circle in Figure 3) and the slag temperature was taken as the average temperature of the slag reaching the testing site. The thickness of the slag was also calculated with respect to the slag pot volume and a spreading area equal to 10 cm. Of course, it should be pointed out that the slag did not spread uniformly over the top surface during the pilot test, but in the model setup, the slag layer was set at a uniform thickness-temperature.

3. Results

The modelling of the RecHeat can be divided into two distinct parts: the structure heating and heat exchanging stages.

3.1. The Structure Heating Stage

In a real process, it can be expected that the apparatus temperature is at equilibrium with the surrounding environment, i.e., ambient temperature. Therefore, the objective of the first stage of the process is to increase the temperature of the structure to the maximum possible magnitude. By pouring the slag over the structure, the body of the apparatus absorbs the energy of the slag through conduction. Simultaneously, the radiative energy of the slag instantaneously heats up the surrounding air.
Figure 4 shows the average temperature of the sucked-in air into the structure during the structure heating stage. It can be visibly seen that the slag radiation energy disperses into the surroundings where the temperature of air is above 250 °C.
Then, the sucked-in heated air begins to exchange its energy with the body of the structure as it flows through the apparatus, since the temperature of the structure is lower than the entering medium. Hence, it can be said that the convection and radiation have a simultaneous effect during the structure heating stage.
Table 2 shows the magnitude of the temperature of each pallet in three layers of the heat exchanger at two instances, the initial stage and the end of the steady state. As expected, the top layer of the heat exchanger registers the greatest temperature magnitude.
Moreover, it can be seen that the middle and bottom layers register greater temperature magnitude than the ambient, while the middle-layer pallets are at least 2 °C colder than the one in the bottom layer. This behaviour then reverses, and the temperature of the middle layer is more than 80 degrees warmer than the bottom.
To determine the end of the first stage, the change in the magnitude of the temperature of each pallet was monitored. When this variation flatlined near zero, it was concluded that the system was at the end of the structure heating stage. Therefore, the second stage, and heat exchange should be initiated. It should be pointed out that this does not mean the structure heating stage has come to an end; it merely suggests that such a stage is in its converged state.

3.2. The Heat Exchange Stage

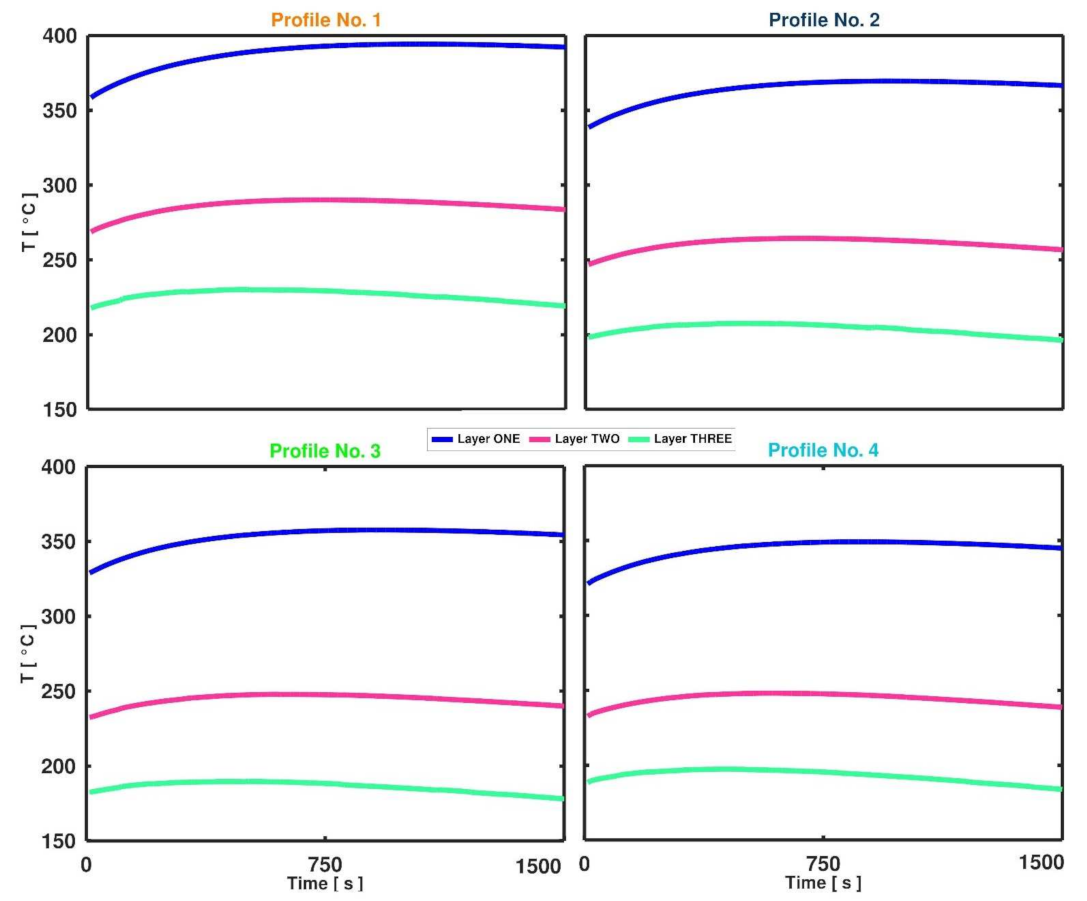
3.2.1. Pallet Temperature Profiles

Figure 5 shows the evolution of temperature of each layer for the given stacks, where the colour of the title corresponds to the colour presented in Figure 1. As mentioned, layers are indexed from top to bottom; hence, layer one in each stack registers the greatest temperature magnitude, while layer three (at the bottom) is significantly colder.
The figure suggests that all the layers of the stack number one (opposite to the outlet) have larger magnitude of the temperature compared to their counterparts in the other three. For stacks number three and four, even though the top pallets have large difference in the magnitude of the temperature, the middle and bottom layers seem to be rather the same.
Moreover, the figure shows that the magnitude of the temperature still increases at the beginning of the heat exchanger stage, but it changes before the midpoint. It can be seen that this change in the slope of the curves appears sooner for the layers in the bottom and the middle in comparison to the top.

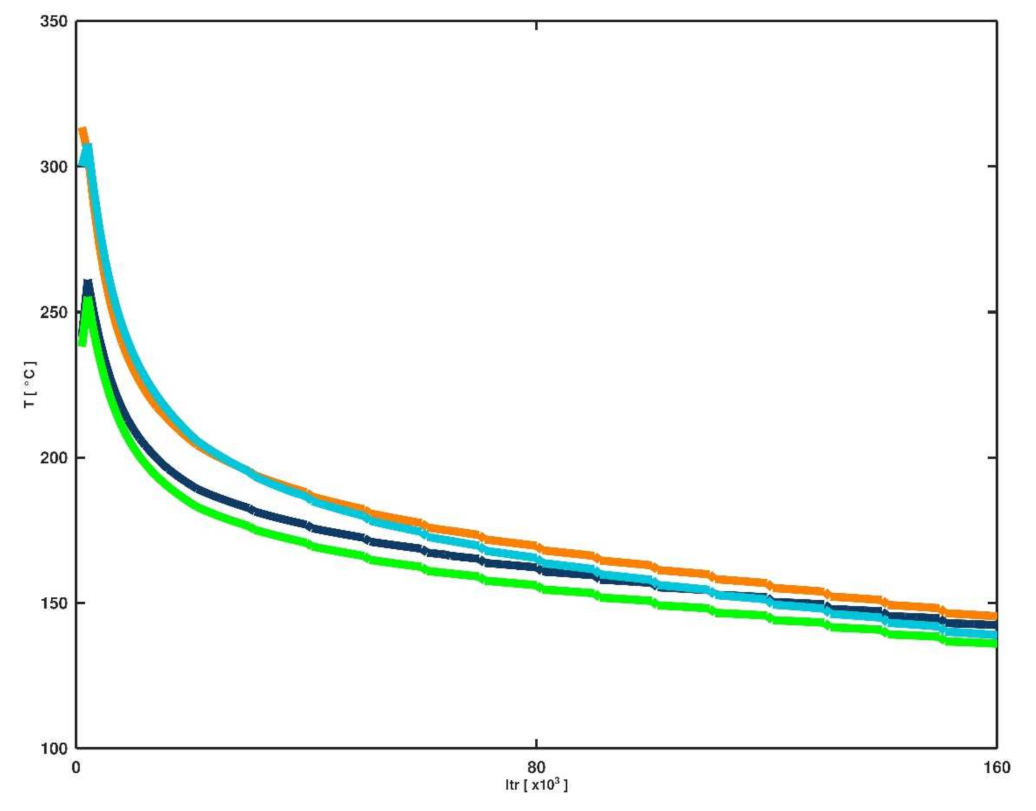
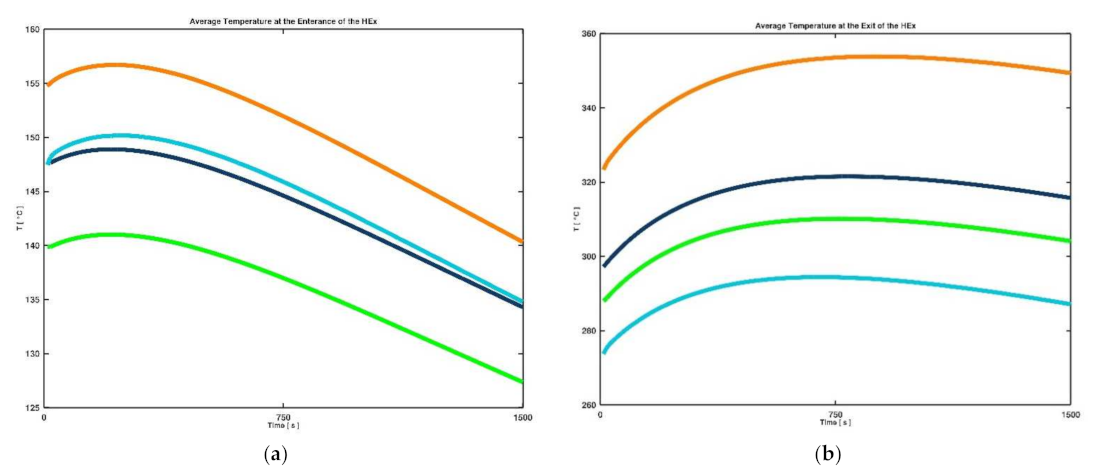
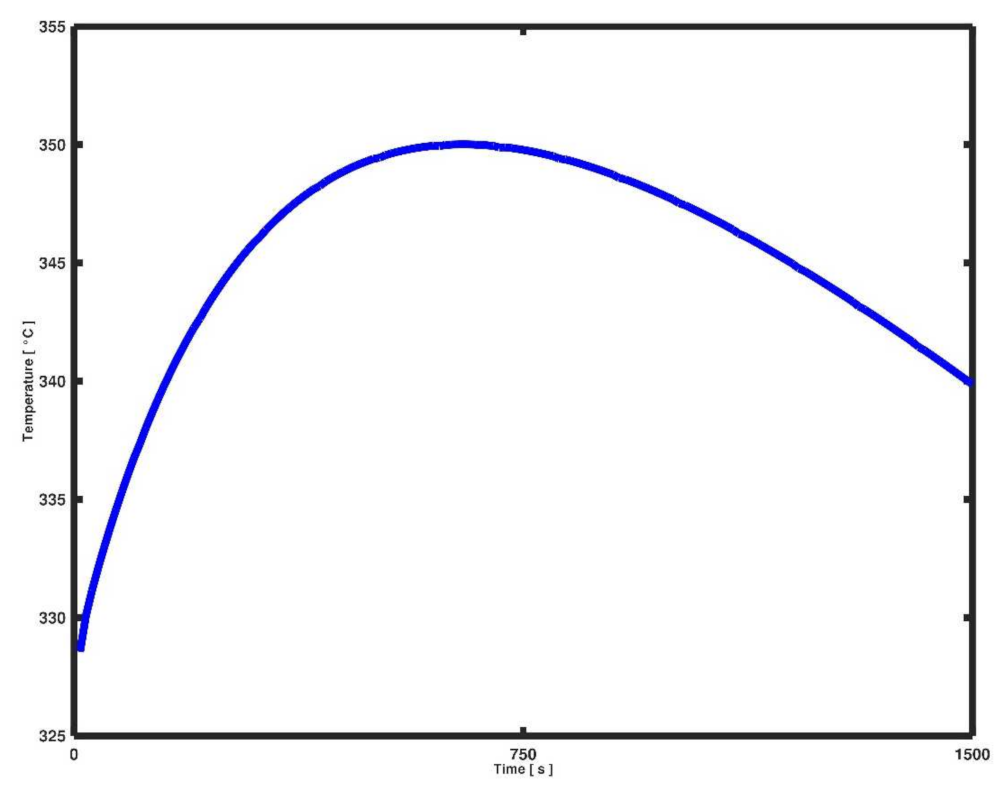
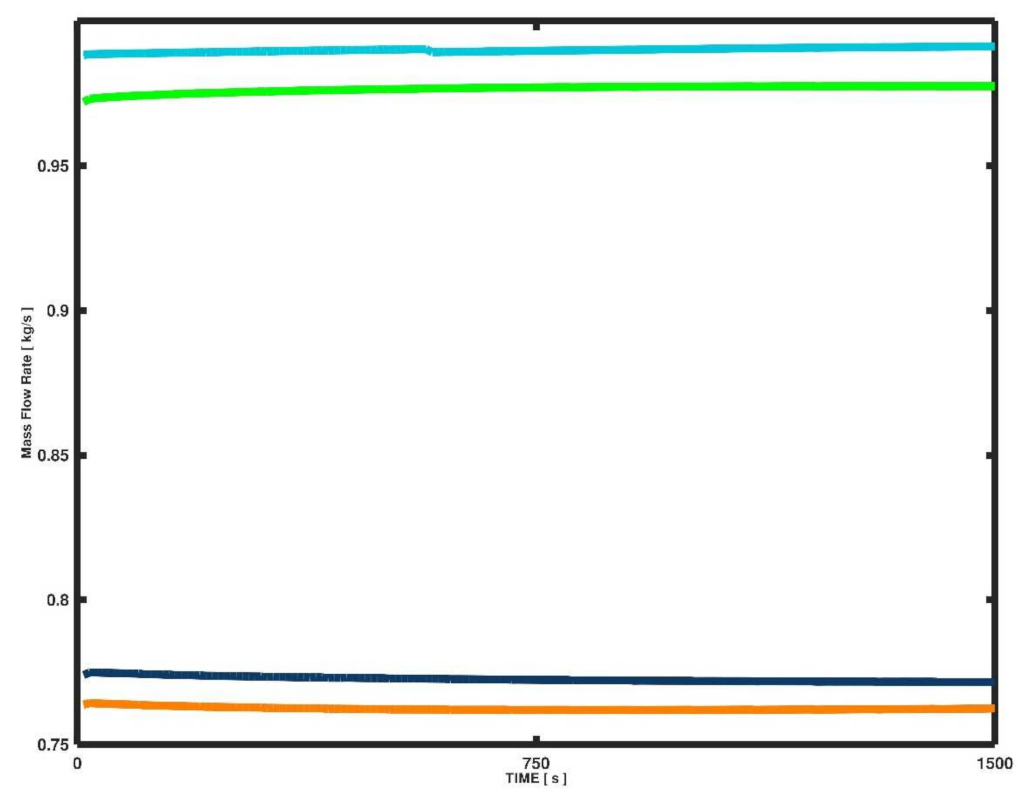
3.2.2. Air Flow Temperature Profile

Figure 6 shows the average temperature of the air at the entrance and the exit of the heat exchanger (HEx) section of the apparatus. As can be seen, the temperature of the air entering the heat exchanger still increasing in the magnitude. This corresponds to the energy pick-up from the slag radiation to the environment which continues at the beginning of the transient simulation. However, this behaviour starts to change, and the magnitude of the temperature of the air entering the heat exchanger starts to drop rapidly.
On the other hand, at the exit ports of the heat exchanger, the magnitude of the temperature increases further nearly till the middle of the simulation. In the case of stack number one (orange pallets) this increase even continues further.
Moreover, Figure 5 shows that even though the temperature of the air entering pallet number 4 is slightly higher than pallet number 2, the exit temperatures of these two pallets differ significantly. This should be due to the differences in the magnitude of the temperature of the stacks (Table 2 and Figure 5).
Table 3 shows the average temperature of the air entering and exiting the heat exchanger at the end of the transient simulation. As can be seen, the air temperature magnitudes increase to more than double at the end of the heat exchanger section of the RecHeat.
Figure 7 shows the temperature of the air at the outlet of the apparatus. As can be seen, the product temperature at the start of the transient period is equal to 328 °C, which peaks at 350 °C, and by the end of the simulation (at 1500 s) drops to nearly 340 °C. The peak occurs at 650 s into the transient process; at this point, the curve reverses its direction. Therefore, it can be seen that the outlet temperature increases by more than 20 degrees in the first 650 s and it decreases by 12 degrees in 850 s after the peak.

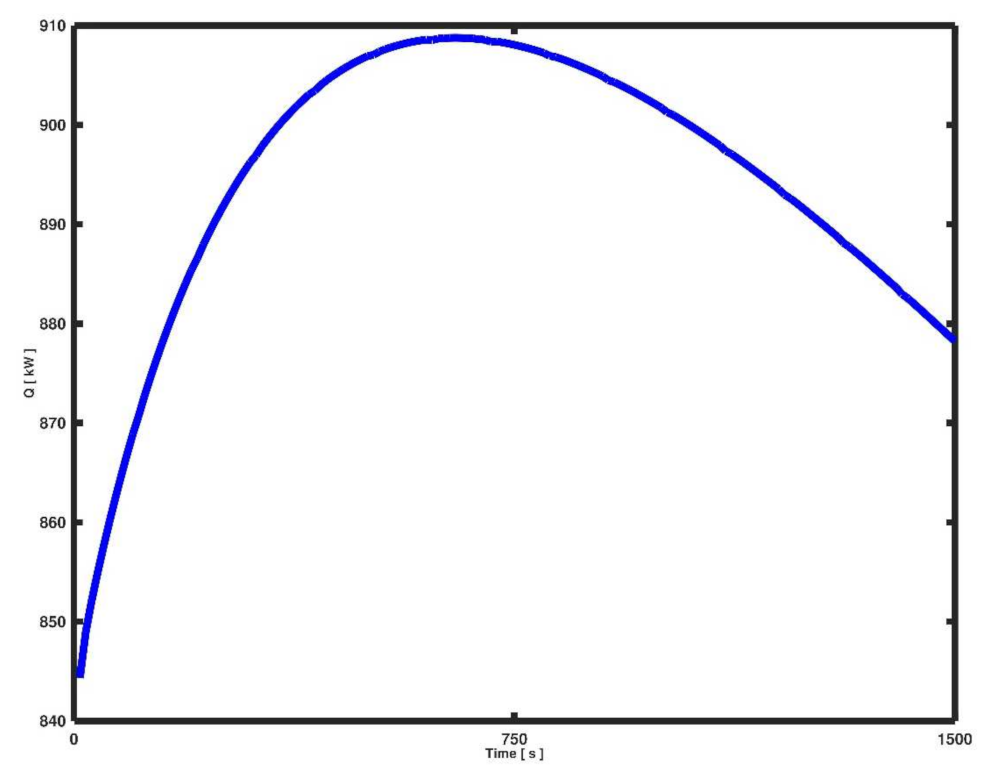
3.3. Heat Energy of the Product

As mentioned, the objective of the RecHeat is to produce hot air to be used in a drying process, and this dried material can be anything such as biomaterial, sludges or others. Therefore, it is logical to calculate the heat energy of the product.
Figure 8 shows the calculated heat energy of the outgoing air. Of course, to calculate the heat of energy one should assess the value using a baseline or reference temperature. In this study, since the air is sucked in from the surrounding environment, it is just logical to choose the ambient temperature as the baseline temperature of the medium. The ambient temperature, considering the location of the test, was chosen as TRef = 20 °C Using the given value, the heat energy of the air was calculated (Figure 8).
As can be seen, the heat energy of the product at the beginning of the transient process, at its peak and the end of the simulation are 844, 908 and 878 kW, respectively. As can be seen, the magnitude of the heat energy at the end of the simulation is 34 kW larger than the starting value.

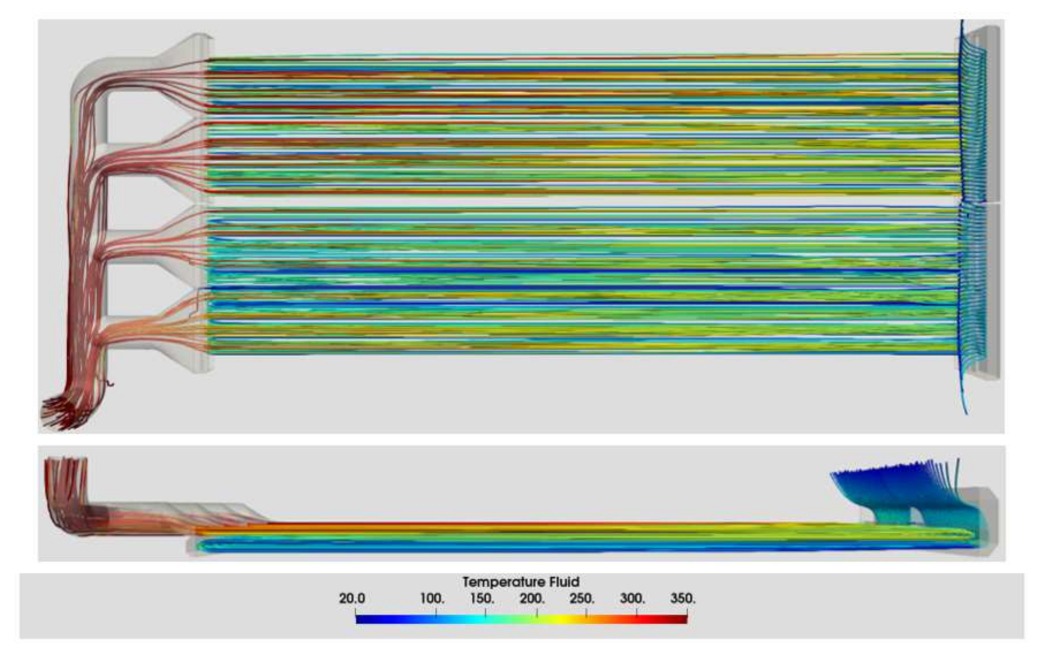
3.4. Streamlines and Air Profile

Figure 9 shows the profile of the air entering the apparatus to the ports at the left and the evolution of the temperature of the medium through the heat exchanger section of RecHeat.
As can be seen, the source of the streamlines was chosen as the location where the air sucked into the apparatus comes from above the entrance ports. Since the radiation effect decreases, this figure suggests that the medium entering the system is near ambient temperature.
Moreover, it can be seen that the temperature of the air at the bottom layers of the heat exchanger section of the apparatus is still not higher than 150 °C. This changes by the end of the middle layer. The figure shows that the air temperature reaches 200 °C and larger at this point; reaching the end of the heat exchanger section, the temperature of the air is close to the exit temperature in three of the four sections. Generally, it can be seen that the temperature of the air in the upper two layers (top view) is greater than the lower two.

4. Discussion

4.1. The Structure Heating Stage

As explained, Table 2 shows that at the beginning of the structure heating stage, the middle layer registers a slightly lower temperature magnitude compared to the bottom layer. Considering that the energy of the slag diffuses in a top-to-bottom direction, it is natural to assume otherwise. This behaviour, therefore, could be due to the heat energy entering the structure through the entrance ports of the RecHeat by means of the sucked-in air.
As Figure 4 shows, the air temperature very rapidly reaches beyond 250 °C at the beginning of the structure heating stage. This is the energy that has radiated from the surface of the slag. This heated air entered the apparatus (and heat exchanger section) at the top layer in the second configuration of the RecHeat, resulting in a different temperature profile.
In the current optimised design of the RecHeat, the heated air enters the heat exchanger section through the bottom layers. Hence, the bottom layers not only receive conductive heat energy of the slag but also absorb part of the radiated heat energy of slag through the flow of the air.
Hence, it is safe to say that this shows the significance of the radiative-convective energy dispersion of the slag during the structure heating process. Moreover, it shows that a change in the arrangement of the air entering the apparatus has a noticeable effect on the temperature profile of the pallets.
Of course, by the end of the structure heating stage, the bottom layer is significantly colder than the middle one which should be due to the stronger effect of the conductive heat through the body absorption from the slag.

4.2. The Heat Exchanging Stage

As mentioned, this stage starts when the energy exchange between the slag and the structure drops to a very low magnitude. At this stage, the temperatures of the pallets still change, but to a lesser extent (Figure 5).
The figure also shows that the change in the average magnitude of the temperature of each pallet is greater for the ones in the bottom and middle layers compared to the top. Therefore, compared to the top layer (blue line), the curves of other layers change their slope. Of course, this change is smaller for the middle layer compared to the bottom. This could be due firstly to the fact that the top layer is still in almost direct contact with the slag; and secondly, the heating process of the air during its transition though the heat exchanger section (absorption of energy of the body by the fluid).
This is more clearly expressed in Figure 9. It can be seen that the ambient air rapidly heats up by entering the inlet port of the RecHeat to 100 °C and increases its magnitude by more than 100 °C when passing through the bottom two layers. Of course, the air temperature increases further by absorbing the energy of the top, while the absorbed energy of the layers by the air should be substituted through conduction of the energy of the slag through its proximity.
Figure 9 also shows that the air exiting the heat exchanger region of profile three and four (closer to the outlet) seems to be colder than the other two. This could be due to the differences in the mass flow rates of the air through different profiles.
Figure 10 shows the mass of air entering each profile. As can be seen, there is a significant difference in the mass flow rate of the air through the two stacks near the outlet. A larger mass flow rate can mean larger energy pick-up leading to lower temperature magnitude.
Meanwhile, even though the air temperature at the end of the heat exchanger varies in the interval of 260–360 °C (Figure 6), the temperature of the air exiting the apparatus is greater than 325 °C and is equal to 340 °C at the end of the transient simulation (Figure 7). Translating this value into heat energy, it can be seen that the RecHeat collects more than 840 kW energy (from the baseline of ambient temperature). Of course, this value seems to be small in comparison to the amount of energy available in the slag, but such a performance proves to be noteworthy considering the temperature range (and the heat energy) required for drying of a wide range of materials.

5. Conclusions

The recovery of energy from waste materials has become a prime objective in many industries due to social and economic aspects, and one such material and industry is slag and steel-plants, respectively.
To address this objective, and as a part of technological development, a slag heat recovery apparatus, RecHeat, was designed using a one-to-one computer model. Then, the results of the simulation were used to redesign and optimise the structure to maximise the heat recovery process. This was done to prevent the economical exhaustion of the building and testing of such an apparatus. The optimised structure of the RecHeat was then also tested at an industrial pilot scale, as part of the ECOSLAG project (funded by RFCS, Research for steel and coal industry, project no. 800762 [11]).
Two stages were identified during the heat recovery process, i.e., the structure heating and the heat exchanger stages. In the former stage, the body of the apparatus increases its temperature magnitude, while in the latter one, the magnitude of the temperature of the sucked-in air increases when passing through each layer of the heat exchanger section.
The model shows that the temperatures of the layers of the heat exchanger section of the apparatus are around 170, 250 and 380 °C at the end of the structure heating stage, while the average air temperature at the entrance of the heat exchanger section is less than 150 °C.
The temperature magnitudes of the pallets change their slope when the system enters the heat exchanger stage. This could be due to the fact that the air entering the system starts to absorb the energy deposited into the structures. It was shown that the temperature of the fluid medium changes from a 125–140 °C interval to 260–340 °C from one end of the heat exchanger section to the other at the end of the simulation.
The outlet temperature at the end of the simulation is calculated to be around 340 °C, which shows an increase in temperature of at least 200 °C in the air entering the apparatus.

Author Contributions

Initial design, V.L. and J.M.; design optimisation, V.L., J.M., R.S.N. and J.B.; model conceptualisation, R.S.N., J.B. and V.L.; model setup, R.S.N.; writing—original draft preparation, R.SN and V.L.; writing—review and editing, R.S.N., V.L. and J.B. All authors have read and agreed to the published version of the manuscript.

Funding

The research leading to these results has received funding from the European Union’s Research Fund for Coal and Steel research programme under grant agreement number: 800762.

Data Availability Statement

Not applicable.

Acknowledgments

The authors would like to acknowledge and thank Anita Wedholm of SSAB Merox and Slag handling staff of SSAB Luleå.

Conflicts of Interest

The authors declare no conflict of interest.

References

  1. Birol, F. Energy Technology Perspectives. 2020. Available online: https://iea.blob.core.windows.net/assets/7f8aed40-89af-4348-be19-c8a67df0b9ea/Energy_Technology_Perspectives_2020_PDF.pdf (accessed on 4 June 2021).
  2. Wang, R.Q.; Jiang, L.; Wang, Y.D.; Roskilly, A.P. Energy saving technologies and mass-thermal network optimization for decarbonized iron and steel industry: A review. J. Clean. Prod. 2020, 274, 122997. [Google Scholar] [CrossRef]
  3. Fact Sheet World Steel Association. 2021. Available online: https://www.worldsteel.org/en/dam/jcr:5574d4fd-4dd4-4b2d-9300-2ed7d3de0c7a/step%2520up-vf.pdf (accessed on 28 May 2021).
  4. Climate Change and the Production of Iron and Steel. World Steel Association. 2021. Available online: https://www.worldsteel.org/en/dam/jcr:228be1e4-5171-4602-b1e3-63df9ed394f5/worldsteel_climatechange_policy%2520paper.pdf (accessed on 28 May 2021).
  5. Iron and Steel International Energy Agency. 2021. Available online: https://www.iea.org/reports/iron-and-steel (accessed on 28 May 2021).
  6. Slag Recycling Recovery Worldwide. 2021. Available online: https://www.recovery-worldwide.com/en/artikel/slag-recycling_3528047.html (accessed on 4 June 2021).
  7. Feng, Y.H.; Zhang, Z.; Qiu, L.; Zhang, X.X. Heat recovery process modelling of semi-molten blast furnace slag in a moving bed using XDEM. Energy 2019, 186, 115876. [Google Scholar] [CrossRef]
  8. Zhu, X.; Ding, B.; Wang, H.; He, X.Y.; Tan, Y.; Liao, Q. Numerical study on solidification behaviors of a molten slag droplet in the centrifugal granulation and heat recovery system. Appl. Therm. Eng. 2018, 130, 1033–1043. [Google Scholar] [CrossRef]
  9. Fleischanderl, A.; Fenzl, T.; Neuhold, R. Dry Slag Granulation—The Future Way to Granulate Blast Furnace Slag. In Proceedings of the 2018 Iron & Steel Technology Conference and Exposition, Philadelphia, PA, USA, 7–10 May 2018. [Google Scholar]
  10. González-Fernández, L.; Ortega-Fernández, I.; Grosu, Y.; Faik, A. Thermophysical Properties of Steel Slag for Heat Recovery and Storage Applicaations. In Proceedings of the 10th European Slag Conference, Thessaloniki, Greece, 8–11 October 2019; pp. 1–3. [Google Scholar]
  11. RFCS, ECOSLAG: Eco-Friendly Steelmaking Slag Solidification with Energy Recovery to Produce a High-Quality Slag Product for a Austainable Recycling. 2018. Available online: https://ec.europa.eu/info/sites/default/files/research_and_innovation/funding/documents/synopsis_of_rfcs_projects_2017-2020.pdf (accessed on 8 June 2021).
Figure 1. Heat exchanger and the slag layer; side-, front-, back- and top-view of the apparatus from top to bottom.
Metals 11 01144 g001
Figure 2. Calculation domain.
Metals 11 01144 g002
Figure 3. Outer faces of the calculation domain: top and sides faces are treated as pressure boundary and the bottom as adiabatic wall.
Metals 11 01144 g003
Figure 4. Average air temperature during the structure heating stage; colours correspond to pallet colouring.
Metals 11 01144 g004
Figure 5. Average temperature of each layer of the stacks; colours of the titles correspond to pallet colouring.
Metals 11 01144 g005
Figure 6. (a) Average temperature at the entrance of the Hex. (b) Average temperature at the exit of Hex.
Metals 11 01144 g006
Figure 7. Temperature of the final product (air).
Metals 11 01144 g007
Figure 8. Heat energy of the final product (air).
Metals 11 01144 g008
Figure 9. Air streamlines originating from a line across the entrance ports, coloured by temperature.
Metals 11 01144 g009
Figure 10. Air mass flow rate through each profile.
Metals 11 01144 g010
Table 1. Model initial and boundary conditions.
BC & IVObjectTypeMagnitudeUnit
Boundary ConditionRecHeat Gas OutMass Flow Rate2.5kg/s
Top & Side FacesPressure boundaryAmbient P and TPa & °C
Bottom FaceWallAdiabatic-
Initial ValueSlagTemperature1300°C
AirTemperatureAmbient T°C
Table 2. Temperature magnitude of each pallet in each layer at two instances of the structure heating stage.
Top LayerMiddle LayerBottom Layer
126.00125.04125.04127.2740.6639.2440.0044.2943.6141.2242.5147.22
392.14387.60384.70372.51262.99264.73259.63246.12170.82175.02170.53162.71
Table 3. Average temperature of each stack at the entrance and the exit of the heat exchanger at the final time.
VariableLocationStack #1Stack #2Stack #3Stack #4
TemperatureEntrance140.32134.29127.36134.79
Exit349.36315.76304.13287.13
Diff209.04181.47176.77152.34
Publisher’s Note: MDPI stays neutral with regard to jurisdictional claims in published maps and institutional affiliations.

