
Numerical Simulation of Bottom-Blowing Stirring in Different Smelting Stages of Electric Arc Furnace Steelmaking

Abstract
:1. Introduction
2. Flow Characteristics of Molten Steel in Different Smelting Periods of EAF
2.1. Factors Influencing Liquid Steel Flow Characteristics
2.2. Feature Point Selection in Different Smelting Periods
3. Numerical Simulation of Bottom-Blowing
3.1. Governing Equation
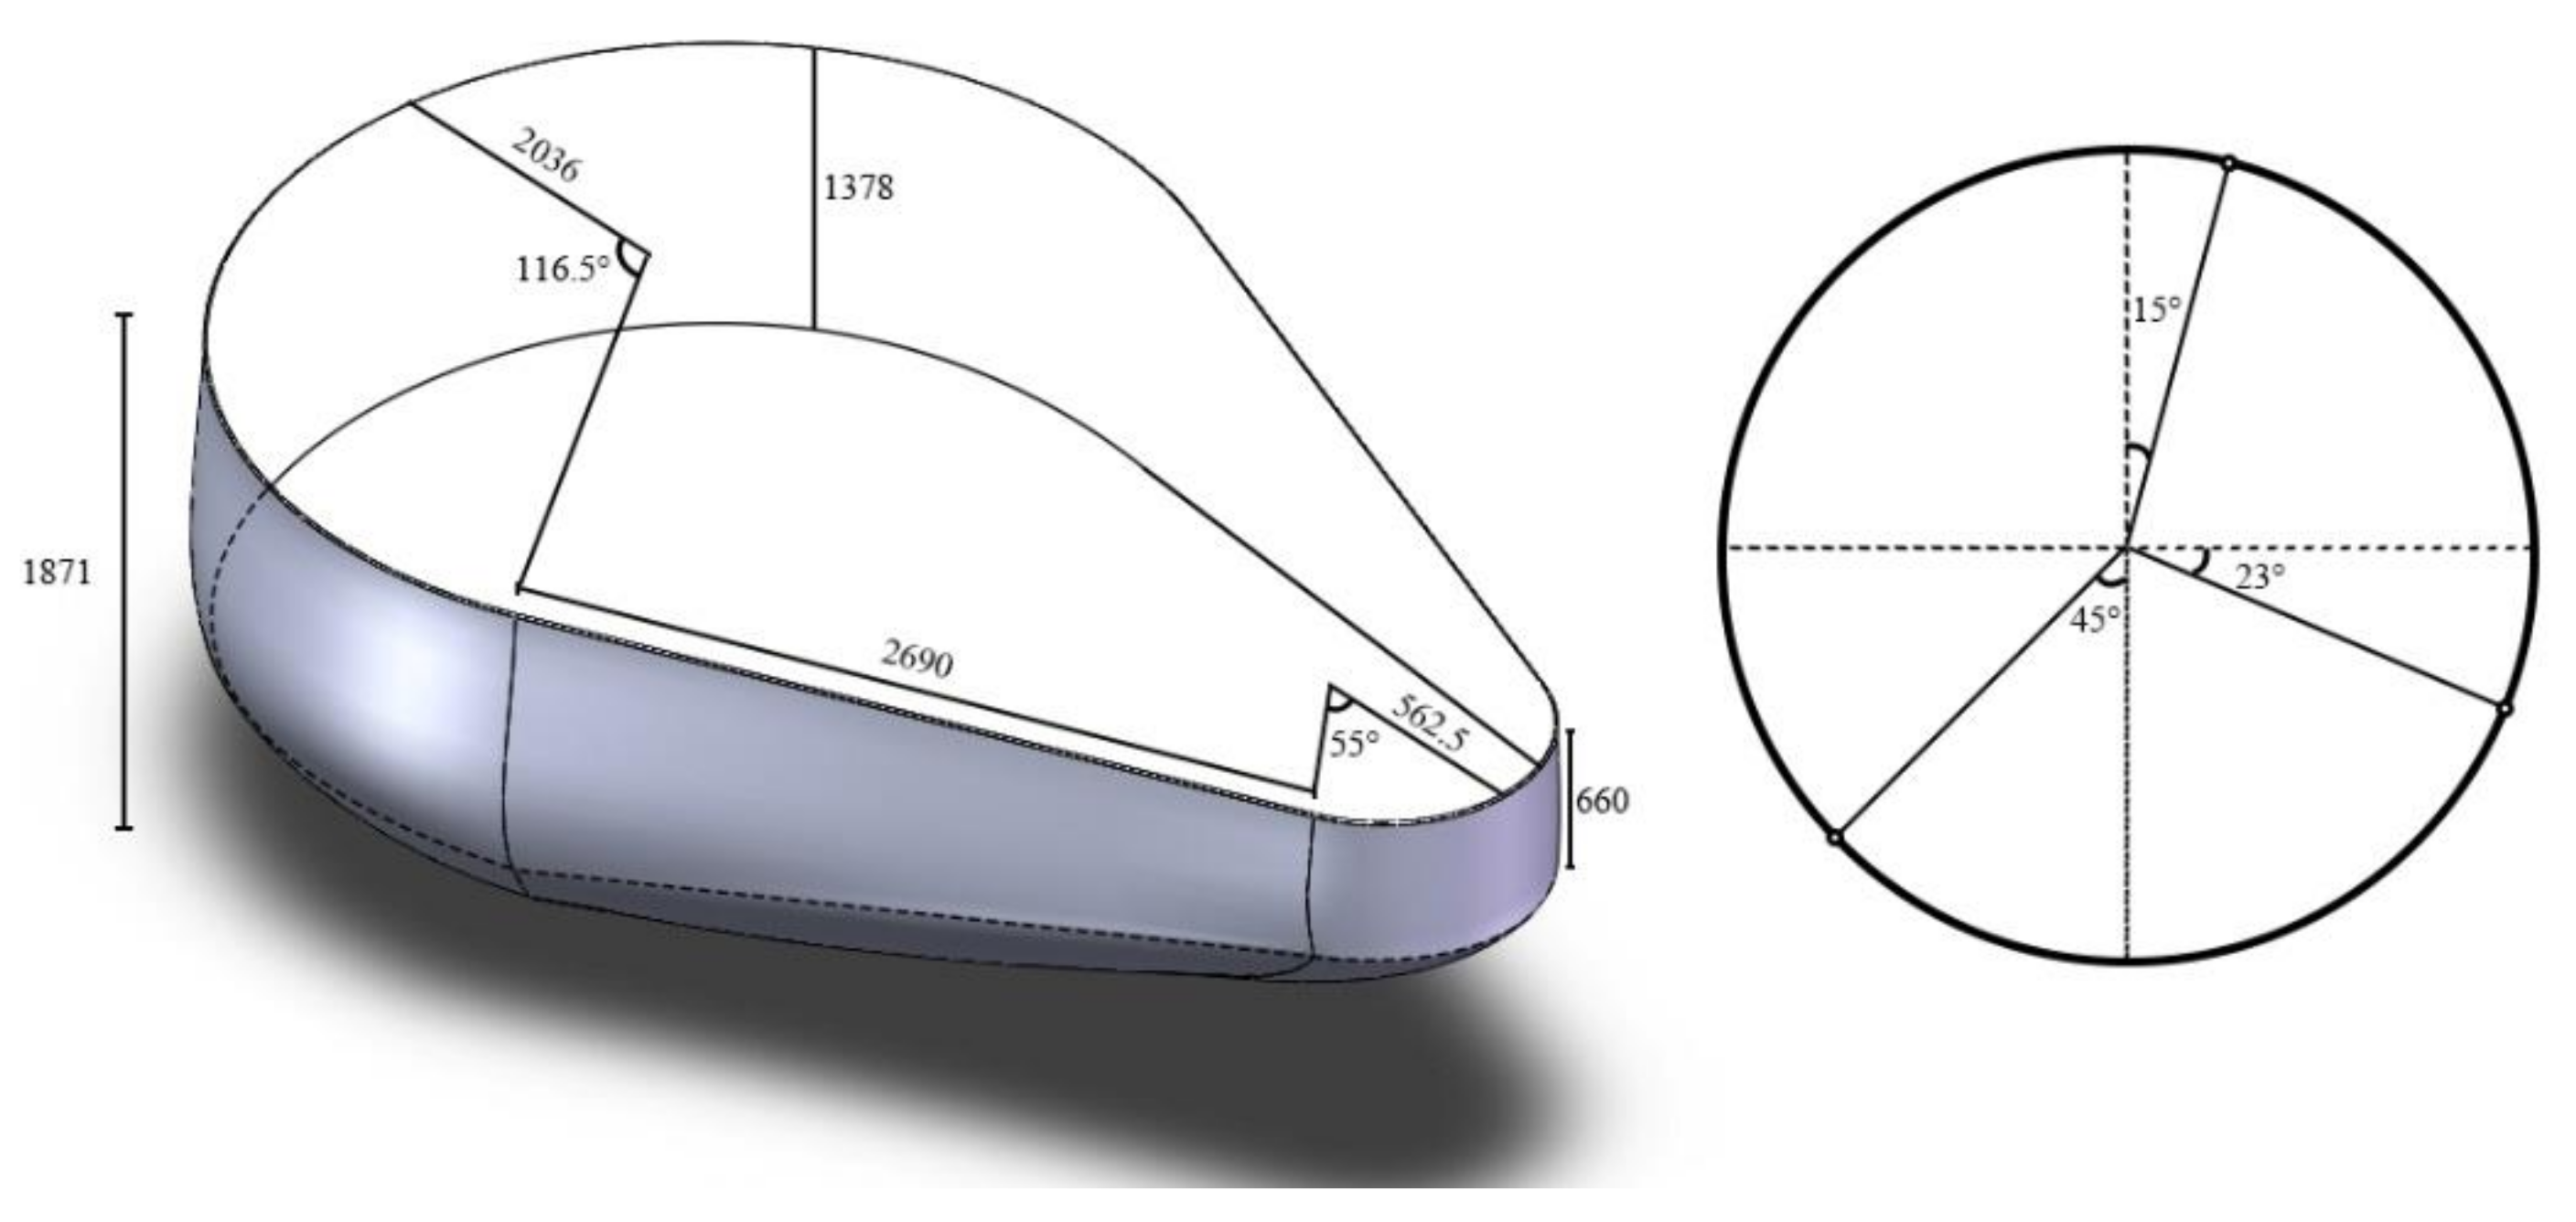
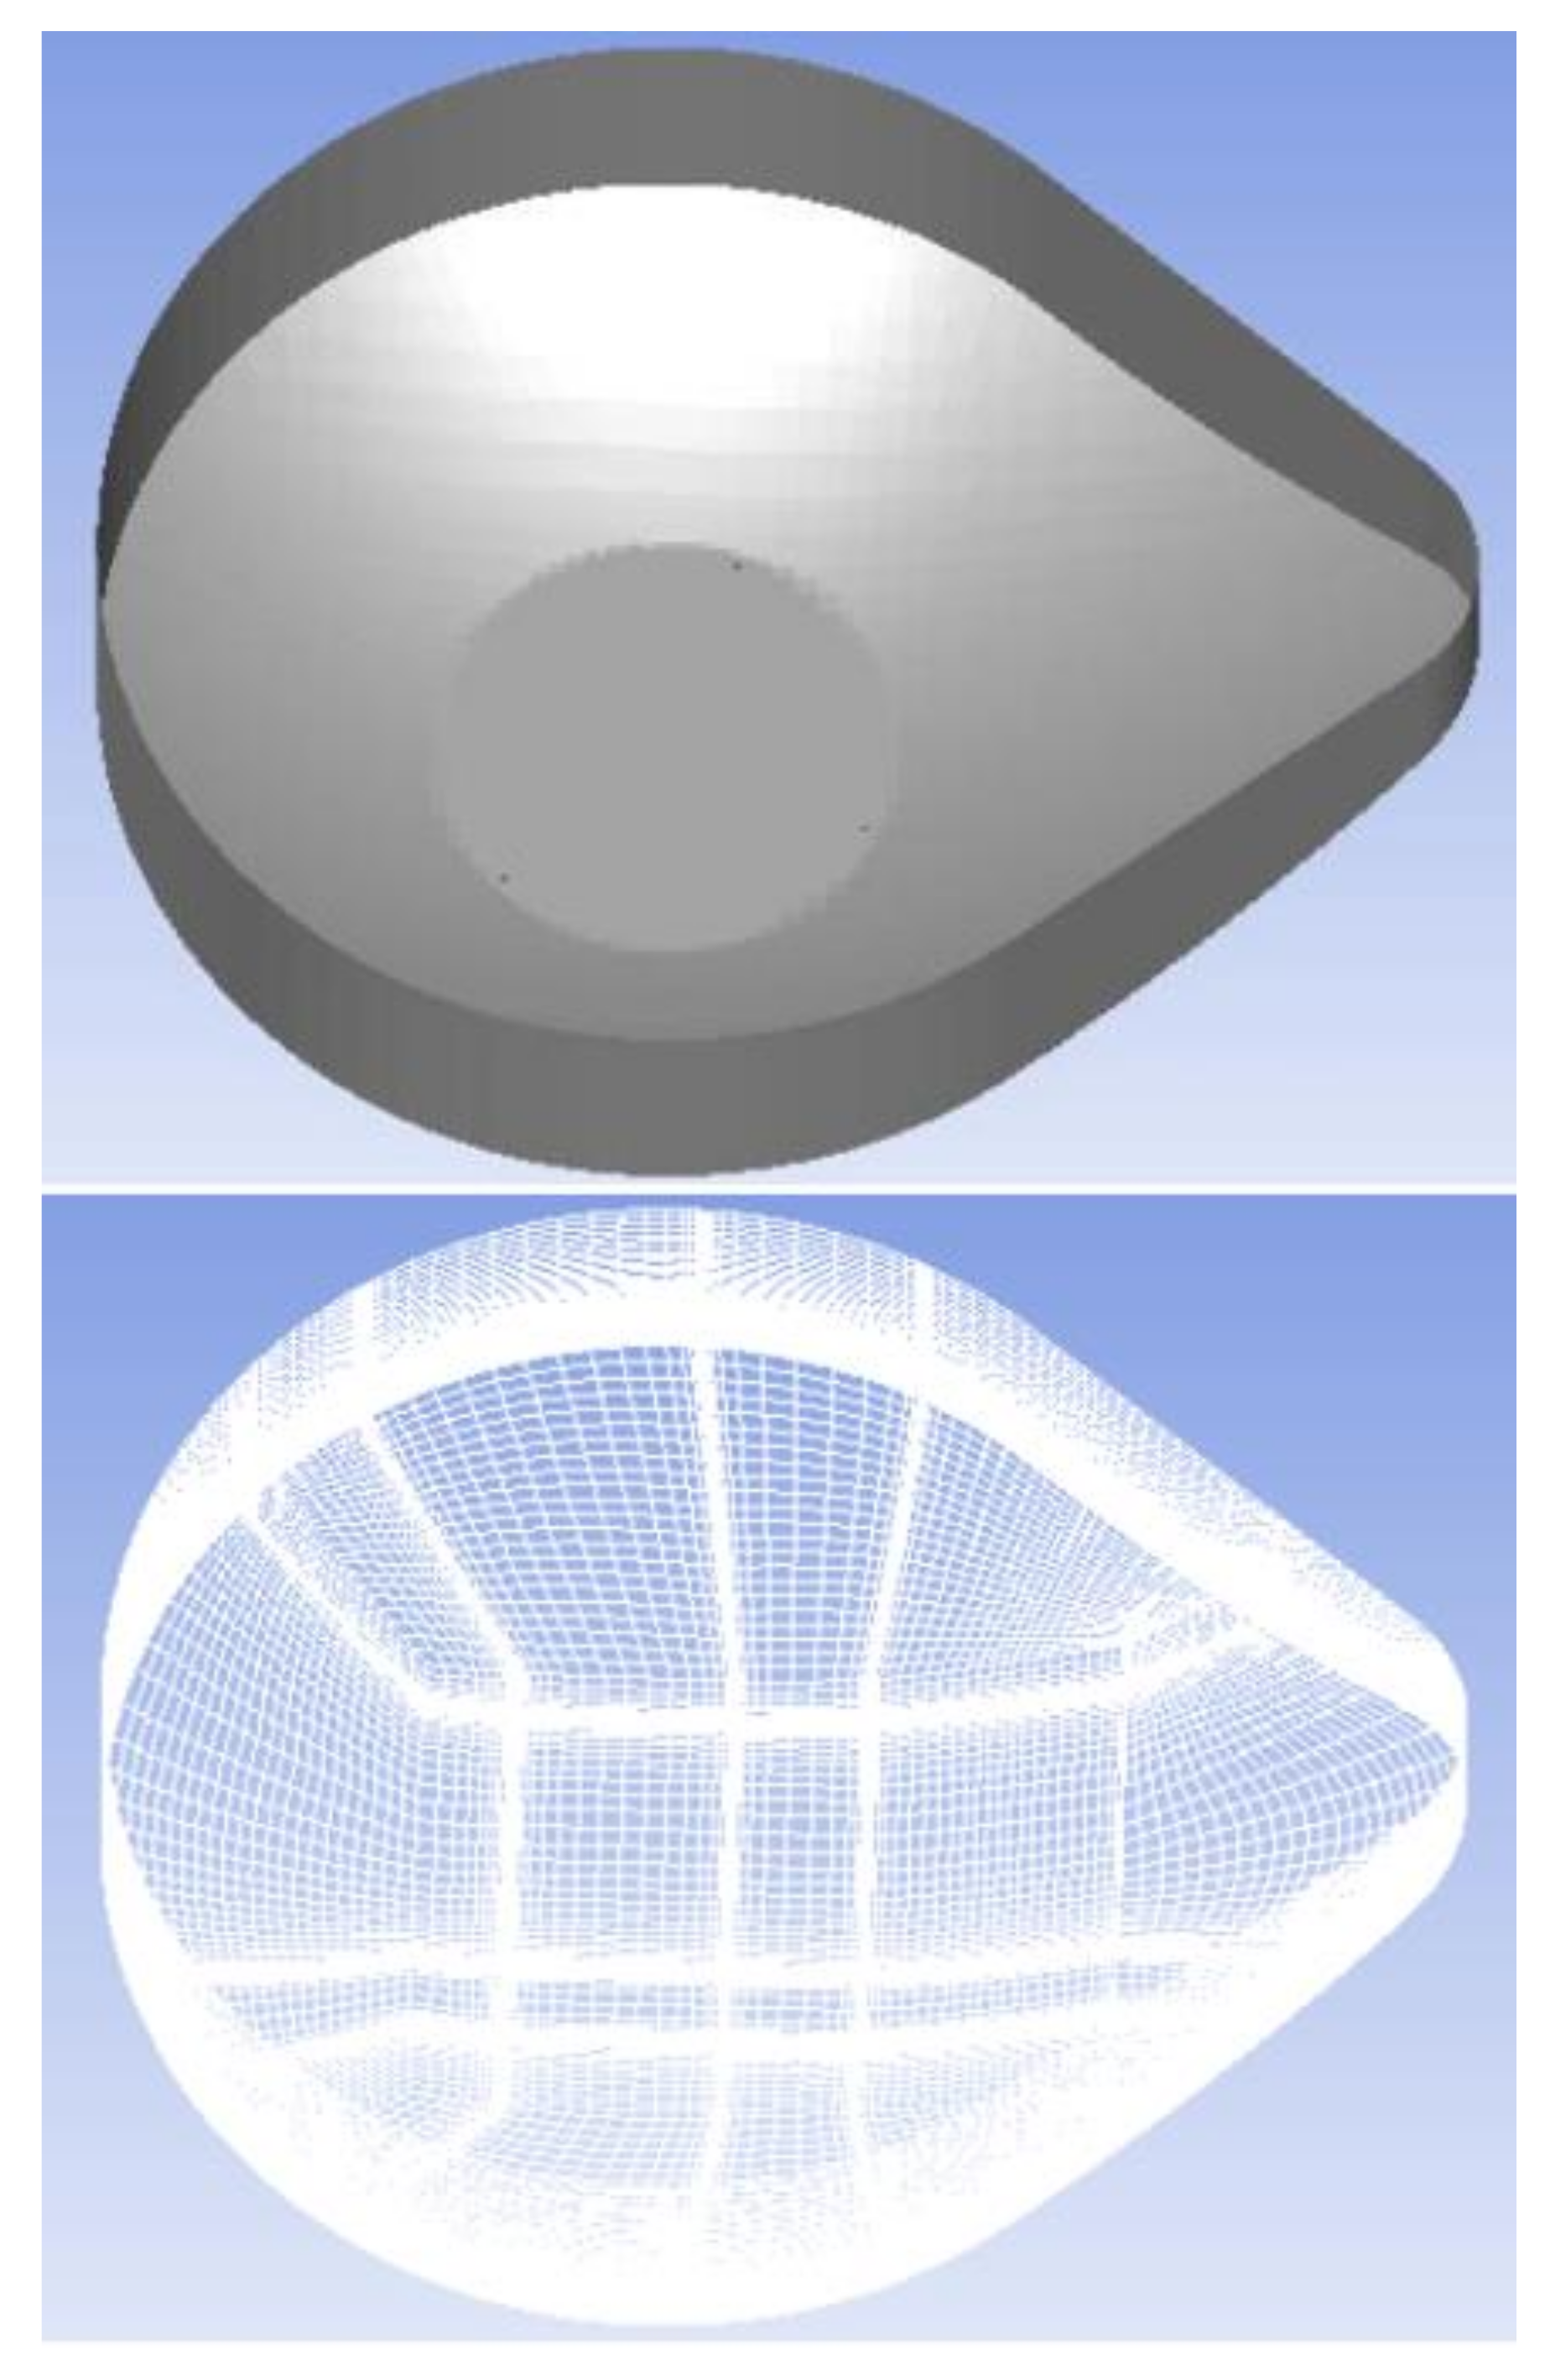
3.2. Grid Model
3.3. Calculation Hypothesis
3.4. Calculation Settings
4. Results and Discussion
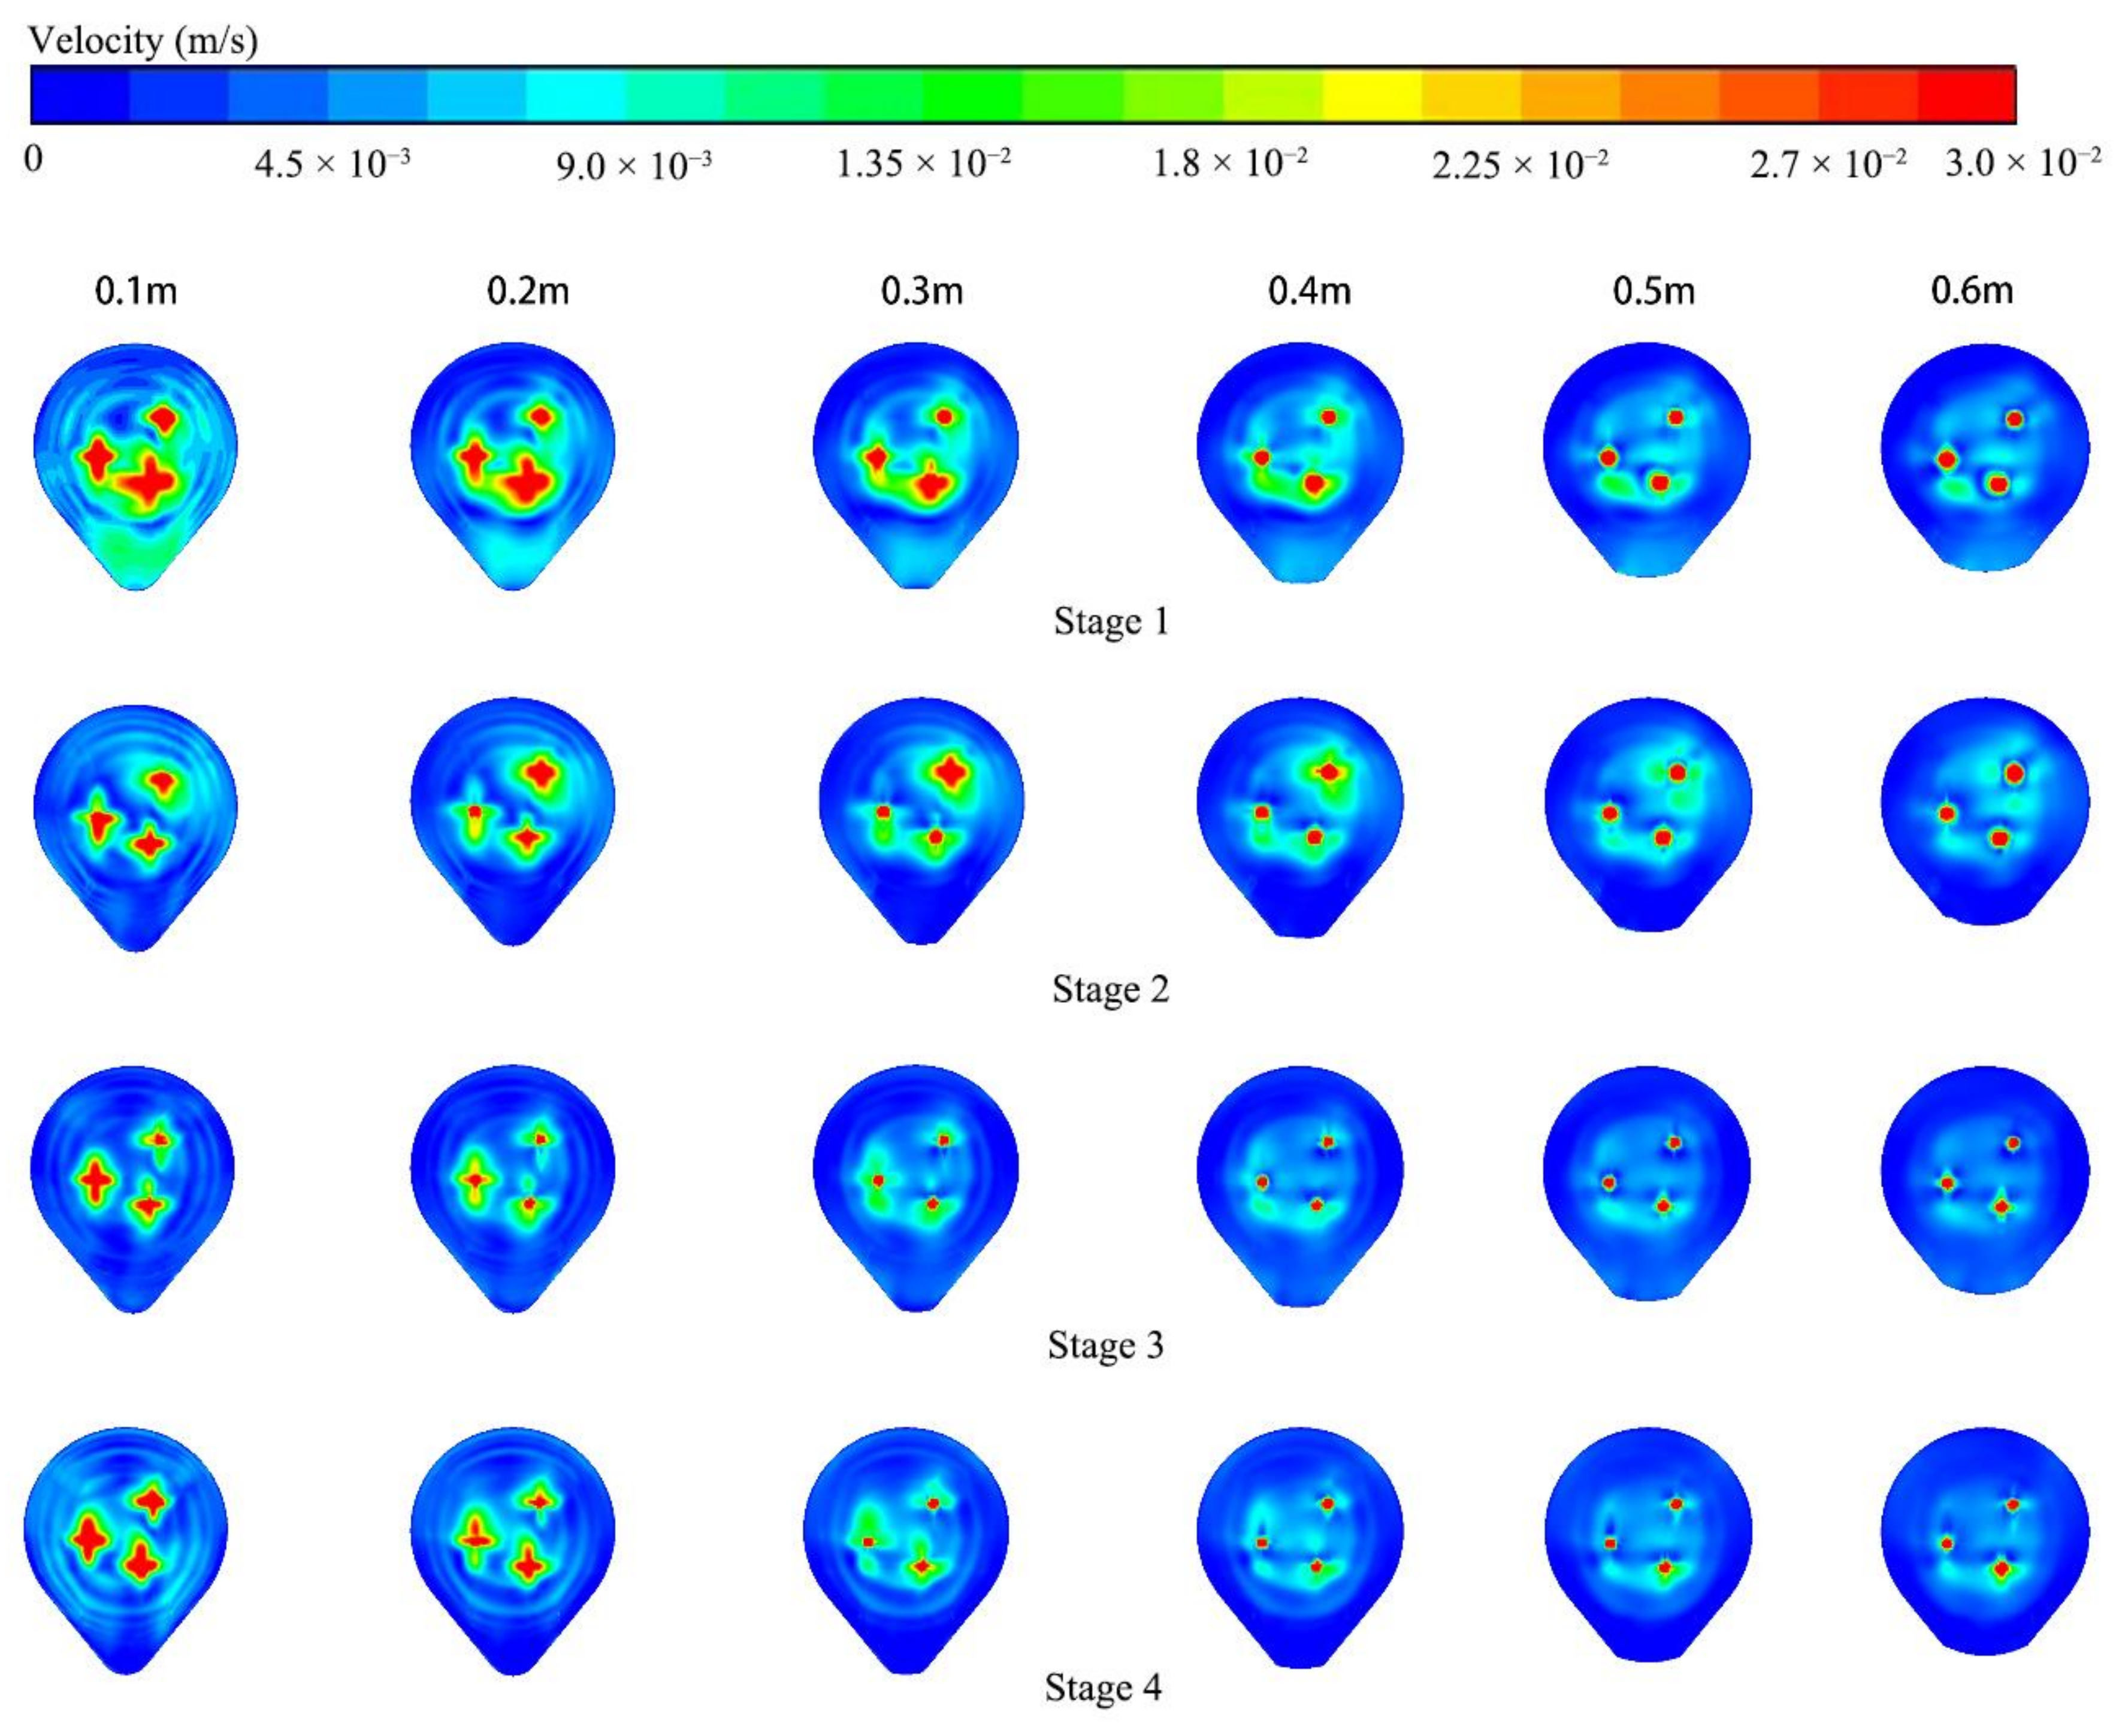
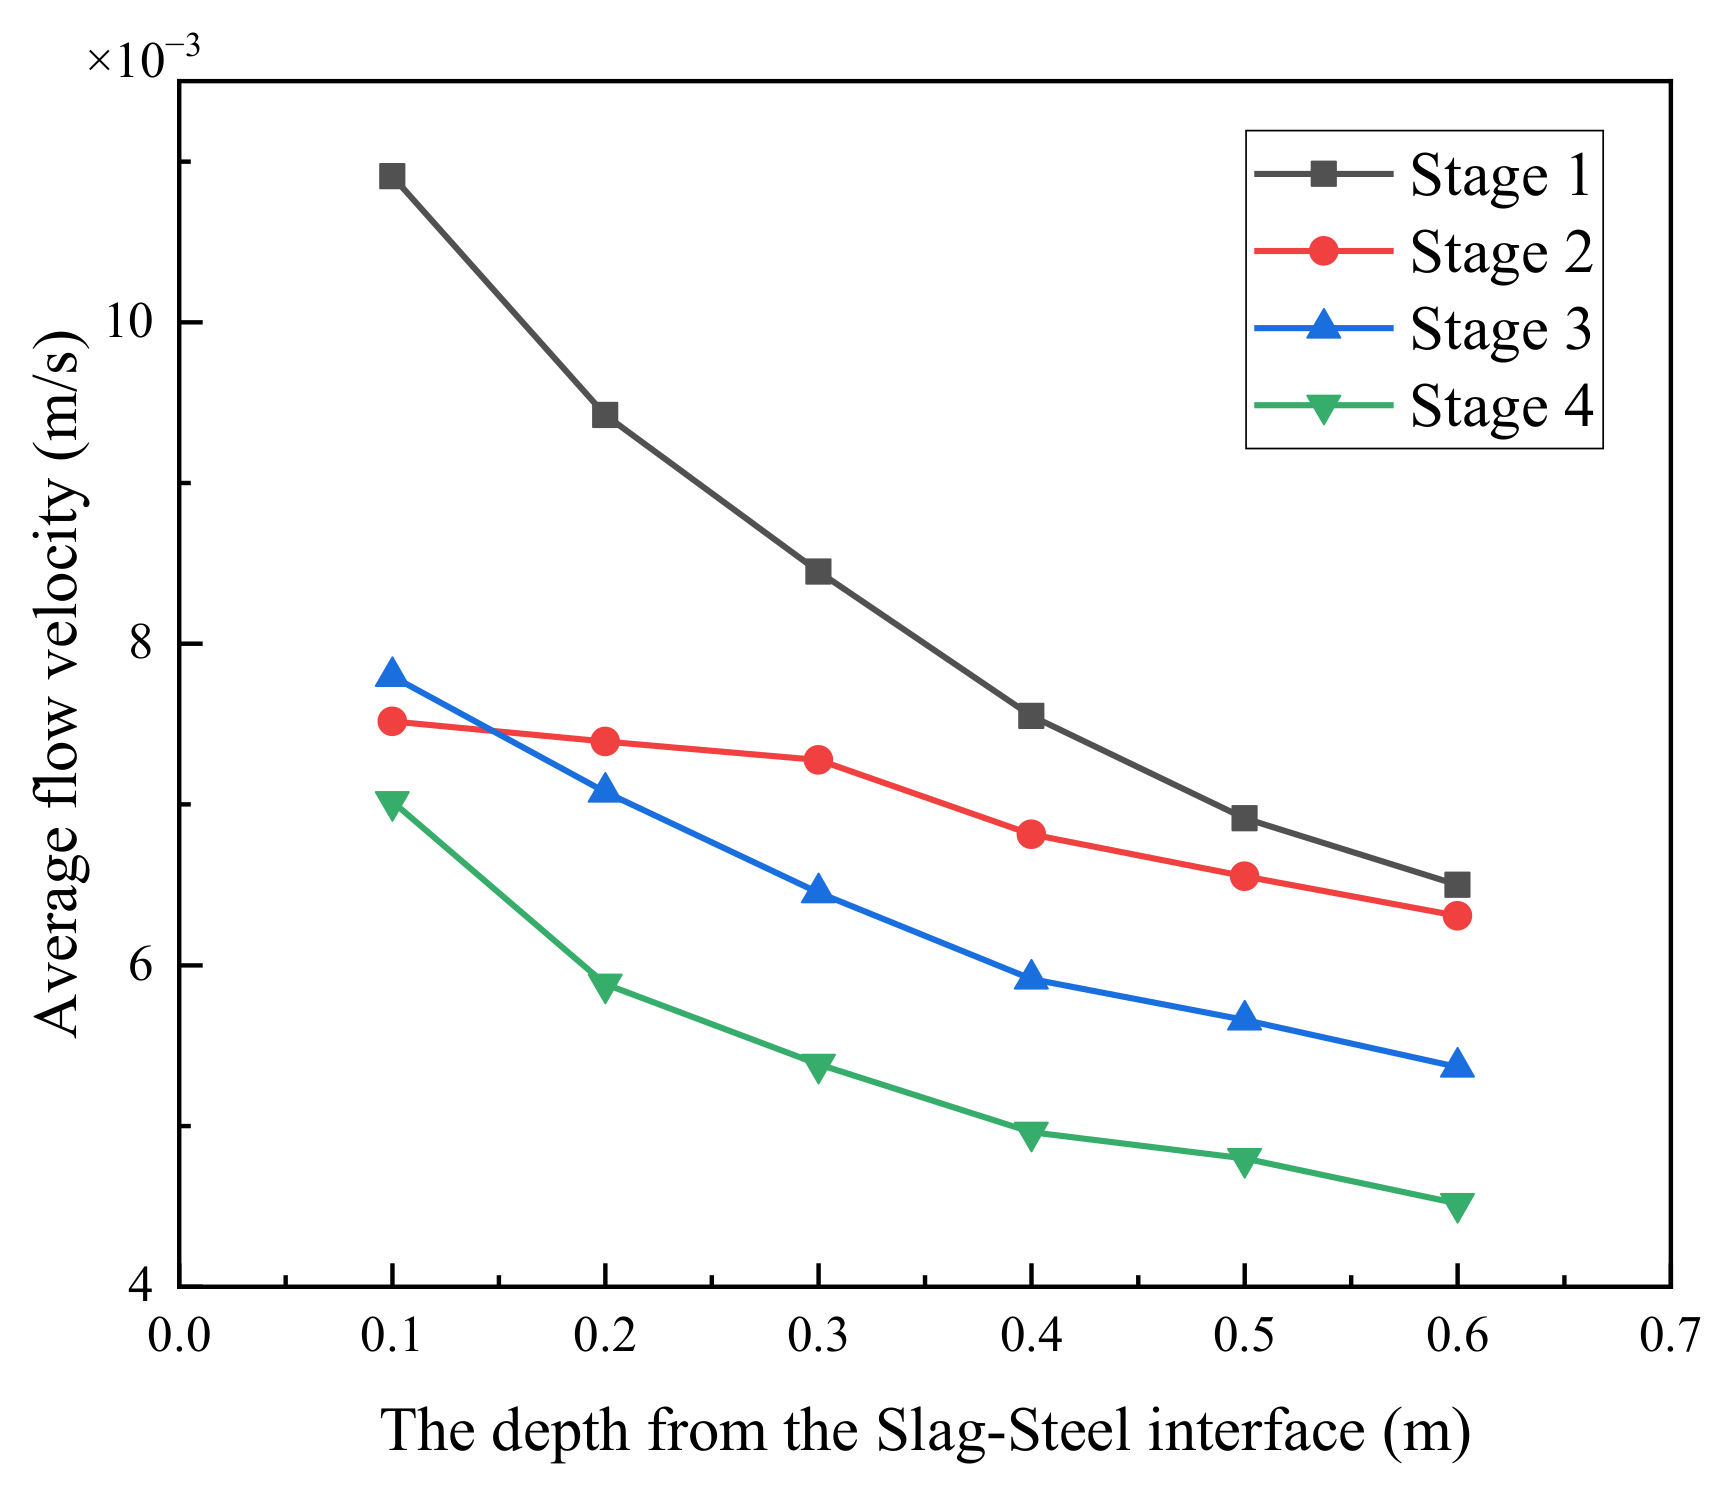
4.1. Numerical Simulation Results
4.2. Physical Model Verification
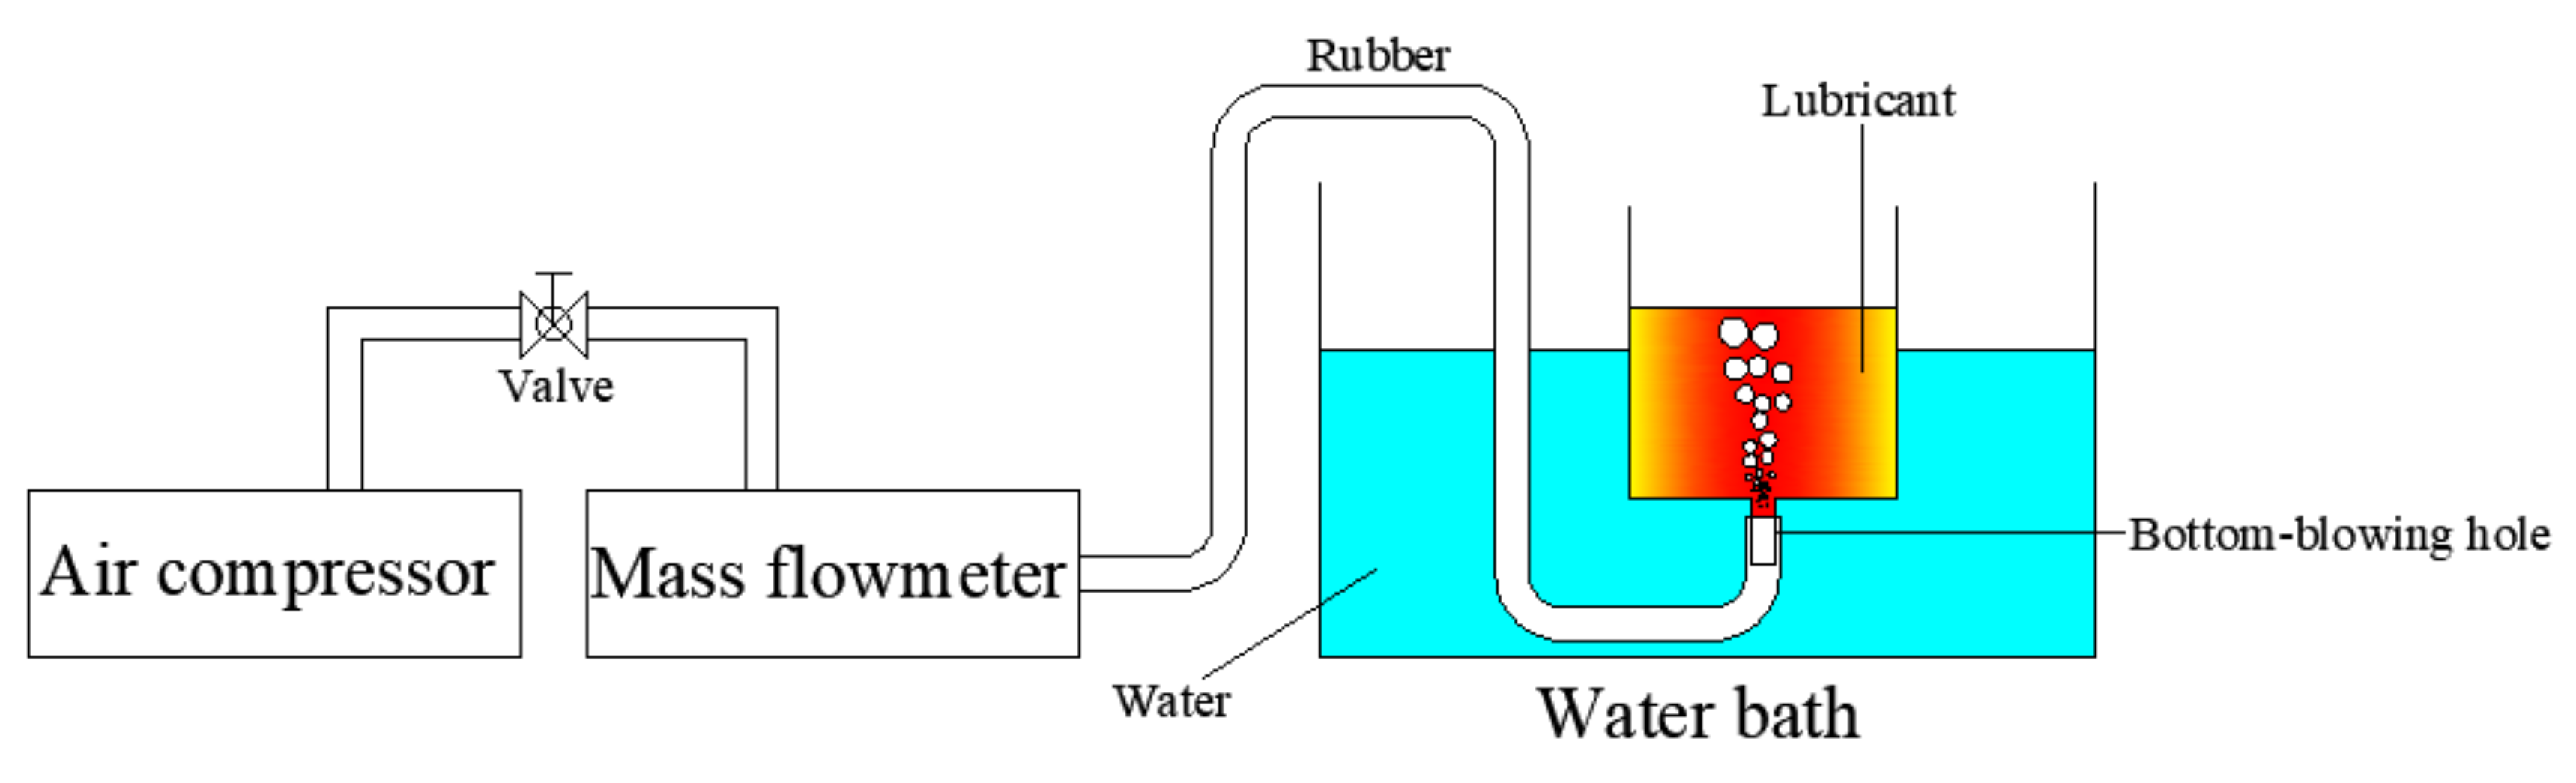
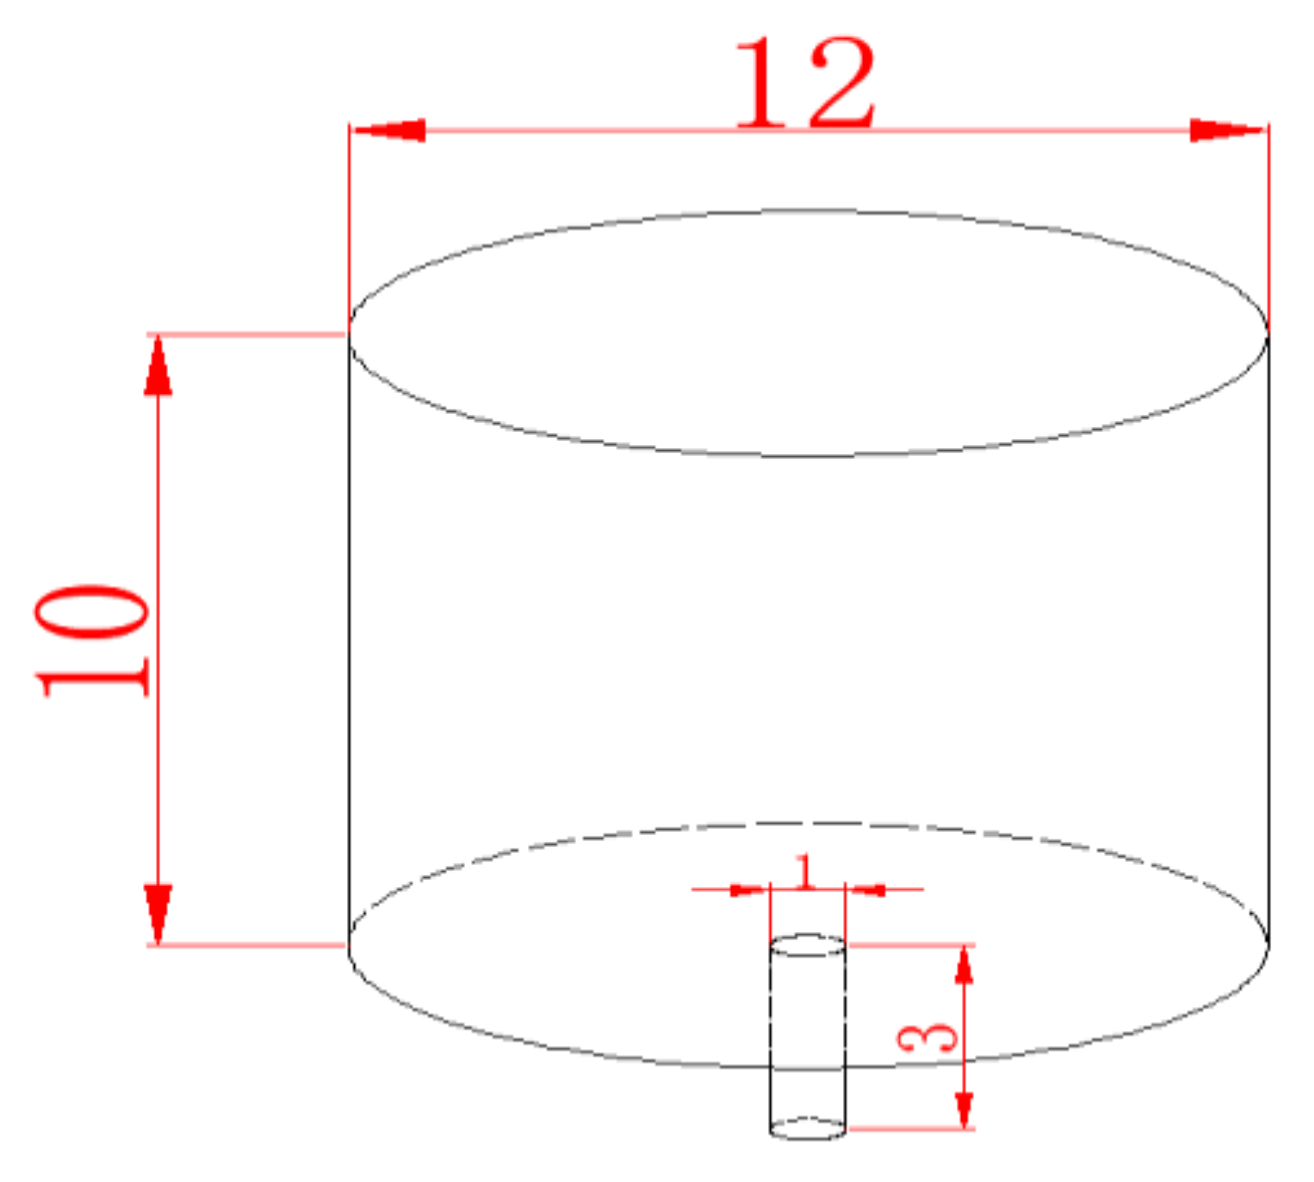
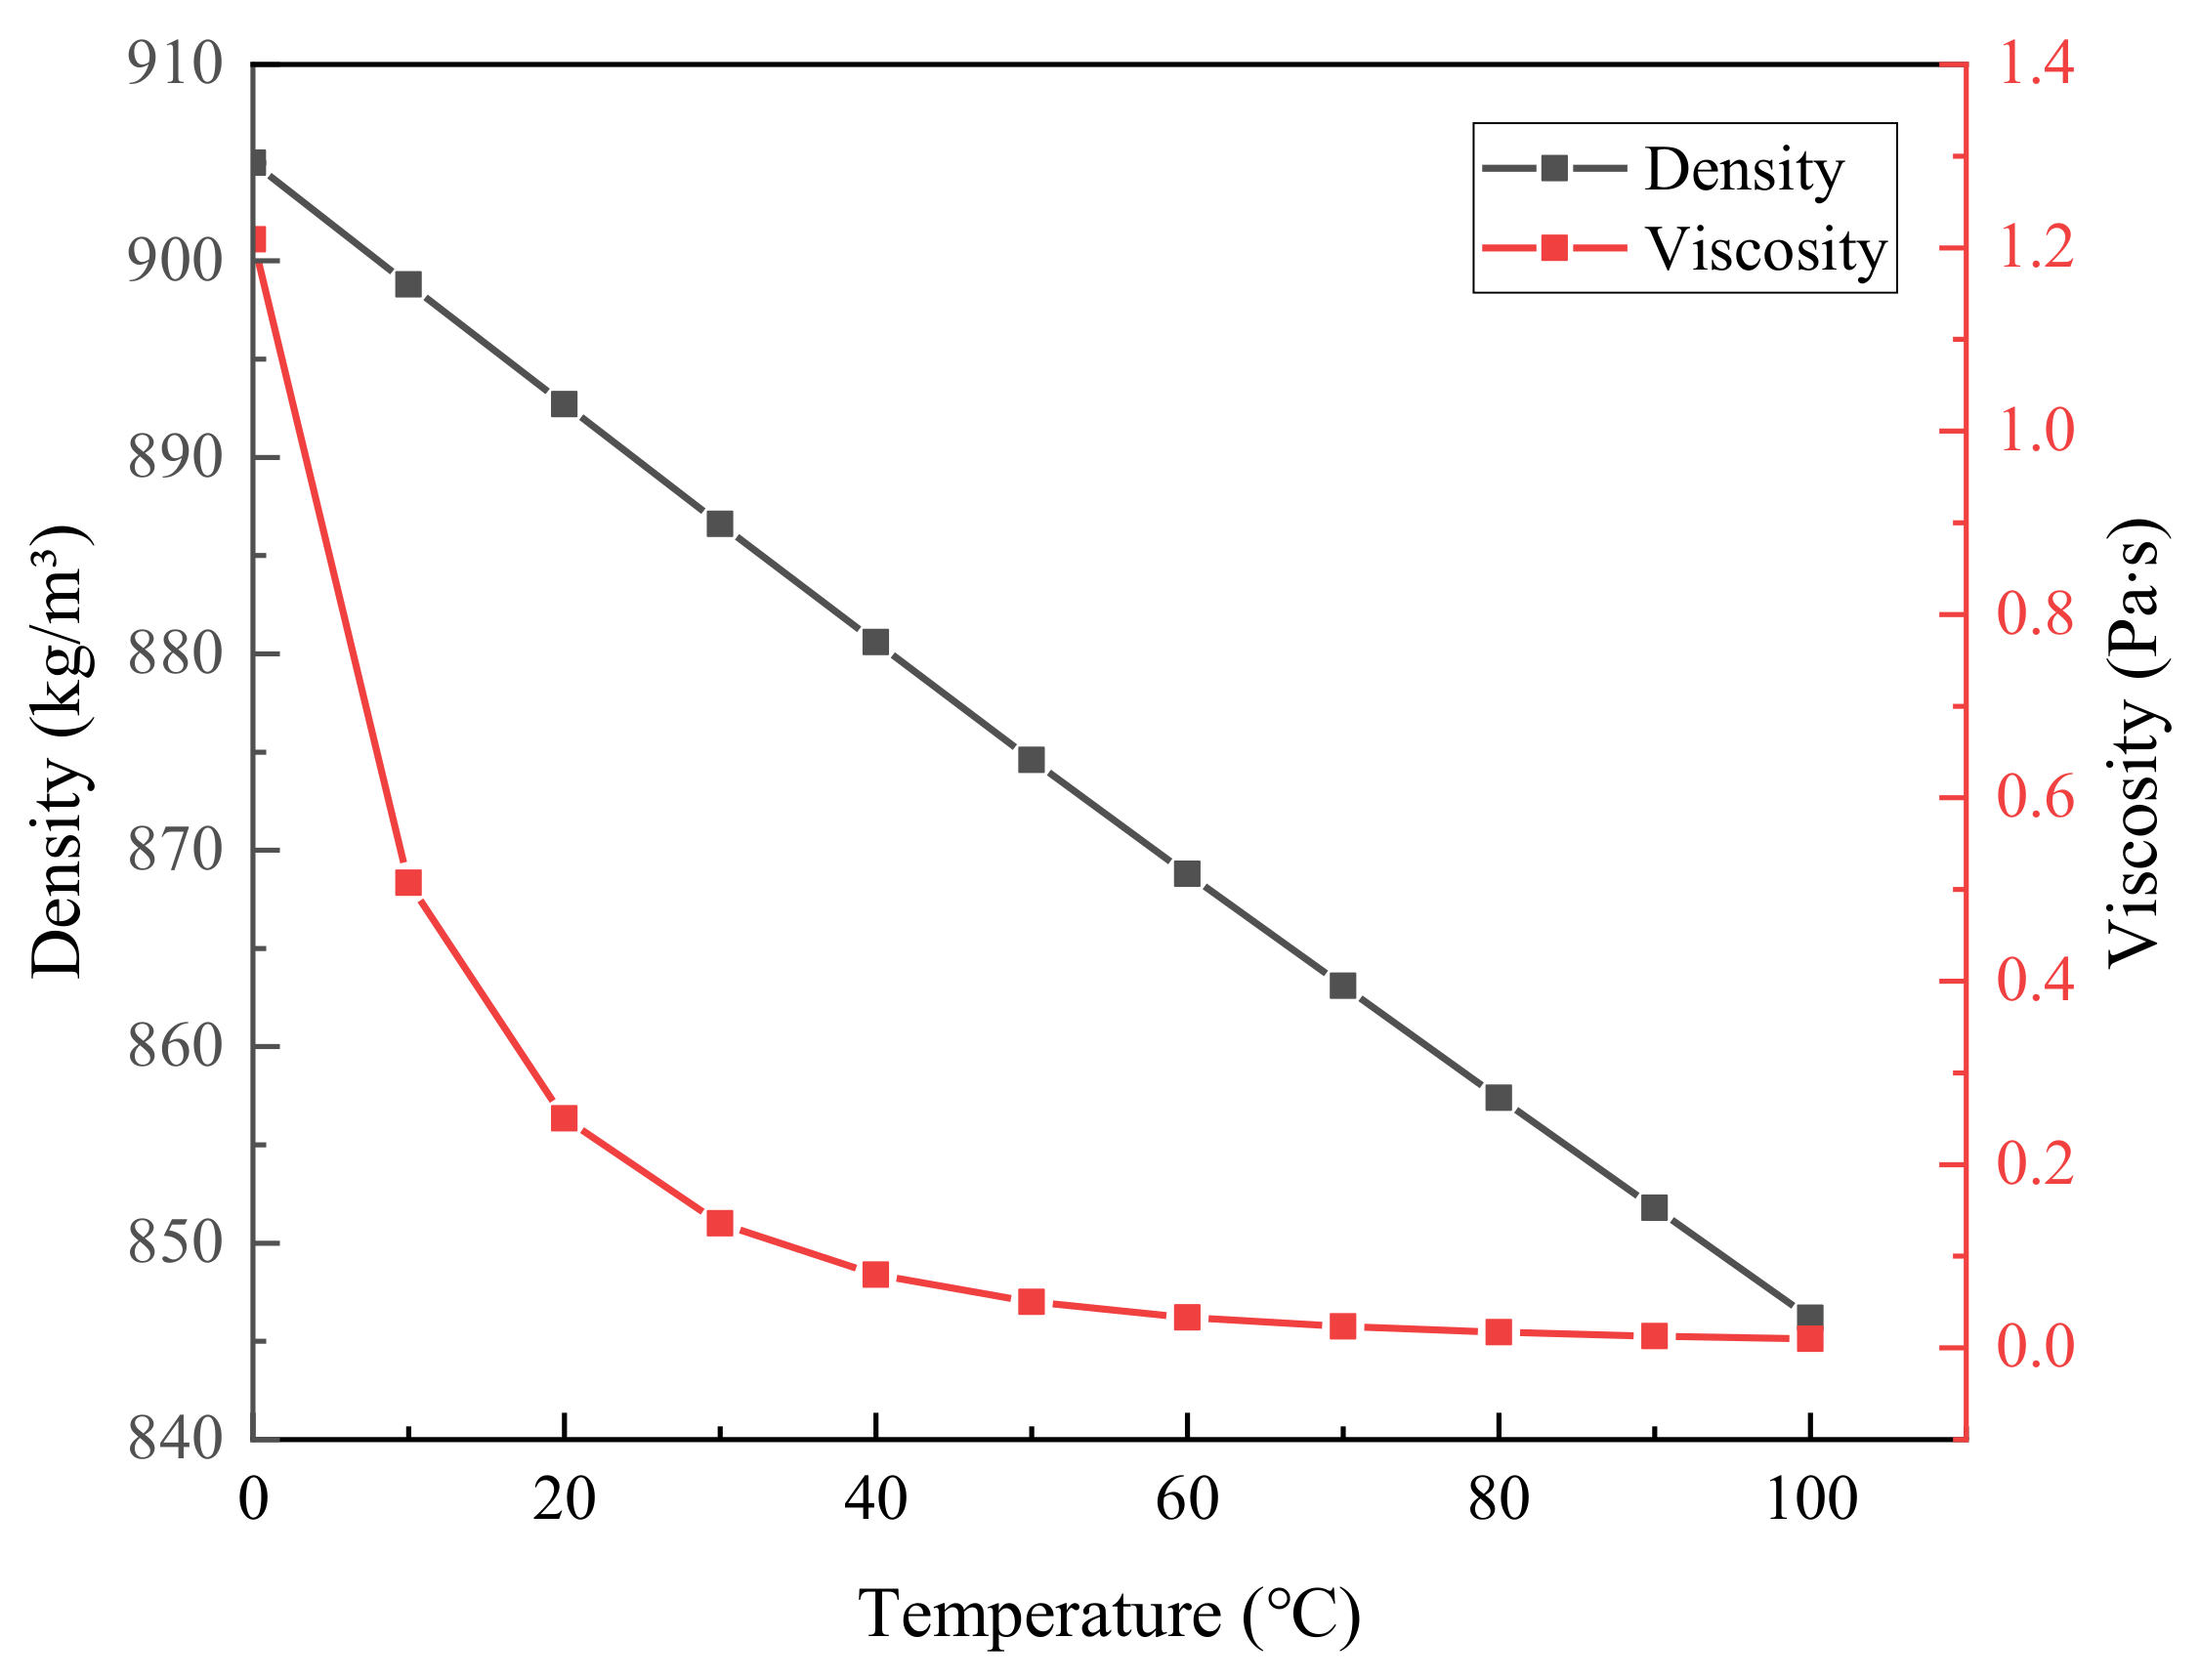
4.2.1. Physical Model Verification Plan
4.2.2. Physical Model Verification Results and Analysis
4.3. Operation System Discussion for Bottom-Blowing
5. Conclusions
Author Contributions
Funding
Institutional Review Board Statement
Informed Consent Statement
Data Availability Statement
Acknowledgments
Conflicts of Interest
References
- Goodfellow, H.D.; Pozzi, M.; Maiolo, J. Dynamic process control and optimization for EAF steelmakers. MPT 2006, 29, 24–31. [Google Scholar]
- Yin, R.Y. Thinking of Developing Modern Electric Furnace Route in 21st Century. China Metall. 2005, 6, 1–7. [Google Scholar]
- Lv, M.; Zhu, R.; Yang, L.Z. High Efficiency Dephosphorization by Mixed Injection during Steelmaking Process. Steel Res. Int. 2018, 90, 1800454. [Google Scholar] [CrossRef]
- Wei, G.S.; Peng, Y.H.; Zhu, R.; Yang, L.Z.; Wu, X.T. Fluid Dynamics Analysis of O2–CaO Jet with a Shrouding Flame for EAF Steelmaking. ISIJ Int. 2020, 60, 481–491. [Google Scholar] [CrossRef]
- Yang, L.Z.; Yang, Z.S.; Wei, G.S.; Guo, Y.F.; Chen, F.; Zheng, F.Q. Influence of Ambient and Oxygen Temperatures on Fluid Flow Characteristics Considering Swirl-type Supersonic Oxygen Jets. ISIJ Int. 2019, 59, 2272–2282. [Google Scholar] [CrossRef] [Green Version]
- Jiang, M.F.; Li, L.F. Current Status of Development in Bottom Stirring Technique for Electric Arc Furnace. Res. Iron Steel 1994, 5, 46–49. [Google Scholar]
- Wang, H.; Zhu, R.; Liu, R.Z.; Shou, D.; Xie, G.J.; Fan, S.L.; Gu, Y.L. Application Research of Carbon Dioxide in EAF Bottom Blowing. Ind. Heat. 2014, 43, 12–17. [Google Scholar]
- Wei, G.S.; Zhu, R.; Dong, K.; Li, Z.Z.; Yang, L.Z.; Wu, X.T. Influence of bottom-blowing gas species on the nitrogen content in molten steel during the EAF steelmaking process. Ironmak. Steelmak. 2017, 45, 839–846. [Google Scholar] [CrossRef]
- Wei, G.S.; Zhu, R.; Wu, X.T.; Dong, K.; Yang, L.Z.; Liu, R.Z. Technological Innovations of Carbon Dioxide Injection in EAF-LF Steelmaking. JOM 2018, 70, 969–976. [Google Scholar] [CrossRef]
- Van Wijngaarden, M.J.U.T.; Pieterse, A.T. Bottom-stirring in an electric-arc furnace: Performance results at lscor Vereeniging Works. J. S. Afr. Inst. Min. Metall. 1994, 1, 27–34. [Google Scholar]
- He, P.; Zhang, D.M.; Deng, K.W.; Zhang, R.S.; Wang, Q.K. Stirring Technology of Bottom Blowing Gas in EAF. Iron Steel 1992, 9, 65–70. [Google Scholar]
- Ramirez, M.; Alexis, J.; Trapaga, G.; Jonsson, P.; Mckelliget, J. Modeling of a DC Electric Arc Furnace—Mixing in the Bath. ISIJ Int. 2001, 41, 1146–1155. [Google Scholar] [CrossRef] [Green Version]
- Gu, Y.L.; Zhu, R.; Dong, K.; Bao, X.; Xie, G.J.; Liu, Z.Q.; Shou, D.; Ma, G.H. Optimization study on bottom blowing process in EAF. Steelmaking 2013, 29, 28–30. [Google Scholar]
- Dong, K.; Zhu, R.; Liu, W.J. Bottom-blown Stirring Technology Practiced in Consteel EAF. Adv. Mater. Res. 2011, 361, 639–643. [Google Scholar] [CrossRef]
- Wei, G.S.; Zhu, R.; Dong, K.; Ma, G.H.; Cheng, T. Research and Analysis on the Physical and Chemical Properties of Molten Bath with Bottom-Blowing in EAF Steelmaking Process. Metall. Mater. Trans. B 2016, 47, 3066–3079. [Google Scholar] [CrossRef]
- Liu, F.H.; Zhu, R.; Dong, K.; Bao, X.; Fan, S.L. Simulation and Application of Bottom-Blowing in Electrical Arc Furnace Steelmaking Process. ISIJ Int. 2015, 55, 2365–2373. [Google Scholar] [CrossRef] [Green Version]
- Ma, G.H.; Zhu, R.; Dong, K.; Li, Z.Z.; Liu, R.Z.; Yang, L.Z.; Wei, G.S. Development and application of electric arc furnace combined blowing technology. Ironmak. Steelmak. 2016, 43, 594–599. [Google Scholar] [CrossRef]
- Suh, D.W.; Kim, N.J. Low-density steels. Scr. Mater. 2013, 68, 337–338. [Google Scholar] [CrossRef]
- Zuazo, I.; Hallstedt, B.; Lindahl, B.; Selleby, M.; Soler, M.; Etienne, A.; Perlade, A.; Hasenpouth, D.; Massardier-Jourdan, V.; Cazottes, S.; et al. Low-Density Steels: Complex Metallurgy for Automotive Applications. JOM 2014, 66, 1747–1758. [Google Scholar] [CrossRef]
- Feng, X.; Liang, F. Density of Liquid Steel over Temperature Range of 1803–1873 K. J. Iron. Steel Res. Int. 2004, 11, 37–40. [Google Scholar]
- Zhao, S.; Wei, D.L.; Xu, J.H.; Chen, H.; Li, Z. Influence of Steel Strip-Feeding Process on Density and Segregation of Casting Ingot. Mater. Sci. Forum 2016, 872, 45–49. [Google Scholar] [CrossRef]
- Hu, J.; Sun, B.L.; Li, C.W.; Xu, Y.; Wang, L. Numerical simulation of the influence of steel density change on the flow field in tundish. Energ. Metall. Ind. 2008, 6, 12–14. [Google Scholar]
- Nakanishi, H.; Nakazato, K.; Abe, K. Temperature dependence of the density of molten germanium and silicon measured by a newly developed Archimedian technique. J. Cryst. Growth 1999, 203, 75–79. [Google Scholar] [CrossRef]
- Huang, X.G. Molten Metal. Ferrous Metallurgy Theory, 4th ed.; Beijing Metallurgical Industry Press: Beijing, China, 2014; pp. 194–206. [Google Scholar]
- Roscoe, R.; Bainbridge, W. Viscosity Determination by the Oscillating Vessel Method II: The Viscosity of Water at 20 °C. Proc. Phys. Soc. 1958, 72, 585. [Google Scholar] [CrossRef]
- Hermann, S.; Frohberg, M.G.; Eberhard, S. Untersuchungen über wechselseitige Aktivitätseinflüsse in homogenen metallischen Mehrstofflösungen. Steel Res. Int. 1963, 34, 37–42. [Google Scholar]
- Morita, Z.I.; Iida, T. Viscosity of molten iron and steel. Iron Steel 1982, 2, 54–61. [Google Scholar]
- Wei, G.S.; Zhu, R.; Yang, L.Z.; Dong, K.; Liu, R.Z. Modeling on impact zone volume generated by coherent supersonic jet and conventional supersonic jet. J. Iron. Steel Res. Int. 2018, 25, 681–691. [Google Scholar] [CrossRef]
- Guo, H.Z.; Zhao, P.; Wang, K.L.; Fu, J.; Ma, T.W. Numerical Calculation on Electromagnetic Stirring and Heat Transfer in DC-EAF Bath. J. USTB 1995, 17, 284–288. [Google Scholar]
- Chen, J.X. The Physical Properties of Iron and Steel. Manual of Chart Data for Steelmaking, 2nd ed.; Beijing Metallurgical Industry Press: Beijing, China, 2010; pp. 355–393. [Google Scholar]
- Yang, Z.S.; Yang, L.Z.; Cheng, T.; Chen, F.; Zheng, F.Q.; Wang, S.; Guo, Y.F. Fluid Flow Characteristic of EAF Molten Steel with Different Bottom-Blowing Gas Flow Rate Distributions. ISIJ Int. 2020, 60, 1957–1967. [Google Scholar] [CrossRef] [Green Version]
- ANSYS lnc. ANSYS FLUENT 18.2 User’ s Guide. 2018. Available online: https://www.ansys.com (accessed on 6 September 2018).
- Alam, M.; Irons, G.; Brooks, G.; Fontana, A.; Naser, J. Inclined Jetting and Splashing in Electric Arc Furnace Steelmaking. ISIJ Int. 2011, 51, 1439–1447. [Google Scholar] [CrossRef] [Green Version]
- Wei, G.S.; Zhu, R.; Wu, X.T.; Yang, L.Z.; Dong, K.; Cheng, T.; Tang, T.P. Study on the Fluid Flow Characteristics of Coherent Jets with CO2 and O2 Mixed Injection in Electric Arc Furnace Steelmaking Processes. Metall. Mater. Trans. B 2018, 49, 1405–1420. [Google Scholar] [CrossRef]
- Barella, S.; Gruttadauria, A.; Mapelli, C.; Mombelli, D. Critical evaluation of role of viscosity and gas flowrate on slag foaming. Ironmak. Steelmak. 2010, 39, 463–469. [Google Scholar] [CrossRef]
- Morales, R.D.; Rubén, L.G.; López, F. The Slag Foaming Practice in EAF and Its Influence on the Steelmaking Shop Productivity. ISIJ Int. 2007, 35, 1054–1062. [Google Scholar] [CrossRef]
- Wei, G.S.; Zhu, R.; Yang, S.F.; Wu, X.T.; Dong, K. Simulation and application of submerged CO2–O2 injection in EAF steelmaking: Combined blowing equipment arrangement and industrial application. Ironmak. Steelmak. 2021, 3, 1–9. [Google Scholar] [CrossRef]


| Physical Properties | Temperature (°C) | Carbon Content (%) | Silicon Content (%) | Viscosity (Pa·s) | Density (g/cm3) |
|---|---|---|---|---|---|
| Point 1 (Melting stage) | 1140 | 2.581 | 0.3165 | 0.0113 | 6.900 |
| Point 2 (Early decarburization stage) | 1400 | 2.3259 | 0.0593 | 0.0069 | 6.662 |
| Point 3 (intermediate smelting stage) | 1500 | 1.132 | 0 | 0.0059 | 7.003 |
| Point 4 (Ending smelting stage) | 1650 | 0.1035 | 0 | 0.0049 | 6.912 |
| Materials | Slag | Argon |
|---|---|---|
| Density (kg/m3) | 3000 | Ideal-gas |
| Specific Heat (J/(kg·K)) | 1200 | 520.64 |
| Thermal Conductivity (W/m·K) | 1.2 | 0.0158 |
| Viscosity (kg/m·s) | 0.35 [15,31] | 2.125 × 10⁻⁵ (298.15 K) |
| Molar Mass (kg/mol) | 31.996 | 39.948 |
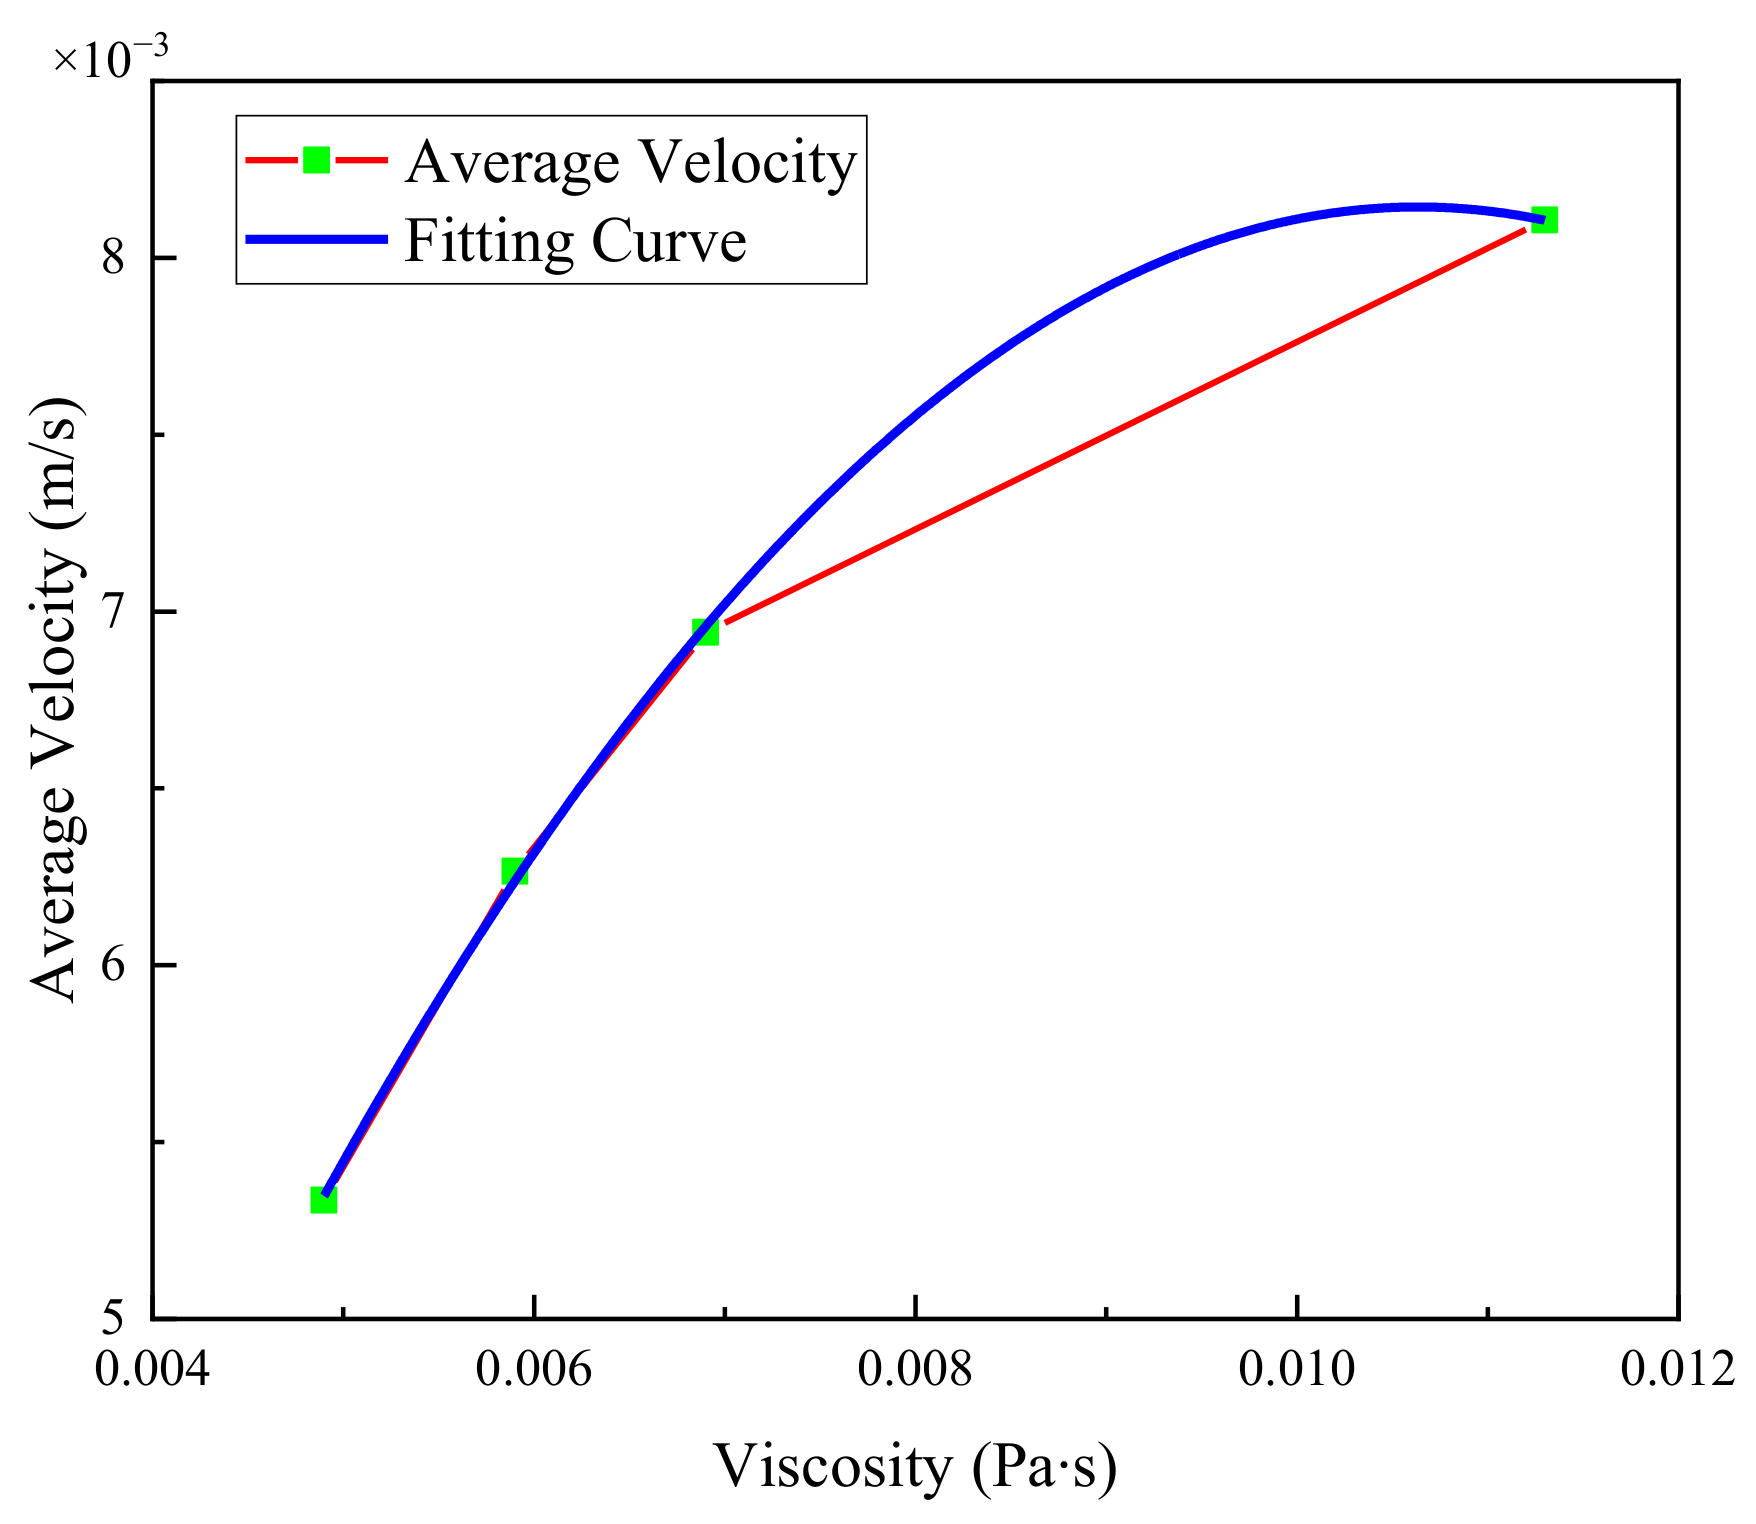
| Number of Smelting Stages | Average Flow Velocity of the Liquid Surface at the Corresponding Depth from the Slag–Steel Interface (×10−3 m/s) | Average value (×10−3 m/s) | |||||
|---|---|---|---|---|---|---|---|
| 0.1 m | 0.2 m | 0.3 m | 0.4 m | 0.5 m | 0.6 m | ||
| 1 | 10.970 | 9.422 | 8.448 | 7.550 | 6.913 | 6.499 | 8.107 |
| 2 | 7.517 | 7.392 | 7.277 | 6.815 | 6.554 | 6.306 | 6.941 |
| 3 | 7.797 | 7.078 | 6.452 | 5.915 | 5.659 | 5.367 | 6.266 |
| 4 | 7.018 | 5.883 | 5.383 | 4.961 | 4.799 | 4.518 | 5.336 |
| Instruments | Parameters |
|---|---|
| HH-2J magnetic stirring water bath | Power supply and heating power: 220 V 50 HZ, 600 W; Constant temperature range: room temperature 40–90 °C; Temperature accuracy: ≤ ±0.5 °C; |
| ACO (Air Compression Operation) series electromagnetic air pump | Power supply and heating power: 220 VAC/50 HZ, 35 W; Displacement: 40 L/min |
| Mass flowmeter | Variable flow adjustment, the flow rate of this experiment is constant at 1 L/min. |
| Transparent acrylic plexiglass tube mold | Wall thickness: 5 mm |
| Temperature | Number of Experiments | Average Value (s) | ||||||
|---|---|---|---|---|---|---|---|---|
| 1 | 2 | 3 | 4 | 5 | 6 | 7 | ||
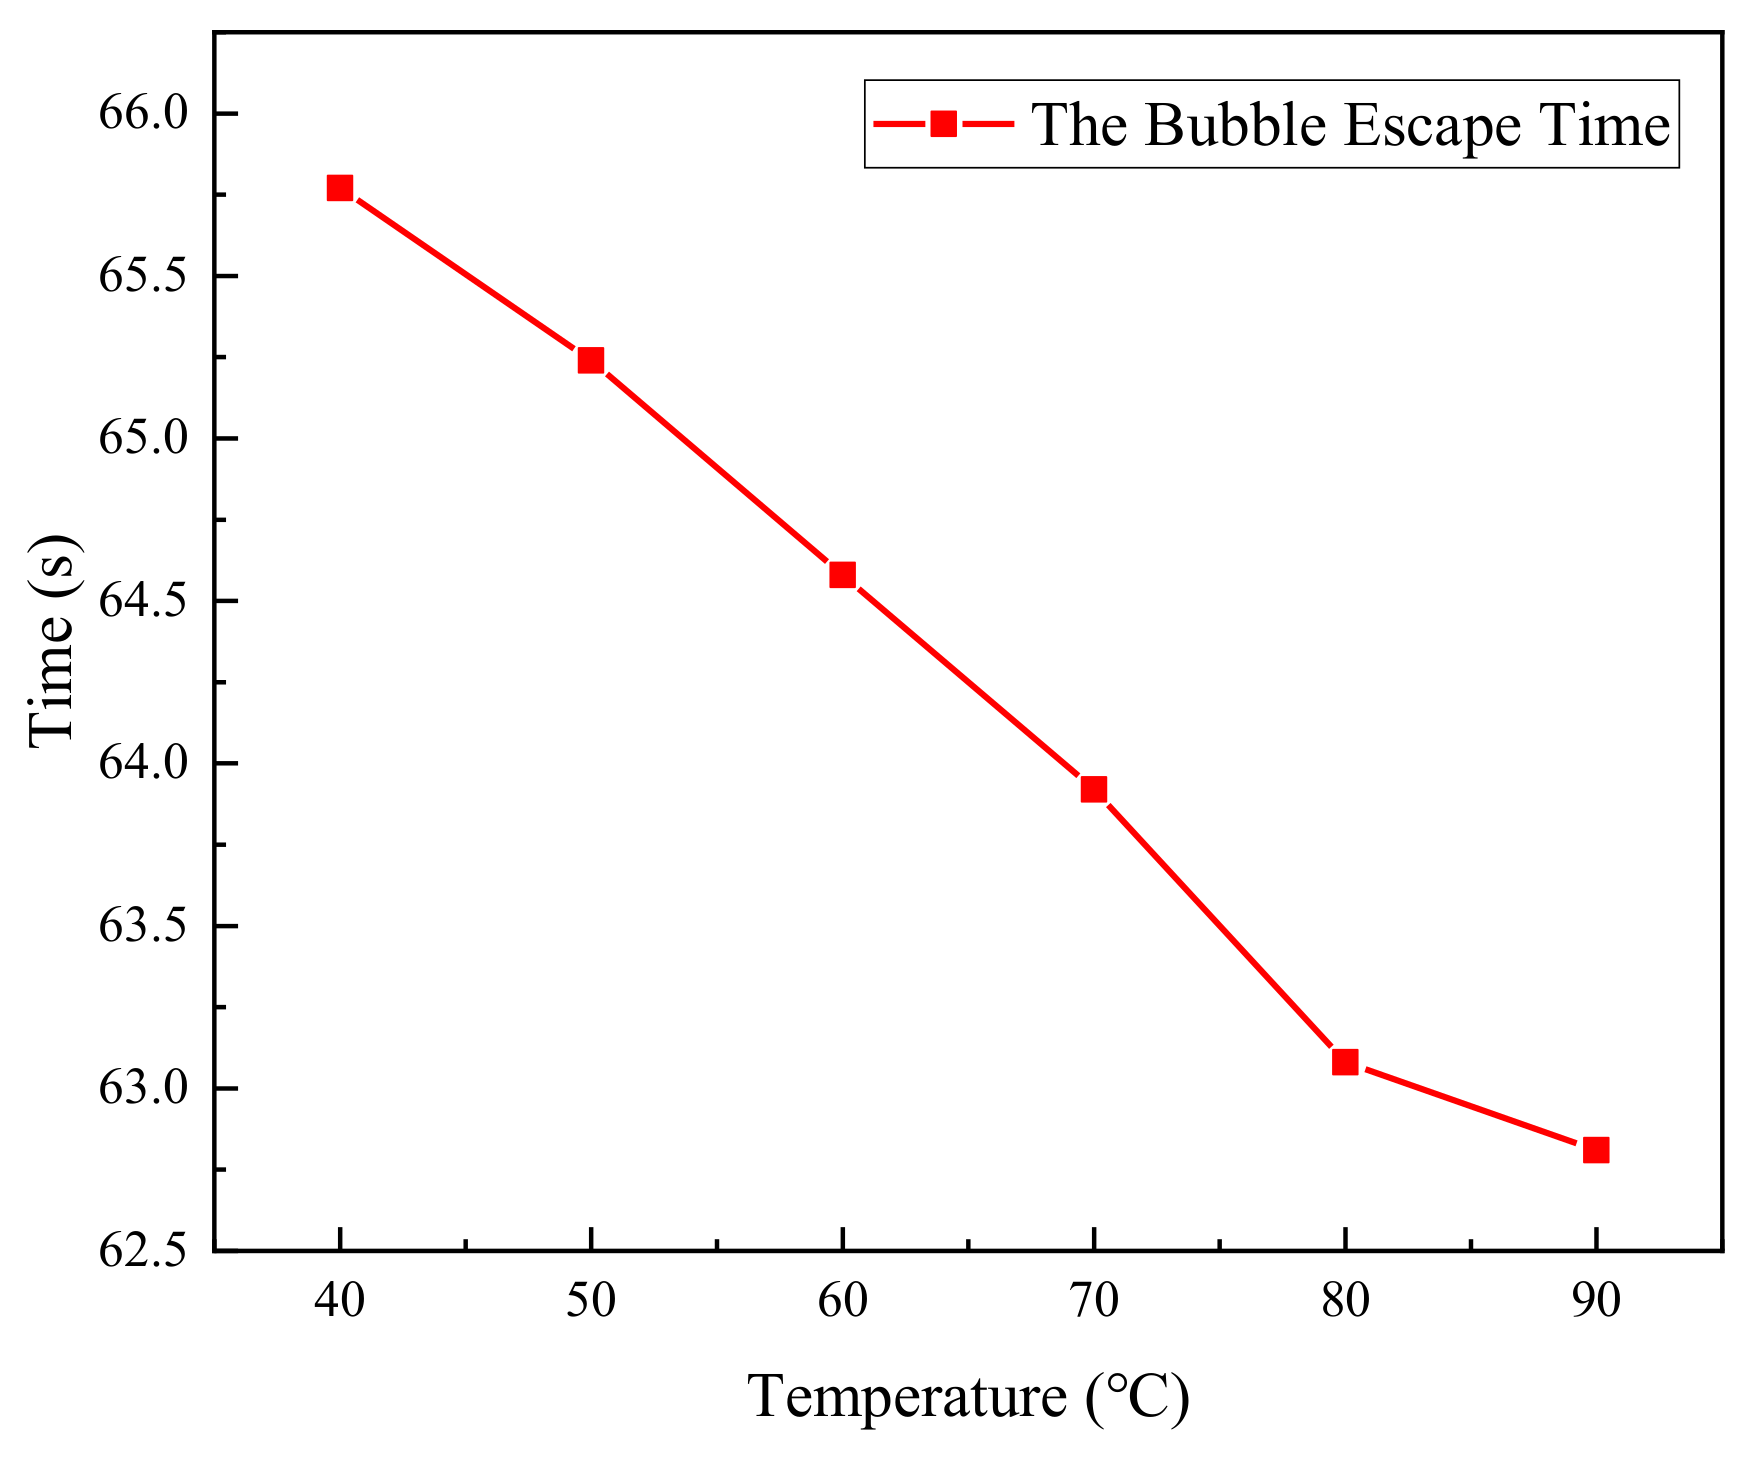
| 40 °C | 66.40 | 66.55 | 66.63 | 64.46 | 65.26 | 64.72 | 65.94 | 65.77 |
| 50 °C | 64.99 | 65.31 | 65.40 | 65.10 | 64.65 | 65.48 | 65.42 | 65.24 |
| 60 °C | 65.49 | 64.31 | 64.53 | 64.24 | 64.46 | 65.36 | 64.23 | 64.58 |
| 70 °C | 64.43 | 64.03 | 64.06 | 64.33 | 63.62 | 63.53 | 63.56 | 63.92 |
| 80 °C | 63.05 | 63.07 | 63.25 | 62.86 | 63.44 | 63.17 | 60.28 | 63.08 |
| 90 °C | 62.79 | 63.07 | 62.46 | 62.27 | 63.21 | 62.87 | 62.86 | 62.81 |
| Temperature | Variance | Standard Deviation | Confidence | Confidence Interval |
|---|---|---|---|---|
| 40 °C | 0.599 | 0.774 | 0.95 | (65.096, 66.452) |
| 50 °C | 0.036 | 0.190 | 0.95 | (65.077, 65.411) |
| 60 °C | 0.203 | 0.451 | 0.95 | (64.185, 64.975) |
| 70 °C | 0.105 | 0.324 | 0.95 | (63.636, 64.204) |
| 80 °C | 0.022 | 0.147 | 0.95 | (62.951, 63.209) |
| 90 °C | 0.049 | 0.222 | 0.95 | (62.616, 63.004) |
Publisher’s Note: MDPI stays neutral with regard to jurisdictional claims in published maps and institutional affiliations. |
© 2021 by the authors. Licensee MDPI, Basel, Switzerland. This article is an open access article distributed under the terms and conditions of the Creative Commons Attribution (CC BY) license (https://creativecommons.org/licenses/by/4.0/).
Share and Cite
Hu, H.; Yang, L.; Guo, Y.; Chen, F.; Wang, S.; Zheng, F.; Li, B. Numerical Simulation of Bottom-Blowing Stirring in Different Smelting Stages of Electric Arc Furnace Steelmaking. Metals 2021, 11, 799. https://doi.org/10.3390/met11050799
Hu H, Yang L, Guo Y, Chen F, Wang S, Zheng F, Li B. Numerical Simulation of Bottom-Blowing Stirring in Different Smelting Stages of Electric Arc Furnace Steelmaking. Metals. 2021; 11(5):799. https://doi.org/10.3390/met11050799
Chicago/Turabian StyleHu, Hang, Lingzhi Yang, Yufeng Guo, Feng Chen, Shuai Wang, Fuqiang Zheng, and Bo Li. 2021. "Numerical Simulation of Bottom-Blowing Stirring in Different Smelting Stages of Electric Arc Furnace Steelmaking" Metals 11, no. 5: 799. https://doi.org/10.3390/met11050799