Article

Consideration of Magnetic Measurements for Characterisation of Ferrite–Martensite Commercial Dual-Phase (DP) Steel and Basis for Optimisation of the Operating Magnetic Field for Open Loop Deployable Sensors

Advanced Steel Research Centre, WMG, University of Warwick, Coventry CV4 7Al, UK
*
Author to whom correspondence should be addressed.
Metals 2021, 11(3), 490; https://doi.org/10.3390/met11030490
Submission received: 16 February 2021 / Revised: 8 March 2021 / Accepted: 9 March 2021 / Published: 16 March 2021
(This article belongs to the Special Issue FaSTeP: Faultless Steel Production and Manufacturing)

Abstract

:
The magnetic properties of commercial dual-phase (DP) steels (DP600, DP800 and DP1000 grades) were evaluated using initial permeability, incremental permeability and coercivity and correlated with the key microstructural differences between the grades. The ferrite grain sizes and ferrite fractions have been compared with the magnetic parameters obtained from minor and major magnetisation loops within each DP grade. It has been revealed that the incremental permeability increases with the applied magnetic field amplitude to reach a peak and then drops at a higher magnetic field, with the values being different for the three DP grades at a lower field and converging to a similar permeability value at the high field. The effects of ferrite grain size and phase fraction on the incremental permeability are considered, and it has been shown that the influence of ferrite grain boundaries on magnetic permeability is more dominant than the effect of ferrite fraction in commercial DP steel samples. An analysis of the correlation between coercivity and initial permeability with tensile strength shows that the initial permeability provides a slightly better prediction of strength for the steels examined, which is believed to be due to the fact that a combination of reversible and irreversible domain components affect the coercivity value, while the initial permeability is predominantly affected by reversible domain movements. Based on the trend between incremental permeability and applied magnetic field and the commercial EM sensor (EMspec) operating parameters, the effect of lift-off and hence magnetic field strength on the sensitivity to DP steel properties can be assessed.

1. Introduction

Dual-phase (DP) steels are generally characterised by a continuous soft ferrite matrix and small islands of martensite (tempered martensite and/or bainite). The soft ferrite matrix provides a good ductility with continuous yielding behaviour, and the hard phase particles give a relatively large tensile strength. An improved combination of toughness and strength makes dual-phase (DP) steels more attractive for the automotive industry, including usage in the bodyside inner/outer, bumper and other automotive applications [1]. The mechanical properties of dual-phase (DP) steel are highly affected by its microstructural features, in particular phase fraction (ferrite/martensite) and grain size factor [1,2].
A considerable amount of literature has been published on the effect of martensite fraction on the mechanical behaviour of DP steels as it is one of the most significant microstructural features affecting performance. It has been observed that by increasing the volume fraction of martensite, the hardness, yield strength and ultimate tensile strength of DP steels increase while uniform and total elongation decrease [2,3].
The ferrite grain size also plays an important role on the mechanical properties of DP steel through the Hall Petch effect, where a decrease in grain size results in an increase in strength. Hall Petch strengthening from ferrite grain size refinement will have a larger effect in DP600 steel, due to the higher volume fraction of ferrite, than in DP800 steel or DP1000 steel. In order to predict the mechanical properties from the microstructure in DP steels, phase determination (e.g., volume fraction of martensite) and ferrite grain size are both very important.
In recent years, the use of magnetic methods for nondestructive evaluation/characterisation of steels has increased rapidly [4,5,6,7,8]. For ferromagnetic materials, the interaction between lattice imperfections and Bloch walls is reasonably well explained [9], and characteristic magnetic flux density (B)–magnetic field strength (H) curves are detected. Major hysteresis loop properties such as permeability, coercivity, remanence and saturation magnetisation are employed to evaluate the magnetic properties of a material, which in turn represents material mechanical properties (e.g., strength or hardness) [10,11,12]. Besides these major loop parameters, additional information can be obtained from minor loop deviations from the initial magnetisation curve or/and major hysteresis loops. Although the major loop and minor loop both involve the measurement of magnetic flux density (B) in response to an applied magnetic field strength (H), the processes of domain wall movement or domain rotation can be different. A combination of irreversible and reversible components can be seen in the major loop; irreversible magnetisation changes come from irreversible magnetisation vector rotations and domain wall motion past pinning features, while the reversible changes are due to reversible magnetisation vector rotations and domain wall bowing around pinning sites [13]. In contrast, the minor loop magnetisation is generated by a small applied magnetic field which is predominantly reversible [13].
There are different EM techniques (measurement of different magnetic parameters) available for characterising and/or monitoring microstructure and properties for DP steel. For instance, the Impulse Magnetic Process Online Controller (IMPOC) system is based on magnetisation with a very strong field (e.g., 20 kA/m) and measurement of the amount of residual magnetisation in the sample which is correlated with the yield or tensile strength of the material that is, for example, measured online in cold strip mills [14]. The EMspec system measures the complex impedance, which is approximately proportional to the low-field relative magnetic permeability of the material (around 400 A/m). The EMspec system is used for phase transformation monitoring during cooling after hot rolling in the run-out table (ROT) of a hot strip mill [15]. While there are some empirical equations to link the magnetic measurements to the mechanical properties (e.g., coercivity can be related to strength), not all commercial or laboratory EM sensors measure coercivity. Therefore, it is important to consider how well the different magnetic properties that can be measured characterise DP steel and to compare the sensitivity of those parameters (i.e., coercivity and permeability) to microstructure features.
There have been many investigations on the empirical relationships between minor/major loop measurements and the assessment of mechanical properties such as hardness and tensile strength (UTS) [10,11,12] or minor/major loop to assess grain size and precipitates [6] as an inspection method for the cold rolling process [16,17] and creep detection [18]; however, few studies are available on detailed correlations between the measured magnetic permeability at different applied magnetic fields and the sensitivity to different microstructural features.
The main novelty of the present work is to use the incremental permeability and coercivity as two different magnetic parameters to correlate with the mechanical property (tensile strength) of DP steel and examine the sensitivity of these two methods, both of which are used commercially by online sensor systems. In addition, to optimise the sensitivity of the measurement, the incremental permeability–magnetic field data can be considered rather than using a single magnetic field value, which may provide better sensitivity to microstructure and hence mechanical properties for DP steels.

2. Materials and Methods
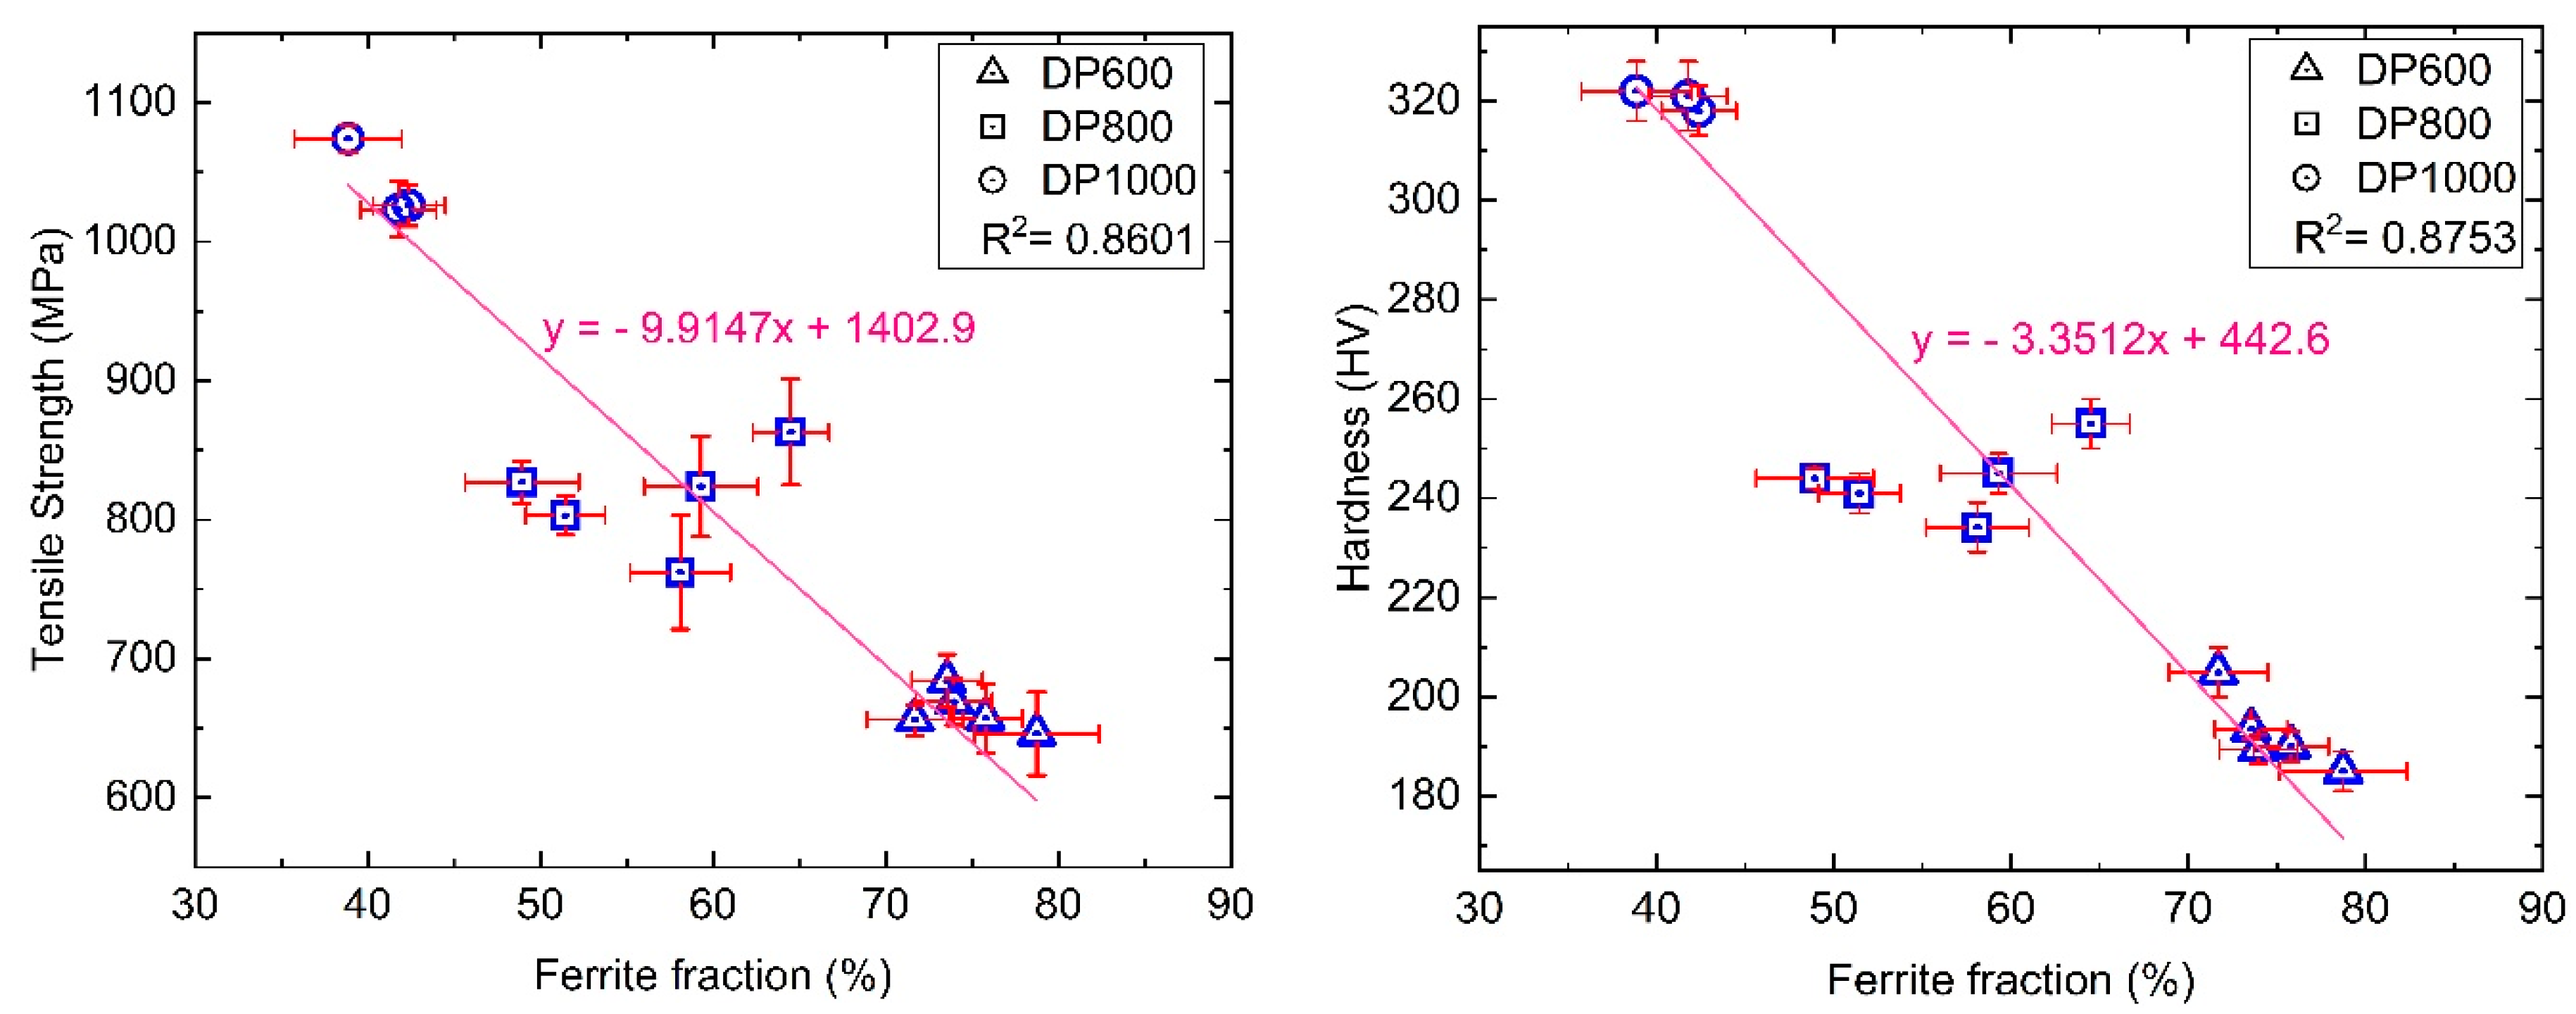
The steels chosen for this study were a number of commercial dual-phase (DP) steels, DP600, DP800 and DP1000 of varying thicknesses (1 to 4 mm), supplied by Tata Steel Europe. Metallographic samples were polished to a 0.05 µm final surface finish and then etched in 2% Nital. The optical microstructure was characterised (magnification of X400 from different locations for each DP sample) using a Nikon ECLIPSE LV150N optical microscope (Nikon, Tokyo, Japan), and ferrite/martensite phase balances of the samples were analysed using “Image J” software (V1.53d, LOCI, University of Wisconsin, USA). The mean linear intercept method was used to measure the ferrite grain size on the optical micrographs taken at a magnification of X500. Vickers hardness measurements were made with a Wilson VH1202 using a 500 g load on polished samples by taking the average of ten measurements for each sample. Uniaxial tensile tests were performed on flat tensile specimens of 80 mm gauge length and 20 mm gauge width using a Static Instron 100 kN testing machine at a strain rate of 0.002 s−1.
A BH loop measurement system (lab-based closed magnetic circuit), developed at the University of Manchester [19,20], was employed to measure minor and major BH loops. This BH loop measurement system enables application of a magnetic field strength (H) of any selected range of amplitude (up to 25 kA/m) within a predefined power limit (percentage of maximum power) and calculates the applied magnetic field (H) and magnetic flux density (B) in a test sample. In this technique, a current with a frequency of 1 Hz is applied to the generation coils wrapped around the silicon steel core with a slot to maximise coupling between the core and the sample. The magnetic flux density of the induced field (B) was measured using a 40-turns encircling coil of 0.16 mm insulated copper, and the axial magnetic field (H) was measured using a Hall sensor (with a sensitivity of 0.16 mV/mA·mT).
Five rectangular samples with a length of 49.3 ± 0.6 mm, a width of 4.9 ± 0.7 mm and the same thickness as the supplied strip sheets were prepared. The magnetic incremental permeability (µ) is defined as the magnetic behaviour of the material around the operating point with an extremely small magnetisation by measuring the ratio of the variation in induced magnetic flux density (ΔB) and the corresponding change in the applied magnetic field (ΔH), scaled with respect to the permeability of free space (µ0) (see Equation (1)).
The initial permeability is derived from the incremental permeability term at zero field (see Equation (2)).
µΔ = ΔB/(µ0·ΔH)
µ i = lim Δ H 0 µ Δ

3. Microstructure

The microstructure of the DP600, DP800 and DP1000 steels consists of isolated regions of martensite (and/or bainite, tempered martensite) within a ferrite matrix as shown in Figure 1.
Different ratios of martensite (and/or bainite, tempered martensite) to ferrite are present in the different grades of DP steels, used to give the different strength levels. Table 1 gives values for ferrite fraction, ferrite grain size, tensile strength (UTS) and hardness in commercial DP steel.
The decrease in tensile strength/hardness of dual phase steel (DP) with increasing ferritic fraction is well known and broadly discussed [21]. The tensile strength (UTS)/hardness decreases linearly with increasing ferrite volume fraction in DP steels, as shown in Figure 2.
The trends stem mostly from the composite effect due to the presence of hard isolated regions in a soft matrix. The correlation coefficients for the best-fit equation are R2HV = 0.8753 and R2UTS = 0.8601 for hardness and tensile strength, respectively. From Figure 2, it can be observed that, whilst the different grades group into data clusters, there is much more scatter for the DP800 steel grades than the other samples, which has been described elsewhere [8], and there is potential for overlap in the ferrite fraction between the grades, indicating that a fraction of ferrite alone is not a good indicator to characterise the grade or mechanical properties in the DP steel samples.

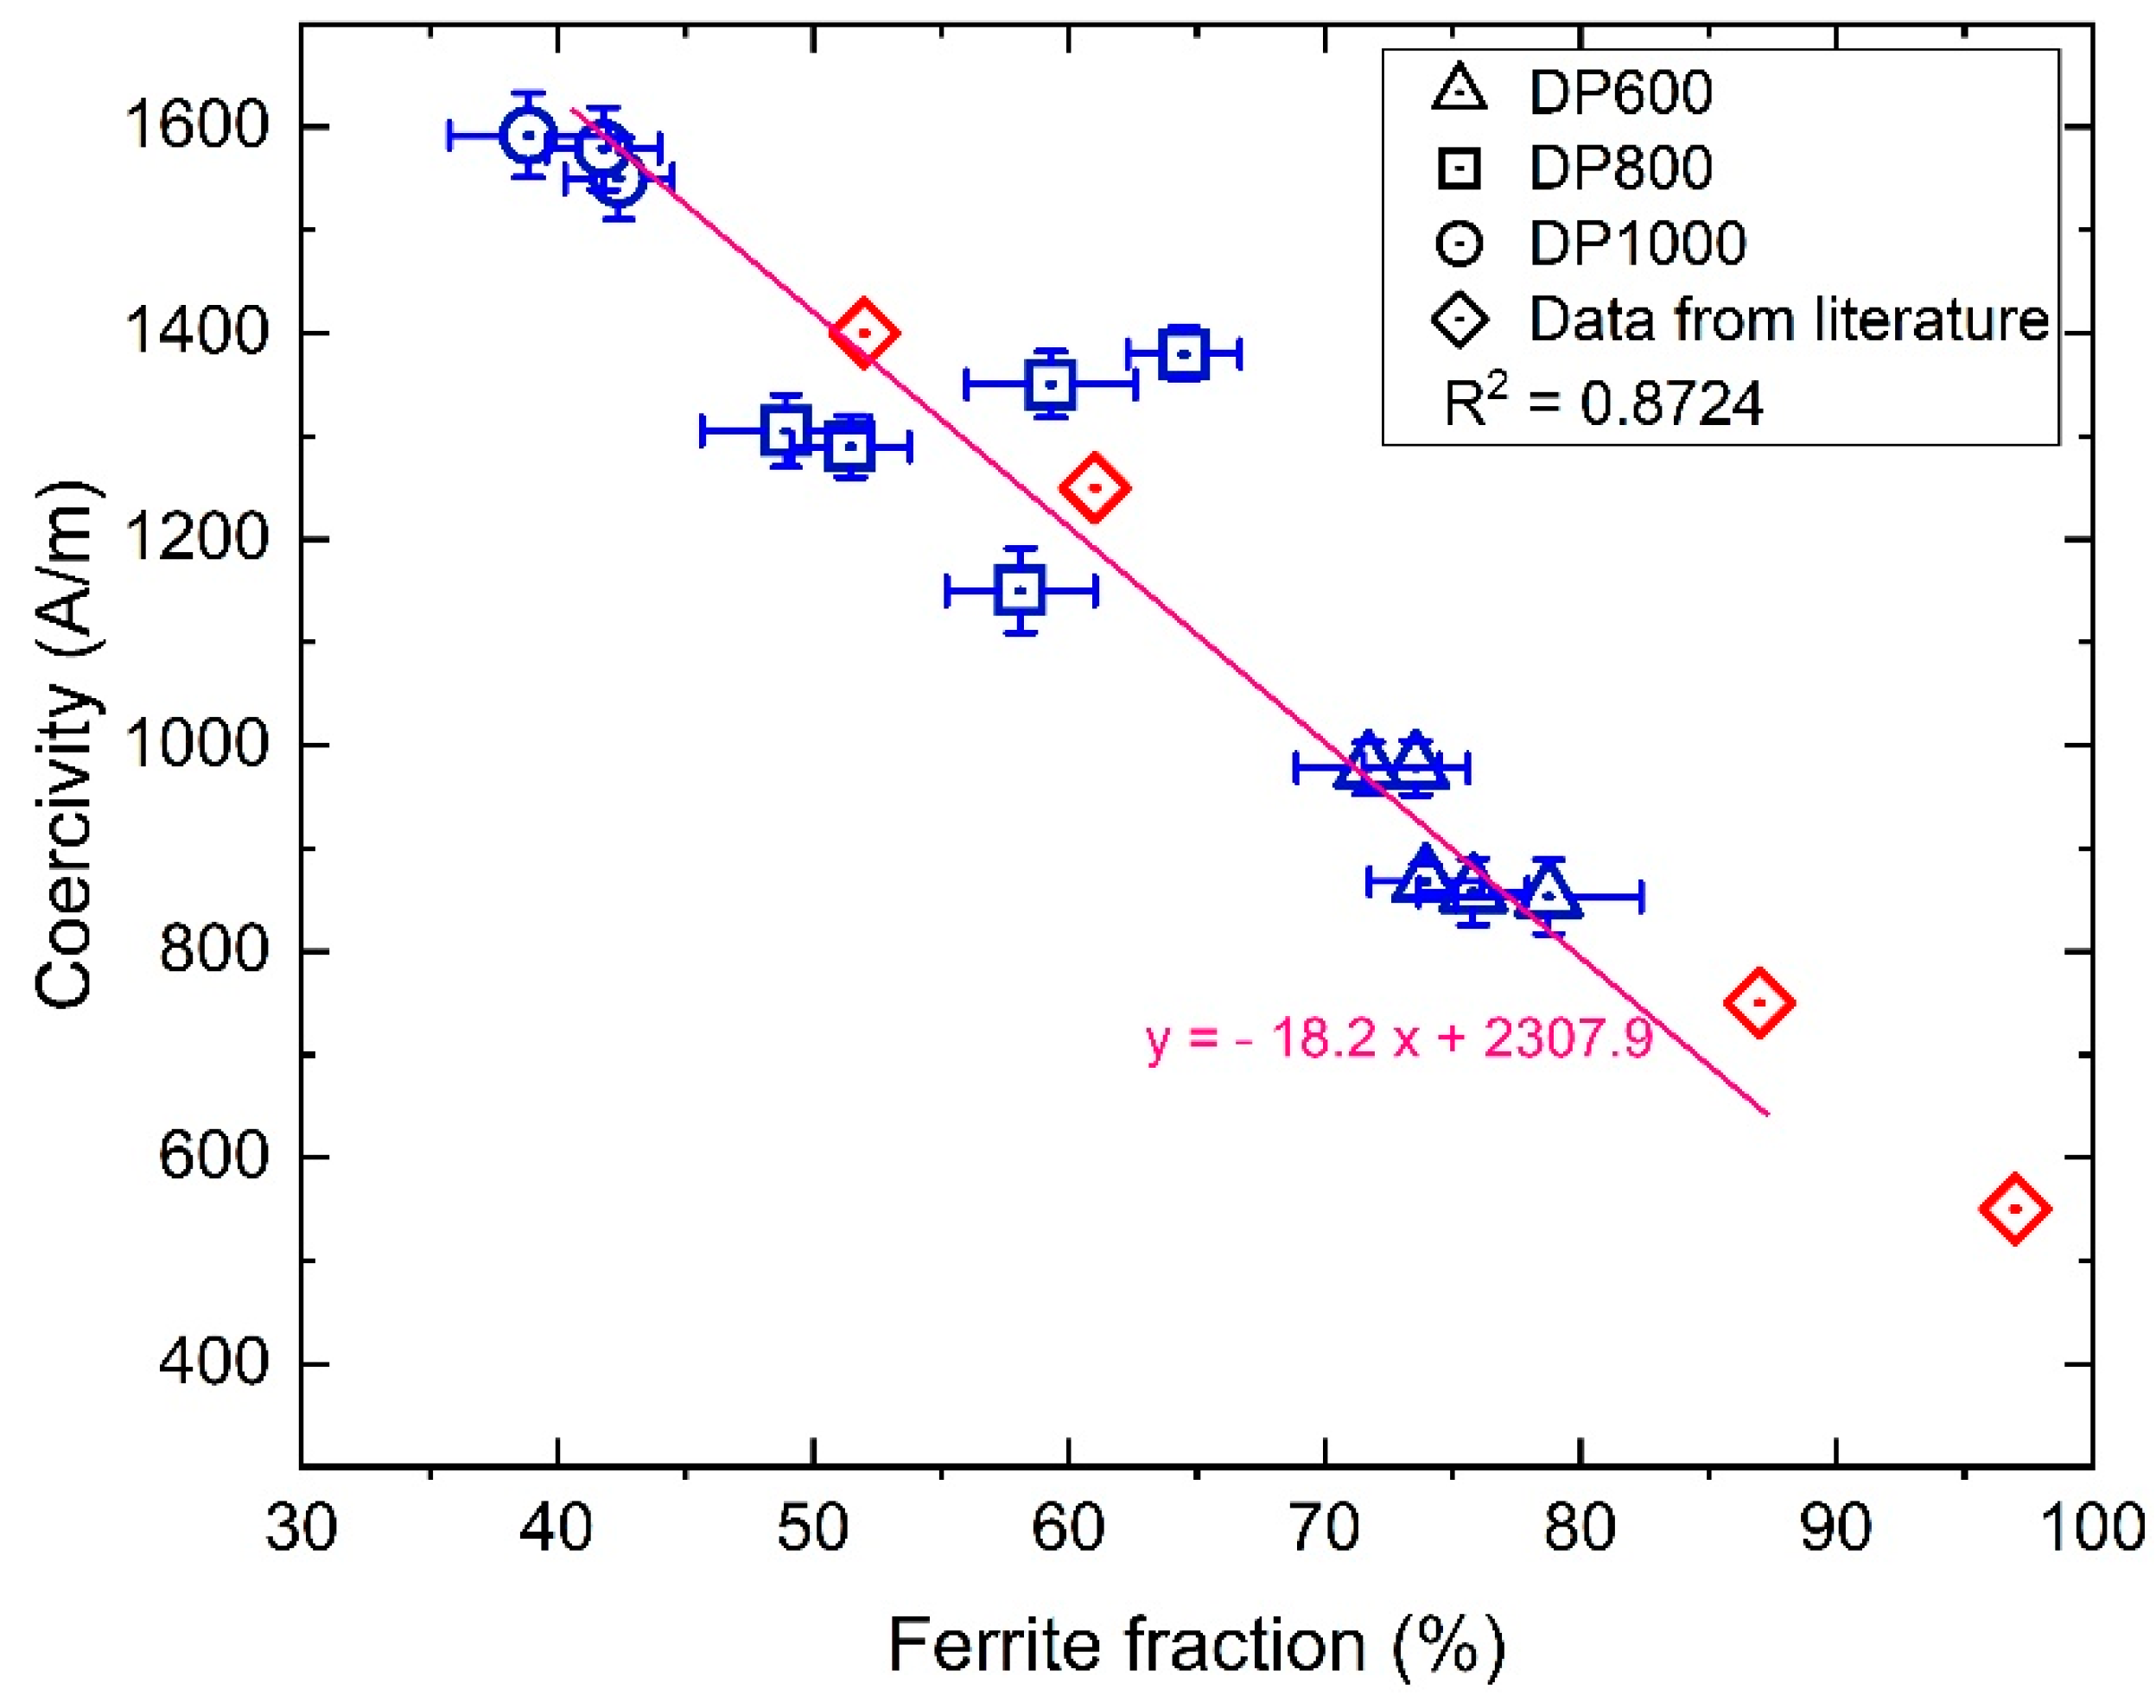
4. Magnetic Properties of Commercial DP Steels

4.1. Major BH Loop Measurements

The major loops and the initial magnetisation curves are illustrated in Figure 3 for the commercial DP600, DP800 and DP1000 steel samples. As it can be clearly seen from Figure 3, different commercial DP steels represent different BH loop curves. The measured coercivity and initial permeability values, obtained from the major BH loop, are given in Table 2.
Figure 4 shows the coercivity values in comparison to the ferrite fraction values for the steels examined in this work and from the literature. The results, an approximately linear decrease in coercivity with ferrite fraction, is in agreement with that reported in the literature [22].
The highest value of coercivity is seen in the DP1000 samples which have a higher volume fraction of martensite. The martensitic areas have a high dislocation density as well as a large number of lath boundaries and carbides (from any autotempered martensite/bainite present); therefore, higher fields are required to achieve the demagnetised state. The value of coercivity shows a reduction in DP800 steels in comparison to the DP1000 steels and a further reduction in DP600 steels due to their higher volume fraction of ferrite rather than the martensite (or bainite) fraction. From Figure 4, much more scatter for the DP800 grades than the other steels is again observed. This is believed to be due to the magnetic properties also being influenced by the ferrite grain size as the grain boundaries act as effective pinning points to magnetic domain movement and there is more variation in the ferrite grain size for the DP800 steels (66% difference) compared to the DP600 steels (50% difference) and the DP1000 steels (28% difference); see Table 1 [8,10].
Figure 5 shows a clear link between tensile strength (UTS) and coercivity for the commercial DP steel samples; this also agrees with reports in the literature, and literature data [12] are included to show the general trends. The tensile strength values (UTS) show a strong correlation with the coercivity, an approximately linear increase in tensile strength with higher coercivity for the DP steel commercial samples. It is worth mentioning that Figure 5 is fitted with a straight line; however, if the literature data are removed, the fit is a polynomial (y = 0.0006x2 − 1.025x + 1065.7).

4.2. Minor Loop Measurements

Incremental Permeability from Amplitude Sweep

The major loop is obtained by sweeping the applied field beyond the saturation field which accounts for reversible and irreversible domain processes, whilst the minor loops are obtained when the cycle is limited to fields near and below the saturation field corresponding to predominantly reversible magnetic domain interactions.
The fundamental assumptions of the domain theory and hysteresis mechanism models of Kondorsky [23], Becker and Doring [24] and [23] Kersten [25] explain that in the demagnetised state, since the domain walls do not experience any net force tending to move them, there is no reason for bending and they are rigid and planar.
Under the action of a magnetic field when the domain walls bend while being held, for example on two pinning features, this represents a reversible process in magnetisation. The irreversible process occurs when a domain wall either encounters another nearby effective pinning feature or it has sufficiently expanded to enable depinning and breaking away from the present pinning features and the domain wall moves discontinuously [23,24,25].
Three factors, including the strength of the pinning features, the domain wall surface energy and the applied magnetic field, affect the amount of domain wall bending behaviour. The strength of the pinning features and the domain wall surface energy are intrinsic and dependent on the properties of the material (e.g., microstructural features), whereas the applied magnetic field is an extrinsic factor [26,27]. Sufficient driving force needs to be provided under the applied magnetic field to give a domain wall potential to move and overcome the pinning regions.
Assuming fPin is the pinning strength to domain walls, a minimum applied magnetic field Ha required to enable a domain wall (DW) to just overcome the pinning sites of a microstructure [28], then there is a possibility to characterise the microstructural features such as grain size, phase fraction and precipitates by correlating with the fPin distribution in a microstructure [28]. For any magnetic field, Ha, smaller than fPin (Ha < fPin), the predominant domain process is 180° DWs oscillating between the microstructural features that are effectively pinning DWs [26,27,28]. In this connection, for a given amplitude increment ΔHa it is expected that the number of depinned sites proportionally rises [28]. With an applied magnetic field, Ha higher than fPin (Ha > fPin), the microstructural features will be passed through by the DWs.
A series of minor loops with different magnetic field amplitudes ranging from approximately 150 to 2000 A/m, taking the DP600CR (1.4 mm) sample as an example can be seen in Figure 6.
The magnetic field amplitude influences the shape of the minor loops, as it is illustrated in Figure 6, it shows a lenticular shape at a small field amplitude as in Figure 6b, and at a higher field amplitude it shows a sigmoid shape as in Figure 6c,d.
The measured initial permeability and coercivity values (see Table 2) are inversely related to each other so that samples with high coercivity have a low permeability and vice versa.
Figure 7 illustrates the incremental permeability measurements from the minor loop amplitude for each steel sample. It can be seen that the incremental permeability curves follow a similar pattern; all curves rise proportionally with the applied magnetic field amplitude (H), obtaining a peak (i.e., maximum incremental permeability) which is very close to the coercivity values, then curves gradually fall at a higher applied magnetic field and converge to a similar permeability value. However, the peak position and the initial/final gradient for the samples are different and would allow them to be distinguished from each other. For instance, the curves of the DP600 samples are characterised by narrow peaks with a high gradient, whilst for the DP800 steels the peaks shift to the right with lower gradients, with a further shift to the right and lower gradients (broad curves) for the DP1000 samples.
Polynomial fitting has been employed to extrapolate values of the initial permeability from the incremental permeability (i.e., minor loop amplitude) at H = 0. Figure 8 displays a strong effect of ferrite fraction on the permeability as has been seen previously [7]. It would be worth mentioning that initial permeability values are not reported in the literature which is why they are not included in Figure 8. It can be seen from Figure 8 that there is an increase in the initial permeability value as the ferrite fraction increases; hence, the initial permeability value of these samples shows an increasing order of DP1000 < DP800 < DP600. The correlation coefficients for the best-fit line, R2μi = 0.8602, is low as the effect of grain size on permeability is not taken into account, which has been described elsewhere [8,29]. In summary, higher permeability values can be observed in the DP600HR4 mm with a larger ferrite grain size (10 µm) than the other DP600 samples (ferrite grain size of 6–7 µm), and lower permeability values are observed in the DP800 samples with the smaller ferrite grain size (3 µm) compared to the ferrite grain size of 5–6 µm for the rest of DP800 samples. This indicates that ferrite grain size affects the magnetic property (i.e., permeability) in dual-phase (DP) steels as well as the ferrite fraction which has also been reported/documented by other researchers [29]. This is believed to be due to the ferrite grain size influencing the magnetic properties in low carbon steels as the grain boundaries act as obstacles to magnetic domain wall motion [10,11,30]. Therefore, for characterisation of DP steels, ferrite fraction and ferrite grain size need to be considered as both influence the permeability in the commercial DP steels.
In addition, from Figure 7, considering the incremental permeability–magnetic field curves, it is apparent that the DP600HR4 mm steel sample shows higher permeability values than the other steels and that this appears to be more associated to the ferrite grain size rather than ferrite fraction; i.e., similar incremental permeability values occur for the DP600 CR1 mm and DP600 CR1.5 mm samples, which have 72–76% ferrite fraction, with maximum values of the incremental permeability, µInc = 520 and 560, whilst the DP600 HR4 mm sample, with only a slightly larger ferrite fraction (79%), shows a significantly higher incremental permeability peak (µInc = 690). Another point to mention is that the martensitic/bainitic lath boundaries also act as obstacles to magnetic domain wall motion in DP steel. Compared to ferrite grain boundaries, which are high-angle boundaries, the martensite/bainite lath boundaries are typically low angle [31] and will have less strong pinning features than ferrite grain boundaries. Therefore, decreasing ferrite grain size gives rise to more effective boundaries which corresponds to more strong pinning features. Therefore, for this range of ferrite grain size (7–10 µm) and range of ferrite fraction (74–79%), the influence of ferrite grain boundaries on permeability is more dominant than the effect of ferrite/martensite fraction.
A similar scenario occurs for the commercial DP800 samples, where at a very low magnetic field (e.g., 100 A/m) the permeability values of samples are very close. The maximum incremental permeability (i.e., the peak) in the sample with a relatively larger ferrite grain size (5–6 µm) can be observed at a lower applied magnetic field with a higher gradient curve, whilst this peak in the samples with a smaller ferrite grain size (3 µm) is reached at a higher field with a broader curve. On the basis of the above statement, for varying the applied magnetic field, the grain size and ferrite fraction show different effects on the incremental permeability versus the magnetic field.
Figure 9 shows the correlation between the tensile strength and the initial permeability values for the commercial DP steel samples. It can be observed that the relationship is not linear; however, there is less scatter around the best-fit equation, particularly for the DP800 sample grades, than in Figure 8 where only ferrite fraction is correlated to permeability.
In addition, Figure 9 reveals that the correlation coefficient for the best-fit equation, R2μi = 0.9693, is very high which shows that magnetic initial permeability is a good measure to predict tensile strength (and hardness) for DP steel samples. Since both tensile strength and magnetic permeability are influenced by ferrite fraction and grain size, a strong correlation between tensile strength and permeability is established.
It should be emphasized that when there is more than one microstructural parameter affecting the mechanical and magnetic performance, their influence on magnetic permeability cannot be separated. It should be noted that besides the effect of ferrite grain size and phase fraction, other parameters such as inclusions, chemical composition differences [20] and precipitates [6] are less significant (in DP steels) on properties and can be considered as second-order influences after ferrite grain size and phase fraction for DP steel samples, and they will be similar for the steels considered in this work as the commercial DP steels have been processed under similar conditions.
The significance of these findings is how the information can be used in the design and use of electromagnetic sensors for industrial or laboratory applications (where full BH curves cannot easily be obtained from the open-loop systems). If a varying magnetic field can be applied to the sample, then knowledge of how the incremental permeability varies with field strength curves will enable operation conditions to be chosen that give maximum sensitivity to the microstructural differences between samples, or multiple field measurements could be taken that will provide more information than single field measurements. For instance, the EMspec system [32,33] could be operated at different lift-off values or operating currents which could result in a range of applied fields being experienced by the sample. The full sensor-sample model [32] available for the EMspec system means that calibration samples and optimization trials would not be required.
A case study has been included here to illustrate this point. If the EMspec system is operated at 40 mm lift-off to the steel strip (standard installation conditions for a hot strip mill), the magnetic field experienced in the strip is around 400 A/m, whereas if the lift-off is reduced to 20 mm, the applied field increases to 700 A/m. Considering Figure 7, the percentage difference in average incremental permeability between the DP600 and DP800 steels increases from 29% to 57%, and between the DP800 and DP1000 steels it increases from 22% to 55%. As the EMspec signal is directly related to the incremental permeability, then the sensitivity of the signal to differences in ferrite grain size and/or phase balance would increase, making the EMspec sensor suitable for inspection of DP steels and other steel grades where a large stand off to the steel strip and an open loop magnetic measurement system are preferred.

5. Conclusions

The detailed study of metallurgy and characteristic magnetic properties of commercial DP600, DP800 and DP1000 steel samples indicate that the magnetic properties of incremental permeability, initial permeability and coercivity are affected by both ferrite grain size and phase balance (i.e., ferrite-martensite/bainite fraction).
The magnetic permeability is influenced by microstructural features (e.g., phase fraction and grain size) as intrinsic parameters and/or extrinsic parameters (e.g., magnetic field strength). Although the incremental permeability curves for each sample follow a similar form (all curves rise proportionally with the applied magnetic field until reaching a peak and then curves gradually fall at a higher applied magnetic field and converge), different values/positions of the peak in permeability are seen for each grade of the DP samples. The narrow and higher peak of the DP600 samples is ascribed to the higher volume fraction of ferrite in DP600, associated with a significant increase in the mean free path for domain wall movement between pinning sites. For the DP800 samples, the peak shifts to a higher magnetic field value which is believed to be due to the increased number of pinning points (e.g., ferrite grain boundaries, ferrite-martensite/bainite boundaries, martensite/bainite lath boundaries and higher density of dislocations). A further shift to higher magnetic fields and the broader and lower permeability peak for the DP1000 samples indicate a broad distribution of pinning feature strengths, fPin, which in turn is associated with an expectedly broad spatial distribution of the pinning features. The convergent point, at high applied field amplitudes for all DP samples, can be regarded as the point at which the saturation state is approached and contributions from domain wall pinning features are reduced, giving way to reversible domain rotation effects.
The results reveal that initial permeability and coercivity can both be used as a reliable nondestructive measurement to characterise microstructural/property differences in DP steels. The correlation coefficient for the best-fit equations to tensile strength are R2Hc = 0.9412 and R2μi = 0.9693 for the coercivity and the initial permeability, respectively, suggesting the initial permeability is a slightly more sensitive magnetic parameter compared to the coercivity for discriminating/assessing the mechanical properties of DP steels.

Author Contributions

Conceptualisation, M.A.J. and C.D.; methodology, M.A.J.; formal analysis, M.A.J. and C.D.; investigation, M.A.J., L.Z. and C.D.; writing—original draft preparation, M.A.J.; writing—review and editing, L.Z. and C.D.; visualisation, M.A.J., L.Z. and C.D.; supervision, C.D.; project administration, C.D. All authors have read and agreed to the published version of the manuscript.

Funding

This research was funded by EPSRC and Tata Steel UK.

Acknowledgments

The authors greatly acknowledge Tata steel UK and the financial support of The Engineering and Physical Science Research Council (EPSRC) and Tata Steel UK for this work via an Industrial CASE PhD studentship.

Conflicts of Interest

The authors declare no conflict of interest.

References

  1. Kim, S.-J.; Cho, Y.-G.; Oh, C.-S.; Kim, D.E.; Moon, M.B.; Han, H.N. Development of a dual phase steel using orthogonal design method. Mater. Des. 2009, 30, 1251–1257. [Google Scholar] [CrossRef]
  2. Xu, X.; van der Zwaag, S.; Xu, W. The effect of martensite volume fraction on the scratch and abrasion resistance of a ferrite–martensite dual phase steel. Wear 2016, 348–349, 80–88. [Google Scholar] [CrossRef]
  3. Zhang, F.; Ruimi, A.; Wo, P.C.; Field, D.P. Morphology and distribution of martensite in dual phase (DP980) steel and its relation to the multiscale mechanical behavior. Mater. Sci. Eng. A 2016, 659, 93–103. [Google Scholar] [CrossRef]
  4. Davis, C.; Strangwood, M.; Peyton, A. Overview of non-destructive evaluation of steel microstructures using multifrequency electromagnetic sensors. Ironmak. Steelmak. 2011, 38, 510–517. [Google Scholar] [CrossRef]
  5. Haldane, R.J.; Yin, W.; Strangwood, M.; Peyton, A.J.; Davis, C.L. Multi-frequency electromagnetic sensor measurement of ferrite/austenite phase fraction—Experiment and theory. Scr. Mater. 2006, 54, 1761–1765. [Google Scholar] [CrossRef]
  6. Liu, J.; Wilson, J.; Davis, C.L.; Peyton, A. Magnetic characterisation of grain size and precipitate distribution by major and minor BH loop measurements. J. Magn. Magn. Mater. 2019, 481, 55–67. [Google Scholar] [CrossRef]
  7. Zhou, L.; Liu, J.; Hao, X.J.; Strangwood, M.; Peyton, A.J.; Davis, C.L. Quantification of the phase fraction in steel using an electromagnetic sensor. Ndt E Int. 2014, 67, 31–35. [Google Scholar] [CrossRef]
  8. Aghadavoudi-Jolfaei, M.; Shen, J.; Smith, A.; Zhou, L.; Davis, C. Non-destructive measurement of microstructure and tensile strength in varying thickness commercial DP steel strip using an EM sensor. J. Magn. Magn. Mater. 2019, 473, 477–483. [Google Scholar] [CrossRef]
  9. Miyazaki, T.; Jin, H. The Physics of Ferromagnetism; Springer Science & Business Media: Berlin, Germany, 2012; Volume 158. [Google Scholar]
  10. Thompson, S.; Tanner, B. The magnetic properties of pearlitic steels as a function of carbon content. J. Magn. Magn. Mater. 1993, 123, 283–298. [Google Scholar] [CrossRef]
  11. Thompson, S.; Tanner, B. The magnetic properties of specially prepared pearlitic steels of varying carbon content as a function of plastic deformation. J. Magn. Magn. Mater. 1994, 132, 71–88. [Google Scholar] [CrossRef]
  12. Tanner, B.K.; Szpunar, J.A.; Willcock, S.N.M.; Morgan, L.L.; Mundell, P.A. Magnetic and metallurgical properties of high-tensile steels. J. Mater. Sci. 1988, 23, 4534–4540. [Google Scholar] [CrossRef]
  13. Parker, G. Encyclopedia of materials: Science and technology. In Guide-Wave Optical Communications: Materials; Elsevier: Amsterdam, The Netherlands, 2001; pp. 3703–3707. [Google Scholar]
  14. Skarlatos, A.; Reboud, C.; Svaton, T.; de Guerenu, A.; Kebe, T.; Van-Den-Berg, F. Modelling the IMPOC response for different steel strips. In Proceedings of the 19th World Conference on Non-destructive Testing WCNDT, Munich, Germany, 13–17 June 2016; p. 22. [Google Scholar]
  15. Zhu, W.; Yang, H.; Luinenburg, A.; van den Berg, F.; Dickinson, S.; Yin, W.; Peyton, A. Development and deployment of online multifrequency electromagnetic system to monitor steel hot transformation on runout table of hot strip mill. Ironmak. Steelmak. 2014, 41, 685–693. [Google Scholar] [CrossRef]
  16. Takahashi, S.; Kobayashi, S.; Kikuchi, H.; Kamada, Y. Relationship between mechanical and magnetic properties in cold rolled low carbon steel. J. Appl. Phys. 2006, 100, 113908. [Google Scholar] [CrossRef] [Green Version]
  17. Takahashi, S.; Kobayashi, S.; Kikuchi, H.; Kamada, Y.; Ara, K. Analysis of minor hysteresis loops of cold rolled low carbon steel. IEEE Trans. Magn. 2006, 42, 3782–3784. [Google Scholar] [CrossRef]
  18. Kobayashi, S.; Tanaka, M.; Kimura, T.; Kamada, Y.; Kikuchi, H.; Takahashi, S.; Ohtani, T. Changes of magnetic minor hysteresis loops during creep in Cr-Mo-V ferritic steel. J. Electr. Eng 2008, 59, 29–32. [Google Scholar]
  19. Wilson, J.W.; Karimian, N.; Liu, J.; Yin, W.; Davis, C.L.; Peyton, A.J. Measurement of the magnetic properties of P9 and T22 steel taken from service in power station. J. Magn. Magn. Mater. 2014, 360, 52–58. [Google Scholar] [CrossRef]
  20. Jolfaei, M.A. Characterisation of Advanced High Strength Strip Steels Using Electromagnetic Sensor System. Ph.D Thesis, University of Warwick, Coventry, UK, 2019. [Google Scholar]
  21. Ebrahimian, A.; Ghasemi Banadkouki, S.S. Mutual mechanical effects of ferrite and martensite in a low alloy ferrite-martensite dual phase steel. J. Alloys Compd. 2017, 708, 43–54. [Google Scholar] [CrossRef]
  22. Martínez-de-Guerenu, A.D.; Jorge-Badiola, A.L.; Gutierrez, I. Comparative sensitivity study of magnetic hysteresis loops and Barkhausen noise for the non-destructive characterisation of dual-phase and mixed microstructures. In Proceedings of the In-Line Measurement and Control for Metals Processing 2017, Warwick Conference Centre, Coventry, UK; 2017. [Google Scholar]
  23. Kondorsky, E. On the nature of coercive force and irreversible changes in magnetization. Phys. Z. Sowjetunion 1937, 11, 68. [Google Scholar]
  24. Becker, R.; Döring, W. Ferromagnetismus; Springer: Berlin, Germany, 2013. [Google Scholar]
  25. Kersten, M. Grundlagen Einer Theorie der Ferromagnetischen Hysterese und der Koerzitivkraft; JW Edwards: Hirzel, Switizerland, 1943. [Google Scholar]
  26. Jiles, D.C.; Thoelke, J.; Devine, M. Numerical determination of hysteresis parameters for the modeling of magnetic properties using the theory of ferromagnetic hysteresis. IEEE Trans. Magn. 1992, 28, 27–35. [Google Scholar] [CrossRef]
  27. Jiles, D.C.; Atherton, D.L. Theory of ferromagnetic hysteresis. J. Magn. Magn. Mater. 1986, 61, 48–60. [Google Scholar] [CrossRef]
  28. Liu, J.; Wilson, J.; Strangwood, M.; Davis, C.L.; Peyton, A. Magnetic characterisation of microstructural feature distribution in P9 and T22 steels by major and minor BH loop measurements. J. Magn. Magn. Mater. 2016, 401, 579–592. [Google Scholar] [CrossRef]
  29. Zhou, L.; Davis, C.; Kok, P. Steel microstructure—Magnetic permeability modelling: The effect of ferrite grain size and phase fraction. J. Magn. Magn. Mater. 2021, 519. [Google Scholar] [CrossRef]
  30. Byeon, J.W.; Kwun, S.I. Magnetic evaluation of microstructures and strength of eutectoid steel. Mater. Trans. 2003, 44, 2184–2190. [Google Scholar] [CrossRef] [Green Version]
  31. He, B.; Huang, M. Revealing the intrinsic nanohardness of lath martensite in low carbon steel. Metall. Mater. Trans. A 2015, 46, 688–694. [Google Scholar] [CrossRef]
  32. Shen, J.; Zhou, L.; Jacobs, W.; Hunt, P.; Davis, C. Real-time in-line steel microstructure control through magnetic properties using an EM sensor. J. Magn. Magn. Mater. 2019, 490, 165504. [Google Scholar] [CrossRef]
  33. Yang, H.; Van Den Berg, F.; Bos, C.; Luinenburg, A.; Mosk, J.; Hunt, P.; Dolby, M.; Hinton, J.; Peyton, A.; Davis, C. EM sensor array system and performance evaluation for in-line measurement of phase transformation in steel. Insight-Non-Destr. Test. Cond. Monit. 2019, 61, 153–157. [Google Scholar] [CrossRef]
Figure 1. SEM micrograph of commercial DP600, DP800 and DP1000 steel samples (in InLens mode with 5 kV).
Metals 11 00490 g001
Figure 2. Tensile strength (left) and hardness measurement (right) versus ferrite fraction for the commercial DP600, DP800 and DP1000 steel samples.
Metals 11 00490 g002
Figure 3. Major hysteresis loops and initial magnetisation curves for the commercial DP600, DP800 and DP1000 steel samples.
Metals 11 00490 g003
Figure 4. Coercivity measurement versus ferrite fraction for the commercial DP600, DP800 and DP1000 steel samples compared to a set of laboratory heat-treated dual phase steel from Martinez et al. [22].
Metals 11 00490 g004
Figure 5. Tensile strength versus coercivity for the commercial DP600, DP800 and DP1000 steel samples, compared to a set of high-strength construction steel [12] and laboratory heat-treated DP steel [22].
Metals 11 00490 g005
Figure 6. (a) A series of minor loops with the amplitudes ranging from 150 to 2000 (A/m) for the DP600CR 1.4 mm sample. The magnetic field amplitude influences the shape of the minor loops, a lenticular shape at a small field amplitude (b,c) at a higher field amplitude it shows a sigmoid shape (d).
Metals 11 00490 g006
Figure 7. Incremental permeability versus applied magnetic field for the commercial DP600, DP800 and DP1000 steel samples.
Metals 11 00490 g007
Figure 8. Initial permeability versus ferrite fraction for the commercial DP600, DP800 and DP1000 steels.
Metals 11 00490 g008
Figure 9. Tensile strength as a function of the initial permeability for the commercial DP600, 800 and 1000 steels.
Metals 11 00490 g009
Table 1. Summary of the ferrite fraction, hardness and grain size of commercial DP steels, HR = Hot-rolled, CR = Cold-rolled, Gl = Galvanised, mm = sample thickness.
Sample IDFerrite Fraction
(%)
Ferrite Grain Size (μm)Hardness
(HV)
UTS
(MPa)
DP600CR 1 mm74 ± 27 ± 3194 ± 2684 ± 19
DP600CR 1 mmGl76 ± 26 ± 2190 ± 3657 ± 25
DP600CR 1.4 mm72 ± 57 ± 3205 ± 5656 ± 11
DP600CR 1.5 mm74 ± 27 ± 2195 ± 4670 ± 17
DP600HR 4 mm79 ± 410 ± 4185 ± 4646 ± 30
DP800CR 0.95 mm58 ± 46 ± 3234 ± 5762 ± 41
DP800CR 1.6 mm59 ± 53 ± 2240 ± 4819 ± 32
DP800CR 1.6 mmGl52 ± 15 ± 2234 ± 4803 ± 14
DP800CR 2 mmA49 ± 25 ± 1244 ± 2827 ± 15
DP800CR 2 mmB65 ± 23 ± 1255 ± 5852 ± 32
DP1000CR 1 mm39 ± 33 ± 1320 ± 61074 ± 10
DP1000CR1.2 mmGl42 ± 23 ± 1318 ± 51026 ± 15
DP1000CR 1.6 mm42 ± 14 ± 2321 ± 71023 ± 20
Table 2. Measured coercivity and initial permeability values for the commercial DP600, DP800 and DP1000 steel samples.
SampleCoercivity
(A/m)
Initial Permeability
i)
DP600CR 1 mm978 ± 26152 ± 4
DP600CR 1 mmGL858 ± 32150 ± 3
DP600CR 1.4 mm975 ± 25147 ± 4
DP600CR 1.5 mm868 ± 16149 ± 3
DP600HR 4 mm853 ± 36180 ± 3
DP800CR 0.95 mm1150 ± 32127 ± 3
DP800CR 1.6 mm1350 ± 30109 ± 2
DP800CR 1.6 mmGL1290 ± 38114 ± 3
DP800CR 2 mmA1305 ± 35115 ± 2
DP800CR 2 mmB1380 ± 25111 ± 3
DP1000CR 1 mm1592 ± 3790 ± 3
DP1000CR1.2 mmGL1550 ± 3892 ± 3
DP1000CR 1.6 mm1579 ± 3692 ± 4
Publisher’s Note: MDPI stays neutral with regard to jurisdictional claims in published maps and institutional affiliations.

