Article

Laser Surface Modification in Ti-xNb-yMo Alloys Prepared by Powder Metallurgy

1
Instituto de Tecnología de Materiales, Universitat Politècnica de València, 46022 Valencia, Spain
2
Regenerative Medicine Lab, Department of Veterinary Surgery and Animal Reproduction, School of Veterinary Medicine and Animal Science, São Paulo State University, Botucatu 18618681, Brazil
3
Departamento de Ingeniería Industrial II, Universidade da Coruña, 15471 Ferrol, Spain
*
Authors to whom correspondence should be addressed.
Metals 2021, 11(2), 367; https://doi.org/10.3390/met11020367
Submission received: 30 January 2021 / Revised: 11 February 2021 / Accepted: 16 February 2021 / Published: 22 February 2021
(This article belongs to the Special Issue Laser Treatment of Metallic Materials)

Abstract

:
The main objective was to study the effect of surface modification by laser on Ti-Nb-Mo powder metallurgical alloys to improve their mechano-chemical behavior and their application as a biomedical implant. The used powder mixtures were produced in an inert atmosphere. Uniaxial compaction took place at 600 MPa with high-vacuum sintering at 1250 °C for 3 h. The specimens for the three-point flexure test were prepared and their mechanical properties determined. Microstructural characterization was performed by scanning electron microscopy (SEM) and X-ray diffraction (XRD) to obtain the distribution of phases, porosity, size, and shape of the grains of each alloy. Corrosion behavior was evaluated by electrochemical tests using an artificial saliva electrolyte modified from Fusayama at 37 °C. Chemical characterization was completed by analyzing the ionic release by Inductively coupled plasma atomic emission spectroscopy (ICP-EOS) after immersion for 730 h in Fusayama solution modified with NaF at 37 °C to simulate a 20-year life span based on a daily 2-min cycle of three toothbrushes. Corrosion behavior confirmed promising possibilities for the biomedicine field. The surface porosity of the samples not submitted to surface treatment deteriorated properties against corrosion and ion release. The obtained phase was β, with a low α”-martensite percentage. The maximum resistance to bending was greater after surface fusion. Plastic deformations were above 7% under some conditions. Microhardness came close to 300 HV in heat-affected zone (HAZ) and 350 HV in fusion zone (FZ) (under the determined condition. The elastic modulus lowered by around 10%. The corrosion rate was lower in Ti-27Nb-8Mo and Ti-35Nb-6Mo. Niobium release was significant, but below the physiological limit.

1. Introduction

Adequate material selection is essential for biomedical use. For this reason, properties like corrosion resistance, ion release behavior, and elastic modulus should be studied to avoid negative effects for patients. Of the biomaterials to choose from, titanium offers interesting opportunities for the biomedical field [1].
Currently, material selection in implantology presents two major problems that have not yet been solved: Toxicity of components and the stress shielding phenomenon due to a superior elastic modulus to bone. Firstly, despite the fact that Ti6Al4V alloys are the most widely used in this area, recent studies prove that Al and V ions pose serious allergic and neurological problems [2]. Secondly, the bone resorption that occurs by screening stresses has rendered it necessary to develop titanium alloys with a low Young’s modulus, in addition to non-toxic elements.
Everything discussed above leads to a new titanium (Ti) alloys focus on a crystalline structure of the body-centered cubic phase (BCC, Body-Centered Cubic), that is, β-phase alloys, and using highly compatible alloys [3]. Niobium (Nb) not only stabilizes the β phase, but also presents substantial biocompatibility. Ti-Nb alloys also have a lower elastic modulus compared to other binary titanium alloys [4]. Molybdenum (Mo) is a strong β-stabilizer that can retain the β phase with 10% wt in alloys. Ti-Mo binary alloys have a low elastic modulus and suitable corrosion resistance [5]. Therefore, Ti-Nb-Mo system alloys may possess favorable properties for applications like biomaterials, and have been studied in some more recent research works in the literature [6,7].
The use of titanium alloys in biomedicine is limited by the high cost of raw material, a complex manufacturing process and serious with geometric design limitations [8]. Manufacturing pieces by the powder metallurgy technique would greatly minimize costs by reducing material waste and subsequent machining stages. This technique is especially useful for materials that are highly reactive or difficult to diffuse, such as alloys with high niobium contents or other components with a high melting point. In addition, the porosity inherent to this manufacturing method would be a good way to reduce the material’s elastic modulus and to, thus, minimize the stress shielding process [9].
However, this manufacturing method involves obtaining pieces with a certain open porosity that can damage important surface properties, e.g., corrosion resistance or ion release behavior. This porosity can be closed by different surface modification technologies. Surface treatment not only entails the surface closure of porosity, but can also be adapted by conferring different properties. Of these technologies, the laser fusion technique can promote layer formation, but also controls thickness and, thus, improves certain properties of modified pieces. This surface fusion would be responsible for better diffusion by most refractory elements, surface sealing, and the crystalline phases modification present on surfaces. Therefore, the main objective of this work was to study the effect that laser surface modification has on four Ti-Nb-Mo powder alloys (Ti-13Nb-12Mo, Ti-20Nb-10Mo, Ti-27Nb-8M, Ti-35Nb-6Mo) with 15.5% Moeq to know their mechanical behavior, elastic modulus, electro-chemical corrosion, and ion release in an artificial saliva medium.

2. Materials and Methods

To produce parts by powder metallurgy, an elemental mixture of Ti, Nb, and Mo powders was made, which were all supplied by Atlantic Equipment Engineers (Upper Saddle River, NJ, USA) as: Ti with 99.67% purity and granulometry d (0.5) = 29.23 µm; Nb with 99.95% purity and size d (0.5) = 15.94 µm; and Mo with 99.97% purity and size d (0.5) = 4.26 µm. The powders were mixed for 30 min in a 2-liter Inversine turbine (Bio-Components- Wald, Switzerland). Samples measuring 30 mm × 12 mm × 5.5 mm were compacted in an Instron (model 1343, Buckinghamshire, UK) uniaxial action universal hydraulic press in a floating matrix and were dimensionally characterized. Due to the differences in the powders’ melting points, compacts were sintered in a CARBOLITE HVT 15-75-450 (GlobalSpec- Engineering 360-Hope, Albany, NY, USA ) high-vacuum tube furnace under vacuum conditions of 3 × 10⁻² Pa at 1250 °C for 3 h [10,11,12]. After sintering, a new dimensional control was carried out, and density was determined by the Archimedes method using a KERN 770/GS/GJ (Balingen, Germany) analytical balance.
A continuous wave neodymium-doped yttrium aluminum garnet (Nd: YAG) high-power solid-state industrial laser system (Rofin-Sinar DY022, Plymouth, MI, USA), run in the continuous mode and λ = 1064 nm was used to melt the surface. A laser was defocused to obtain a 2-mm beam diameter on the working plane. Helium was used as a shielding gas at a flow rate of 20 L/min. The XYZ movement was achieved with a robotic-arm ABB IRB 2400 unit (Zurich, Switzerland) at 6 degrees of freedom. Scan velocity was combined with laser power to obtain three different energy densities (50, 75, 100 J/mm2). First of all, six single beads were made with different laser beam power and speed parameters. Beads were analyzed by optical microscopy Eclipse LV100DA-U (Nikon Instruments Inc, Tokyo Japan), on their cross-sections, and the optimal condition was selected by the h/A ratio, where h is the maximum bead depth and A is bead width.
A fusion of the entire sample surface was obtained after this selection, approximately 30 × 12 mm2, with a 40% overlap between beads according to the final conditions listed in Table 1.
The porosity in green was measured by the dimensional density of the materials selected after the compaction process. In this way, it was possible to obtain the resulting contraction after the sintering stage.
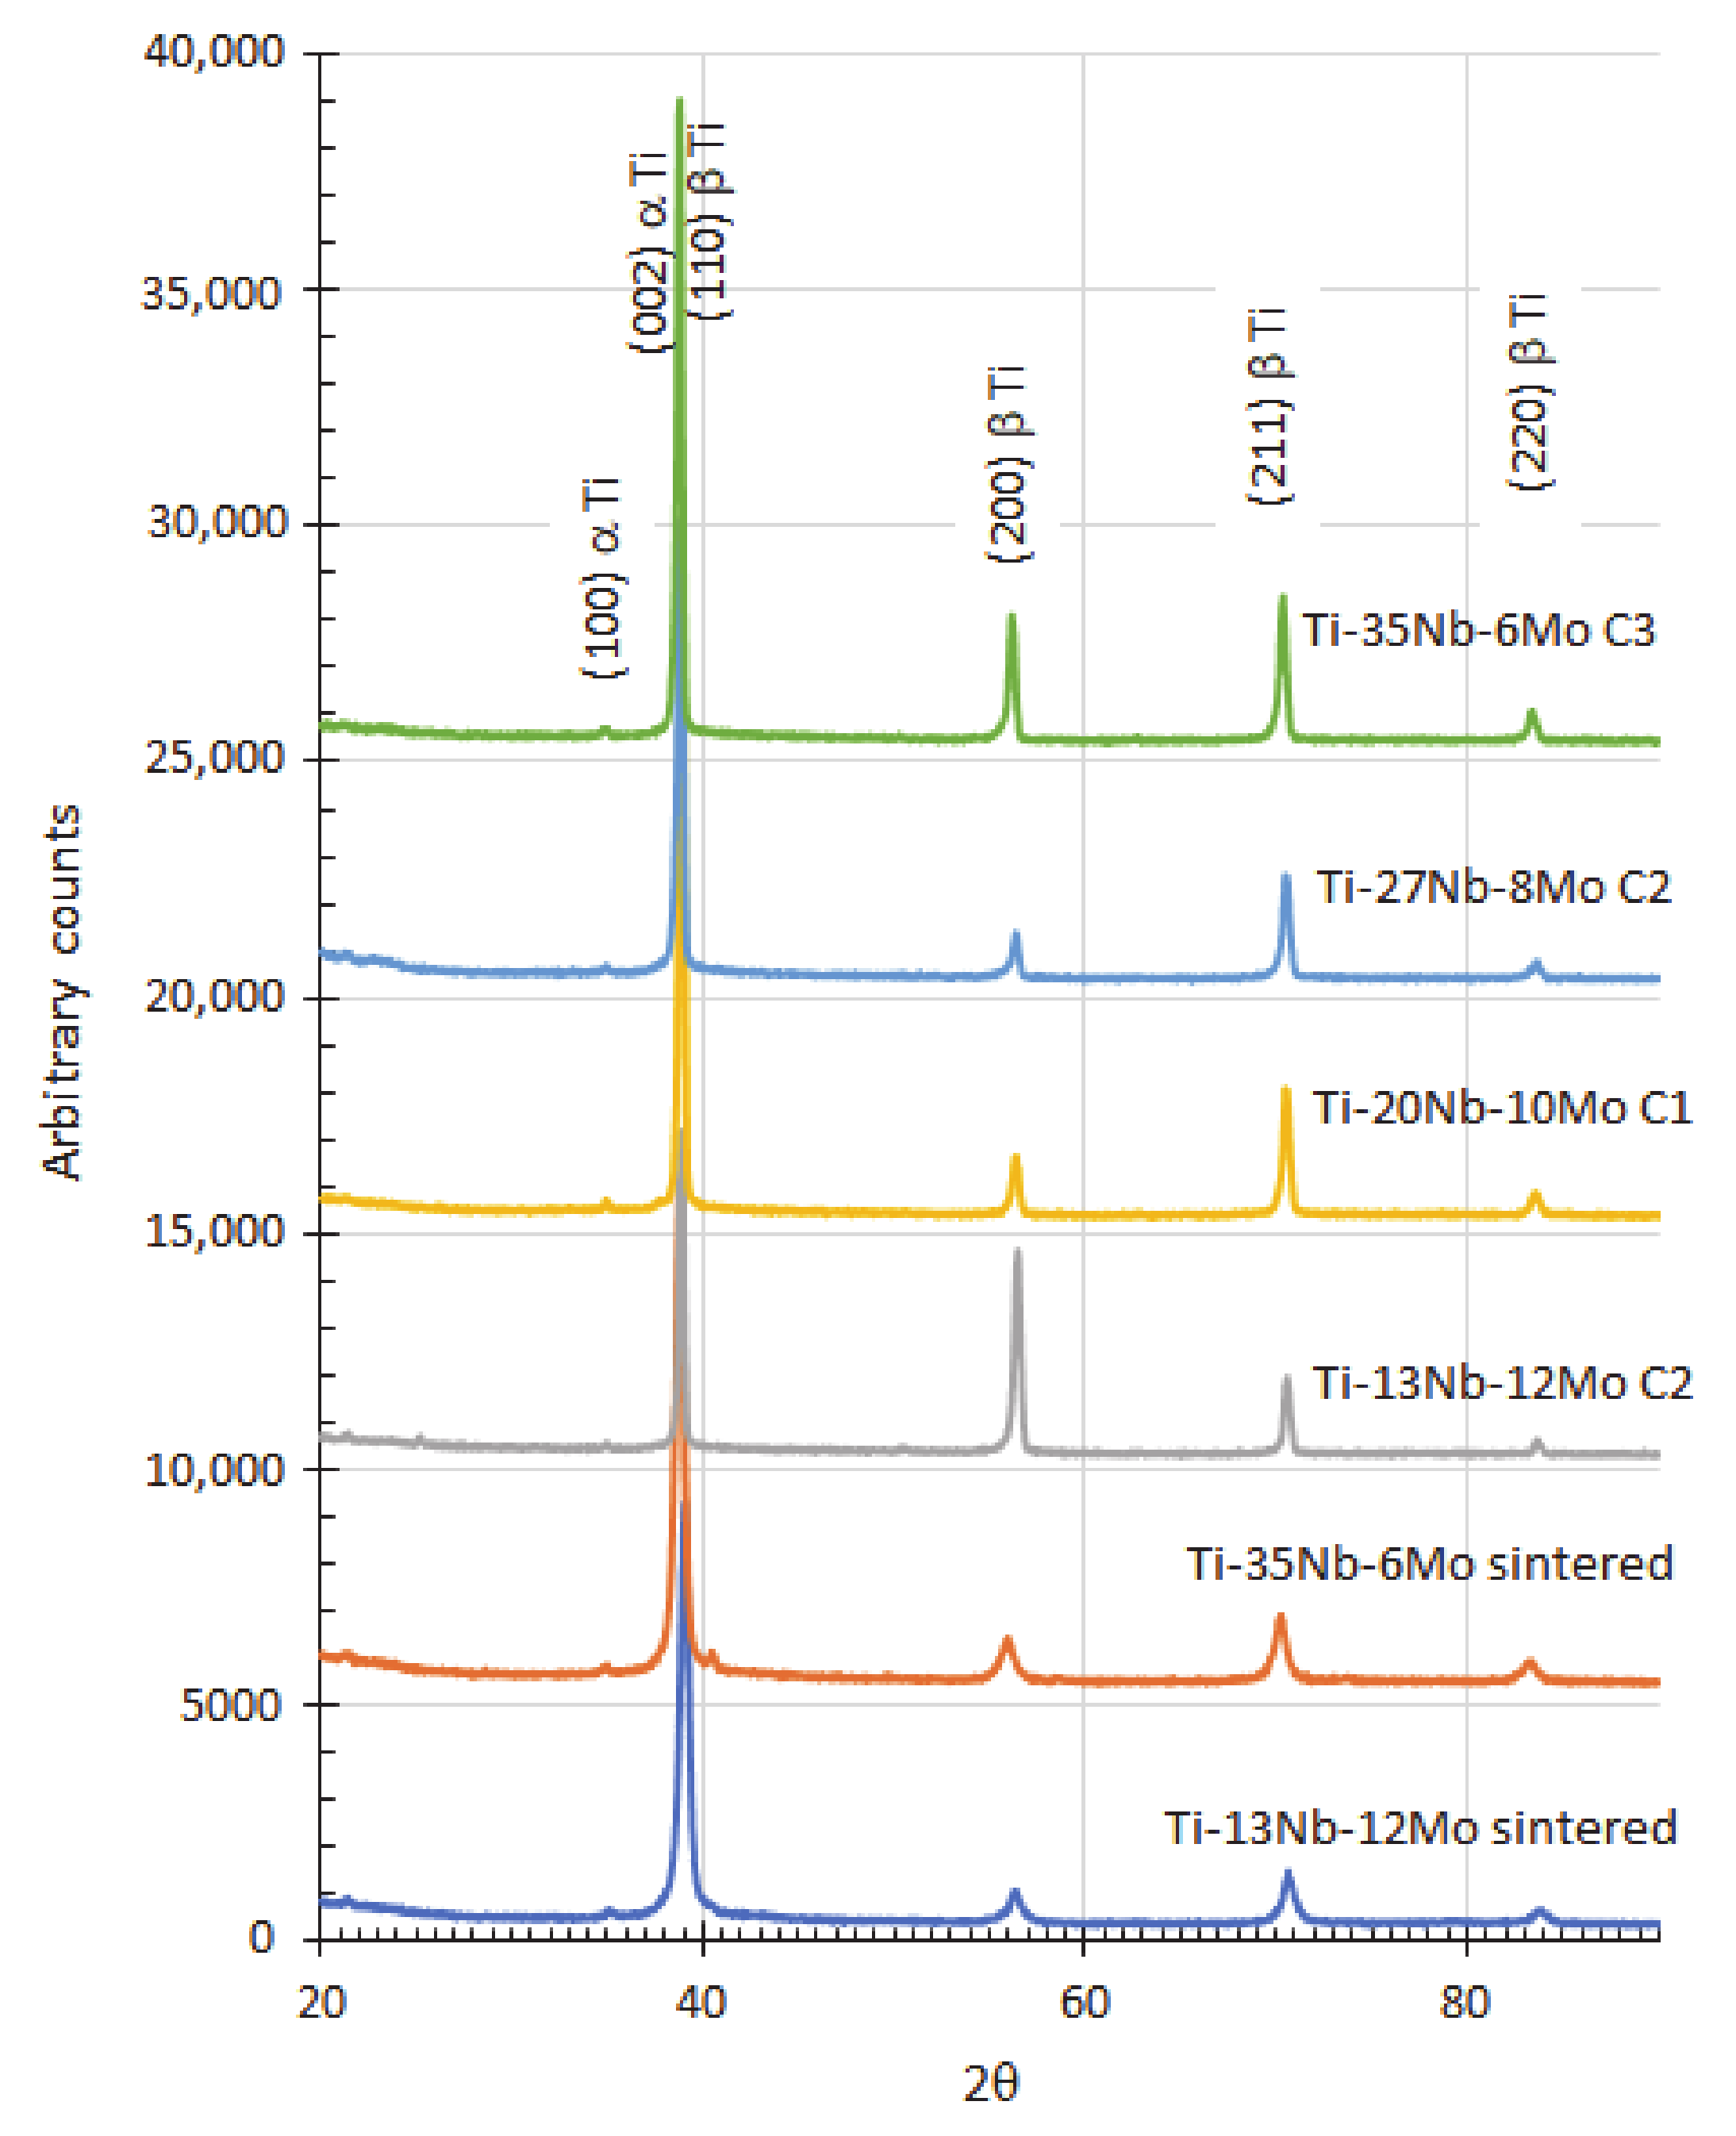
The crystalline structure of the sintered and modified surfaces was analyzed by X-ray diffraction (XRD) by performing a quantitative phase analysis by the Rietveld method. XRD was performed in a D2 Phaser model (Bruker, Karlsruhe, Germany) as follows: Cu Kα radiation (λ = 1.544 Å), 15 mA current, 30 kV potential, sweep from 20 to 90°, with a 0.02° step size. For the diffractograms analysis, the free MAUD (Materials Analysis Using Diffraction, University of Trento, Trento, Italy) software was used [13] with the crystallographic database records of the ICSD (Inorganic Crystal Structure Database).
Mechanical behavior was carried out by three-point bending tests in a Shimadzu universal test press, model Autograph AG-100kN Xplus (Shimadzu, Tokyo, Japan), at a crosshead speed of 0.1 mm/min and with a 22-mm distance between supports. Displacement was determined using a video capture board model SOLIOS 2M EV (Matrox- Montreal, QC, Canada).
The elastic modulus was established by ultrasound equipment, model Echograph 1090 (Karl Deutsh, Wuppertal, Germany), with the DS 6 PB 4-14 probes for longitudinal waves, and the YS 12 HB 1 probe for transverse waves. For the hardness measurements, a microhardness (Matsuzawa-Akita, Japan), (model MHT2) was evaluated using 19.6 N load for 15 s microhardness. The number of indentations in each sample was 10, and they were made every 50 µm.
For the microstructural analysis, samples were subjected to a standard for metallographic preparation purposes [14]. Images were obtained using an optical microscope (Eclipse LV100, Nikon Inc., Melville, NY, USA), and a field emission scanning electron microscope (ULTRA 55, Carl Zeiss, Oberkochen, Germany) equipped with a X-ray dispersive energy detector (X-Max, Oxford Instruments, Oberkochen, Germany), and a diffraction detector. The backscattered electron beams (EBSD) from Oxford Instruments (Symmetry, Oberkochen, Germany) were controlled by the AZtecHKL software.
The ion release test was carried out by complete immersion in 50 mL of Fusayama artificial saliva (NaCl 0.4 g/L, KCl 0.4 g/L, CaCl2 0.8 g/L, H2PO4 0.7 g/L, NaF 2.5 g/L, Na2S 0.005 g/L, urea 1 g/L), pH 5.86, at 37 °C for 730 h. The ion content in the electrolyte was evaluated by Optical Emission Spectrometer (715ES, ICP-OES, Varian Medical Systems, Austin, TX, USA).
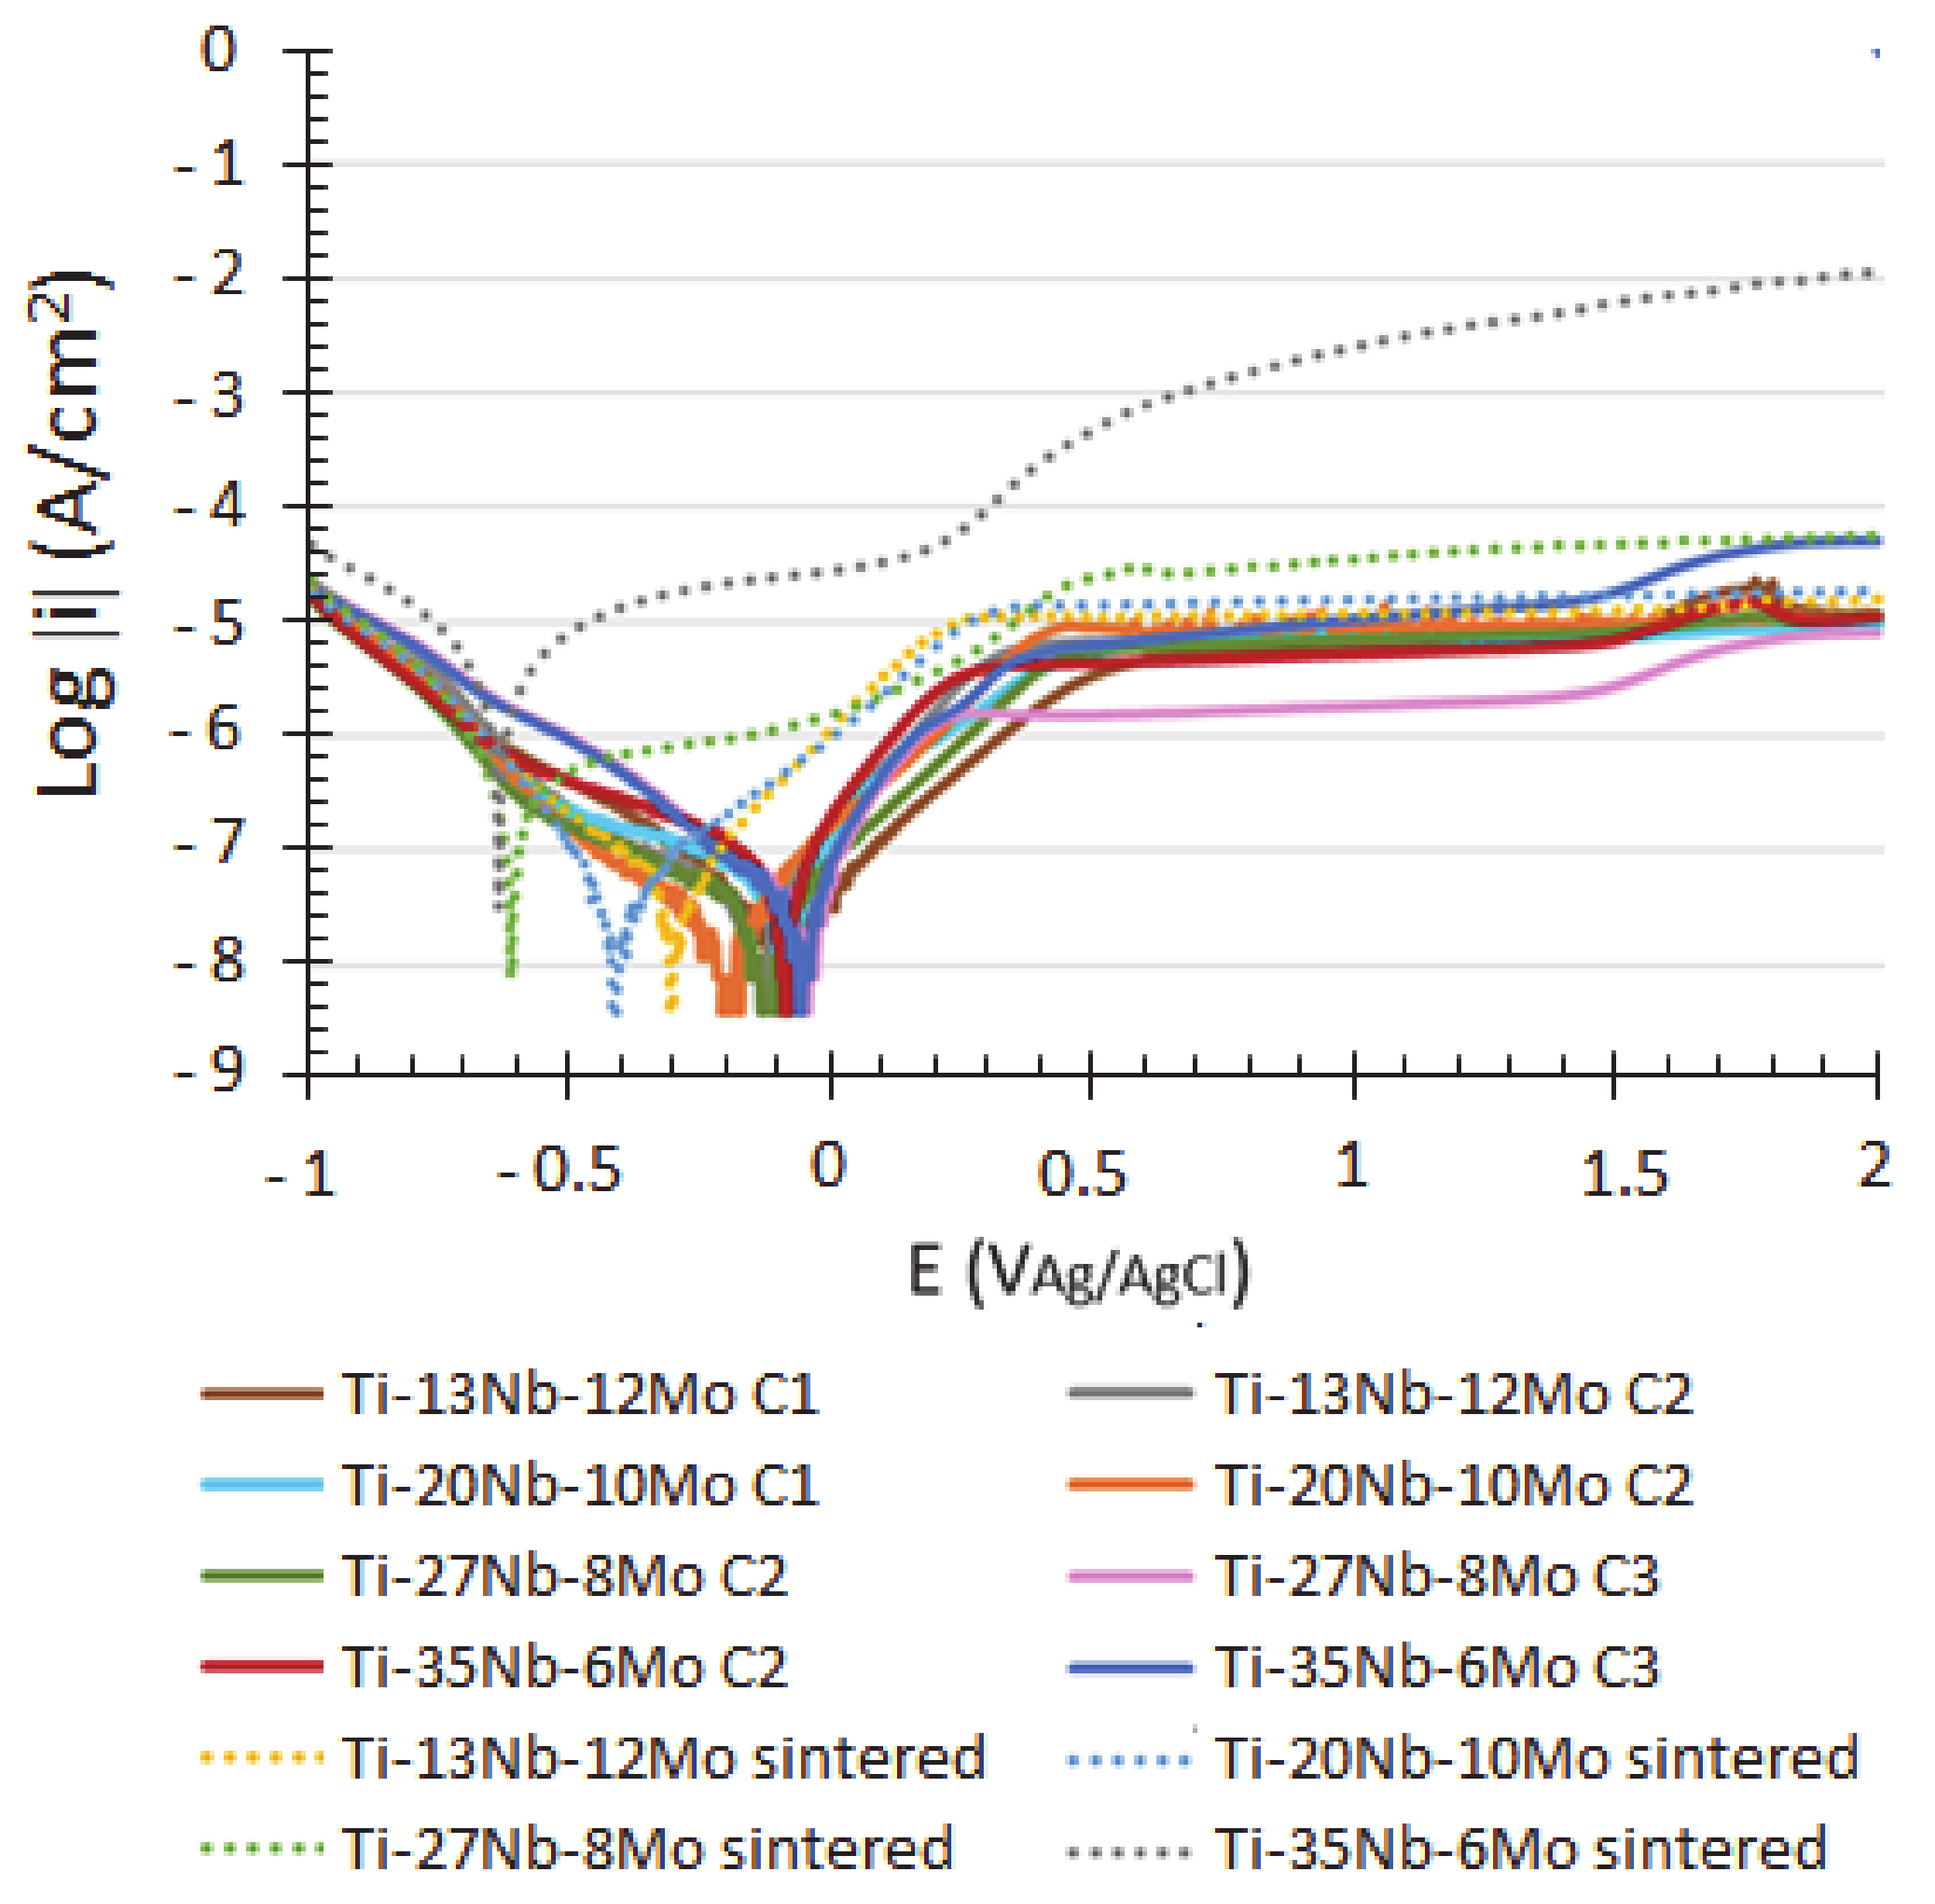
The potentiodynamic corrosion tests were carried out at 37 °C in the Fusayama artificial saliva electrolyte without NaF on a surface area of 0.785 cm2 using Ag/AgCl, 3M KCl as a reference electrode in a potentiostat (PGSTAT204, Metrohm autolab, Utrecht, Netherlands). The corrosion rate was determined by Tafel’s extrapolation methods. Tafel´s slope cathodic (βc) and anodic (βa) and corrosion current densities (icorr) were estimated from Tafel plots. Corrosion potential was also established. Three repetitions of all the tests were performed at a scan rate of 2 mV/s.
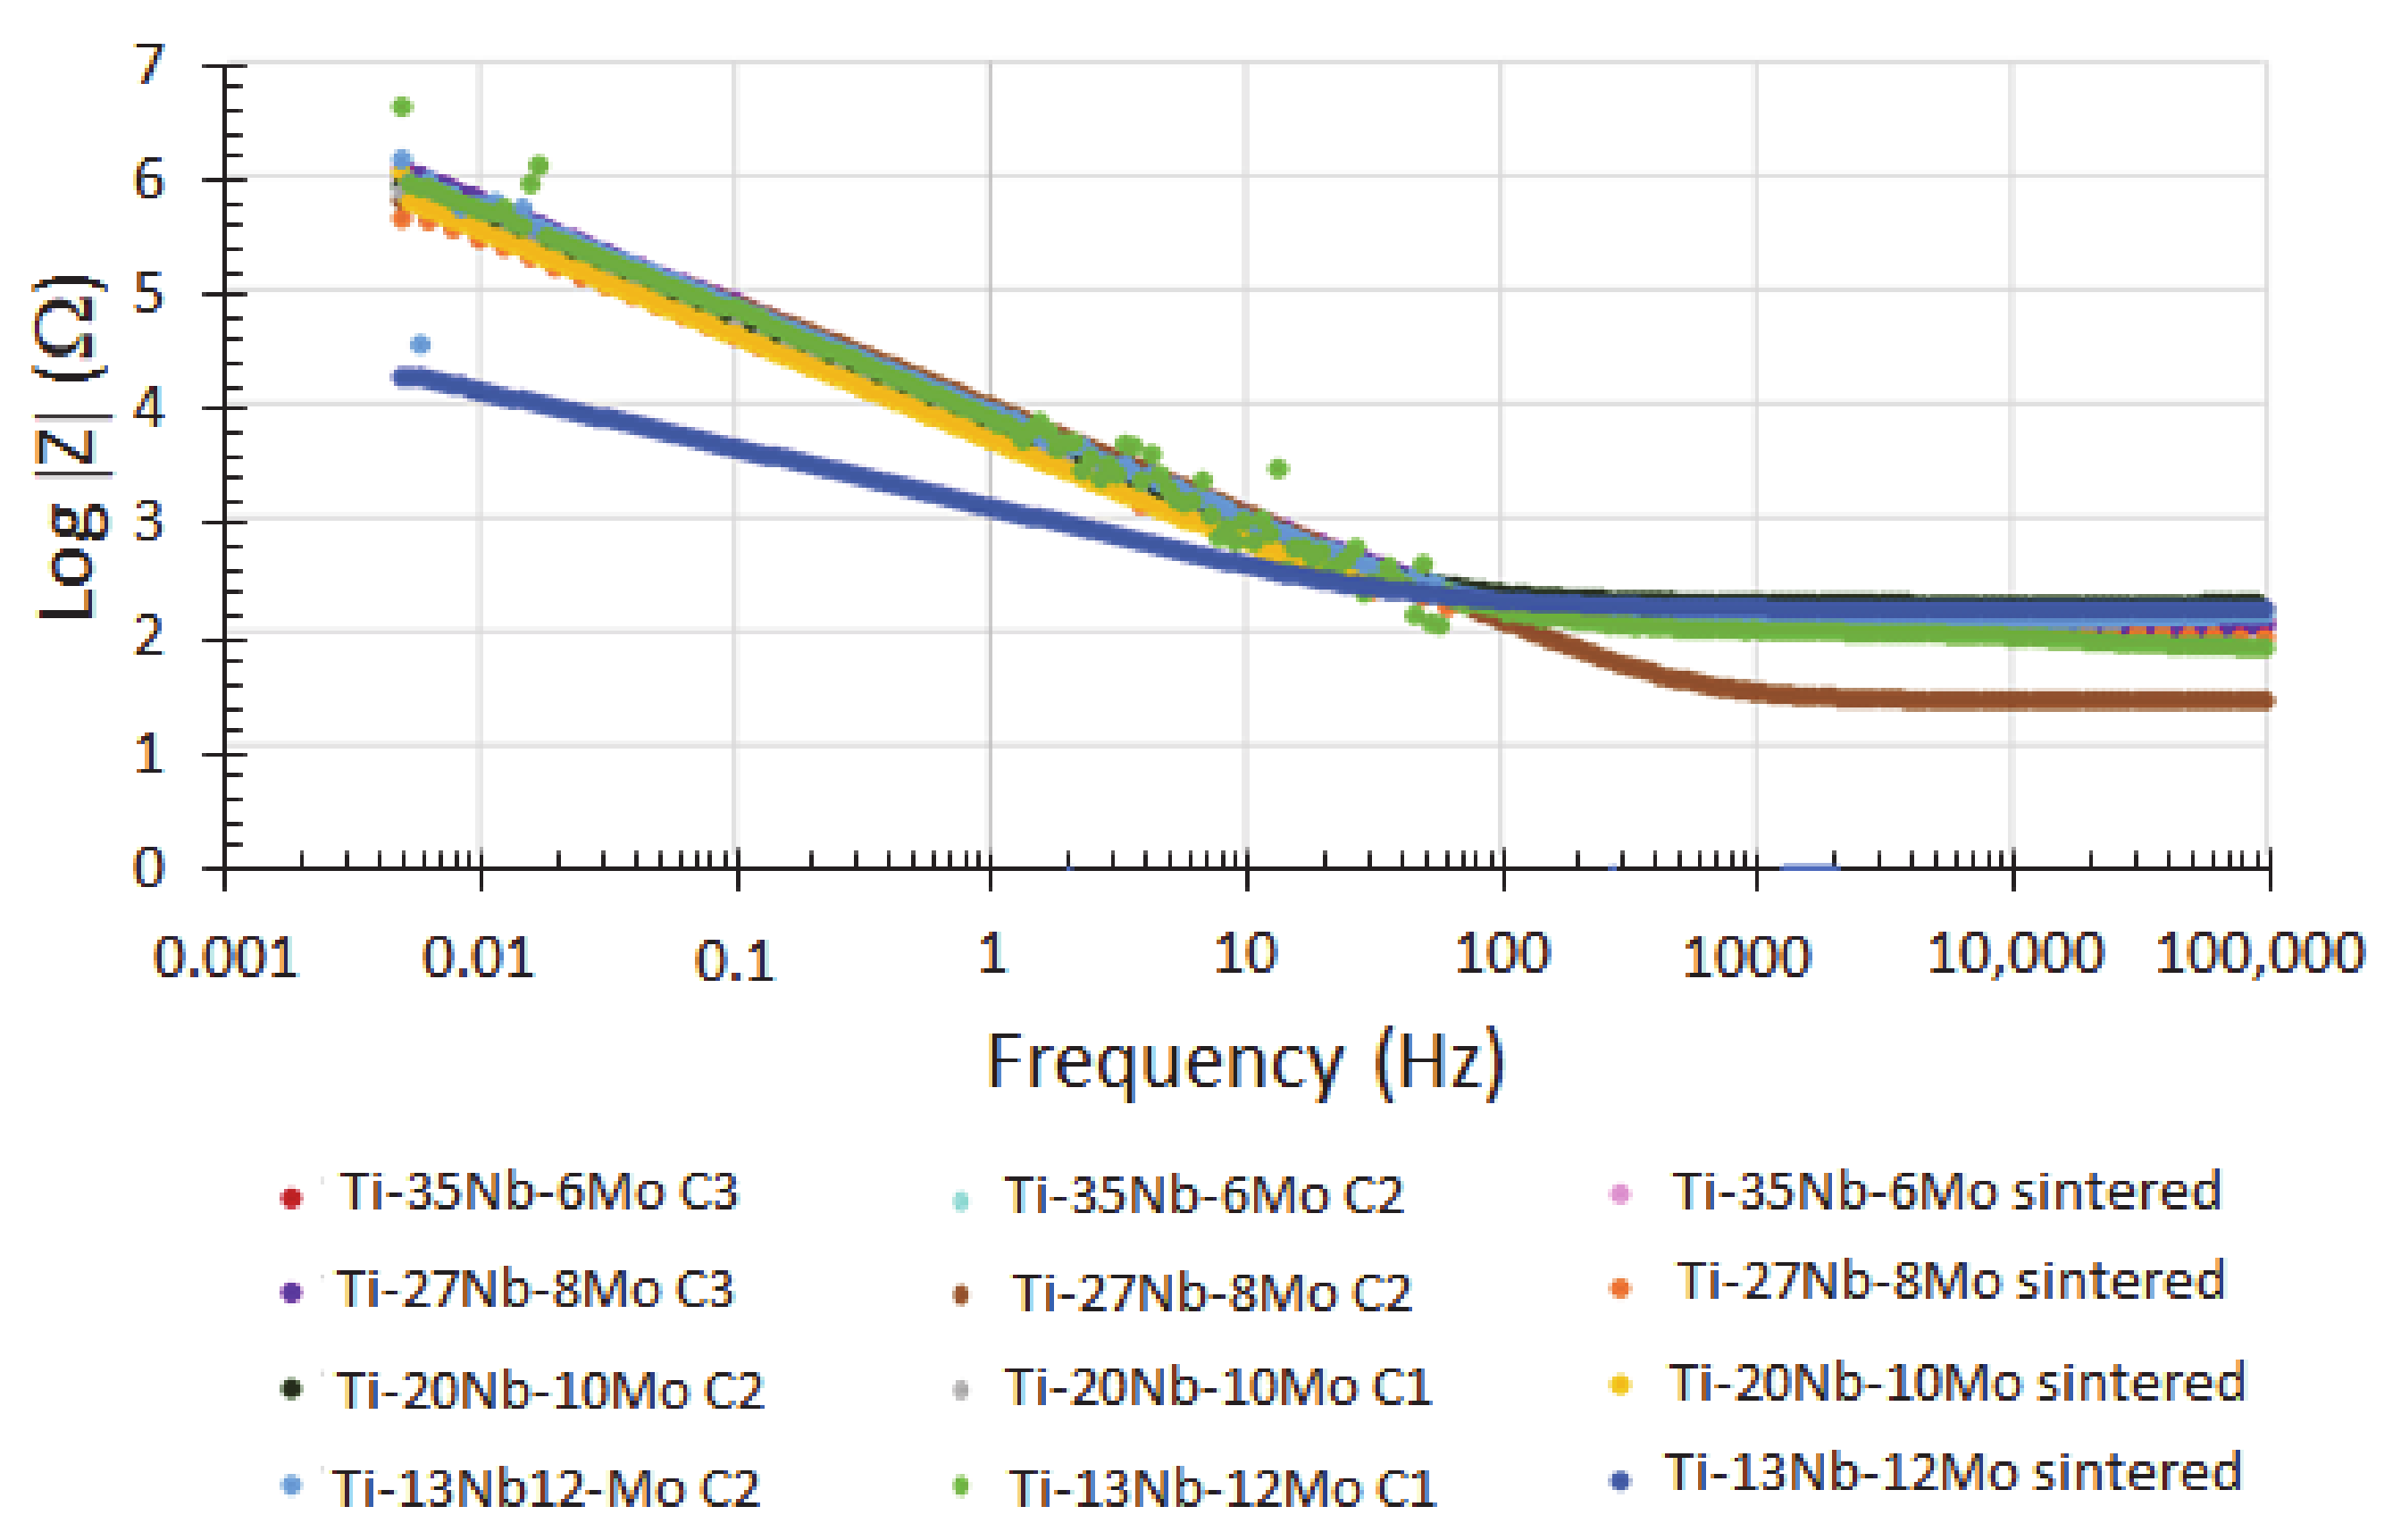
Electrochemical Impedance Spectroscopy (EIS) was obtained with a FRA32M module combined with the potentiometer in the same AS solution at a frequency range from 1 MHz to 0.01 Hz and a signal amplitude of 10 mV at OCP for 3600 s. Impedance data were analyzed by the Zview software (Key Solutions, Landis, NC, USA) and fitted to double porous layer equivalent circuits.

3. Results

3.1. Dimensional Characterisation

Significant contraction in volume occurred during sintering, with which a relative density of the sintered product was obtained, which slightly decreased with the addition of Nb (Table 2).
By Laser Surface Modification (LSM), a slight reduction in open porosity was observed, which depended on the conditions ranges from 21 to 65%, especially when laser power or energy density was higher.

3.2. Mechanical Properties Characterisation

The maximum bending strength increased significantly after LSM but, above all, the strongest effect was obtained on the plastic deformation after surface fusion, which very significantly increased, while microhardness was not affected compared to the base metal (BM) (see Table 3).

3.3. Characterisation of Microstructure

XRD confirmed a β structure according to Moeq, with slight presence assignable to the α phase, on its (100) plane and scarce presence of α” phase, which was not determined by the Rietveld method. Figure 1 presents the obtained diffractograms, which correspond to the laser treatment conditions and have higher bending strengths, along with those corresponding to the base alloys with lower and higher Nb contents.
The image analysis study of the different sample areas enabled the surface fusion layer area to be calculated and the layer thickness value to be obtained, together with the porosity percentage, to distinguish between the heat-affected zone (HAZ) and base metal (BM) (Table 4). Porosity increased when Nb content rose and Mo content dropped in both HAZ and BM, but both were between 3% and 6% in most cases.
BSE images provide information on the microstructure of the different compositions of Ti-Nb-Mo alloys, and a microstructural change occurred, such as increased densification in fusion zone (FZ) compared to (HAZ) (Figure 2). The distinct morphology of the grains in the Ti20Nb10Mo alloy (C2) are seen in Figure 3. The formed grains present an equiaxial morphology on most of surface zone of cord, and columnar-type growth in the interface zone.
The Energy-dispersive X-ray spectroscopy (EDS) line analysis carried out on this same alloy, in its C1, showed clear variations in its composition with dendrites structures rich in Mo and Nb, but dendritic spaces rich in Ti (Figure 4). However, the distribution of the elements in HAZ was much more homogeneous with complete particle fusion, mainly of Nb, in the BM (see Figure 4).
Nb and Mo unmelting was clearly seen in some areas in the BM, such as the region studied in Figure 5, with the compositional distribution maps of each element obtained by dispersive energies. Ti was considerably lacking in the particles in which Nb was highlighted for its increased concentration.
The distribution of phases in FZ (Figure 6), indicated, apart from the transformation into martensite α” in FZ, the penetration of this transformation to HAZ, albeit clearly to a lesser extent. This transformation into martensite appeared when Mo content lowered. However, for the Ti-27Nb-8Mo alloy, the highest contents were obtained under any laser condition (Table 5).
Mechano-physical properties depend on the morphology and distribution of phases to a great extent, which is shown in Figure 6, along with the proportion between them. Thus, it would be interesting to consider it to analyze the results (Table 5), where we can see that all the alloys present transformations into martensite α’’.
The size of each alloy’s grains is an important characteristic although, as Table 5 shows, dimensions were due to the different microstructures generated by the laser surface treatment. As determined by EBSD, these average grain size values presented some indexing problems for the grains of the β-phase because abundant acicular phase α” precipitates formed.
The analysis of Euler maps and inverse pole figures (IPF) allowed grain distribution to be observed in both FZ and HAZ (Figure 7). These images can explain the differences between the grain size considering practically only the β-phase grains given the limitations indicated and the minimum grain size in pixels and disorientation on the grain edge to contemplate different grains.
The texture (crystalline orientation of the grains) is conditioned by the orientations of the base metal that provide columnar grains formation according to the cooling rate used (volume of the piece and energy of the laser process). Whereas the roughness of the surface is very low, although the fusion beads are visible on the surface modified. These irregularities can be easily eliminated by polishing processes, without hardly affecting the properties described.

3.4. Chemical Characterisation

3.4.1. Ion Release Study

The microstructure was obtained after chemical etching of the same alloy, as presented in Figure 8. The concentrations of all the elements released from the alloy are listed according to the exposed area and testing hours (see Table 6). No apparent relation was found between the behavior of the different alloys during testing, and the reduced ion release from alloys Ti-27Nb-8Mo (C3) and Ti-35Nb-6Mo (C2) is highlighted.
The obtained Nb and Mo release values vastly differed. In the table, we can see that even for the Ti-13Nb-12Mo alloy with similar Nb and Mo percentages, Nb release was much higher than that of Ti. We also found that the released Mo concentrations lowered as the Mo concentration dropped in the alloy, which was consistent. However, the released Nb concentrations did not appear to be related to the amount of Nb present in the alloy.

3.4.2. Electrochemical Corrosion under Different LSM Conditions

According to potentiodynamic behavior (Figure 9), the values of corrosion potential (Ecorr), corrosion current density (Icorr), resistance to polarization (Rp), and the corrosion rate index (Vc) were obtained, which provide clues about material loss due to ionic release per year (Table 7). A clear difference was observed between the tests performed on the samples sintered treated by laser. The sintered samples presented more negative corrosion potentials, together with passive layer breakage in some, mainly for the Ti-35Nb-6Mo alloy. These results indicated that surface porosity closure improved the corrosion resistance of these Ti-Nb-Mo alloys, with lower current intensities, higher resistance to polarization, and lower corrosion rates.
The average open circuit potential (OCP) values for the different Ti-Nb-Mo alloys (for both sintered and after laser surface modification (LSM)) are shown in Table 7. The alloys exhibiting the most negative potential indicated worse corrosion performance. When looking at the OCPs, no significant compositional influence appeared, although some improvement was noted in performance with surface fusion.
The Bode diagrams (see Figure 10) indicate a certain homogeneity among all the alloys within the 75–85° range, which highlights that those alloys that were not submitted to surface treatment were left with lower or offset angles.
The equivalent circuit of Figure 11 was that which finally obtained chi-square adjustment values (χ2) in the order of 10−3. The parameters used to adjust the electrical model are shown in Table 8. Rs, Rct, and Rfilm were obtained for resistances, CPEdl and CPEfilm for the constant phase elements, and ndl and nfilm for exponents. We can observe higher passive layer strengths for the alloys that underwent laser fusion surface treatment, while constant phase elements decreased with increasing strength. It can be seen by the naked eye that the main resistance of the passive layer of the studied alloys was due to Rfilm.
Higher resistances of the passive layer were observed for the samples treated superficially together with exponents n that came close to 1. For the samples that did not undergo surface treatment, resistances were lower, and exponents did not come close to 1.
Passivation layer thickness measurements can be taken from the 1/C parameters because they are directly proportional to oxide layer thickness. Table 9 shows the results that correspond to 1/CPEdl and 1/CPEfilm for the different alloys and conditions.

4. Discussion

Alloys’ porosity seemed to rise with higher Nb and lower Mo contents. However, the values of the contractions that samples underwent did not significantly differ among distinct compositions. Interestingly, the open porosity after SML in the Ti-13Nb-12Mo and Ti-20Nb-10Mo alloys presented a proportional reduction in porosity with increasing laser beam power. However, the reduced porosity in the Ti-27Nb-8Mo and Ti-35Nb-6Mo samples increased with rising energy laser beam density. Slowing laser speed can increase the area of the beads obtained due to the longer interaction time between the laser and the surface. Laser fusion can cause surface cracks or defects, and thermal exposure leaves HAZ below the cast surface, which modifies its mechanical properties. Typically, this area that occupies around 400–600 µm under the FZ layer can be reduced using lasers run at higher speeds [15].
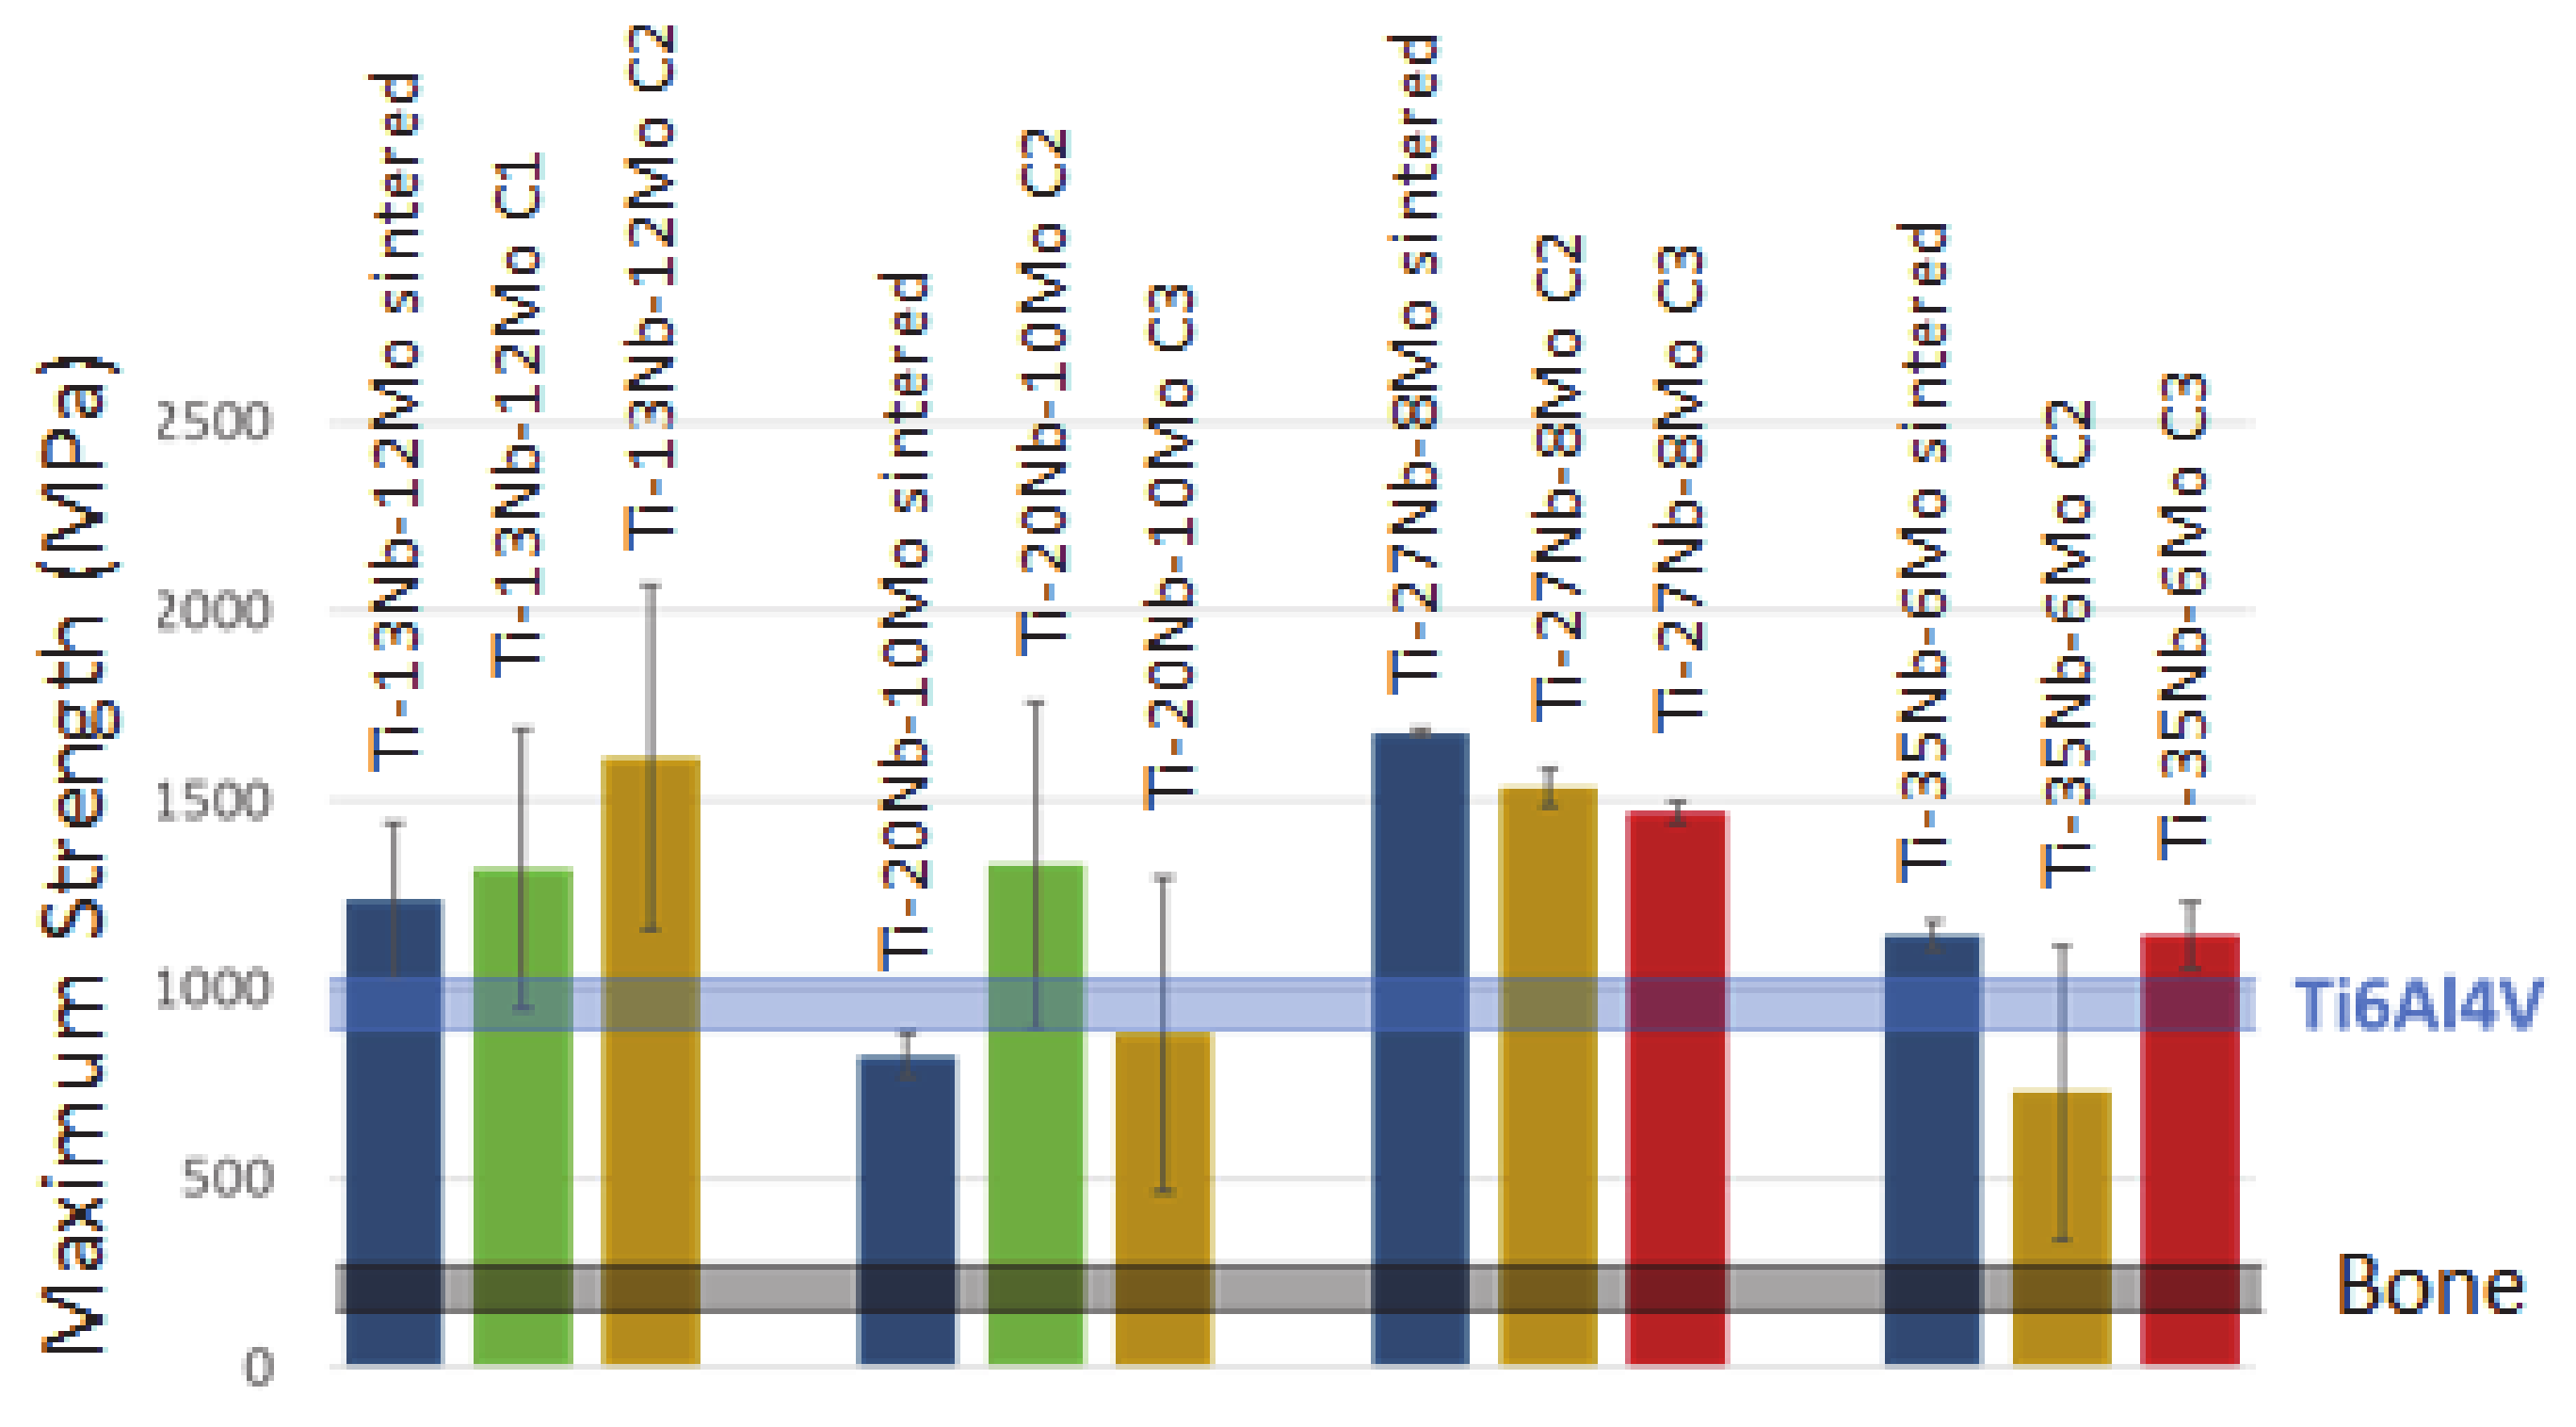
Higher porosity in an alloy generally implies reduced mechanical properties [
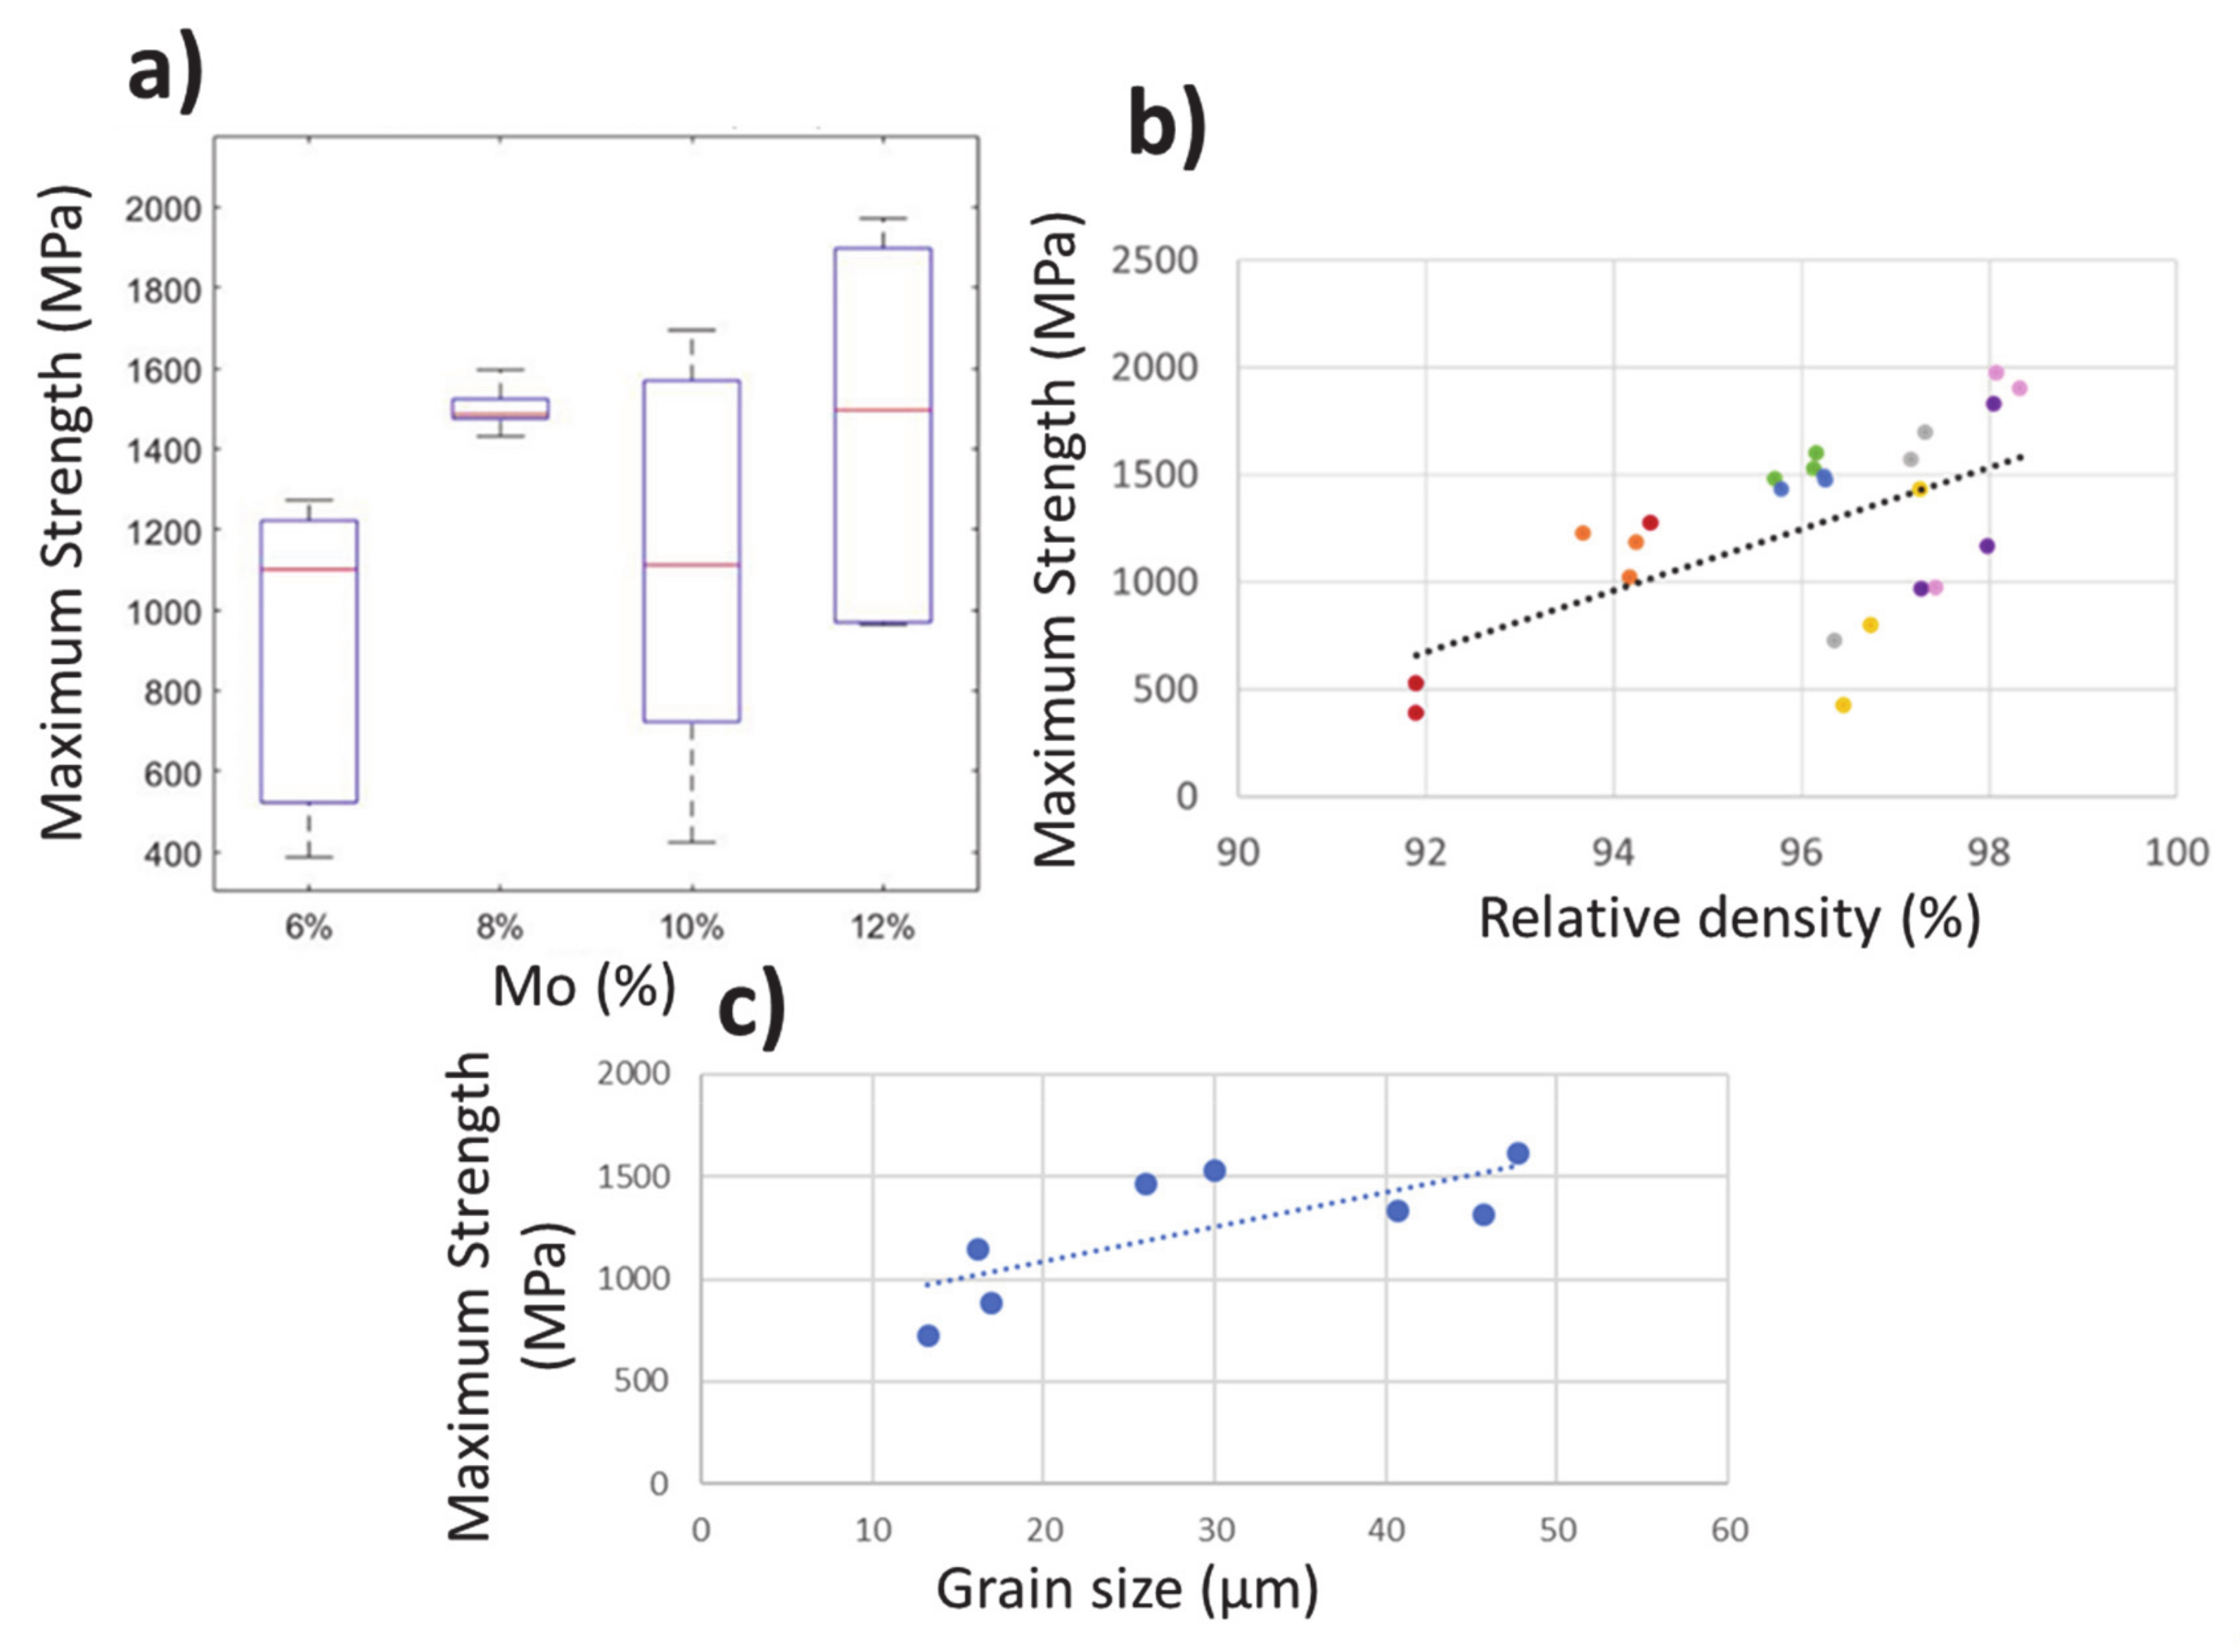
16]. By observing the results for the different compositions of the Ti-Nb-Mo alloys, a certain increase in the maximum flexural strength was seen when Mo content rose in the alloy. The composition of each alloy plays a decisive role in its final mechanical properties. Both Nb and Mo have a strong β-stabilizing effect on Ti alloys, but Mo appears to increase mechanical characteristics to a greater extent than Nb [17,18]. The variability in flexural strength data is decomposed into statistically significant contributions due to Mo content, relative density, and grain size, as depicted in Figure 12.
The obtained flexural strength values are considered relatively high as they are well above the flexural strength of bone tissue, whose range is around 110–184 MPa [19]. To make a comparison of the flexural strength values of other medical materials, such as forging Ti-6Al-4V, Figure 13 shows the 896–1103 range [20], despite the fact that the obtained values are not higher for all the alloys and quite a small difference.
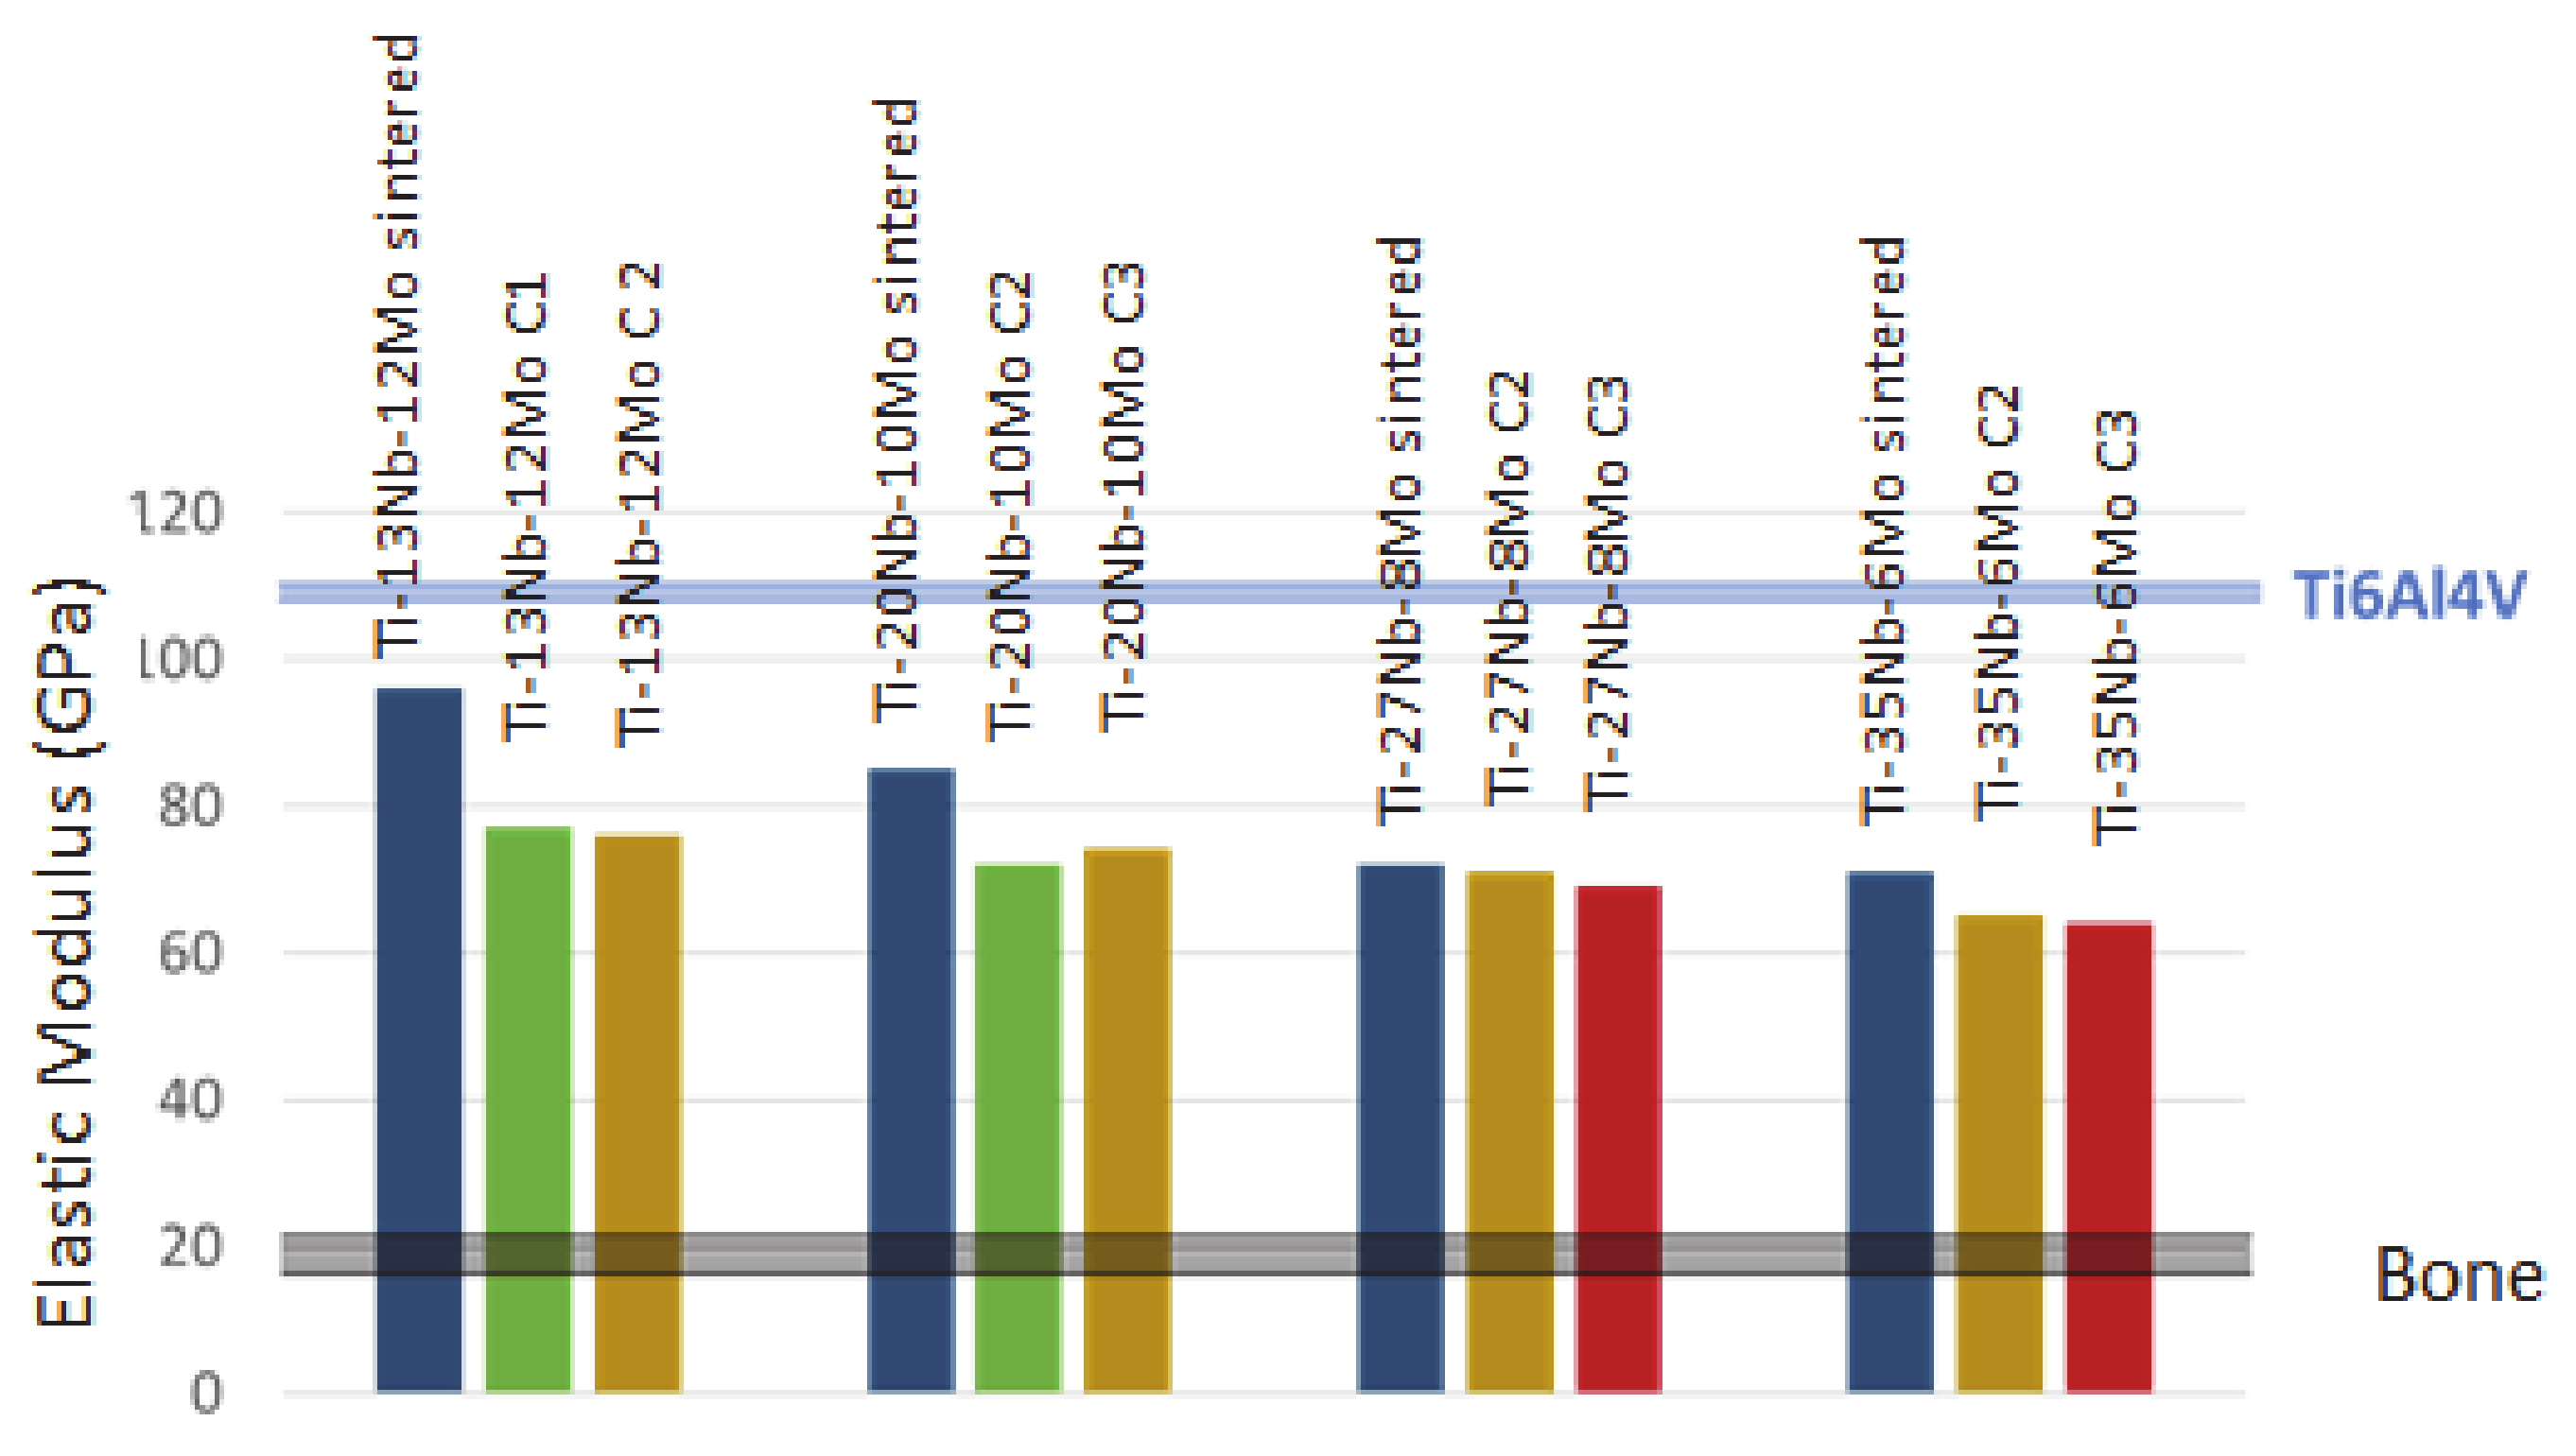
The decrease in the elastic modulus as Mo content lowered is worth noting (Figure 14). Besides, we can see a reduction with laser surface fusion which is, in any case, considerably lower than that of the Ti-6Al-4V alloy [21]. However, as with the vast majority of currently investigated biomedical alloys [4,22,23], the elastic modulus value of the Ti-Nb-Mo alloys was well above the elastic modulus of bone tissue.
Hardness was affected by different Nb and Mo concentrations in alloys, while the difference between the values obtained for HAZ and BM did not seem to significantly contribute to the material’s hardness. When observing the results obtained with other powder metallurgical alloys, the hardness ranges came very close to the corresponding forging alloys and depended largely on the sintering temperature at which materials were produced [9,24].
In the modified areas, the obtained hardness value was higher than the corresponding BM. This could be due to the greater homogeneity of the studied matrix, which could be verified in complementary microscopy studies, together with the disappearance of porosity, which reduces any material’s mechanical properties. This increase in surface hardness could provide interesting improvements to the material’s wear behavior [25], which is very important in the biomedical field because it requires contact movement between different components. Relatively low wear resistance leads to excessive wear, mechano-chemical instability and, consequently, to implant loosening [26].
It is noteworthy that the hardness values generally obtained for the surface treatment lowered as the analysis distance progressed. This decrease was attributed to the microstructural evolution caused by surface treatment. The laser is used to induce thin layer fusion on the metal surface, which modifies the material’s surface properties due to rapid melting, followed by fast solidification. The fact that the melt and the solid substrate come into close contact with one another caused very rapid heat extraction during solidification which, in turn, resulted in very high cooling rates in the order from 105 to 108 K/s [27]. The high cooling rates to which this surface layer was subjected gave rise to different microstructures forming from the BM.
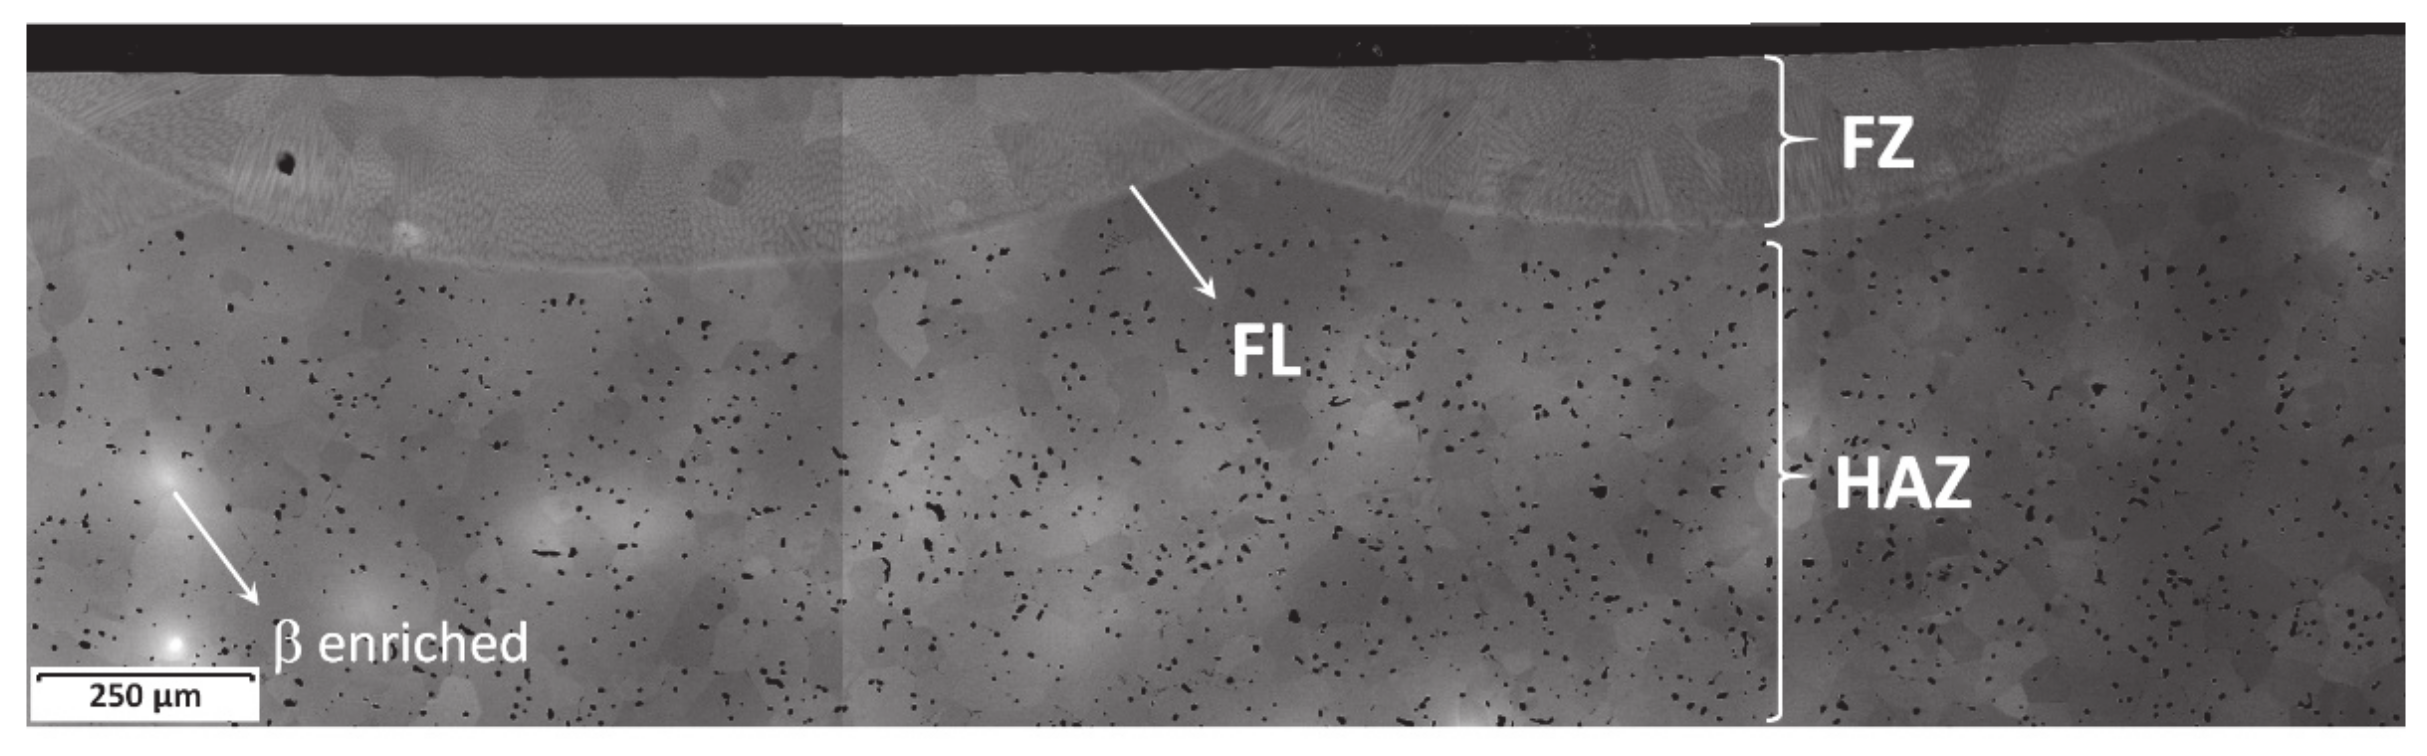
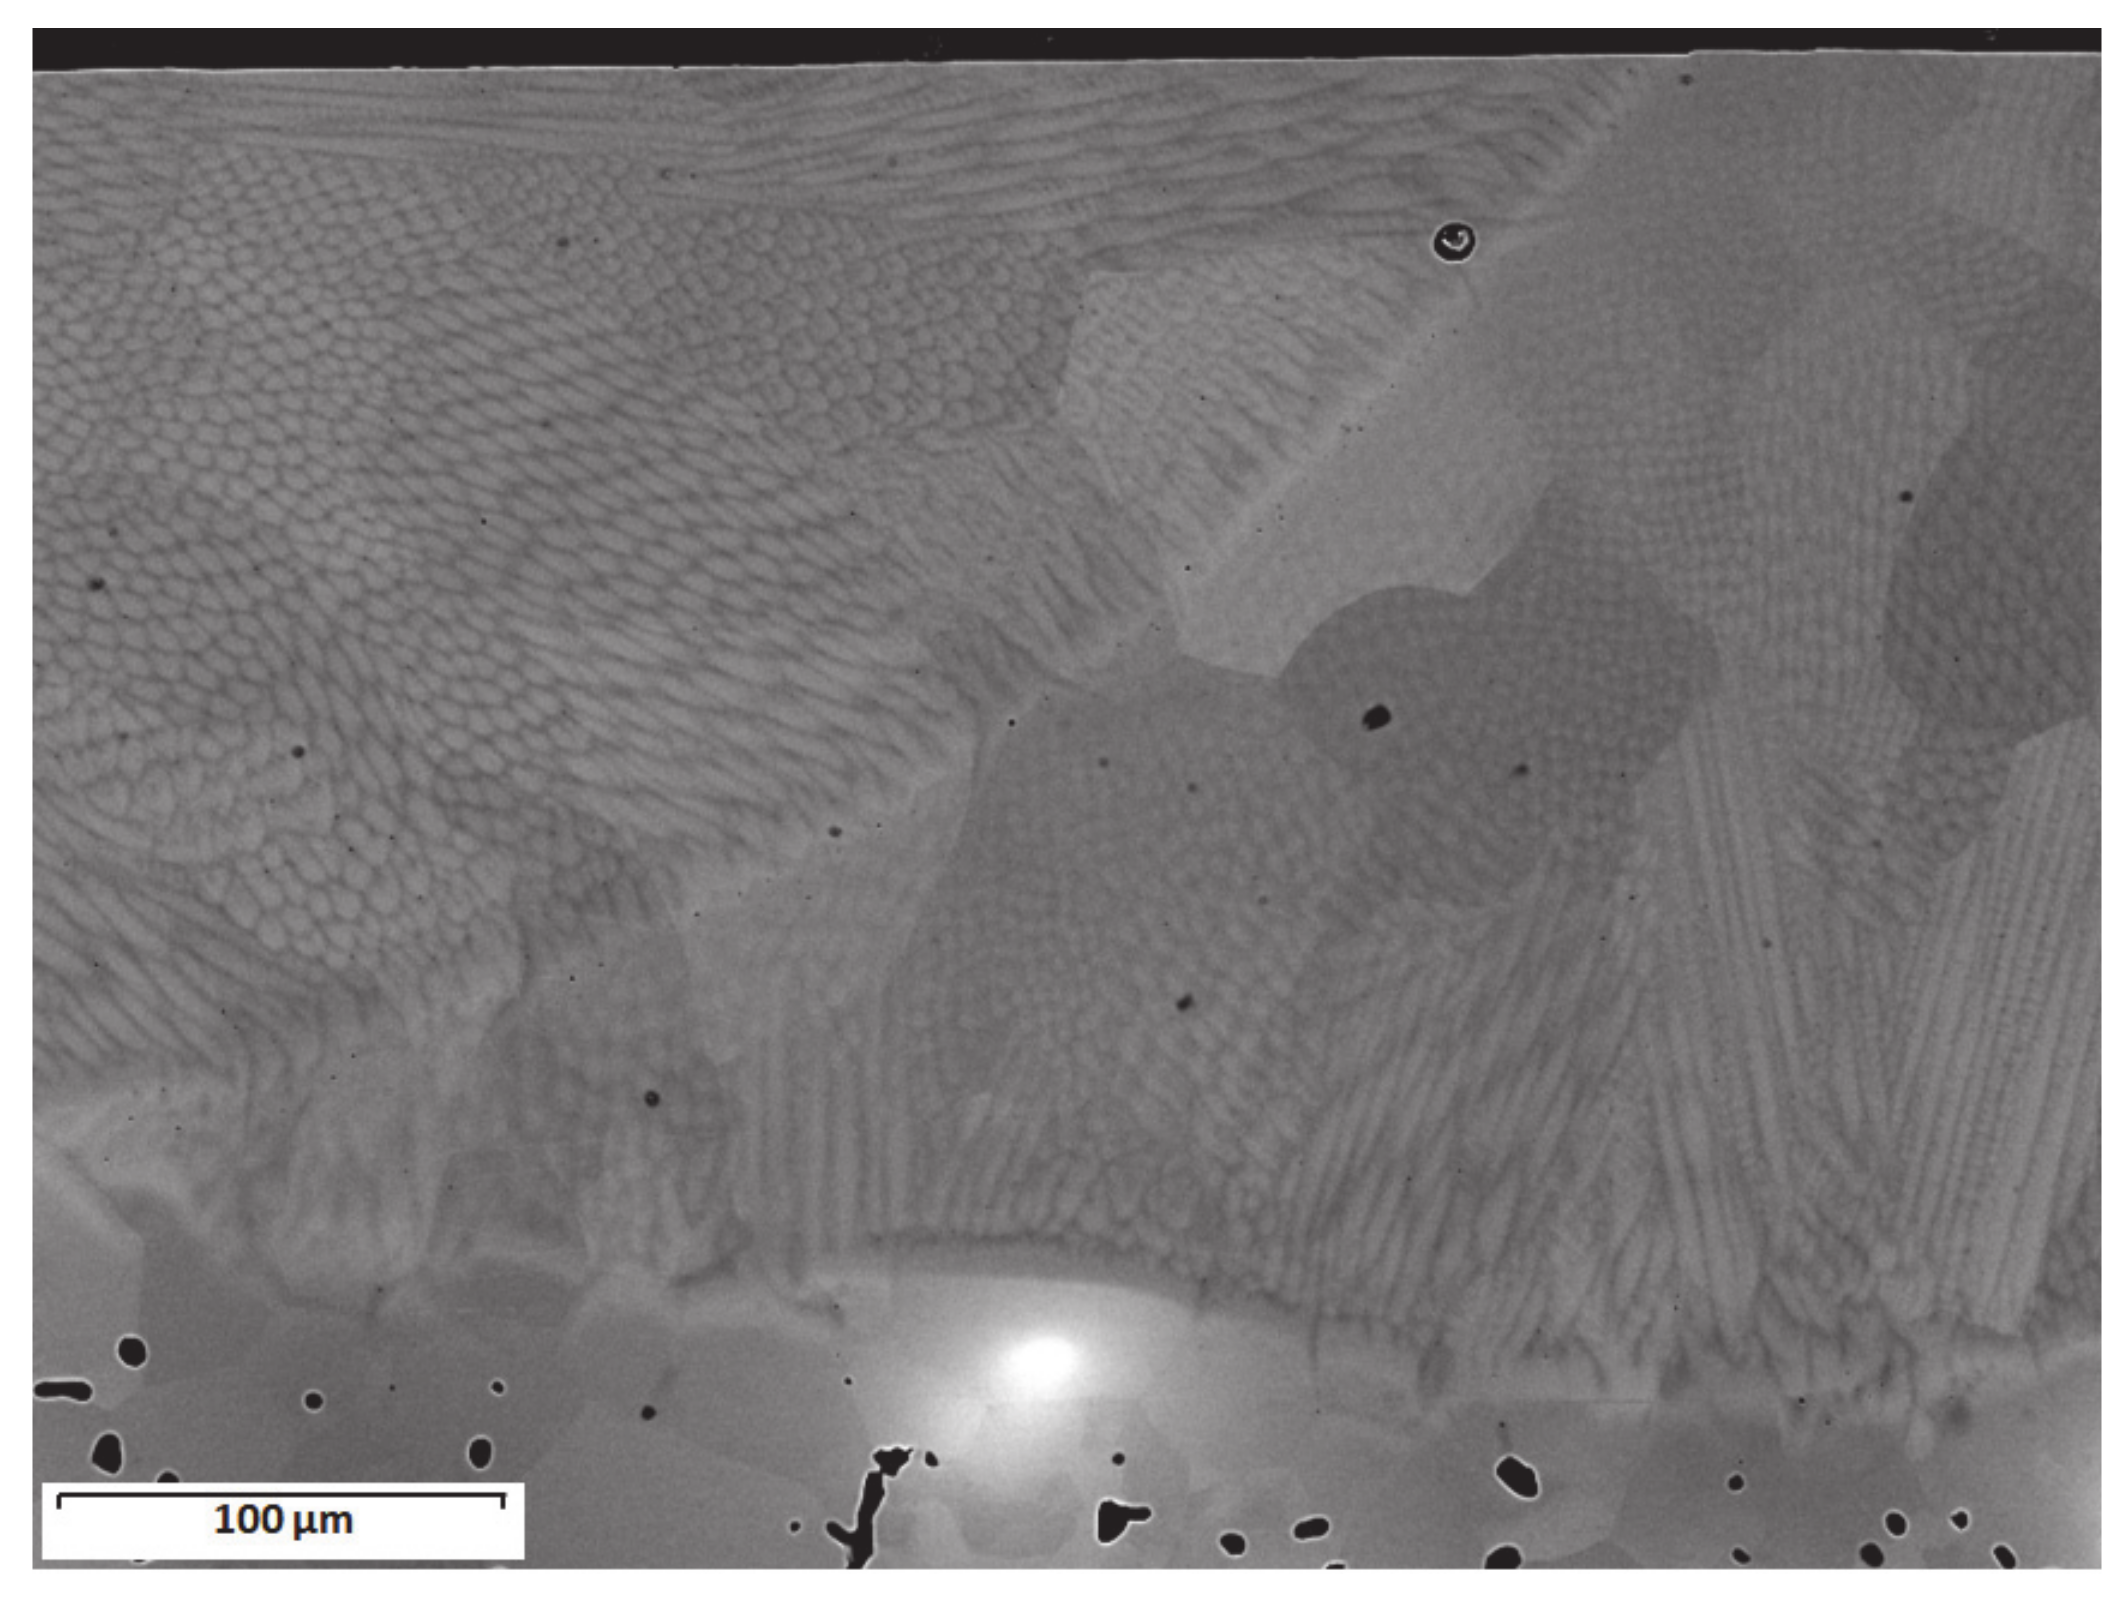
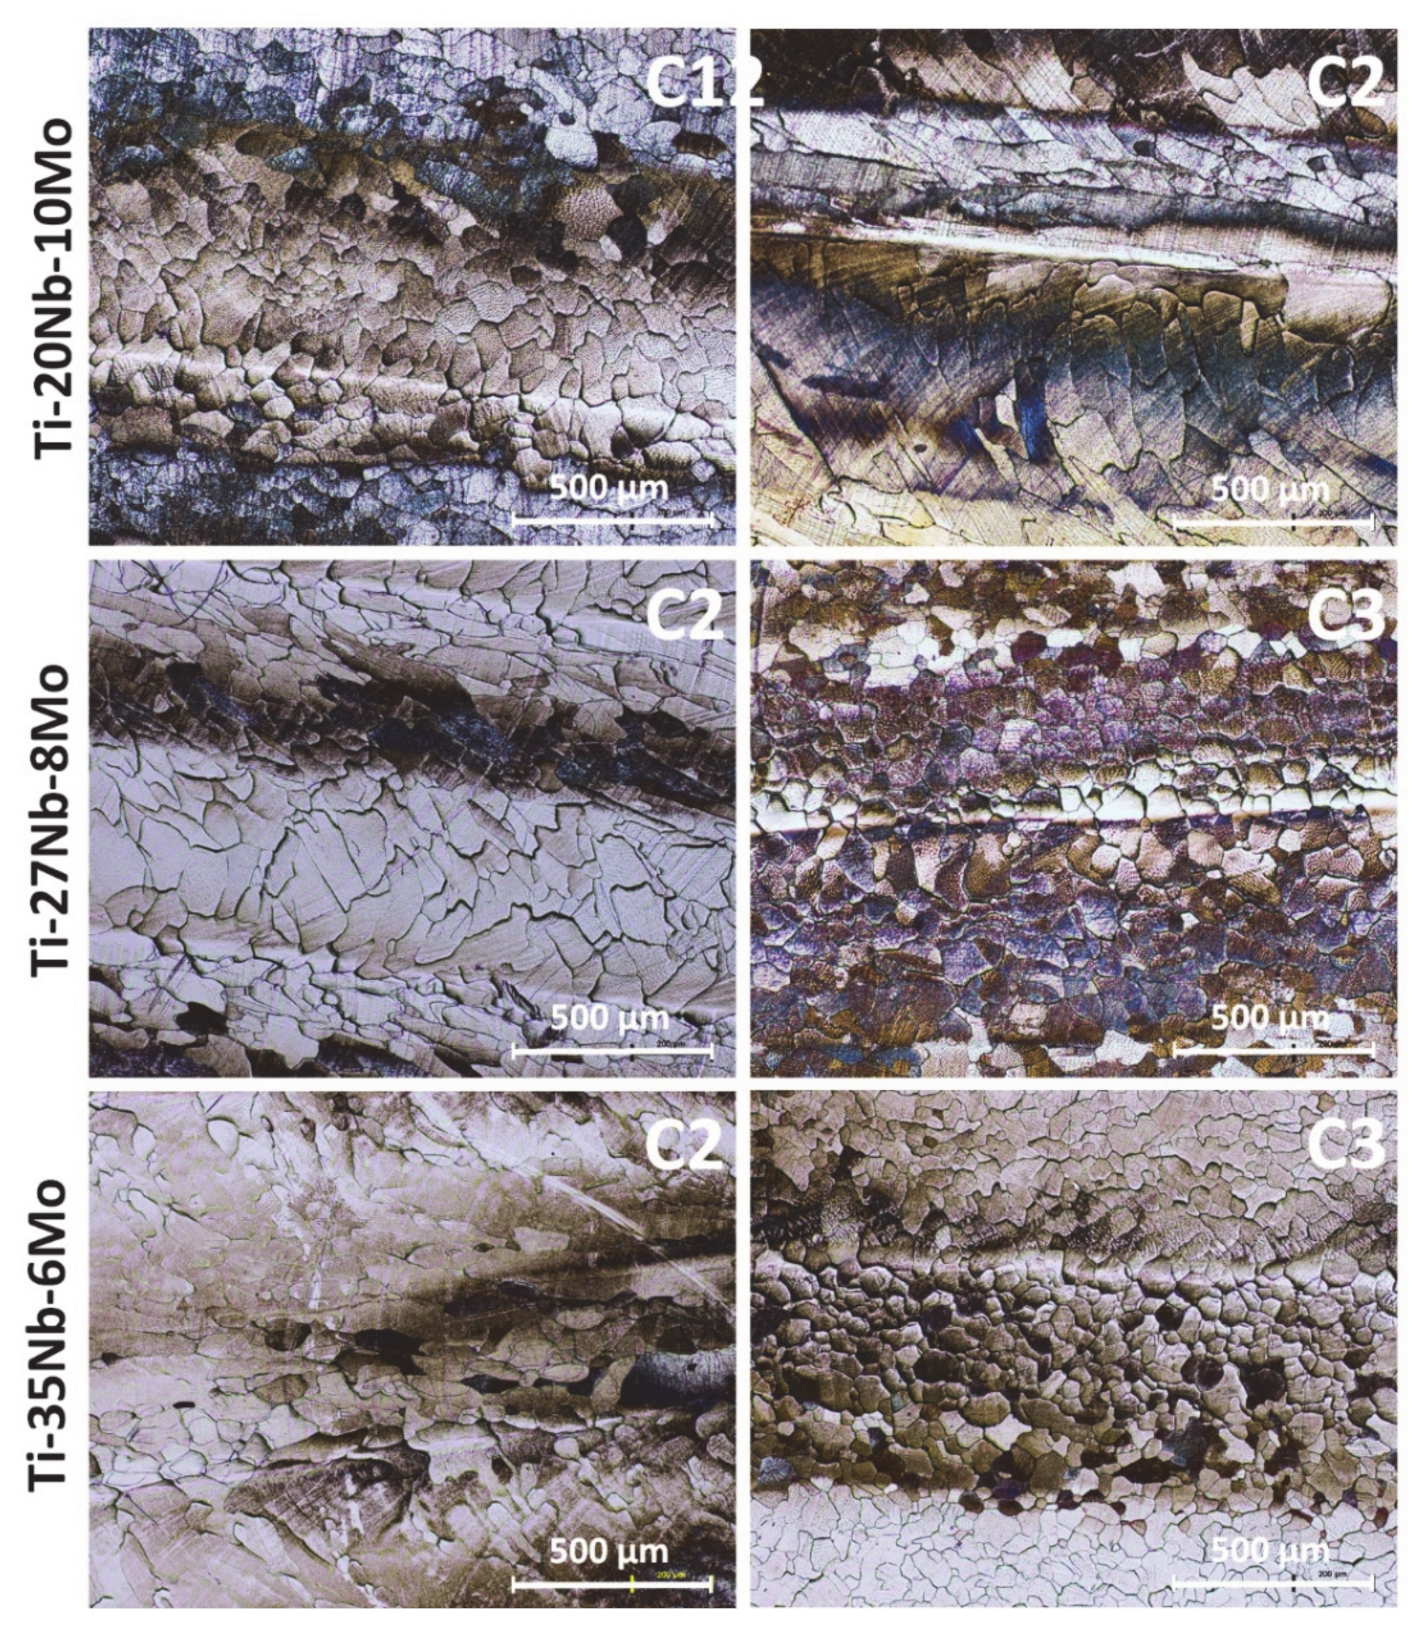
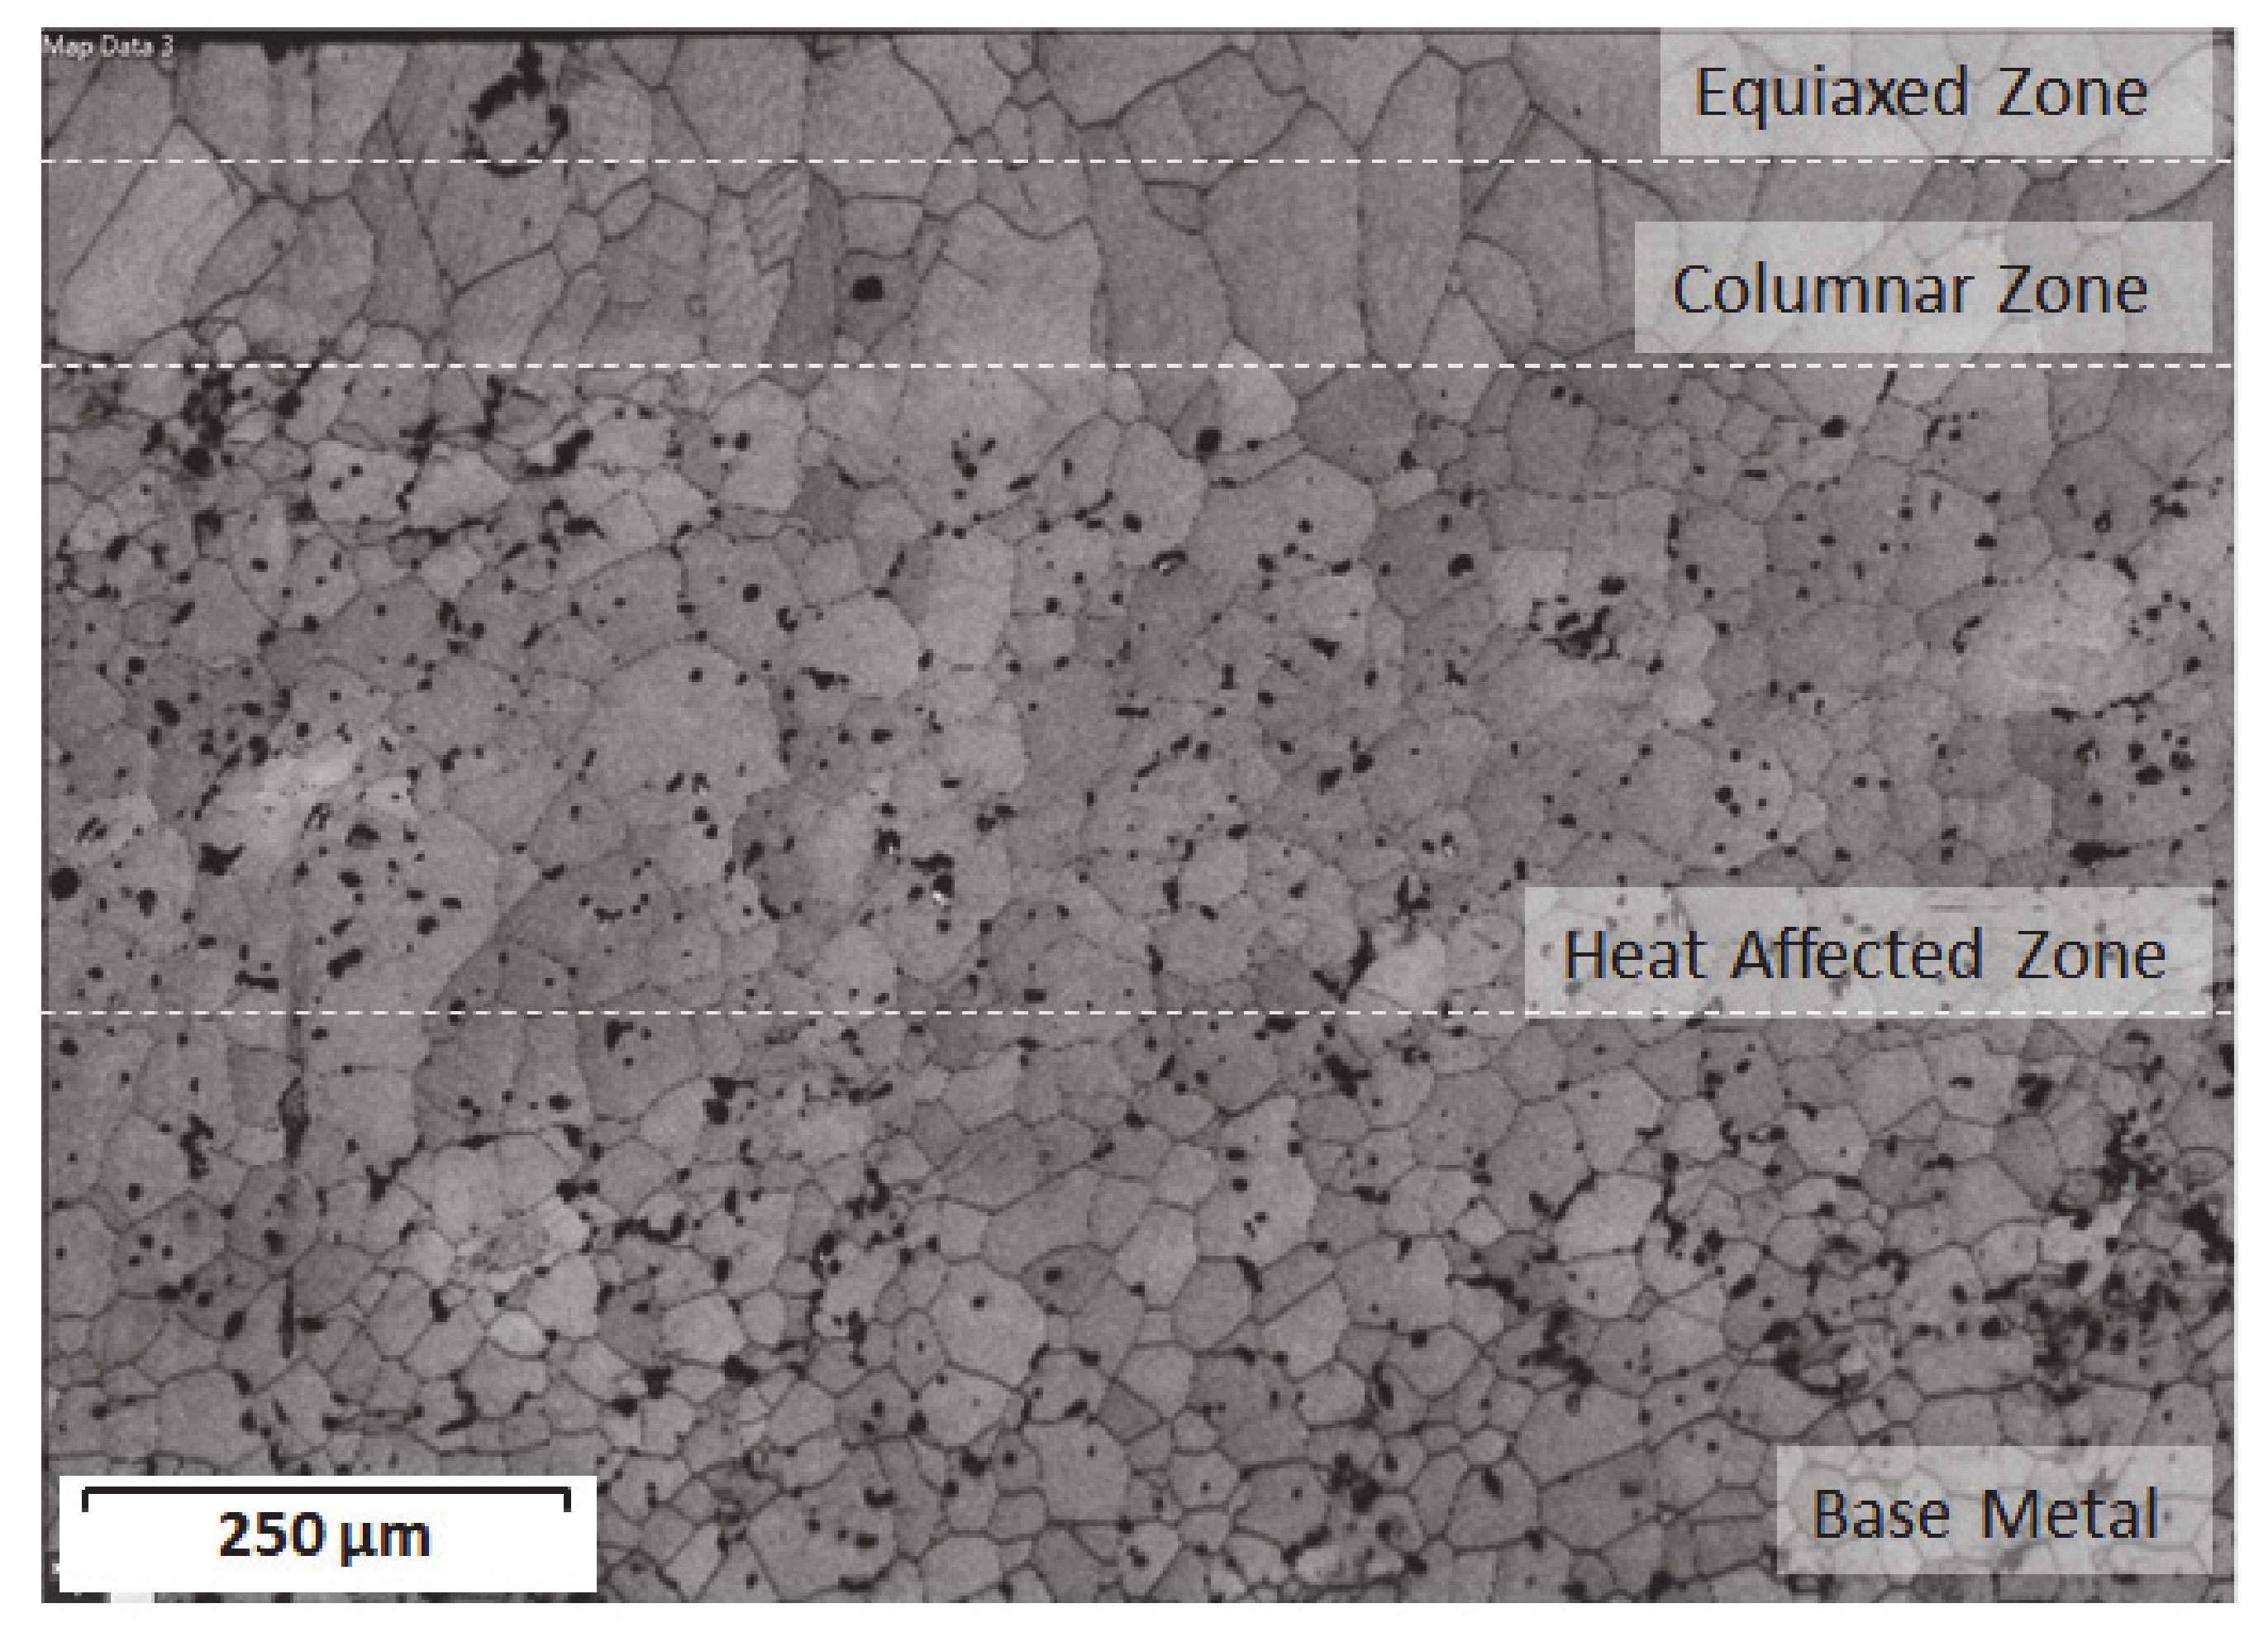
The image in Figure 15, which is related to the cross-section of the Ti-27Nb-8Mo alloy (Condition 2) with laser surface fusion, allows us to clearly see the three zones into which we divided the specimen: FZ, HAZ, and BM. In this image, the different microstructural zones are roughly marked because of the wide variety in the laser-fused zone between grain characteristics. Although columnar grain growth is seen, we also found that grains were more equiaxed in the most superficial area. In this way, the laser fused zone can be divided into two zones: An equiaxial microstructure zone exposed to a very fast cooling rate for being that which came into contact with air; a columnar microstructure with grains of 100–250 μm in diameter and subjected to a somewhat slower cooling rate. So, these columnar grains nucleated from HAZ and grew vertically through FZ.
At the same time, there was no well-defined boundary between BM and HAZ, whose microstructure gradually varied with the distance from the laser fused zone. The HAZ microstructure consisted of poorly defined equiaxed grains in which the presence of α” was still detected in their interior.
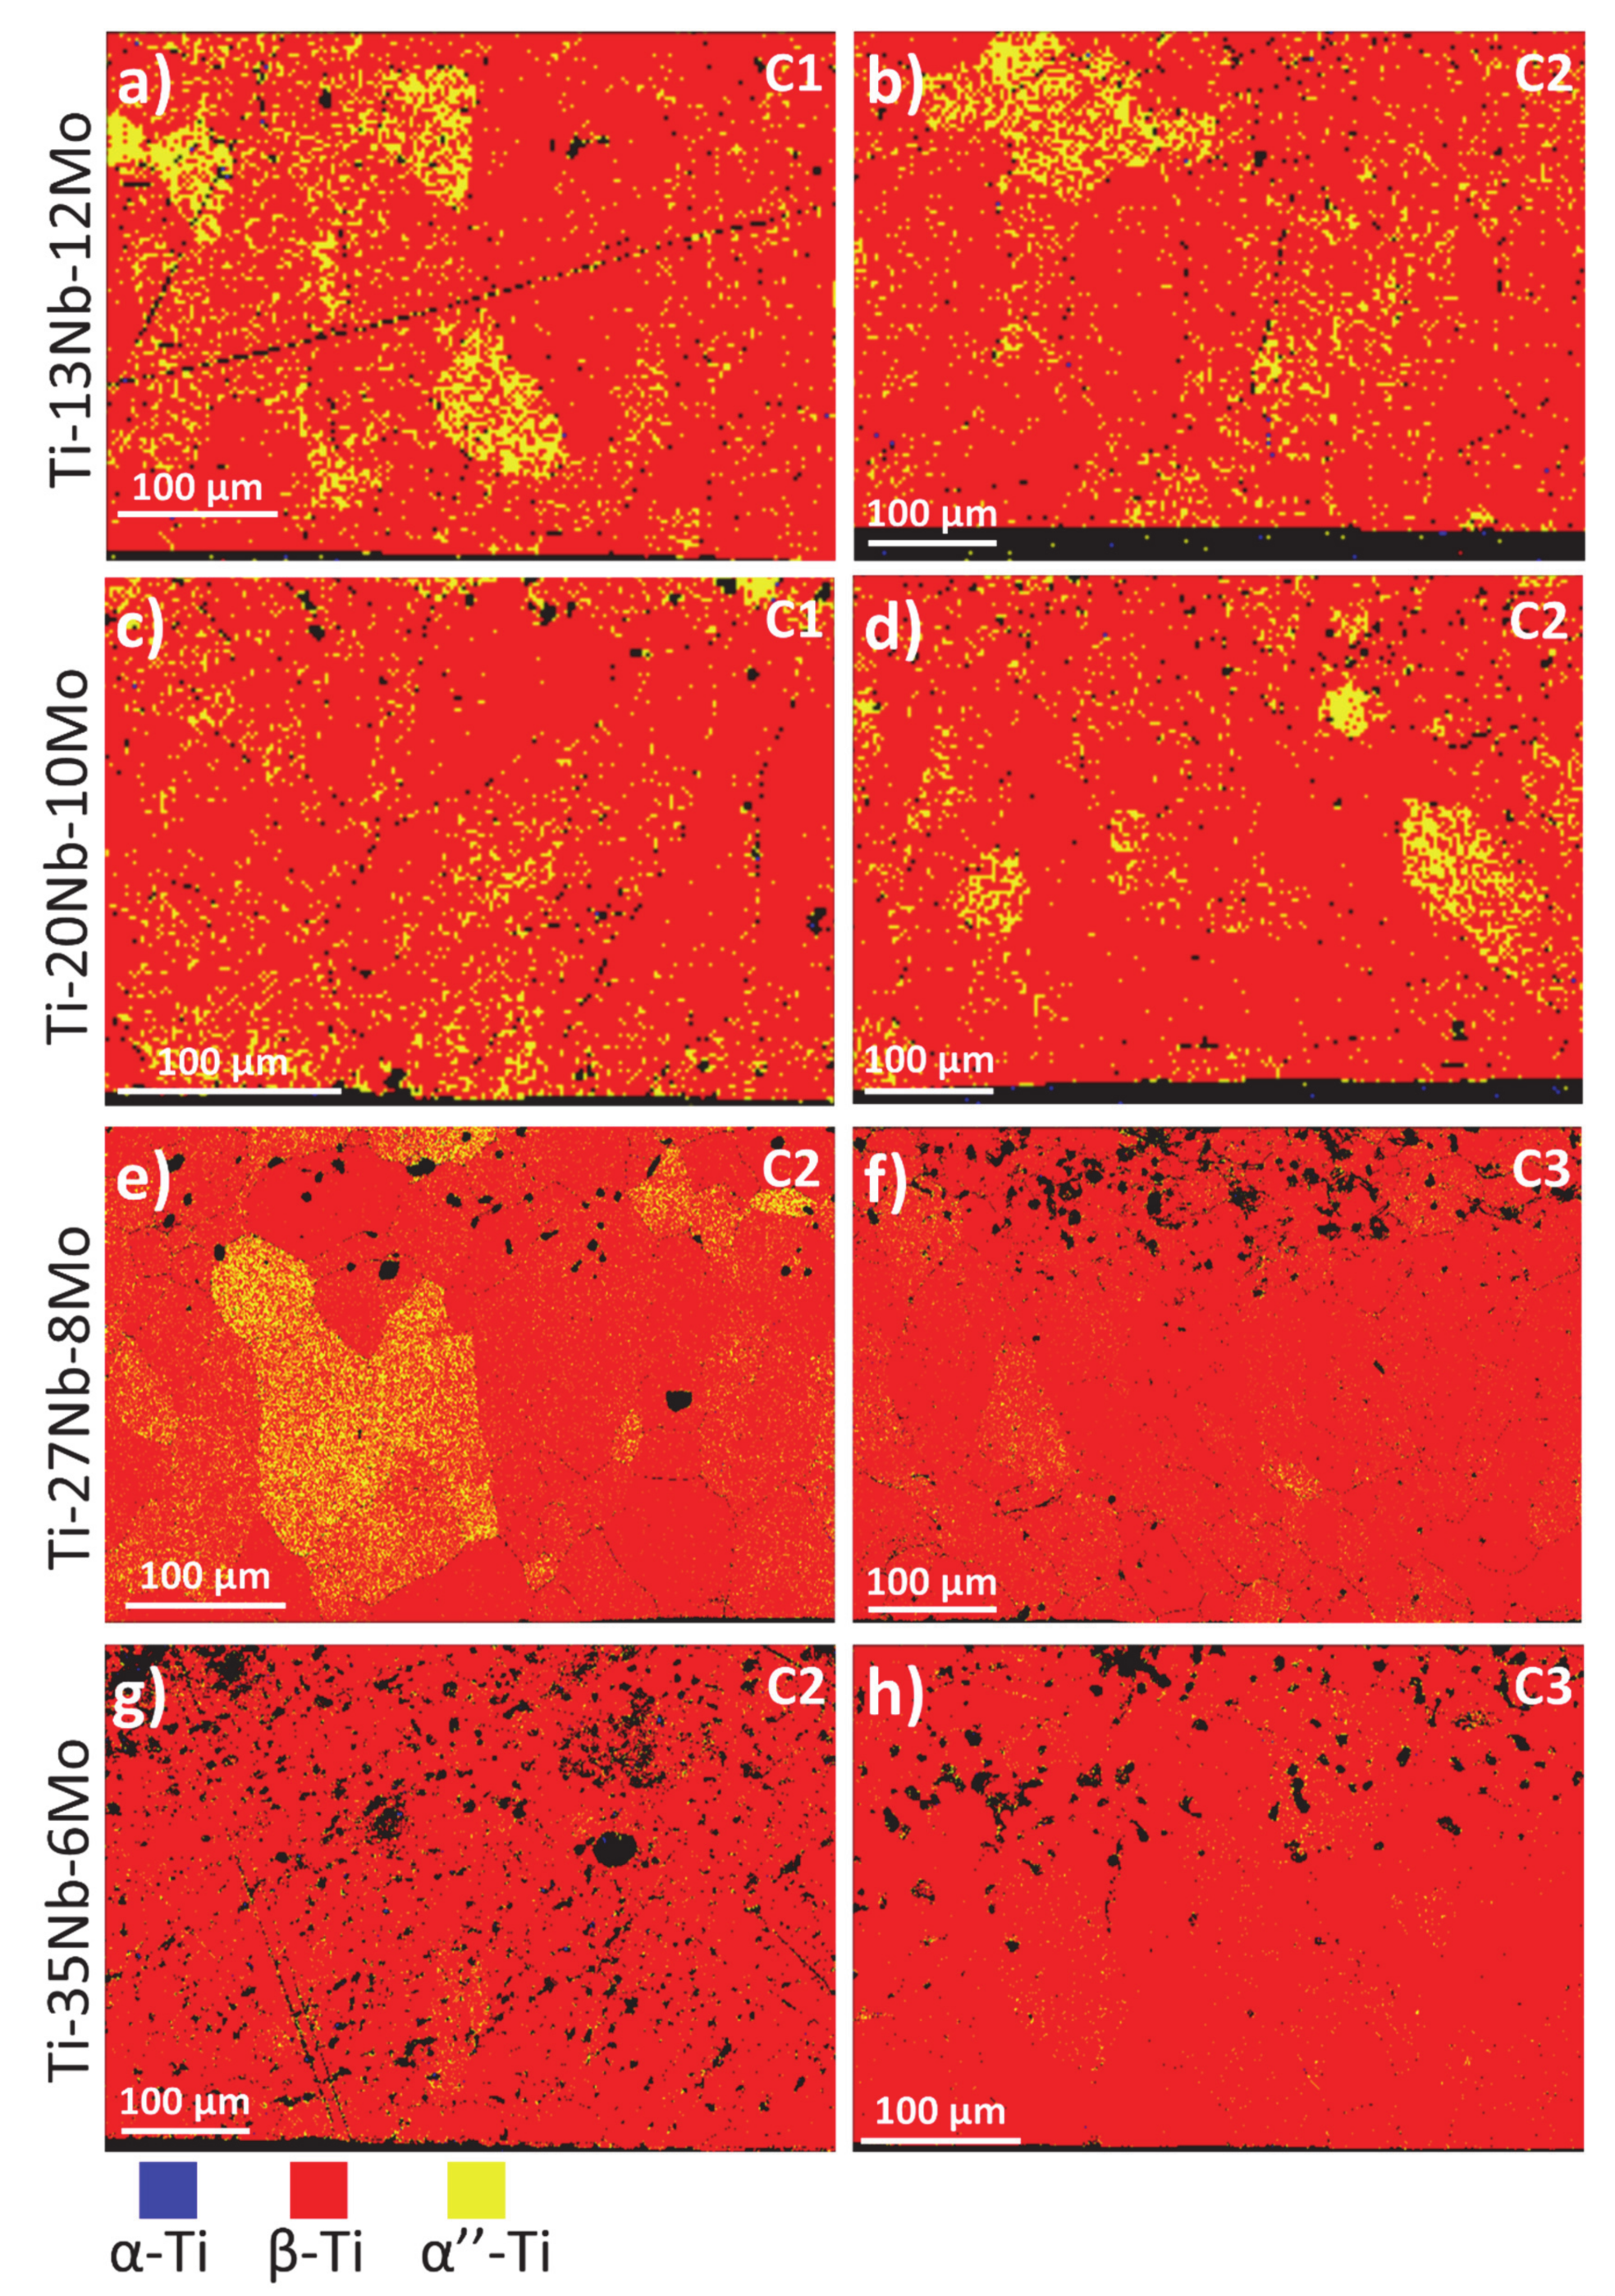
The alloys’ microstructure was predicted thanks to the equivalent Mo percentage but, above all, thanks to the orbital theory. When observing the representation of the different alloys in the Bo-Md diagram, and according to Bignon and co-workers [28], the Ti-Nb-Mo alloys came very close to a martensitic structure, and the precipitation of α” after heat treatment was possible.
These mechano-microstructural properties are decisive for ion release and to avoid corrosion processes. The interaction between the implanted biomaterial and the surrounding tissue allowed the diffusion of ions and microparticles, which has often been associated with clinical complications. Ti spontaneously oxidizes by creating a passive layer, whose physico-chemical properties are decisive during this electrochemical process [29].
Alloys’ biocompatibility can be linked with the amount of elements released under certain clinical conditions. The choice of alloy elements Nb and Mo was because they are non-cytotoxic, and they present interesting and promising qualities for biomedicine [30].
Possible Ti toxicity is uncertain, and information on this matter in the literature is scarce. Compared to other metal ions like Co + 2 or Cr + 3 [31], the effect of Ti is generally considered non-cytotoxic. However, several recent studies suggest that, despite the considered inert biological Ti activity due to its rapid oxidation, some cases of patients with Ti implants reveal a series of adverse effects associated with this metal, which include inflammation, pain, cytotoxicity, allergy to metals, genotoxicity, carcinogenicity, and implant failure [32,33,34]. It should be noted that as failed implants result in deep material deposition in distant organs, it is important to know the biomaterial’s ion release behavior and, if possible, to study how it can be improved.
According to Schroeder and co-workers [35], typical diets can contain approximately 0.3–0.5 mg of Ti. Taking Ti orally remains largely unabsorbed because the rapid oxidation of this metal and its ions prevents their permeability through human excretory systems. The Ti concentrations generally found in urine (approx. 10 μg/L) suggest <5% absorption when assuming a daily intake of at least 300 μg. However, this estimate may be erroneous due to possible non-contemplated excretion routes. The concentrations of the released Ti ions were all below 10 μg/L, which would generally contain human urine. Furthermore, these concentrations occurred after 730 h of testing, which are the equivalent to 20 years of implantation. Thus, Ti concentrations would be lower thanks to excretion mechanisms.
For Nb, it is estimated that a diet containing 100 g of protein, 250 g of carbohydrates, and 100 g of fat would contain 620 μg of Bn. Furthermore, excreted Nb would also be 620 μg [36]. In this way, we see that despite the fact that Ni concentrations seemed very high at first, adapting diet would not be harmful thanks to the body’s rapid effective excretion mechanisms. It is worth highlighting the marked interest in carrying out a cellular study, that is, cell cultures in Ti-Nb-Mo alloys, to find out if these ions have local harmful effects.
Finally, the obtained concentrations of the Mo ions were analyzed. As Mo is an essential chemical element, it should not be as cytotoxic as other components. The estimated daily Mo intake ranges from 50 to 126 μg/day [37,38] and urinary excretion averages 69 μg/day [39]. When observing these data with the results obtained by the chemical characterization of alloys for this ion, we noted very low Mo concentrations, which were much lower than the urinary mean. This implies that there should be no general toxicity problems.
It should be noted that this assay is not ideal. In the physiological environment, we find proteins or other organic molecules that can affect the behavior of implanted biomaterials [40]. However, considerable uncertainty lies in the effect of proteins on the implant’s metal surface. For example, the effect of albumin, which is the most abundant protein in the bloodstream, has been reported. In order to obtain conclusive conclusions on the behavior of these alloys when releasing ions, several factors must be considered. We firstly analyzed the specific area. The tested surface was obviously proportional to the released ions and, thus, test results (Table 7) depend on the specific area exposed to the electrolyte. Hence in order to be able to compare the different obtained concentrations, it would be necessary to divide the corresponding value between each sample’s tested surface. The sample surface state would also be a determining factor for the test or, in other words, the surface oxide layer, processing type and subsequent alloy treatment. For this factor, we find different characteristics linked with the manufacturing processes and subsequent treatments of alloys, such as the distribution of microstructural phases or grain sizes. Finally, one factor has already been taken into account, namely the effect of liquid on alloys.
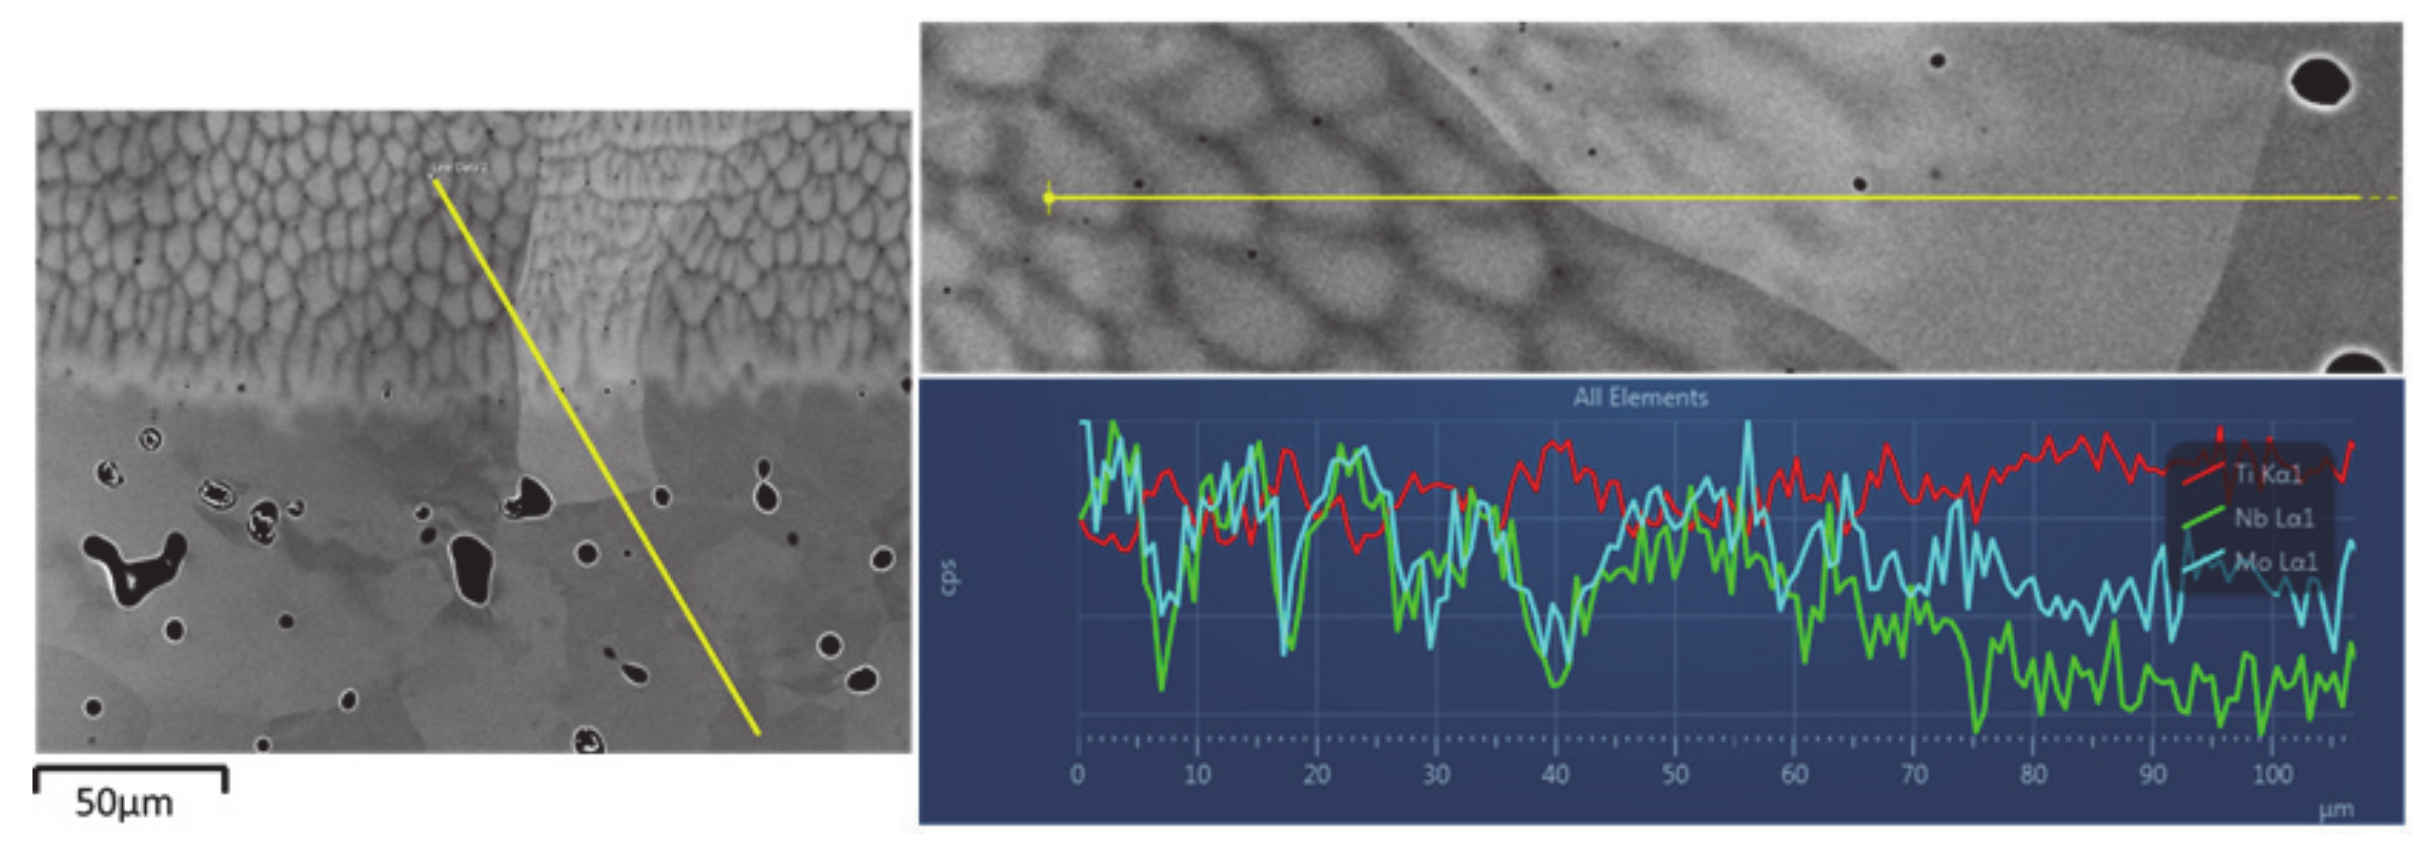
The Ti-27Nb-8Mo and Ti-35Nb-6Mo alloys, respectively, in their C3 and 2, presented a low ion release rate, explained by the presence of non-diffused Nb particles under the other conditions, which had a much more uniform surface for both their chemical composition and surface porosity.
Chemical characterization was completed by conducting corrosion tests and considering that these alloys were designed as β-Ti alloys. These alloys exhibited better corrosion behavior than the rest [41].
The Pourbaix diagram reveals how the thermodynamically stable Ti state is the Ti3+ anion at a pH below 1.49 within the range of potentials that come close to OCP. By regarding the passive layer of these Ti alloys, Kolman and Scully [42] showed that a low passivation rate, that is, of TiO2 formation, led to Ti3+ Production. Although nothing has been proven, the accumulation of these ions always occurs in implant failure. Therefore, an improved Ti alloy would show greater resistance to anodic dissolution at a negative pH, as well as better passivation–repassivation behavior to limit Ti3+ production compared to currently available Ti-based alloys. Therefore, the stability and passivation speed that Nb contributes to the passive layer of Ti alloys renders it a very important component for biomedical alloys.
The alloys with laser surface fusion presented a more positive open circuit potential (OCP) value than the powder metallurgical alloys, which means that these performed surface treatments seemed to improve the studied alloys’ corrosion behavior. As Nb content rose, the alloys’ behavior was nobler because their values were closer to zero. However, the alloys’ surface hardness and the received surface treatment had a statistically significant effect on the different alloys’ corrosion behavior.
Protecting each alloy’s passive surface layer is related to resistance to polarization (Rp). A higher Rp value means greater corrosion resistance. For high corrosion-resistant materials, resistance to polarization lies in the order of 106 Ω [43]. The values obtained for Rp (Table 7) showed that all the alloys that underwent surface treatment would be highly corrosion-resistant materials, and even alloys Ti-13Nb-12Mo and Ti-20Nb-10Mo that did not undergo surface treatment obtained results in the order of 106 Ω.
The passive dissolution rate of the porous Ti-20Nb-10Mo alloy that was not subjected to surface treatment obtained the highest corrosion rate with an average value of 4.52 μm/year, while much more interesting values for implantology were obtained for the alloys subjected to surface treatment, especially for Ti-27Nb-8Mo in both C2 and 3.
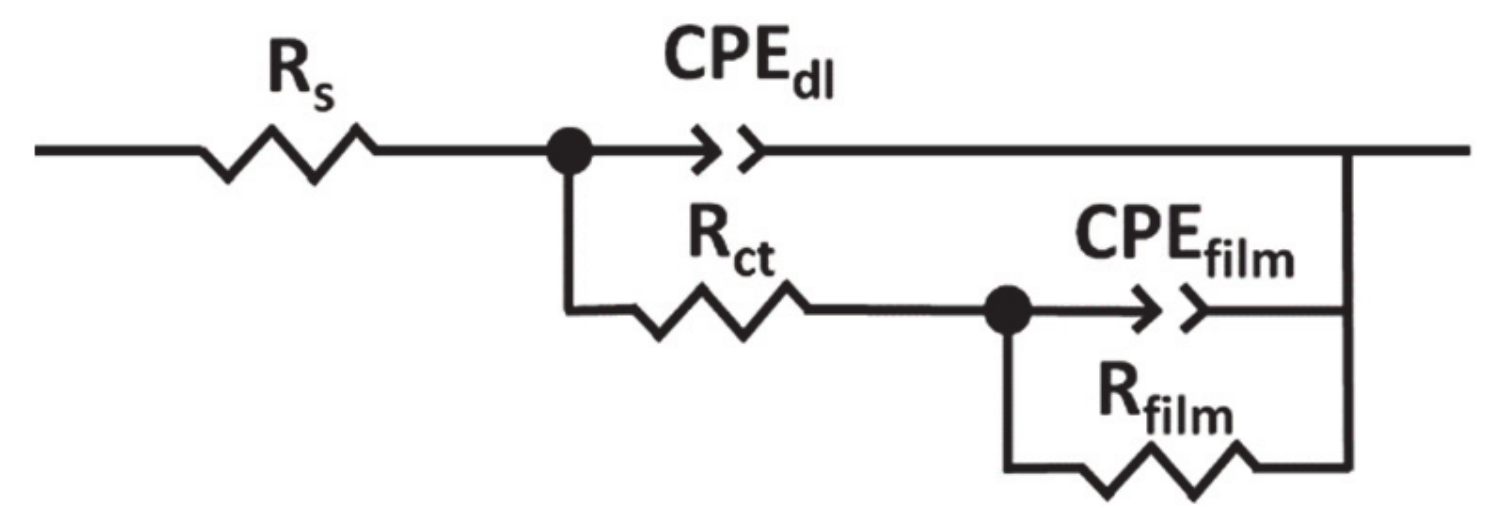
The passive oxide coating formed by the Ti alloys immersed in an aqueous solution was a bilayer formed by an inner compact layer and another outer porous layer, which falls in line with what other authors report [44,45]. However, to demonstrate a good fit to the electrical model, a chi-square value (χ2) below 10−3 was sought and was obtained only with the composite circuit that simulated the double porous layer. In this way, it was possible to model the effects on the double oxide layer of the studied samples.
According to the settings obtained for the circuit that simulated the double porous layer, the internal compact layer presented significantly greater resistance (Rfilm) than the values associated with the external porous layer (Rct). Next the ‘n’ fit was attributed to the unevenness and inhomogeneity on the surface. In this way, we observed that the adjustment of the nfilm exponent gave values close to 1, and the CPEfilm component behaved similarly to that of a pure capacitor. Unlike nfilm, the ndl exponent had lower values, and CPEdl component behavior was less capacitive due to the greater heterogeneity on the external porous layer. With these values, we were able to discern that the main surface protection was due to the internal compact layer and that a passive layer dissolving process could take place on the external layer of some alloys with very low ndl coefficients.
Passive film thickness is given by the equation d = ε × ε 0 C [46,47], where d is film thickness, ɛ is the dielectric constant, ɛ0 is the permittivity of the free space, and C is the passive film capacitance. To simplify calculations, 1/C was taken as a comparative parameter between the different obtained thicknesses because this value was directly proportional to passive layer thickness.
By evaluating the 1/CPEdl and 1/CPEfilm results for the different alloys, we concluded that alloys Ti-27Nb-8Mo in C3 and Ti-35Nb-6Mo in C3 had much higher porous inner layer thickness values (Table 9). Hence we can state that they offer promising results in corrosion behavior terms. It is worth noting that except for some samples, CPEfilm and CPEdl were either due to a worse fit or worse behavior during testing, and could have more or less close values in some cases, with a higher CPEdl value in many other cases. In this case, we highlight that the lower the passive layer capacity, the higher the thickness value of this layer, and the less compact and more likely it would be to present active dissolution. Thus, we see that the CPEdl values for some alloys, especially porous ones, but also for some others like Ti-20Nb-10Mo in C1, presented a passive dissolution risk.
With the results obtained for the behavior model of the passive layer, the presence of a porous oxide layer with good osseointegration capacity could be related to the presence of that external porous layer. When implanting a Ti alloy, cells may occupy passive film pores and favor bone-implant adhesion. This assumption could be made by the fact that integrating the alloy into the body, the so-called implant anchoring, has been found to be more efficient due to an increased non-uniform contact space [48].

5. Conclusions

The surface modification obtained in the alloys processed by powder metallurgy was possible by the laser surface fusion of the surface, which gave a layer of homogeneous chemical composition and high density, in the studied Ti-Nb-Mo alloys with the same Moeq. After analyzing the different fusion conditions in the individual strands, two suitable conditions were selected for each alloy (Ti-xNb-yMo), which permitted extensive surface fusion. The specific conclusions are listed above:
  • The mainly obtained phase is β phase, with a slight percentage of transformation into α”-martensite, mainly in FZ.
  • Maximum resistance to bending is higher after the superficial fusion carried out on both the sintered material’s surfaces. In almost all cases, the highest values correspond to around 1500 MPa for the Ti-27Nb-8Mo alloy.
  • In this same alloy and for both tested conditions, plastic deformations exceed 7%, which are the highest to be obtained under all the laser fusion conditions and tested alloys.
  • Microhardness shows differences caused by surface treatment, with values close to 300 HV in the zone hardened by treatment and lower values, depending on the alloy, in BM. The Ti-20Nb-10Mo alloy in its C2 presents the highest hardness in FZ, around 350 HV.
  • The elastic modulus after LSM lowers by around 10% compared to the samples without LSM. The elastic modulus also lowers with Nb content, from 77 GPa for the Ti-13Nb-12Mo alloy (C1) to 64 GPa for the Ti-36Nb-6Mo alloy (C3).
  • The corrosion rate lowers under some laser treatment conditions in alloys Ti-27Nb-8Mo and Ti-35Nb-6Mo.
  • Significant Nb release takes place, but is below the physiological limit thanks to the body’s metabolic systems for eliminating this metal
  • The curves obtained for OCP and the polarization of alloys highlight the alloys’ superior corrosion behavior with the laser fusion surface treatment, with values from around −0.40V for the porous samples to −0.15V for the superficially treated samples.
  • Electrochemical impedance spectroscopy concludes that all the studied alloys have a high potential in the medicine field, specifically the powder metallurgical Ti-27Nb-8Mo and Ti-35Nb-6Mo alloys with subsequent laser fusion surface treatment.

Author Contributions

Conceptualization: I.T.; V.A.; methodology: I.T., V.A. and A.Y.; investigation: I.T., M.V., J.M.A. and Á.V.; resources: Á.V., V.A. and A.Y.; writing—original draft preparation: I.T.; M.C.R.; writing—review and editing: M.C.R., V.A., M.J.T.; supervision: V.A. and A.Y; project administration: V.A. and A.Y.; funding acquisition: V.A., A.Y. All authors have read and agreed to the published version of the manuscript.

Funding

The authors thank the Ministerio de Economía y Competitividad de España for Research Project RTI2018-097810-B-I00 and the Ministerio de Economía y Competitividad de España for Research Project RTI2018-096472-B-I00. The European Commission thanks to FEDER and the São Paulo State Research Support Foundation (FAPESP) [Grant: 2019/24237-6].

Institutional Review Board Statement

The study did not require ethical approval.

Informed Consent Statement

Not applicable.

Data Availability Statement

Not applicable.

Acknowledgments

The authors would like to thank the valuable technical support provided by J. C. Zambrano Carrullo.

Conflicts of Interest

The authors declare no conflict of interest.

References

  1. Long, M.; Rack, H.J. Titanium alloys in total joint replacement—A materials science perspective. Biomaterials 1998, 19, 1621–1639. [Google Scholar] [CrossRef]
  2. Okazaki, Y.; Ito, A.; Tateishi, T.; Ito, Y. Effect of Alloying Elements on Mechanical Properties of Titanium Alloys for Medical Implants. Mater. Trans. JIM 1993, 34, 1217–1222. [Google Scholar] [CrossRef] [Green Version]
  3. Niinomi, M.; Akahori, T.; Hattori, Y.; Morikaw, K.; Kasuga, T.; Fukui, H.; Suzuki, A.; Kyo, K.; Niwa, S. Super elastic functional β titanium alloy with low young’s modulus for biomedical applications. J. ASTM Int. 2005, 2, 1–16. [Google Scholar] [CrossRef]
  4. Bai, Y.; Deng, Y.; Zheng, Y.; Li, Y.; Hang, R.; Lv, Y.; Zhao, Q.; Wei, S. Characterization, corrosion behavior, cellular response and in vivo bone tissue compatibility of titanium-niobium alloy with low Young’s modulus. Mater. Sci. Eng. C 2016, 59, 565–576. [Google Scholar] [CrossRef] [PubMed]
  5. Ho, W.F.; Ju, C.P.; Chern Lin, J.H. Structure and properties of cast binary Ti-Mo alloys. Biomaterials 1999, 20, 2115–2122. [Google Scholar] [CrossRef]
  6. Al-Zain, Y.; Kim, H.Y.; Hosoda, H.; Nam, T.H.; Miyazaki, S. Shape memory properties of Ti-Nb-Mo biomedical alloys. Acta Mater. 2010, 58, 4212–4223. [Google Scholar] [CrossRef]
  7. De Almeida, L.H.; Bastos, I.N.; Santos, I.D.; Dutra, A.J.B.; Nunes, C.A.; Gabriel, S.B. Corrosion resistance of aged Ti-Mo-Nb alloys for biomedical applications. J. Alloys Comp. 2015, 615, S666–S669. [Google Scholar] [CrossRef]
  8. Bolzoni, L.; Esteban, P.G.; Ruiz-Navas, E.M.; Gordo, E. Mechanical behaviour of pressed and sintered titanium alloys obtained from master alloy addition powders. J. Mech. Behav. Biomed. Mater. 2012, 15, 33–45. [Google Scholar] [CrossRef] [Green Version]
  9. Oh, I.-H.; Nomura, N.; Masahashi, N.; Hanada, S. Mechanical properties of porous titanium compacts prepared by powder sintering. Scr. Mater. 2003, 49, 1197–1202. [Google Scholar] [CrossRef]
  10. Froes, F.H.; Mashl, S.J.; Moxson, V.S.; Hebeisen, J.C.; Duz, V.A. The technologies of titanium powder metallurgy. JOM 2004, 56, 46–48. [Google Scholar] [CrossRef]
  11. Wang, H.T.; Lefler, M.; Fang, Z.Z.; Lei, T.; Fang, S.M.; Zhang, J.M.; Zhao, Q. Titanium and Titanium Alloy via Sintering of TiH2. Key Eng. Mater. 2010, 436, 157–163. [Google Scholar] [CrossRef]
  12. Esteban, P.G.; Bolzoni, L.; Ruiz-Navas, E.M.; Gordo, E. Introduction to powder metallurgy processes for titanium manufacturing. Rev. Metal. 2011, 47, 169–187. [Google Scholar] [CrossRef] [Green Version]
  13. Lutterotti, L. Total pattern fitting for the combined size-strain-stress-texture determination in thin film diffraction. Nucl. Instrum. Methods Phys. Res. B 2010, 268, 334–340. [Google Scholar] [CrossRef]
  14. ASTM E407-07(2015). Standard Practice for Microetching Metals and Alloys; ASTM International: West Conshohocken, PA, USA, 2015; pp. 1–22. [Google Scholar] [CrossRef]
  15. Ta, D.V.; Dunn, A.; Wasley, T.J.; Kay, R.W.; Stringer, J.; Smith, P.J.; Connaughton, C.; Shephard, J.D. Nanosecond laser textured superhydrophobic metallic surfaces and their chemical sensing applications. Appl. Surf. Sci. 2015, 357, 248–254. [Google Scholar] [CrossRef] [Green Version]
  16. Niinomi, M. Mechanical biocompatibilities of titanium alloys for biomedical applications. J. Mech. Behav. Biomed. Mater. 2008, 1, 30–42. [Google Scholar] [CrossRef] [PubMed]
  17. Mohan, P.; Elshalakany, A.B.; Osman, T.A.; Amigo, V.; Mohamed, A. Effect of Fe content, sintering temperature and powder processing on the microstructure, fracture and mechanical behaviours of Ti-Mo-Zr-Fe alloys. J. Alloys Comp. 2017, 729, 1215–1225. [Google Scholar] [CrossRef]
  18. Amigó, A.; Vicente, A.; Afonso, C.R.M.; Amigó, V. Mechanical Properties and the Microstructure of Ti-35Nb-10Ta-xFe Alloys Obtained by Powder Metallurgy for Biomedical Applications. Metals 2019, 9, 76. [Google Scholar] [CrossRef] [Green Version]
  19. Murphy, W.; Black, J.; Hastings, G. (Eds.) Handbook of Biomaterial Properties, 2nd ed.; Springer: NewYork, NY, USA, 2016. [Google Scholar] [CrossRef]
  20. Boyer, R.; Welsch, G.; Collings, E.W. (Eds.) Materials Properties Handbook: Titanium Alloys; ASM International: Materials Park, OH, USA, 1994. [Google Scholar]
  21. Niinomi, M. Mechanical properties of biomedical titanium alloys. Mater. Sci. Eng. A 1998, 243, 231–236. [Google Scholar] [CrossRef]
  22. Biesiekierski, A.; Wang, J.; Abdel-Hady Gepreel, M.; Wen, C. A new look at biomedical Ti-based shape memory alloys. Acta Biomater. 2012, 8, 1661–1669. [Google Scholar] [CrossRef]
  23. Pilz, S.; Geissler, D.; Calin, M.; Eckert, J.; Zimmermann, M.; Freudenberger, J.; Gebert, A. Thermomechanical processing of In-containing β-type Ti-Nb alloys. J. Mech. Behav. Biomed. Mater. 2018, 79, 283–291. [Google Scholar] [CrossRef]
  24. Bolzoni, L.; Ruiz-Navas, E.M.; Gordo, E. Quantifying the properties of low-cost powder metallurgy titanium alloys. Mater. Sci. Eng. A 2017, 687, 47–53. [Google Scholar] [CrossRef]
  25. Bloyce, A.; Qi, P.-Y.; Dong, H.; Bell, T. Surface modification of titanium alloys for combined improvements in corrosion and wear resistance. Surf. Coat. Tech. 1998, 107, 125–132. [Google Scholar] [CrossRef]
  26. Guleryuz, H.; Cimenoglu, H. Surface modification of a Ti–6Al–4V alloy by thermal oxidation. Surf. Coat. Tech. 2005, 192, 164–170. [Google Scholar] [CrossRef]
  27. Kurz, W.; Fisher, D.J. Fundamentals of Solidification, 4th ed.; CRC Press (Taylor & Francis): Boca Raton, FL, USA, 1998. [Google Scholar]
  28. Bignon, M.; Bertrand, E.; Tancret, F.; Rivera-Díaz-del-Castillo, P.E.J. Modelling martensitic transformation in titanium alloys: The influence of temperature and deformation. Materialia 2019, 7, 100382. [Google Scholar] [CrossRef]
  29. Landolt, D. Corrosion and Surface Chemistry of Metals; CRC Press, (Taylor & Francis): Boca Raton, FL, USA, 2007. [Google Scholar]
  30. Cremasco, A.; Messias, A.D.; Esposito, A.R.; Duek, E.A.D.R.; Caram, R. Effects of alloying elements on the cytotoxic response of titanium alloys. Mater. Sci. Eng. C 2011, 31, 833–839. [Google Scholar] [CrossRef]
  31. Park, Y.J.; Song, Y.H.; An, J.H.; Song, H.J.; Anusavice, K.J. Cytocompatibility of pure metals and experimental binary titanium alloys for implants materials. J. Dent. 2013, 41, 648–652. [Google Scholar] [CrossRef]
  32. Wang, J.J.; Sanderson, B.J.S.; Wang, H. Cyto- and genotoxicity of ultrafine TiO2 particles in cultured human lymphoblastoid cells. Mutat. Res. Genet. Toxicol. Environ. Mutagen. 2007, 628, 99–106. [Google Scholar] [CrossRef] [PubMed]
  33. Lai, J.C.K.; Lai, M.B.; Jandhyam, S.; Dukhande, V.V.; Bhushan, A.; Daniels, C.K.; Leung, S.W. Exposure to titanium dioxide and other metallic oxide nanoparticles induces cytotoxicity on human neural cells and fibroblasts. Int. J. Nanomed. 2008, 3, 533–545. [Google Scholar] [CrossRef] [Green Version]
  34. Chan, E.; Cadosch, D.; Gautschi, O.P.; Sprengel, K.; Filgueira, L. Influence of Metal Ions on Human Lymphocytes and the Generation of Titanium-Specific T-Lymphocytes. J. Appl. Biomater. Biomech. 2011, 9, 137–143. [Google Scholar] [CrossRef]
  35. Schroeder, H.A.; Balassa, J.J.; Tipton, I.H. Abnormal trace metals in man: Titanium. J. Chronic Dis. 1963, 16, 55–69. [Google Scholar] [CrossRef]
  36. Schroeder, H.A.; Balassa, J.J. Abnormal trace metals in man: Niobium. J. Chronic Dis. 1965, 18, 229–241. [Google Scholar] [CrossRef]
  37. Buss, D.H.; Rose, H.J. Dietary intake of nutrient trace elements. Food Chem. 1992, 43, 209–212. [Google Scholar] [CrossRef]
  38. Pennington, J.A.; Jones, J.W. Molybdenum, nickel, cobalt, vanadium, and strontium in total diets. J. Am. Diet. Assoc. 1987, 87, 1644–1650. [Google Scholar]
  39. Paschal, D.C.; Ting, B.G.; Morrow, J.C.; Pirkle, J.L.; Jackson, R.J.; Sampson, E.J.; Miller, D.T.; Caldwell, K.L. Trace Metals in Urine of United States Residents: Reference Range Concentrations. Environ. Res. 1998, 76, 53–59. [Google Scholar] [CrossRef] [PubMed]
  40. Yu, F.; Addison, O.; Baker, S.J.; Davenport, A.J. Lipopolysaccharide inhibits or accelerates biomedical titanium corrosion depending on environmental acidity. Int. J. Oral Sci. 2015, 7, 179–186. [Google Scholar] [CrossRef] [PubMed]
  41. Martins Júnior, J.R.S.; Matos, A.A.; Oliveira, R.C.; Buzalaf, M.A.R.; Costa, I.; Rocha, L.A.; Grandini, C.R. Preparation and characterization of alloys of the Ti–15Mo–Nb system for biomedical applications. J. Biomed. Mater. Res. Part B Appl. Biomater. 2018, 106, 639–648. [Google Scholar] [CrossRef]
  42. Kolman, D.G.; Scully, J.R. On the Repassivation Behavior of High-Purity Titanium and Selected α, β, and β+ α Titanium Alloys in Aqueous Chloride Solutions. J. Electrochem. Soc. 1996, 143, 1847–1860. [Google Scholar] [CrossRef]
  43. Mareci, D.; Ungureanu, G.; Aelenei, D.M.; Rosca, J.C.M. Electrochemical characteristics of titanium based biomaterials in artificial saliva. Mater. Corros. 2007, 58, 848–856. [Google Scholar] [CrossRef]
  44. Lavos-Valereto, I.C.; Wolynec, S.; Ramires, I.; Guastaldi, A.C.; Costa, I. Electrochemical impedance spectroscopy characterization of passive film formed on implant Ti–6Al–7Nb alloy in Hank’s solution. J. Mater. Sci. Mater. Med. 2004, 15, 55–59. [Google Scholar] [CrossRef]
  45. Vasilescu, C.; Drob, S.I.; Neacsu, E.I.; Mirza Rosca, J.C. Surface analysis and corrosion resistance of a new titanium base alloy in simulated body fluids. Corros. Sci. 2012, 65, 431–440. [Google Scholar] [CrossRef]
  46. Jovic, V.D.; Barsoum, M.W. Corrosion Behavior and Passive Film Characteristics Formed on Ti, Ti3SiC2, and Ti4AlN3 in H2SO4 and HCl. J. Electrochem. Soc. 2004, 15, B71–B76. [Google Scholar] [CrossRef]
  47. Ibriş, N.; Mirza Rosca, J.C. EIS study of Ti and its alloys in biological media. J. Electroanal. Chem. 2002, 526, 53–62. [Google Scholar] [CrossRef]
  48. Li, L.-H.; Kong, Y.-M.; Kim, H.-W.; Kim, Y.-W.; Kim, H.-E.; Heo, S.-J.; Koak, J.-Y. Improved biological performance of Ti implants due to surface modification by micro-arc oxidation. Biomaterials 2004, 25, 2867–2875. [Google Scholar] [CrossRef] [PubMed]
Figure 1. Diffraction patterns of the samples under the different laser treatment conditions and sintered.
Metals 11 00367 g001
Figure 2. Microstructure of the Ti-13Nb-12Mo alloy treated by laser fusion under condition C1. In detail, the fusion line (FL), heat-affected zone (HAZ), and fusion zone (FZ) regions are observed.
Metals 11 00367 g002
Figure 3. Detail of the FZ microstructure in the Ti-20Nb-10Mo alloy (C2).
Metals 11 00367 g003
Figure 4. Line Energy-dispersive X-ray spectroscopy (EDS) analysis of the Ti-20Nb-10Mo alloy microstructure (C1).
Metals 11 00367 g004
Figure 5. Map of the distribution of Ti, Nb, and Mo of the Ti-27Nb-8Mo alloy in its C3, using Forward Scatter Detector (FSD).
Metals 11 00367 g005
Figure 6. Phases obtained for the samples with surface Ti-Nb-Mo fusion: (a,b) Ti-13Nb-12Mo alloys treated under conditions C1 and C2; (c,d) Ti-20Nb-10Mo alloys treated under conditions C1 and C2; (e,f) Ti-27Nb-8Mo alloys treated under conditions C2 and C3; (g,h) Ti-35Nb-6Mo alloys treated under conditions C2 and C3. The blue phase is hexagonal Ti, the red phase corresponds to cubic Ti and the yellow phase to the orthorhombic Ti of the martensitic phase.
Metals 11 00367 g006
Figure 7. Sample Ti-27Nb-8Mo (C3). Euler color map accompanied by the inverse pole figures (IPF) diagrams in the X, Y, and Z directions. Grains are elongated in the direction of the thermal gradients, and size is determined by the base material (epitaxial growth). The grains with higher Nb contents are smaller, as Figure 7 depicts.
Metals 11 00367 g007
Figure 8. Micrographs of alloys after ion release assays.
Metals 11 00367 g008
Figure 9. Potentiodynamic curves of the studied Ti-Nb-Mo alloys.
Metals 11 00367 g009
Figure 10. Bode diagrams of the all Ti-Nb-Mo samples.
Metals 11 00367 g010
Figure 11. The electrical circuit that simulates a parallel equivalent circuit to represent a porous oxide layer, where Rs is the resistance of the solution, CPEdl and Rct are the constant phase element and the resistance to charge transfer, and CPEfilm and Rfilm are the constant phase element and the resistance of the passive layer.
Metals 11 00367 g011
Figure 12. Representations of the maximum resistance obtained in the three-point bending tests: (a) Boxplots shown in accordance with the alloy’s Mo content (b,c) two scatter plots according to relative density and grain size.
Metals 11 00367 g012
Figure 13. The obtained maximum resistance values compared to the values of bone and Ti6Al4V.
Metals 11 00367 g013
Figure 14. The obtained elastic modulus compared to values of bone and Ti6Al4V values.
Metals 11 00367 g014
Figure 15. Band contrast image for the cross-section of the Ti-27Nb-8Mo alloy condition 2 and the different marked microstructural zones.
Metals 11 00367 g015
Table 1. Applied laser surface treatment conditions.
AlloyConditionLaser Power (W)Laser Speed (mm/s)Energy Density (J/mm2)F (W/mm2)h/A
Ratio
Ti-13Nb-12MoC1100010.0050318.320.12
C2150015.0050477.480.15
Ti-20Nb-10MoC1100010.0050318.320.12
C2150015.0050477.480.15
Ti-27Nb-8MoC2150015.0050477.480.15
C310006.6775318.320.12
Ti-35Nb-6MoC2150015.0050477.480.15
C310006.6775318.320.12
Table 2. Average green porosity, shrinkage, relative density, and open porosity values of the sintered alloys. The number of samples tested was n = 5.
AlloyGreen Porosity (%)Volumetric Shrinkage (%)Relative Sintered Density (%)Open Porosity (%)
Ti-13Nb-12Mo18.466 ± 0.78316.20 ± 0.7797.86 ± 0.210.59 ± 0.14
Ti-20Nb-10Mo18.667 ± 0.28615.84 ± 1.1796.12 ± 0.380.88 ± 0.20
Ti-27Nb-8Mo18.535 ± 0.72316.36 ± 1.0095.55 ± 0.130.59 ± 0.12
Ti-35Nb-6Mo20,938 ± 0,49515.14 ± 1.7993.79 ± 0.310.35 ± 0.89
Table 3. Mechanical properties of the sintered and modified alloys. The number of samples tested for elastic modulus, bending strength was n = 5, and for microhardness, n = 3.
AlloyConditionElastic Modulus (GPa)Bending Stress Max (MPa)Def. Max (%)Microhardness (HV)
Ti-13Nb-12MoSintered96 ± 21235 ± 2070.9 ± 0.1286 ± 30
C177 ± 41318 ± 3704.3 ± 2.0264 ± 24
C276 ± 11613 ± 4565.2 ± 2.5263 ± 22
Ti-20Nb-10MoSintered85 ± 2824 ± 570.8 ± 0.2272 ± 23
C172 ± 21329 ± 4325.7 ± 4.1261 ± 22
C274 ± 2882 ± 4142.6 ± 0.9277 ± 21
Ti-27Nb-8MoSintered72 ± 11679 ± 93.6 ±1.1224 ± 23
C271 ± 11532 ± 507.6 ± 1.2217 ± 22
C369 ± 11467 ± 277.1 ± 1.2211 ± 34
Ti-35Nb-6MoSintered71 ± 11142 ± 361.2 ± 0.9208 ± 21
C265 ± 2727 ± 38935 ± 2.2190 ± 36
C364 ± 31141 ± 885.3 ± 1.2212 ± 35
Table 4. Average fusion layer area values for each sample. HAZ: Heat-affected zone; BM: Base metal.
AlloyLaser ConditionSurface Fusion Layer Thickness (µm)Porosity in HAZ (%)Porosity in BM (%)
Ti13Nb12MoC1220 ± 173.88 ± 0.833.74 ± 0.96
C2260 ± 203.04 ± 1.023.52 ± 2.34
Ti20Nb10MoC1206 ± 124.09 ± 1.254.77 ± 1.00
C2284 ± 44.71 ± 0.996.29 ± 0.69
Ti27Nb8MoC2268 ± 155.28 ± 0.575.61 ± 1.10
C3253 ± 85.99 ± 1.437.48 ± 0.81
Ti35Nb6MoC2337 ± 449.96 ± 0.789.70 ± 1.38
C3204 ± 63.33 ± 1.826.86 ± 1.29
Table 5. Percentage of the phases found in the Ti-Nb-Mo alloys after LSM.
AlloyLaser Condition%α″Grain Size with AZtech (μm)
Ti-13Nb-12MoC10.013.3596.6445.75 ± 32.22
C20.021.5598.4347.71 ± 36.27
Ti-20Nb-10MoC10.041.9797.9940.7 ± 28.92
C20.079.7790.1616.92 ± 8.71
Ti-27Nb-8MoC20.0516.5483.4130.41 ± 6.27
C30.045.1494.8126.74 ± 8.46
Ti-35Nb-6MoC20.103.1996.7113.22 ± 13.50
C30.021.7698.2216.21 ± 14.01
Table 6. Average concentrations of the Ti, Nb, and Mo ions in Fusayama artificial saliva after 730 h of immersion.
AlloyCond.Concentration Ti Ions (µg/L·cm2·h)Concentration Nb Ions (µg/L·cm2·h)Concentration Mo Ions (µg/L·cm2·h)Corrosion Rate (mg/dm2·Day)
Ti-13Nb-12MoC14.13 ± 1.2284.50 ± 25.721.06 ± 0.4510.76
C23.70 ± 0.1782.44 ± 16.240.72 ± 0.1210.42
Ti-20Nb-10MoC13.53 ± 0.3978.60 ± 11.900.70 ± 0.139.94
C24.00 ± 1.0798.36 ± 35.780.85 ± 0.2812.39
Ti-27Nb-8MoC22.25 ± 0.1972.70 ± 3.280.38 ± 0.029.04
C31.18 ± 0.6442.15 ± 15.210.33 ± 0.025.24
Ti-35Nb-6MoC20.98 ± 0.8340.97 ± 21.300.38 ± 0.075.08
C32.39 ± 1.1899.89 ± 22.140.37 ± 0.0212.32
Table 7. Results obtained from the potentiodynamic tests on the sintered and modified samples.
AlloyConditionOCP (V)Ecorr (V)Icorr (A)Rp (Ω)Vc (μm/Year)
Ti-13Nb-12MoSintered−0.28 ± 0.03−0.31 ± 0.072.92 × 10−78.79 × 1042.57
C1−0.22 ± 0.04−0.17 ± 0.081.12 × 10−82.26 × 1060.10
C2−0.17 ± 0.03−0.15 ± 0.109.82 × 10−92.98 × 1060.09
Ti-20Nb-10MoSintered−0.28 ± 0.02−0.40 ± 0.105.03 × 10−77.84 × 1044.52
C1−0.23 ± 0.04−0.22 ± 0.091.12 × 10−81.44 × 1060.10
C2−0.20 ± 0.01−0.21 ± 0.032.25 × 10−82.63 × 1060.20
Ti-27Nb-8MoSintered−0.27 ± 0.03−0.38 ± 0.122.09 × 10−71.22 × 1051.89
C2−0.05 ± 0.02−0.04 ± 0.089.24 × 10−93.96 × 1060.08
C3−0.16 ± 0.03−0.20 ± 0.038.94 × 10−94.31 × 1060.08
Ti-35Nb-6MoSintered−0.20 ± 0.05−0.64 ± 0.012.70 × 10−71.13 × 1052.49
C2−0.22 ± 0.03−0.16 ± 0.037.89 × 10−93.22 × 1060.07
C3−0.08 ± 0.05−0.08 ± 0.051.34 × 10−82.01 × 1060.12
Table 8. Values resulting from adjusting the impedance spectra by the equivalent circuit of Figure 11.
AlloyConditionRs (Ω·cm2)CPEdl (μF/cm2)ndlRct (Ω)CPEfilm (μF/cm2)nfilmRfilm (Ω)
Ti-13Nb-12MoSintered23.4181 × 10−60.651003.54 × 10−50.952.26 × 106
C131.62.59 × 10−50.61802.52 × 10−50.932.02 × 106
C220.32.76 × 10−60.621252.28 × 10−50.952.82 × 106
Ti-20Nb-10MoSintered304.25 × 10−80.79116.43.83 × 10−50.943.39 × 105
C110.27.32 × 10−70.601502.61 × 10−50.921.30 × 106
C230.82.58 × 10−60.55165.22.53 × 10−50.924.26 × 106
Ti-27Nb-8MoSintered34.51.06 × 10−60.711584.14 × 10−50.901.53 × 106
C223.641.90 × 10−50.9415001.06 × 10−50.859.10 × 106
C335.23.42 × 10−60.925001.46 × 10−60.911.41 × 106
Ti-35Nb-6MoSintered25.54.04 × 10−70.6890.59.01 × 10−50.811.87 × 105
C233.52.15 × 10−60.9310001.01 × 10−50.923.42 × 106
C3154.25 × 10−60.691452.55 × 10−60.932.10 × 106
Table 9. The 1/CPEdl and 1/CPEfilm values for the different alloys.
AlloyCondition1/CPEdl (μF/cm2)1/CPEfilm (μF/cm2)
Ti13Nb12MoSintered0.55 × 1060.28 × 105
10.38 × 1050.39 × 105
20.36 × 1060.44 × 105
Ti20Nb10MoSintered0.23 × 1080.26 × 105
10.14 × 1070.38 × 105
20.39 × 1060.39 × 105
Ti27Nb8MoSintered0.94 × 1060.24 × 105
20.53 × 1050.94 × 105
30.29 × 1060.68 × 106
Ti35Nb6MoSintered0.25 × 1070.11 × 105
20.46 × 1060.99 × 105
30.23 × 1060.39 × 106
Publisher’s Note: MDPI stays neutral with regard to jurisdictional claims in published maps and institutional affiliations.

