Hot Deformation Characteristics and Processing Parameter Optimization of Al–6.32Zn–2.10Mg Alloy Using Constitutive Equation and Processing Map


Abstract
:1. Introduction
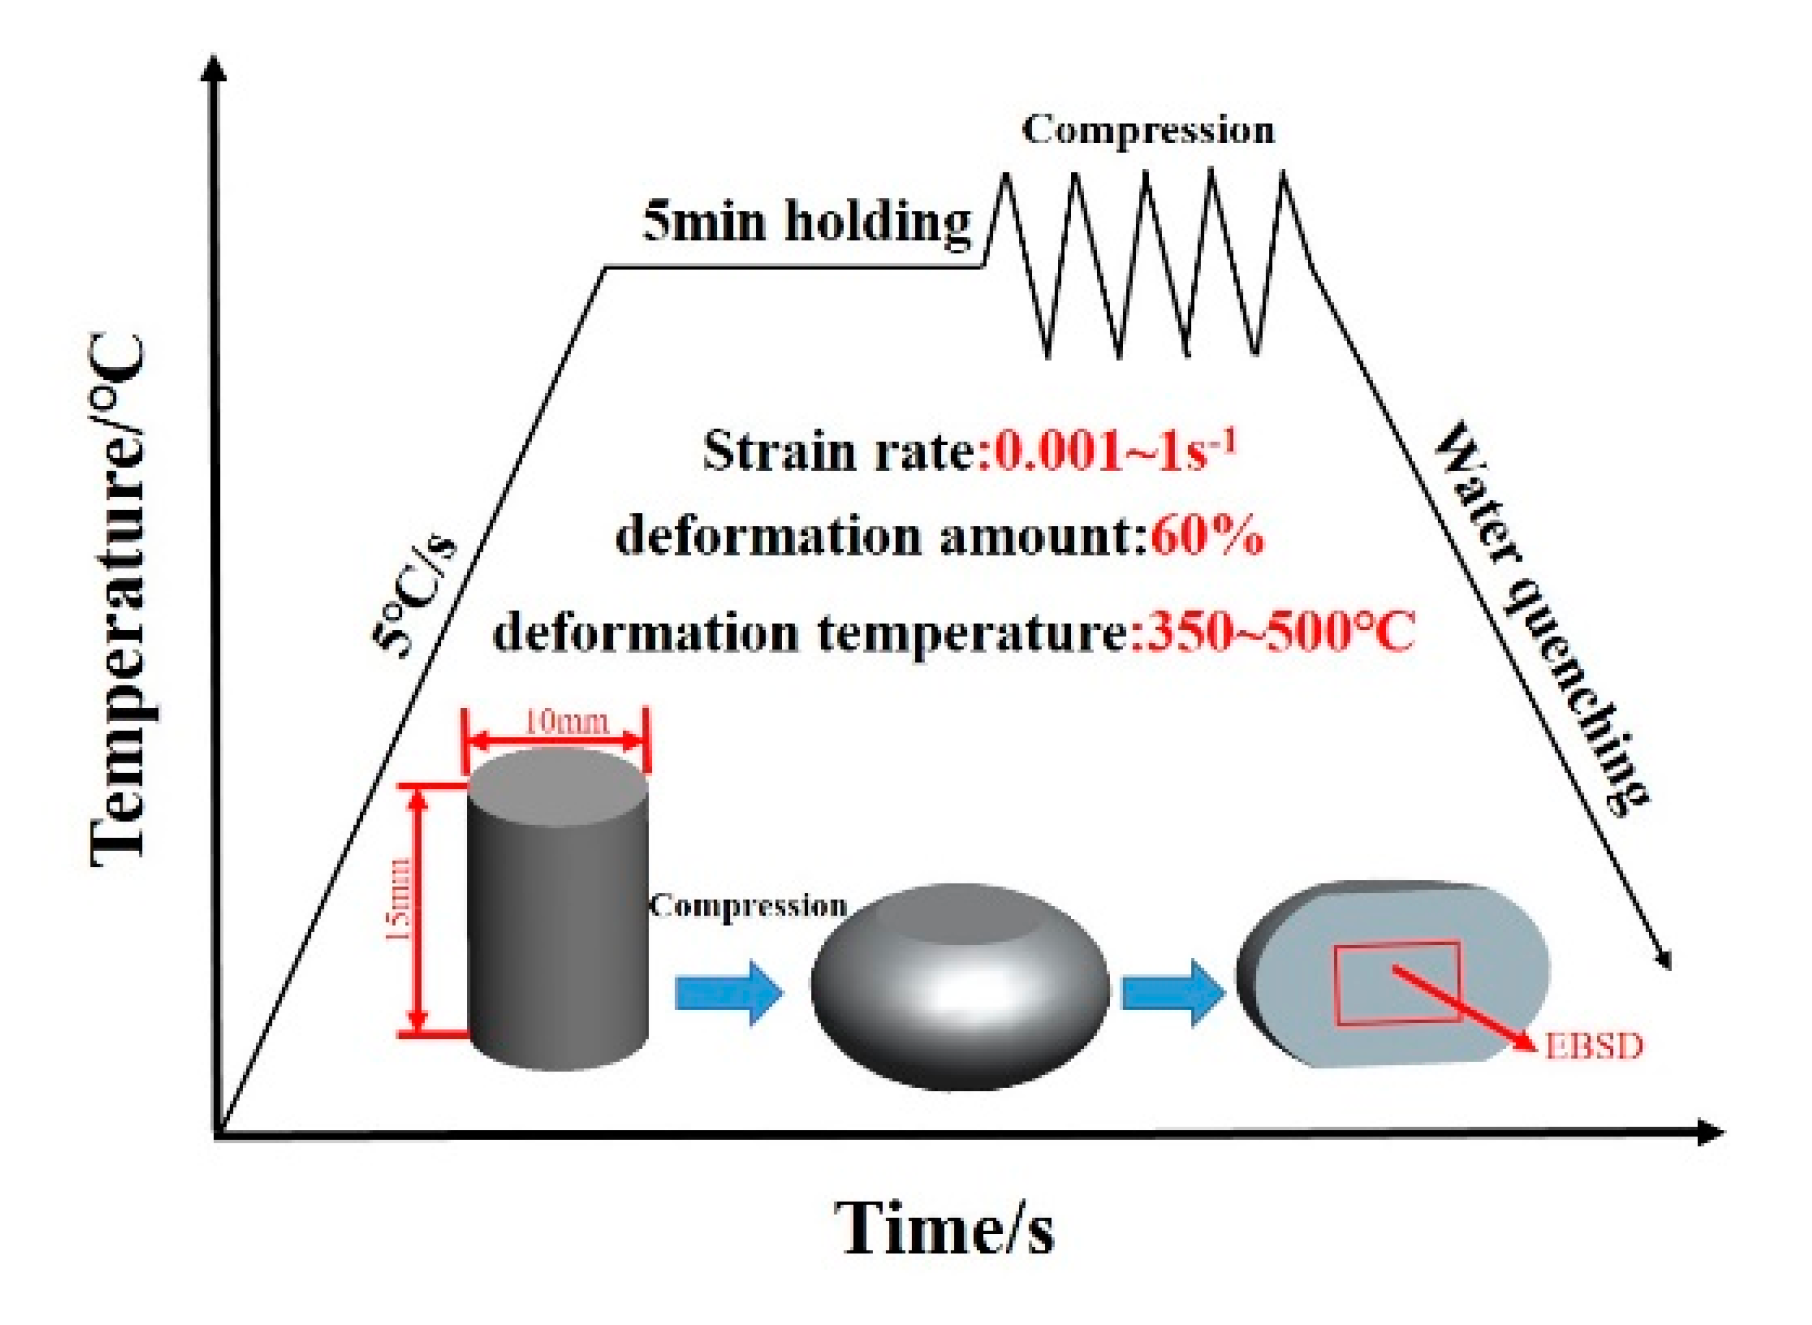
2. Experimental
3. Results
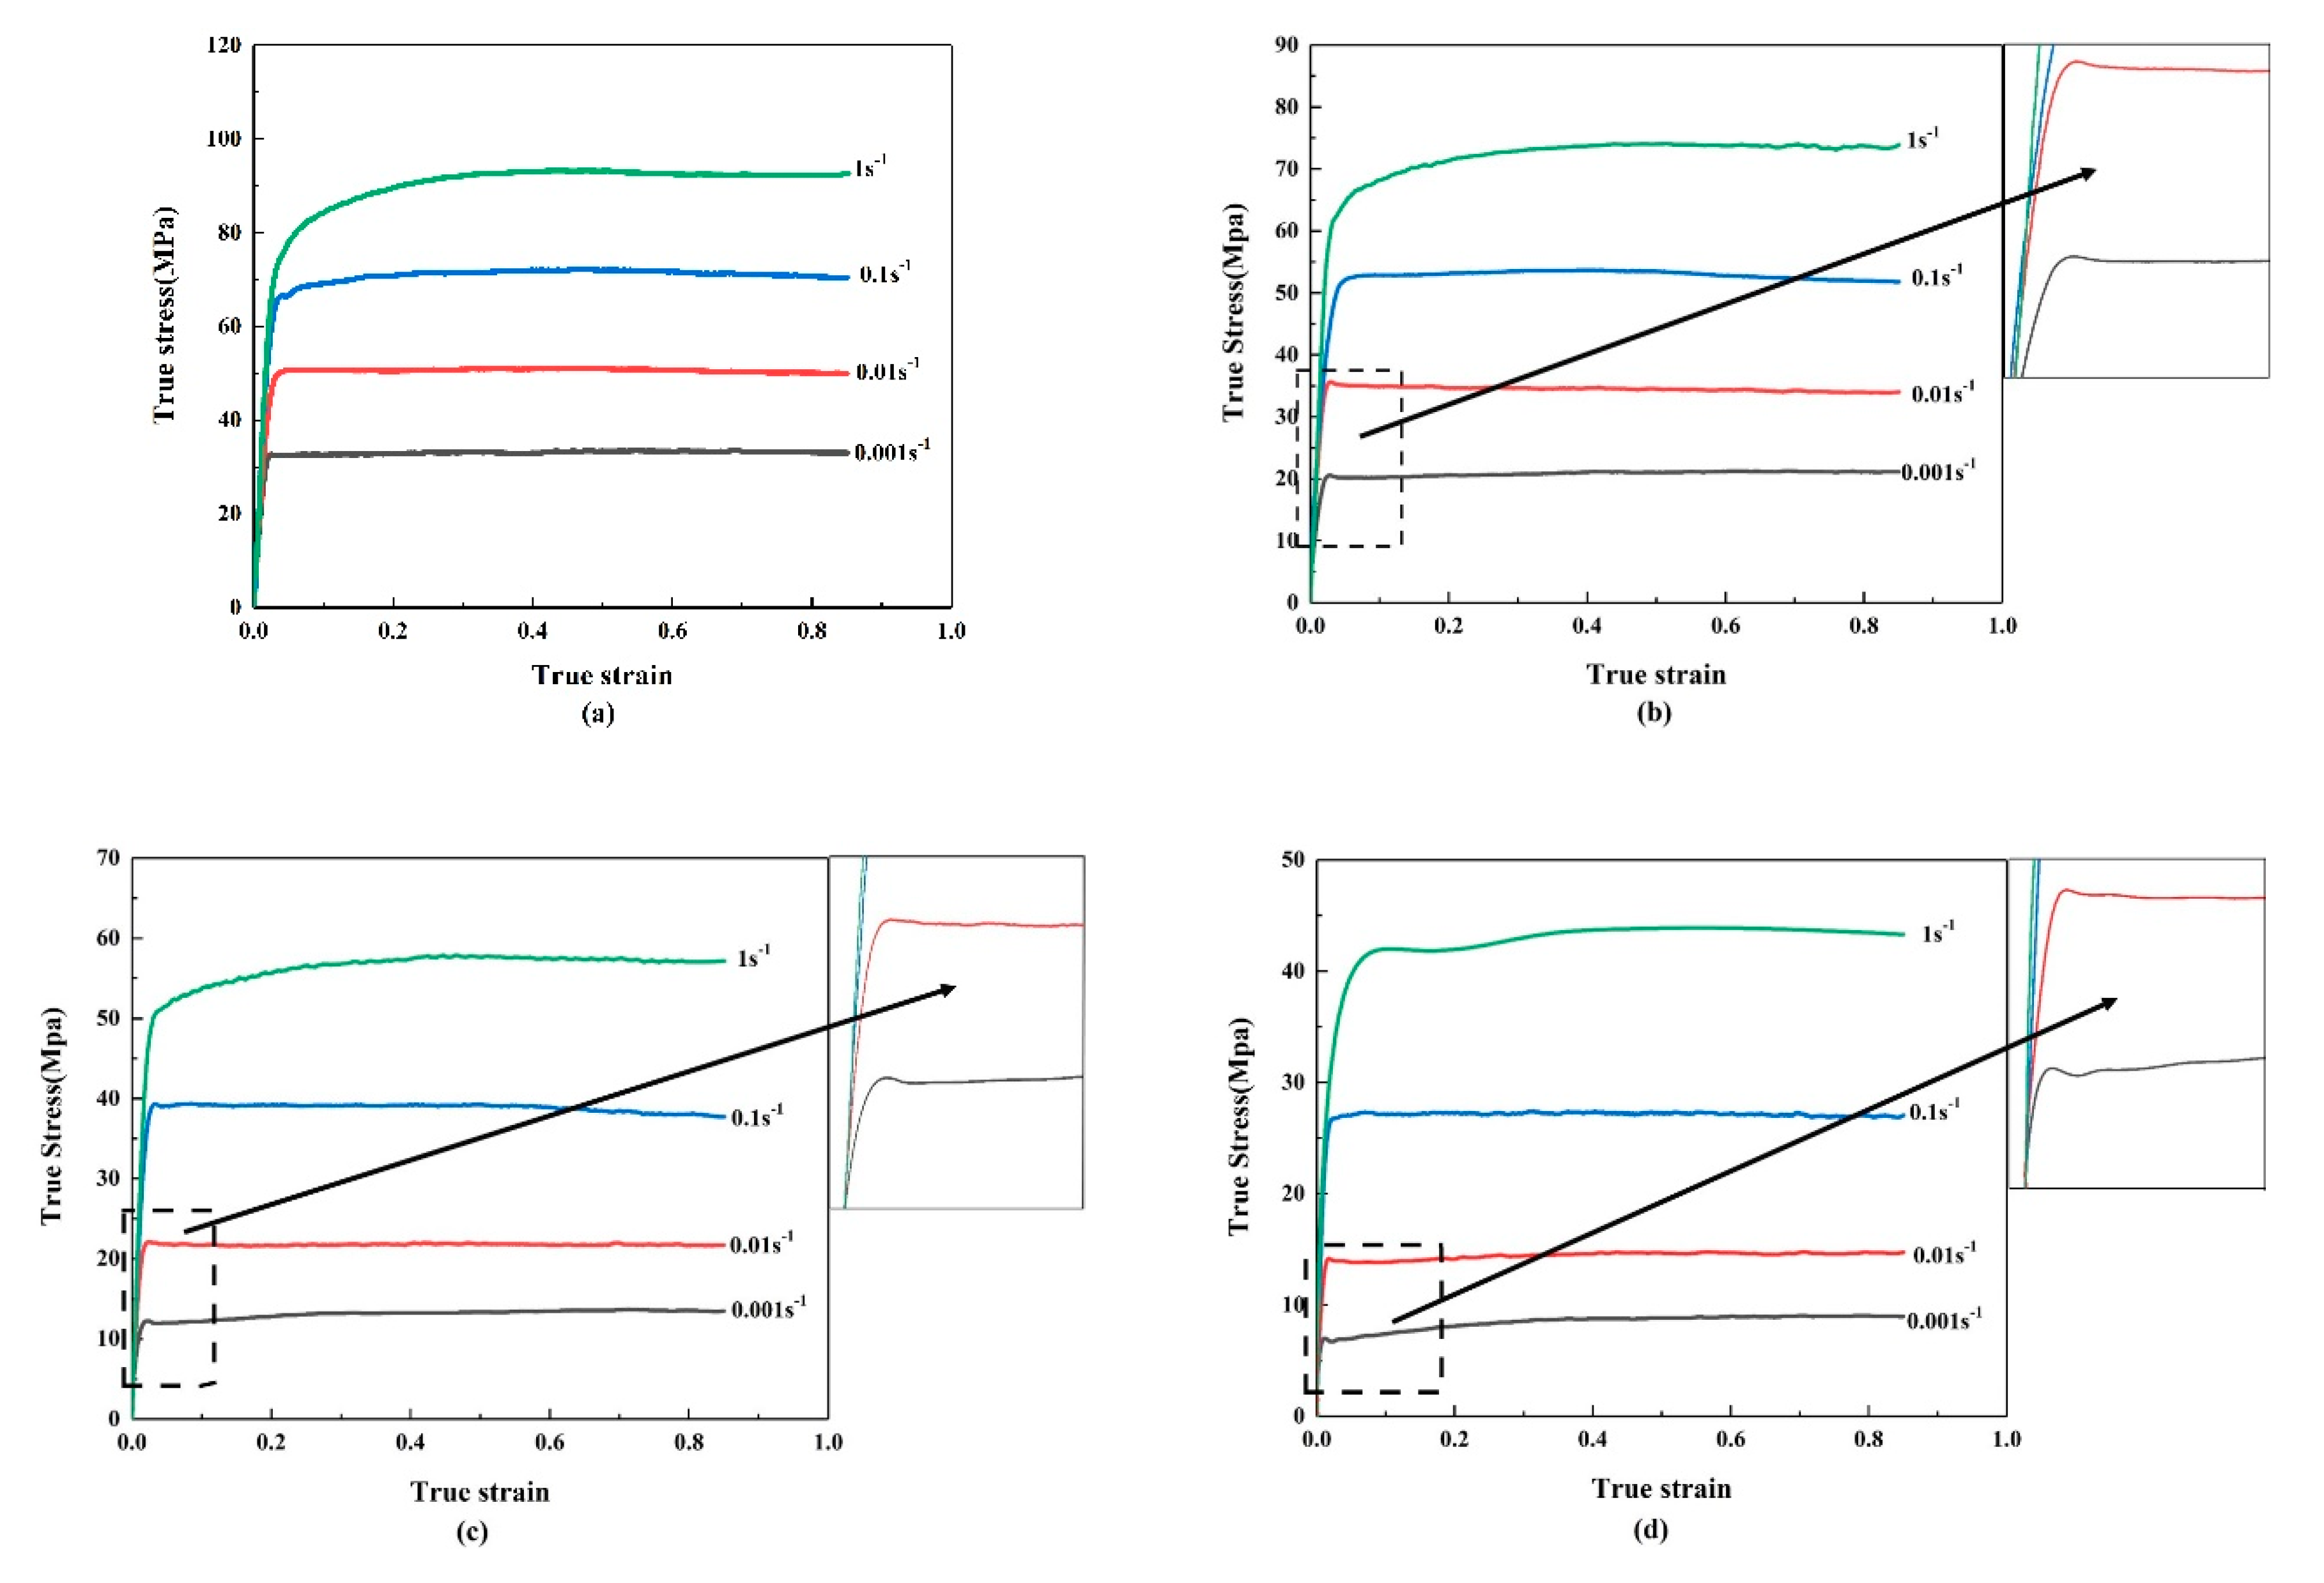
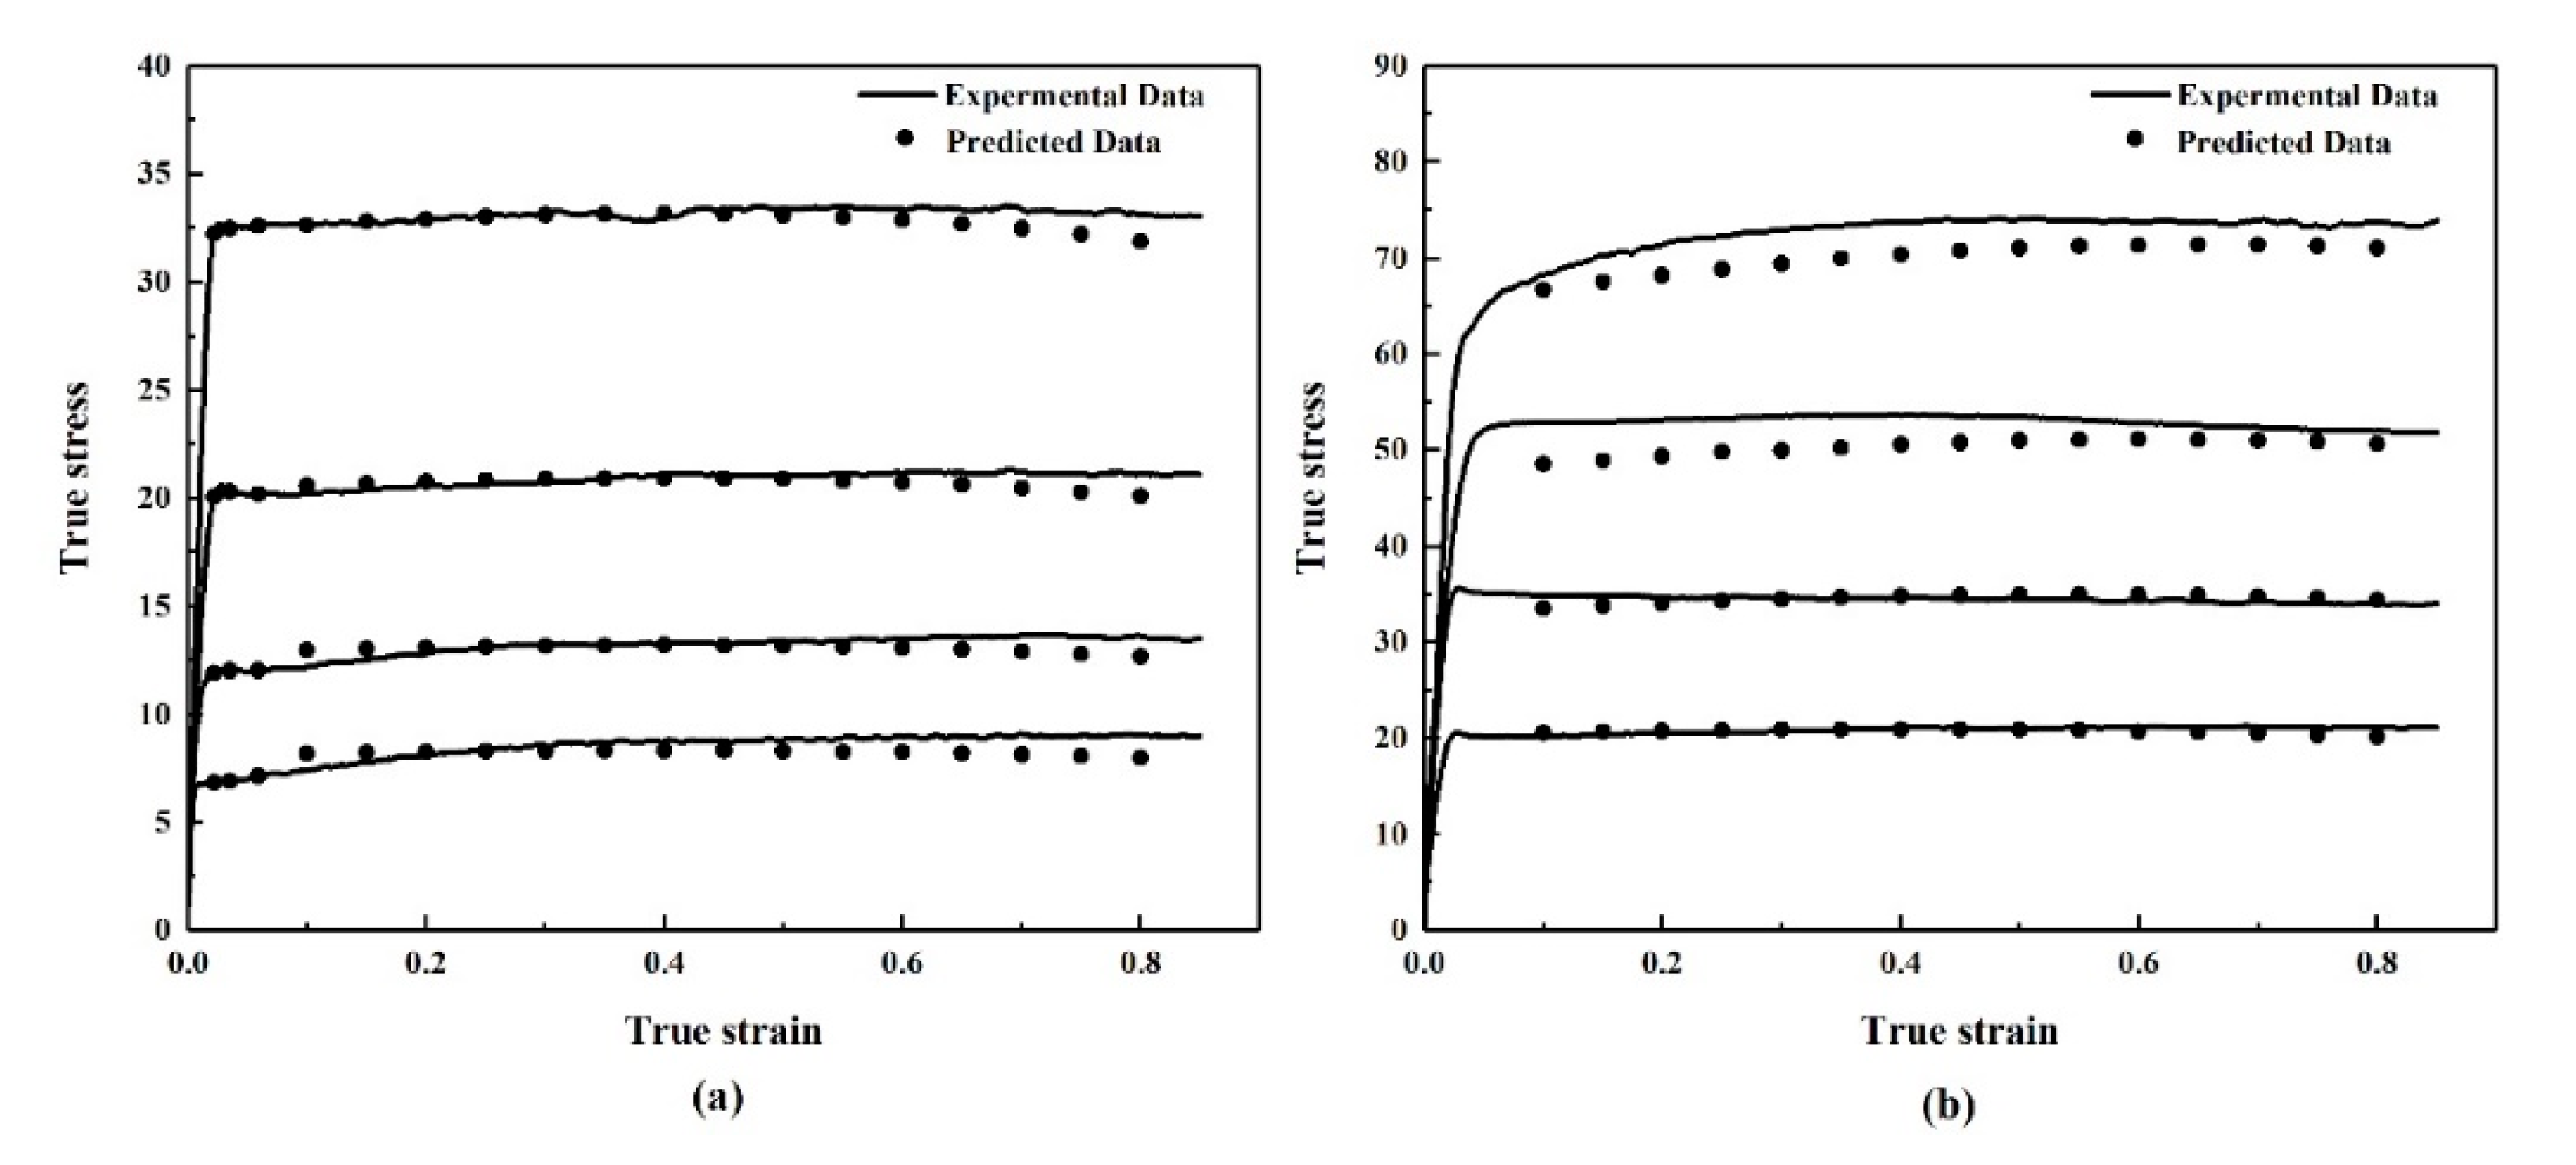
3.1. True Stress–True Strain Curves
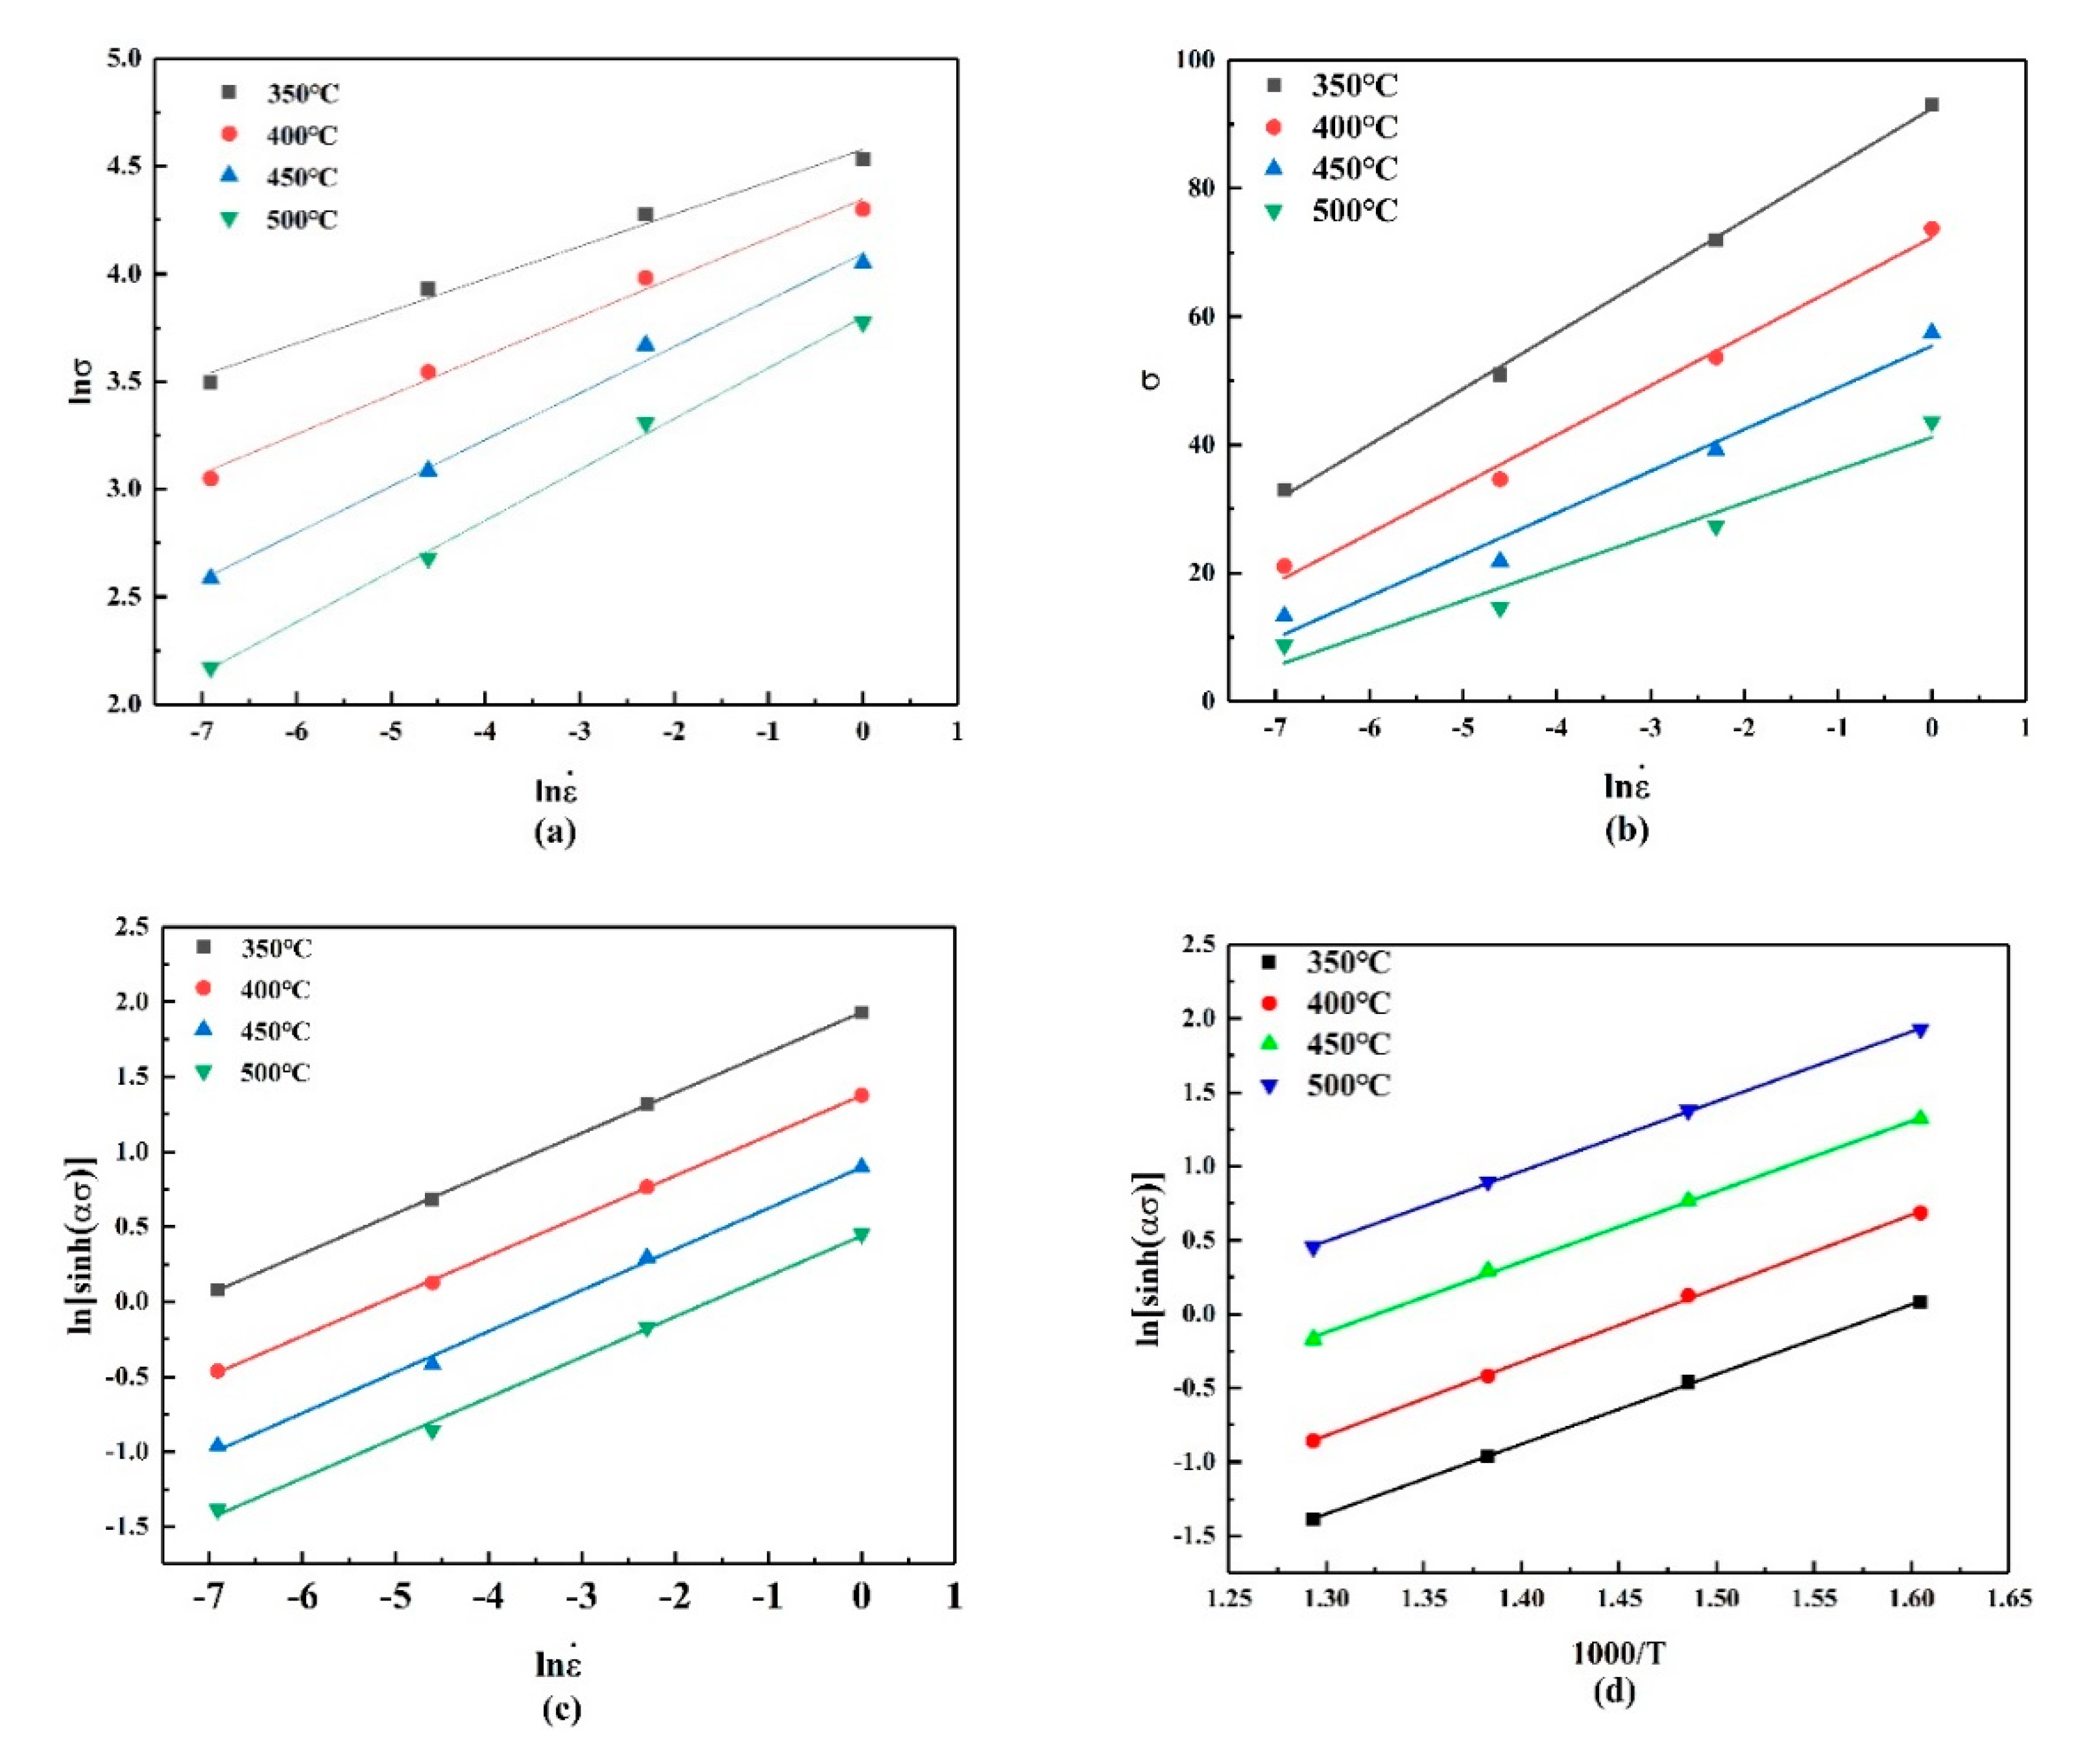
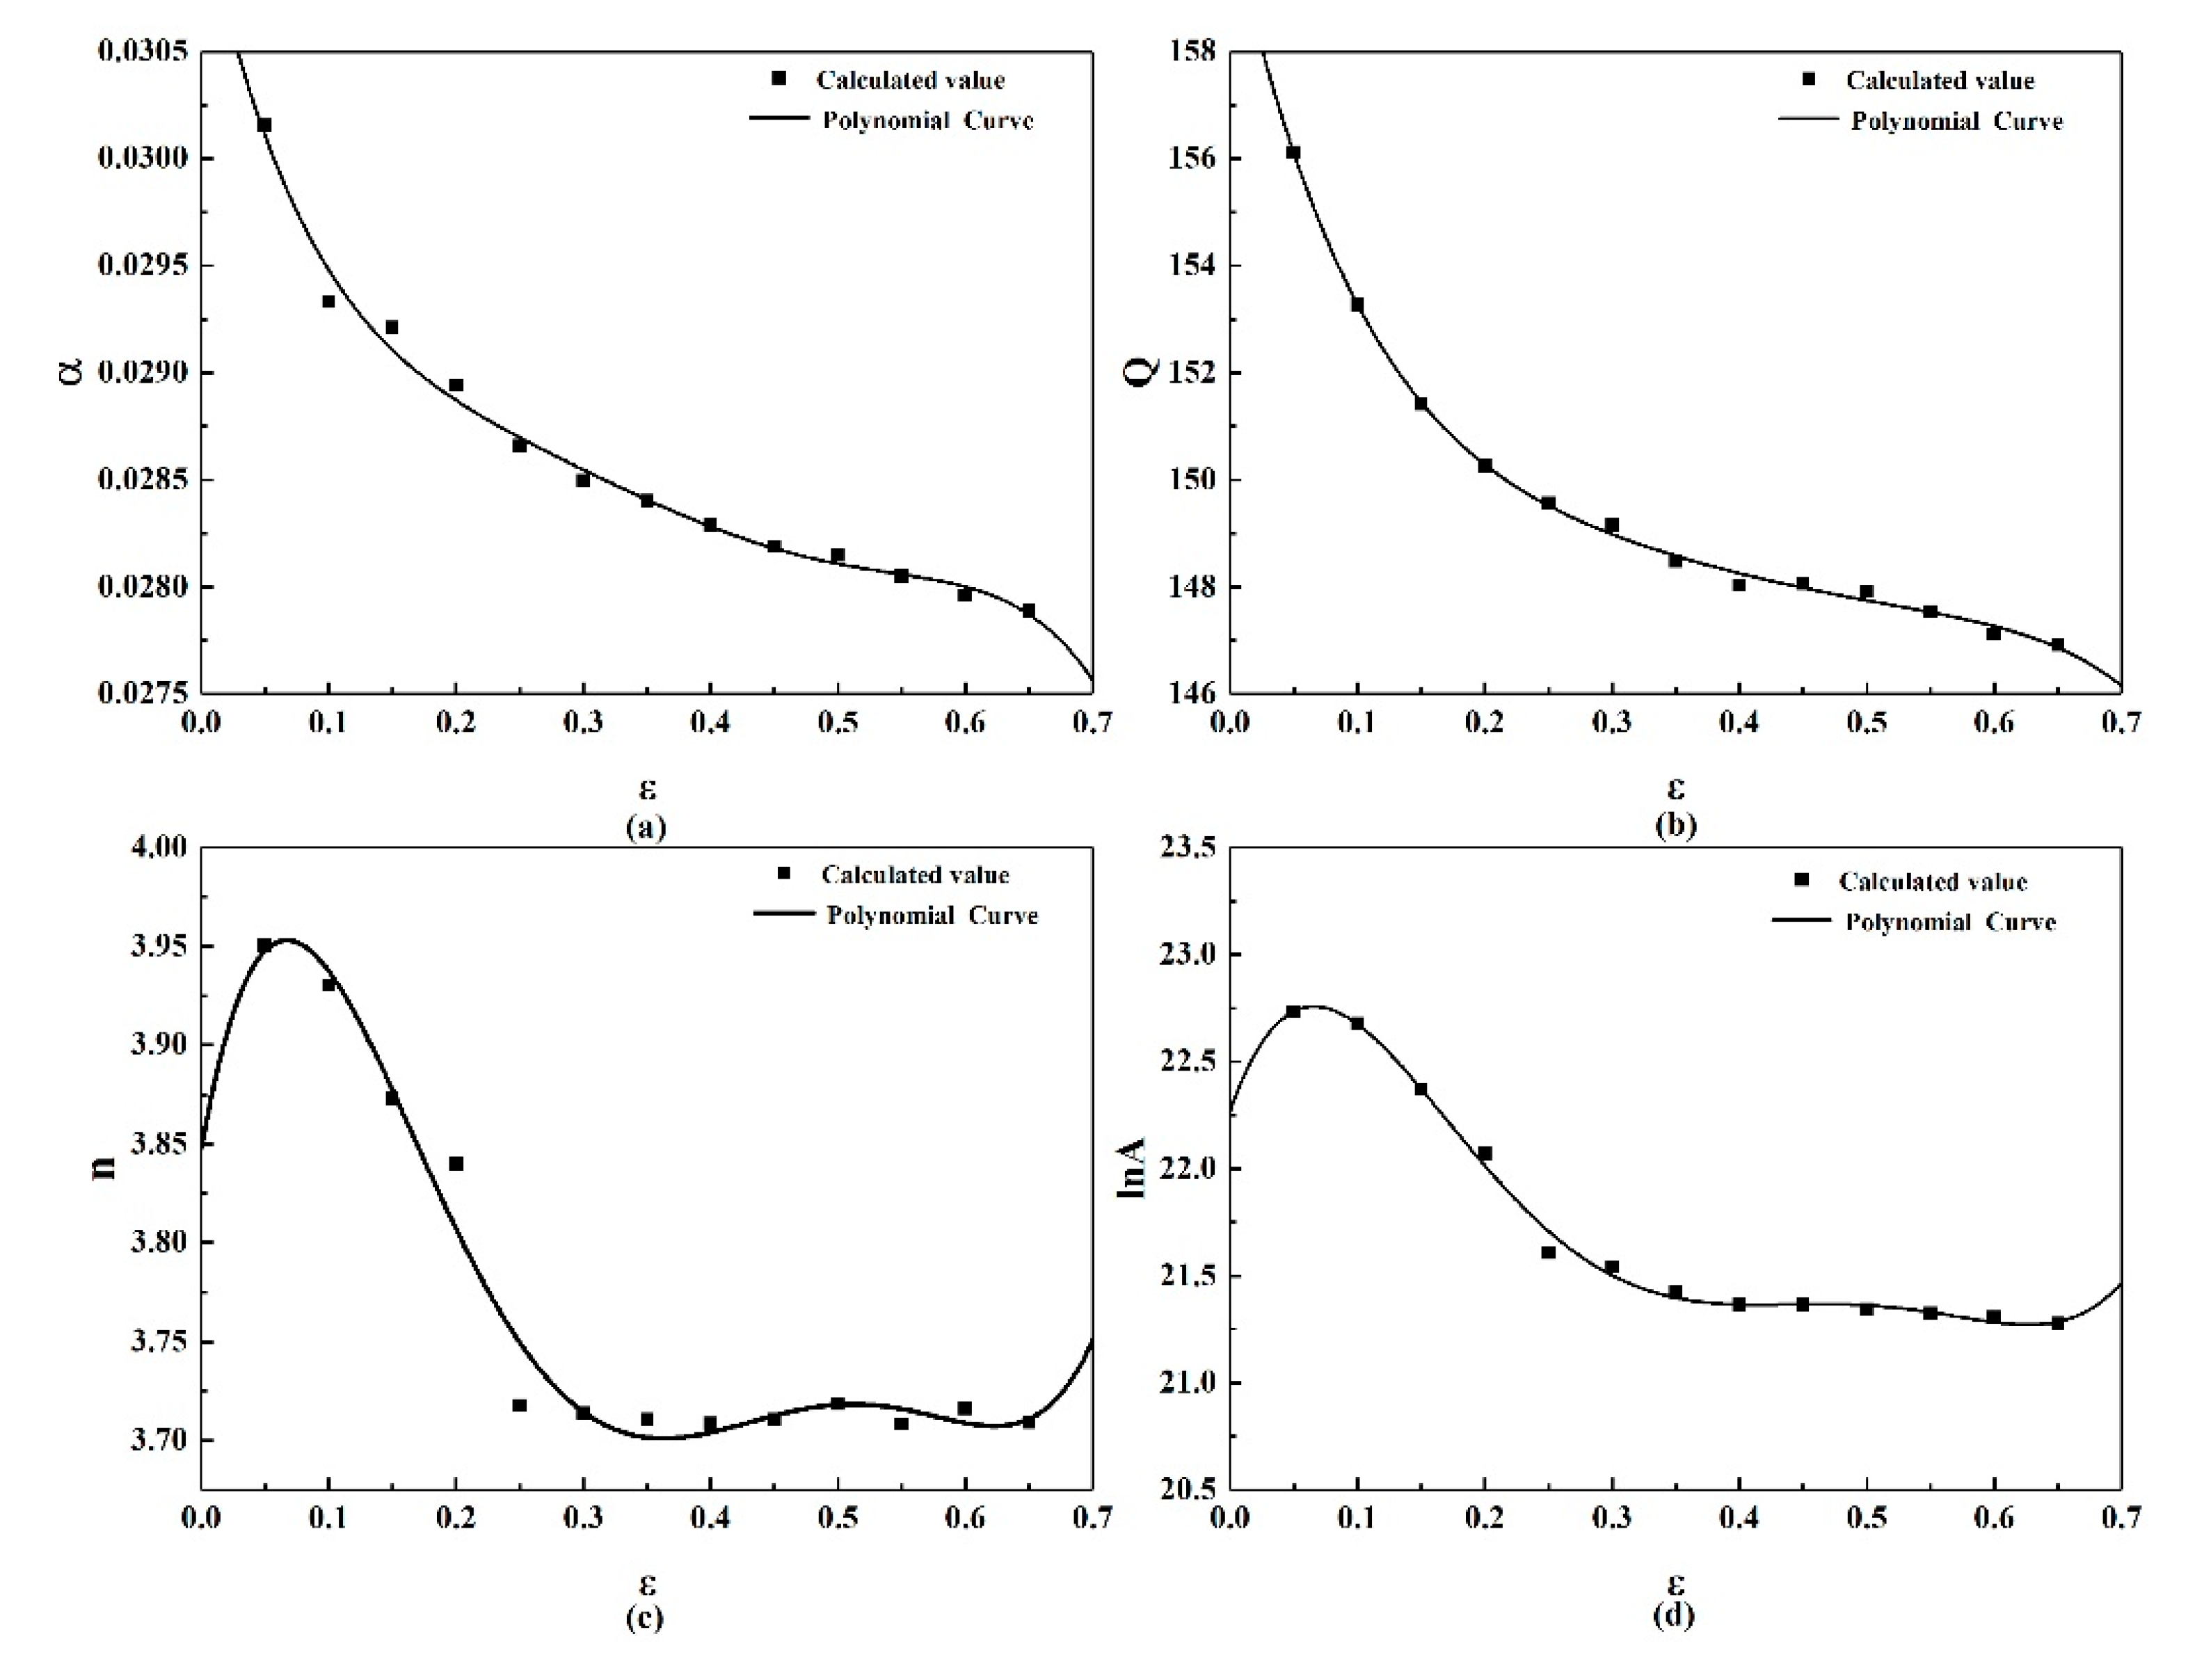
3.2. Modified Arrhenius Model
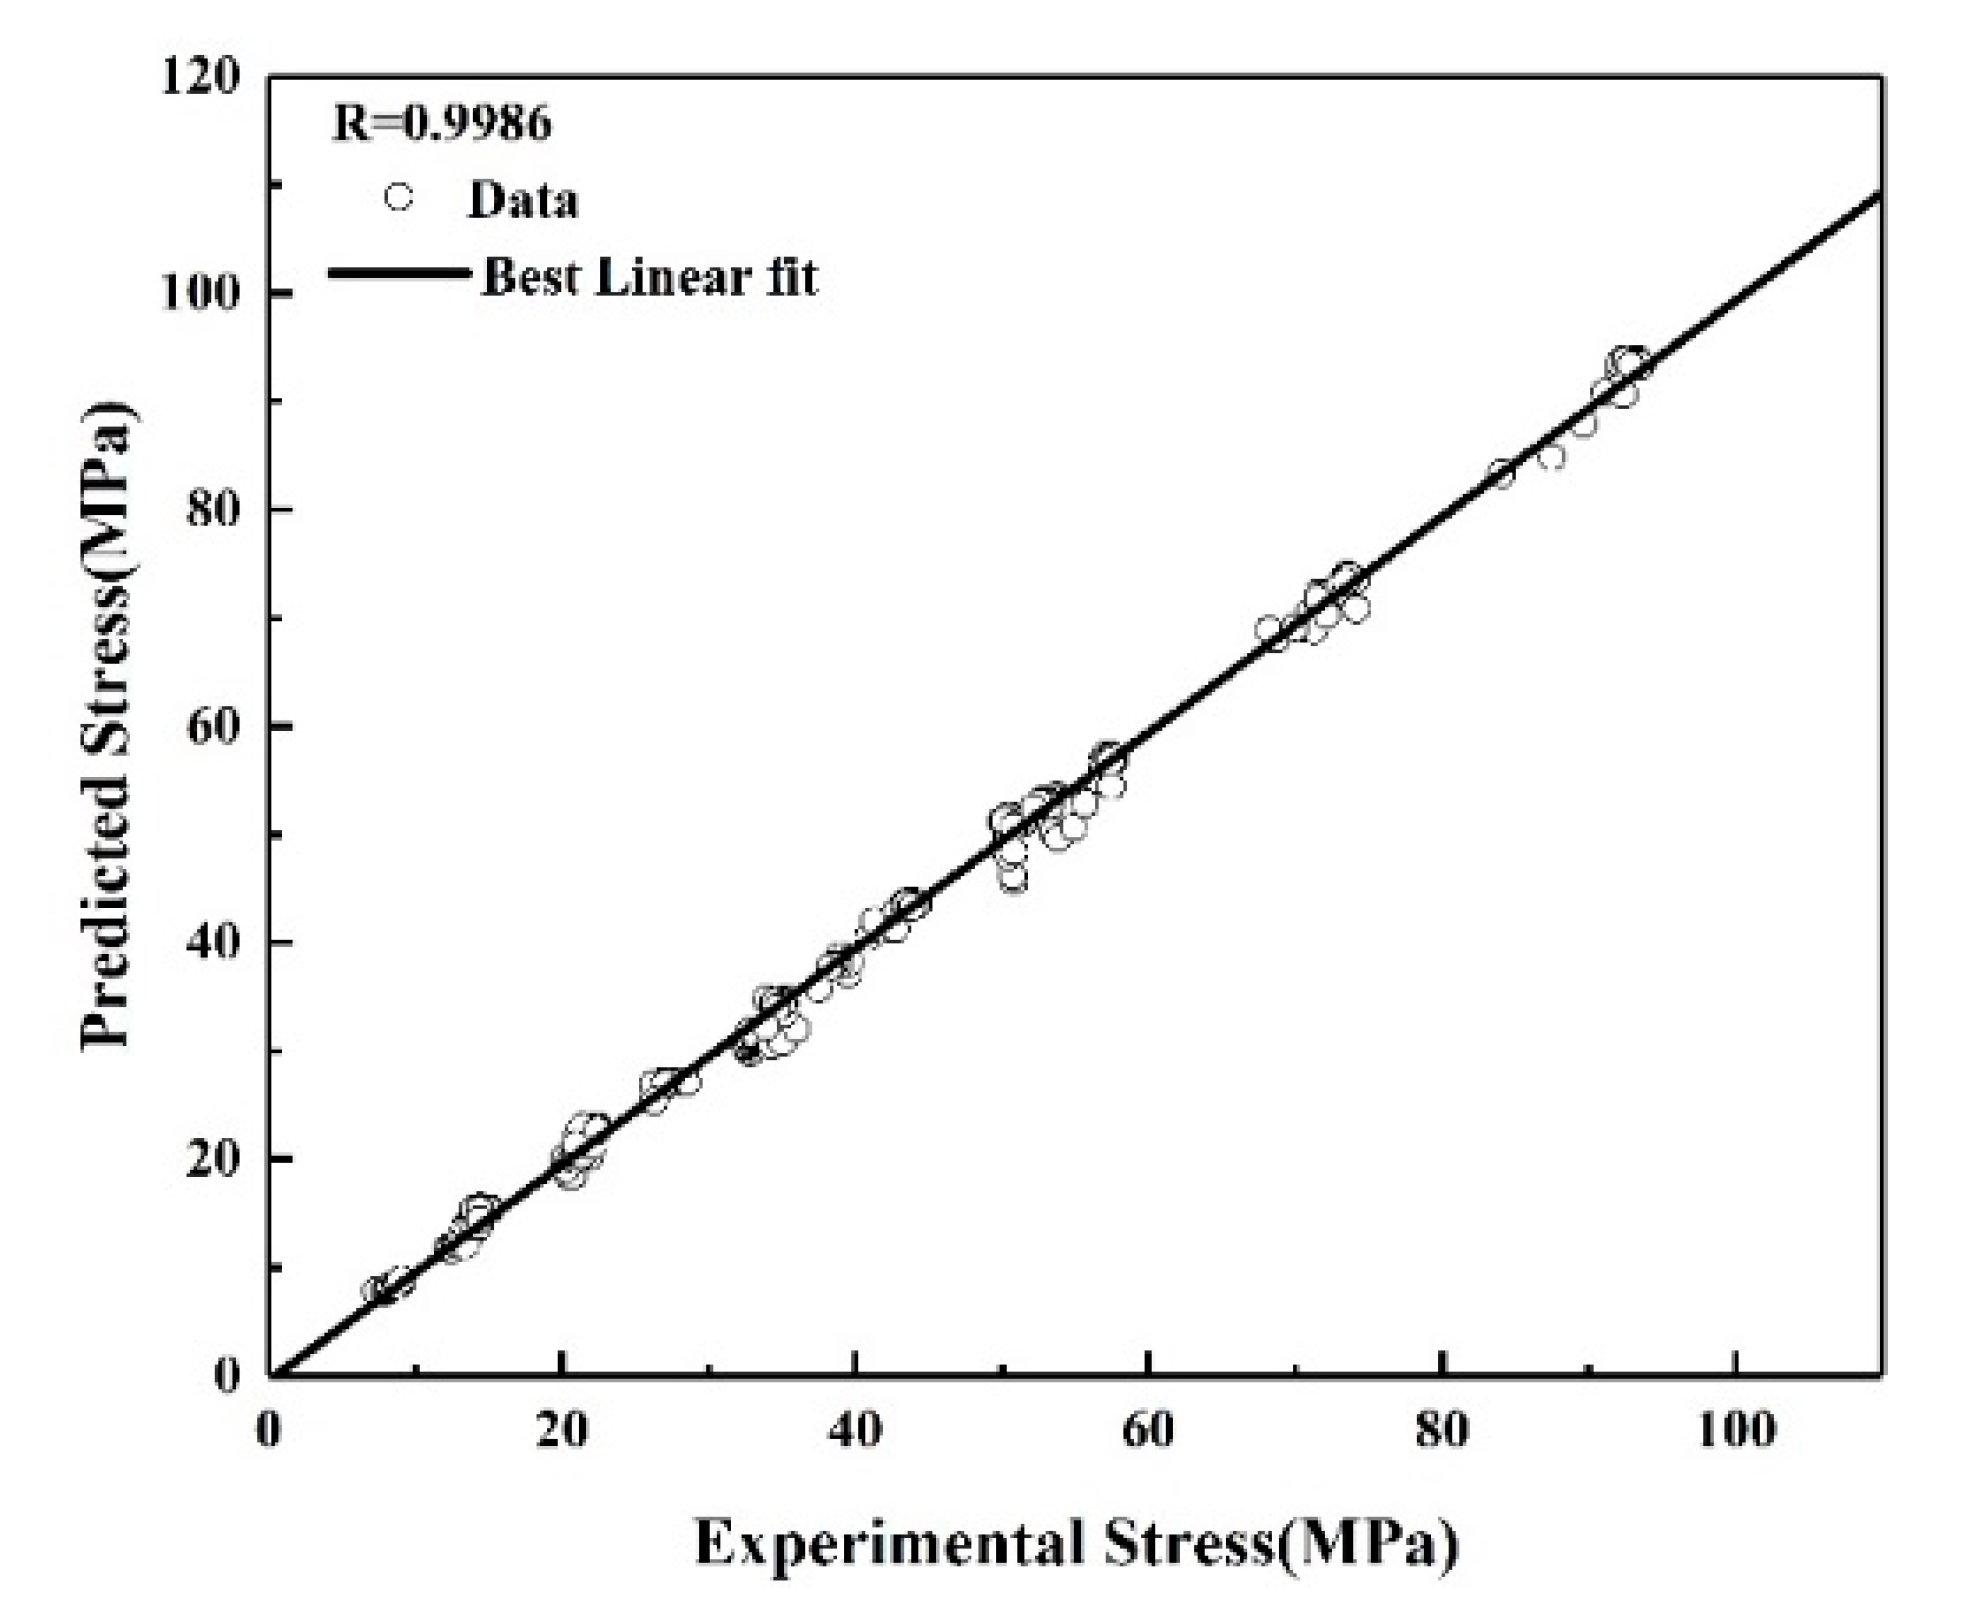
3.3. Error Analysis
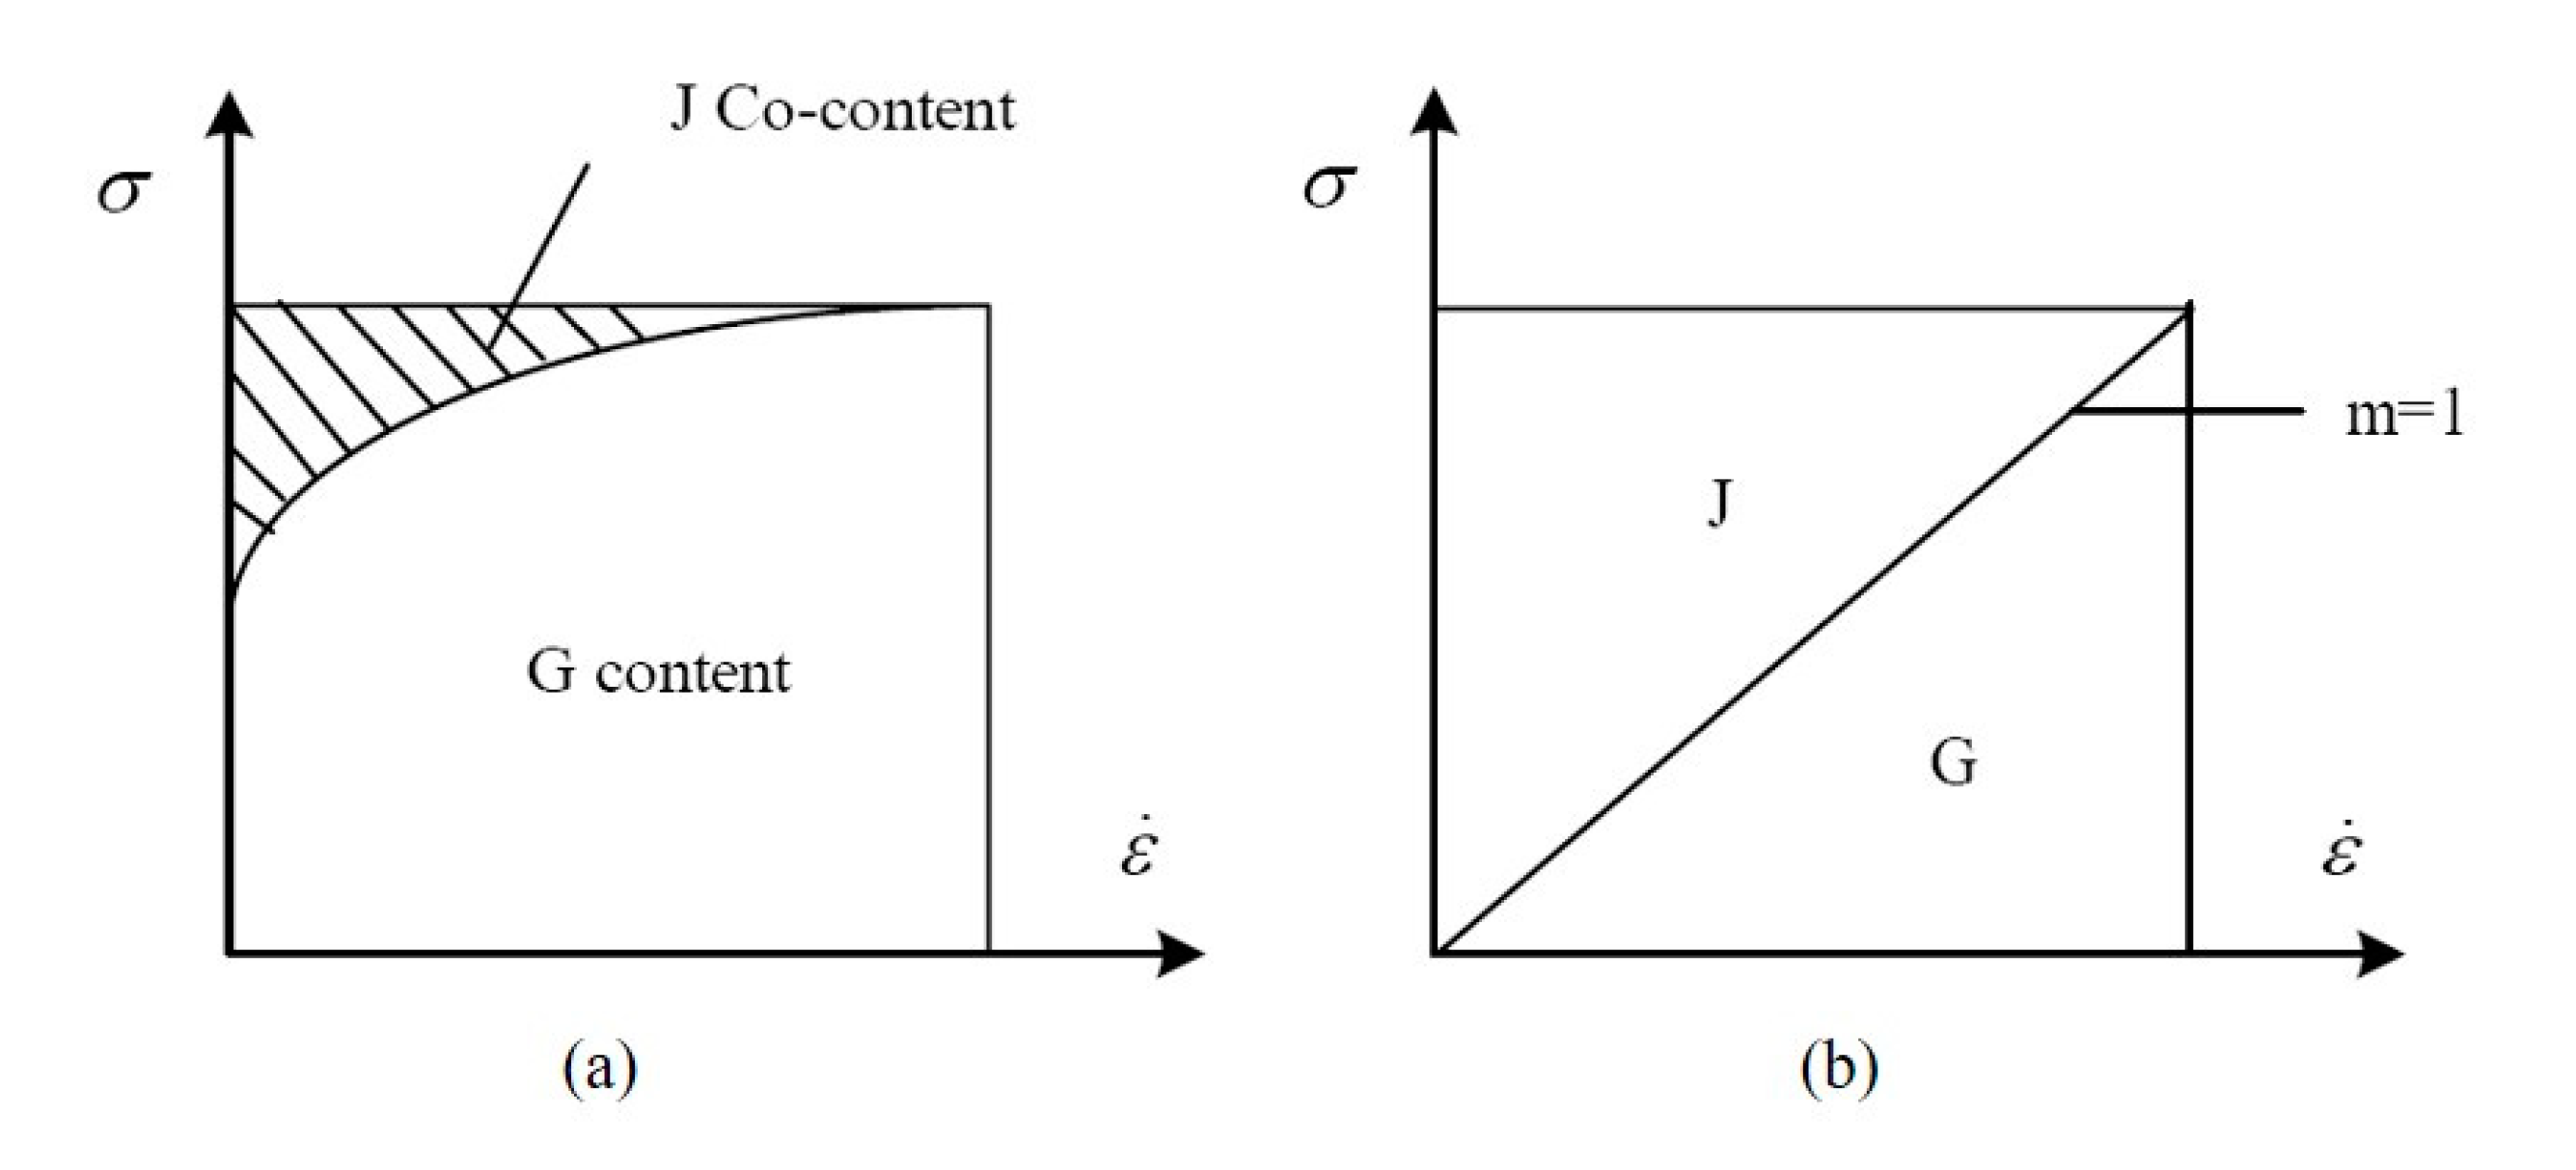
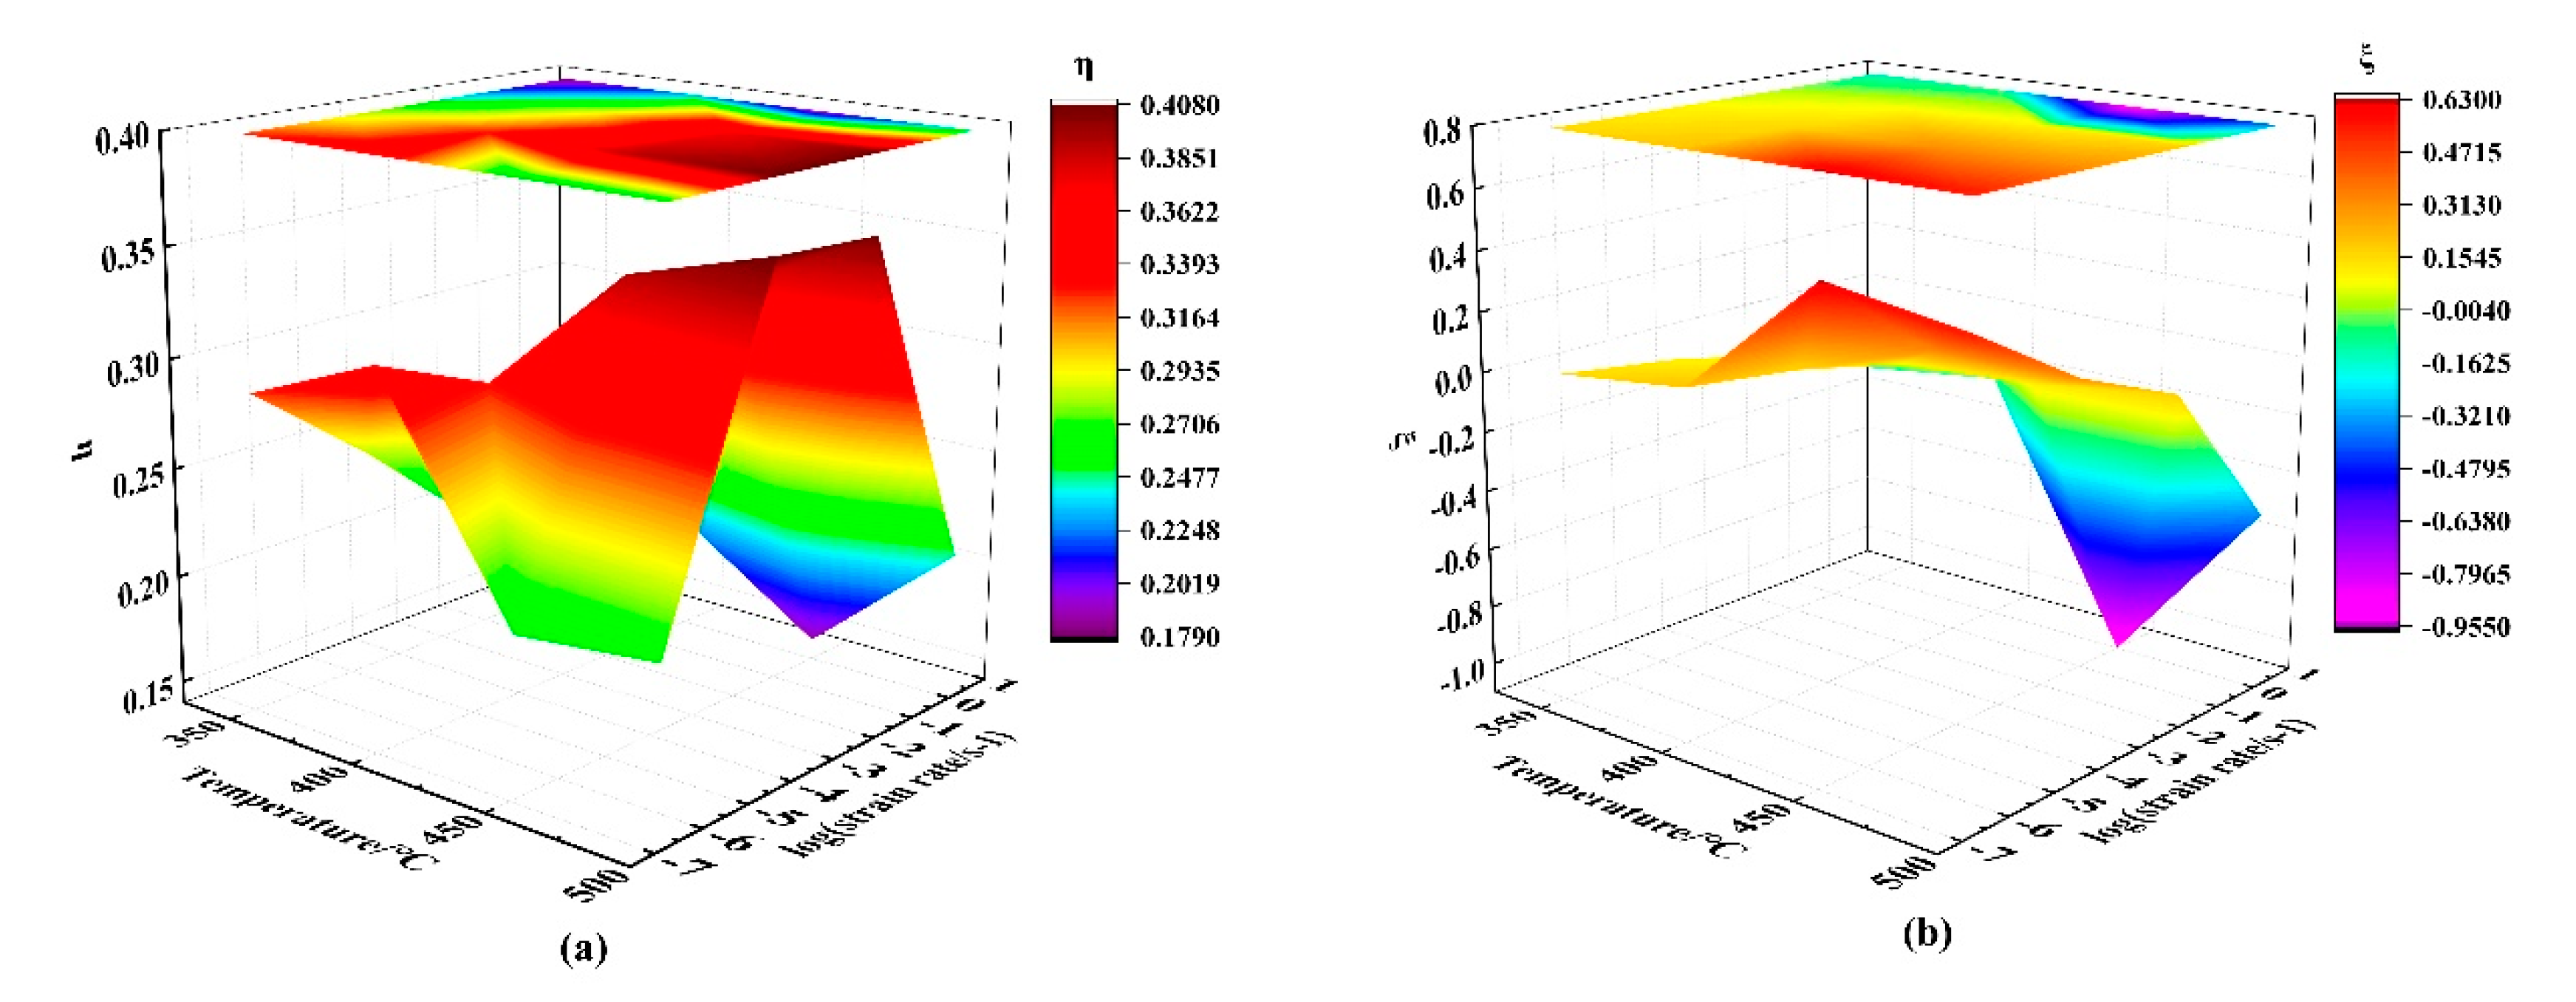
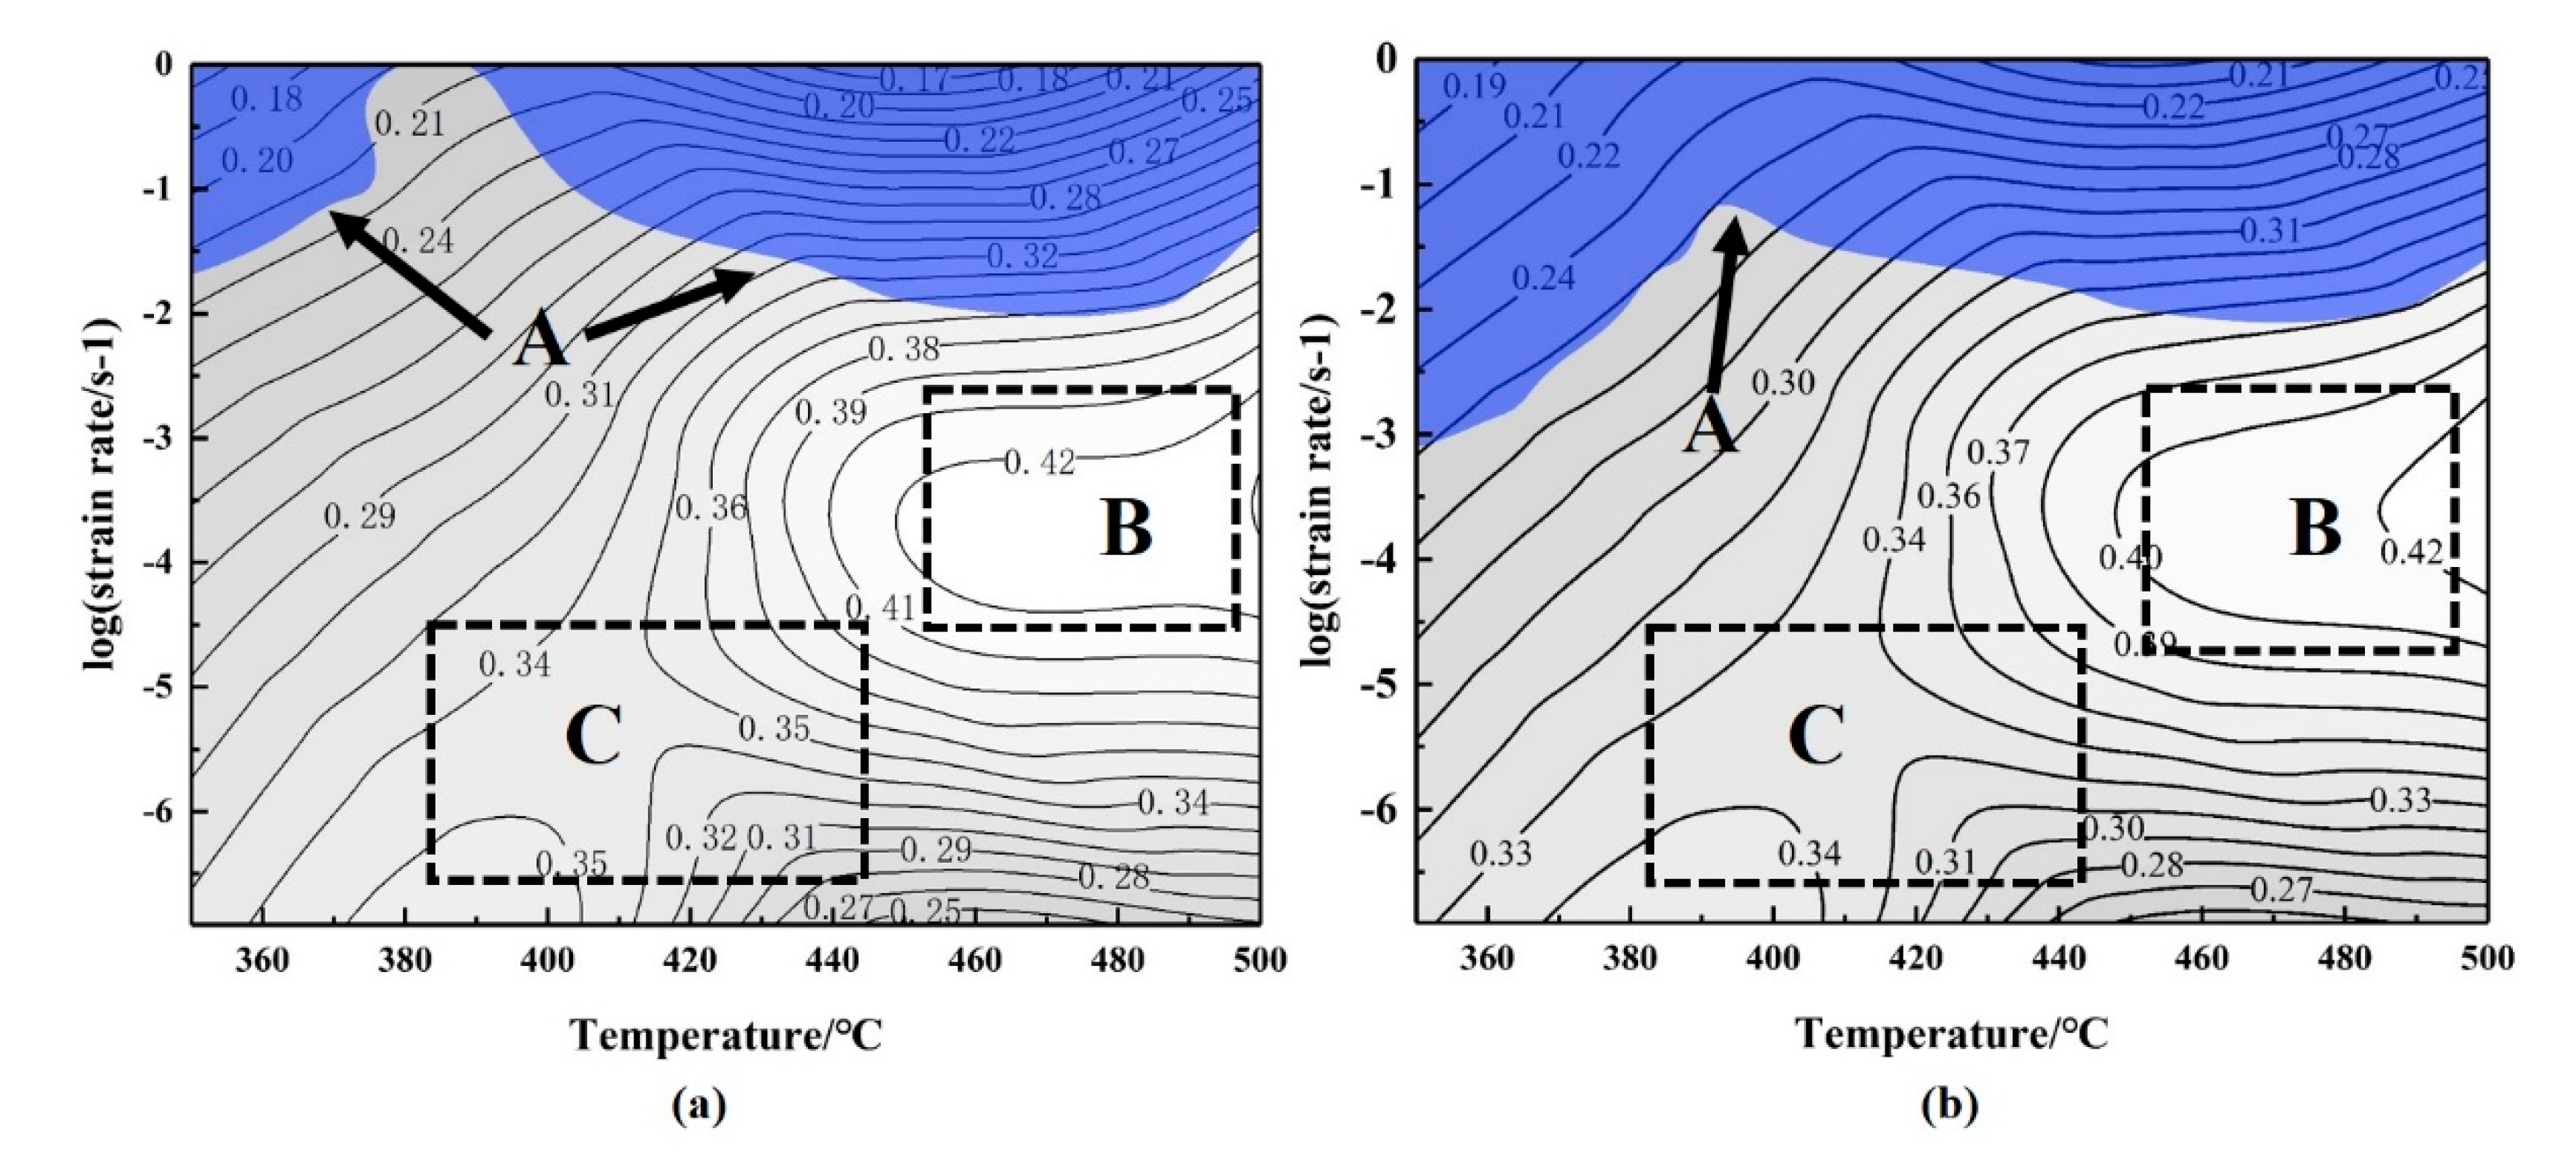
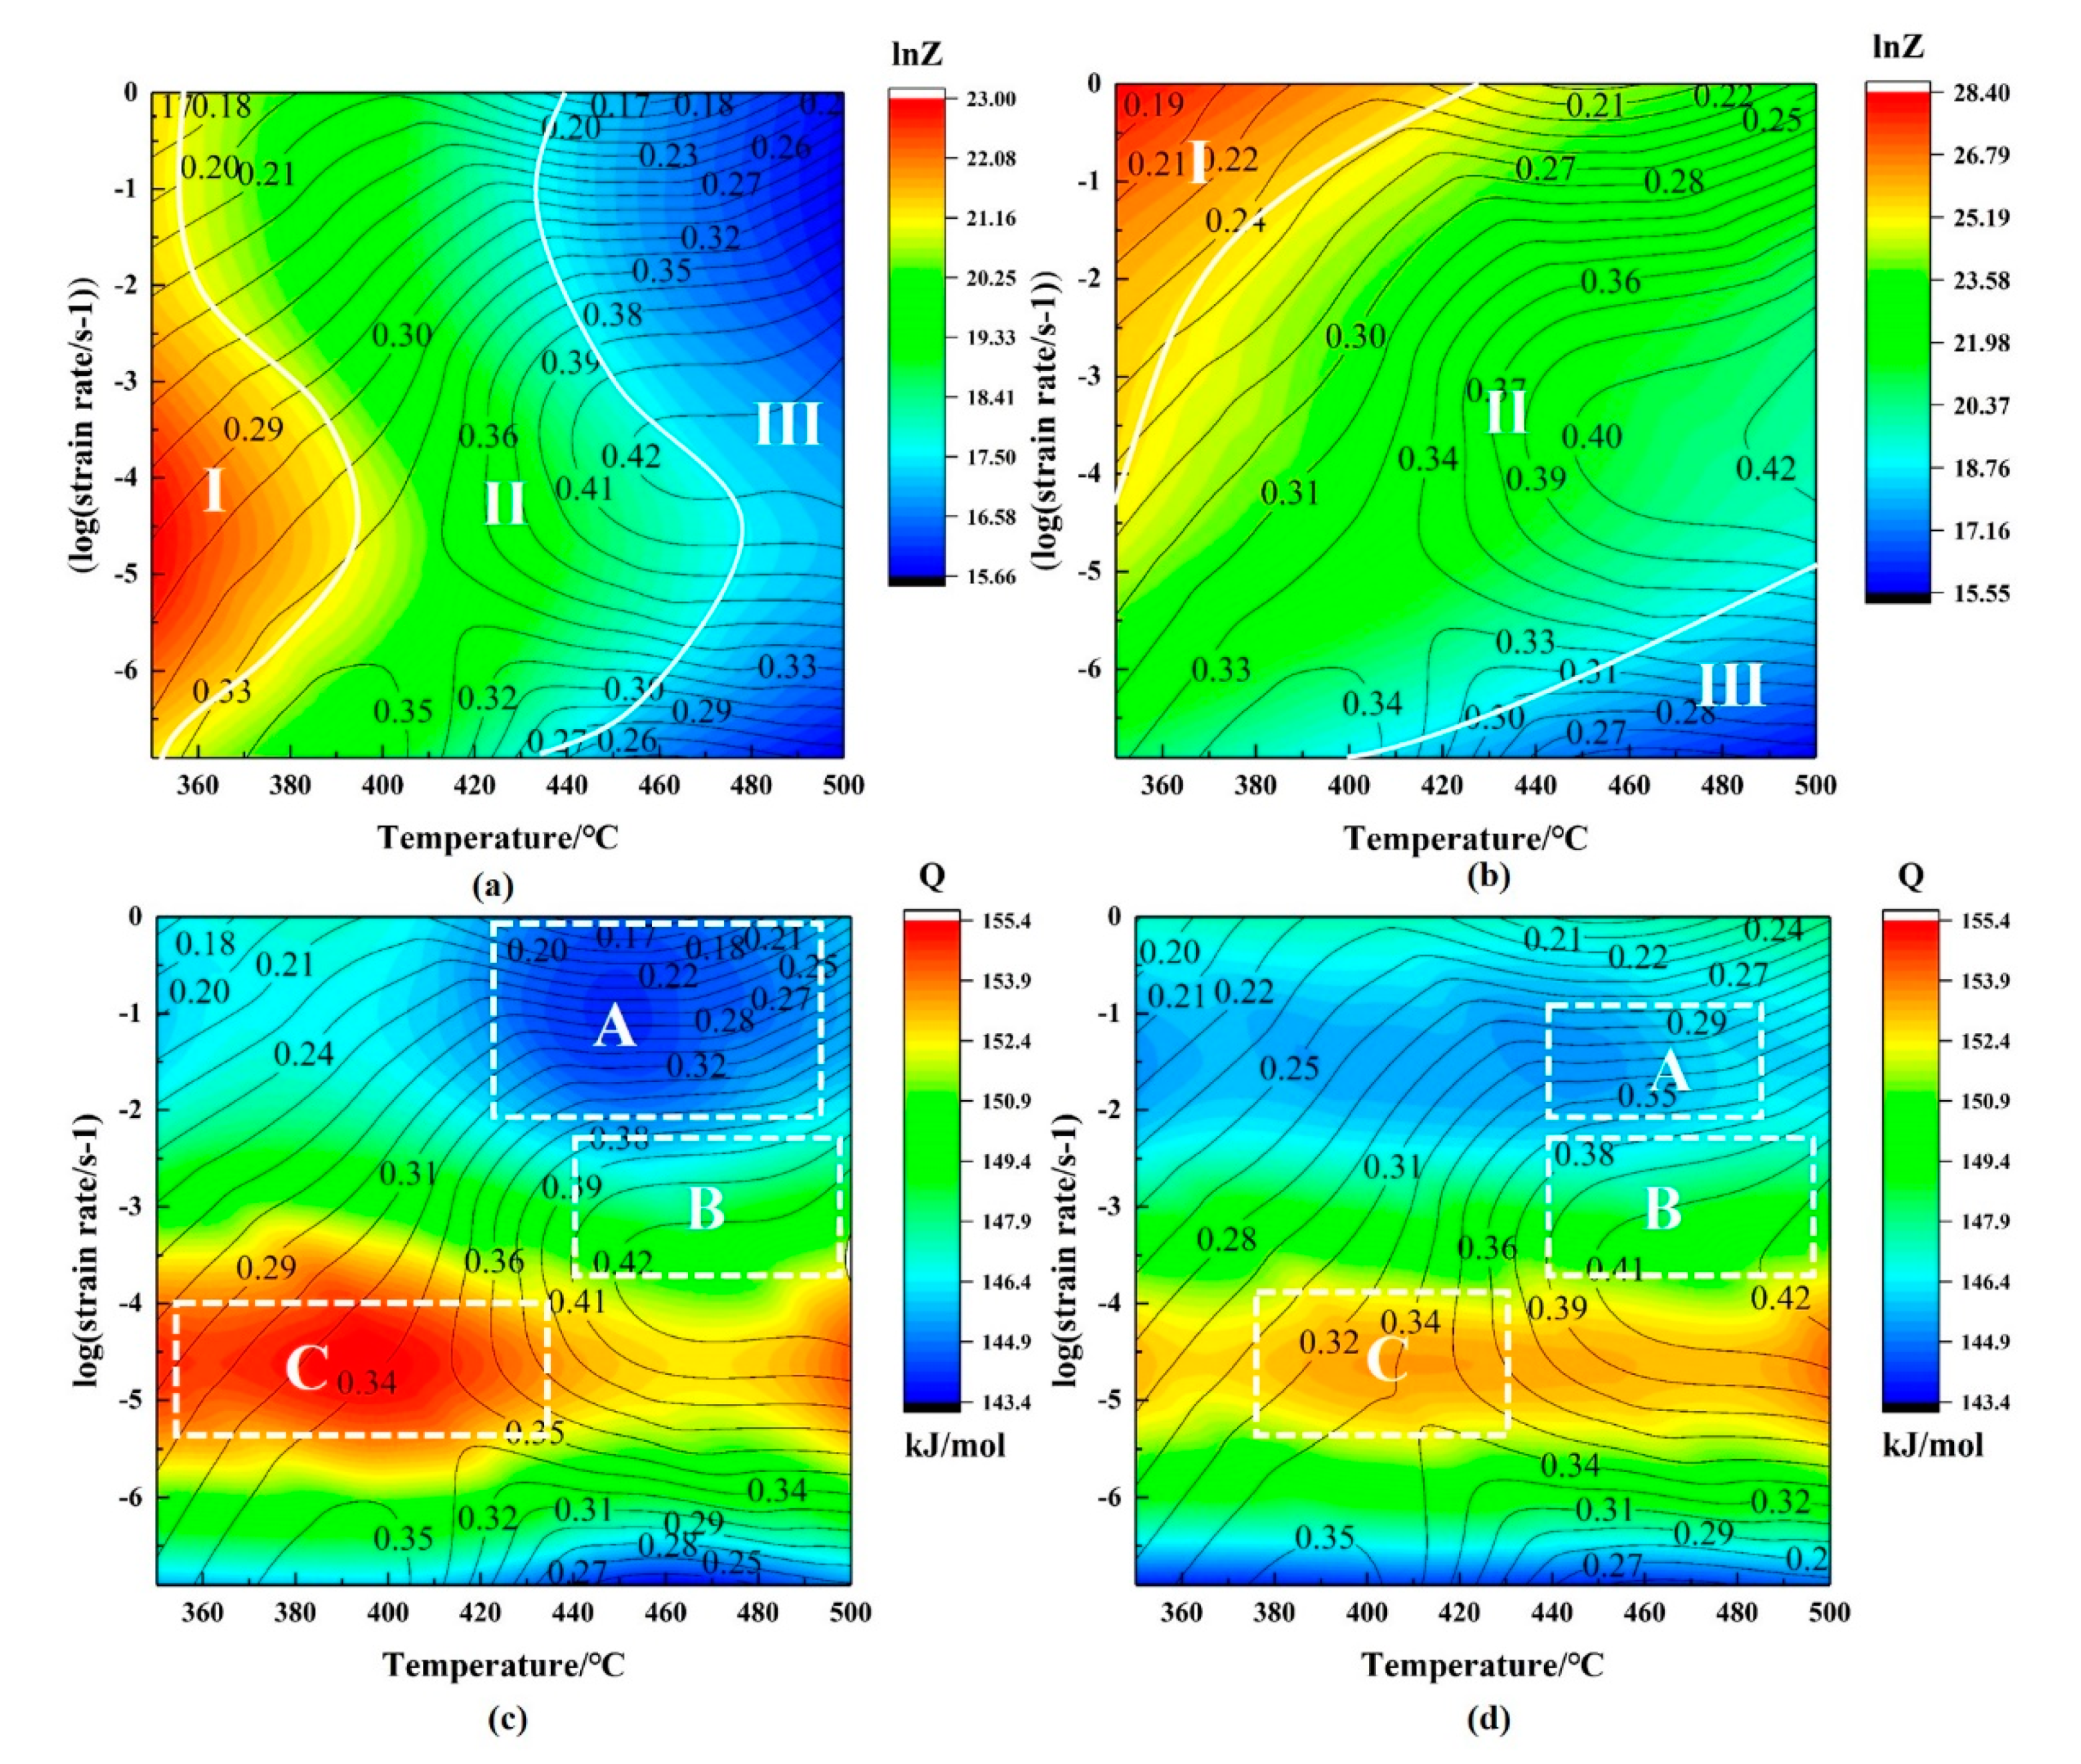
3.4. Processing Map and Activation Energy Map
4. Discussion
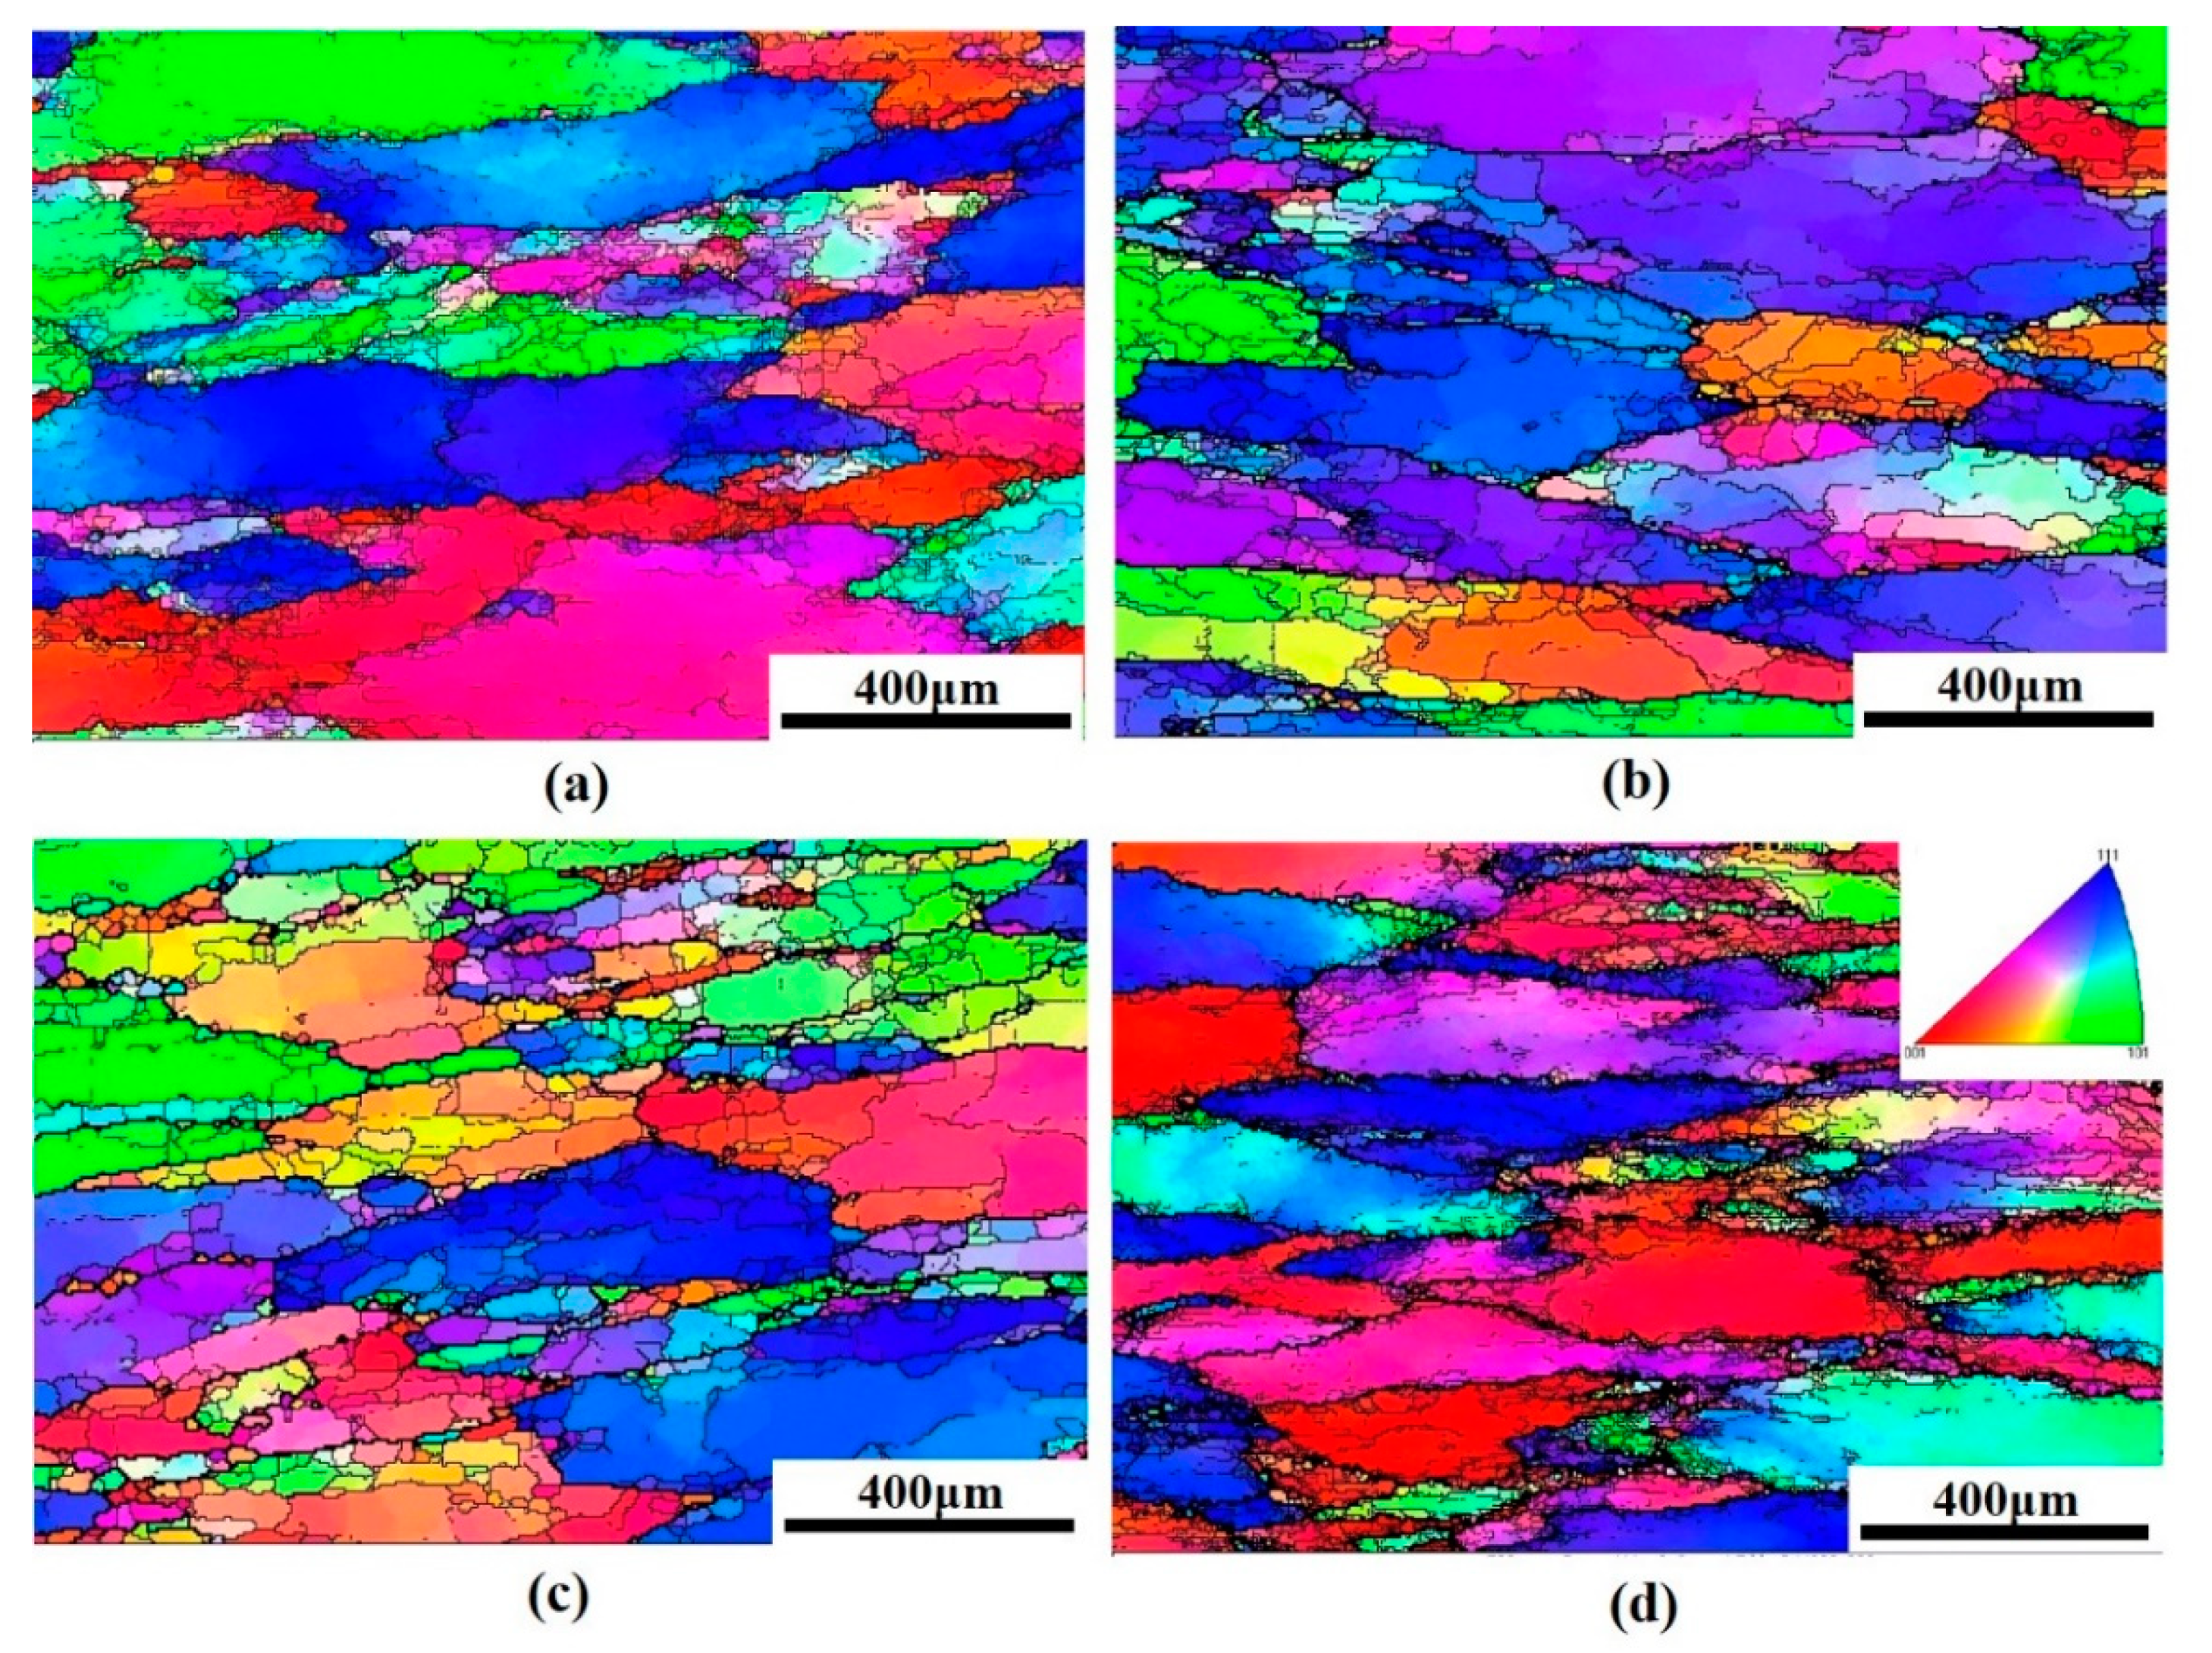
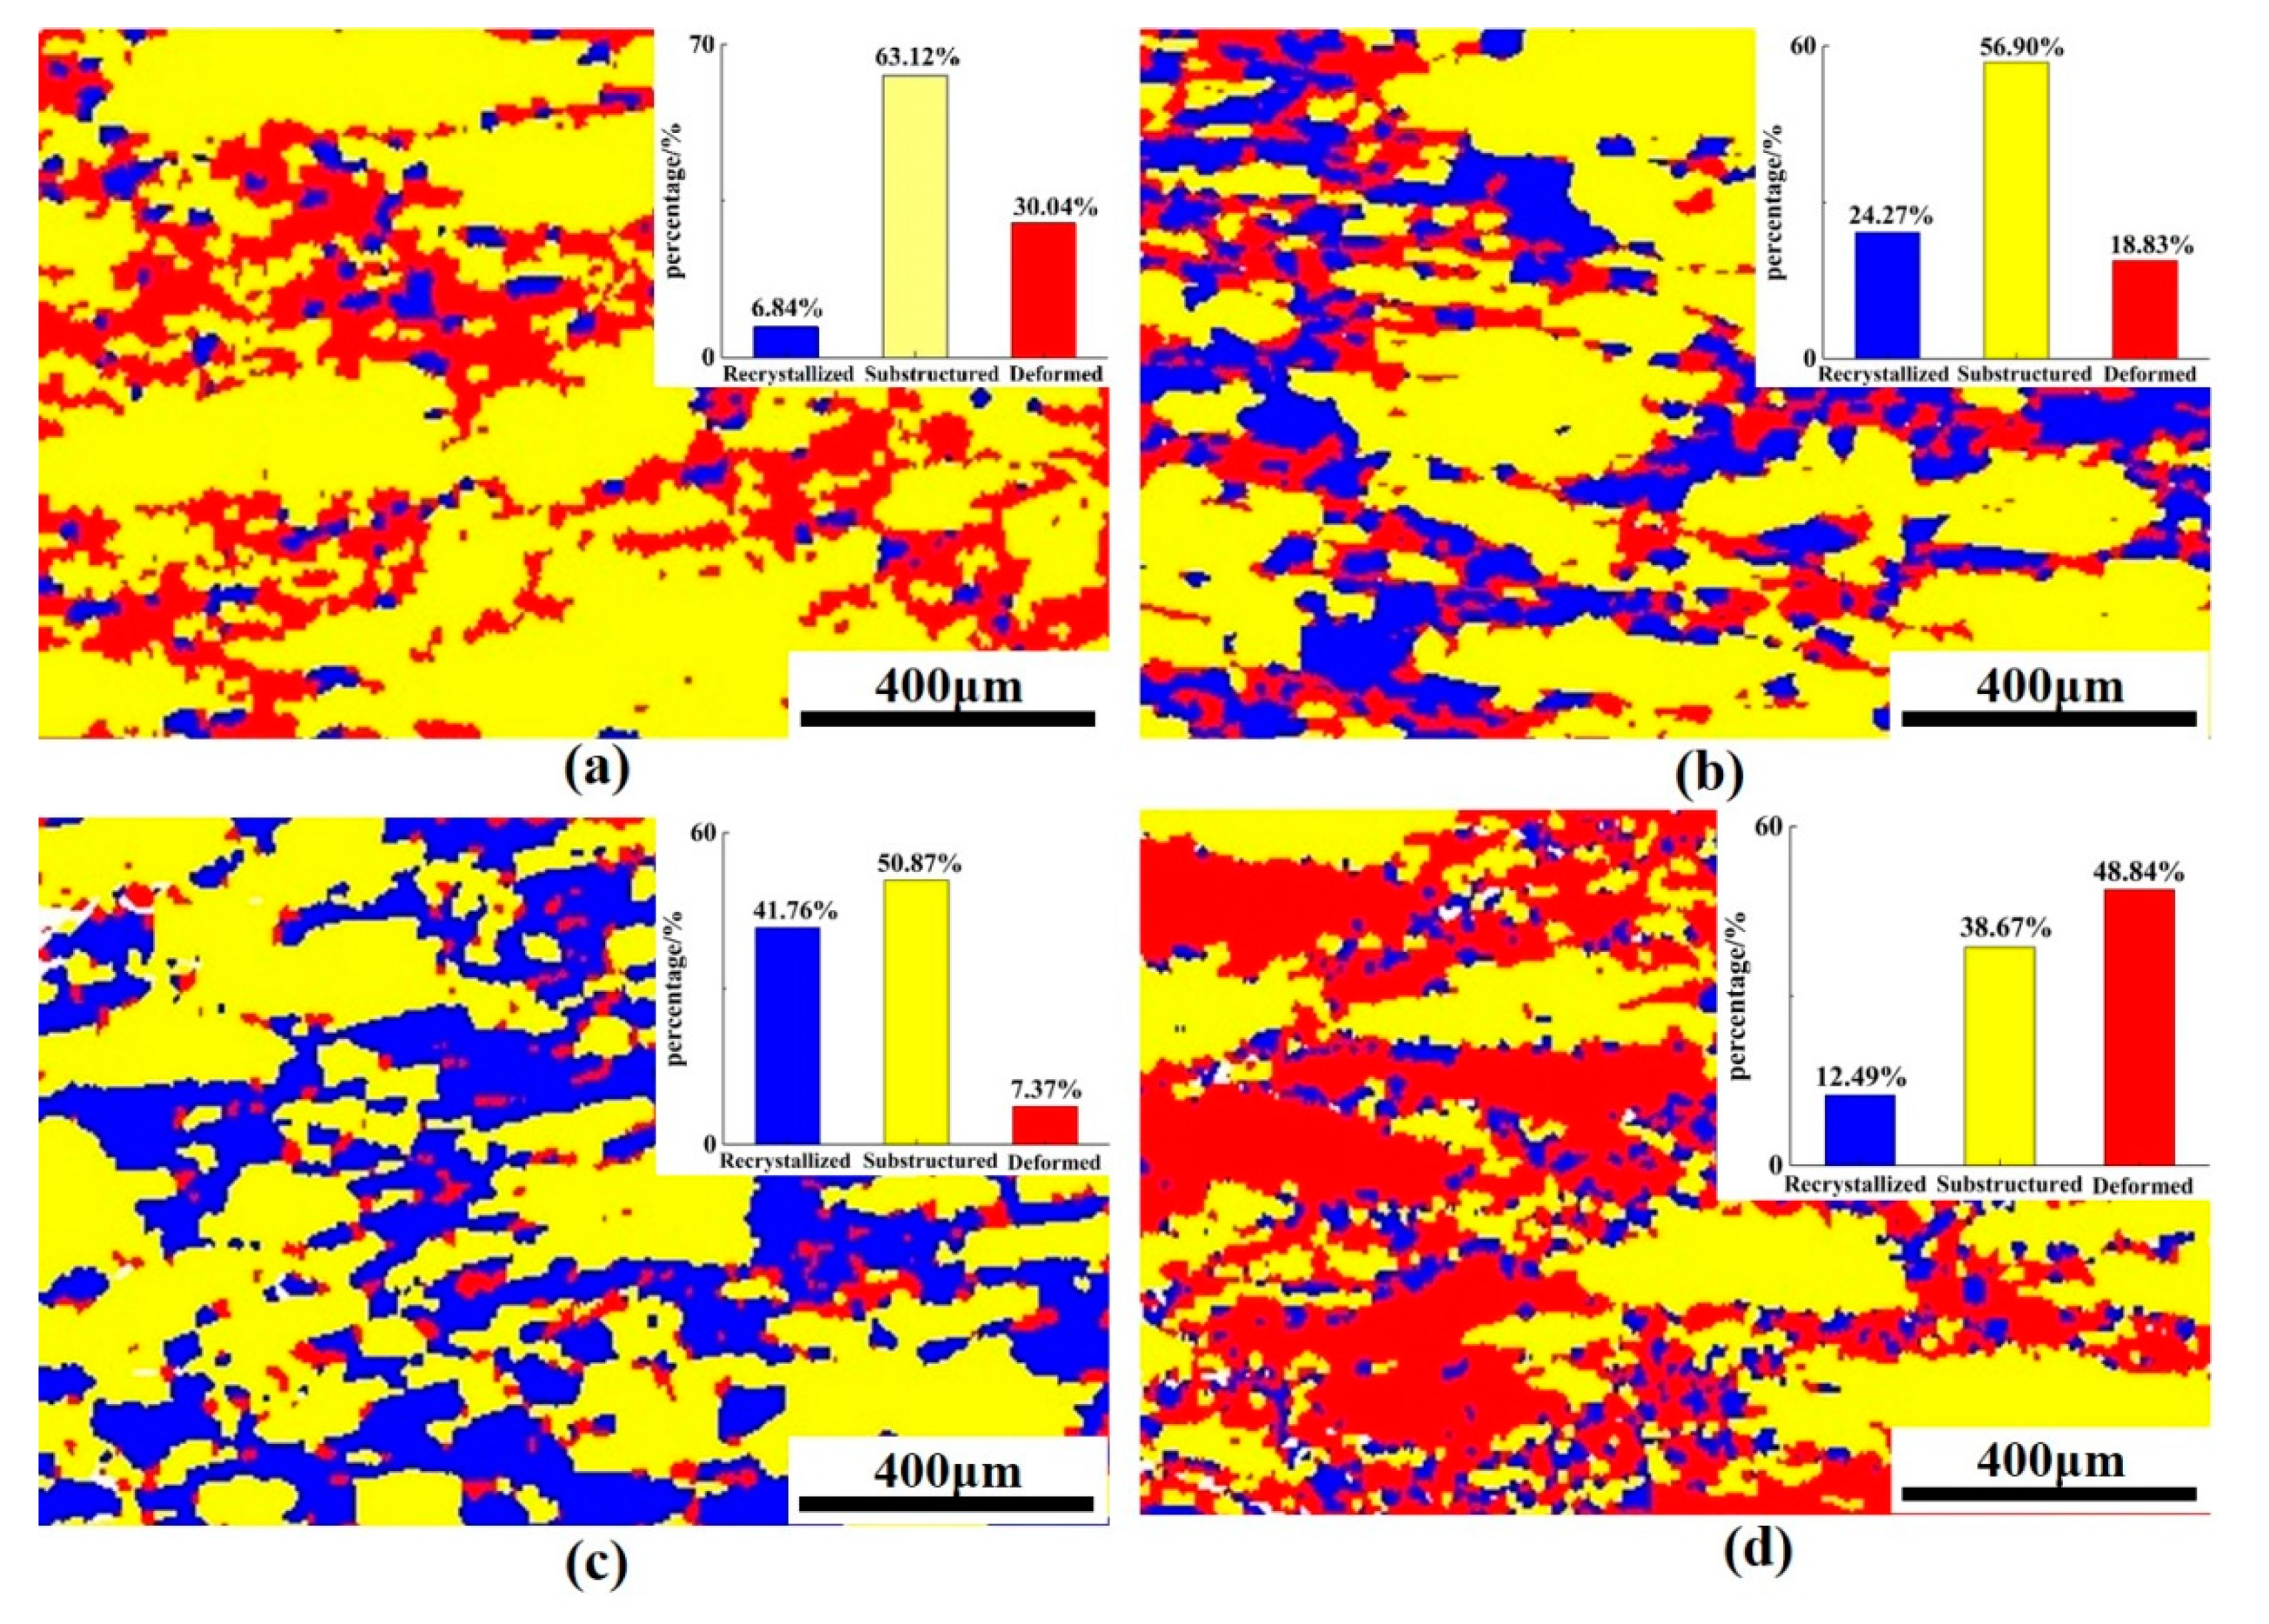
4.1. Microstructure Evolution
4.2. Dynamic Recrystallization in the Studied Alloys
5. Conclusions
- The true stress increased significantly with increasing strain rate and decreasing deformation temperature. The modified Arrhenius constitutive equation based on hyperbolic sine function was established. The correlation coefficient of the Arrhenius model was R = 0.9986 and the average absolute error was 2.89%, which can accurately describe the high-temperature flow stress.
- The hot-processing map was established based on DMM, and the stability processing area for the hot-processing map was 460–500 °C/0.01–0.08 s−1. Then, the Z parameter processing map and activation energy processing maps were established for further optimization. Eventually, the optimal processing parameters of the alloy were 460–500 °C (0.03–0.08 s−1).
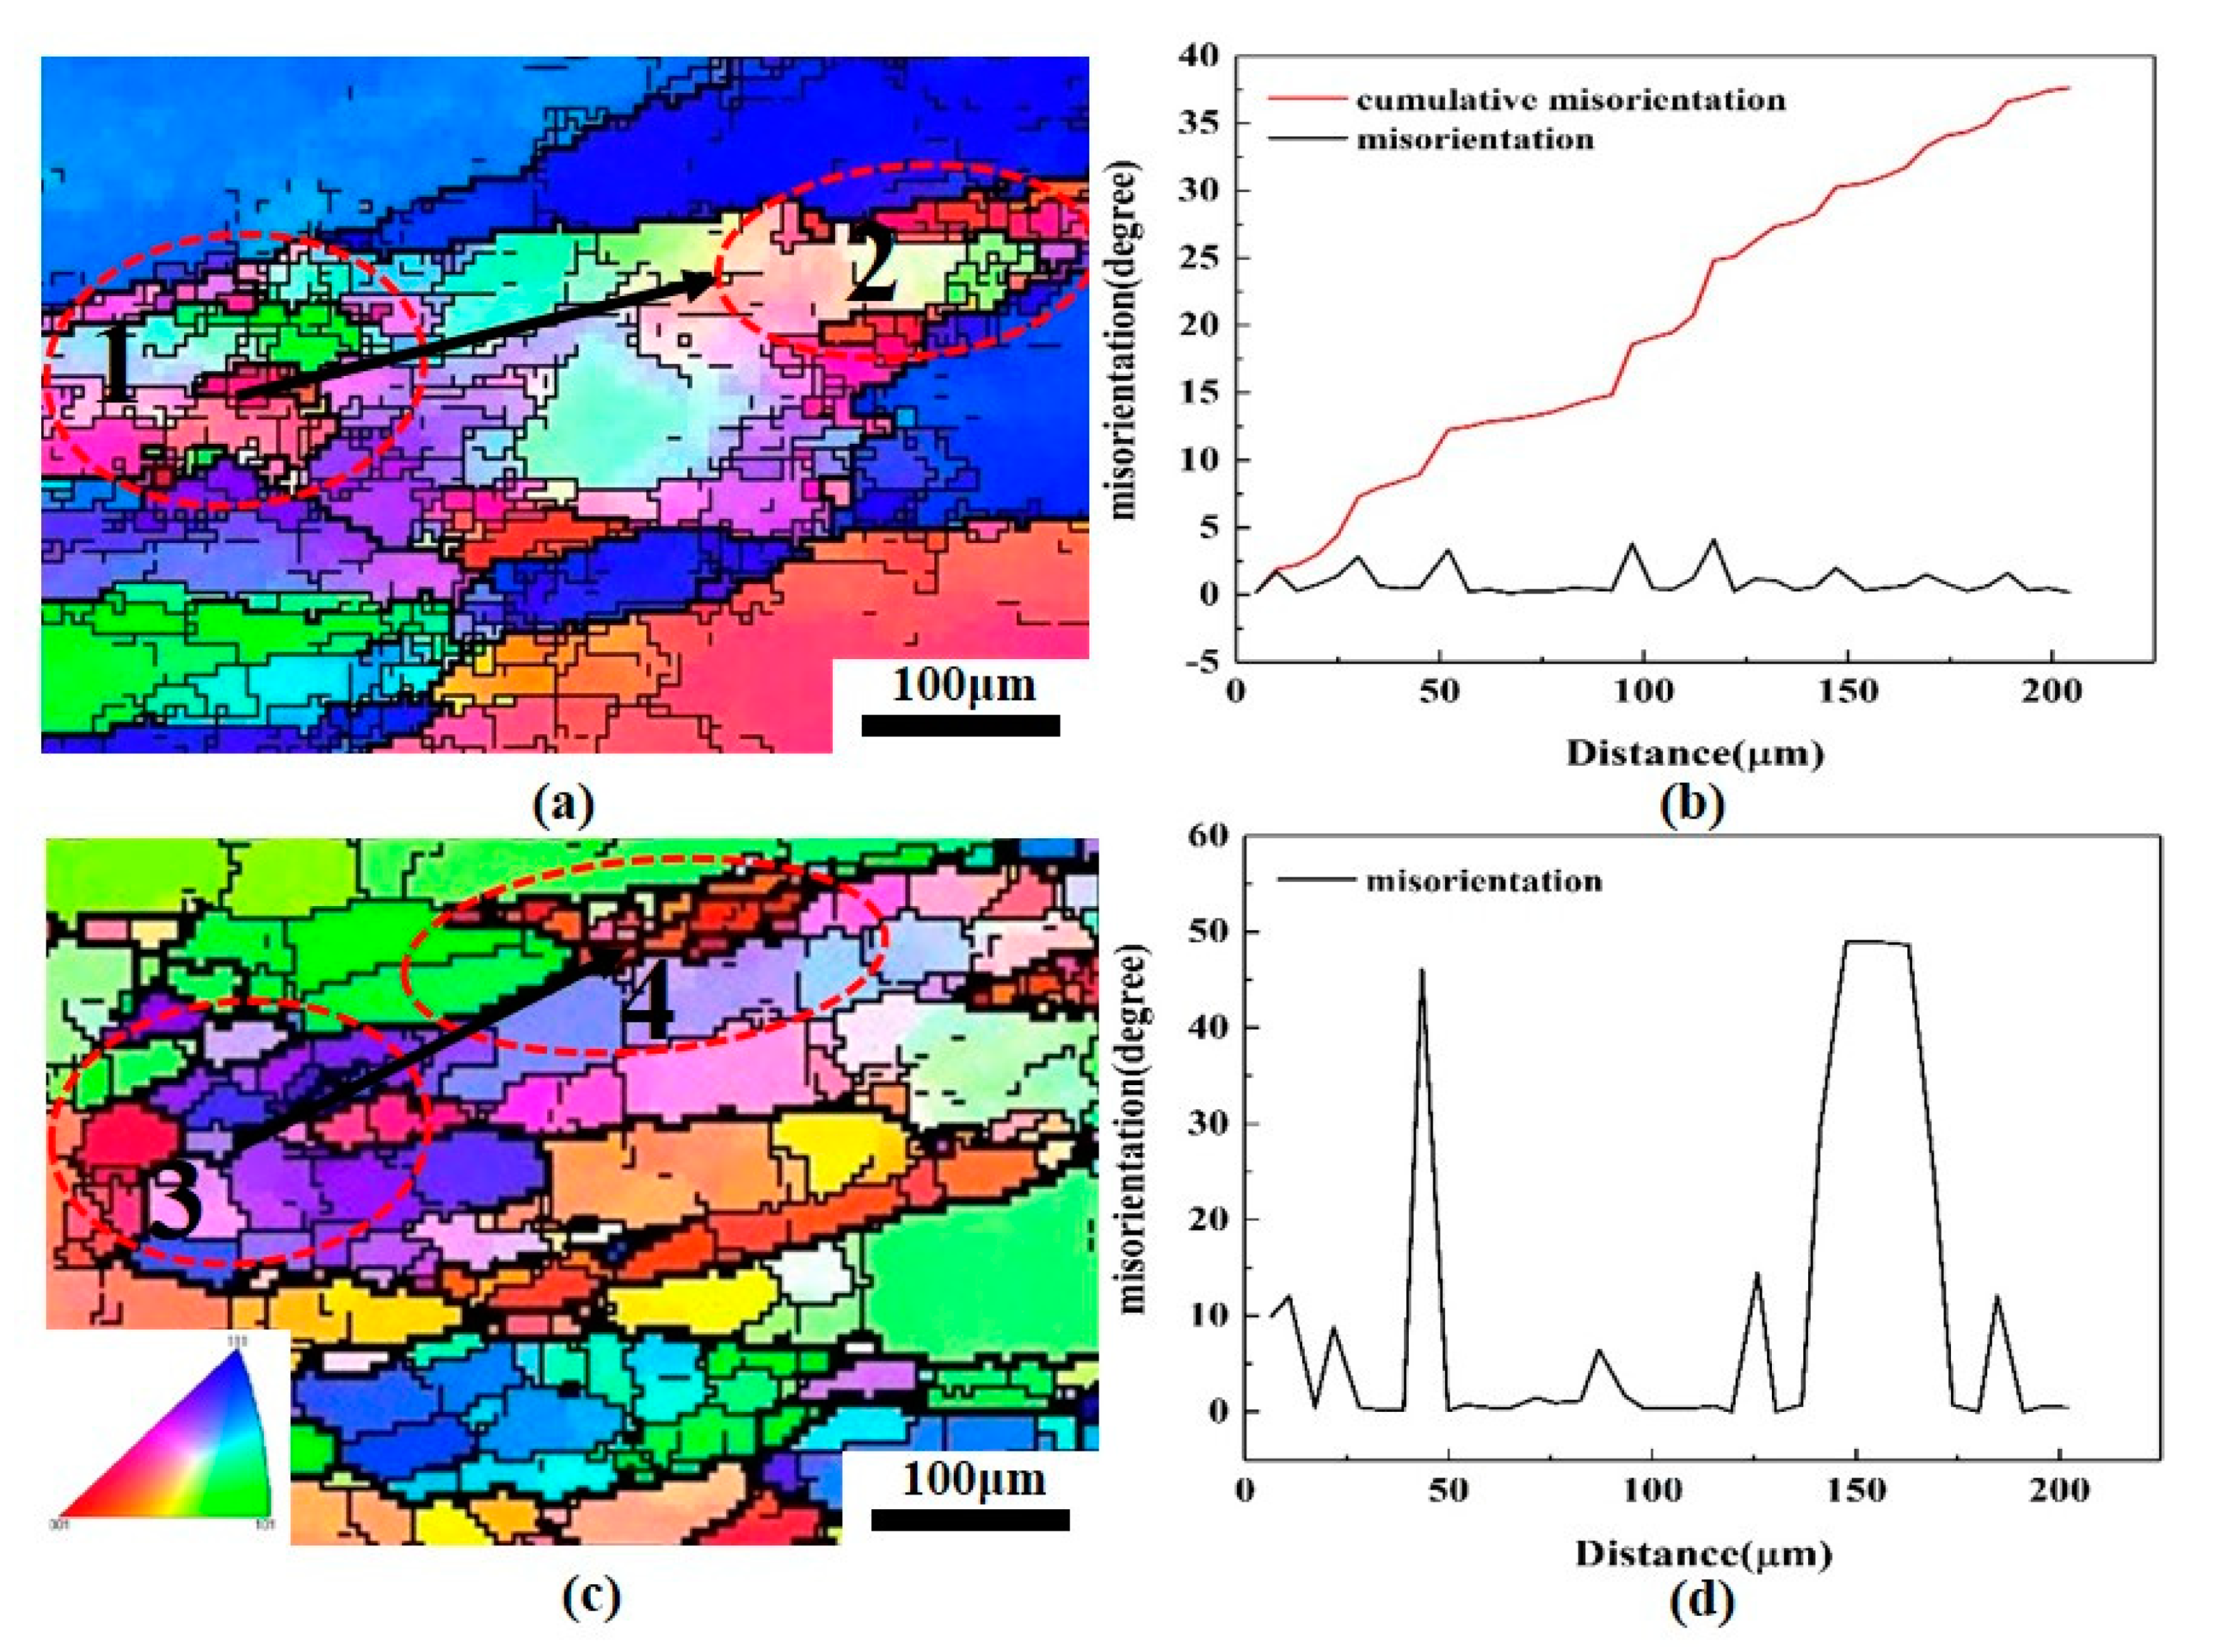
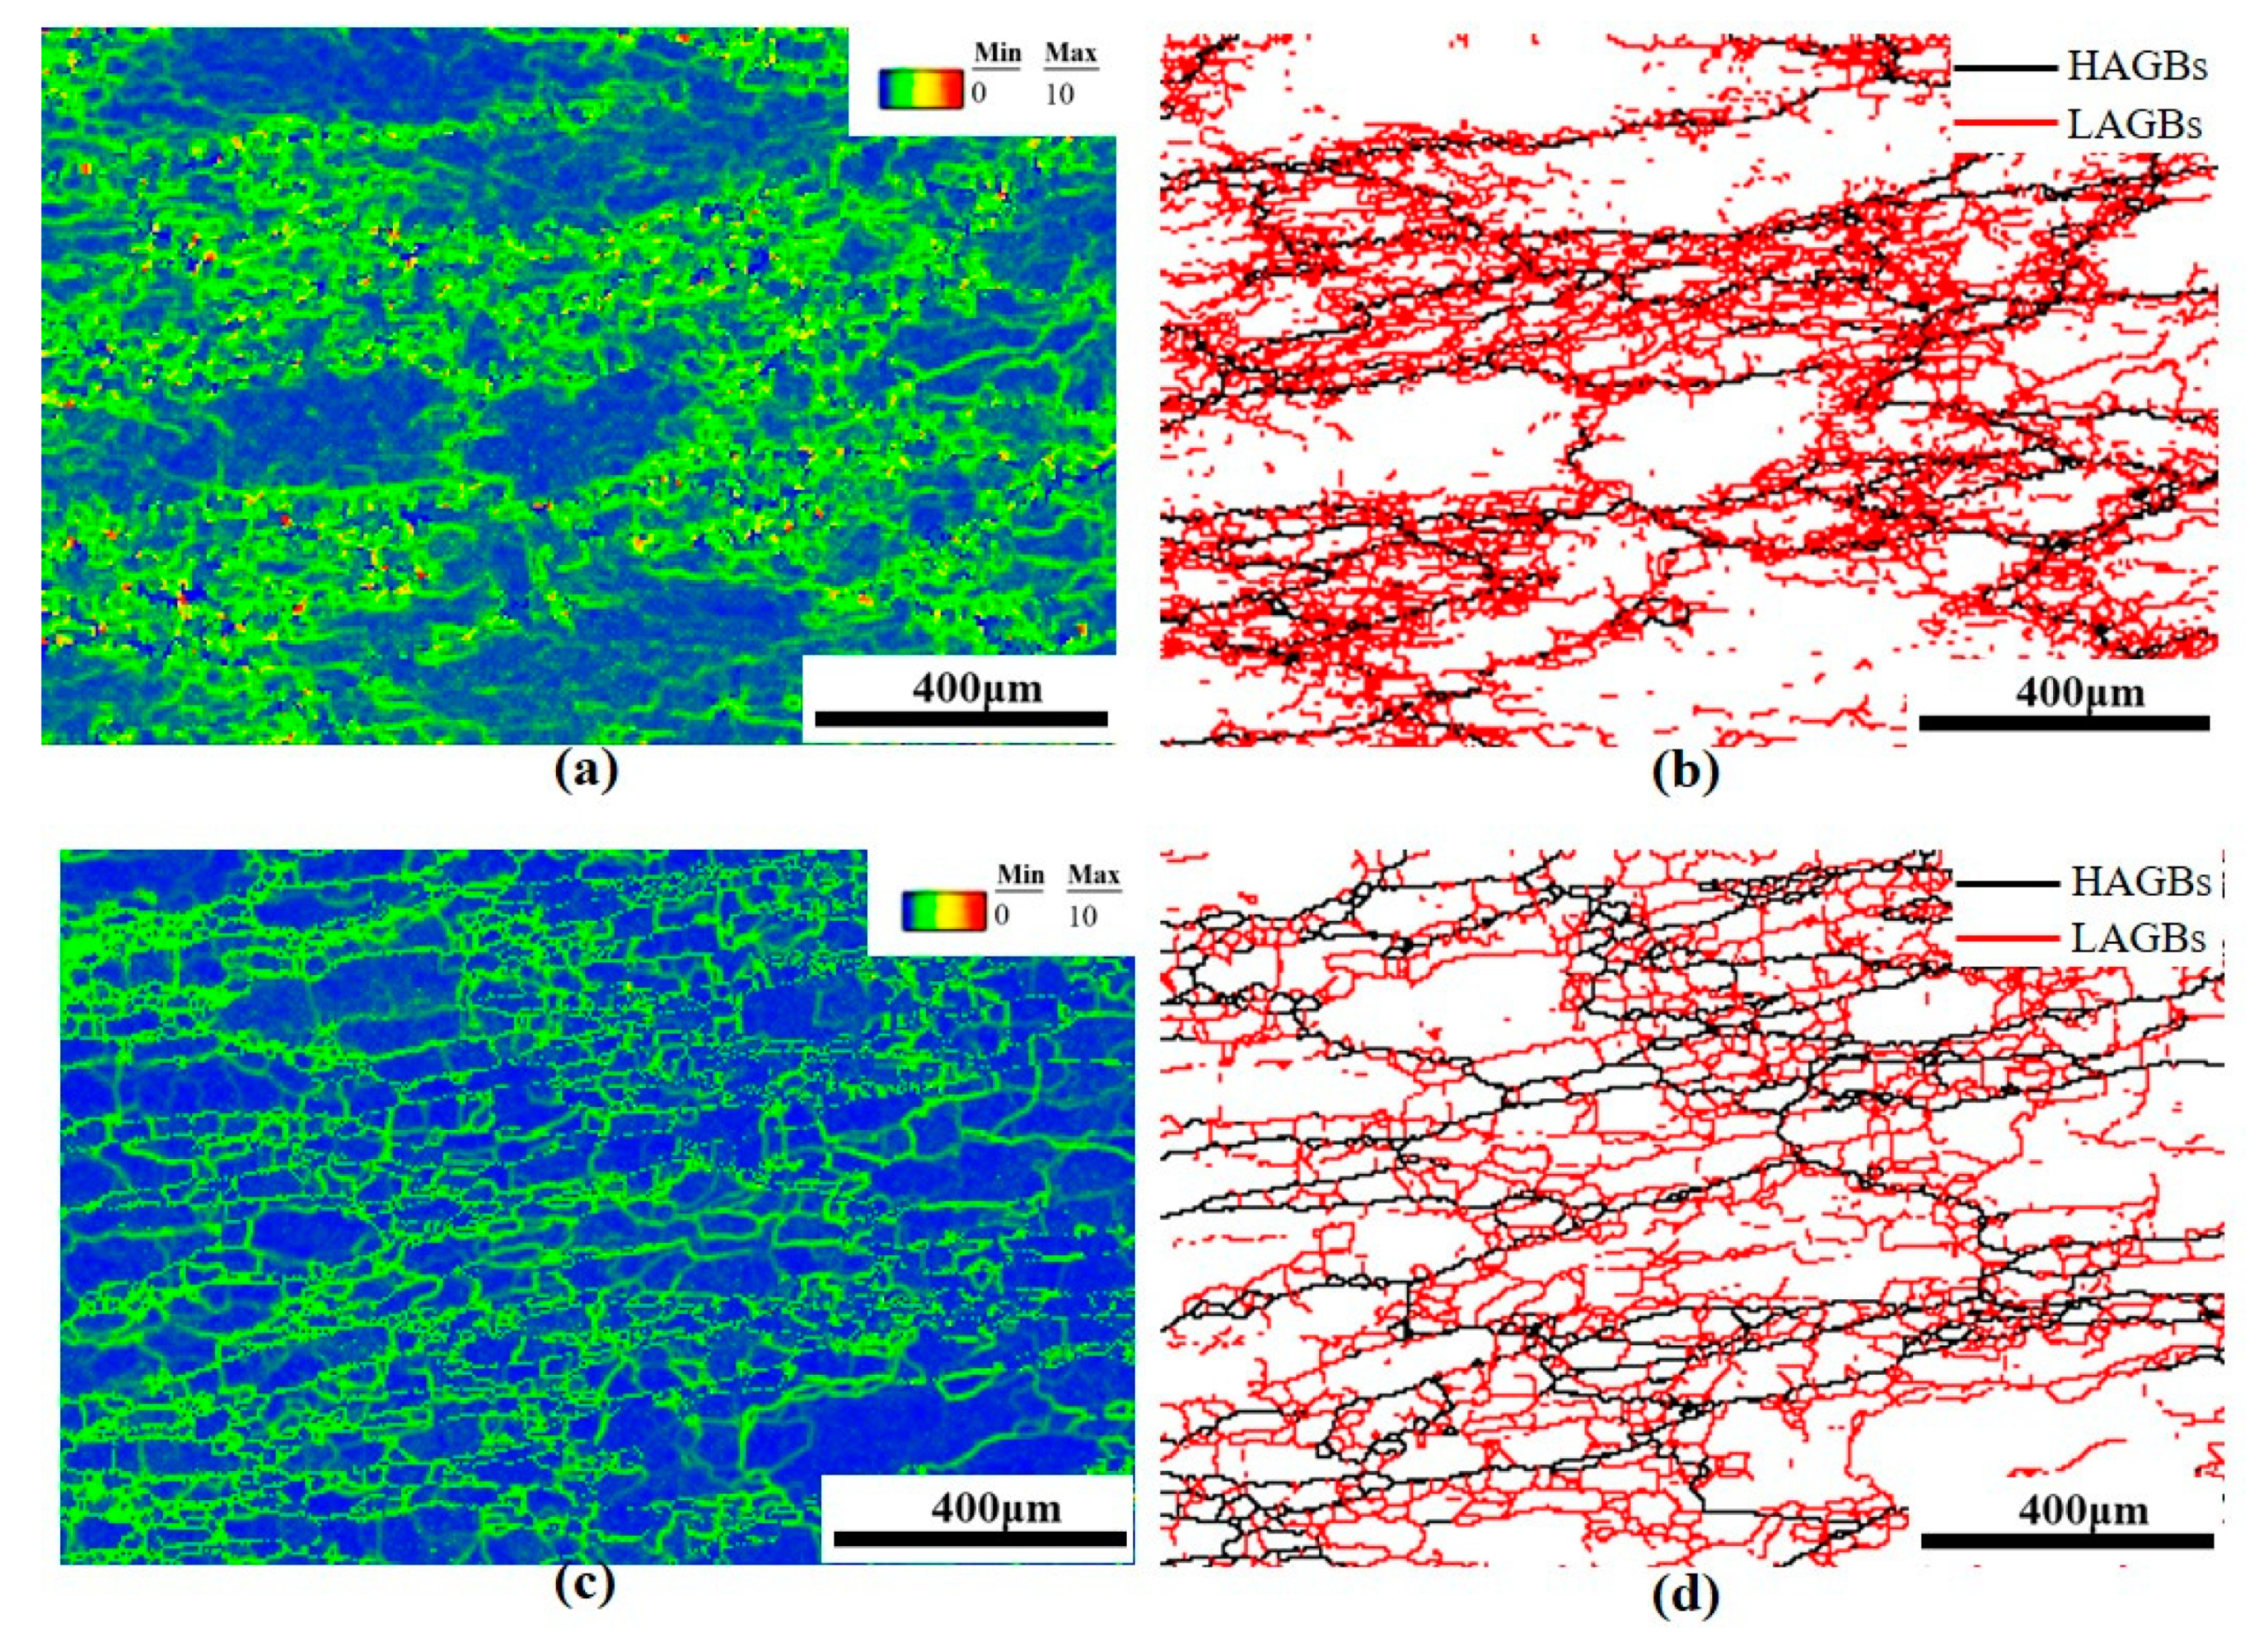
- EBSD techniques were used to analyze the evolution of the grain structure during the deformation process. Based on the findings, the reasonability of the AEP map and Z parameter map was verified. Meanwhile, in the Al–Zn–Mg alloy, dynamic recovery occurs first and subgrains with an orientation difference of less than 10° are formed in the initial grains. The subgrains are gradually converted to large-angle grain boundaries through constantly absorbing dislocations and continuous subgrains’ rotation, showing typical CDRX microstructure characteristics. Then with the continuous increase of strain, the strain induces migration of large-angle grain boundaries to produce DDRX, forming necklace grains along the initial grain boundary.
Author Contributions
Funding
Institutional Review Board Statement
Informed Consent Statement
Data Availability Statement
Acknowledgments
Conflicts of Interest
References
- He, H.; Yi, Y.; Cui, J.; Huang, S. Hot deformation characteristics and processing parameter optimization of 2219 Al alloy using constitutive equation and processing map. Vacuum 2019, 160, 293–302. [Google Scholar] [CrossRef]
- Rokni, M.R.; Zarei-Hanzaki, A.; Roostaei, A.A.; Abedi, H.R. An investigation into the hot deformation characteristics of 7075 aluminum alloy. Mater. Des. 2011, 32, 2339–2344. [Google Scholar] [CrossRef]
- Rokni, M.R.; Zarei-Hanzaki, A.; Roostaei, A.A.; Abolhasani, A. Constitutive base analysis of a 7075 aluminum alloy during hot compression testing. Mater. Des. 2011, 32, 4955–4960. [Google Scholar] [CrossRef]
- Wang, X.-D.; Pan, Q.-L.; Xiong, S.-W.; Liu, L.-L.; Sun, Y.-W.; Wang, W.-Y. Prediction on hot deformation behavior of spray-formed 7055 aluminum alloy via phenomenological models. Trans. Nonferrous Met. Soc. 2018, 28, 1484–1494. [Google Scholar] [CrossRef]
- Yang, Q.; Wang, X.; Li, X.; Deng, Z.; Jia, Z.; Zhang, Z.; Huang, G.; Liu, Q. Hot deformation behavior and microstructure of AA2195 alloy under plane strain compression. Mater. Charact. 2017, 131, 500–507. [Google Scholar] [CrossRef]
- Lin, Y.; Chen, X.-M. A critical review of experimental results and constitutive descriptions for metals and alloys in hot working. Mater. Des. 2011, 32, 1733–1759. [Google Scholar] [CrossRef]
- Sheng, X.; Lei, Q.; Xiao, Z.; Wang, M. Hot Deformation Behavior of a Spray-Deposited Al–8.31Zn–2.07Mg–2.46Cu–0.12Zr Alloy. Metals 2017, 7, 299. [Google Scholar] [CrossRef] [Green Version]
- Rudnytskyj, A.; Simon, P.; Jech, M.; Gachot, C. Constitutive modelling of the 6061 aluminium alloy under hot rolling conditions and large strain ranges. Mater. Des. 2020, 190, 108568. [Google Scholar] [CrossRef]
- Zhou, P.; Ma, Q.; Luo, J. Hot Deformation Behavior of As-Cast 30Cr2Ni4MoV Steel Using Processing Maps. Metals 2017, 7, 50. [Google Scholar] [CrossRef] [Green Version]
- Wu, R.; Liu, Y.; Geng, C.; Lin, Q.; Xiao, Y.; Xu, J.; Kang, W. Study on hot deformation behavior and intrinsic workability of 6063 aluminum alloys using 3D processing map. J. Alloys Compd. 2017, 713, 212–221. [Google Scholar] [CrossRef]
- Lutz, A.; Malet, L.; Dille, J.; De Almeida, L.H.; Lapeire, L.; Verbeken, K.; Godet, S.; Terryn, H.; De Graeve, I. Effect of Zn on the grain boundary precipitates and resulting alkaline etching of recycled Al–Mg–Si–Cu alloys. J. Alloys Compd. 2019, 794, 435–442. [Google Scholar] [CrossRef] [Green Version]
- Xiao, Q.-F.; Huang, J.-W.; Jiang, Y.-G.; Jiang, F.-Q.; Wu, Y.-F.; Xu, G.-F. Effects of minor Sc and Zr additions on mechanical properties and microstructure evolution of Al∓Zn∓Mg∓Cu alloys. Trans. Nonferrous Met. Soc. 2020, 30, 1429–1438. [Google Scholar] [CrossRef]
- Zhu, Q.; Cao, L.; Wu, X.; Zou, Y.; Couper, M.J. Effect of Ag on age-hardening response of Al–Zn–Mg–Cu alloys. Mater. Sci. Eng. A 2019, 754, 265–268. [Google Scholar] [CrossRef]
- Chen, K.; Tang, J.; Jiang, F.; Teng, J.; Fu, D.; Zhang, H. The role of various Zr additions in static softening behavior of Al–Zn–Mg–Cu alloys during interval holding of double-stage hot deformation. J. Alloys Compd. 2019, 792, 1112–1121. [Google Scholar] [CrossRef]
- Gupta, R.K.; Kumar, V.A.; Krishnan, A.S.; Niteshraj, J. Hot Deformation Behavior of Aluminum Alloys AA7010 and AA7075. J. Mater. Eng. Perform. 2019, 28, 5021–5036. [Google Scholar] [CrossRef]
- Tang, J.; Zhang, H.; Teng, J.; Fu, D.; Jiang, F. Effect of Zn content on the static softening behavior and kinetics of Al–Zn–Mg–Cu alloys during double-stage hot deformation. J. Alloys Compd. 2019, 806, 1081–1096. [Google Scholar] [CrossRef]
- Sun, Y.; Pan, Q.; Huang, Z.; Wang, W.; Wang, X.; Li, M.; Lai, J. Evolutions of diffusion activation energy and Zener–Hollomon parameter of ultra-high strength Al–Zn–Mg–Cu–Zr alloy during hot compression. Prog. Nat. Sci. 2018, 28, 635–646. [Google Scholar] [CrossRef]
- Wu, H.; Wen, S.; Huang, H.; Gao, K.; Wu, X.; Wang, W.; Nie, Z. Hot deformation behavior and processing map of a new type Al–Zn–Mg–Er–Zr alloy. J. Alloys Compd. 2016, 685, 869–880. [Google Scholar] [CrossRef]
- Lin, Y.C.; Li, L.-T.; Xia, Y.-C.; Jiang, Y.-Q. Hot deformation and processing map of a typical Al–Zn–Mg–Cu alloy. J. Alloys Compd. 2013, 550, 438–445. [Google Scholar] [CrossRef]
- Feng, D.; Zhang, X.M.; Liu, S.D.; Deng, Y.L. Constitutive equation and hot deformation behavior of homogenized Al–7.68Zn–2.12Mg–1.98Cu–0.12Zr alloy during compression at elevated temperature. Mater. Sci. Eng. A 2014, 608, 63–72. [Google Scholar] [CrossRef]
- Wang, L.; Wang, X.; Zhu, X.; Xu, X.; Cui, J.Z.; Liao, B.; Wang, X.; Wu, X. Role of Vanadium Addition on Hot Deformation Behavior of Aluminum Alloy 5083. Metals 2019, 9, 766. [Google Scholar] [CrossRef] [Green Version]
- Sellars, C.M.; McTegart, W.J. On the mechanism of hot deformation. Acta Met. 1966, 14, 1136–1138. [Google Scholar] [CrossRef]
- Zener, C.; Hollomon, J.H. Effect of Strain Rate Upon Plastic Flow of Steel. J. Appl. Phys. 1944, 15, 22–32. [Google Scholar] [CrossRef]
- Yan, J.; Pan, Q.-L.; Li, A.-D.; Song, W.-B. Flow behavior of Al–6.2Zn–0.70Mg–0.30Mn–0.17Zr alloy during hot compressive deformation based on Arrhenius and ANN models. Trans. Nonferrous Met. Soc. 2017, 27, 638–647. [Google Scholar] [CrossRef]
- Ren, F.-C.; Chen, J.; Chen, F. Constitutive modeling of hot deformation behavior of X20Cr13 martensitic stainless steel with strain effect. Trans. Nonferrous Met. Soc. 2014, 24, 1407–1413. [Google Scholar] [CrossRef]
- Sun, C.; Zuo, X.; Xiang, Y.; Yang, J. Investigation on Hot Deformation Behavior and Hot Processing Map of BSTMUF601 Super-Alloy. Metals 2016, 6, 70. [Google Scholar] [CrossRef] [Green Version]
- Prasad, Y.V.R.K.; Gegel, H.L.; Doraivelu, S.M.; Malas, J.C.; Morgan, J.T.; Lark, K.A.; Barker, D.R. Modeling of dynamic material behavior in hot deformation: Forging of Ti-6242. Metall. Mater. Trans. A 1984, 15, 1883–1892. [Google Scholar] [CrossRef]
- Łyszkowski, R.; Bystrzycki, J. Hot deformation and processing maps of a Fe–Al intermetallic alloy. Mater. Charact. 2014, 96, 196–205. [Google Scholar] [CrossRef]
- Lu, J.; Song, Y.; Hua, L.; Zheng, K.; Dai, D. Thermal deformation behavior and processing maps of 7075 aluminum alloy sheet based on isothermal uniaxial tensile tests. J. Alloys Compd. 2018, 767, 856–869. [Google Scholar] [CrossRef]
- Zhou, M.; Hu, R.; Yang, J.-R.; Wang, C.; Wen, M. Determination of Constitutive Equation and Thermo–Mechanical Processing Map for Pure Iridium. Metals 2020, 10, 1087. [Google Scholar] [CrossRef]
- Li, X.; Hou, L.; Wei, Y.; Wei, Z. Constitutive Equation and Hot Processing Map of a Nitrogen-Bearing Martensitic Stainless Steel. Metals 2020, 10, 1502. [Google Scholar] [CrossRef]
- Prasad, Y.; Seshacharyulu, T. Processing maps for hot working of titanium alloys. Mater. Sci. Eng. A 1998, 243, 82–88. [Google Scholar] [CrossRef]
- Opěla, P.; Schindler, I.; Kawulok, P.; Kawulok, R.; Rusz, S.; Navrátil, H.; Jurča, R. Correlation among the Power Dissipation Efficiency, Flow Stress Course, and Activation Energy Evolution in Cr-Mo Low-Alloyed Steel. Materials 2020, 13, 3480. [Google Scholar] [CrossRef] [PubMed]
- Wang, Z.; Fu, W.; Wang, B.; Zhang, W.; Lv, Z.; Jiang, P. Study on hot deformation characteristics of 12%Cr ultra-super-critical rotor steel using processing maps and Zener–Hollomon parameter. Mater. Charact. 2010, 61, 25–30. [Google Scholar] [CrossRef]
- Rajput, S.K.; Chaudhari, G.P.; Nath, S.K. Characterization of hot deformation behavior of a low carbon steel using processing maps, constitutive equations and Zener-Hollomon parameter. J. Mater. Process. Technol. 2016, 237, 113–125. [Google Scholar] [CrossRef]
- Zhou, P.; Deng, L.; Zhang, M.; Gong, P.; Wang, X. Characterization of Hot Workability of 5052 Aluminum Alloy Based on Activation Energy-Processing Map. J. Mater. Eng. Perform. 2019, 28, 6209–6218. [Google Scholar] [CrossRef]
- Ke, B.; Ye, L.; Tang, J.; Zhang, Y.; Liu, S.; Lin, H.; Dong, Y.; Liu, X. Hot deformation behavior and 3D processing maps of AA7020 aluminum alloy. J. Alloys Compd. 2020, 845, 156113. [Google Scholar] [CrossRef]
- Liu, D.; Qin, J.; Zhang, Y.; Wang, Z.; Nie, J. Effect of yttrium addition on the hot deformation behavior of Fe–6.5 wt%Si alloy. Mater. Sci. Eng. A 2020, 797, 140238. [Google Scholar] [CrossRef]


| Chemical Composition | Zn | Mg | Cu | Zr | Ti | Fe | Si | Al |
|---|---|---|---|---|---|---|---|---|
| wt.% | 6.32 | 2.10 | 0.10 | 0.11 | 0.063 | 0.063 | 0.038 | Bal. |
| α | Q | n | lnA |
|---|---|---|---|
| B0 = 0.031 | C0 = 160.421 | D0 = 3.848 | F0 = 22.273 |
| B1 = −0.027 | C1 = −105.167 | D1 = 3.613 | F1 = 16.869 |
| B2 = 0.133 | C2 = 419.898 | D2 = −38.356 | F2 = −180.136 |
| B3 = −0.367 | C3 = −932.104 | D3 = 129.099 | F3 = 596.753 |
| B4 = 0.500 | C4 = 1076.587 | D4 = −182.413 | F4 = −835.176 |
| B5 = −0.262 | C5 = −506.806 | D5 = 93.327 | F5 = 425.388 |
Publisher’s Note: MDPI stays neutral with regard to jurisdictional claims in published maps and institutional affiliations. |
© 2021 by the authors. Licensee MDPI, Basel, Switzerland. This article is an open access article distributed under the terms and conditions of the Creative Commons Attribution (CC BY) license (http://creativecommons.org/licenses/by/4.0/).
Share and Cite
Xiao, Z.; Wang, Q.; Huang, Y.; Hu, J.; Li, M. Hot Deformation Characteristics and Processing Parameter Optimization of Al–6.32Zn–2.10Mg Alloy Using Constitutive Equation and Processing Map. Metals 2021, 11, 360. https://doi.org/10.3390/met11020360
Xiao Z, Wang Q, Huang Y, Hu J, Li M. Hot Deformation Characteristics and Processing Parameter Optimization of Al–6.32Zn–2.10Mg Alloy Using Constitutive Equation and Processing Map. Metals. 2021; 11(2):360. https://doi.org/10.3390/met11020360
Chicago/Turabian StyleXiao, Zhengbing, Qiang Wang, Yuanchun Huang, Jiawei Hu, and Ming Li. 2021. "Hot Deformation Characteristics and Processing Parameter Optimization of Al–6.32Zn–2.10Mg Alloy Using Constitutive Equation and Processing Map" Metals 11, no. 2: 360. https://doi.org/10.3390/met11020360