Article

Hot Processing Map of an Al–4.30 Mg Alloy under High One-Pass Deformation

1
College of Resources, Environment and Materials, Guangxi University, Nanning 530004, China
2
Guangxi Key Laboratory of Processing for Non-Ferrous Metal and Featured Materials, Guangxi University, Nanning 530004, China
3
Center of Ecological Collaborative Innovation for Aluminum Industry in Guangxi, Nanning 530004, China
*
Author to whom correspondence should be addressed.
Metals 2021, 11(2), 347; https://doi.org/10.3390/met11020347
Submission received: 14 January 2021 / Revised: 5 February 2021 / Accepted: 16 February 2021 / Published: 19 February 2021
(This article belongs to the Section Metal Casting, Forming and Heat Treatment)

Abstract

:
The high one-pass deformation behaviors of mass-produced Al–4.30Mg alloy are investigated in the temperature ranging of 350 °C–500 °C, the strain rate ranging of 0.01 s−1–1 s−1 and the reduction ranging of 50–75%. 3D processing maps are constructed by the superimposition of the instability map and the power dissipation map at the true strain of 0.69, 0.92, 1.20 and 1.38. When the true strain increases from 0.69 to 1.38, the average apparent activation energy (Q) decreases from 140.3 kJ/mol to 112.7 kJ/mol, indicating the reduction of the hot deformation energy barrier. The heating caused by a large strain of 1.38 greatly reduces the Q and improves processing efficiency. The instability regions at the strain of 0.69 appear at two domains, namely 350 °C/1.0 s−1 and 450 °C/1.0 s−1; whereas, the instability regions disappear at the strain of 1.38. The maximum efficiency of power dissipation is about 48%, which occurs at both domains of 440–480 °C/0.01 s−1/0.69 true strain and 470–500 °C/1.0 s−1/1.20 true strain. High-efficiency domains represent the optimized deformation conditions which are verified by stress-strain curves and microstructure characterization, in which the local dynamic recrystallization is observed and the power dissipates mainly by dynamic recrystallization during deformation.

1. Introduction

Al–Mg alloys (5xxx series) have been widely used in aerospace, electrical and electronics, transportation and bridge construction due to their low density, large specific strength and specific stiffness, and good corrosion resistance [1,2,3]. Al–Mg alloys are the best choices for components that require moderate strength, formability, weldability, and excellent atmospheric corrosion resistance [4]. However, the way to improve the strength, plasticity, and formability of Al–Mg alloys is very limited because the heat treatment is not suitable for them. Instead, their mechanical properties are mainly improved by alloying and work hardening. Rare earth elements and transition elements (such as Sc, Zr, Er, Cr, Nb, Sr and Ti) are widely used alloying elements in Al–Mg alloys, which can significantly improve their mechanical properties; in particular, the strengthening effects of trace addition of Sc, Er and Zr in Al–Mg alloys are significant [5,6,7,8]. Additionally, since thermomechanical processing is a devoted part of Al–Mg alloys production, it is also important to investigate their deformation behaviors at elevated temperatures. The processing parameters, like temperature, strain rate and strain during hot processing, have a strong impact on their behaviors of strain hardening and dynamic softening [9,10,11]. The constitutive model is used to connect the complex hot deformation process with the forming parameters [12,13,14,15,16] The four popular constitutive models, namely Arrhenius model, Zerilli–Armstrong (ZA) model, Johnson–Cook (JC) model and an artificial neutral network model can accurately predict flow stress [17,18,19,20,21,22]. The JC model and ZA model have been widely used to predict the flow stress of materials because of the simple constitutive form and a small number of involved material parameters [17,18,19]. However, the JC equation is not accurate enough when thermal deformation behaviors are considered [17,18]. ZA equation can’t pay enough attention to couple the effects of temperature and strain rate [19]. An artificial neutral network model not only needs a lot of adaptive training to achieve high accuracy but also be bad at handling complex data [20,21,22].
In the various and complicated constitutive models, the strain is usually expressed by single-pass deformation and the degree of single-pass deformation has a sharp influence on the structure and the deformation resistance [17,18,19,20,21,22]. Most of the published reports are about the thermal deformation behaviors and the hot processing maps of a small amount of deformation (the single-pass deformation is usually less than 0.69) [23,24,25,26,27,28,29]. Haghdadi et al. [23] studied the hot deformation behaviors of A356 Al alloy based on the Arrhenius-type model at the temperature range of 400–540 °C, strain rate of 0.001–0.1 s−1 and the true strain of less than 0.6, and the average relative error (AARE) of the model was reduced to 8.4%. Yuan et al. [24] found that dynamic precipitation of Al3(Er, Zr) at 400–450 °C, 0.001–0.01 s−1 and the true strain of 0.6 for Al–0.04Er-0.08Zr alloy reduced the accuracy of the constitutive model during hot deformation. Reddy et al. [27] established the hot processing maps at a strain of less than 0.5 for Al–4.1Li aluminum alloy and found that the optimized deformation parameters were affected more obviously by the crack due to a larger strain hardening than dynamic recrystallization (DRX) and dynamic recovery (DRV). Ganesan et al. [29] believed that shear band formation for flow stress at high strain rates greatly affected the hot processing maps for 6061/SiC Al alloy with the true stain of 0.3 and 0.5, but the relationship between the maps and strain (larger than 0.6) wasn’t discussed. Mohamadizadeh et al. [30] noted that the efficiency domains may shrink, expand or appear by increasing strain via establishing the 3D hot processing maps of duplex low-density steel to characterized the effect of strain on the maps, but the maximum true strain was only 0.6 (nearly 45.2% reduction) and failed to obtained the curved surface maps. Moreover, the deformation mechanism of dynamic softening may change with the increase of strain, so that DRX takes place after DRV in alloys [31,32]. The large hot deformation increases density of dislocation, induces grain boundaries to slid and accelerates the nucleation and growth of dynamic recrystallization [33,34]. However further exploration on the influence of large one-pass strain (especially strain larger than 0.69) on the deformation mechanism and processing map of Al–Mg alloy is still lacking.
With the improved plasticity, the metal needs to be deformed under a large amount of deformation in order to gain larger strength, higher production efficiency and lower cost. Therefore, it is worthy to study the behaviors of hot deformation and establish the processing map under a large amount of one-pass deformation in order to discuss the influence of strain on the deformation mechanism and processing map under a large amount of one-pass deformation in order to provide the theoretical support for the hot processing such as hot extrusion, hot forging, and hot rolling. In this research, the hot compression deformation behaviors of mass-produced Al–4.30Mg aluminum alloy under a large reduction of 50–75% were characterized at temperatures ranging from 350–500 °C and strain rates ranging from 0.01–1.0 s−1. 3D processing maps were obtained by the superimposition of the instability map and the power dissipation map at the true strain of 0.69, 0.92, 1.20 and 1.38. The stress-strain curve, the apparent activation energy (Q) and microstructural evolution of Al–4.30Mg alloy during the hot compression were analyzed to correlate with the processing maps.

2. Materials and Methods

2.1. Materials

Hot rolled Al–4.30Mg alloy of 25 mm plate was received from an aluminum company. The chemical composition was listed in Table 1. The cylindrical specimens with 10 mm in diameter and 15 mm in height were machined with the cylinder axis parallel to the rolling direction. These samples were annealed at 450 °C for 12 h followed by hot compression.

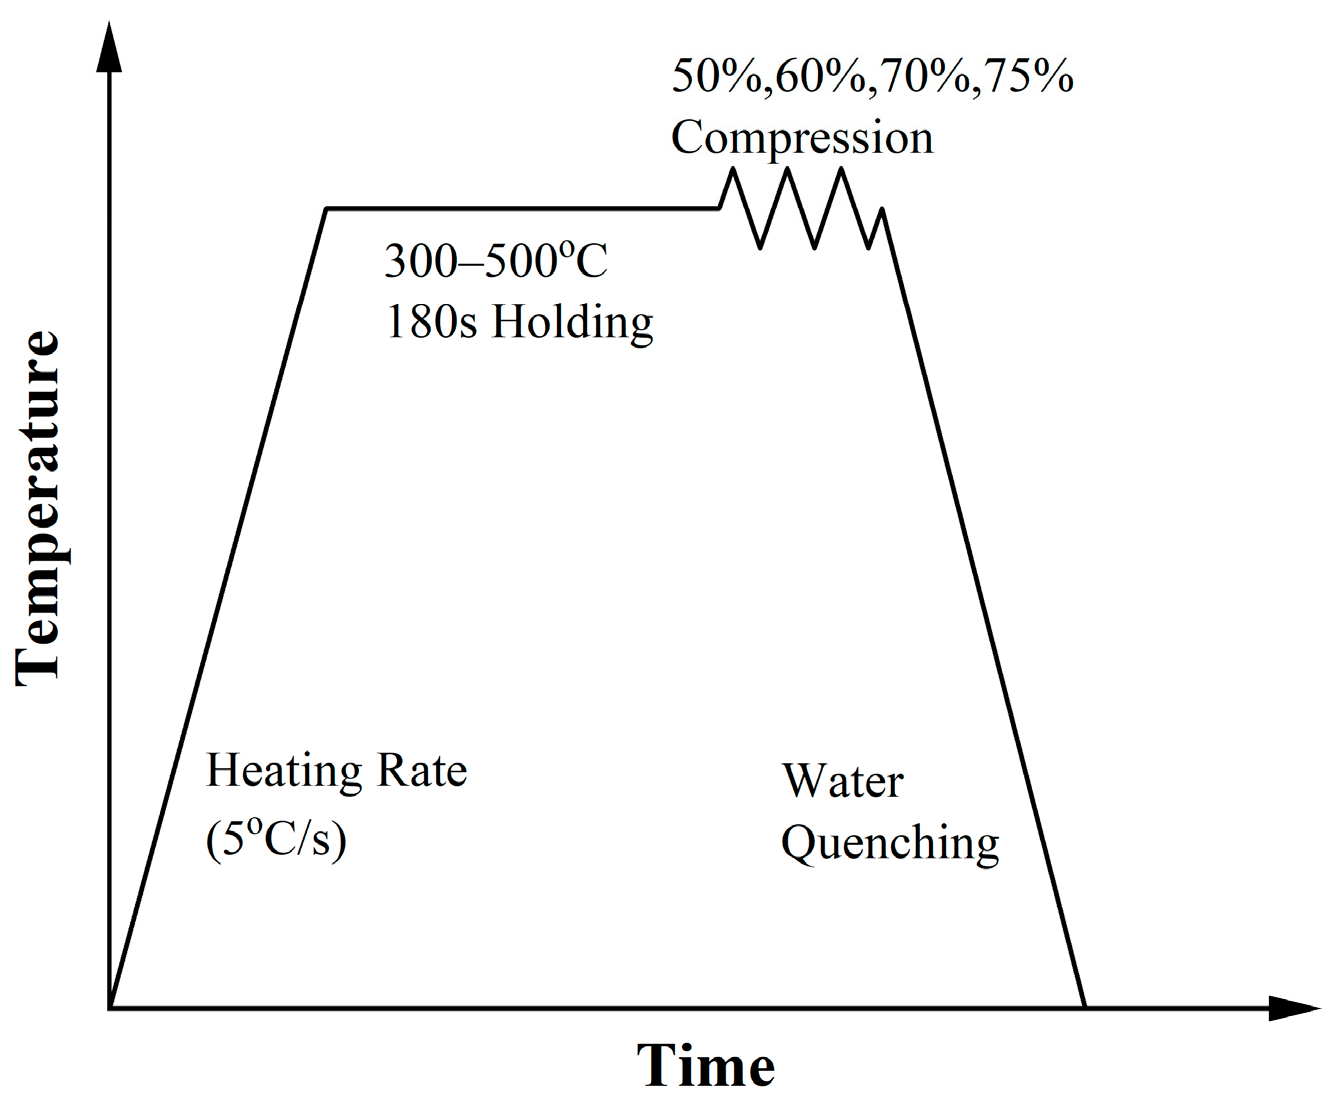
2.2. Hot Compression

The hot compression was carried out using a Gleeble-3500 thermo-mechanical simulator (Poestenkill, NY, USA). The thermocouple was spot-welded to the center of each cylindrical specimen. After polishing the top and bottom surfaces of each cylinder using #600 sandpaper, the lubricant and graphite flakes were placed at both the top and bottom in order to reduce the friction. The lubricant is made of 75% graphite, 20% oil and 5% tricresyl-nitrate. As shown in Figure 1, the cylindrical samples were heated at a rate of 5 °C/s under rough vacuum to 350, 400, 450 and 500 °C. After holding at the selected temperature for 3 min, the samples were deformed along the cylinder axis at a strain rate of 0.01, 0.1 and 1.0 s−1 by a reduction of 50%, 60%, 70% and 75%. Finally, the samples were water quenched to room temperature.

2.3. Microstructure Characterization

The samples for JEM-2010 transmission electron microscope (TEM, Tokyo, Japan) characterization were cut perpendicular to the cylinder axis at the central cross-section, polished and finally thinned using an MTP-A twin-jet electro-polishing device with 10% perchloric acid in ethanol.

2.4. Activation Energy Determined by Constitutive Equation

The stress-strain curves obtained by hot compression at different strain rates and temperatures were used to calculate the material constants of the constitutive equation. The Arrhenius constitutive equation is widely used to describe the relationship between flow stress, temperature and strain rate. The effects of deformation temperature and strain rate on the hot deformation behaviors can be expressed by Equations (1)–(3) [33].
ε ˙ = A 1 σ n exp ( Q / R T ) , α σ < 0.8
ε ˙ = A 2 e x p ( β σ ) exp ( Q / R T ) , α σ > 0.8
ε ˙ = A [ sinh ( α σ ) ] m exp ( Q / R T ) ,   f o r   a l l   σ
where Q is the apparent activation energy for hot deformation (kJ/mol), R is the gas constant (8.314 J mol−1∙K−1), ε ˙ is strain rate (s−1),σ is stress (MPa), T is deformation temperature, α, A, A1, and A2 are material constants, and m, β and n are parameters related to the strain rate sensitivity. Besides, α = β/n.
According to Equation (3), Equation (4) is obtained [34].
Z = A [ sinh ( α σ ) ] m = ε ˙ exp ( Q / R T ) ,
where Z is a constant compensated strain rate.
On the basis of the natural logarithm of both sides of Equations (1)–(4), a series of parallel and straight lines at specific hot deformation conditions can be obtained. The values of n, m and β can be obtained from the slope of fitting linear relationships between ln ε ˙ versus lnσ, between ln ε ˙ versus σ, and between ln ε ˙ versus ln[sinh(ασ)], respectively. From the natural logarithm of Equation (3), the following equation can be gained:
Q = R { ln [ sinh ( α σ ) ] ( 1 / T ) } ε ˙ { ln ε ˙ ln [ sinh ( α σ ) ] } T = R n S .
According to Equation (5), the Q can be calculated. The value of S can be obtained from the plot of ln[sinh(ασ)] versus 10−3 T−1 under different strain rates. The value of Z can be calculated according to Equation (4) after determining the value of Q. According to the natural logarithm of Equation (4), the value of lnA can be obtained from the y-intercept of the linear-relation between lnZ and ln[sinh(ασ)].

2.5. Development of Processing Maps Using Dynamic Material Modeling

The dynamic materials model (DMM) is a method to be used for establishing the hot processing map [35,36,37]. In the DMM theory, the external energy input from hot deformation is usually thought to be consumed as the energy used for hot deformation and micro-structure variation. The total dissipated power P, as expressed in Equation (6), can be composed of parameters G and J. The constant G is the energy required for plastic deformation, which is dissipated as deformation heat; while the constant J is the energy for the material to undergo phase transitions.
P = σ · ε ˙ = G + J = 0 ε ˙ σ d ε ˙ + 0 σ ε ˙ d σ .
The constant G and J can be expressed by the equation of flow stress σ and strain rate ε ˙ . The relationship between the flow stress and strain rate can be expressed by the following equation:
σ = K ε ˙ m ,  
where K is a material parameter, ε ˙ is the strain rate, and m is the strain rate sensitivity. Equation (7) can be expressed by the following equation:
m = J G = ( ln σ ) ( ln ε ˙ ) .
When m is equal to one as an ideal linear dissipation process, the value of J achieves its maximum.
J m a x = 1 2 σ · ε ˙ .
The ratio of the actual energy consumed with microstructure variation (J) and its ideal energy (Jmax) in hot deformation is defined as a constant η by Prasad et al. [35].
η = J / J m a x = 2 m m + 1 .
Then the power dissipation map can be plotted based on the contour line of η on the ln ε ˙ -T coordinate system. Generally, the property of hot processing is indirect proportion to the value of η. However, the high efficiency may lead to deformation instability such as cavitations and crack initiation. Therefore, it is necessary to mark the unstable areas in the hot processing map by instability criterion (ξ) proposed by Prasad et al. [36].
ξ ( ε ˙ ) = ln [ m / ( m + 1 ) ] ln ε ˙ < 0 .
When the value of ξ is less than 0, this area is thought to be unstable. As a result, the hot processing map at a certain strain is obtained by the superimposition of the corresponding power dissipation map and the instability map.

3. Results

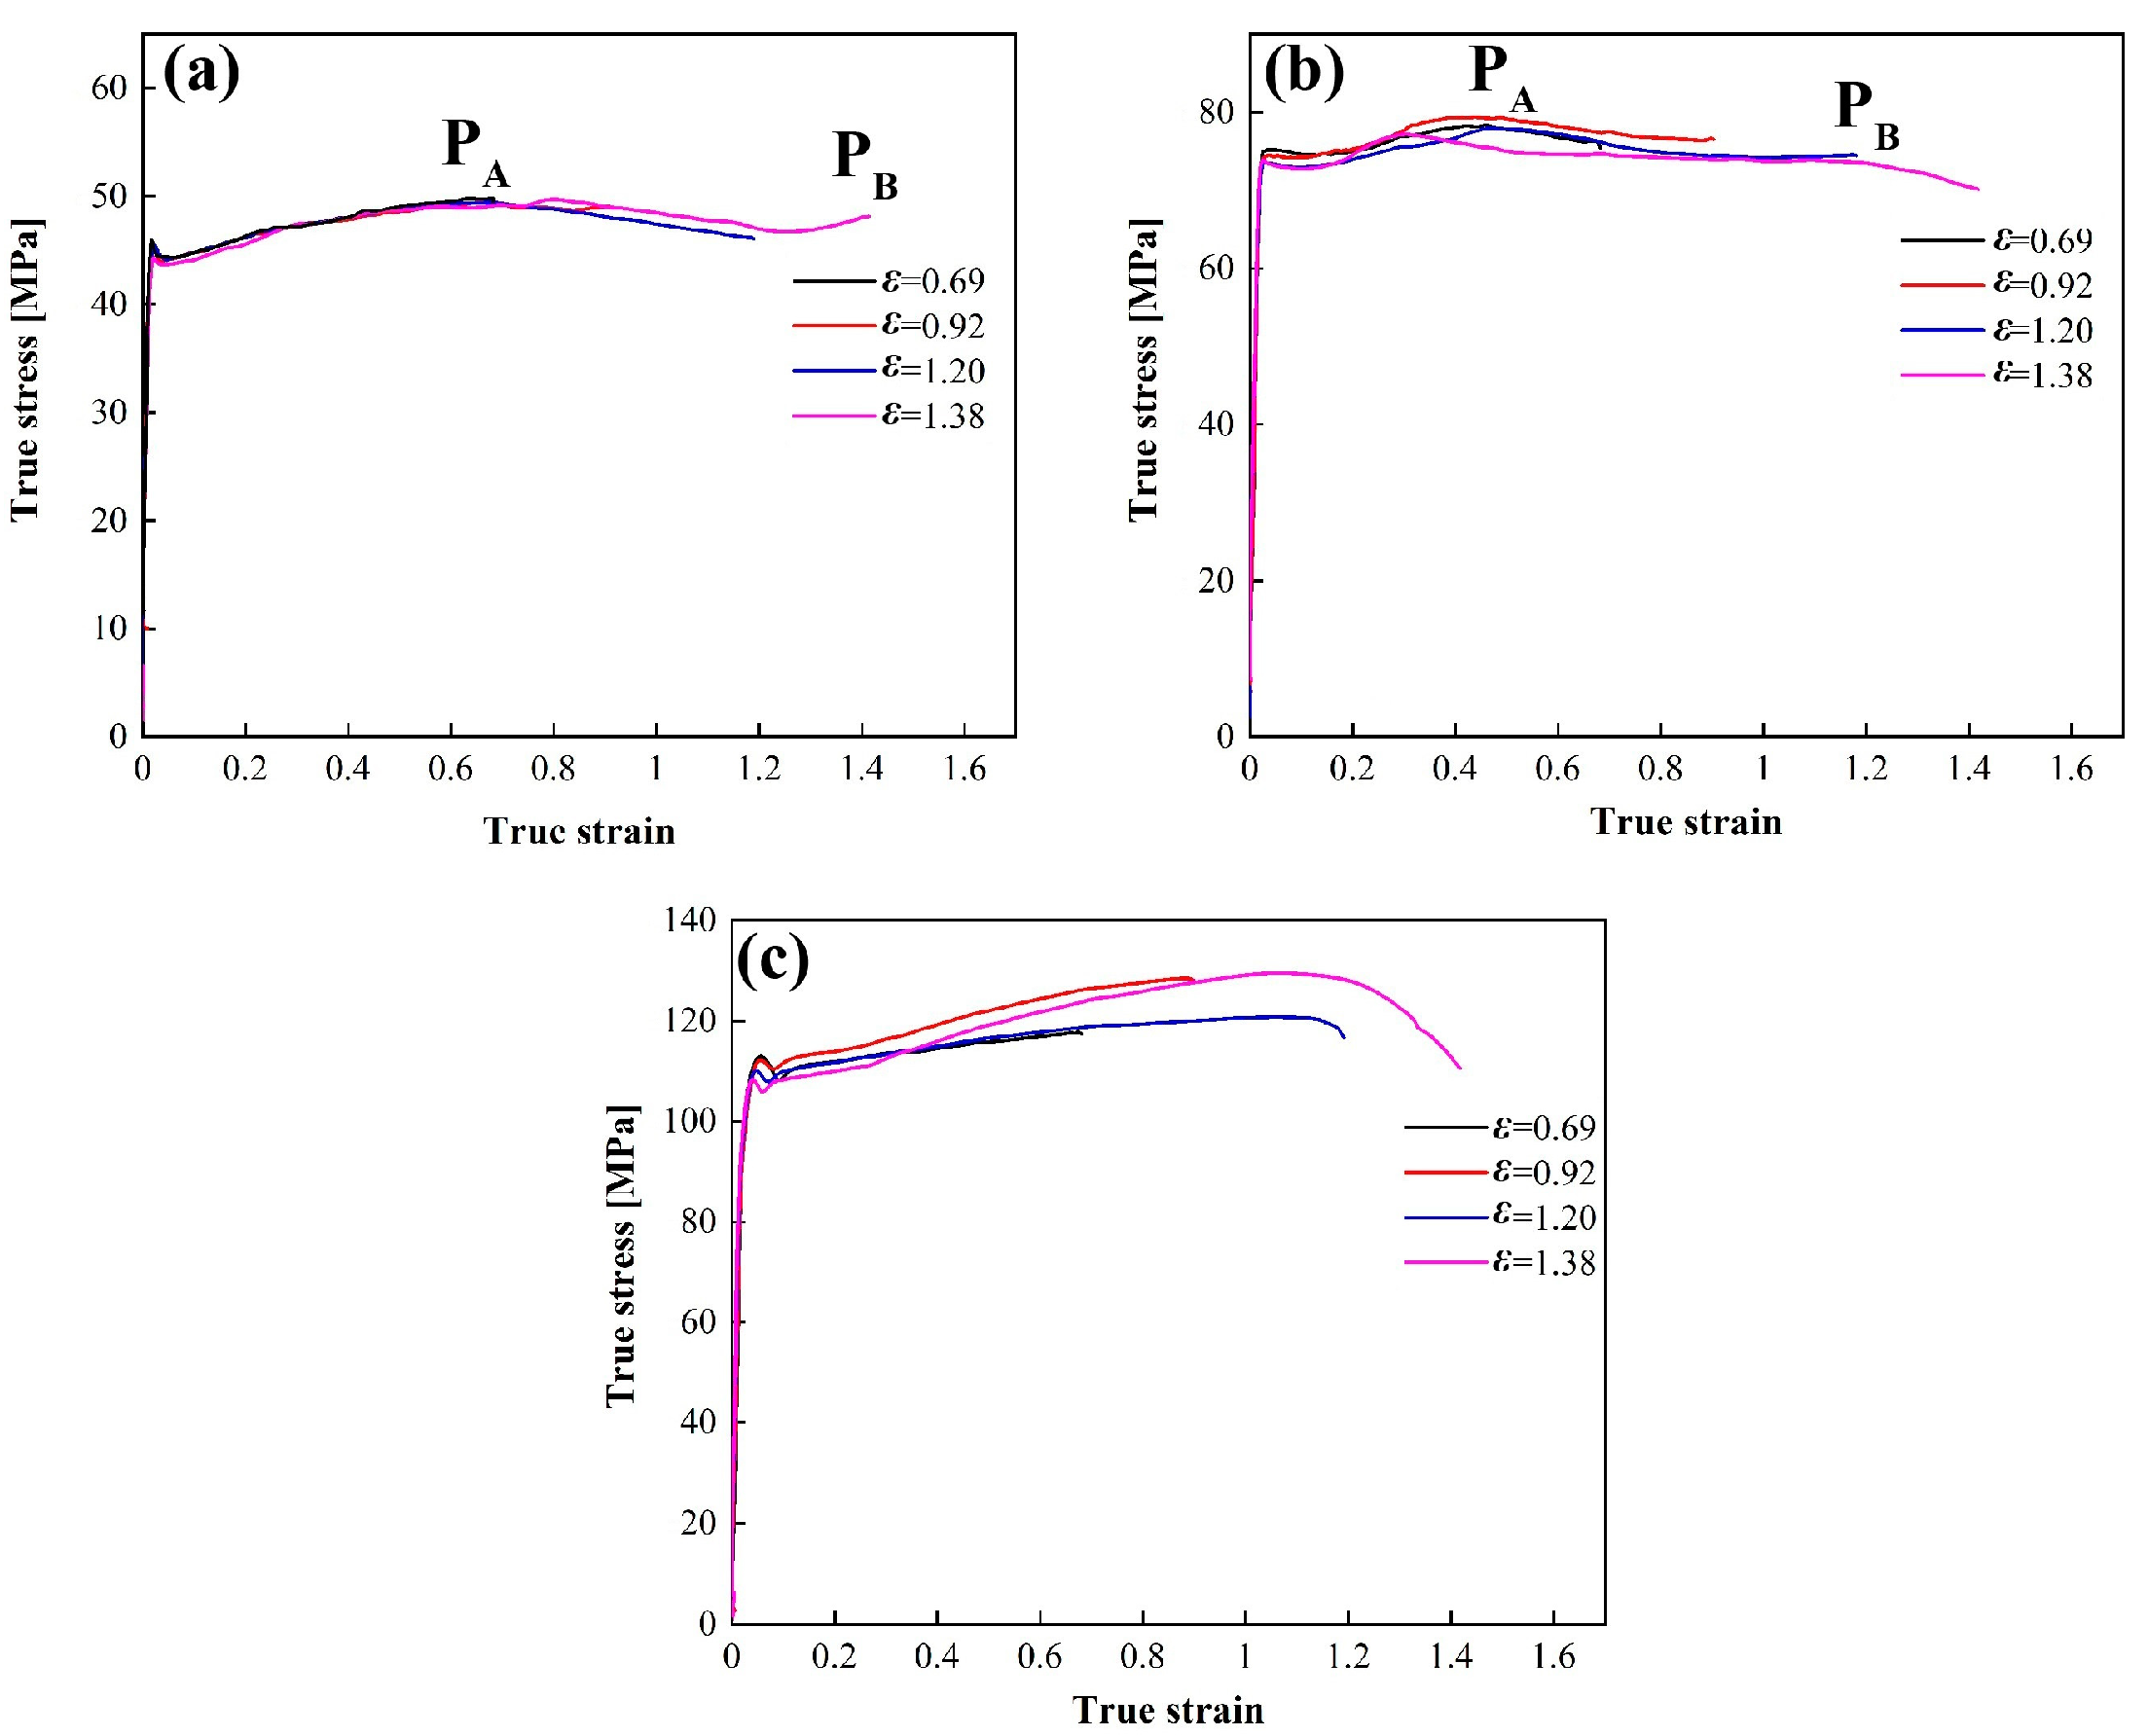
3.1. True Stress–Strain Curves

The true stress-strain curves of the Al–4.30 Mg alloy at 400 °C, the true strain of 0.69–1.38 and different strain rates are showed in Figure 2. As can be seen, the greater the strain rate, the higher flow stress. The flow stress increases gradually to peak stress, and then decreases slightly. With increasing strain, a distinct dynamic softening occurs just after yield point at strain rates of 0.01 s−1 and 0.1 s−1 (Figure 2a,b, which indicates the occurrence of obvious dynamic recrystallization (DRX) [38]. However, with increasing strain, the flow stress increases steadily, which indicates that work hardening is more obvious than DRX. As shown in Figure 2a,b, the multiple peaks (PA and PB) are observed in the curves with increasing strain, which indicates the periodic competition between dynamic softening and work hardening. It is probably because the early recrystallized grains also experience large deformation and provide deformation resistance at a low strain rate. This phenomenon has been described as Discontinuous Dynamic recrystallization (DDRX) [39,40,41]. Noticeably adiabatic heating-up caused by deformation at a high strain rate of 1.0 s−1 and a large strain of 1.20–1.38 contributed to the softening according to the stress-strain curves in Figure 2c.

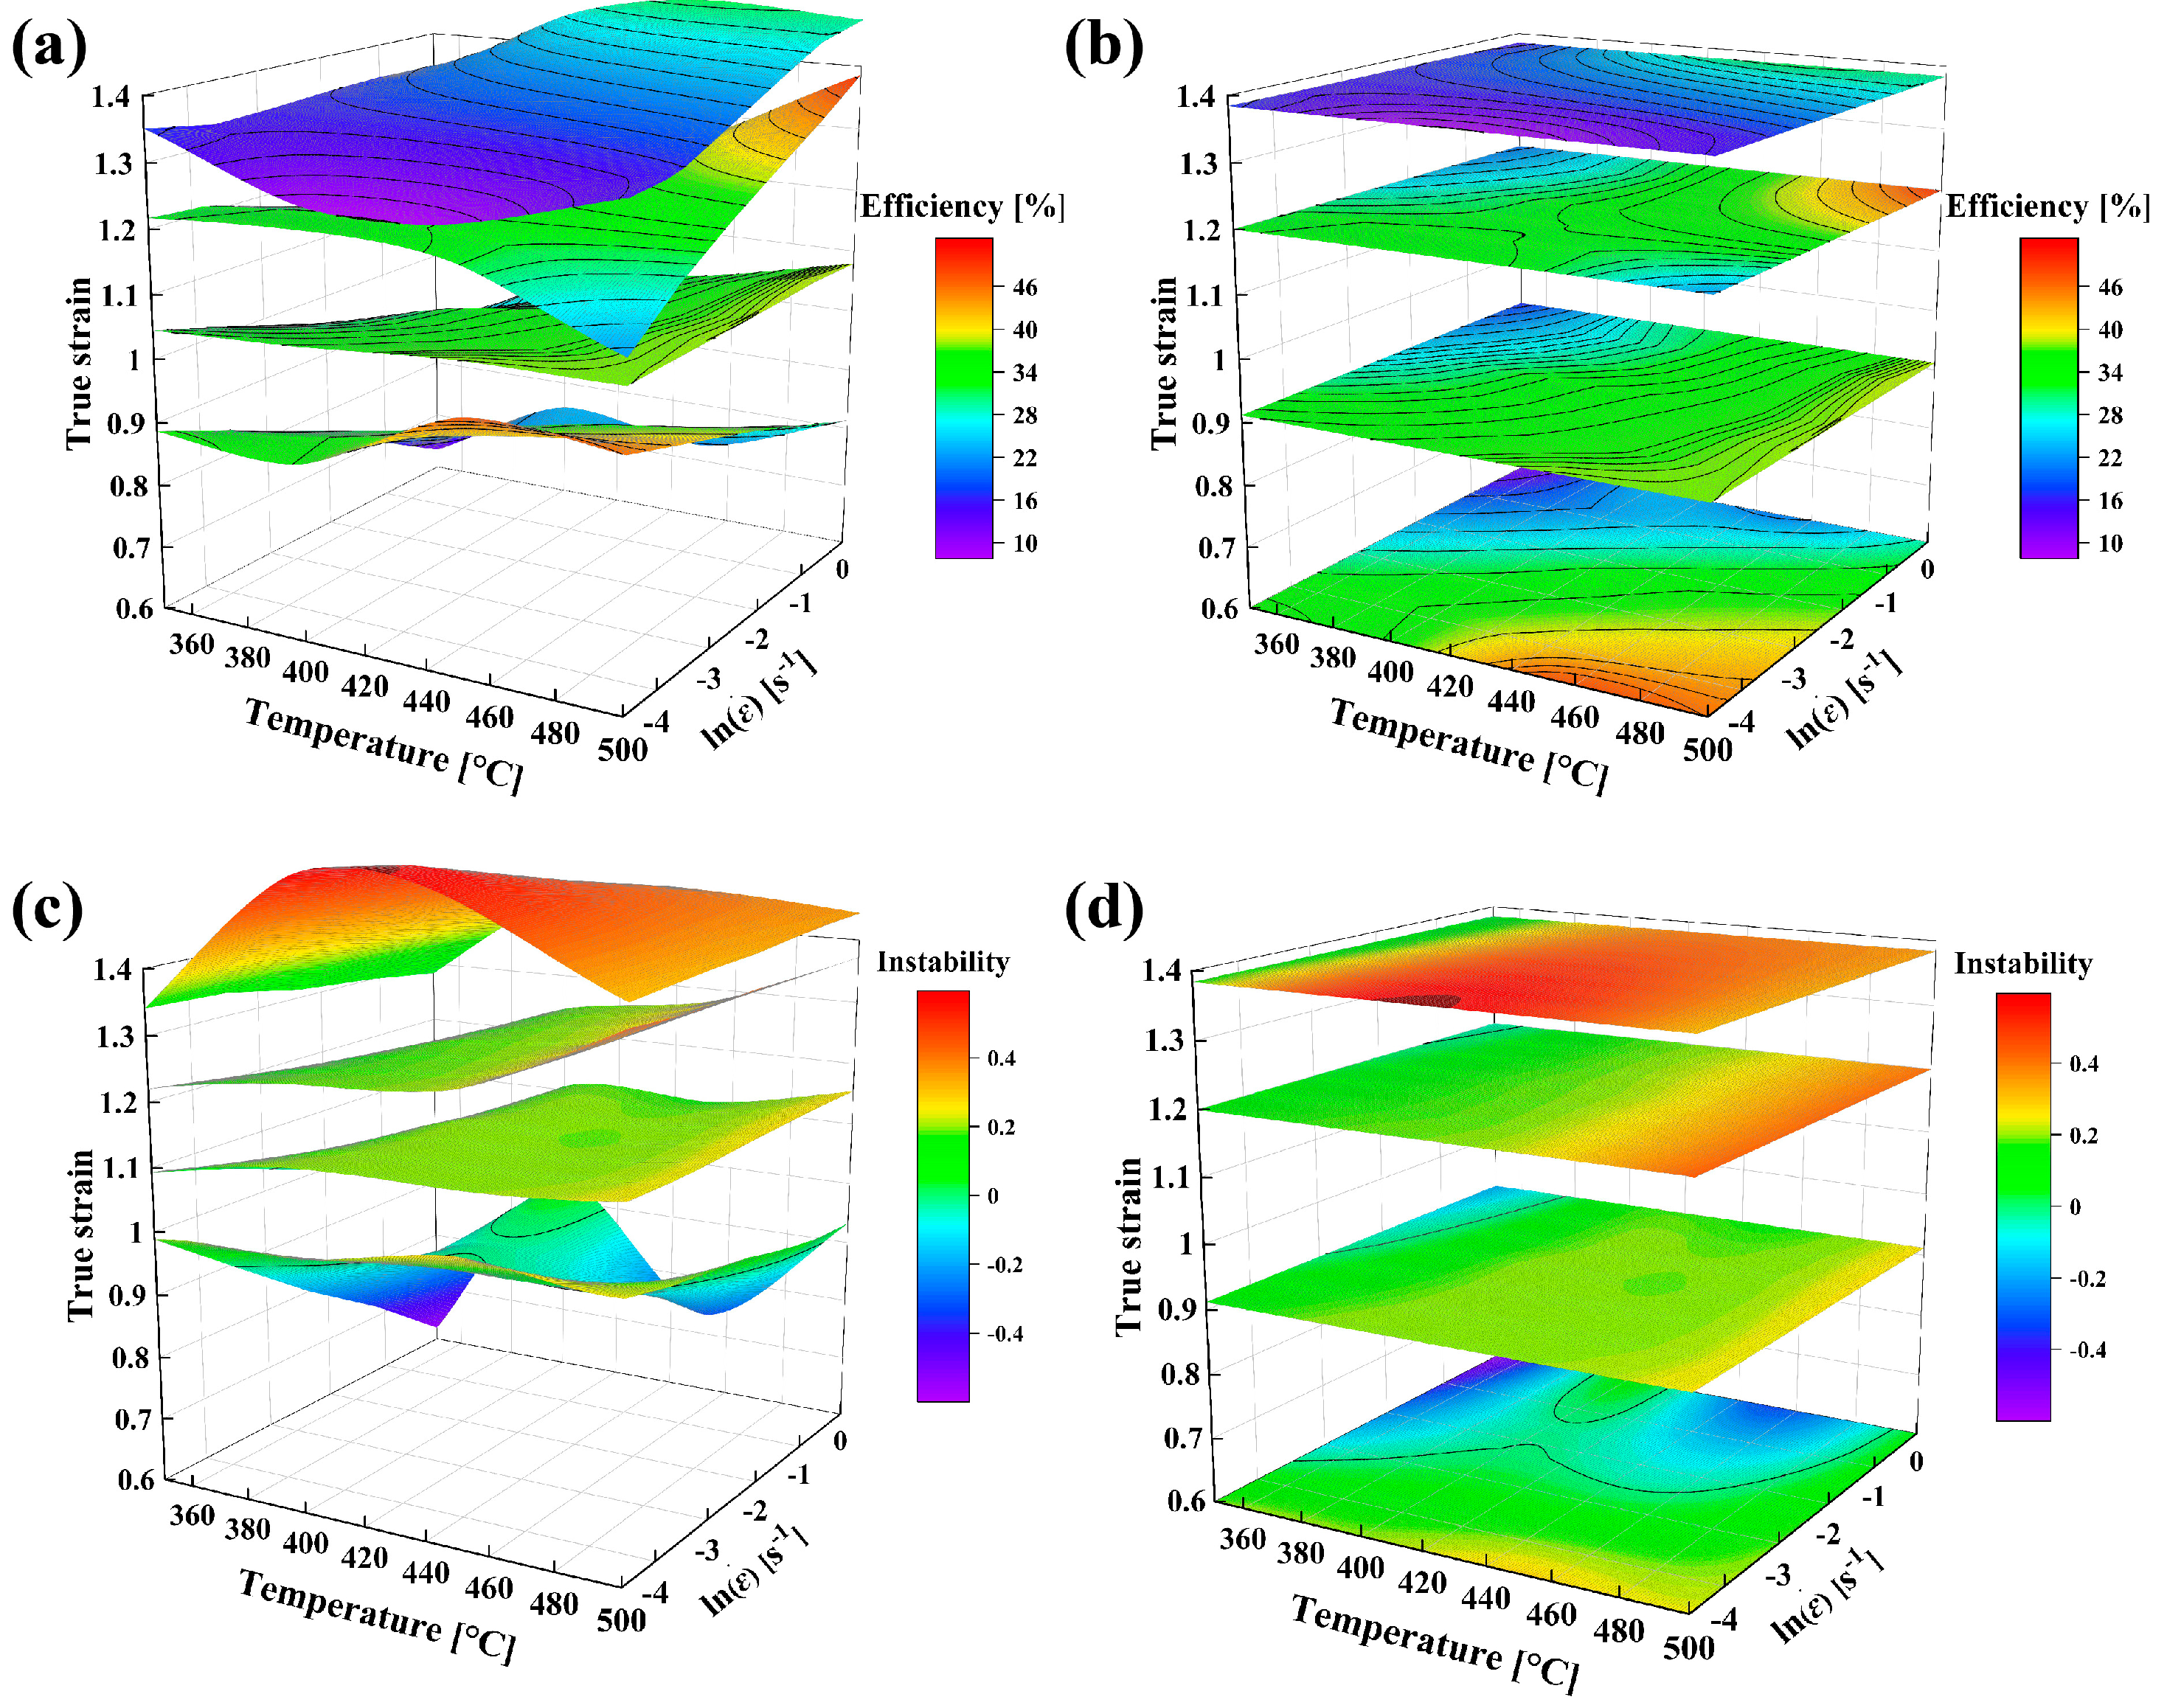
3.2. Development of 3D Hot Processing Map

The 2D processing maps are usually used for describing deformation behaviors, without considering the effect of strain on the efficiency of power dissipation and stability. When considering the effect of strain, the 3D hot processing maps when true strain changes from 0.69 to 1.38 have been constructed in Figure 3. It clearly shows that the power dissipation not only changes with deformation temperature and strain rate but also changes with stain.
The alloy as a function of true strain from 0.69 to 1.38 (The left ones are 3D curved surface maps, while the right ones are the corresponding projection in T ln ε ˙ plane). As shown in Figure 3a,b, the 3D power dissipation map at a true strain of 0.69–1.38 and its projection in T ln ε ˙ plane is established. In addition to temperature and strain rate, the strain also plays a significant role in the change of the power efficiency. At the strain of 0.69, the maximum power efficiency (η) is calculated to be about 48%, which is located at 450 °C/0.01 s−1, namely the red color region in Figure 3a,b. When the strain is 0.92, the maximum η is reduced to 38% (blue color). When the strain increases to 1.20, the efficiency peak value increased to 48% again, which occurs at 500 °C/1.0 s−1, namely the red color region in Figure 3a,b. When the strain rises to 1.38, the maximum η is only about 30% (blue color).
Figure 3c,d shows the 3D instability map and its projection in T ln ε ˙ plane. According to the instability maps, the curved surface becomes smoother with an increase in strain, indicating that the stability of hot working is enhanced. The instability regions, namely blue color regions in Figure 3c,d, also are reduced with increasing the strain. At a strain of 0.69, there is a large instability zone, surrounding the centers of 350 °C/1.0 s−1 and 450 °C/1.0 s−1. However, the instability zone is reduced greatly with the strain increasing up to 0.92 and 1.20, which only has a small area surrounding 350 °C/1.0 s−1. When the strain is 1.38, the instability region is completely disappeared.
Figure 4a–d show 2D hot processing maps, which are from the strain sections of 3D processing maps (Figure 3a,b) and the instability maps (Figure 3c,d) at the true strains of 0.69, 0.92, 1.20 and 1.38, respectively. Clearly, the efficiency of power dissipation (η) varies with the amount of strain.
As shown in Figure 4a, the efficiency domain is characterized at 440–480 °C/0.01–0.04 s−1 (Domain I A, Figure 4a) with the maximum η of 48%. There are two instability regions at 350–390 °C/0.1–1.0 s−1 (Domain II A, Figure 4a) and 410–490 °C/0.1–1.0 s−1 (Domain II B, Figure 4a), which are also the low-efficiency regions with the minimum η of 15%.
At the true stain of 0.92 (Figure 4b), the efficiency region (Domain I A, Figure 4b) still exists, but the maximum of power efficiency (η) decreases to 37%; whereas, the efficiency Domain I B (480–500 °C/0.1–1.0 s−1) starts to appear, with a maximum η of 38%. At the true stain of 0.92 (Figure 4b) and 1.20 (Figure 4c), the instability regions have greatly been contracted to small regions compared with Figure 4a at a small strain of 0.69. At the true stain of 1.38, the power efficiency (η) of most areas in Figure 4d is small, with the minimum η only about 8.0%.
When the strain increases to 0.92 and 1.20, the high-efficiency regions Domain I A in Figure 4a develop into Domain I A and Domain I B (Figure 4b,c). Domains IA in Figure 4b,c are characterized by high temperature and low strain rate; while Domain I B in Figure 4b,c are characterized by high temperature and high strain rate. The maximum power efficiency of Domain I B in Figure 4c (470–500 °C/0.3–1.0 s−1) increases up to 48%. On the other hand, the low-efficiency region (Domain II C, Figure 4c) is characterized at 480–500 °C/0.01–0.04 s−1 with a minimum η of 25%. At the true stain of 1.38 (Figure 4d), the whole hot processing map is divided into two regions, high-efficiency domain I B and low-efficiency domain II C, whose η are the maximum of 30% and the minimum of 8.0%, respectively.

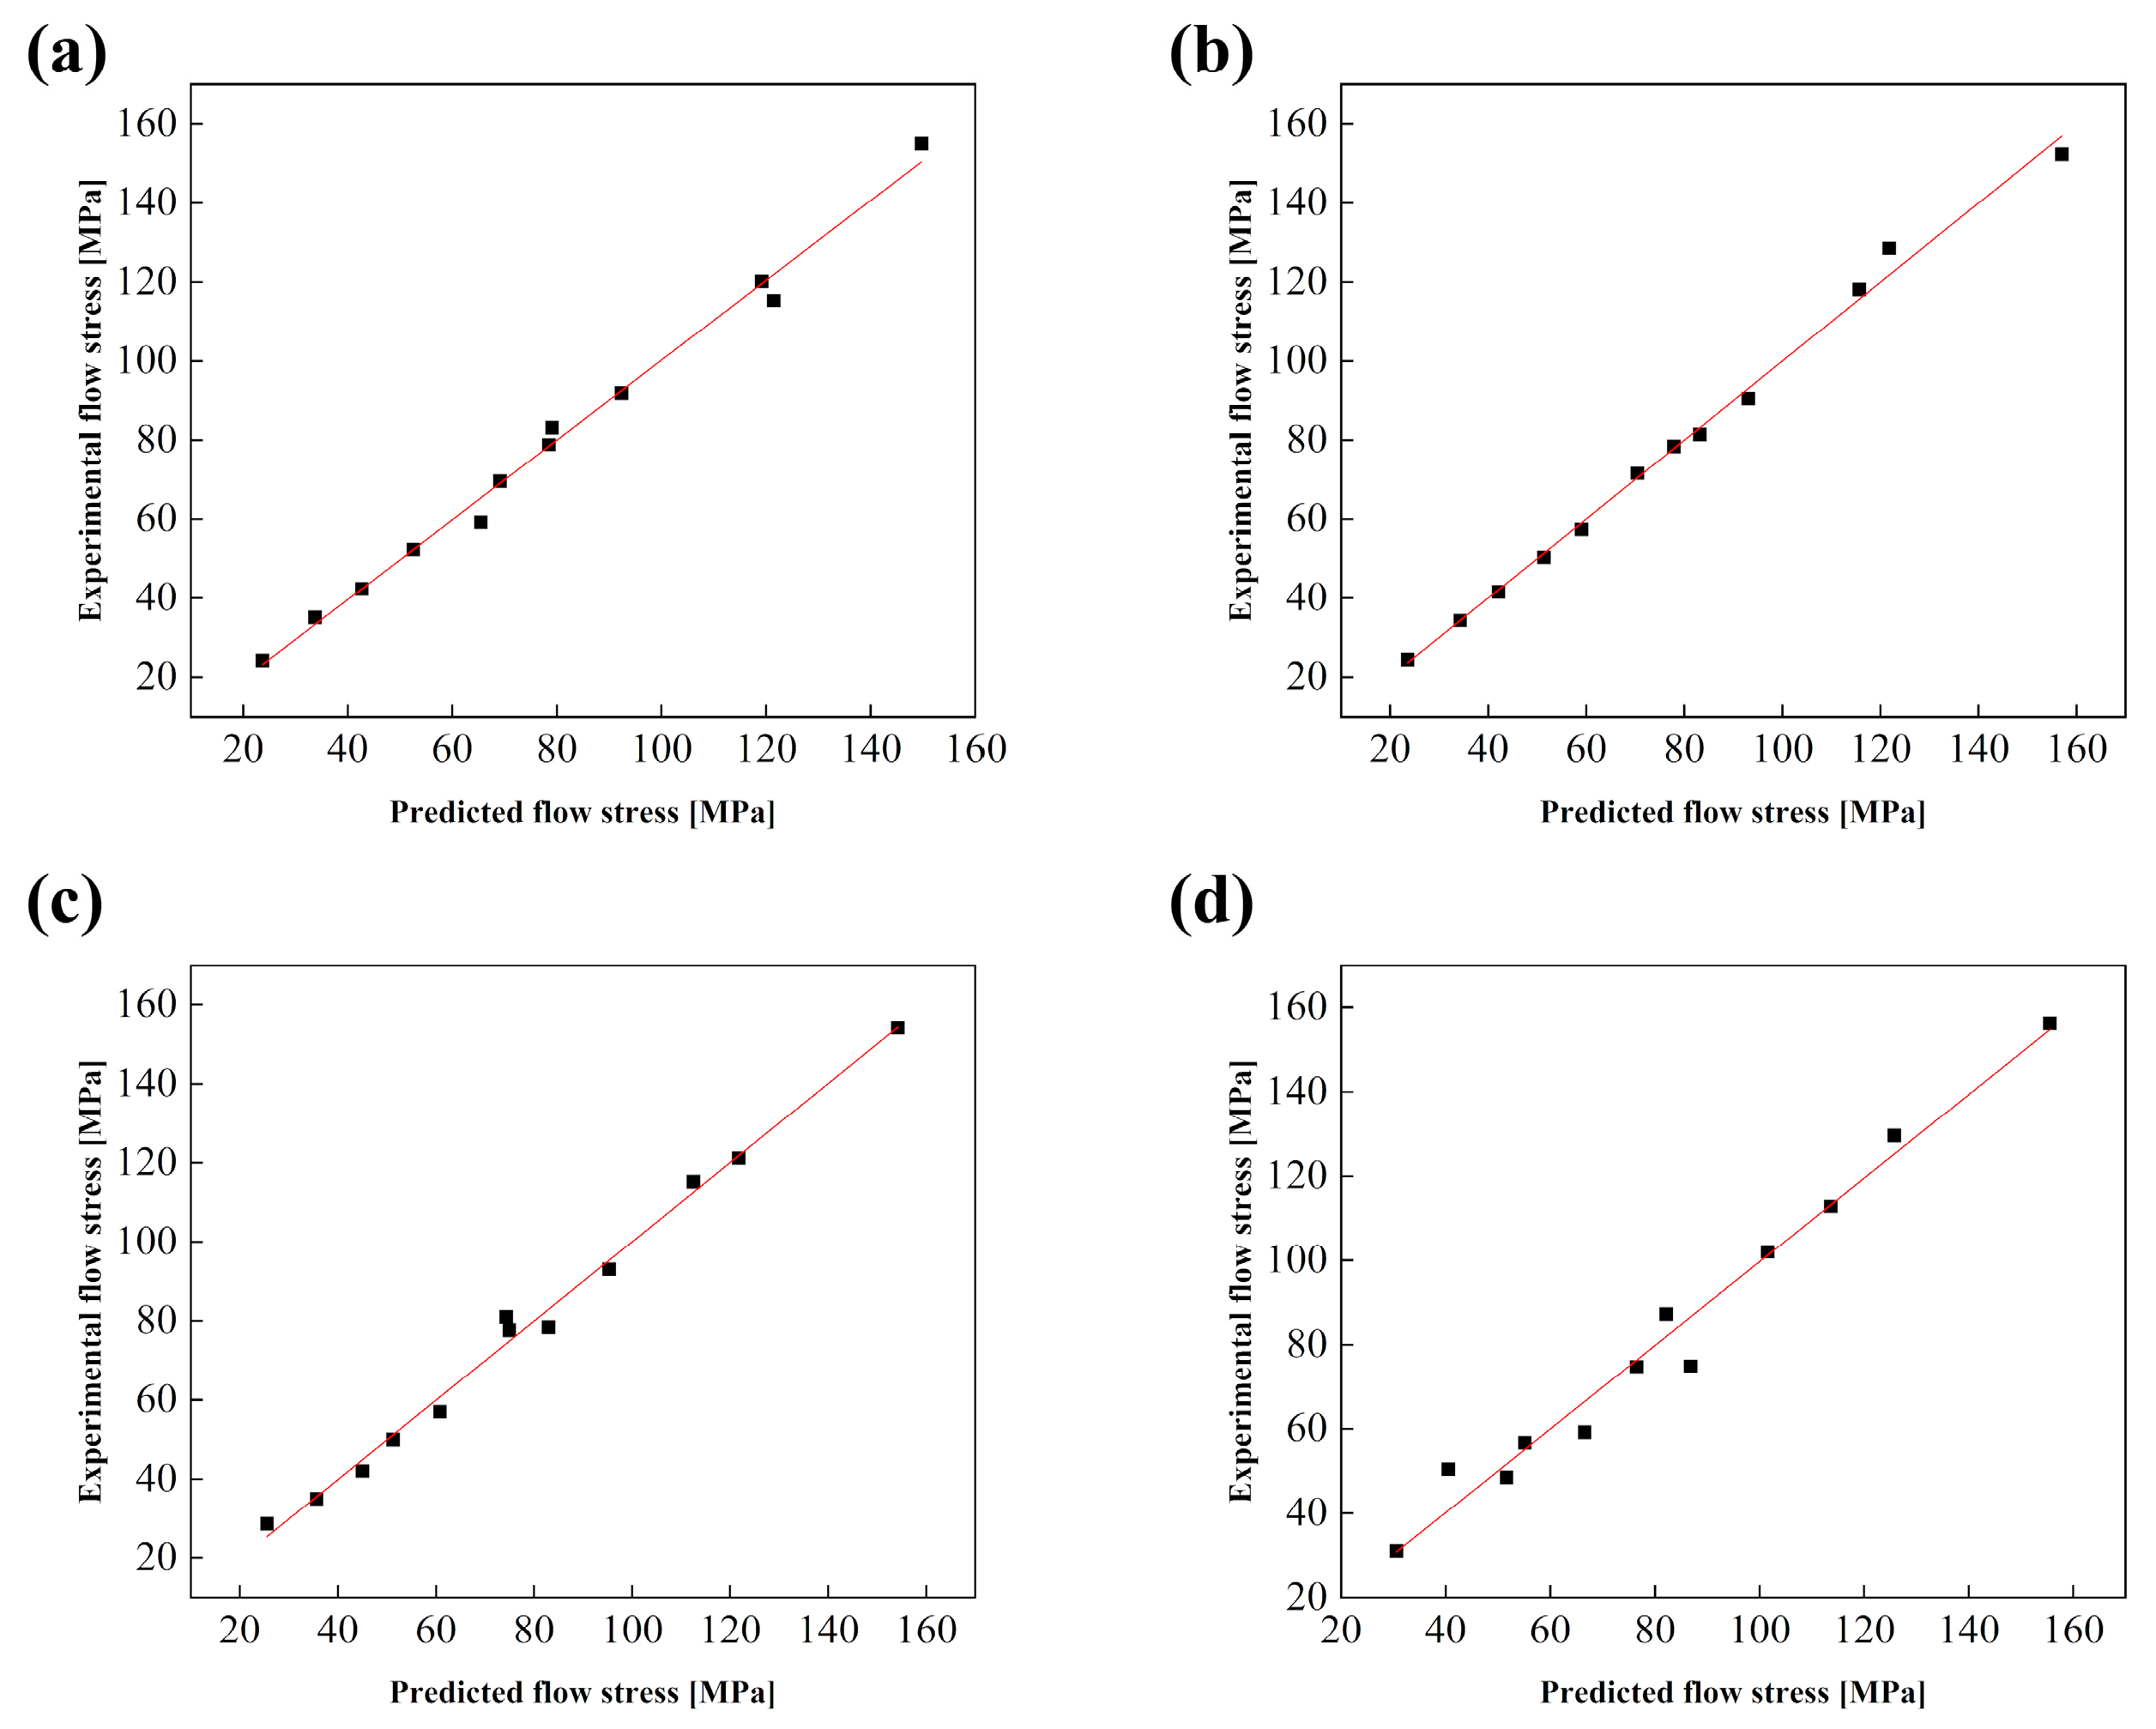
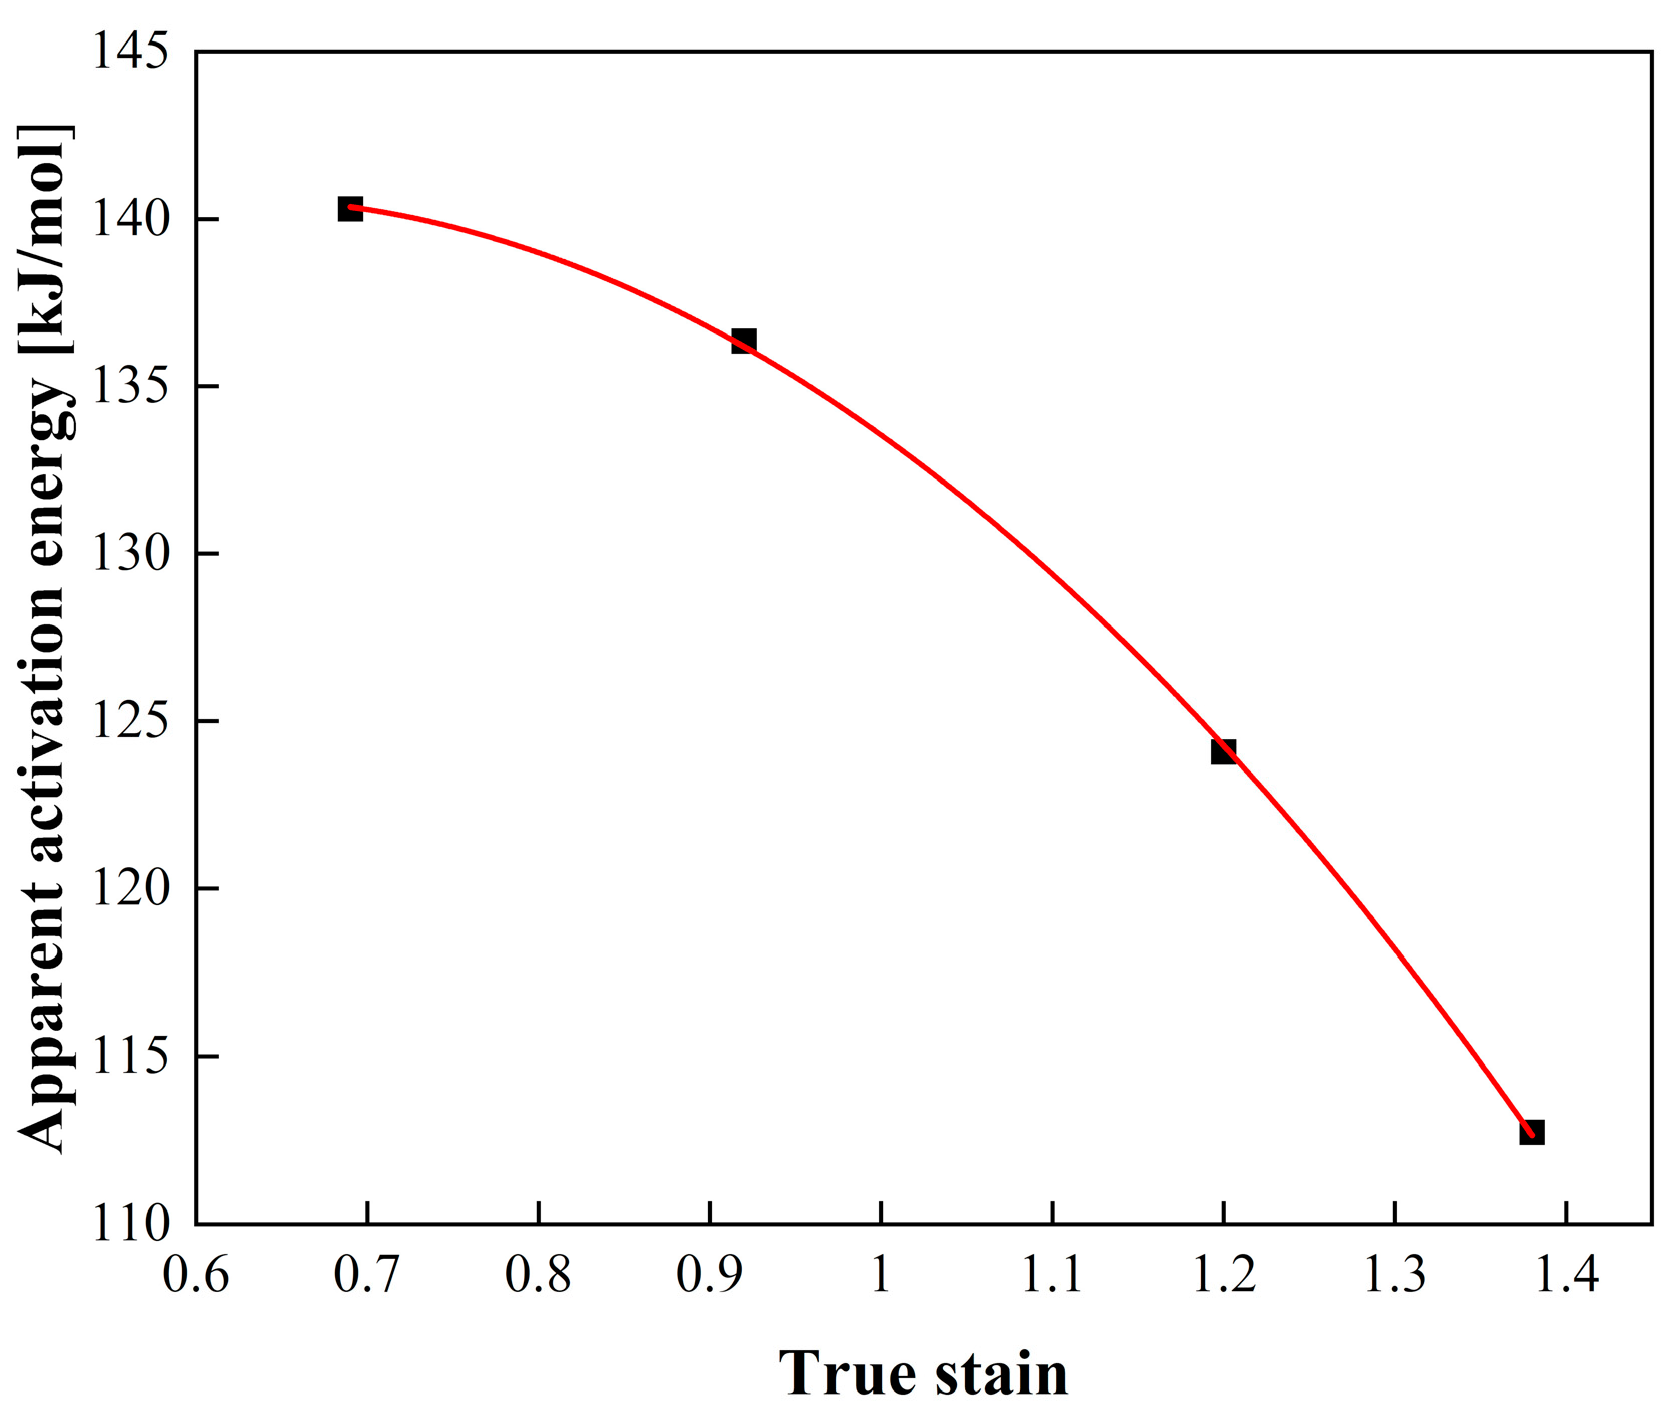
3.3. Verification of Hot Processing Maps via Apparent Activation Energy

According to the analysis of the true stress-strain curves under different strain rates and deformation temperatures, the values of α, n, Q and A of the Arrhenius constitutive model in different amounts of deformation strain are shown in Table 2. The true strain is often expressed as ε = ln ( 1 + ϵ ) , where ϵ is the Engineering strain.
The AARE is used to measure the difference values between the predicted and experimental flow stress. The correlation coefficient (R*) is considered to be a linear relationship between the predicted and experimental flow stress. The accuracy of the constitutive equation can be reflected by the calculation of R* (Equation (12)) and AARE (Equation (13)).
R * = i = 1 N ( E i E ¯ ) ( P i P ¯ ) i = 1 N ( E i E ¯ ) 2 i = 1 N ( P i P ¯ ) 2
A A R E ( % ) = 1 N i = 1 N | E i P i E i | × 100 ,
where Ei is the experimental flow stress and Pi is the predicted flow stress obtained from the established model; E and?P are the average values of Ei and Pi; N is the number of data compared with predicted values.
As shown in Figure 5, the correlations of true strains of 0.69, 0.92 and 1.20 all have values larger than 0.996, indicating that the model is accurate for true strains (0.69–1.20). When the true strain reaches 1.38, the value of R* is larger than 0.988. The values of R*, AARE, and Q are listed in Table 3.
From Table 3 and Figure 6, the apparent activation energy Q decreases with increasing the strain from 0.69 to 1.38. When the strain is 0.69, the apparent activation energy of Al–4.30 Mg alloy is 140.33 kJ/mol; when the strain is 1.38, the activation energy is 112.744 kJ/mol. Therefore, increasing the strain reduces the deformation instability, the deformation energy barrier and the deformation difficulty.
When the true strain increases from 0.69 to 0.92, the activation energy only decreases about 4 kJ/mol; however, when the true strain increases from 0.92 to 1.2 and from 1.2 to 1.38, the activation energy changes significantly and decreases by about 12 kJ/mol. Therefore, the hot workability changing from 0.92 to 1.38 will be greatly different from that of strain less than 0.69. This is consistent with the hot processing maps (Figure 3 and Figure 4).

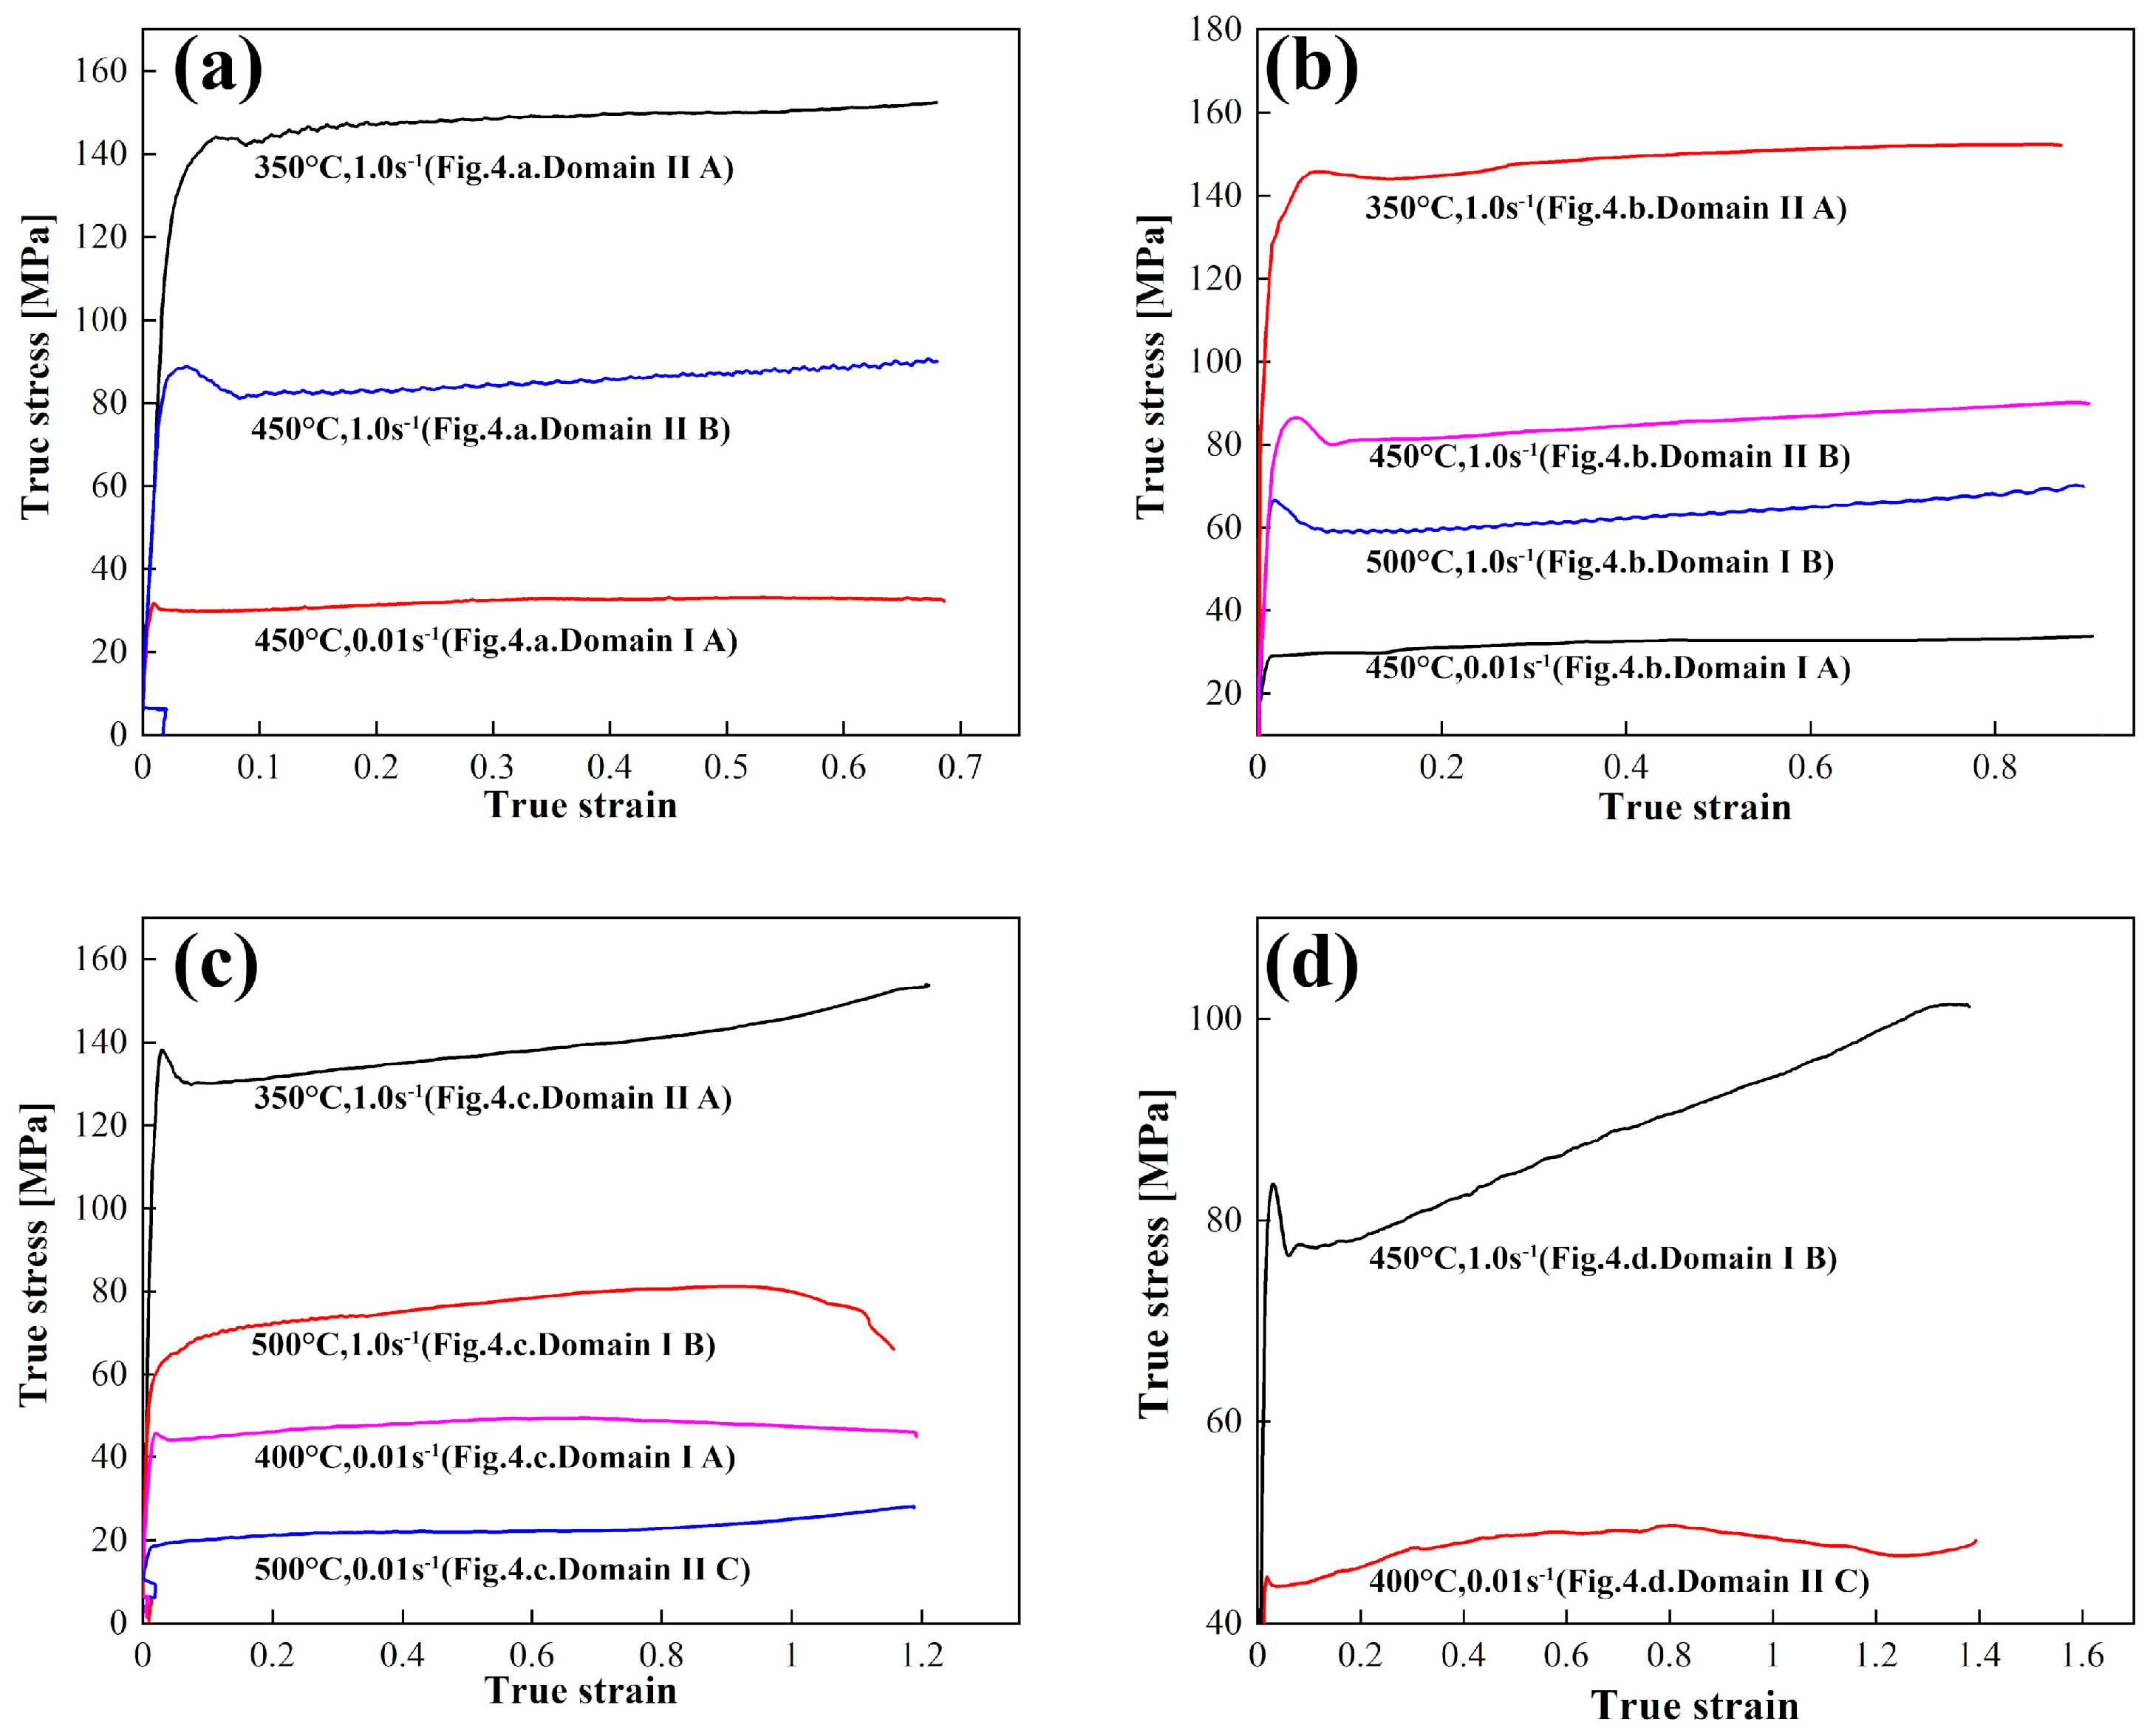
3.4. Verification of Hot Processing Maps via Stress-Strain Curves

In order to verify the reliability of the hot working diagram, it is necessary to analyze the true stress-strain curves (Figure 7) corresponding to the hot deformation parameters (as shown in Figure 4) in order to discuss the competition between softening and hardening.
As shown in Figure 7a ( ε = 0.69 ), the true strain-stress curves of domain II A(350 °C, 1.0 s−1, Figure 4a) and domain II B(450 °C, 1.0 s−1, Figure 4a) are in a strain hardening state after the stress reaches the yield limit. At the same time, the curve of domain I A (450 °C, 0.01 s−1, Figure 4a) is characterized by the softening after the true strain reaches 0.35. At the true stain of 0.92 (Figure 7b), both curves of domain II A and domain II B (Figure 4b) show distinct hardening, corresponding to a low power efficiency η of 20%. Whereas, the curves of efficiency region (Domain I A and Domain I B, Figure 4b) indicate obvious softening due to obvious dynamic recrystallization (DRX) and dynamic recovery (DRV), corresponding to a large η of 38%. In Figure 7c ( ε = 1.20 ), the stresses of Domain I B and Domain I A (Figure 4c) have a significant decline when the strain exceeds 0.92, which greatly benefits the deformation; while stresses of domain II C shows the transitional point of hardening when the strain increasing from 0.92 to 1.20. At a true stain of 1.38 (Figure 7d), the curve of domain I B indicates obvious hardening until the true strain reaches 1.38, which is consistent with Figure 4d having a low η of 8.0%.

4. Discussion

Figure 8 shows the microstructure of Al–4.30 Mg alloy deformed at 450 °C, 0.01 s−1. When the reduction is 60%, the fiber microstructure caused by high one-pass compression is obvious and the recrystallization grains appear along the streamlines. With increasing the reduction to 75%, streamlines become blurring and the recrystallization almost finishes.
The TEM characterization of the samples at Domain I A (ε = 0.69 and 0.92), domain I B (ε = 1.20 and 1.38), and domain II C (ε = 1.38) are shown in Figure 9.

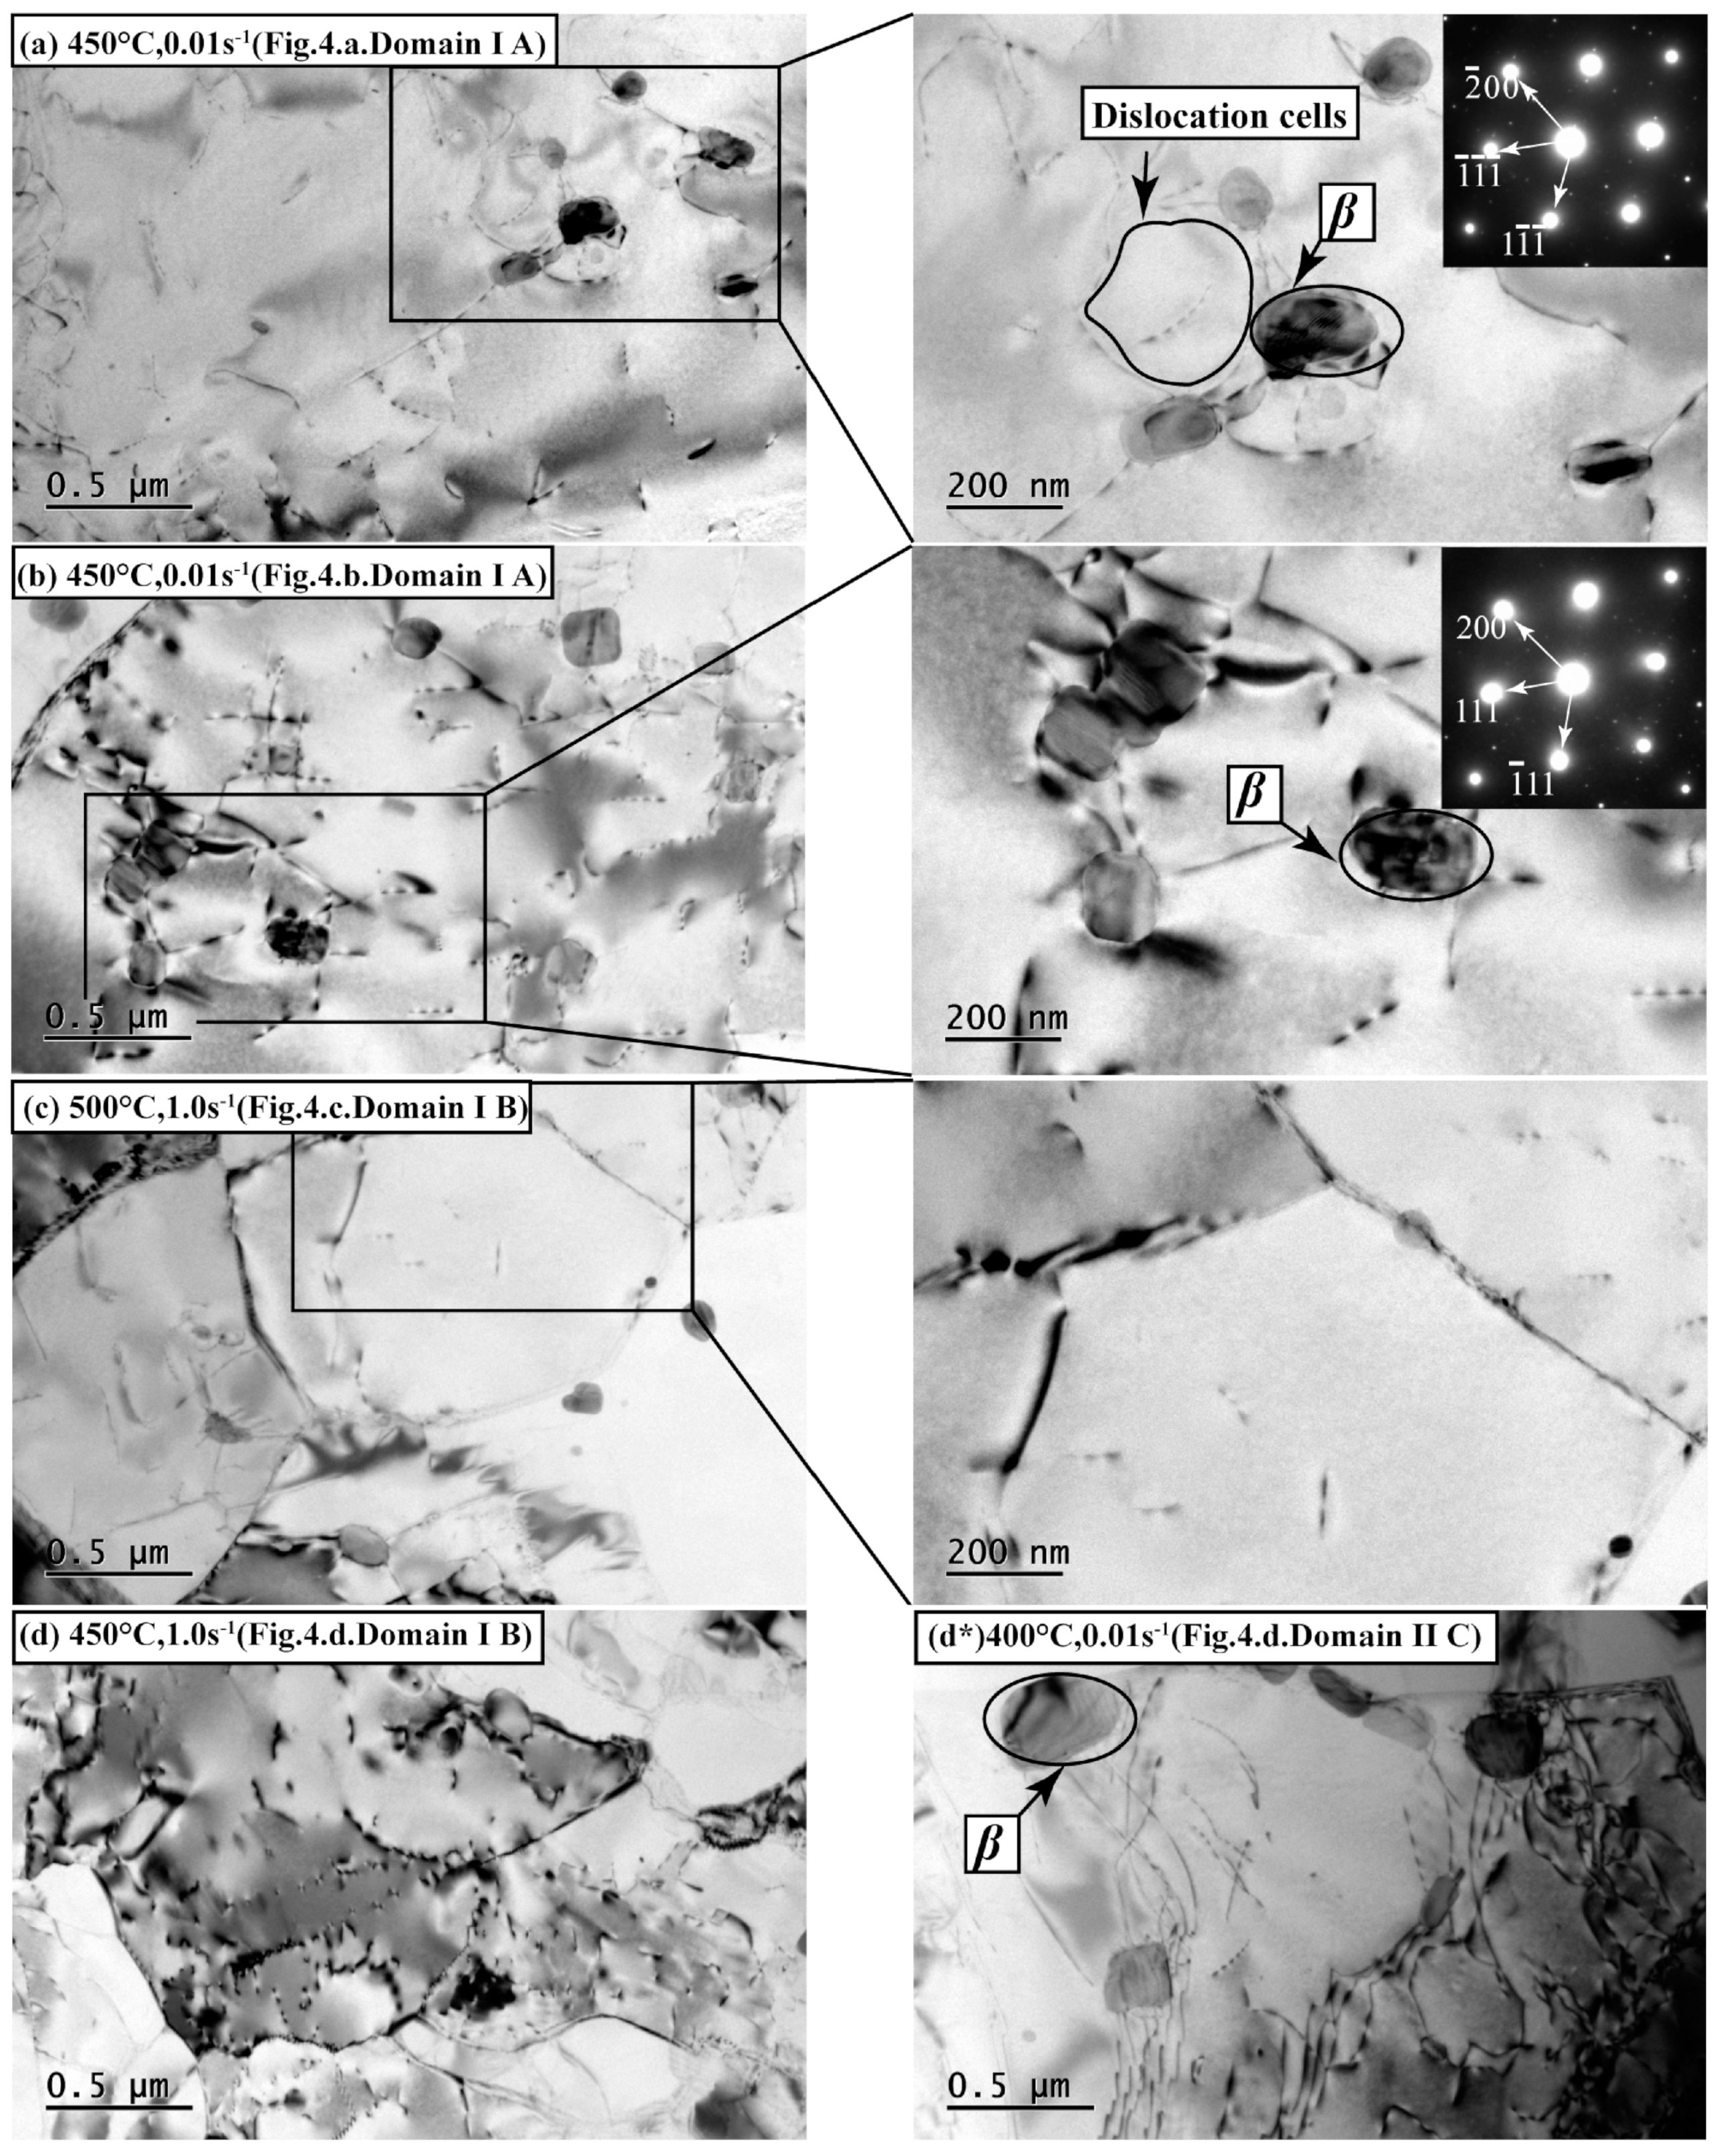
4.1. Efficiency Domain I A (about 450 °C, 0.01 s−1/0.69 Strain)

Few dislocations are observed in Figure 9a, which indicates that DRX has occurred. Some residual dislocations are pinned by the second phases. In addition, several dislocation cells and recrystallization grains are formed, as seen in the local amplification. This microstructure is consistent with the high power efficiency η of 48% and DRX type stress-strain curve (as seen in Figure 7a): The flow stress is stable after the peak, due to the balance between dislocation nucleation caused by work hardening and DRX.

4.2. Efficiency Domain I A (about 450 °C, 0.01 s−1/0.92 Strain)

The dislocation density (as seen in Figure 9b) increases slightly compared with Figure 9a. The corresponding stress-strain curve (Figure 7b) shows that stress has not reached a distinct peak at the initial stage of deformation, and increases slightly after long-term balance. It demonstrates that more dislocations are introduced by the large one-pass deformation, but these dislocations are not sharply decreased by DRX. Meanwhile, the pinned dislocations need more energy to overcome the deformation barrier, due to a reduction of the power efficiency η down to 35% and the corresponding Q has fallen to only 4 kJ/mol.

4.3. Efficiency Domain I B (about 500 °C, 1.0 s−1/1.2 Strain)

In contrast to efficiency domain I A (ε = 1.20), the dislocation density decreases greatly in Figure 9c, and the clear crystal boundaries are formed [42]. The corresponding stress-strain curve (Figure 7c) is softening. This corresponds to the power efficiency η of 48% (Figure 4c). The obvious softening attributes to the deformation heating-up caused by large deformation and high strain rate, which decreases the resistance of deformation and benefits recrystallization.

4.4. Efficiency Domain I B (about 450 °C, 1.0 s−1/1.38 Strain)

Figure 9d shows the microstructure of domain I B (ε = 1.38), whose hot processing map and stress-strain curve correspond to Figure 7d and Figure 4d, respectively. The dislocations are arranged into walls and accumulated at grain boundaries, leading to a decent power efficiency η of 30%. The dislocation cells and clear crystal boundaries are observed in Figure 9d at the same time. The corresponding curve indicates that stress decreases at the strain more than 0.69, and increases at strain more than 1.20, meanwhile, with characteristics of multi-peek. This is because of Discontinuous Dynamic recrystallization (DDRX) caused by further deformation of initial crystal and CDRX grains [41,43].

4.5. Low-Efficiency Domain II C (about 400 °C, 0.01 s−1/1.38 Strain)

The dislocation tangles are observed in Figure 9d*, resulting in a very low-efficiency η of 8% (as seen in Figure 4d). Correspondingly, the stress-strain curve (Figure 7d) is characterized by strain hardening after softening. It can be confirmed that the strain-induced precipitation has enough time to form, which effectively pinned the movement of dislocations. Besides, the low strain rate not only provides more deformation time, but also accelerates the dissipation of deformation heating caused by high one-pass deformation.

5. Conclusions

The hot deformation behaviors of Al–4.30 Mg alloy are analyzed on basis of the true strain-stress curves, and the 3D hot processing maps have been established under high true strains of 0.69, 0.92, 1.20 and 1.38. Based on the comprehensive analysis of the TEM characterization, apparent activation energy and stress–strain curves, the hot processing maps are verified and deformation mechanisms are discussed. The conclusions are as follows.
(1)
The apparent activation energy (Q) decreases obviously with increasing the strain. The activation energy decreases from 140 to 136 kJ/mol when strain increases from 0.69 to 0.92. When the strain increases from 0.92 to 1.20 and from 1.20 to 1.38, the apparent activation energy changes from 136 to 124 kJ/mol and from 124 to 112 kJ/mol, respectively. The difference of Q is nearly 12 kJ/mol, which greatly affects the processing maps. The activation energy changes with the amount of deformation, indicating the dependence of deformation mechanisms on the strain.
(2)
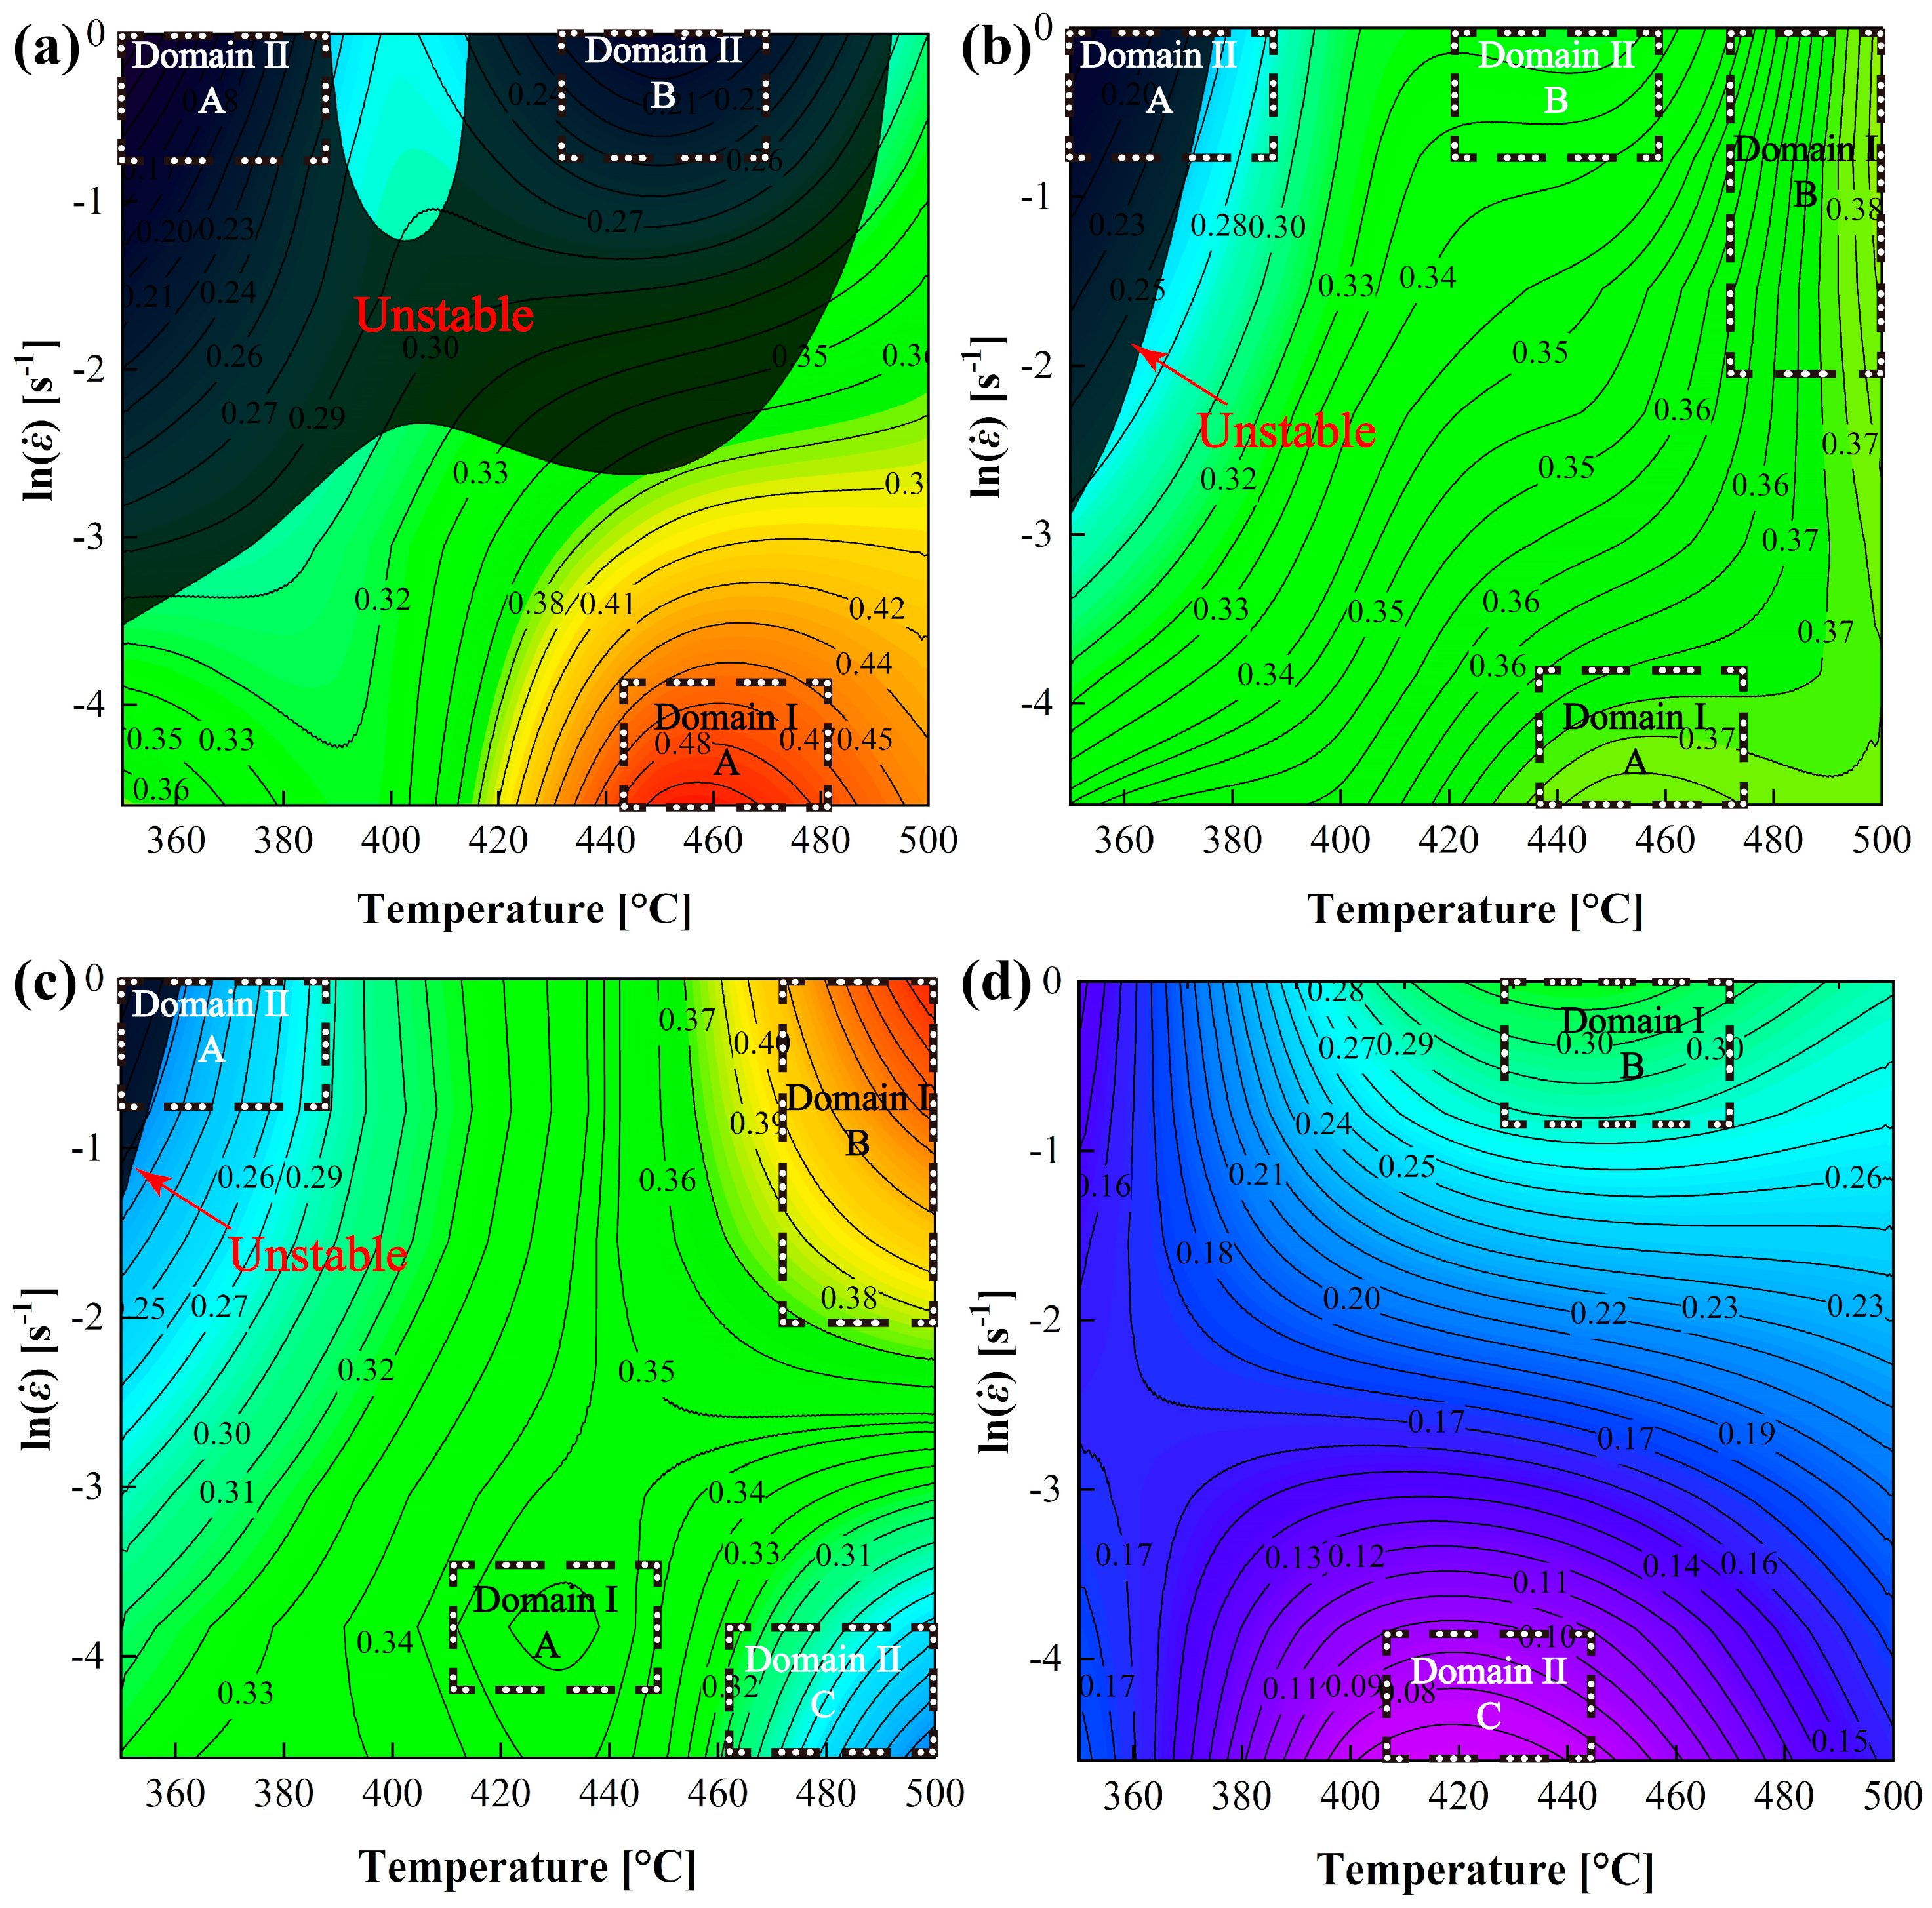
The optimized hot processing parameters are the two efficiency regions with the maximum power efficiency η of 48%. The domain I A (440–480 °C/0.01–0.05 s−1, ε = 0.69) is considered as a result of dynamic recrystallization (DRX) at the high temperature and low strain rate. The domain I B (470–500 °C/0.3–1.0 s−1, ε = 1.20) is the result of DRX at high temperature and a large deformation heat caused by both large strain and high strain rate.
(3)
There are two types of instability regions in hot processing maps of Al–4.30 Mg alloy. The instability domain II A (350–390 °C/1.0 s−1) appears at strains less than 1.20; another instability domain II B (410–490 °C/1.0 s−1) only appears at a stain of 0.69. The appearance of domain II A and domain II B attributes to the obvious strain hardening and low deformation energy under low temperature, low strain and high strain rate, which cannot provide enough driving force for dislocation movement.

Author Contributions

Conceptualization, Y.Z. and H.D.; methodology, H.D., Y.C., P.C., J.Z. and L.L.; validation, Y.Z. and H.D.; formal analysis, H.D., Y.C. and P.C.; writing—original draft preparation, H.D., Y.Z. and J.Z.; paper revision, Y.Z. and H.D.; project administration, Y.Z. and Z.H.; All authors have read and agreed to the published version of the manuscript.

Funding

This research was funded by Development of Science and Technology of Nanning, grant number 20201045, Innovation Drive Development Foundation of Guangxi, grant number GKAA17202011 and GKZ14122001-3, Guangxi Natural Science Foundation, grant number 2018GXNSFAA050048 and 2017GXNSFAA198271, and Guangxi Key Laboratory Project for Processing Non-ferrous Metals and Characteristic Materials, grant number GXYSSF1809.

Acknowledgments

The authors gratefully acknowledge the equipment managers of Guangxi Key Laboratory Project for Processing Non-ferrous Metals and Characteristic Materials.

Conflicts of Interest

The authors declare no conflict of interest.

References

  1. Scamans, G.M.; Holroyd, N.J.H.; Tuck, C.D.S. The role of magnesium segregation in the intergranular stress corrosion cracking of aluminium alloys. Corros. Sci. 1987, 27, 329–347. [Google Scholar] [CrossRef]
  2. Wang, Y.; Gupta, R.K.; Sukiman, N.L.; Zhang, R.; Davies, C.H.J.; Birbilis, N. Influence of alloyed Nd content on the corrosion of an Al-5Mg alloy. Corros. Sci. 2013, 73, 181–187. [Google Scholar] [CrossRef]
  3. Maitra, S.; English, G.C. Mechanism of localized corrosion of 7075 alloy plate. Metall. Trans. A 1981, 12, 535–541. [Google Scholar] [CrossRef]
  4. Gao, X.; Zhang, T.; Hayden, M.; Roe, C. Effects of the stress state on plasticity and ductile failure of an aluminum 5083 alloy. Int. J. Plast 2009, 25, 2366–2382. [Google Scholar] [CrossRef]
  5. Lu, G.; Zhao, M.; Li, J.; Wu, W.; Feng, W. Effect of Microalloying with La and Y on Microstructure and Corrosion Resistance of Al-Si Alloy. Foundry Technol. 2014, 35, 225–227. (In Chinese) [Google Scholar]
  6. Zhou, S.a.; Zhang, Z.; Li, M.; Pan, D.; Su, H.; Du, X.; Li, P.; Wu, Y. Effect of Sc on microstructure and mechanical properties of as-cast Al-Mg alloys. Mater. Des. 2016, 90, 1077–1084. [Google Scholar] [CrossRef]
  7. Zhemchuzhnikova, D.; Kaibyshev, R. Mechanical Behavior of an Al–Mg–Mn–Sc Alloy with an Ultrafine Grain Structure at Cryogenic Temperatures. Adv. Eng. Mater. 2016, 17, 1804–1811. [Google Scholar] [CrossRef]
  8. Liu, Y.G.; Huang, H.; Lin, S.P.; Liu, Y.B.; Nie, Z.R. Effect of Rare Earth Element Er on the Microstructure and Properties of 5083 Alloy. Nonferrous Met. 2008, 6, 27–30. [Google Scholar]
  9. Hu, H.; Zhen, L.; Zhang, B.Y.; Yang, L.; Chen, J.Z. Microstructure characterization of 7050 aluminum alloy during dynamic recrystallization and dynamic recovery. Mater. Charact. 2008, 59, 1185–1189. [Google Scholar] [CrossRef]
  10. Agnew, S.R.; Duygulu, Ö. Plastic anisotropy and the role of non-basal slip in magnesium alloy AZ31B. Int. J. Plast 2005, 21, 1161–1193. [Google Scholar] [CrossRef]
  11. Sakai, T.; Belyakov, A.; Kaibyshev, R.; Miura, H.; Jonas, J.J. Dynamic and post-dynamic recrystallization under hot, cold and severe plastic deformation conditions. Prog. Mater. Sci. 2014, 60, 130–207. [Google Scholar] [CrossRef] [Green Version]
  12. Zhang, H.; Li, L.; Yuan, D.; Peng, D. Hot deformation behavior of the new Al-Mg-Si-Cu aluminum alloy during compression at elevated temperatures. Mater. Charact. 2007, 58, 168–173. [Google Scholar] [CrossRef]
  13. Liu, J.; Cui, Z.; Li, C. Modelling of flow stress characterizing dynamic recrystallization for magnesium alloy AZ31B. Comput. Mater. Sci. 2008, 41, 375–382. [Google Scholar] [CrossRef]
  14. Huang, X.; Zhang, H.; Han, Y.; Wu, W.; Chen, J. Hot deformation behavior of 2026 aluminum alloy during compression at elevated temperature. Mater. Sci. Eng. A 2010, 527, 485–490. [Google Scholar] [CrossRef]
  15. Liu, W.; Zhao, H.; Li, D.; Zhang, Z.; Huang, G.; Liu, Q. Hot deformation behavior of AA7085 aluminum alloy during isothermal compression at elevated temperature. Mater. Sci. Eng. A 2014, 596, 176–182. [Google Scholar] [CrossRef]
  16. Zhu, R.; Liu, Q.; Li, J.; Xiang, S.; Chen, Y.; Zhang, X. Dynamic restoration mechanism and physically based constitutive model of 2050 Al–Li alloy during hot compression. J. Alloys Compd. 2015. [Google Scholar] [CrossRef]
  17. Johnson, G.R.; Hoegfeldt, J.M.; Lindholm, U.S.; Nagy, A. Response of Various Metals to Large Torsional Strains Over a Large Range of Strain Rates—Part 1: Ductile Metals. J. Eng. Mater. Technol. 1983, 105, 42. [Google Scholar] [CrossRef]
  18. Johnson, G.R.; Cook, W.H. Fracture characteristics of three metals subjected to various strains, strain rates, temperatures and pressures. Eng. Fract. Mech. 1985, 21, 31–48. [Google Scholar] [CrossRef]
  19. Zerilli, F.J.; Armstrong, R.W. Dislocation-mechanics-based constitutive relations for material dynamics calculations. J. Appl. Phys. 1987, 61, 1816–1825. [Google Scholar] [CrossRef] [Green Version]
  20. Lin, Y.C.; Li, L.T.; Fu, Y.X.; Jiang, Y.Q. Hot compressive deformation behavior of 7075 Al alloy under elevated temperature. J. Mater. Sci. 2012, 47, 1306–1318. [Google Scholar] [CrossRef]
  21. Li, H.Y.; Wang, X.F.; Duan, J.Y.; Liu, J.J. A modified Johnson Cook model for elevated temperature flow behavior of T24 steel. Mater. Sci. Eng. A 2013, 577, 138–146. [Google Scholar] [CrossRef]
  22. Chen, L.; Zhao, G.; Yu, J. Hot deformation behavior and constitutive modeling of homogenized 6026 aluminum alloy. Mater. Des. 2015, 74, 25–35. [Google Scholar] [CrossRef]
  23. Haghdadi, N.; Zarei-Hanzaki, A.; Abedi, H.R. The flow behavior modeling of cast A356 aluminum alloy at elevated temperatures considering the effect of strain. Mater. Sci. Eng. A 2012, 535, 252–257. [Google Scholar] [CrossRef]
  24. Yuan, X.; Wen, S.; Hou, J.; Wu, X.; Bolong, L.; Gao, K.; Huang, H.; Nie, Z. Hot deformation behavior and dynamic precipitation in Al-Er-Zr alloy. Rare Metal Mater. Eng. 2020, 49, 2305–2313. [Google Scholar]
  25. Sang, D.; Fu, R.; Li, Y. The Hot Deformation Activation Energy of 7050 Aluminum Alloy under Three Different Deformation Modes. Metals 2016, 6, 49. [Google Scholar] [CrossRef]
  26. Odoh, D.; Mahmoodkhani, Y.; Wells, M. Effect of alloy composition on hot deformation behavior of some Al-Mg-Si alloys. Vacuum 2018, 149, 248–255. [Google Scholar] [CrossRef] [Green Version]
  27. Reddy, G.J.; Srinivasan, N.; Gokhale, A.A.; Kashyap, B.P. Processing map for hot working of spray formed and hot isostatically pressed Al–Li alloy (UL40). J. Mater. Process. Technol. 2009, 209, 5964–5972. [Google Scholar] [CrossRef]
  28. Meng, G.; Li, B.; Li, H.; Huang, H.; Nie, Z. Hot deformation and processing maps of an Al–5.7 wt.%Mg alloy with erbium. Mater. Sci. Eng. A 2009, 517, 132–137. [Google Scholar] [CrossRef]
  29. Ganesan, G.; Raghukandan, K.; Karthikeyan, R.; Pai, B.C. Development of processing maps for 6061 Al/15% SiCp composite material. Mater. Sci. Eng. A 2004, 369, 230–235. [Google Scholar] [CrossRef]
  30. Mohamadizadeh, A.; Zarei-Hanzaki, A.; Abedi, H.R.; Mehtonen, S.; Porter, D. Hot deformation characterization of duplex low-density steel through 3D processing map development. Mater. Charact. 2015, 293–301. [Google Scholar] [CrossRef]
  31. Kai, X.; Chen, C.; Sun, X.; Wang, C.; Zhao, Y. Hot deformation behavior and optimization of processing parameters of a typical high-strength Al–Mg–Si alloy. Mater Des. 2015, 90, 1151–1158. [Google Scholar] [CrossRef]
  32. Peng, J.; Wang, Y.; Zhong, L.; Peng, L.; Pan, F. Hot deformation behavior of homogenized al-3.2mg-0.4er aluminum alloy. Trans. Nonferrous Metals Soc. China 2016, 26, 945–955. [Google Scholar] [CrossRef]
  33. Sellars, C.M.; Mctegart, W.J. On the mechanism of hot deformation. Acta Metall. 1966, 14, 1136–1138. [Google Scholar] [CrossRef]
  34. Zener, C.; Hollomon, J.H. Effect of Strain Rate Upon Plastic Flow of Steel. J. Appl. Phys. 1944, 15, 22–32. [Google Scholar] [CrossRef]
  35. Prasad, Y.V.R.K.; Gegel, H.L.; Doraivelu, S.M.; Malas, J.C.; Morgan, J.T.; Lark, K.A.; Barker, D.R. Modeling of dynamic material behavior in hot deformation: Forging of Ti-6242. Metall. Trans. A 1984, 15, 1883–1892. [Google Scholar] [CrossRef]
  36. Prasad, Y.V.R.K.; Seshacharyulu, T. Modelling of hot deformation for microstructural control. Int. Mater. Rev. 1998, 43, 243–258. [Google Scholar] [CrossRef]
  37. Prasad, Y.V.R.K.; Rao, K.P. Processing maps and rate controlling mechanisms of hot deformation of electrolytic tough pitch copper in the temperature range 300–950°C. Mater. Sci. Eng. A 2005, 391, 141–150. [Google Scholar] [CrossRef]
  38. Zhang, B.L.; Maclean, M.S.; Baker, T.N. Hot deformation behaviour of aluminium alloy 6061/SiCp MMCs made by powder metallurgy route. Mater. Sci. Technol. 2013, 16, 897–902. [Google Scholar] [CrossRef]
  39. Liu, S.; Pan, Q.; Li, H.; Huang, Z.; Li, K.; He, X.; Li, X. Characterization of hot deformation behavior and constitutive modeling of al–mg–si–mn–cr alloy. J. Mater. Sci. 2019, 54, 4366–4383. [Google Scholar] [CrossRef]
  40. Galiyev, A.; Kaibyshev, R.; Gottstein, G. Correlation of plastic deformation and dynamic recrystallization in magnesium alloy zk60. Acta Mater. 2001, 49, 1199–1207. [Google Scholar] [CrossRef]
  41. Sitdikov, O.; Kaibyshev, R. Dynamic recrystallization in pure magnesium. Mater Trans. 2005, 42, 1928–1937. [Google Scholar] [CrossRef] [Green Version]
  42. Dai, Q.; Deng, Y.; Tang, J.; Wang, Y. Deformation characteristics and strain-compensated constitutive equation for aa5083 aluminum alloy under hot compression. Trans. Nonferrous Metals Soc. China 2019, 29, 2252–2261. [Google Scholar] [CrossRef]
  43. Beer, A.G.; Barnett, M.R. Microstructural Development during Hot Working of Mg-3Al-1Zn. Metall. Mater.Trans. 2007, 38, 1856–1867. [Google Scholar] [CrossRef]
Figure 1. Experimental procedures for the hot compression.
Metals 11 00347 g001
Figure 2. True stress-strain curves at 400 °C, the true strain of 0.69–1.38 and different strain rates of (a) 0.01 s−1, (b) 0.1 s−1 and (c) 1.0 s−1.
Metals 11 00347 g002
Figure 3. (a,b) The 3D power efficiency map, (c,d) 3D instability map of Al–4.30 Mg.
Metals 11 00347 g003
Figure 4. The strain sections of 3D hot processing maps for the true strain of (a) 0.69, (b) 0.92, (c) 1.20 and (d) 1.38.
Metals 11 00347 g004
Figure 5. The correlation of experimental flow stress and predicted values for true strains of (a) 0.69, (b) 0.92, (c) 1.20 and (d) 1.38.
Metals 11 00347 g005
Figure 6. The variety of apparent activation energy (Q) with increasing strains of 0.69, 0.92, 1.20 and 1.38.
Metals 11 00347 g006
Figure 7. Stress-strain curves after deformation at true strains of (a) 0.69, (b) 0.92, (c) 1.20 and (d) 1.38.
Metals 11 00347 g007
Figure 8. The OM photographs of Al–4.30Mg alloy deformed at 450 °C and a strain rate of 0.01 s−1 with a reduction of (a) 60% and (b) 75%.
Metals 11 00347 g008
Figure 9. The TEM images after deformation at (a) 450 °C, 0.01 s−1/0.69 strain; (b) 450 °C, 0.01 s−1/0.92 strain; (c) 500 °C, 1.0 s−1/1.20 strain; (d) 450 °C, 1.0 s−1/1.38 strain and and (d*) 400 °C, 0.01 s−1/1.38 strain. (β is the second phase of the alloy).
Metals 11 00347 g009
Table 1. Chemical compositions of Al–4.30Mg alloy (wt.%).
MgSiFeCuMnCrZnTiAl
4.300.1180.1880.0220.030.010.030.031Bal.
Table 2. Values of α, n, Q and A of Arrhenius constitutive model in different amounts of deformation strain.
True StrainA/s−1α/MPa−1nQ/kJ/mol
0.691.55×1091.45×10−23.83588140.300
0.928.37×1081.44×10−23.70879136.350
1.201.13×1081.39×10−23.77810124.079
1.381.70×1071.27×10−24.03817112.744
Table 3. Calculated values of R* and average absolute relative error (AARE) for constitutive equations with different stains.
True StrainQ/kJ/molR*AARE(%)
0.69140.3000.99622.77%
0.92136.3500.99742.28%
1.20124.0790.99634.29%
1.38112.7440.98835.96%
Publisher’s Note: MDPI stays neutral with regard to jurisdictional claims in published maps and institutional affiliations.

