Article

Upscaling Severe Torrefaction of Agricultural Residues to Produce Sustainable Reducing Agents for Non-Ferrous Metallurgy

Université Grenoble-Alpes, CEA, LITEN, DTCH, Laboratoire Réacteurs et Procédés (LRP), F-38000 Grenoble, France
*
Authors to whom correspondence should be addressed.
Metals 2021, 11(12), 1905; https://doi.org/10.3390/met11121905
Submission received: 28 October 2021 / Revised: 19 November 2021 / Accepted: 23 November 2021 / Published: 26 November 2021
(This article belongs to the Special Issue Sustainable Metallurgical Processes for Metallic Waste Valorization)

Abstract

:
Torrefaction of almond shells and olive stones, which are typically considered agricultural waste in the southern regions of the European Union, was investigated in this work for application as reducing agents in the metallurgical industry. Four different temperatures were tested: 250, 280, 300 and 350 °C. The evolution of the solid yields with the temperature was determined with TGA measurements. This showed that the duration of torrefaction should not exceed 45 min. The kinetic profiles were successfully fitted using the pseudo-first-order rate equation (PFORE). Then, torrefaction for 45 min was systematically carried out at every temperature and for each resource in a laboratory-scale batch device. The raw and torrefied biomasses were characterized using proximate, ultimate and calorific analyses. The carbon/oxygen ratio and the heating values were increased as a result of the torrefaction severity (from 20 MJ/kg for both raw biomasses to 30 MJ/kg at 350 °C). The highest mass losses were obtained at the highest temperature (67.35 and 65.04 %w for almond shells and olive stones, respectively, at 350 °C). The fixed carbon value also increased, being higher than 67 %w for torrefaction at 350 °C. The large-scale torrefaction at 350 °C (45 min) of these biomasses was carried out in a continuous pilot plant. The solids were characterized as well, and their properties were close to those of the biomasses torrefied in the laboratory-scale batch reactor under the same conditions. This thermal treatment provided biochars with all the required properties to be used as reducing materials in metallurgy.

Graphical Abstract

1. Introduction

The over-exploitation of fossil-based energy worldwide has progressively increased in the last century and has led to an increase in CO2 anthropogenic emissions. Energy-Intensive Industries (EIIS), which include metallurgical industries, are some of the main contributors to this increase in CO2 emissions. The International Energy Agency reported in 2018 that for every ton of steel produced, 1.9 t of CO2 is released into the environment [1].
Consequently, environmental solutions are urgently required to mitigate the impact of using fossil fuels. Thus, green energy schemes have been worldwide developed for achieving this goal, which are essentially associated with solar, wind, ocean, geothermal and biomass resources [2]. Special consideration has to be given to biomass-based energy, as it supplies 10% of the primary energy demand [3].
The use of biomass in metallurgy could be a solution to decrease fossil-based CO2 emissions. The carbon content of raw biomass is lower than in coals and coke, used in metallurgical processes, whereas the oxygen content is higher in raw biomass when compared to coals and coke. In order to treat biomass for reducing agent purposes [4,5], there is a need for efficient technologies to obtain biomass-based products with high carbon content and low oxygen content, as well as to reduce the moisture content of the biomass. One of these promising technologies is to thermally treat the biomass.
A thermal treatment carried out between 250 and 350 °C lies partly in the temperature range of torrefaction. Torrefaction is a thermochemical process typically operated between 200 and 300 °C under the absence of oxygen. During torrefaction, biomass is converted into torrefied biomass, also called biochar. Torrefied biomass presents upgraded properties compared to raw biomass due to the destruction of the fibrous structure and the change in rotting behavior. Furthermore, the initial energy content is mainly preserved within the solid after torrefaction [6].
Partial substitution of coal and coke in blast furnaces with biomass seems to be one promising approach to mitigate CO2 emissions [4]. In metallurgical processes, it also seems that the most suitable raw materials would be woody biomasses. The reason lies in the fact that the ash and sulfur contents are usually low. Moreover, the amount of alkali elements (such as potassium or sodium) within ash contained in wood is usually under the critical limit. The target requirements for charcoals as reducing agents in metal processing and recycling are, as much as possible, the highest fixed carbon content and the lowest volatile matter content. However, woody biomasses are very expensive and often unavailable, whereas agricultural biomasses are cheaper and more readily available in large quantities. Currently, non-woody biomasses are often burnt or deposited for disposal [5,7,8,9].
To our knowledge, no research has yet been carried out on the potential use of non-woody biomass for reducing agent purposes in non-ferrous metallurgy. Nevertheless, one work [4] has mentioned non-woody biomass as a promising source to produce reducing agents for ferrous metallurgy; however, no type of bioresource is specified. Different types of agricultural biomass have been used for sintering [10]: hazelnut shell and rice husk [11]; sunflower briquettes, almond nut shells, hazelnut shells, rape straw and rape seed [12]; and sunflower seed husk [13].
Different potential pathways exist to produce reducing agents from biomass via thermochemical conversion [14]. One of these pathways is the above-mentioned torrefaction. However, to our knowledge, torrefaction has not been investigated as a process to thermo-chemically convert biomass for reducing agent purposes. This work was performed within the framework of the DIGISER++ project (funded by EIT Raw Materials, project agreement no. 19145-DIGISER++), which promotes the shift from fossil to renewable resources with underutilized resources for energy carriers, including harvesting residues from agriculture and the forestry industry. The main goal of the DIGISER++ project is the valorization of metallic wastes coming from a copper smelting and refining process with a patented technology, to recover ZnO-rich concentrates and valuable metals, thus contributing to the reduction of the dependency on minerals.
The first objective of the present work was to investigate the torrefaction conditions required to manufacture a biomass-based reducing agent, to be used in metallurgical furnaces, from two types of agricultural residues: almond shells and olive stones. The characterization data of the materials (before and after torrefaction) will be presented. These biomasses were selected for three main reasons: (i) their low ash content; (ii) after torrefaction, the resulting biochar presents an elevated fixed carbon content [4]; (iii) their high availability in the Southern regions of Spain, which is in proximity to the end-user of the DIGISER++ project technology (Atlantic copper S.L.U., located in Huelva, Spain). Note that the temperature range was extended up to 350 °C, which is above the usual upper limit of torrefaction. In what follows, the term torrefaction is still used to refer to any thermal treatment of biomass, even above 300 °C. To test different conditions of torrefaction, an instrumented laboratory-scale device was used. Once the best conditions were identified, the large-scale production of torrefied biomass was carried out in a continuous reactor (multiple-hearth furnace). The second objective of this work was also to assess whether the process of production of biochars may be upscaled from the laboratory to the pilot scale.

2. Materials and Methods

2.1. Biomass Analysis

The raw biomasses were provided by Iberia Bioenergy S.L. (Granada-Spain). Samples were ground below 300 μm according to the standard method NF EN ISO 14780 for raw biomasses, and according to the standard method NF EN 15413 for torrefied biochars. Table 1 shows the proximate and ultimate analyses of the biomasses.

2.2. Torrefaction at Laboratory Scale

The preparation of the biochar materials was carried out using a programmable laboratory furnace (CARBOLITETM CWF 12/13, dimensions: 325 mm × 200 mm × 200 mm, provided by Fisher Scientific SAS part of Thermo Fischer Scientific Inc., Illkirch, France). An internal device was specially conceived in order to maintain the inert atmosphere of the process for developing the torrefaction assessments.
Figure 1 represents the scheme of the equipment, in which a fixed amount of biomass (20 g) was placed in contact with a stable nitrogen flow rate (2 L min−1) in order to maintain a low oxygen content (<5%). The device was equipped with eight thermocouples (T1, T2, T3, T4, T5, T6, T7, T8) for monitoring the temperature profiles in different zones of the apparatus. Four torrefaction conditions were considered, (i) 250 °C, (ii) 280 °C, (iii) 300 °C, (iv) 350 °C, with a residence time higher than 45 min.
The gases produced during torrefaction were efficiently evacuated from the process by an extraction system installed on the top of the furnace. At the end of the process, a certain amount of condensates was observed on the walls of the extraction pipes. The torrefied biomass was cooled down in a nitrogen stream until a temperature of 40 °C was reached, and then it was collected for characterization.

2.3. Torrefaction at Pilot Scale

Torrefaction at pilot scale was carried out using a vertical furnace with multiple hearths (internal diameter 1.82 m, hearth height 0.74 m; including a rotatory shaft with internal diameter 0.42 m) provided by CMI Group technology (Seraing, Belgium). The column was equipped with six hearths or stages, in which two burners by stage were present, achieving temperatures in the range of 200 to 350 °C. An internal rabbling system ensured the transport and the displacement of the biomass through the hearths [15]. Figure 2 shows the scheme of this torrefaction pilot plant.
Before feeding the furnace with the raw biomass, it was first heated for 40 h until the temperature chosen to operate torrefaction was reached. The input flow rate of biomass (Q) was set at Q ≥ 60 kg h−1 (during 32 h of working time). The following torrefaction conditions were considered: 350 °C with a residence time of 45 min. The torrefied biomass exiting the oven was cooled down into two successive screw conveyors and finally collected in airtight containers of 1 m3 volume (which was swept by a nitrogen stream to maintain low oxygen content, <5%). The mass and energy yields of the tests were then calculated, and the torrefied biomass was characterized.

2.4. Characterization of the Materials

The raw and torrefied biomasses were ground by a cross-beater mill SK 100 (RETSCH, Haan, Germany) for characterization analyses; the particle size of the materials was reduced to 0.1 mm < Sp < 0.5 mm. The average particle size (Sp) was systematically checked with a dynamic image analyzer (CAMSIZER XT equipment) from RESTCH (Eragny, France).

2.4.1. Thermal Gravimetric Analyses (TGA)

Thermal gravimetric analyses were performed under a N2 atmosphere (with a flow rate of 50 mL min−1) at a heating rate of 10 °C min−1 using TGA-92 equipment (SETARAM instrumentation, Caluire-et-Cuire, France). Samples of 8 mg were degraded within a temperature range of 30–350 °C.

2.4.2. Elemental Analyses

Elemental analyses were carried out with a Vario EL cube instrument (ELEMENTAR, Langenselbold, Germany). The weight content of the main elements (such as carbon, hydrogen, nitrogen and sulfur) was determined by the equipment in three replicated analyses to validate the repeatability of the results (the standard deviation was in the order of ±5%). The standard procedures presented in Table 1 were followed.

2.4.3. Calorimetric Analyses

A 6200 isoperibol oxygen bomb calorimeter (Parr Instrument, Moline, IL, USA) was used to determine the higher heating values (HHV) of the raw and torrefied biomasses. The ignition of 1 g of dried sample under an oxygen atmosphere was performed under a pressure of 30 bar. Benzoic acid (Merck, Darmstadt, Germany) was used to calibrate the heat capacity of the calorimeter [16].

2.4.4. SEM-EDX Analyses

The samples were analyzed using a Philips XL-30 microscope (Philips Electron Optics BV, Eindhoven, The Netherlands); the specialized scanning electron microscope (SEM), with low-vacuum and high-vacuum modes, is capable of analyzing samples under low pressure (<5 × 10⁻⁴ Pa). The objective lenses of the XL series have optimum performance for both the imaging and micro-analysis of specimens; this makes it ideal for the monitoring of manufacturing processes, as well as for routine operations. A high magnification is easily obtained (which improves the study of several types of micro/nano-structures). The microscope is also equipped with an Energy Dispersive X-ray (EDX) spectrometer (INCA 250, Oxford instruments, Oxfordshire, UK) for chemical analyses.

3. Results and Discussion

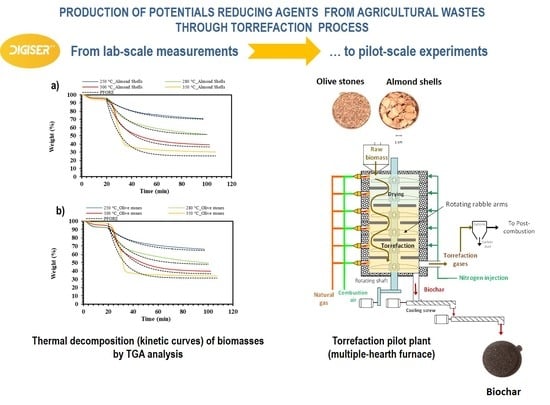
3.1. Thermal Gravimetric Analyses (TGA)

Figure 3 reports the mass loss evolution as a function of time (kinetic profiles) for the thermal conversion of almond shells and olive stones, respectively. The results show that both biomasses experienced similar mass loss during torrefaction at the same temperature. Differences in mass loss were lower than 5 %w between the biomasses (under the same torrefaction conditions). In all cases, mass loss was stable after 45 min of torrefaction, which was chosen as the reference duration of torrefaction. Three general stages can be distinguished in the curves of Figure 3:
  • Stage 1: Corresponds to the increase in temperature from room temperature until around 200 °C. During this stage, mainly the loss of volatiles and water occurs, and the mass loss is similar for all temperatures and biomasses, reaching a maximum of 7 %w.
  • Stage 2: Corresponds to the increase in temperature from around 200 °C until the torrefaction temperature. There is significant mass loss during this stage; the higher the temperature, the higher the mass loss. At 350 °C, the total mass loss reaches almost 70 %w for both biomasses. Significant differences among temperatures can be observed, reaching up to 20 %w. The higher the temperature, the more significant this mass decrease and the longer this stage is.
  • Stage 3: Corresponds to the decrease in temperature from the torrefaction temperature to the room temperature. During this stage, there is no significant mass loss, being lower than 5 %w for all temperatures and biomasses. The higher the temperature, the later this stage takes place.
In summary, the results demonstrated that increasing the torrefaction time leads to a mass loss increase until a pseudo-plateau is achieved. The curves in Figure 3 have the typical shape of the pseudo-first-order reaction plots. Thus, the pseudo-first-order model rate equation (PFORE) [8,9] was adapted and tested in order to describe the thermal conversion of the biomass in the temperature range of 200–350 °C. Although the principles of the original model are different, the equation allows description of the kinetic profiles as a progressive rate in which an equilibrium state is reached (plateau).
The relative mass loss (Wt) is defined as the ratio (%w) between the mass at the time t (mt) and the initial mass of the sample (m0) [17]:
Equation (1). Relative mass loss.
W t = 100 100 × m t m 0
Similarly, the relative mass loss at the equilibrium time (Wp) is defined as the ratio (%w) between the mass at the plateau (mp) and the initial mass of the sample (m0).
Equation (2). Relative mass loss at the equilibrium time.
W p = 100 100 × m p m 0
The variation in the relative mass loss as a function of time is defined as follows.
Equation (3). Variation in relative mass loss.
dW t dt = K W p W t
where K is the kinetic constant expressed in min−1, t is the torrefaction time expressed in min, and the mass of the samples is expressed in mg. Equation (3) states that the rate of thermal conversion is directly proportional to the distance to the plateau (Wp − Wt); this distance is higher at time t = 0, in which Wt = 0, and decreases with time until the equilibrium is reached, Wp − Wt = 0. The integration of Equation (3) gives the following.
Equation (4). Empirical equation [17].
W t = W P 1 e Kt
The constants obtained from the fit of this model to the experimental results are reported in Table 2. The temperature has a greater impact on the mass yield than the torrefaction time. Equation (5) can be used to describe the relationship between the TGA (at laboratory scale) and a larger-scale production furnace (e.g., pilot-scale torrefaction furnaces).
The values of the kinetic constant (KT) were found to be two times greater for the process at 350 °C (Table 2) than that obtained at 250 °C, which is in agreement with the literature [17]. As expected, the increase in temperatures contributes to accelerating the thermal degradation of the biomasses studied in this work; consequently, at higher torrefaction severity, the values of KT are greater.
The weight loss values reported in Table 2 (TGA curves) correspond to the maximum mass losses, which are achieved at the equilibrium plateau; PFORE can effectively be used for fitting the experimental data. The maximum weight loss is obtained at 350 °C (i.e., 67.35% and 65.04% for almond shells and olive stones, respectively); the residual biochar is highly concentrated in carbon.

3.2. Torrefaction at Laboratory Scale

The temperature profiles of the torrefaction process (by using the laboratory-scale device) are plotted in Figure 4 and Figure 5. Three zones can be clearly distinguished in the plots (at 300 and 350 °C): (i) a first zone in which the curves progressively increase (at 10 °C/min) until the set temperature is reached; (ii) a second zone in which a characteristic peak is observed (detected by the thermocouples T1 and T3, installed in the core of the device). This is the effective zone of the process; the temperature is stabilized by the appearance of a plateau and the torrefaction of the biomass is carried out. Finally, there is (iii) a third zone in which the curves decrease as a result of the cooling of the process (meaning that the torrefaction of the biomass is complete and the samples can be collected from the furnace).
At 300 and 350 °C (zone 2), a thermal runaway of the biomass is observed since a temperature peak occurs in the particle bed. This thermal runaway may be due to the hemicelluloses’ degradation, which is exothermic [18]. Recent work explains that exothermicity is linked to the heterogeneous secondary reactions of volatile species. This is in agreement with the results presented by Di Blasi et al. [19]; the lowly porous structure of the particle may impact on the secondary reactions of the process. Thus, in a biomass matrix structure (with low porosity), the retention time of the produced gases during torrefaction is higher, which could contribute to increasing the charring reactions (and the associated exothermicity) [19].
Interestingly, the peak at 350 °C is higher than that obtained at 300 °C. The results indicate that the peaks’ height can be associated with the amount of produced volatile species (obviously, at 350 °C, the cellulose is more degraded than at 300 °C). The initial amount of almond shell and olive stone samples is the same (~20 g) and the particle size distribution is similar in both studies. The average weight loss (AWL) has been compared with that obtained with TGA tests (Table 3), and the results are reproducible.

3.3. Characterization of the Materials

The characterization results (ash content, higher heating values (HHV) and elemental analyses) obtained for raw and torrefied biomasses are reported in Table 4. As expected, after torrefaction, the oxygen/carbon and hydrogen/carbon ratios have decreased as a consequence of the by-product formation during the decomposition steps of macromolecular components (into condensable and permanent gases). From the Van Krevelen plot (Figure 6 and Figure 7), the O/C ratio is more affected than the H/C ratio (the O/C of both biomasses decreased from 0.60 to 0.16 at 350 °C). The temperature contributes to the densification of carbon concentration, which also favors the formation of energetically dense materials. The HHV increases from 20 MJ kg−1 (raw biomasses) to 30 MJ kg−1 (at 350 °C). The greater fixed carbon (FC) values indicated that the biomasses torrefied at 350 °C (with 68% of FC) are the most interesting materials for replacing fossil coal in the metallurgical industries.
The experimental higher heating values (HHV) were compared with the predicted values obtained from the equation suggested by [20]. Equation (5) allows the accurate prediction of the energy content of the biomass by using its elemental composition.
Equation (5). Energy content of biomass calculated from its elemental composition.
HHV = 3.55 C 2 232 C 2230 H   + 51.2 CH   + 131 N   + 20600
where HHV is the higher heating value expressed in kJ kg−1; C, H and N are the mass contents (%w) of carbon, hydrogen and nitrogen, respectively. Figure 6 and Figure 7 report the comparison of experimental HHV and theoretical HHV (estimated by Equation (5)).
Figure 8 shows the linear dependence of the fixed carbon content with the total carbon content, for the samples that were submitted to different thermal treatments, including the untreated sample. The slope of the linear regression is 1.8, indicating that, for every percent of carbon content gained after torrefaction, the fixed carbon content is increased by almost 2%.
Figure 9 shows that the fixed carbon content varies linearly with the torrefaction temperature. By extrapolating this relation, it can be deduced that the biomass should be treated at 400 °C to reach 85% of fixed carbon (in the treated solid). This temperature level lies above the upper admissible limit of the torrefaction pilot-plant furnace. Furthermore, the ash content in this solid will also increase, and could be higher than a typical reducing agent used in the metallurgy industry (e.g., anthracite). Thus, the torrefaction temperature chosen in this work was 350 °C.

3.4. SEM-EDX Analyses

SEM micrographs were obtained to examine the topography of the materials’ surfaces. Figure 10 and Figure 11 show the morphology of the biomasses (before and after torrefaction). As a function of the torrefaction severity, some cavities were found around the entire surface. At higher torrefaction temperatures, wide holes were obtained. These observations are in agreement with the results reported by [17], who suggested that the gas generated during the process opened the pores, becoming larger than those of the original raw biomass.
Thus, the torrefaction process can be used for conditioning the surface of agricultural waste (such as almond shells and olive stones). The resulting materials could have potential uses as sorbents in water treatment and gas cleaning applications.

3.5. Torrefaction at Pilot Scale

Both almond shells and olive stones were torrefied at 350 °C for 45 min at pilot scale. Figure 12 shows the raw biomasses (A, B), as well as the corresponding biochars (C, D), after torrefaction. Table 5 shows the mass balance of the torrefaction at pilot scale. The obtained mass loss (on dry basis) was 63 %wdb for almond shells and 61 %wdb for olive stones. The mass loss (on dry basis) in the laboratory-scale furnace was 64 %wdb for almond shells and 62 %wdb for olive stones. Despite the relatively large uncertainties regarding the values of the mass loss at pilot scale, the solid yield measured at laboratory scale was very similar to the mass loss values obtained at pilot scale. The bulk density was lower and the porosity higher for almond shells than for olive stones.
Figure 13 shows the overall mass balances of almond shells and olive stones, respectively. The solid yield corresponds to the biochar, the condensable yield corresponds to the condensable or non-permanent gases, and the dry gas yield corresponds to the permanent gases. The condensable yield was estimated to be around 38% for both biomasses.
Table 6 shows the proximate and ultimate analyses of almond shells and olive stones torrefied at 350 °C. The moisture content was almost zero for both almond shells and olive stones, due to the change during torrefaction from a hydrophilic to a hydrophobic material. The ash content in both torrefied biomasses was higher than in raw biomasses since the ashes were concentrated and not released during torrefaction. The volatile matter content was reduced to one third of the original content due to the fact that volatile matter was largely released during the process. The fixed C content was much higher (more than three times) than in the raw biomasses. Both the volatile matter content and the fixed C content are key parameters for the reducing-agent application of biochar.
The ultimate analysis of elements C, H, N, O and S revealed a structure that was highly deoxygenated and carbon-concentrated. The biochars presented a HHV that corresponded to 150% of the original HHV value in the raw biomasses and was similar to the HHV of fossil-based fuels. Figure 14 shows the energy balance obtained from the pilot plant. Torrefaction trials with olive stones presented lower power supplied (per kilograms of feedstock) than almond shells.
Figure 15 and Figure 16 show the comparison of properties among the raw biomasses, the biomasses torrefied at laboratory scale at 350 °C and the biomasses torrefied at pilot scale at 350 °C, for almond shells and olive stones, respectively. These results show that there were significant differences in the properties (fixed C, ash, volatile matter and HHV values) between the raw biomasses and the corresponding torrefied biomasses. In contrast, there were no significant differences in the properties between the torrefied biomasses, regardless of the size of the furnace used. This means that a suitable product could be obtained after performing torrefaction, and the above-mentioned properties were unchanged when scaling up torrefaction.
The laboratory-scale reactor was a few centimeters long, whereas the pilot reactor was a few meters in height. The properties, which are relevant for metallurgy applications, are thus nearly unmodified when upscaling by a factor of 100. While the thermal treatment is fully controlled in the laboratory-scale device, some heterogeneities are unavoidable in a reactor as large as the torrefaction pilot. The thermal treatment is slightly more advanced in the small oven compared to the pilot, as revealed by the slightly higher fixed carbon content of the biomasses torrefied in the laboratory-scale device. Nevertheless, as already mentioned, the differences were not significant. This may be an indication that severe torrefaction yields a relatively uniform solid.
Figure 17 shows the compared properties between the two pilot-scale torrefied biomasses. There were no significant differences between the properties of almond shells and olive stones after torrefaction at pilot scale at 350 °C.

4. Conclusions

The different torrefaction conditions tested in the laboratory-scale oven have shown that the thermal treatment needs to be quite severe to meet the requirements of the metallurgy industry. It was therefore decided to treat both biomasses at 350 °C for 45 min. During laboratory-scale torrefaction, at a temperature of 350 °C and a residence time of 45 min, mass loss was higher than 60 %w for both biomasses.
The HHV was increased from 19.98 MJ kg−1 (raw almond shells) and 20.29 MJ kg−1 (raw olive stones), to 29.80 MJ kg−1 and 30.28 MJ kg−1, for the biomasses torrefied at 350 °C (45 min), respectively. Significant differences were observed when comparing the properties of raw biomasses and those of the corresponding biochars.
There were no significant differences between the properties of almond shells and olive stones after Torrefaction (biochar materials). This may be an indication that severe torrefaction yields a relatively uniform solid. The properties of the solids remained unchanged when scaling up torrefaction from the laboratory-scale oven (a few centimeters long) to the pilot reactor (a few meters in height).
Biochar materials obtained from the torrefaction of almond shells and olive stones are promising products to be used as reducing agents in non-ferrous metallurgical furnaces. The torrefaction process contributes to an increase in the HHV and the fixed carbon content of the biochar. On the other hand, it increases the ash content of the solid product. Therefore, this application in metallurgy is only suitable for biomasses with a low ash content.

Author Contributions

Conceptualization, M.G., E.R.-A., M.M., T.M. and H.D.; methodology, M.G., E.L., A.C. and S.T.; validation, H.D., M.M. and T.M.; formal analysis, S.T., N.J., M.G. and A.C.; investigation, H.D. and E.R.-A.; resources, M.M.; data curation, T.M.; writing—original draft preparation, H.D. and E.R.-A.; writing—review and editing, M.M., E.L. and T.M.; visualization, H.D.; supervision, H.D. and T.M.; project administration, E.R.-A.; funding acquisition, M.M. All authors have read and agreed to the published version of the manuscript.

Funding

This work has received funding from the European Institute of Innovation and Technology (EIT Raw Materials), a body of the European Union, under the Horizon 2020 EU framework programme for Research and Innovation (project agreement no. 19145-DIGISER++). The official website of the DIGISER ++ project is https://digiser.tech/, accessed on 20 October 2021. The French Agency for Research (ANR) is also acknowledged for partial funding of the GENEPI platform within the framework of the investments of future (Ref: ANR-11-EQPX-0019).
Metals 11 01905 i001

Acknowledgments

The authors would like to thank Alejandro Demey for the project logotype design, and H. Miller, M. Marotta and C. Tripoli (from CEA, Grenoble, France) for their technical assistance in this work.

Conflicts of Interest

The authors declare no conflict of interest.

Abbreviations

HHVhigher heating value
PFOREpseudo-first-order rate equation
dbdry basis

References

  1. International Energy Agency. CO2 Emissions from Fuel Combustion 2018 Highlights. Available online: http://www.indiaenvironmentportal.org.in/files/file/CO2_Emissions_from_Fuel_Combustion_2018_Highlights.pdf (accessed on 24 October 2021).
  2. Alonso, E.R.; Dupont, C.; Heux, L.; Perez, D.D.S.; Commandre, J.M.; Gourdon, C. Study of solid chemical evolution in torrefaction of different biomasses through solid-state 13C cross-polarization/magic angle spinning NMR (nuclear magnetic resonance) and TGA (thermogravimetric analysis). Energy 2016, 97, 381–390. [Google Scholar] [CrossRef]
  3. Welfle, A. Balancing growing global bioenergy resource demands-Brazil’s biomass potential and the availability of resource for trade. Biomass Bioenergy 2017, 105, 83–95. [Google Scholar] [CrossRef]
  4. Mousa, E.; Wang, C.; Riesbeck, J.; Larsson, M. Biomass applications in iron and steel industry: An overview of challenges and opportunities. Renew. Sustain. Energy Rev. 2016, 65, 1247–1266. [Google Scholar] [CrossRef]
  5. Suopajärvi, H.; Umeki, K.; Mousa, E.; Hedayati, A.; Romar, H.; Kemppainen, A.; Wang, C.; Phounglamcheik, A.; Tuomikoski, S.; Norberg, N.; et al. Use of biomass in integrated steelmaking—Status quo, future needs and comparison to other low-CO2 steel production technologies. Appl. Energy 2018, 213, 384–407. [Google Scholar] [CrossRef] [Green Version]
  6. Van der Stelt, M.J.C.; Gerhauser, H.; Kiel, J.H.A.; Ptasinski, K.J. Biomass upgrading by torrefaction for the production of biofuels: A review. Biomass Bioenergy 2011, 35, 3748–3762. [Google Scholar] [CrossRef]
  7. Griessacher, T.; Antrekowitsch, J.; Steinlechner, S. Charcoal from agricultural residues as alternative reducing agent in metal recycling. Biomass Bioenergy 2012, 39, 139–146. [Google Scholar] [CrossRef]
  8. Saidur, R.; Abdelaziz, E.A.; Demirbas, A.; Hossain, M.S.; Mekhilef, S. A review on biomass as a fuel for boilers. Renew. Sustain. Energy Rev. 2011, 15, 2262–2289. [Google Scholar] [CrossRef]
  9. Suopajärvi, H.; Pongrácz, E.; Fabritius, T. The potential of using biomass-based reducing agents in the blast furnace: A review of thermochemical conversion technologies and assessments related to sustainability. Renew. Sustain. Energy Rev. 2013, 25, 511–528. [Google Scholar] [CrossRef]
  10. Jha, G.; Soren, S. Study on applicability of biomass in iron ore sintering process. Renew. Sustain. Energy Rev. 2017, 80, 399–407. [Google Scholar] [CrossRef]
  11. Haykiri-Acma, H.; Yaman, S.; Kucukbayrak, S. Effect of biomass on temperatures of sintering and initial deformation of lignite ash. Fuel 2010, 89, 3063–3068. [Google Scholar] [CrossRef]
  12. Zandi, M.; Martinez-Pacheco, M.; Fray, T.A.T. Biomass for iron ore sintering. Miner. Eng. 2010, 23, 1139–1145. [Google Scholar] [CrossRef]
  13. Ooi, T.C.; Aries, E.; Ewan, B.C.; Thompson, D.; Anderson, D.R.; Fisher, R.; Fray, T.; Tognarelli, D. The study of sunflower seed husks as a fuel in the iron ore sintering process. Miner. Eng. 2008, 21, 167–177. [Google Scholar] [CrossRef]
  14. Basu, P. Biomass Gasification, Pyrolysis and Torrefaction. Practical Design and Theory, 2nd ed.; Academic Press: Boston, MA, USA, 2013; pp. 87–145. [Google Scholar]
  15. Thevenon, F.; Marchand, M.; Grateau, M.; Demey, H.; Chatroux, A.; De Vincent, P.P.; De Ryck, A.; Melkior, T. Energy requirements to produce fine powders of raw and torrefied wood at pilot scale, and characterization of their flowability. Biomass Bioenergy 2021, 152, 106196. [Google Scholar] [CrossRef]
  16. Chiou, B.S.; Valenzuela-Medina, D.; Bilbao-Sainz, C.; Klamczynski, A.P.; Avena-Bustillos, R.J.; Milczarek, R.R.; Du, W.X.; Glenn, G.M.; Orts, W.J. Torrefaction of almond shells: Effects of torrefaction conditions on properties of solid and condensate products. Ind. Crops Prod. 2016, 86, 40–48. [Google Scholar] [CrossRef]
  17. Demey, H.; Melkior, T.; Chatroux, A.; Attar, K.; Thiery, S.; Miller, H.; Grateau, M.; Sastre, A.M.; Marchand, M. Evaluation of torrefied poplar-biomass as a low-cost sorbent for lead and terbium removal from aqueous solutions and energy co-generation. Chem. Eng. J. 2019, 361, 839–852. [Google Scholar] [CrossRef]
  18. Anca-Couce, A. Reaction mechanisms and multi-scale modelling of lignocellulosic biomass pyrolysis. Prog. Energy Combust. Sci. 2016, 53, 41–79. [Google Scholar] [CrossRef]
  19. Di Blasi, C.; Branca, C.; Galgano, A. On the Experimental Evidence of Exothermicity in Wood and Biomass Pyrolysis. Energy Technol. 2017, 5, 19–29. [Google Scholar] [CrossRef]
  20. Friedl, A.; Padouvas, E.; Rotter, H.; Varmuza, K. Prediction of heating values of biomass fuel from elemental composition. Anal. Chim. Acta 2005, 544, 191–198. [Google Scholar] [CrossRef]
Figure 1. Configuration of the experimental device used for the laboratory-scale torrefaction tests.
Metals 11 01905 g001
Figure 2. Scheme of the continuous torrefaction pilot plant (multiple-hearth furnace).
Metals 11 01905 g002
Figure 3. Thermal decomposition kinetic curves fitted with PFORE (dashed lines). (a) Almond shells. (b) Olive stones.
Metals 11 01905 g003
Figure 4. Temperature profiles of almond shell biomass using MATISSE device. (a) Torrefaction at 350 °C. (b) Torrefaction at 300 °C. (c) Torrefaction at 280 °C. (d) Torrefaction at 250 °C.
Metals 11 01905 g004
Figure 5. Temperature profiles of olive stone biomass using MATISSE device. (a) Torrefaction at 350 °C. (b) Torrefaction at 300 °C. (c) Torrefaction at 280 °C. (d) Torrefaction at 250 °C.
Metals 11 01905 g005
Figure 6. Characterization of almond shells: raw biomass and biochars. (a) Van Krevelen plot. (b) Comparison of higher heating values at different temperatures.
Metals 11 01905 g006
Figure 7. Characterization of olive stones: raw biomass and biochars. (a) Van Krevelen plot. (b) Comparison of higher heating values at different temperatures.
Metals 11 01905 g007
Figure 8. Fixed carbon content of torrefied biomass as a function of its carbon content.
Metals 11 01905 g008
Figure 9. Fixed carbon content of torrefied biomasses as a function of the torrefaction temperature.
Metals 11 01905 g009
Figure 10. Scanning electron microscopy (SEM) images of almond shells: (a) raw biomass before torrefaction; (b) biomass torrefied at 300 °C; (c) biomass torrefied at 350 °C.
Metals 11 01905 g010
Figure 11. Scanning electron microscopy (SEM) images of olive stones: (a) raw biomass before torrefaction; (b) biomass torrefied at 300 °C; (c) biomass torrefied at 350 °C.
Metals 11 01905 g011
Figure 12. (A) Raw olive stones; (B) raw almond shells; (C) pilot-scale torrefied olive stones at 350 °C; (D) pilot-scale torrefied almond shells at 350 °C.
Metals 11 01905 g012
Figure 13. Overall mass balance of almond shells and olive stones in the pilot furnace (350 °C, 45 min).
Metals 11 01905 g013
Figure 14. Energy balance of torrefaction of almond shells and olive stones in the pilot furnace (350 °C, 45 min).
Metals 11 01905 g014
Figure 15. Comparison of properties among different treatments of almond shells.
Metals 11 01905 g015
Figure 16. Comparison of properties among different treatments of olive stones.
Metals 11 01905 g016
Figure 17. Comparison of properties between pilot-scale torrefied almond shells and olive stones.
Metals 11 01905 g017
Table 1. Proximate and ultimate analyses of raw almond shells and olive stones.
PropertyUnitStandard ProcedureFeedstock
Almond ShellsOlive Stones
Moisture%wInternal method PA 25414.88.3
Ash%wdbInternal method PA209 or PA2761.30.9
Volatile matterNF EN ISO 1812379.179.2
Fixed CCalculation/NF M03-00619.619.9
CNF EN ISO 1694850.551.3
H5.955.99
N0.200.19
OCalculation by difference42.041.6
SInternal method PA 3340.0110.032
Cl0.0090.020
HHVMJ/kg dbNF EN ISO 1812519.8420.30
Table 2. Kinetic parameters of the thermal conversion of agricultural wastes.
Experimental
(TGA)
Fitting Model
(PFORE)
BiomassTemperature
(°C)
WTGA
(%wdb)
KT
(min−1)
Wp
(%wdb)
r2
Almond Shells250 24.9 ± 1.6 4.24 × 10−225.190.997
280 46.3 ± 0.45.40 × 10−245.000.986
300 58.7 ± 1.36.39 × 10−258.310.985
350 67.3 ± 1.19.01 × 10−267.270.941
Olive stones250 27.8 ± 0.94.51 × 10−227.820.997
280 45.7 ± 1.15.64 × 10−243.740.976
300 57.9 ± 1.26.24 × 10−258.000.989
350 65.0 ± 1.09.64 × 10−265.610.919
Table 3. Comparison of the experimental mass loss (using different scaled-up laboratory furnaces).
Thermal Gravimetric Analyses
(TGA)
Laboratory Furnace
BiomassTemperature
(°C)
AWLTGA
(%wdb)
AWLLab-Furnace
(%wdb)
Almond shellsRaw--
25024.9429.80
28046.2842.46
30058.6649.97
35067.3563.62
Olive stonesRaw--
25027.7925.63
28045.7441.00
30057.9150.14
35065.0461.66
Table 4. Composition and energy content of agricultural biomasses.
Elemental AnalysesAsh Content
(815 °C)
Energy ContentVolatile SpeciesFixed Carbon
BiomassTemp.
(°C)
C
(%)
H
(%)
N
(%)
S
(%)
O
(%)
Ash
(%)
HHV *
(MJ kg−1)
HHV **
(MJ kg−1)
VS
(%)
FC
(%)
Almond shells25058.505.760.280.0333.531.9023.123.623.1334.40
28066.005.220.300.0326.751.7026.126.726.0946.80
30069.205.200.310.0223.671.6027.528.427.5253.10
35076.404.290.340.0115.863.1029.830.829.7967.70
Olive stones25059.305.570.220.0333.681.2023.923.823.9434.40
28066.205.460.240.0326.871.2026.827.126.8346.00
30071.605.110.290.0121.591.4029.029.529.0455.10
35076.404.320.330.0216.932.0030.230.930.2868.30
* HHV obtained from bomb calorimeter analysis; ** HHV obtained from equation suggested by [20].
Table 5. Operational parameters and mass loss measured during torrefaction at pilot scale (350 °C).
PropertyUnitFeedstock
Almond ShellsOlive Stones
Initial moisture%w14.88.3
Mass flowInput kg/h76.797.1
kg db/h65.389.0
Outputkg db/h23.934.5
Mass loss%w69 ± 5%64 ± 4%
%wdb63 ± 5%61 ± 4%
Bulk density of bed-0.330.76
Porosity of bed0.720.50
Table 6. Proximate and ultimate analyses of almond shells and olive stones torrefied at 350°C in the pilot furnace.
CharacteristicUnitStandard ProcedureFeedstock
Almond ShellsOlive Stones
Moisture%wInternal method PA 254<0.1<0.1
Ash%wdbInternal method PA209 or PA2762.52.1
Volatile matterNF EN ISO 1812333.631.9
Fixed CCalculation/NF M03-00663.966.0
CNF EN ISO 1694874.376.3
H4.564.43
N0.330.36
OCalculation by difference17.716.5
SInternal method PA 3340.0160.015
Cl<0.0070.008
HHVMJ/kg dbNF EN ISO 1812529.4129.84
Publisher’s Note: MDPI stays neutral with regard to jurisdictional claims in published maps and institutional affiliations.

