Article

Transient Liquid Phase Sintering of PM Steel—A Matter of the Heating Rate

by
Stefan Geroldinger
,
Raquel de Oro Calderon
,
Christian Gierl-Mayer
* and
Herbert Danninger
TU Wien, Getreidemarkt 9, 1060 Wien, Austria
*
Author to whom correspondence should be addressed.
Metals 2021, 11(10), 1662; https://doi.org/10.3390/met11101662
Submission received: 16 September 2021 / Revised: 16 October 2021 / Accepted: 16 October 2021 / Published: 19 October 2021
(This article belongs to the Special Issue Sintering Behavior in Steels)

Abstract

:
Powder metallurgy (PM) offers several variants to introduce alloying elements for establishing the desired final composition. One route is the master alloy (MA) approach. The composition and the elements contained in the MA can be adjusted to obtain a liquid phase that penetrates through the interconnected pore network and thus enhances the distribution of the alloying elements and the homogenization of the microstructure. Such a liquid phase is often of a transient character, and therefore the amount of liquid formed and the time the liquid is present during the sintering are highly dependent on the heating rates. The heating rate has also an impact on the reaction temperatures, and therefore, by properly adjusting the heating rate, it is possible to sinter PM-steels alloyed with Fe-Cr-Si-C-MA at temperatures below 1250 °C. The present study shows the dependence of the melting regimes on the heating rate (5, 10, 20, 120 K/min) represented by “Kissinger plots”. For this purpose, liquid phase formation and distribution were monitored in quenching dilatometer experiments with defined heating up to different temperatures (1120 °C, 1180 °C, 1250 °C, 1300 °C) and subsequent quenching. Optimum sintering conditions for the materials were identified, and the concept was corroborated by C and O analysis, CCT diagrams, metallographic sections, and hardness measurements.

1. Introduction

Ferrous powder metallurgy (PM) parts production will be challenged in several ways in the near future. The raw material cost for Cu [1] and Mo constantly increase—“Molybdenum has increased 19.25 USD/kg or 81.91% since the beginning of 2021” [2]—and the use of Ni [3] is progressively restricted due to health hazards. As these are the three alloying elements most commonly used in ferrous PM parts [4,5,6], it is necessary to develop new alloying concepts that can support future industrial needs. PM precision parts production offers a broad spectrum of applications with high dimensional precision and reproducibility of properties and at the same time excellent utilization of material and energy. More cost-efficient alloying elements such as Cr and Si are already well established in standard ingot metallurgy. However, the usage of these alloying elements is challenging in PM as they have a markedly higher oxygen affinity than Fe [7], which, combined with the high specific surface of metal powders, causes problems especially in industrial sintering.
PM offers several routes to introduce alloying elements into a material. One attractive possibility is the use of a master alloy (MA), which contains a relatively high amount of different alloying elements combined in one powder [8,9,10]. MA has turned out to be beneficial to minimize the oxygen affinity compared to the pure element, as the oxygen-sensitive elements of an MA are present with lower chemical activity. The properties of an MA can be tailored—e.g., by using thermodynamic simulations—by adjusting the elemental composition. Therefore, it is possible to design low-melting MAs which form a liquid phase during the heating segment of the sintering process, thus using the interconnected porosity of the PM material to distribute the liquid phase and accelerate the homogenization of the alloying elements [11]. MAs are admixed to a base powder in small quantities (usually < 5 wt%) which has hardly any negative effects on the compressibility of the material. Furthermore, nowadays new atomization techniques, such as Ultra High Pressure Water Atomization, allow an affordable production of fine master alloy powders containing e.g., Cr, Mn, Si, and C with a reasonably low oxygen content [9].
In the present study, MA’s tailored as described in [10] were combined with plain Fe base powder and two different C-contents. In a first step, quenching dilatometer abortion experiments were carried out up to different final temperatures with a fast heating rate (120 K/min) to study the evolution of the melting process and the liquid phase distribution in the specimen at temperature. In a second step, quenching dilatometer abortion experiments with slow heating rates (5, 10, and 20 K/min) were carried out to determine the influence of the heating rate on the melting reactions. Typically, transient liquid phase formation is indicated by expansion, as well known from the classical “copper swelling” [12]. Kissinger plots [13,14] were created from these experiments, to determine if the reaction mechanisms changed. In a last step, specimens were sintered under these optimized conditions. From these specimens CTT diagrams were recorded and metallographic sections were prepared to verify the method.

2. Materials and Methods

Powder mixes of about 500 mg were prepared from plain Fe base powder, 4 wt% MA and natural graphite with a total C-content (nominal) of 0.6 wt% or 0.75 wt% C (remark: all concentrations given are in wt%). The materials used in the present study are listed in Table 1.
The powders were blended for 40 min in a Turbula mixer and pressed immediately after blending to rectangular impact test specimens (55.4 × 10.4 × 6.0 mm3). Compacting was done at 600 MPa with die wall lubrication using Multical sizing fluid. The specimens for both the fast and slow heating rate experiments were first presintered at 800 °C in N2/H2 (90:10) atmosphere for 1 h to increase the mechanical stability while avoiding MA melting reactions. C-content and O-content of the presintered specimens were determined with an LECO TC 400 Oxygen/Nitrogen Determinator, and an LECO CS 230 Carbon/Sulfur Determinator. The standard used for O measurement was an iron powder Jernkontoret JK47 with 1.09 wt% O. The standard used for C measurement was a steel pin standard LECO 501–679 with 0.799 ± 0.011 wt% C. For the quenching dilatometer abortion experiments, parallelepiped pieces (4.5 × 10.4 × 6 mm3) were cut from the presintered specimens. A K-type thermocouple was directly spot welded on the cut samples. The contacted sample was placed in the quenching dilatometer (Linseis L78Q) between two corundum pushrods and pushed into the Cu coil. This is shown in Figure 1. The sample chamber was evacuated twice below 3 × 10⁻³ mbar and filled with dry N2 (5.0 quality). The same gas quality was used to quench the samples in the experiments. It is of utmost importance to use a dry, water free quenching gas to avoid decarburization.

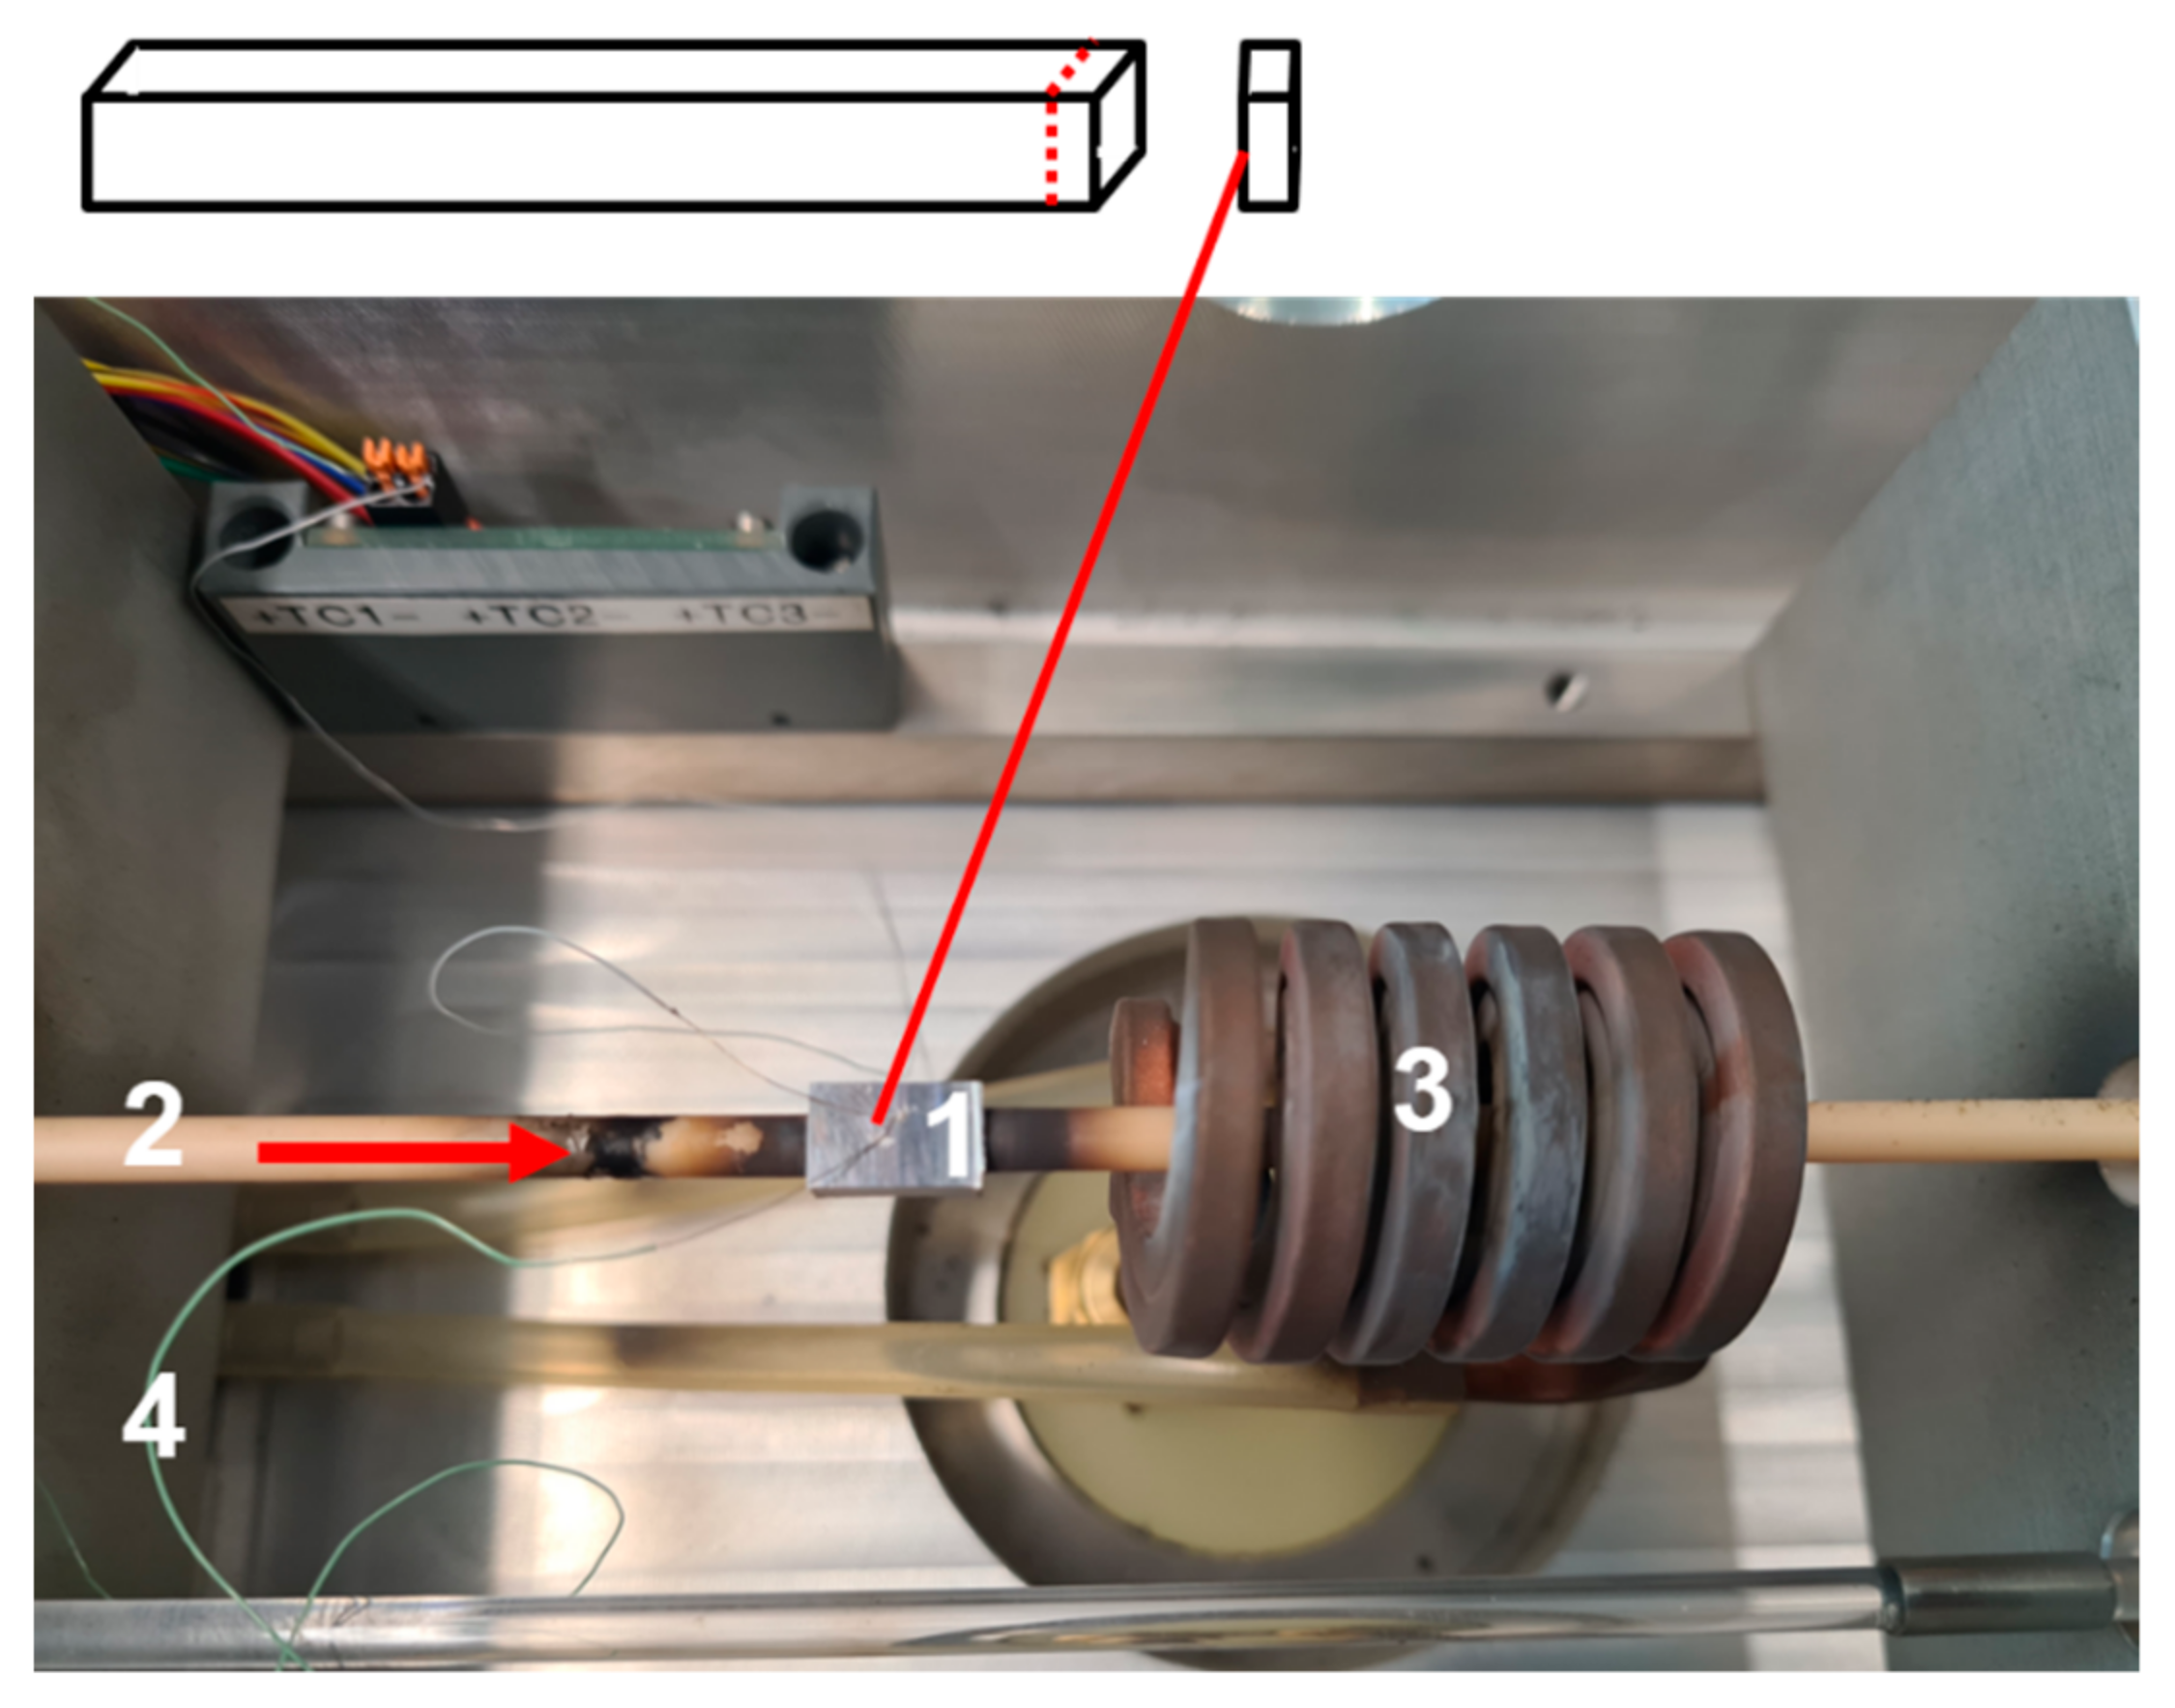
2.1. Evolution of the Melting Process at Fast Heating and Cooling Rates

The objective of these experiments was to analyze the melting process when the inter-diffusion of elements is hindered by rapid heating. The MAs are tailored to melt and form a transient liquid phase [10,15,16]. There are various possibilities how the transient liquid phase is formed and how it is distributed in a porous material [16,17].
The specimens were heated with 120 K/min to 5 different temperatures (1120 °C, 1140 °C, 1180 °C, 1250 °C, and 1300 °C) and quenched as fast as possible (~22.5 K/s). The samples were then cold embedded in epoxy resin to avoid additional temperature loads and investigated metallographically.

2.2. Influence of the Heating Rate on the Melting Process

In a first step, specimens were heated up with 5, 10, and 20 K/min to 1250 °C and quenched as fast as possible (~22.5 K/s). The experiments were used to study the effect of the heating rate on the evolution of the melting process. At lower heating rates the interdiffusion of elements between solid and transient liquid phase is promoted, and some interdiffusion occurs already before attaining the melting temperature, which effect reduces the amount of liquid phase formed [18]. The maximum temperature for this experiment was lowered from 1300 °C to 1250 °C because most of the samples were deformed at temperatures slightly above 1250 °C when using slow heating rates.
In a second step, 10 K/min was chosen as a heating rate, and the samples were heated to lower temperatures: 1120 °C and 1180 °C.
All samples were cold embedded and studied metallographically.
The liquid phase formation and distribution were monitored in quenching dilatometer experiments with defined heating up to different temperatures (1120 °C, 1180 °C, 1250 °C, 1300 °C) and subsequent quenching. From these measurements, through Kissinger plots, the relationship between a reaction peak and the heating rate can be described [13,19]. Usually this is done with peaks from DTA measurements [13,20,21]. The peak temperature is considered to be the temperature at which the reaction is strongest [22] In the present study, not DTA but dilatometric measurements were used for the Kissinger plots. Recent research, as shown in [23], follows the same approach. The peaks used are identified in the first deviation of the dilatometer curves recorded in the quenching dilatometer experiments. The main difference is that in a DTA curve the peak shows the maximum temperature difference, while the peak in a first deviation of a dilatometer curve shows the maximum deviation from the linear thermal expansion. Both peaks signal a material transformation either through energy consumption or differences in expansion. The main advantage using the dilatometer is the possibility to realize fast heating rates due to an inductive heating, which is not applicable for DTA. The peak temperature in the first deviation of the dilatometer curve is as well considered to be the temperature at which the reaction is strongest. It is referred to as Tmax. “Tmax is by definition a function of the heating rate only” [22]. For Kissinger Plots, it has to be assumed that the melting reaction of the MA obeys a first-order law [13,19,22]. In this case, at constant temperature Equation (1) can be described.
x t T = k T 1 x
Equation (1). First-order law of reactions, with x as fraction of material molten, kT as constant and t as time [13].
kT depends on the temperature T and is given by an Arrhenius equation Equation (2) [13].
k T = A e E R T  
Equation (2). Arrhenius equation, R gas constant J m o l   K , T temperature (K), A is a constant describing the probability that a molecule having energy E will participate in a reaction (“frequency factor”), E activation energy (J).
The total reaction rate can be expressed as Equation (3)
d x d t = A 1 x e E R T
Equation (3). Total reaction rate, holds for any value of T as long as T and x are determined at the same time [13].
Equation (3) has its maximum at Tmax, the peak temperature. If the reaction rate is maximum, the derivative of Equation (3) with respect to time is 0. After solving Equation (3) for d d t d x d t   it can be written for Tmax shown in Equation (4) [13].
A e E R T m a x = E R T m a x 2 d T d t
Equation (4) for maximum value of d x d t   at Tmax [13]
By transforming the formula of Equation (4), the dependence of the heating rate d T d t = Φ can be shown:
l n A + E R T m a x = l n E R T m a x 2 d T d t
Equation (5) Solving the e-function by logarithmising Equation (4).
E R T m a x = l n E R A + l n 1 T m a x 2 d T d t | d d 1 T m a x
Equation (6) Deriving the function to 1 T .
E R = d ( l n Φ T m a x 2 ) d 1 T m a x
Equation (7) Dependency of the peak temperature Tmax and the heating rate represented via an equation for the energy.
For a Kissinger plot, l n Φ T m a x 2 (y-axis) is plotted against 1 T m a x (x-axis). The data points in these plots are supposed to follow a straight line if the peak temperatures from the same reactions are plotted. From the gradient of the regression, E (activation energy) and A (Arrhenius constant) can be determined. The most important information from these plots for the present study is how the reaction peaks are affected by the heating rate and if the reaction mechanism changes with the heating rate, which would result in a non-linear regression [13].

2.3. Hardenability of Samples Sintered at 1180 °C with 10 K/min Heating Rate

The sintering conditions of temperature and heating rate were selected from previous experiments. The purpose was to promote the distribution of alloying elements while using industrially meaningful heating rates. For these experiments, new green Charpy samples were produced similar to those used for the quenching experiments. They were placed in an electrically heated push type furnace with a gas-tight superalloy retort operated in N2/H2 (90:10) atmosphere, heated at 10 K/min from room temperature up to 1180 °C and held for 30 min. After the isothermal step the samples were pushed into a water-cooled exit zone (linearized cooling rate ~0.5 K/s). Parallelepiped pieces were cut from the as sintered Charpy specimens (4.5 × 10.4 × 6 mm3) to generate CTT diagrams.
The sintered samples were contacted and placed in the quenching dilatometer as described for the abortion experiments. The samples were austenitised at 1100 °C and held for 300 s before being cooled with defined rate. In total 15 runs with 14 different cooling rates (91.7, 40.7, 22.4, 15.1, 11.2, 9.0, 6.4, 6.1, 5.0, 3.0, 1.5, 1.0, 0.8, 0.5 K/s) were carried out to generate the CTT diagram. It was possible to run all measurements on one sample since the porosity of the PM material inhibits grain growth. Dry high purity N2 (5.0 quality) was used as quenching gas, to avoid decarburization. The last and 15th run was cooled again at 3 K/s cooling rate, a standard cooling rate in the ferrous PM industry, for metallography and hardness measurements. All samples were cold embedded in epoxy resin to avoid tempering effects by hot embedding. For metallography the embedded samples were ground, diamond polished, and etched with 1% Nital. Apparent hardness (HV 30) and micro hardness (HV 0.1) were measured on the samples from the 10 K/min sintering experiments and the hardened samples from the CTT measurements.

3. Results

It has to be noted first that the C content in PM steels is much more crucial than in ingot steels. Since carbon is a reducing agent, the C content changes during the sintering process, C being consumed for carbothermal reduction of the “natural” oxide contained by the metal powders. The C content influences numerous mechanisms and properties such as e.g., the melting and distribution behavior of the MA, the sintering activity and the hardenability, etc. It is considered to be of utmost importance to keep the changes of the C content tracked and controlled. Therefore, in this study the material is always given with both the nominal C content and the measured (combined) C-content, written in brackets behind. Table 2 shows the results of the C- and O-LECO measurements for the materials used in the study.
The most common reducing agents for ferrous PM-materials are H2 provided via the sintering atmosphere and C, which is usually added to the powder mix. The reducing reactions are affected by alloying elements, especially if the alloying elements show a higher oxygen affinity than Fe [24,25]. From Table 2 it is evident that obtaining a Cr alloyed PM-steel with relatively low O-content can be achieved. The MA alloying route is therefore one promising option to achieve the O values already at 1180 °C.

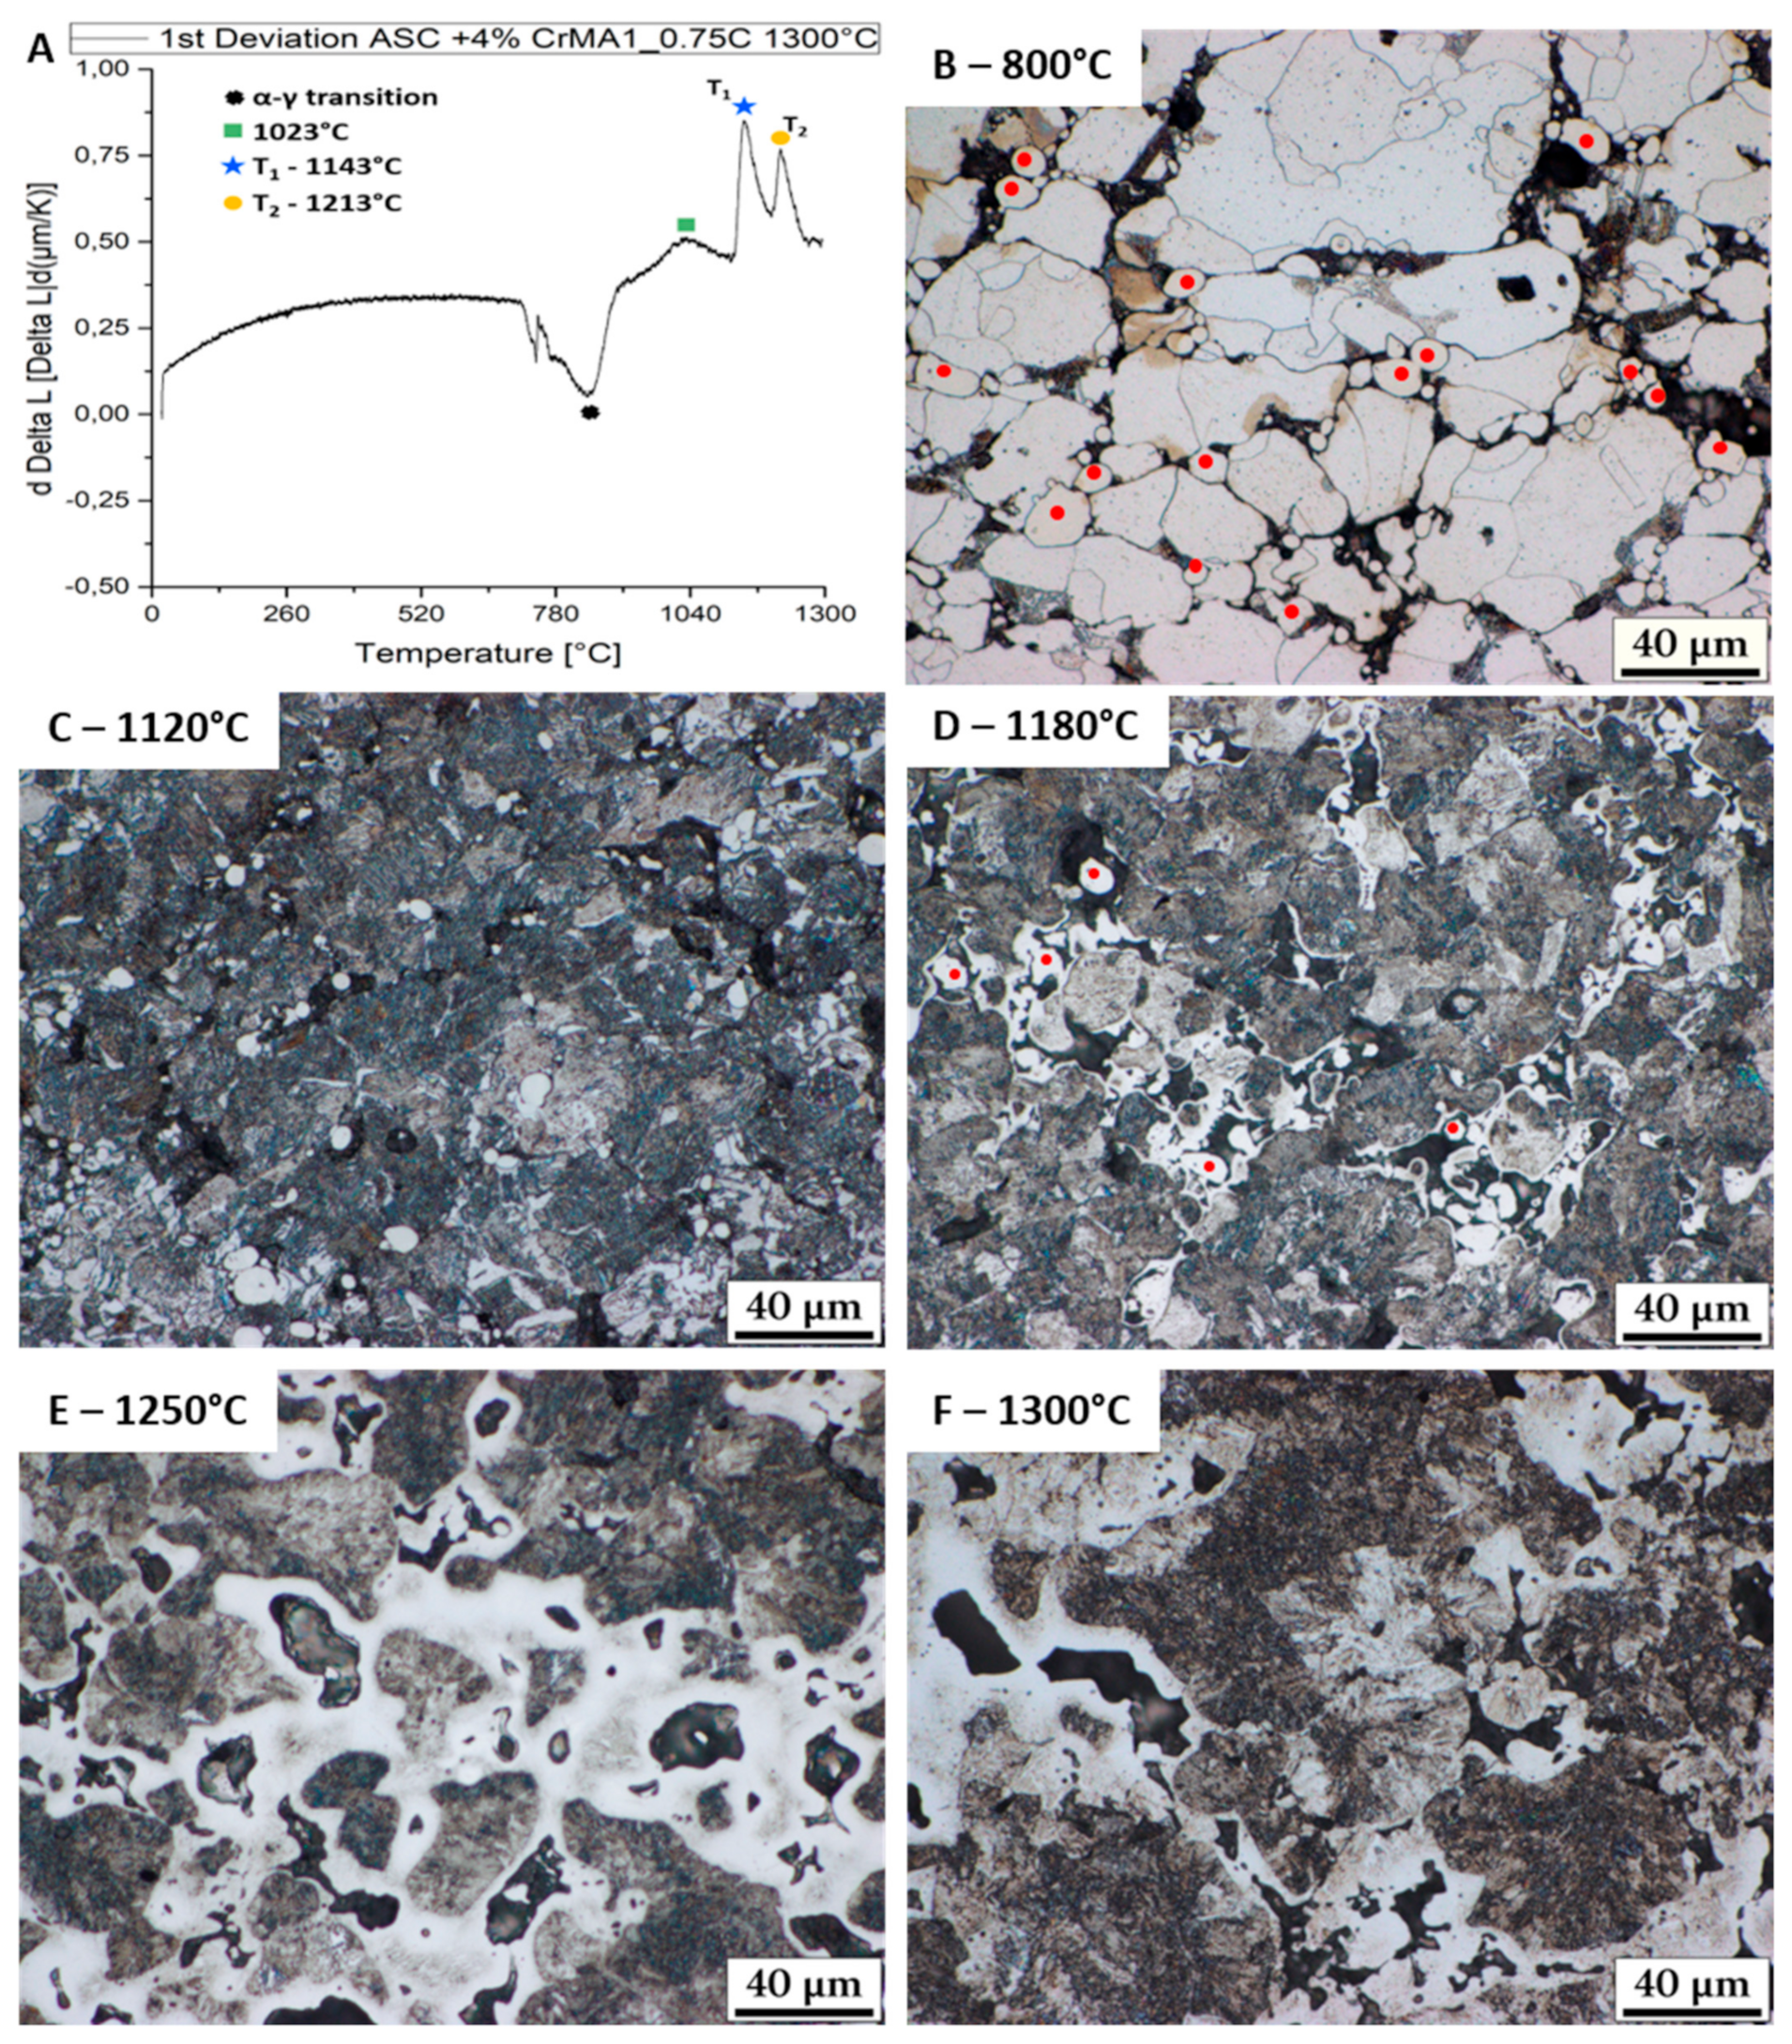
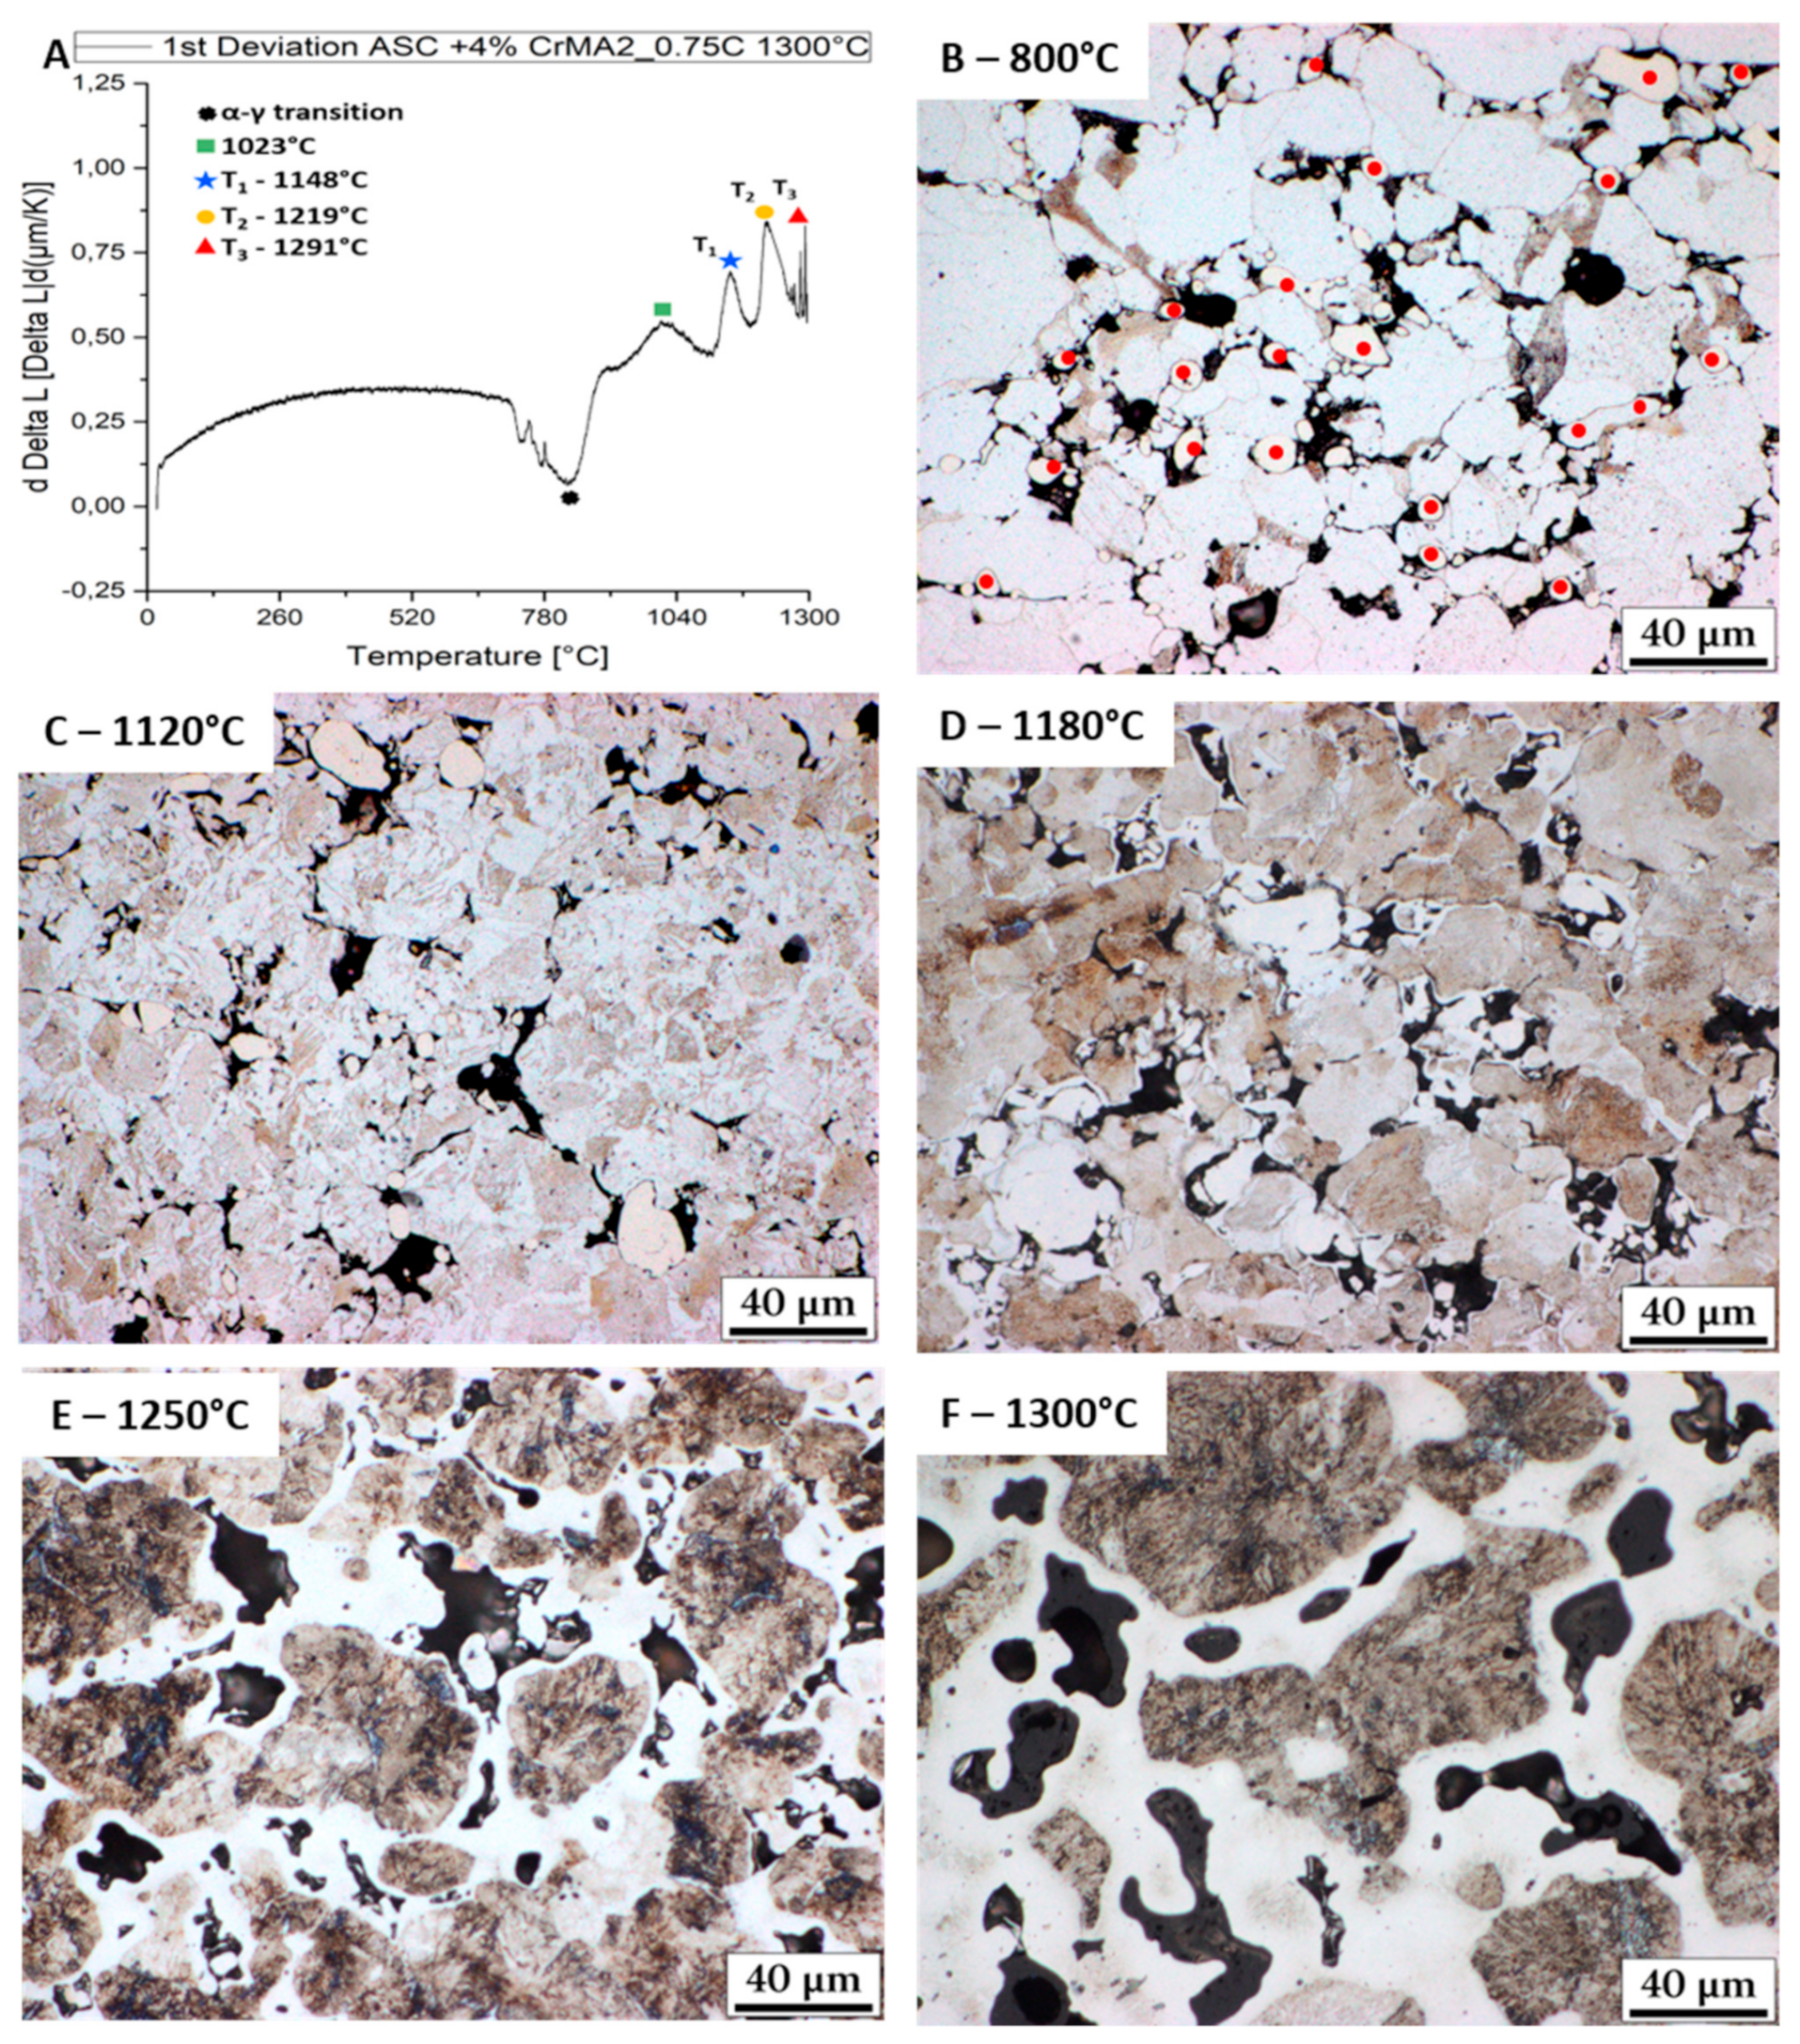
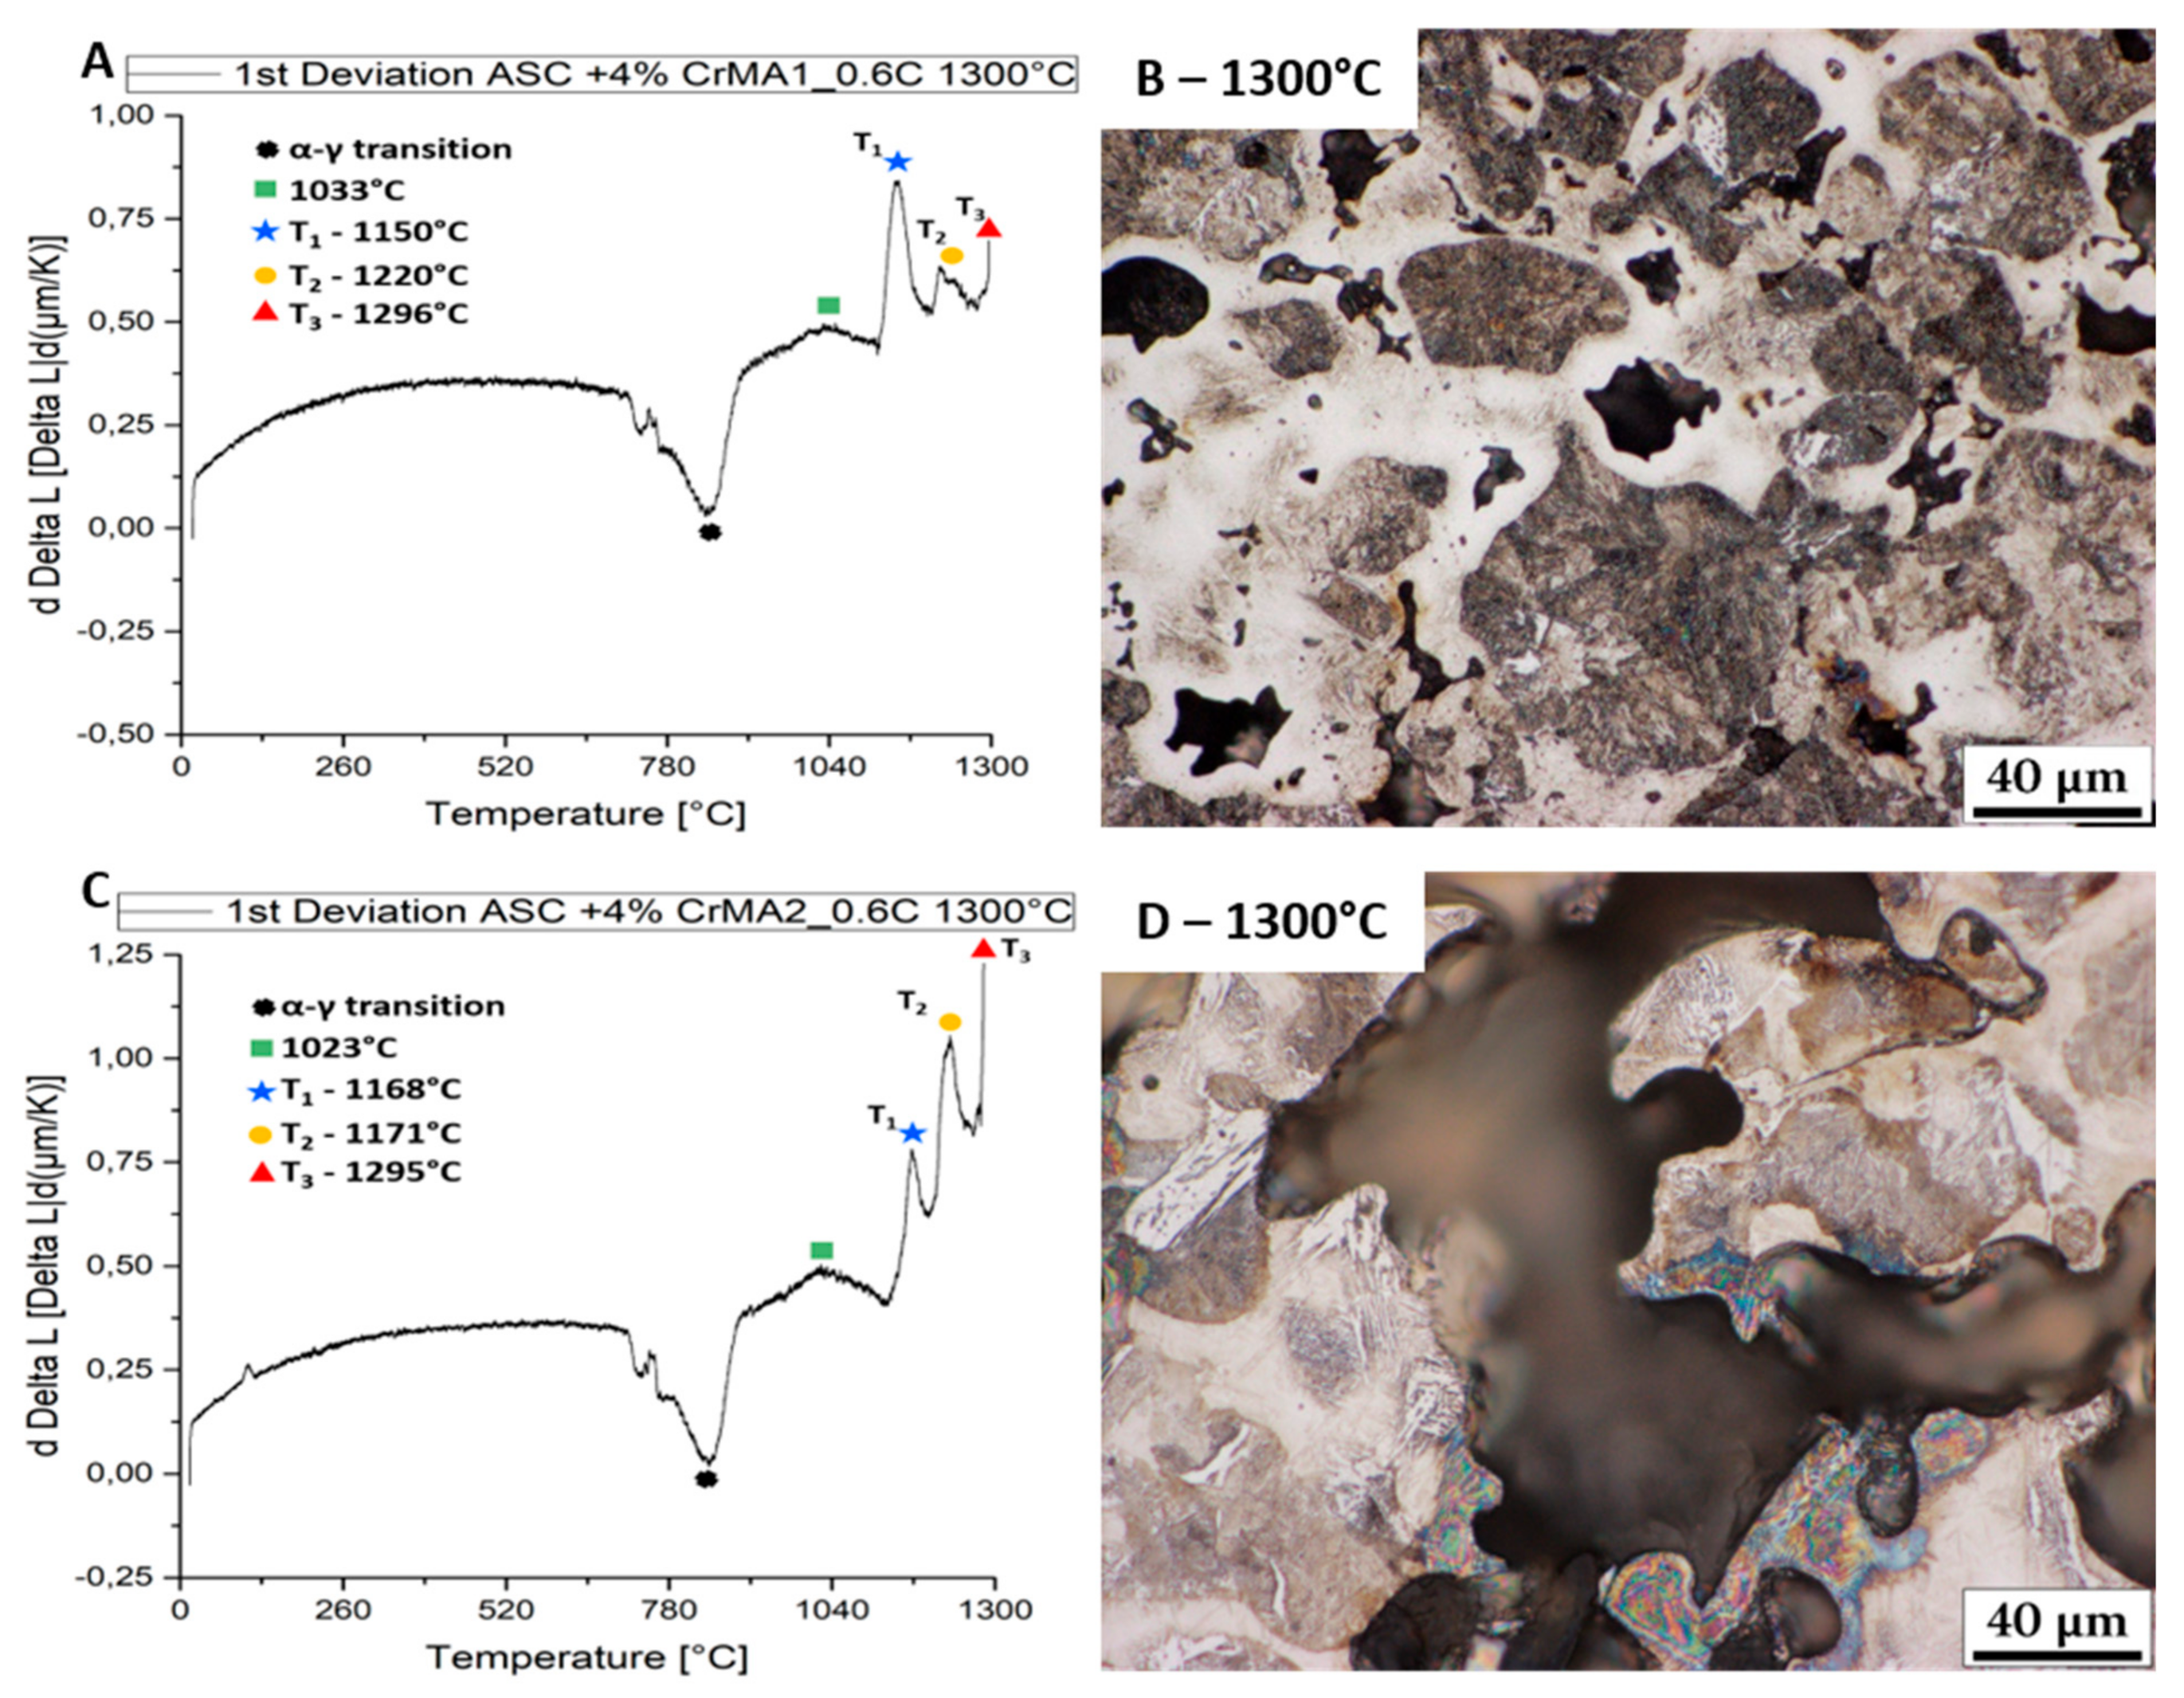
3.1. Evolution of the Melting Process at Fast Heating Rates

The evolution of the melting process of the MA was first studied using fast heating rates, in order to minimize the effect of the interaction between the MA and the other components of the powder mix (base powder and graphite), thus obtaining the maximum possible amount of liquid phase. Samples were heated at increasing temperatures at a rate of 120 K/min and then cooled down as fast as possible. Figure 2 and Figure 3 shows the 1st deviation of the heating curve, as well as metallographic sections of specimens ASC + 4% CrMA1_0.75C (Figure 2) and ASC + 4% CrMA1_0.75C (Figure 3), quenched from different temperatures. The images in Figure 2B and Figure 3B correspond to the pre-sintered material (the starting state prior to the quenching experiments). In these images, the red dots mark the MA particles, which gives an idea of the MA distribution.
As can be seen in Figure 2A and Figure 3A, for both materials studied it is evident that after the α-γ transition (contraction), different additional reactions can be identified. With CrMA1, three (expansion) reactions are highlighted in the image. The first reaction (green) has its maximum at 1023 °C. As visible in Figure 2C, at this temperature, diffusion processes have taken place (at least the diffusion of C is clearly evidenced in the image), but no liquid phase formation seems to be attained at this temperature. The first liquid phase formation takes place at temperatures around 1143 °C (blue). Figure 2D shows the microstructure at 1180 °C (above the reaction at 1143 °C (blue), and evidences that a first melting reaction has already taken place. Solidified liquid phase is already seaming the base powder particles alongside the internal porosity, but MA traces can still be identified (marked with red dots in Figure 2D). Heating above the reaction peak at 1213 °C (orange) intensifies the liquid phase formation. No MA particles can be identified anymore at this stage, and the liquid phase has spread through the interconnected porosity, wetting the base powder.
Figure 3 shows the 1st deviation of the heating curve and metallographic sections of ASC + 4% CrMA2_0.75C quenched from different temperatures. The reactions shown in Figure 3A for CrMA2 are quite similar to those in Figure 2A for CrMA1, although CrMA2 contains more alloying elements. There is one additional reaction peak at 1291 °C (red) for CrMA2 which is related to a third melting reaction, going along with the formation of huge secondary porosity. This can be seen in Figure 3F. Even though the material was held above the reaction peak temperature only for a short time, a clear difference between Figure 3E and Figure 3F, which is akin to Figure 2E and Figure 2F, could be observed.
Figure 4 shows both ASC + 4% CrMA1 and ASC + 4% CrMA2 with lower nominal C content. This has mainly an effect on the temperature of the fourth reaction (red). While for ASC + 4% CrMA1_0.6C a fourth reaction can be identified at 1296 °C, shown in Figure 4A, the same reaction occurs at 1277 °C for ASC + 4% CrMA2_0.6C, as shown in Figure 4C. This reaction can be correlated with a third formation of liquid phase causing huge secondary porosity, most evident in Figure 4D where the reaction had more time to take place. It is clear that this last reaction must be avoided if a proper material is to be achieved.

3.2. Influence of the Heating Rate on the Melting Process (5, 10, 20 K/min)

In this part of the study, samples were heated to 1250 °C with different heating rates. Figure 5 shows the 1st deviation of the heating curve from ASC + 4%CrMA1_0.6C measured with 120 K/min.
Figure 5 is designed to show by example how the peak temperatures Tmax were determined for the Kissinger plots. The first reaction (contraction) observed is the α-γ transition, followed by an expansion reaction where no liquid phase could be observed in the metallographic section. It is most likely a diffusion reaction. In addition to that, three different melting reactions can be observed. The intensity of the peaks is influenced by the MA chosen, the C-content and the heating rate, but can be consistently identified in all samples. The temperatures of Tmax for all materials and heating rates are listed in Table 3. The Kissinger plots made from these Tmax values are shown in Figure 6. It has to be noted that the reaction peak T2 is most likely a double peak. This finding is as well consistent for all experiments.
Figure 6 clearly shows that there is a linear relationship between the peaks of the different reactions in all materials. Furthermore, it is evident that there is no huge difference between CrMA1 and CrMA2. For CrMA1_0.75C the 3rd reaction could be determined with 5 K/min heating rate only, while for CrMA1_0.6C it can be found for all heating rates, shifted as shown in Figure 6A. From these correlations it can be assumed that the three reactions identified are the most meaningful ones for these materials. Identifying these reactions at each heating rate makes it possible to select an optimum combination of heating rate and sintering temperature.

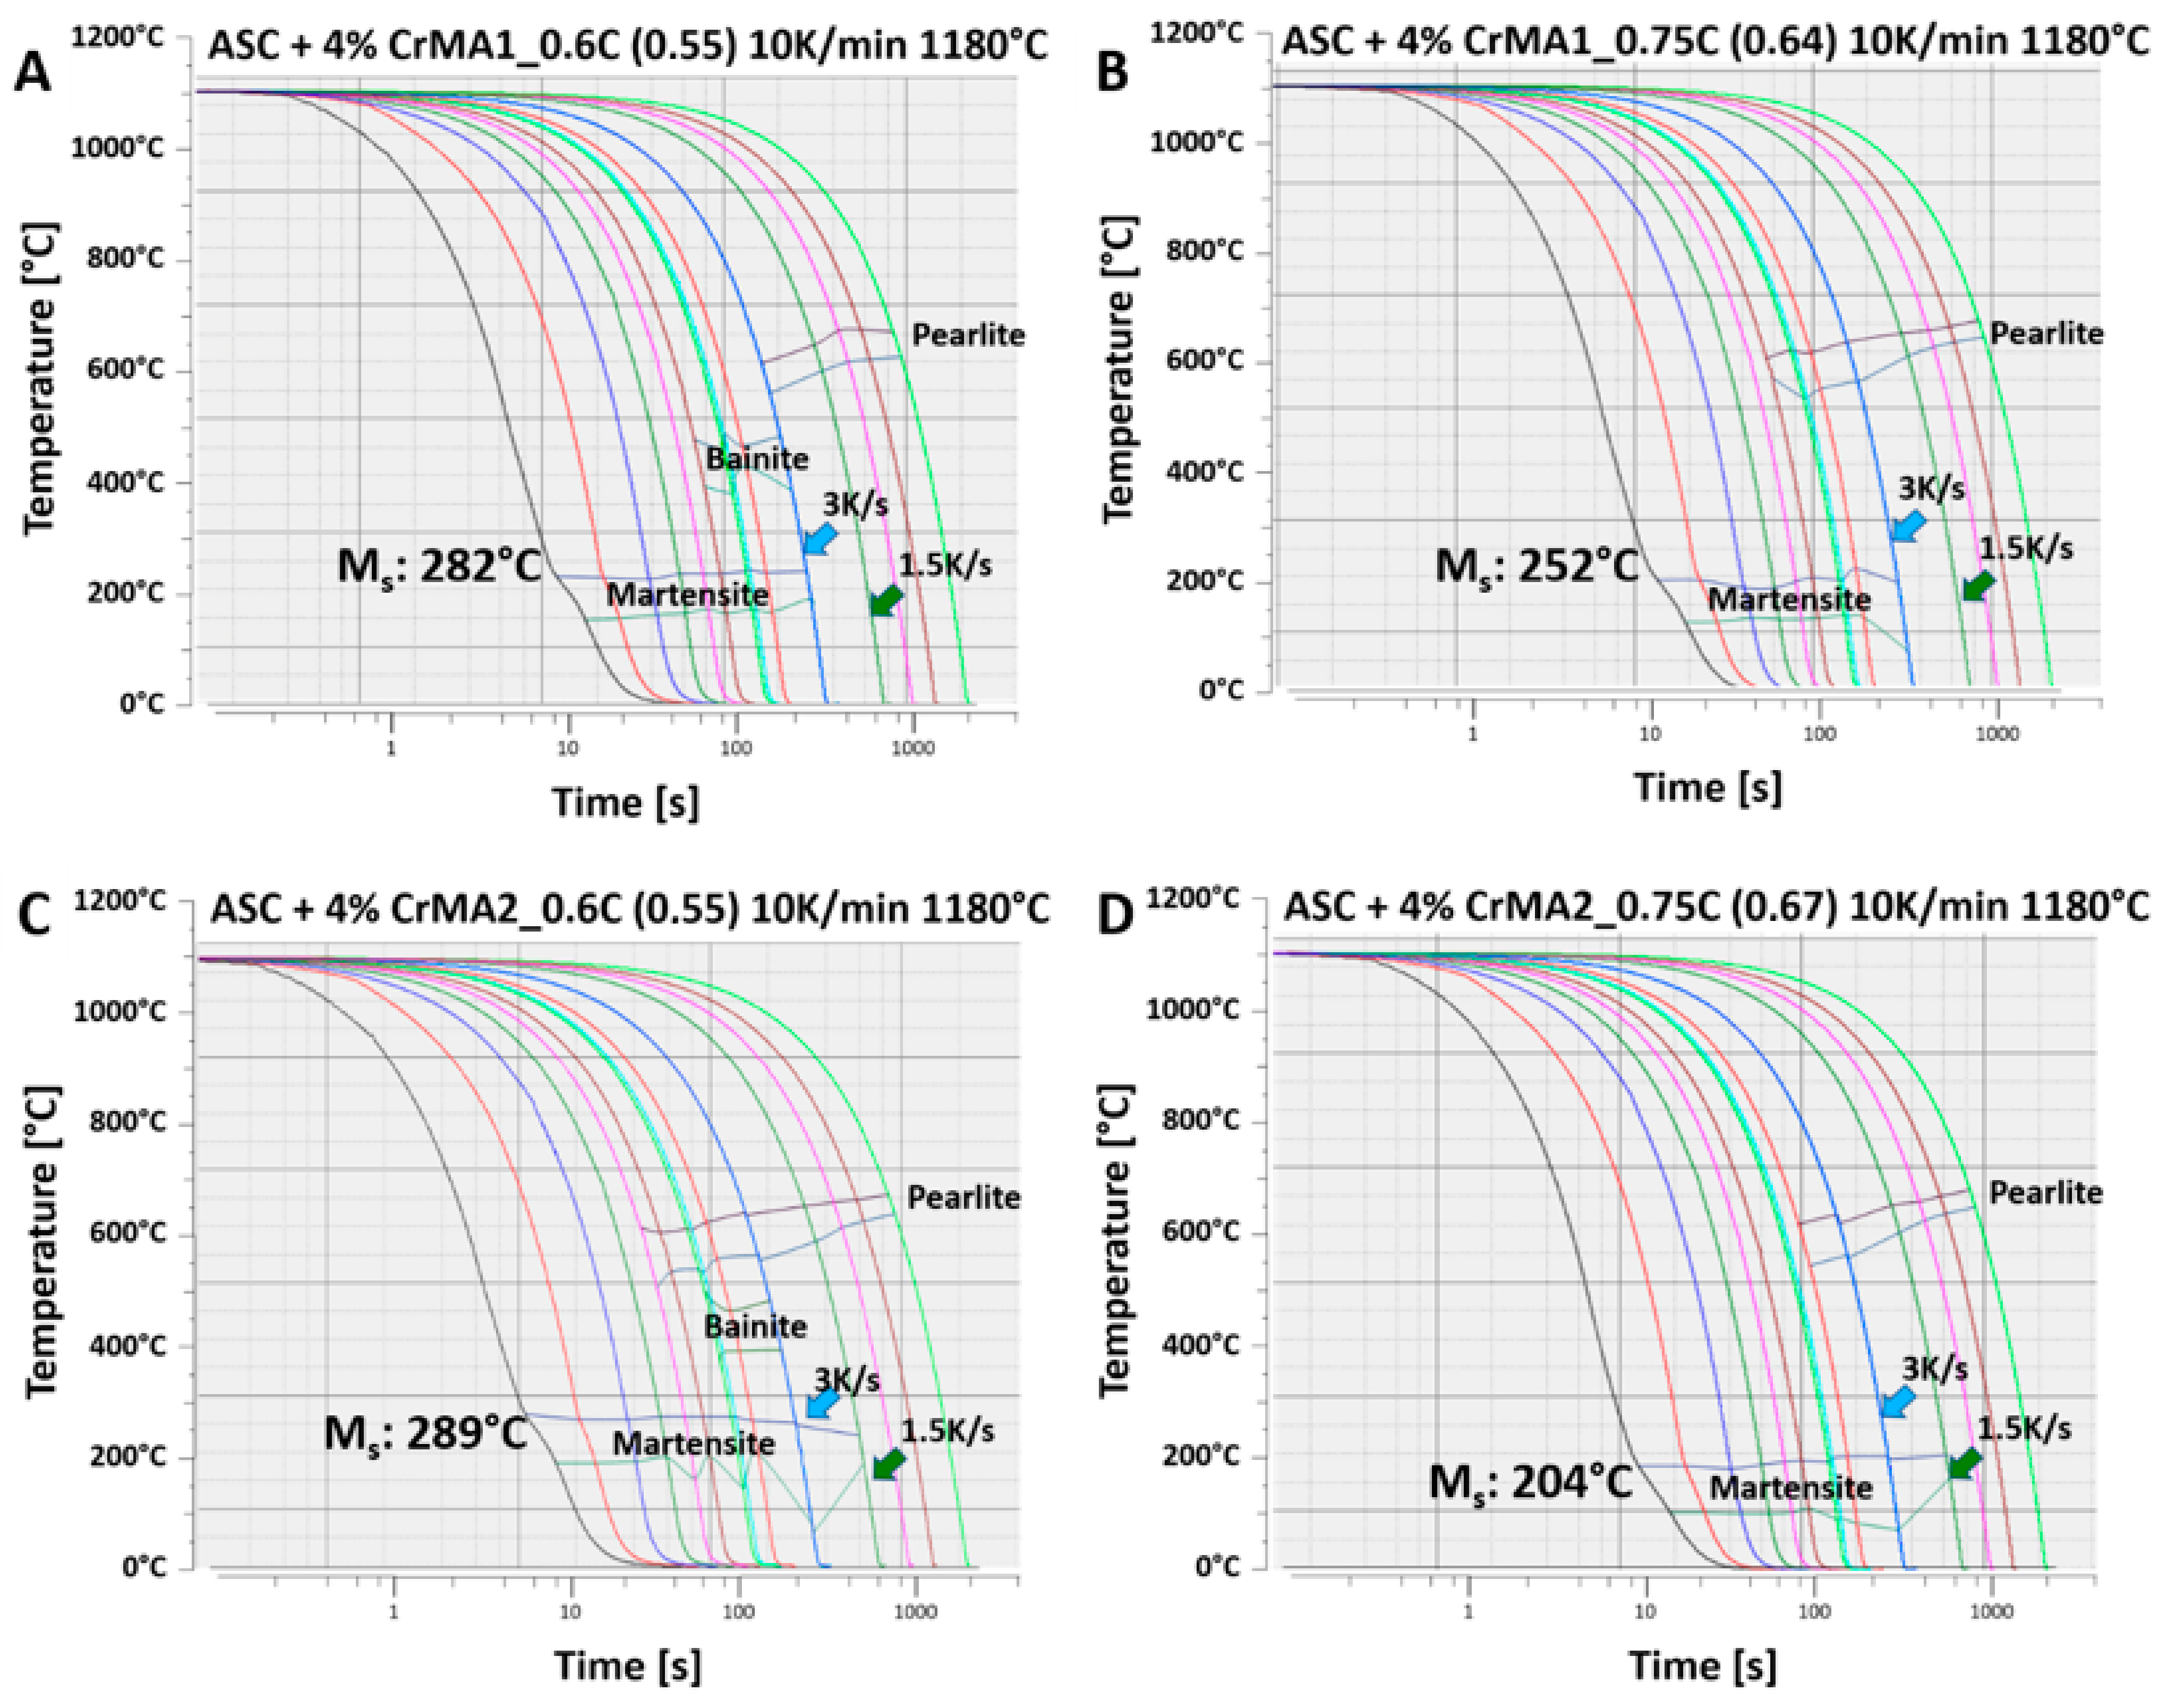
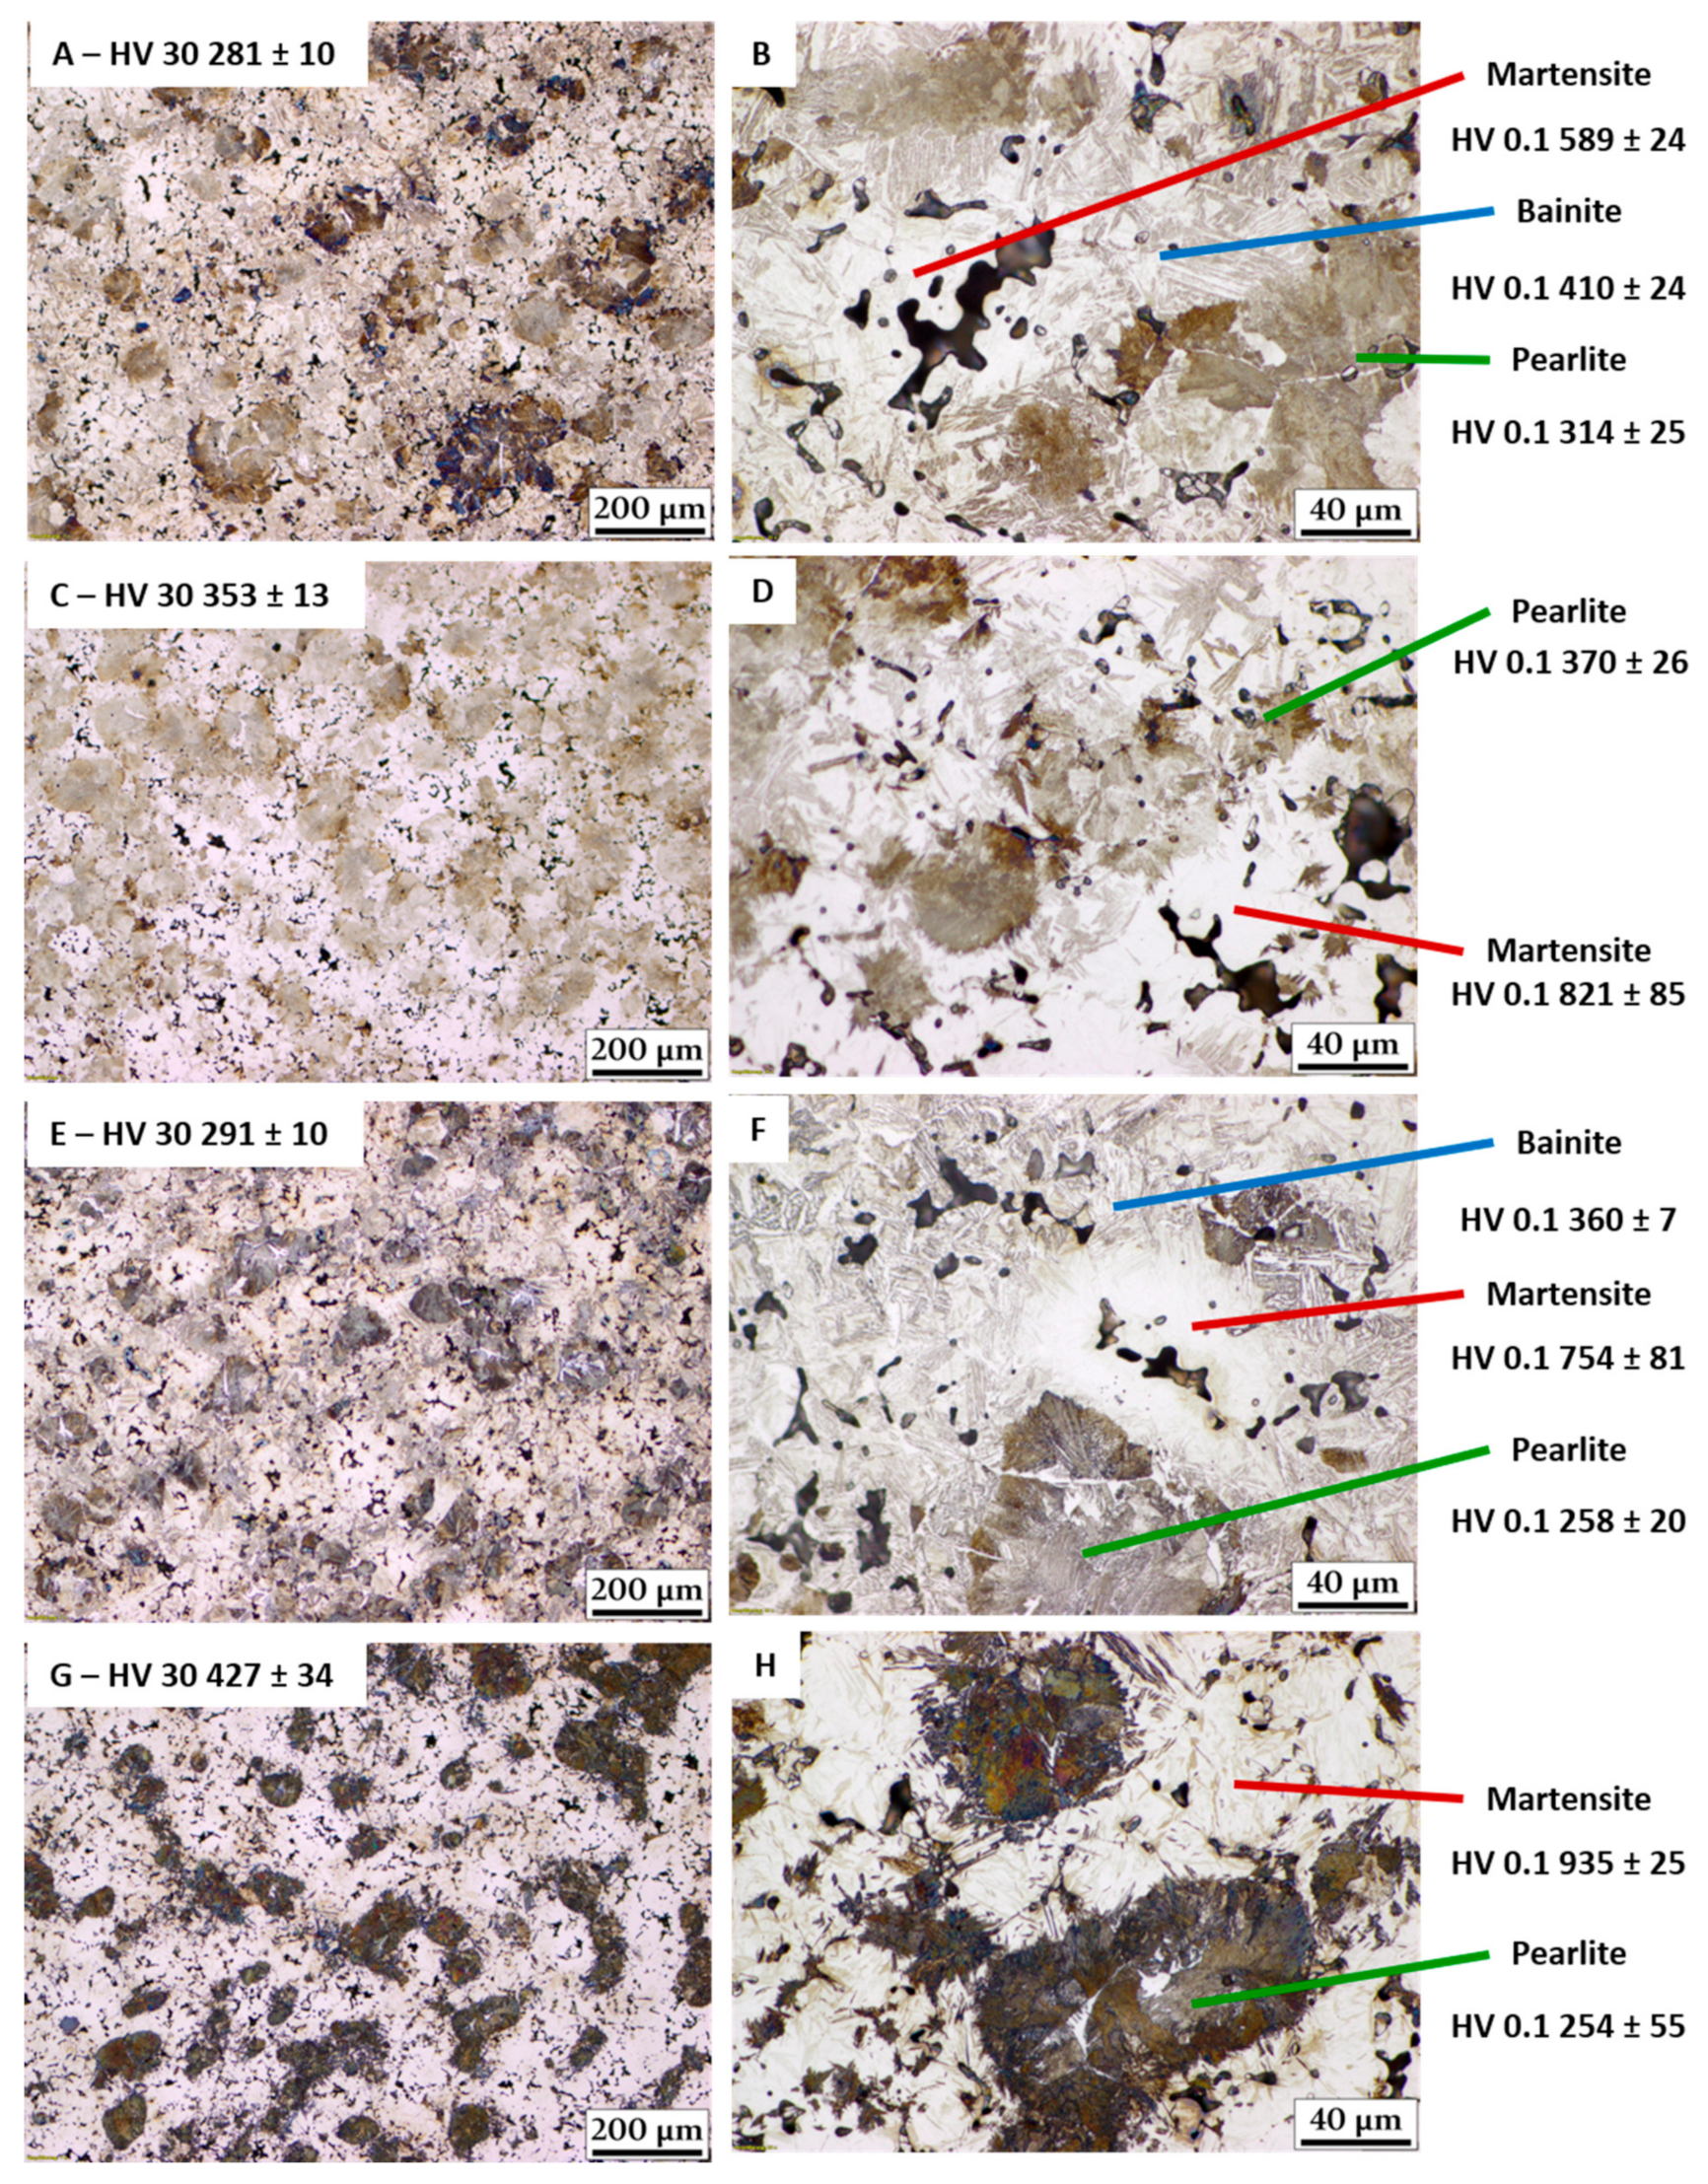
3.3. Hardenability of Samples Sintered at 1180 °C with 10 K/min Heating Rate

The conditions for this sample series were defined as follows: The linear regression of the Kissinger plots indicates that no change in the reaction mechanism is to be expected within the heating rate variation. Thus, it is possible to choose 10 K/min, a standard heating rate in the industry, for the proof of concept. The sintering temperature was chosen from the T2 and T3 temperatures. It is evident from Table 3 that at 10 K/min heating rate, reaction 2 will take place for all compositions at 1180 °C, but reaction 3 should not take place at this temperature for any of them. Figure 7 shows that for all materials heated at 10 K/min the liquid phase formation and distribution are already in an advanced stage at this temperature. It must be remarked here that these samples were immediately quenched after reaching 1180 °C, i.e., no isothermal hold was applied (as would be standard in industrial sintering).
Figure 8 shows the metallographic sections of the as-sintered samples heated with 10 K/min to 1180 °C, held isothermally for 30 min and cooled at ~0.5 K/s, which is comparable to industrial sintering.
There is no big difference between the as sintered materials. All of the materials show a pearlitic-ferritic microstructure in this state. From the apparent hardness (HV 30) it stands out clearly that the materials are macroscopically homogeneous, as the standard deviation out of 10 measurements is rather small. In none of the sections, coarse secondary porosity was observed, which is considered as a proof that the 3rd reaction could be avoided. The images suggest that the liquid phase formed in the first two reactions could spread and distribute the alloying elements through the interconnected porosity of the material.
From these materials, in a next step, CCT diagrams were prepared. These are shown in Figure 9.
It is evident from Figure 9A,C that at a cooling rate of 3 K/s, for both materials with lower C content a mixed martensitic, bainitic, and pearlitic microstructure is to be expected. With higher C content no bainitic phase field can be identified any more in the cooling curves. CrMA2 contains more alloying elements than CrMA1. This has an effect on the martensitic phase field, which extends down to cooling rates of 1.5 K/s for both materials prepared with CrMA2 while the martensitic phase field ends at a cooling rate of 3 K/s for materials containing CrMA1. The martensite start (Ms) temperature is affected by the C content and the alloying elements distributed in the material. In a previous study [26], the measured Ms temperatures were shown to be in good agreement with Steven and Haynes’ calculations [27] for Ms. This means that if deviations between the measured and the calculated Ms temperature occur, remaining MA particles might be an explanation for this case, since they “trap” alloying elements and C away from the materials matrix which are subsequently not available for hardening. Table 4 shows the difference between calculated and measured Ms temperatures.
Although the 3rd melting reaction was avoided, the “loss” of alloying elements due to the unmolten remains seems to be insignificant. The metallographic sections of the material cooled at 3 K/s with pure N2 (5.0) are shown in Figure 10; no traces of undissolved MA particles are visible, which corroborates the above observation.
It is observed that, as expected, in the low C specimens (Figure 10B,E), three different microstructures, according to the CCT diagrams in Figure 9, can be identified. Around the pores, mostly martensitic areas can be identified. The cores of the former base powder particle remain pearlitic as C can diffuse into them, but there is not enough alloying element present there to form a martensitic or bainitic microstructure. Between the martensitic and pearlitic areas, bainitic microstructures can be identified. These areas are considered to be insufficiently alloyed to form a martensitic microstructure [28] but already contain some alloying elements from the MA. Both materials with higher C-content (Figure 10D,H) show a pearlitic-martensitic microstructure. This is as well in good agreement with the CCT diagrams. In some areas, bainitic needles can be identified around the pearlitic regions, however at too low volume to be discernible in the CCT diagrams. Figure 10 A,C,E,G show how the different microstructures are distributed in the material. While Figure 10A,E shows a pearlitic-bainitic network with some martensitic areas, the higher C materials represented in Figure 10C,G form already a martensitic network with pearlitic areas. The pearlitic areas are considered as insufficiently alloyed cores of former base powder particles. Nonetheless it can be seen that around the (interconnected) porosity the material is alloyed. This is taken as proof that the MA are melting and distributing the alloying elements via the PM-material porosity.

4. Conclusions

  • Two different materials, plain iron powder ASC + 4% masteralloy CrMA1 and ASC + 4%CrMA2 with two different C-contents each (0.6C) and (0.75C) were studied.
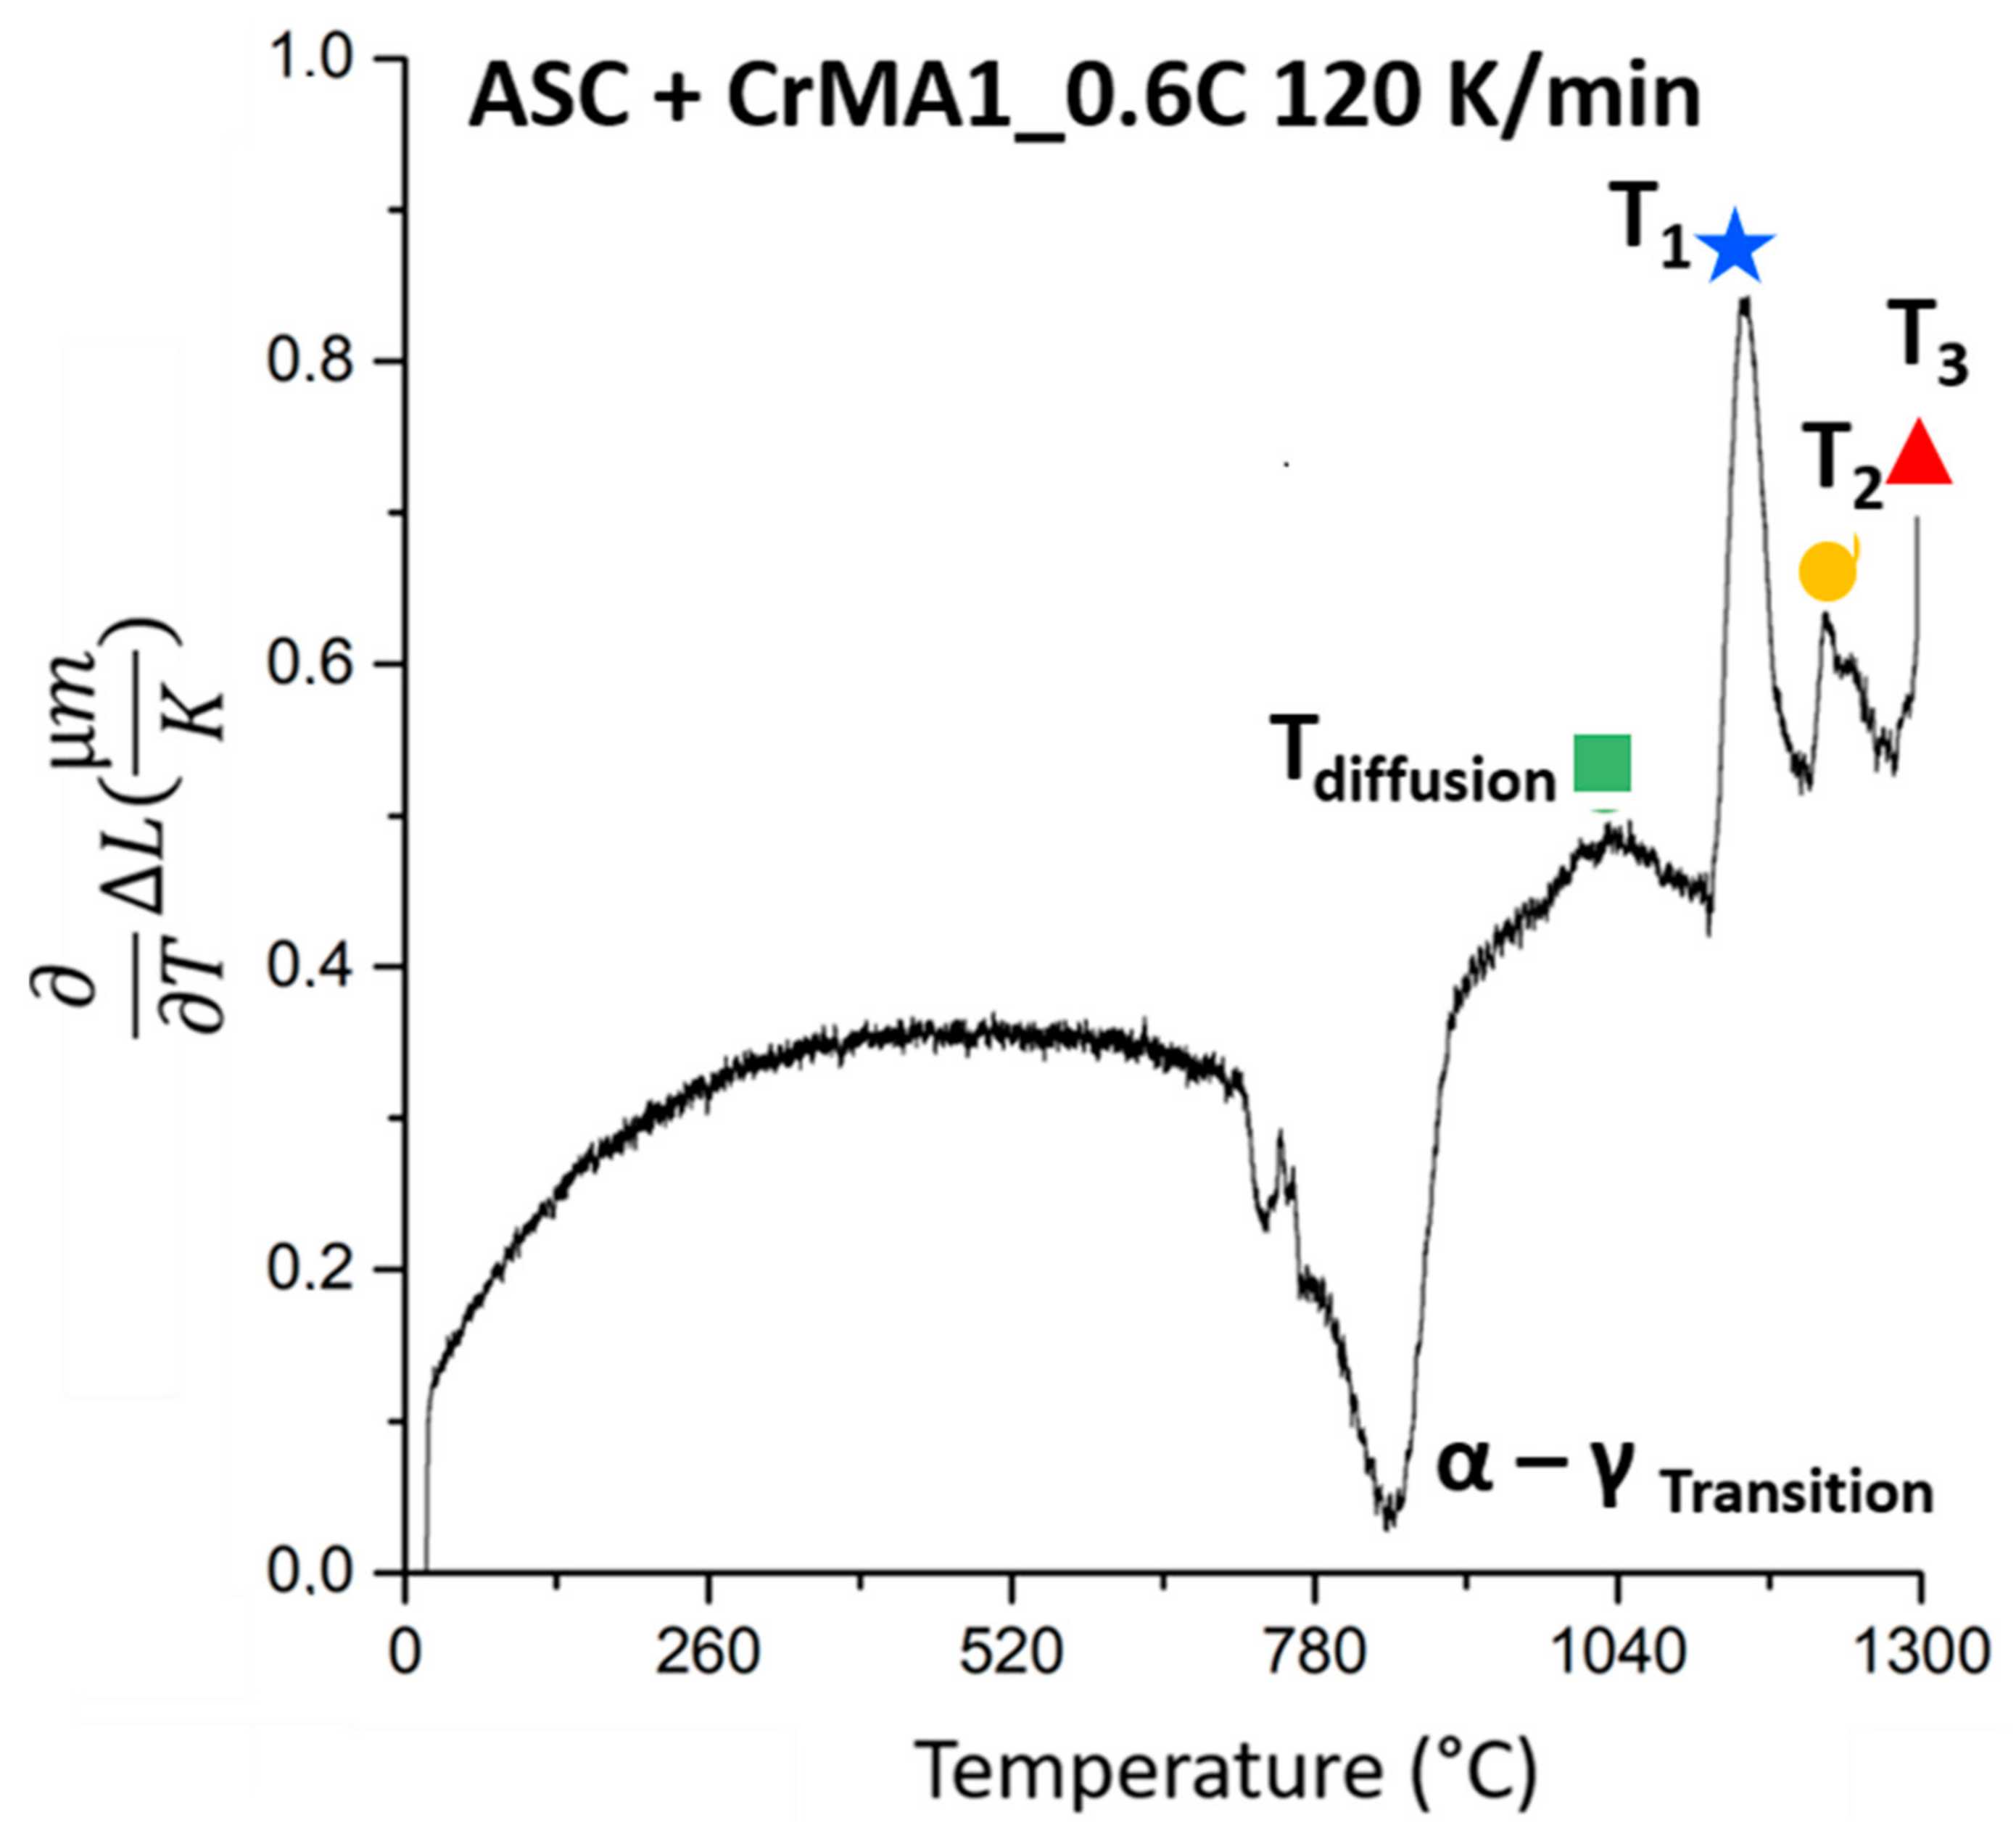
  • Quenching dilatometer experiments with fast heating (120 K/min) up to 1300 °C and immediate quenching showed three different melting reactions of the MA’s.
  • Further fast heating rate (120 K/min) experiments stopped at different temperatures helped identify the effect of the reactions. The first two melting reactions were considered to be beneficial for the material. The 3rd reaction was identified as causing huge secondary porosity and is to be avoided.
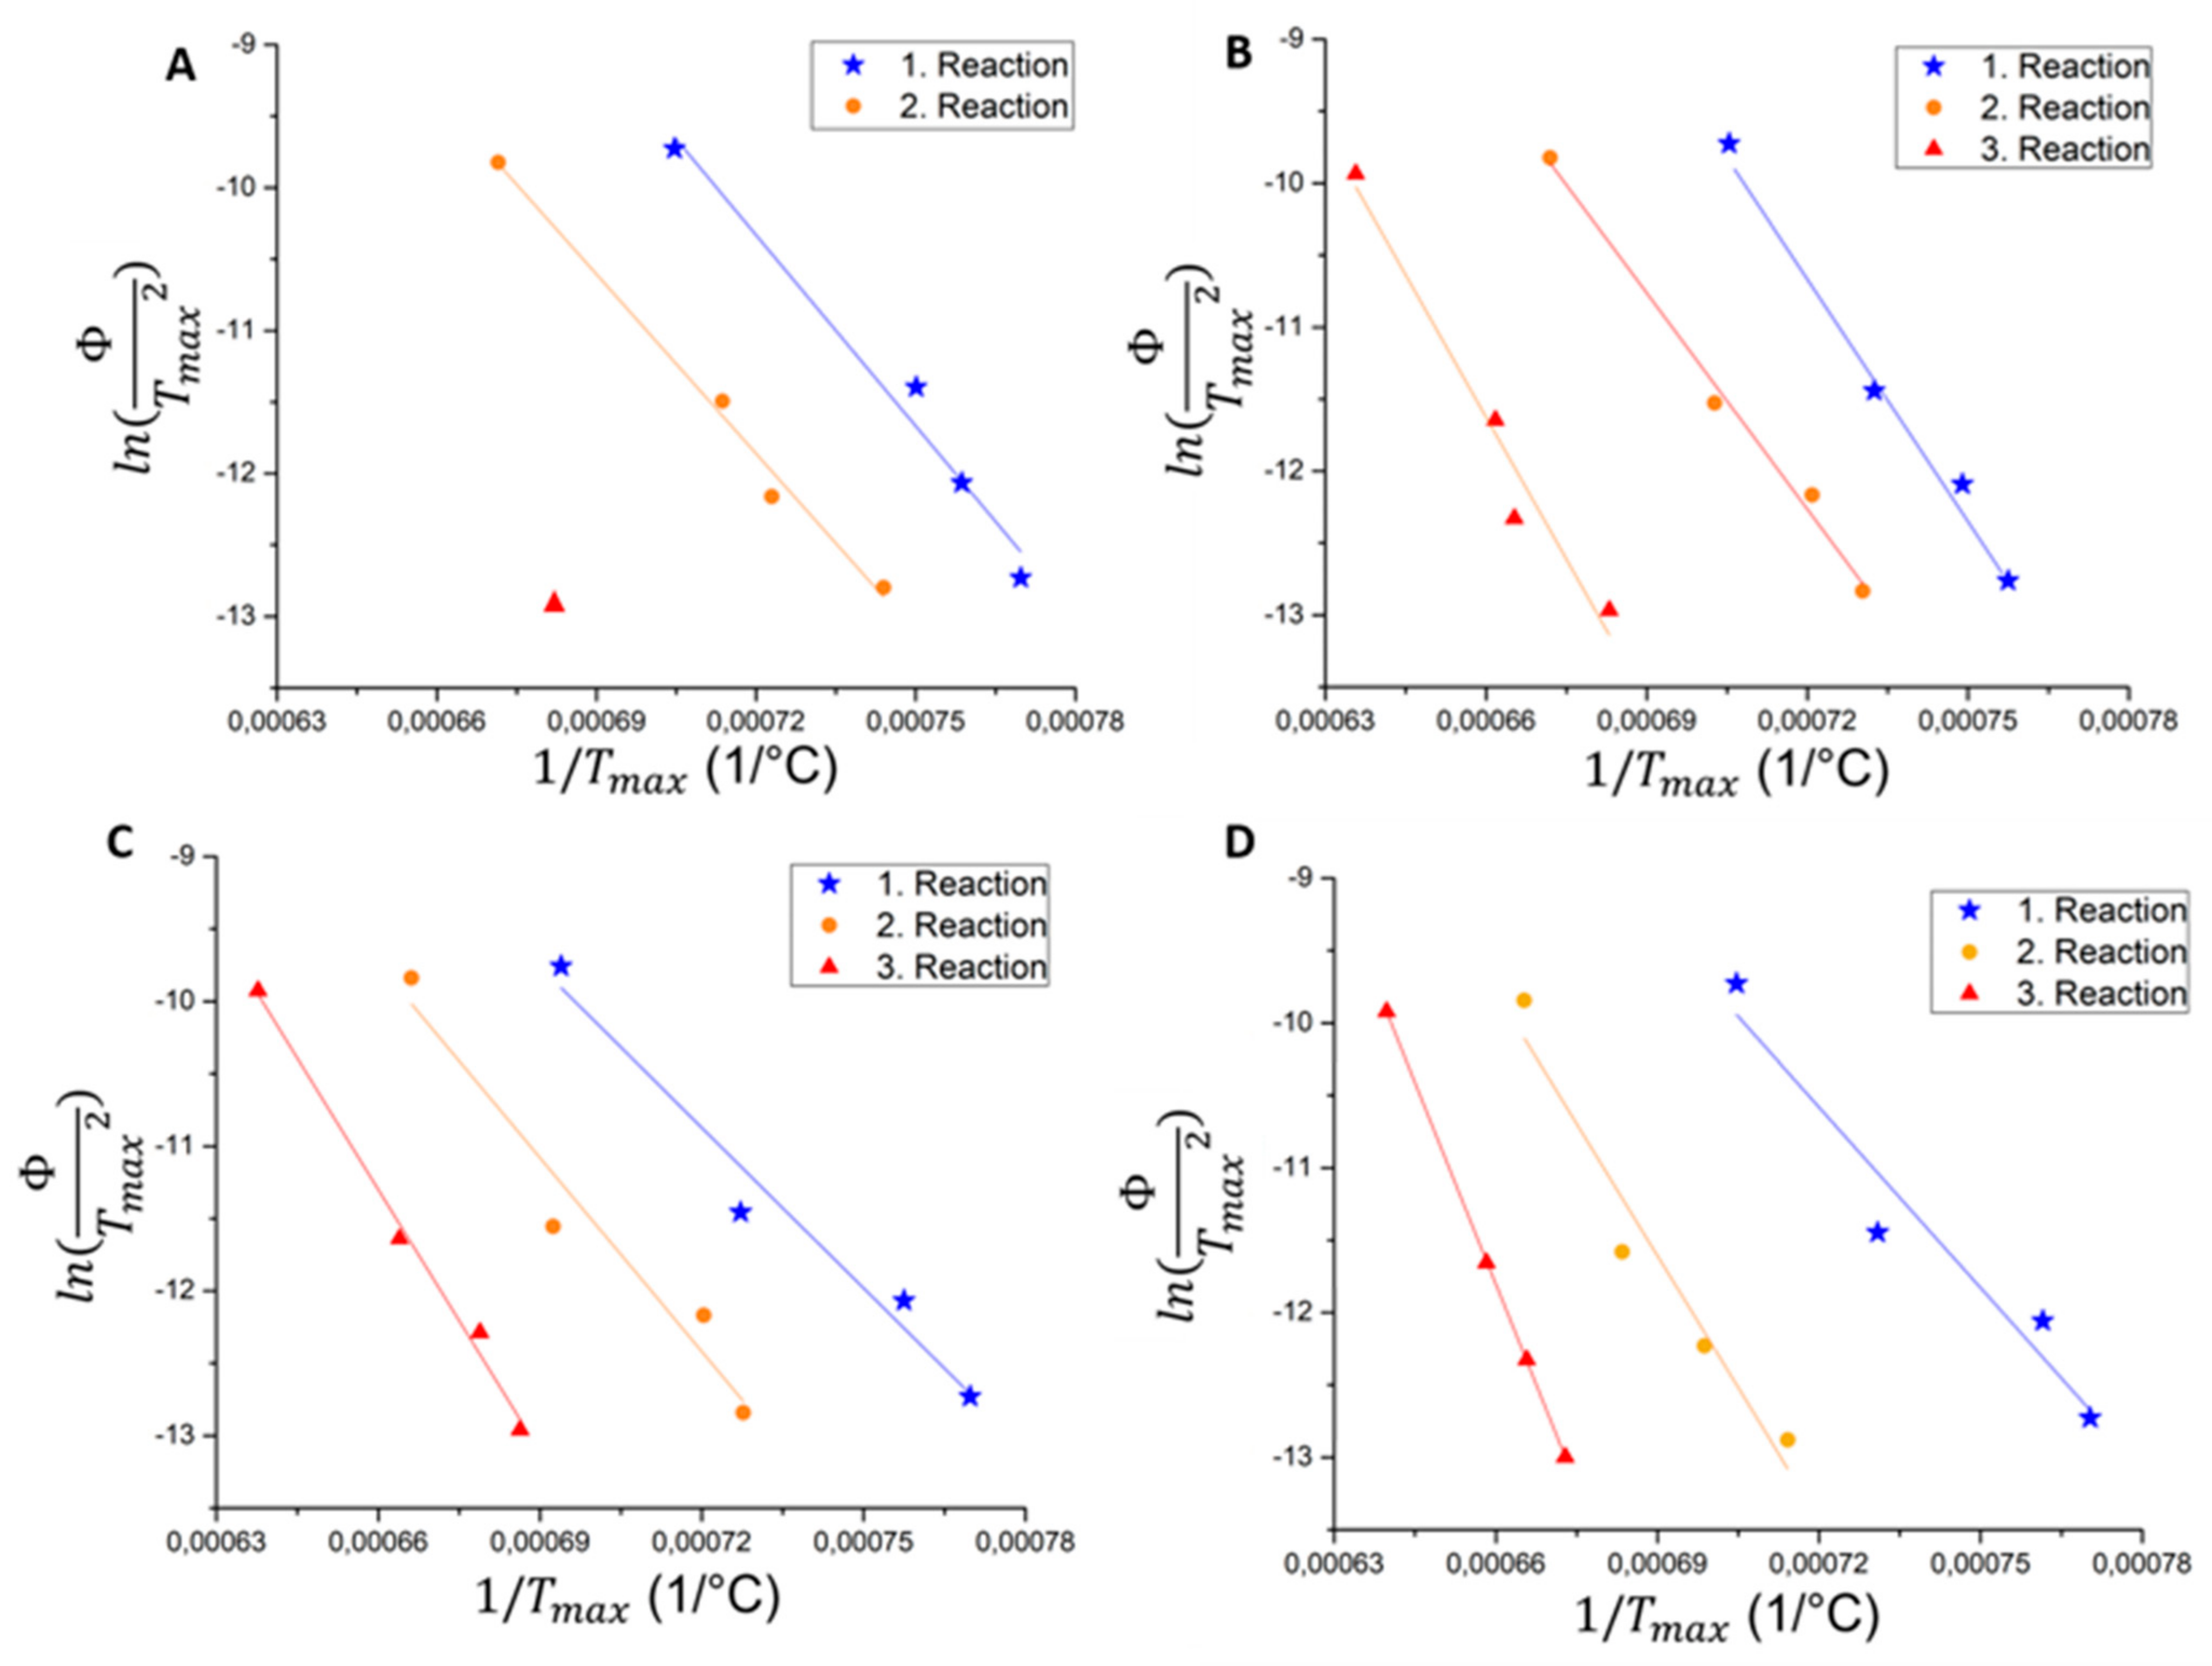
  • Slow heating rate (5, 10, 20 K/min) quenching dilatometer experiments were performed up to 1250 °C. These showed that the reaction peak temperatures Tmax are shifted to lower temperatures with lower heating rates.
  • Kissinger plots were created from the 1st deviation of dilatometer curves. A linear correlation could be identified for all materials and reactions. This proves that the reaction mechanisms do not change with the heating rate, but the temperatures do. The effect of the heating rate is similar for CrMA1 and CrMA 2.
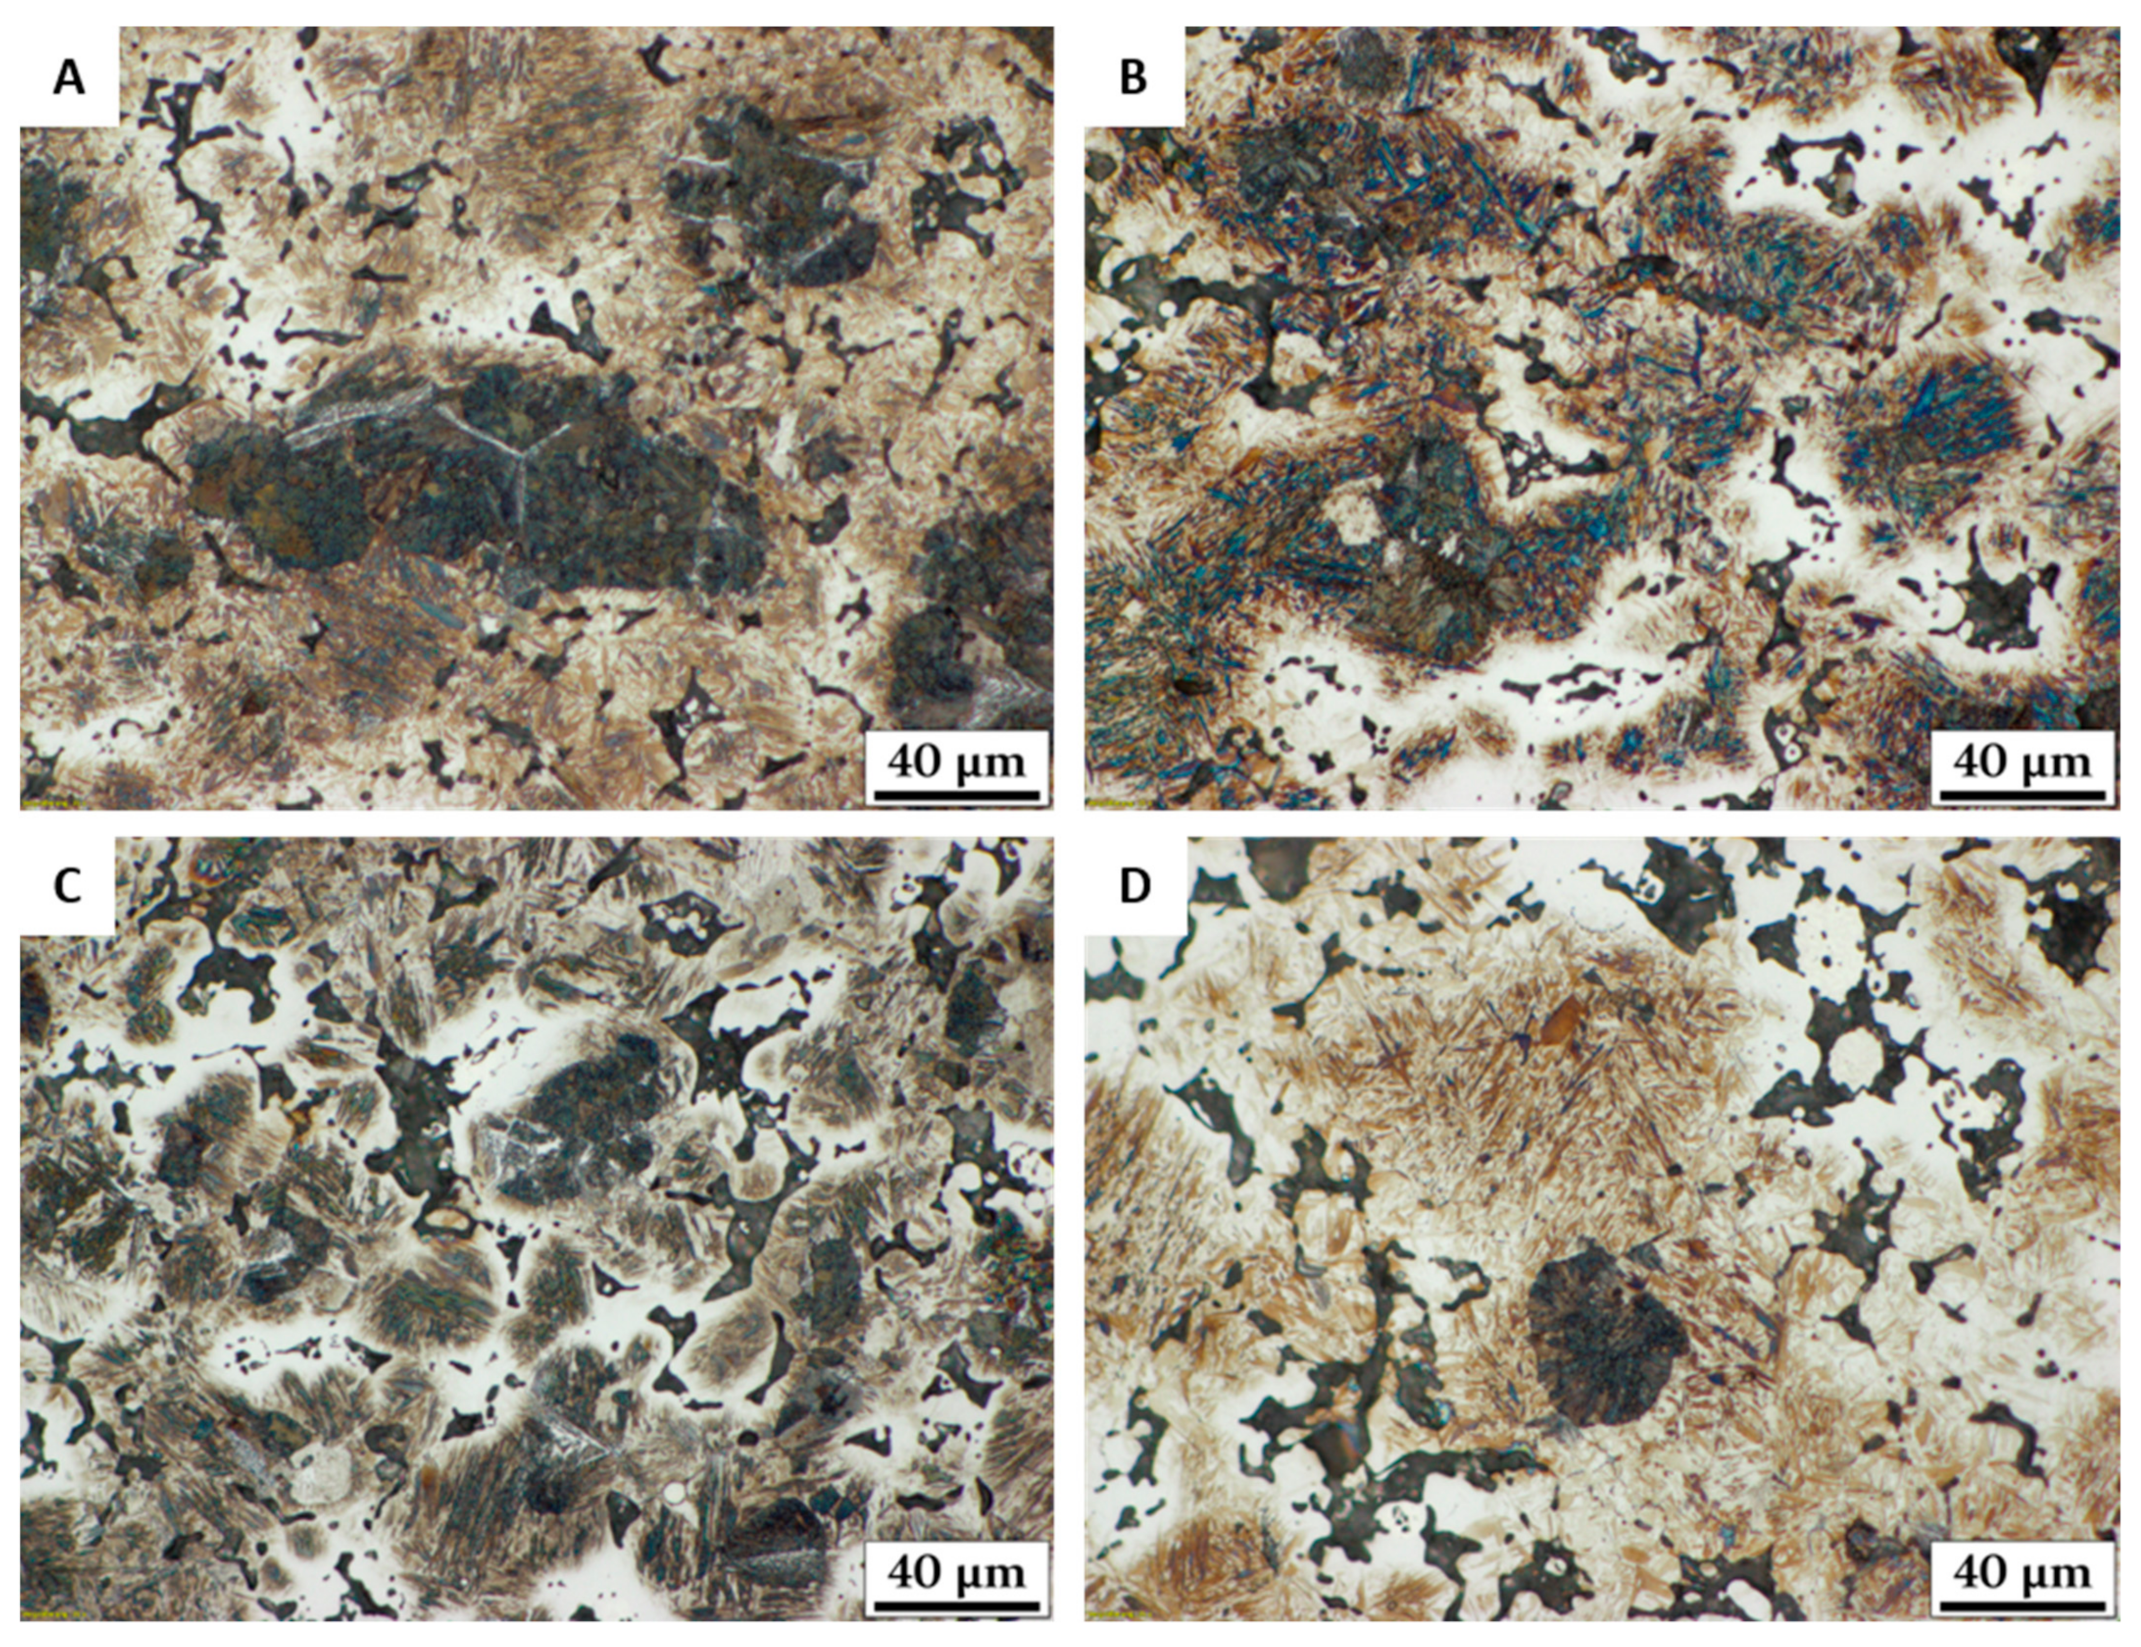
  • From these plots 1180 °C was chosen to be a suitable sintering temperature if the material is heated up at 10 K/min. Metallographic sections proved that liquid phase formation and distribution without the formation of secondary porosity could be achieved.
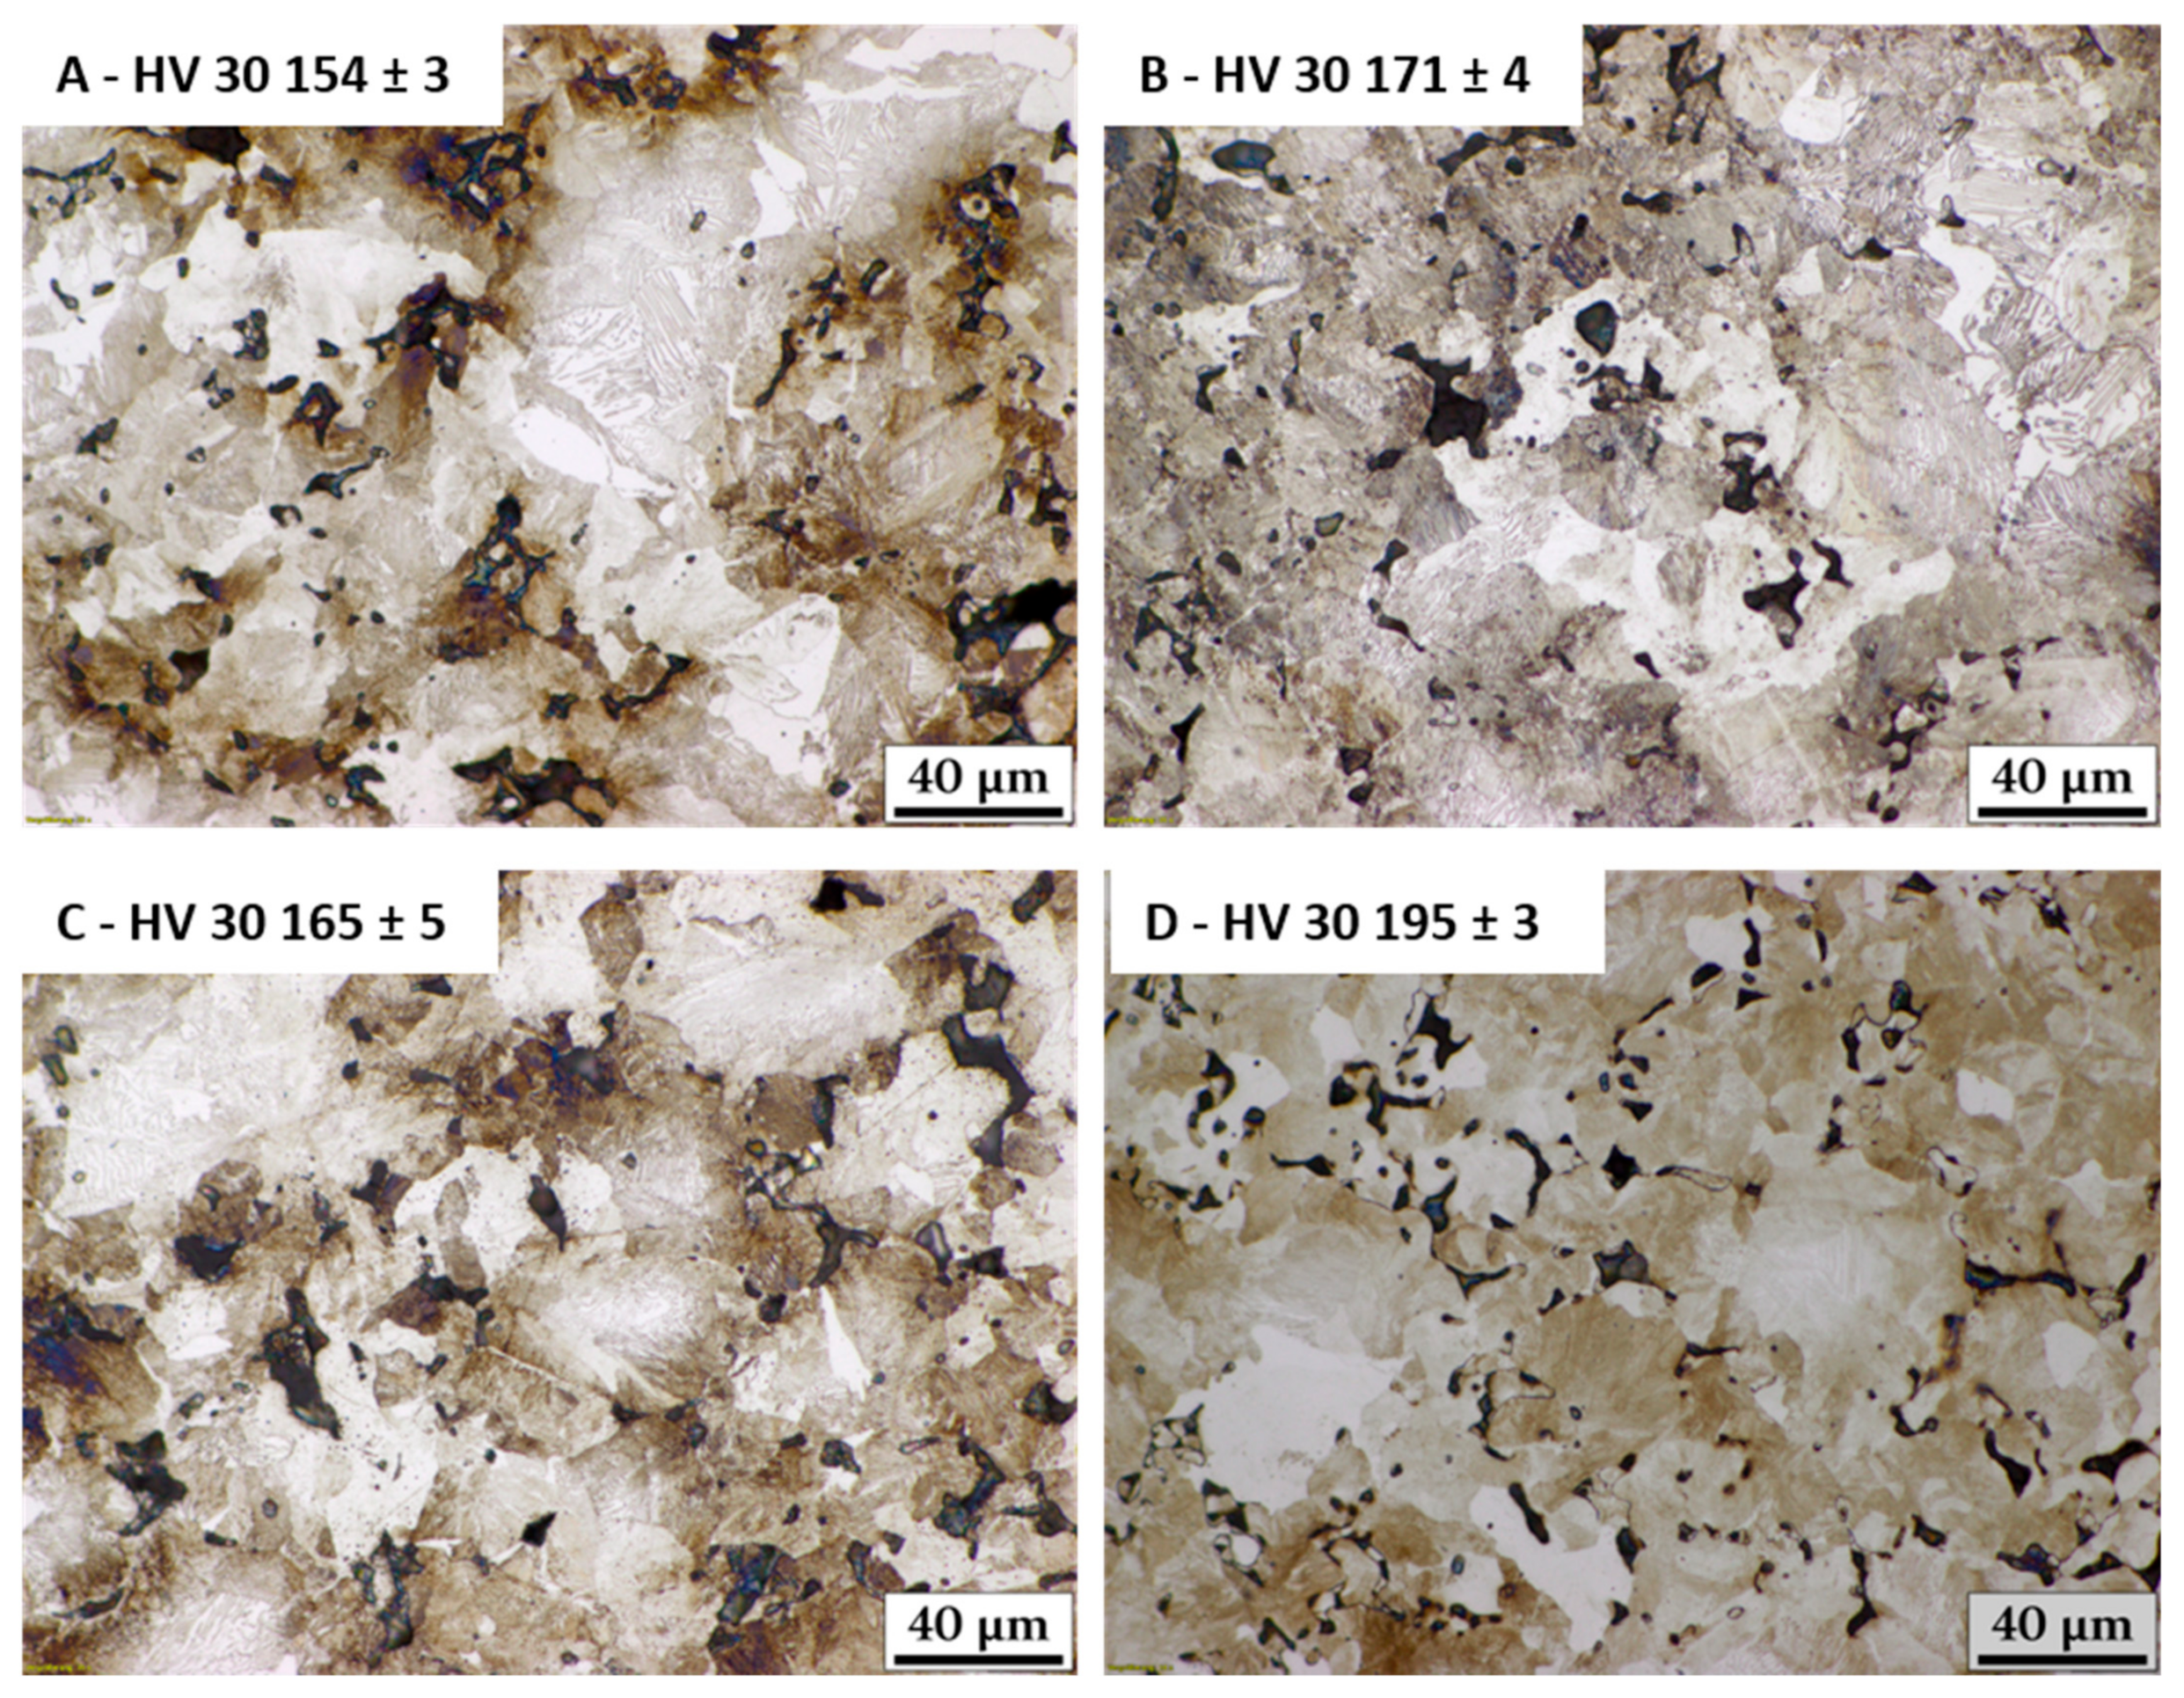
  • From the material thus sintered, CCT diagrams were recorded. The phase fields shown in the CCT diagrams could be corroborated with metallographic sections in combination with apparent hardness (HV 30) and microhardness (HV 0.1) measurements.
  • Both MAs could melt and distribute the alloying elements as intended via the interconnected porosity. Further homogenization would be a matter of isothermal sintering and therefore diffusion time. There is no disadvantage in using MA containing more alloying elements, as it is designed properly in composition.
  • By hot fusion analysis of the O content it could be shown that PM-steel alloyed with Cr via the MA route can be successfully reduced already at 1180 °C.

Author Contributions

Conceptualization, methodology, validation, writing—review and editing, all authors. Investigation, data curation, writing—original draft preparation, visualization, G.S. All authors have read and agreed to the published version of the manuscript.

Funding

This research received no external funding.

Institutional Review Board Statement

Not applicable.

Informed Consent Statement

Not applicable.

Acknowledgments

The authors want to thank Atomising Systems Ltd., Sheffield, UK, for manufacturing and supplying the Master Alloy powders used. Open Access Funding by TU Wien.

Conflicts of Interest

The authors declare not conflict of interests.

References

  1. Copper-Summary. 2021. Available online: https://tradingeconomics.com/commodity/copper (accessed on 4 August 2021).
  2. Trading Economics. Molybdenum-Summary. 2021. Available online: https://tradingeconomics.com/commodity/molybden (accessed on 4 August 2021).
  3. European Council. Commission Delegated Regulation (EU) 2015/2420 of 12 October 2015 Amending Council Regulation (EC) No 428/2009 of 5 May 2009. Setting up a Community Regime for the Control of Exports, Transfer, Brokering and Transit of Dual-Use Items, 2015. Off. J. Eur. Union 2015, 616, 295. [Google Scholar]
  4. Danninger, H.; Gierl-Mayer, C. Advances in powder metallurgy: Properties, processing and applicatons. In Advanced Powder Metallurgy Steel Alloys; Woodhead Publishing: Sawston, UK, 2013; pp. 149–201. [Google Scholar] [CrossRef]
  5. Lichańska, E.; Sułowski, M.; Ciaś, A. Mechanical properties and microstructure of PM Mn-Cr-Mo steels with low carbon concentration. Arch. Metall. Mater. 2016, 61, 109–114. [Google Scholar] [CrossRef] [Green Version]
  6. Momeni, M.; Danninger, H.; Gierl, C.; Dudrová, E.; Arvand, A. Relationship between tensile toughness and impact energy of Mo prealloyed and Ni-Cu-Mo diffusion bonded sintered steels. Powder Metall. Prog. 2011, 11, 62–68. [Google Scholar]
  7. Lindqvist, B. Chormium Alloyed Pm Steels–A New Powder Generation. In Proceedings of the EuroPM2001; European Powder Metallurgy Association (EPMA): Nice, France, 2001; pp. 13–21. [Google Scholar]
  8. Zapf, G.; Dalal, K. Introduction of high oxygen affinity elements manganese, chromium, and vanadium in the powder metallurgy of P/M parts. Mod. Dev. Powder Metall. 1977, 10, 129–152. [Google Scholar]
  9. de Oro Calderon, R.; Dunkley, J.; Gierl, C.; Danninger, H. New opportunities for master alloys: Ultra-high pressure water atomised powders. In Powder Metallurgy Review; Inovar Communications Ltd.: Shrewsbury, UK, 2019; pp. 55–66. [Google Scholar]
  10. Geroldinger, S. Optimization of Iron-Based Master Alloys for Liquid Phase Sintering of PM Steels. Master’s Thesis, Technische Universität Wien, Vienna, Austria, 2019. [Google Scholar]
  11. Kieback, B.; Schatt, W. Anwendung eines kurzzeitigen Flüssigphasensinterns für die Herstellung von Fe-Ti-Sinterlegierungen. Planseeber. Pulvermetall. 1980, 28, 204–215. [Google Scholar]
  12. Dautzenberg, N. Dimensional behavior of Copper-Carbon sintered steel. Powder Metall. 1990, 17, 10–15. [Google Scholar]
  13. Kissinger, H.E. Variation of peak temperature with heating rate in differential thermal analysis. J. Res. Natl. Bur. Stand. 1956, 57, 217–221. [Google Scholar] [CrossRef]
  14. Kissinger, H.E. Reaction kinetics in differential thermal analysis. Anal. Chem. 1957, 29, 1702–1706. [Google Scholar] [CrossRef]
  15. Danninger, H.; Gierl-Mayer, C.; de Oro Calderon, R. The use of transient liquid phases in powder metallurgy. Mater. Sci. For. 2021, 1016, 69–76. [Google Scholar]
  16. De Oro Calderon, R.; Gierl-Mayer, C.; Danninger, H. Fundamentals of Sintering: Liquid Phase Sintering. Reference Module in Materials Science and Materials Engineering; Elsevier: Amsterdam, The Netherlands, 2021. [Google Scholar] [CrossRef]
  17. Danninger, H. Homogenization and pore formation during sintering with transient liquid-phase. Powder Metall. Int. 1988, 20, 21–25. [Google Scholar]
  18. Danninger, H. Sintering of Mo. alloyed P/M steels prepared from elemental powders. II: Mo. Homogenization and dimensional behaviour. Powder Metall. Int. 1992, 24, 163–168. [Google Scholar]
  19. Zhang, X. Applications of kinetic methods in thermal analysis: A review. Eng. Sci. 2020, 14, 1–13. [Google Scholar] [CrossRef]
  20. Wendel, J. Sintering of Water-Atomized Iron and Low-Alloyed Steel Powder. Ph.D. Thesis, Department of Industrial and Materials Science, Chalmers University of Technology, Gothenburg, Sweden, 2020. [Google Scholar]
  21. Manchili, S.K.; Wendel, J.; Hryha, E.; Nyborg, L. Analysis of iron oxide reduction kinetics in the nanometric scale using hydrogen. Nanomaterials 2020, 10, 1276. [Google Scholar] [CrossRef] [PubMed]
  22. Sewell, E.C. The consequences for differential thermal analysis of assuming a reaction to be first-order. Clay Miner. 1955, 2, 233–241. [Google Scholar] [CrossRef]
  23. Oliver, C.; Schuh, C.A. Kissinger-style kinetic analysis for sintering dilatometry data. Metall. Mater. Trans. A 2021, 52, 4479–4487. [Google Scholar] [CrossRef]
  24. Danninger, H.; Gierl, C. Processes in PM steel compacts during the initial stages of sintering. Mater. Chem. Phys. 2001, 67, 49–55. [Google Scholar] [CrossRef]
  25. Danninger, H.; Gierl, C.; Kremel, S.; Leitner, G.; Jaenicke-Roessler, K.; Yu, Y. Degassing and deoxidation processes during sintering of unalloyed and alloyed PM steels. Powder Metall. Prog. 2002, 2, 125–140. [Google Scholar]
  26. Geroldinger, S.; de Oro Calderon, R.; Gierl-Mayer, C.; Danninger, H. Sinter hardening PM steels prepared through hybrid alloying. J. Heat Treat. Mater. 2021, 76, 105–119. [Google Scholar] [CrossRef]
  27. Steven, W.; Haynes, A.G. The temperature of formation of martensite and bainite in low-alloy steel. J. Iron Steel Inst. 1956, 183, 349–359. [Google Scholar]
  28. Suzuki, T.; Ono, Y.; Miyamoto, G.; Furuhara, T. Effects of Si and Cr on bainite microstructure of medium carbon steels. Iron Steel Int. J. 2010, 50, 1476–1482. [Google Scholar] [CrossRef] [Green Version]
Figure 1. (1) Cut and contacted specimen. (2) Corundum push rod. (3) Cu coil for inductive heating with small drilled holes for the quenching gas. (4) K-type thermocouple spot welded on the sample.
Metals 11 01662 g001
Figure 2. Fast heating experiment (120 K/s) with ASC + 4% CrMA1_0.75Cnom (0.72Ccomb). (A) 1st Dev of the dilatometer (heating segment) (B) 800 °C presintered in pusher furnace. Starting point (red dots mark MA particles) (C) Sample quenched from 1120 °C, (D) Sample quenched from 1180 °C, (E) Sample quenched from 1250 °C and (F) Sample quenched from 1300 °C.
Metals 11 01662 g002
Figure 3. Fast heating experiment (120 K/s) with ASC + 4% CrMA2_0.75Cnom (0.72Ccomb). (A) 1st Dev of the dilatometer (heating segment) (B) 800 °C preheated in pusher furnace. Starting point (red dots mark MA) (C) Sample quenched from 1120 °C, (D) Sample quenched from 1180 °C, (E) Sample quenched from 1250 °C and (F) Sample quenched from 1300 °C.
Metals 11 01662 g003
Figure 4. (A,B): Fast heating experiment (120 K/s) with ASC + 4% CrMA1_0.6Cnom (0.6Ccomb), (A) 1st Dev of the dilatometer (heating segment), (B) Sample quenched from 1300 °C; (C,D): Fast heating experiment (120 K/s) with ASC + 4% CrMA2_0.6Cnom (0.59Ccomb), (C) 1st Dev of the dilatometer (heating segment), (D) Sample quenched from 1300 °C.
Metals 11 01662 g004
Figure 5. ASC + CrMA1_0.6C (0.6C): 1st deviation of the heating segment measured with 120 K/s. Example how T1, T2, and T3 were chosen.
Metals 11 01662 g005
Figure 6. Kissinger plots for different melting reactions of the MA. (A) ASC + 4%CrMA1_0.6Cnom (0.6Ccomb), (B) ASC + 4%CrMA1_0.75C (0.72C), (C) ASC + 4%CrMA2_0.6C (0.59C), (D) ASC + 4%CrMA2_0.75C (0.72C).
Metals 11 01662 g006
Figure 7. Metallographic sections of samples heated at 10 K/min to 1180 °C in the quenching dilatometer and then immediately quenched as fast as possible (~22.5 K/s). (A) ASC + 4%CrMA1_0.6C, (B) ASC + 4%CrMA1_0.75C, (C) ASC + 4%CrMA2_0.6C, (D) ASC + 4%CrMA2_0.75C.
Metals 11 01662 g007
Figure 8. Metallographic sections of samples heated at 10 K/min to 1180 °C in a pusher furnace and cooled in a water-jacketed exit zone (~0.5 K/s). (A) ASC + 4%CrMA1_0.6Cnom (0.55Ccomb) HV 0.1 211 ± 25, (B) ASC + 4%CrMA1_0.75C (0.64C) HV 0.1 240 ± 40, (C) ASC + 4%CrMA2_0.6C (0.54C) HV 0.1 230 ± 33, (D) ASC + 4%CrMA2_0.75C (0.67C) HV 0.1 265 ± 14.
Metals 11 01662 g008
Figure 9. CCT diagrams recorded from a single sample with 14 runs each. Heated at 11 K/s to 1100 °C and held for 300 s, cooled with different rates. (A) ASC + 4%CrMA1_0.6Cnom (0.55Ccomb), (B) ASC + 4%CrMA1_0.75C (0.64C), (C) ASC + 4%CrMA2_0.6C (0.54C), (D) ASC + 4%CrMA2_0.75C (0.67C).
Metals 11 01662 g009
Figure 10. Metallographic sections of CCT samples cooled at 3 K/s in a final 15th run. 100× (left), 500× (right) (A,B) ASC + 4%CrMA1_0.6Cnom (0.55Ccomb), (C,D) ASC + 4%CrMA1_0.75C (0.64C), (E,F) ASC + 4%CrMA2_0.6C (0.54C), (G,H) ASC + 4%CrMA2_0.75C (0.67C).
Metals 11 01662 g010
Table 1. List of materials used in the present study. Natural graphite UF 4, (Kropfmühl), Fe base powder ASC 100.29 (Höganäs AB, Sweden), MA (Ultra High Pressure Water Atomized master alloys produced by Atomizing Systems Ltd., UK).
CodeMaterial
CNatural Graphite UF 4
FeBase powder:Plain iron, ASC 100.29d50: 52.38 ± 3.00 µmd90: 75.89 ± 6.81 µm
CrMA-1MA:Fe_32Cr_8Si_4C d50: 6.80 ± 0.19 µmd90: 16.76 ± 0.58 µm
CrMA-2MA:Fe_40Cr_11Si_3.5Cd50: 8.10 ± 0.86 µmd90: 20.16 ± 2.38 µm
Table 2. C and O measurements. Left (white): material pre-sintered at 800 °C for 1 h in N2/H2, Right (grey): material sintered at 1180 °C with 10 K/min heating ramp held for 30 min in N2/H2.
MaterialC [wt%]O [wt%]MaterialC [wt%]O [wt%]
ASC + CrMA1_0.6C 800 °C p.s.0.595 ± 0.007 0..073 ± 0.005ASC + CrMA1_0.6C 1180 °C0.554 ± 0.003 0.020 ± 0.001
ASC + CrMA1_0.75C 800 °C p.s.0..725 ± 0.0130.073± 0.002ASC + CrMA1_0.75C 1180 °C 0.636 ± 0.0240.018 ± 0.001
ASC + CrMA2_0.6C 800 °C p.s.0.593 ± 0.0040.072 ± 0.002ASC + CrMA2_0.6C 1180 °C 0.539 ± 0.0150.022 ± 0.001
ASC + CrMA2_0.75C 800 °C p.s.0.723 ± 0.0080.076 ± 0.006ASC + CrMA2_0.75C 1180 °C 0.667 ± 0.0120.022 ± 0.001
Table 3. Peak temperatures (Tmax) for the different reactions and heating rates.
Heating RateASC + 4%CrMA1_0.6CHeating RateASC + 4%CrMA1_0.75C
(K/min)T1 (°C)T2 (°C)T3 (°C)(K/min)T1 (°C)T2 (°C)T3 (°C)
5 1026107112235104710961191
101045111011591010621114x
20 1060112811872010921150x
120 11461216128912011451215x
Heating RateASC + 4%CrMA2_0.6CHeating RateASC + 4%CrMA2_0.75C
(K/min)T1 (°C)T2 (°C)T3 (°C)(K/min)T1 (°C)T2 (°C)T3 (°C)
5 1026110111845 102511271213
1010471115120010104011581229
20 11021171123320 109511901246
120 116812281275120 114612351290
Table 4. Difference between calculated (after [27]) and measured Ms temperature.
MaterialMs Measured [°C]Ms CalculatedΔT [°C]
ASC + 4% CrMA1_0.6C (0.55C)282275−6
ASC + 4% CrMA1_0.75C (0.64C)252233−19
ASC + 4% CrMA2_0.6C (0.55C)289273−16
ASC + 4% CrMA2_0.75C (0.64C)2042128
Publisher’s Note: MDPI stays neutral with regard to jurisdictional claims in published maps and institutional affiliations.

