Article

Fatigue Crack Growth Behaviour and Role of Roughness-Induced Crack Closure in CP Ti: Stress Amplitude Dependence

1
Department of Mechanical, Manufacturing and Biomedical Engineering, Trinity College Dublin, The University of Dublin, D02 DA31 Dublin, Ireland
2
Department of Glass and Ceramic Engineering, Bangladesh University of Engineering and Technology, Dhaka 1000, Bangladesh
3
Faculty of Mechanical Engineering, Opole University of Technology, Mikolajczyka 5, 45-271 Opole, Poland
*
Author to whom correspondence should be addressed.
Metals 2021, 11(10), 1656; https://doi.org/10.3390/met11101656
Submission received: 16 September 2021 / Revised: 17 October 2021 / Accepted: 18 October 2021 / Published: 19 October 2021
(This article belongs to the Special Issue Fracture Mechanics and Fatigue Design in Metallic Materials)

Abstract

:
This paper investigated the fatigue crack propagation mechanism of CP Ti at various stress amplitudes (175, 200, 227 MPa). One single crack at 175 MPa and three main cracks via sub-crack coalescence at 227 MPa were found to be responsible for fatigue failure. Crack deflection and crack branching that cause roughness-induced crack closure (RICC) appeared at all studied stress amplitudes; hence, RICC at various stages of crack propagation (100, 300 and 500 µm) could be quantitatively calculated. Noticeably, a lower RICC at higher stress amplitudes (227 MPa) for fatigue cracks longer than 100 µm was found than for those at 175 MPa. This caused the variation in crack growth rates in the studied conditions.

1. Introduction

Commercially pure titanium (CP Ti) possesses high ductility as well as excellent corrosion resistance and biocompatibility properties; hence, it has been used in the chemical and biomedical industries, especially in reactor container in chemical plants, and in power station heat exchangers [1]. In these environments, cyclic loading is applied to the components. Therefore, investigation of the fatigue behaviour of CP Ti becomes an important research subject. Fatigue crack initiation, growth, closure and fractography are critical features describing fatigue behaviour. A fatigue crack path may be a powerful resource determining all the aforementioned features. For instance, roughness-induced crack closure (RICC) is attributed to crack path deflection, especially near the threshold range, at which a serrated or zigzag crack path is induced by microstructure-sensitive crack growth [2,3,4]. The tilt angle of the crack path in 2124 Al alloy is reported to be a key controlling factor for RICC [5]. Wang and Müller [2,6] reported that RICC occurs due to a serrated crack path, which significantly affects crack growth rates in Ti-2.5 Cu (wt%) and TIMETAL 1100 alloys. Fatigue crack growth rates are reported to be decreased by crack path deflection [3,4,7], as the crack path causes a direct reduction of the local driving force for crack propagation and an increase in the total crack path length, which results in lower crack growth rates and induces RICC. Antunes et al. [8] mentioned that cracks with larger path deflection may result in higher mode II displacement between the two fracture surfaces, causing higher crack closure stress intensity [9]. Ding et al. [10] correlated the fatigue crack profile with fatigue crack growth rate in Ti–6Al–4V and Ti–4.5Al–3V–2Mo–2Fe alloys. Okayasu et al. [11] investigated the influence of fatigue loading conditions such as, stress amplitude and stress ratio on the contact features of fracture surfaces in annealed Carbon Steel via two methods: (1) Collecting fracture debris fallen from the crack surfaces; and (2) Observing the fracture surface directly through the replica technique. They showed that the fatigue stress amplitude and stress ratio played major factors in determining the contact status between the mating fracture surfaces, e.g., a larger stress amplitude and smaller stress ratio lead to stronger fracture surface contact or interaction. Student et al. [12] studied the role of fracture surface roughness on crack closure in long-term exploited heat-resistant steel. They reported that shear processes at the tip of a fatigue crack significantly affect crack closure and contribute to the roughness of the fracture surface.
The above discussions evidently show that fatigue crack path can be effectively used to investigate numerous phenomena. Unfortunately, study on the fatigue behaviour of CP Ti related to crack path and its role in detecting fatigue phenomena such as RICC is totally lacking in the literature. To fill this gap, the fatigue crack growth mechanism and corresponding RICC from fatigue crack path in CP Ti has been revealed here. This will further help in understanding fatigue crack growth at the small crack regime and the role of RICC in such cracking.

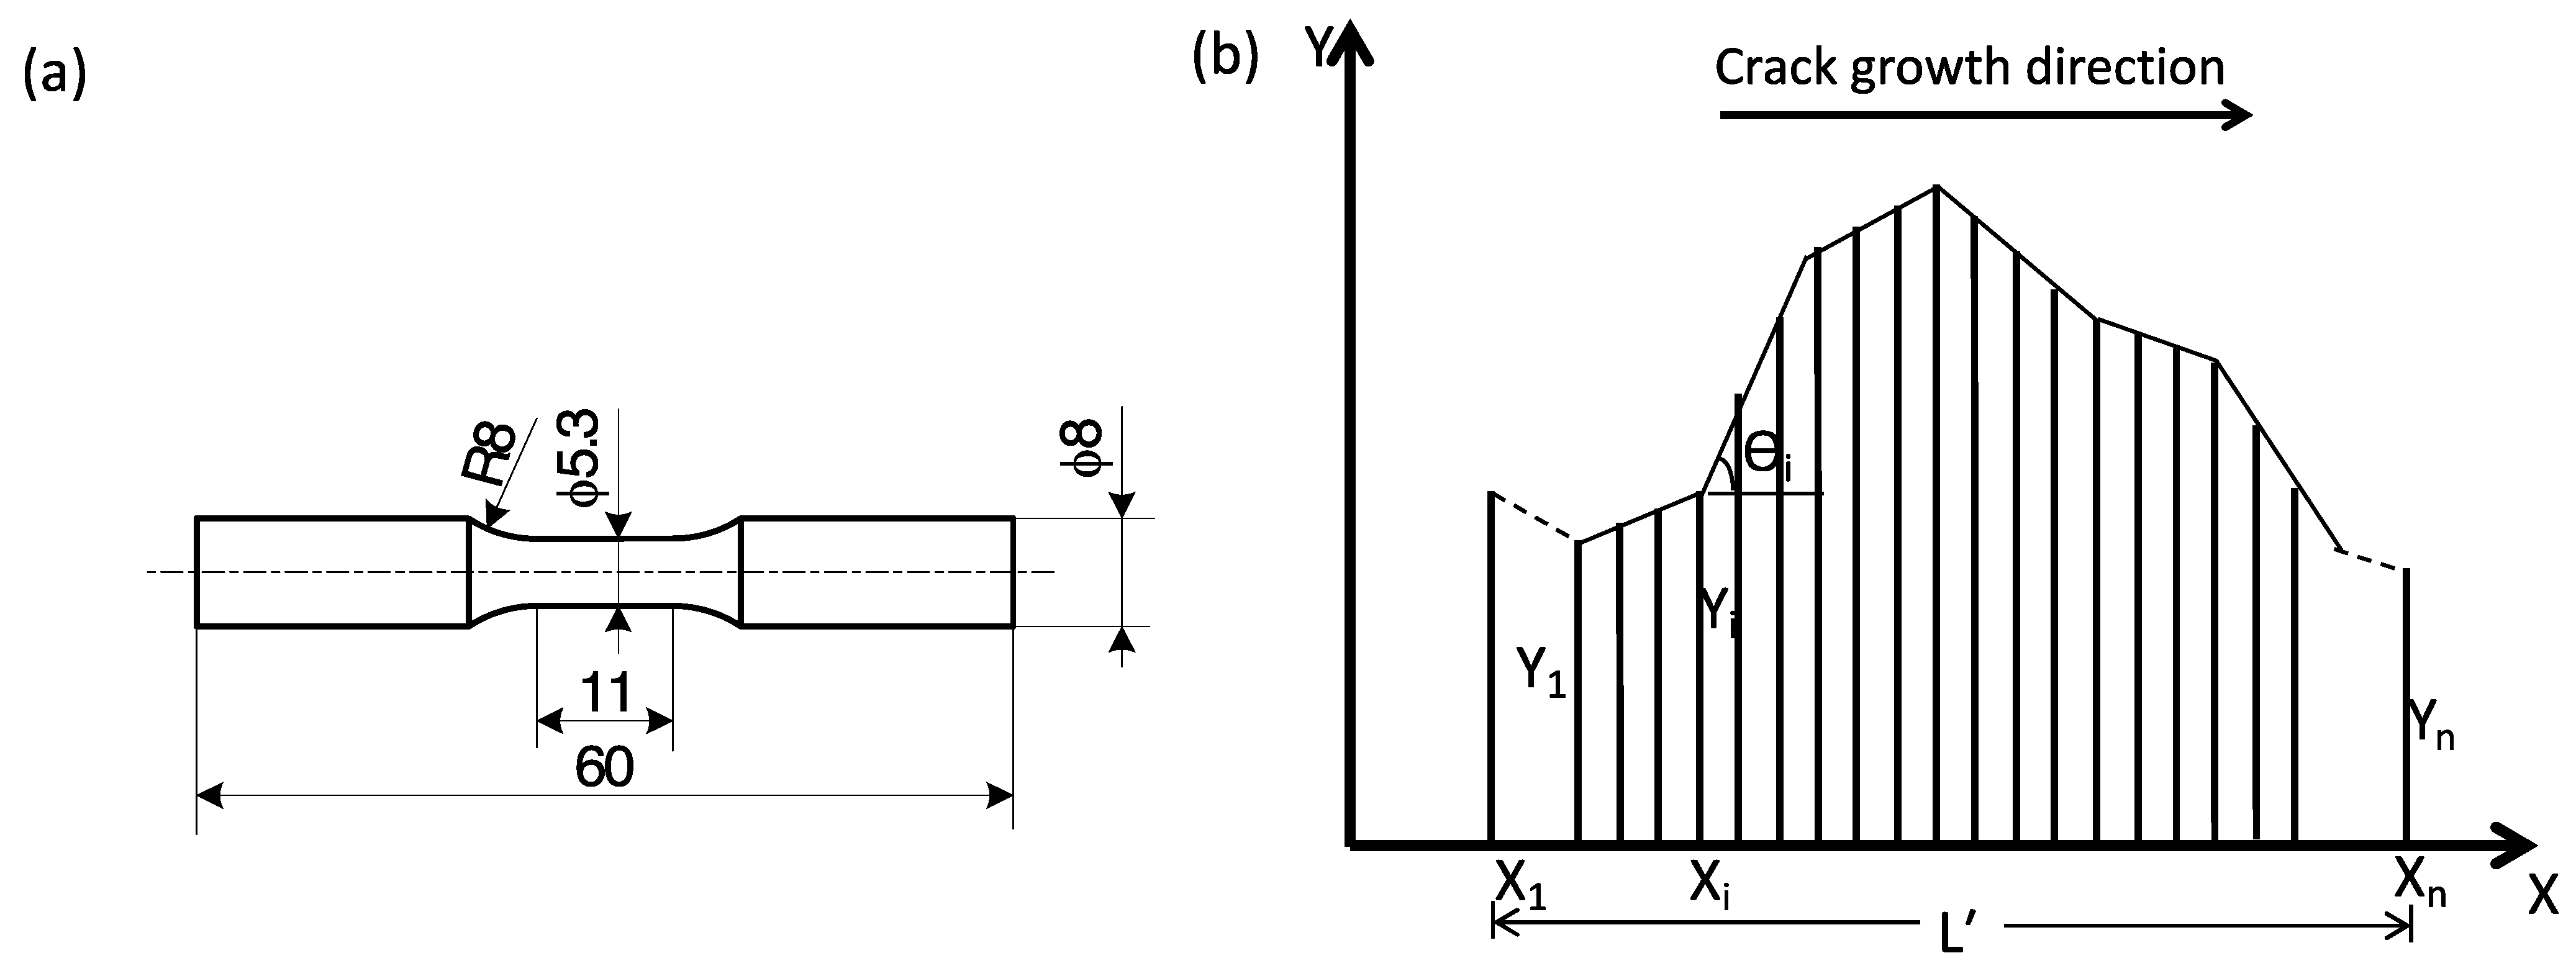
2. Materials and Methods

The composition of the studied CP Ti is given in Table 1. A vacuum furnace heat-treatment of the as received hot rolled sample was performed at 700 °C for 30 min for obtaining equiaxed α grains. Following heat treatment, samples were machined in order to prepare fatigue specimen with the dimensions shown in Figure 1. Because the surface condition of the specimen in fatigue testing is very sensitive, the samples were then carefully mechanically polished using various grades of SiC emery papers followed by colloidal silica with hydrogen peroxide solution. The polished surfaces were then etched using Kroll’s reagent (3HF:6HNO3:91H2O) to reveal the microstructure.
Tensile tests of CP Ti samples were performed employing an Instron Universal Tensile Machine. The dimensions of the samples were in accordance with the ASTM E8. For each condition, three samples are tested, at room temperature and at a strain rate of 1 mm/min.
An Ono-type rotating bending fatigue machine was used for fatigue tests, at a frequency of 30 Hz. A stress interval of 25 MPa was chosen, from the fatigue limit to a stress at which the distinction of the stress amplitude effect could be numerated. Consequently, fatigue tests at the stresses of 175, 200 and 227 MPa were conducted. The stress ratio (R) was −1 with sinusoidal wave form. All tests were conducted at temperature from 15–20 °C. During testing, a cooling fan was used to cool the specimens, as heat production affects the deformation mechanism of Ti. During fatigue testing, the replica technique was intermittently used at different cycles to trace out crack initiation and propagation; this technique involved immersing replica films into methyl acetate solution and subsequently pasting them onto the specimen surface. To then acquire the image from the replica sheet, an optical microscope (VHX-2000 series, Keyence, Osaka, Japan) was used. One sample of each condition was investigated. Following the fatigue tests, fractographic analysis was conducted using a JEOL IT-300 (JEOL, Tokyo, Janpa) scanning electron microscope (SEM) at an acceleration voltage of 30 kV.
Roughness parameters were quantitatively measured using the surface crack paths along the fractured specimens. Two roughness parameters, (i) linear roughness parameter (RL) and (ii) arithmetic mean deflection angle ( θ ¯ ), were evaluated using the equidistant spacing method [3,4,13]. Figure 1b displays the equidistant spacing method used to calculate these roughness parameters. The details of this method can be found elsewhere [3].
The linear roughness parameter, RL of a crack profile is defined as follows:
RL = L/L′
where L and L′ correspond to the true length and projected length of the crack profile, respectively. The arithmetic mean deflection angle of a crack profile is given below:
θ ¯ = 1 n i = 1 n | θ i |
where θi represents the angle between the profile element and X-coordinate axis and can have either a positive or a negative value (90° ≤ θ ≤ −90°), depending on the crack profile.

3. Results

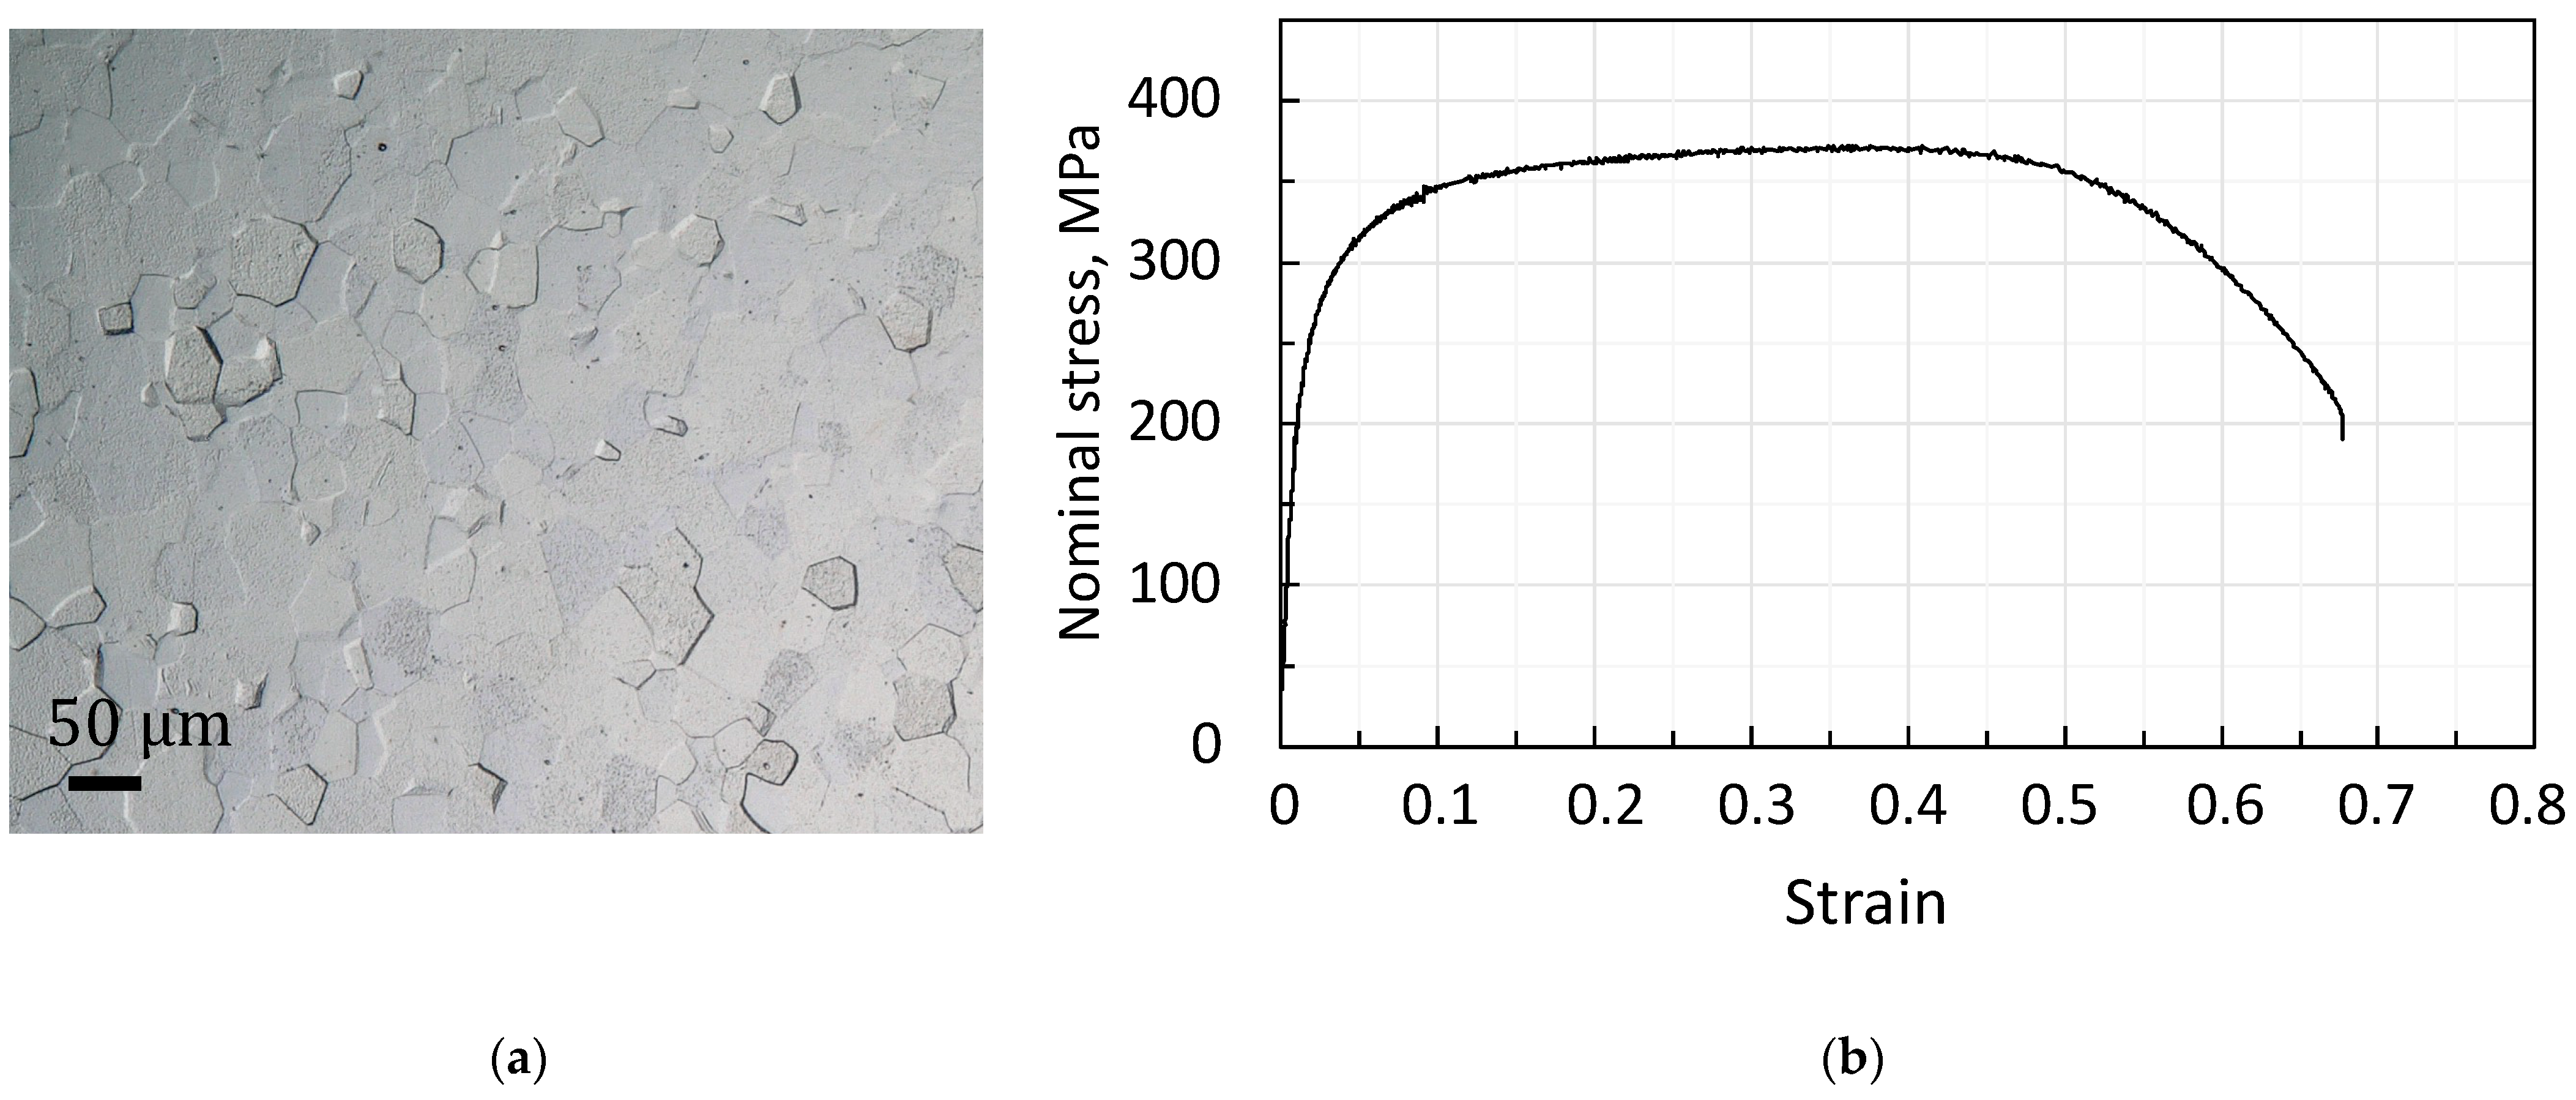
3.1. Initial Microstructure, and Tensile and Fatigue Properties

Figure 2a shows the initial microstructure of the studied material. Uniformly distributed (hexagonal closed packed) α grains with an average diameter of ~35 μm can be observed. The size of the α grains was calculated using Image J. The engineering stress–strain curve plotted from the tensile test is shown in Figure 2b. Beyond the yielding point, work-hardening is followed by work-softening along the stress–strain curve. The yield strength (YS), ultimate tensile strength (UTS) and total elongation (El.) of the studied material were measured to be 293 ± 12 MPa, 383 ± 7 MPa and 67 ± 1%, respectively. Table 2 shows the fatigue test results at various stress amplitudes. As expected, the total life cycle was found to be reduced with increasing stress amplitude. For instance, the sample tested at 175 MPa survived for 6.94 × 10⁵ cycles, while the sample tested at 227 MPa only lasted for 1.05 × 10⁵ cycles. At the intermediate stress amplitude of 200 MPa, the sample failed after reaching 3.4 × 10⁵ cycles.

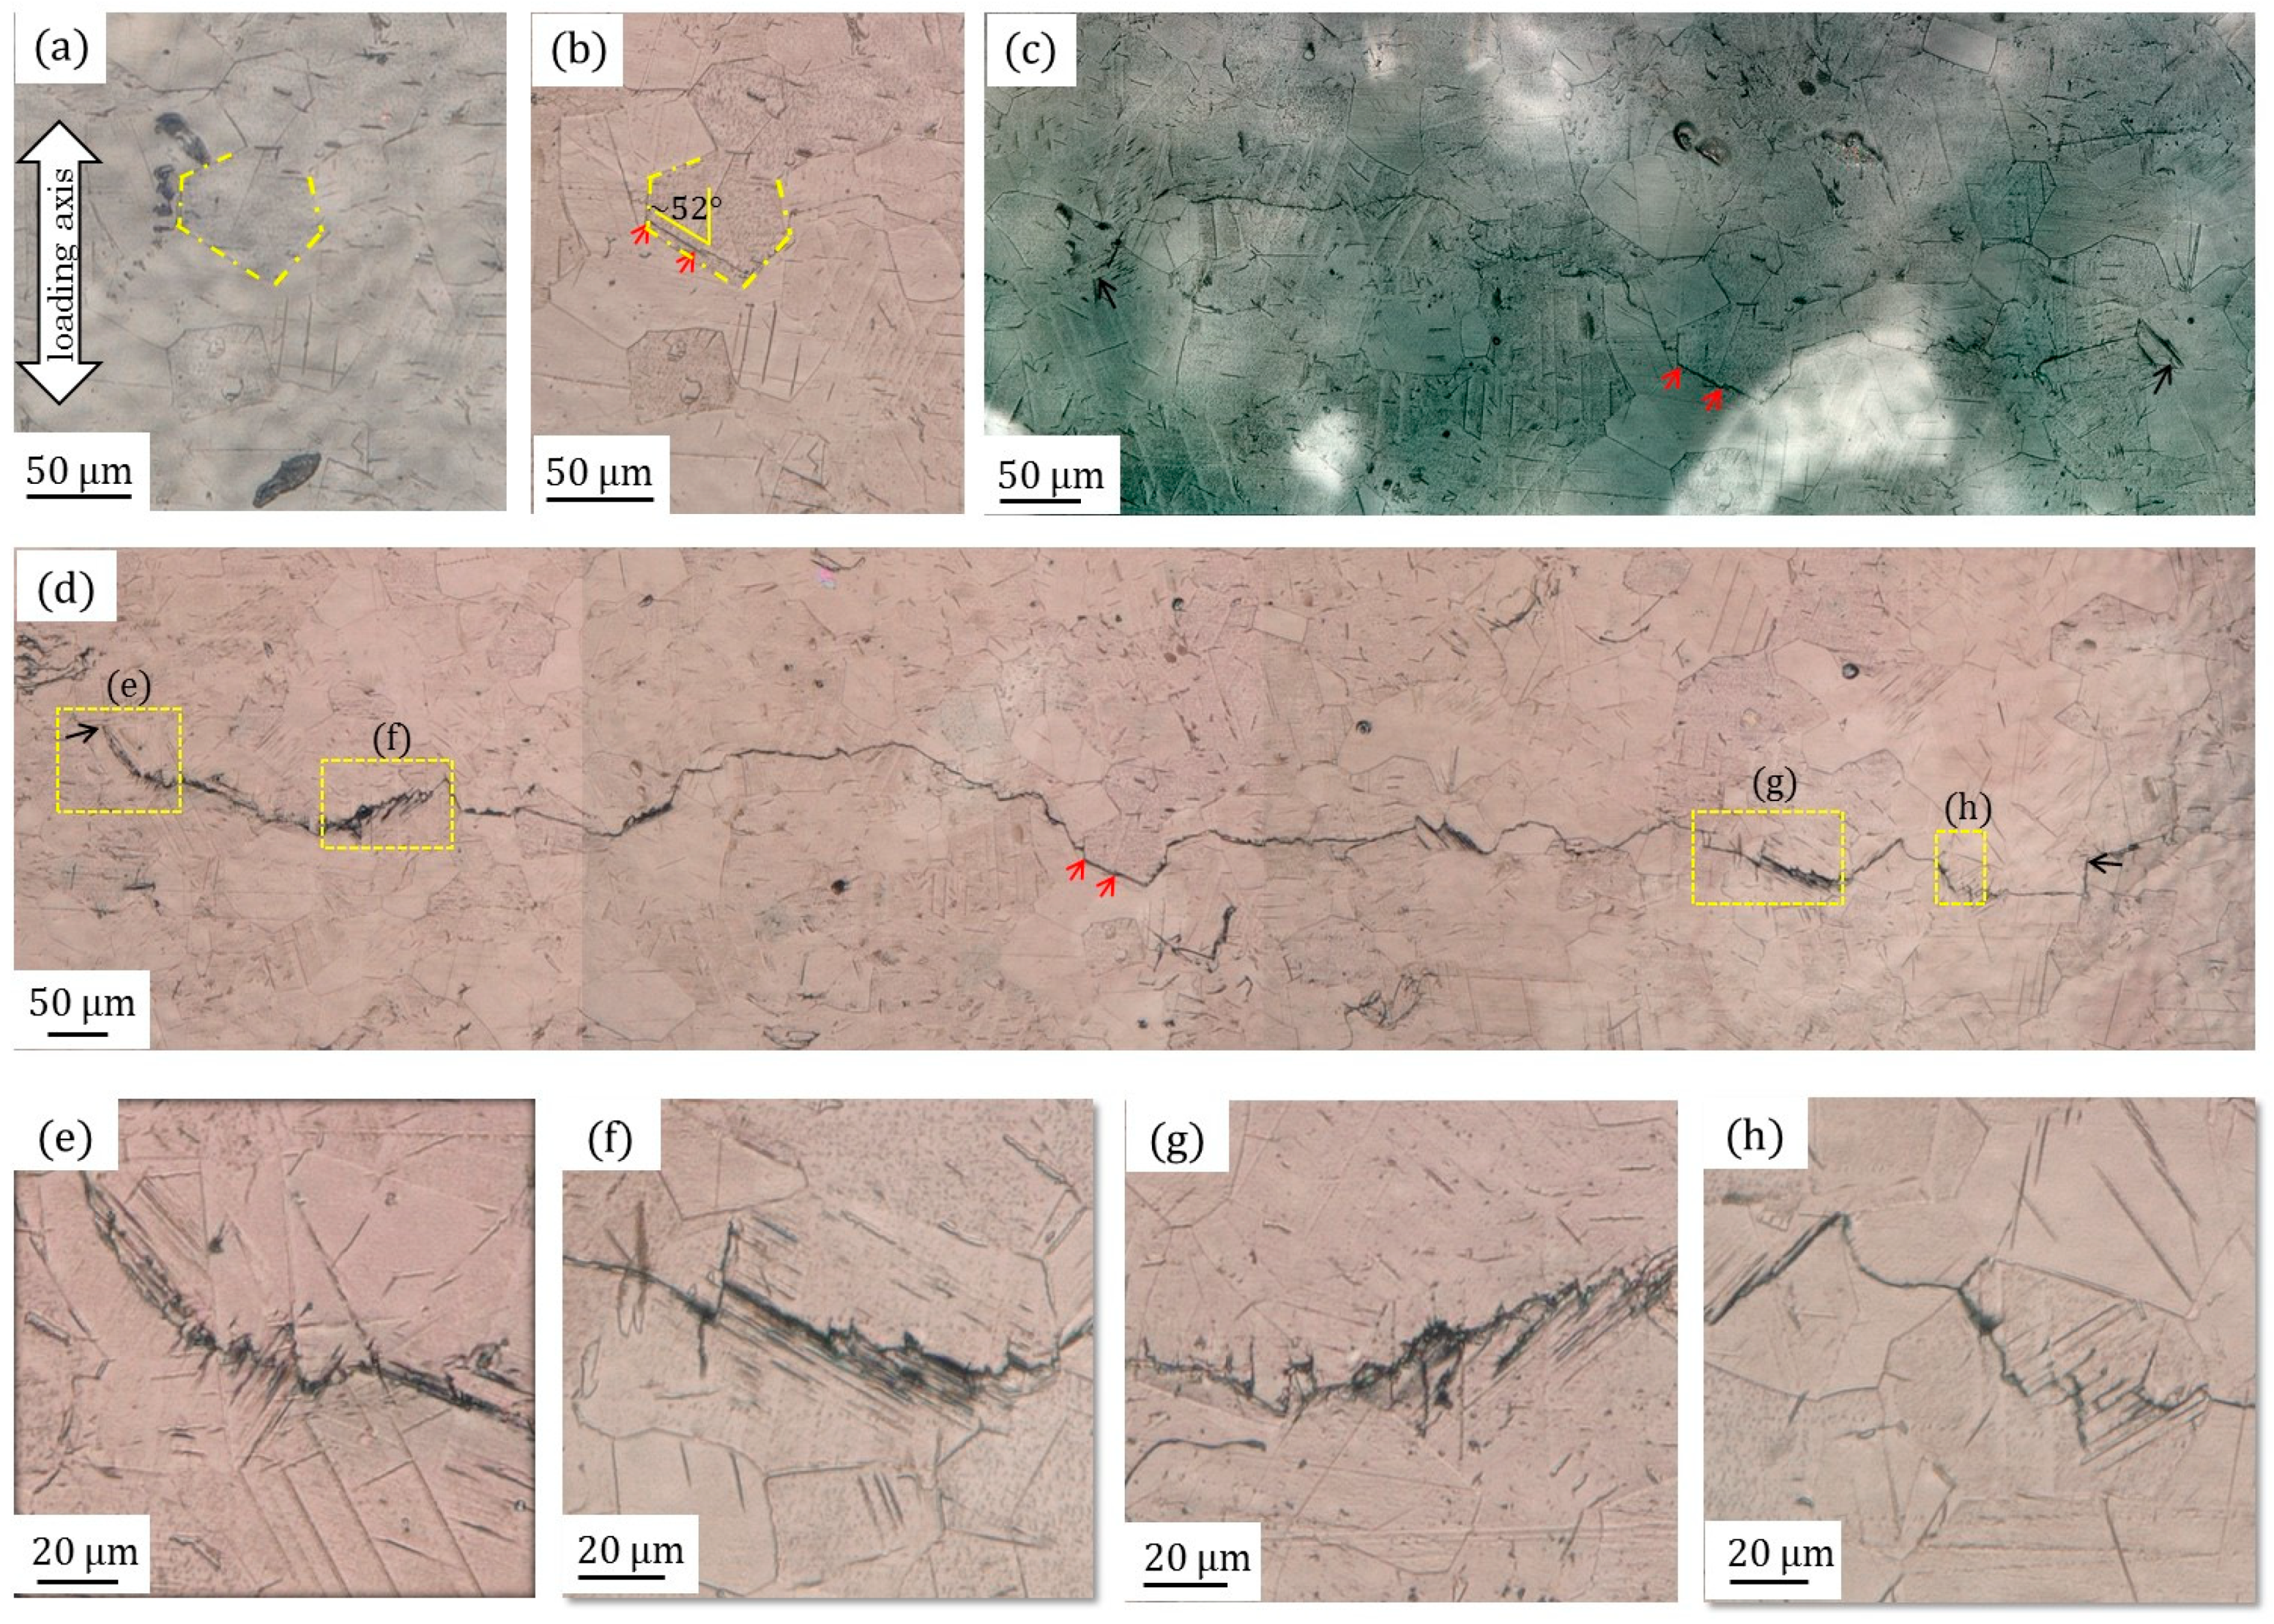
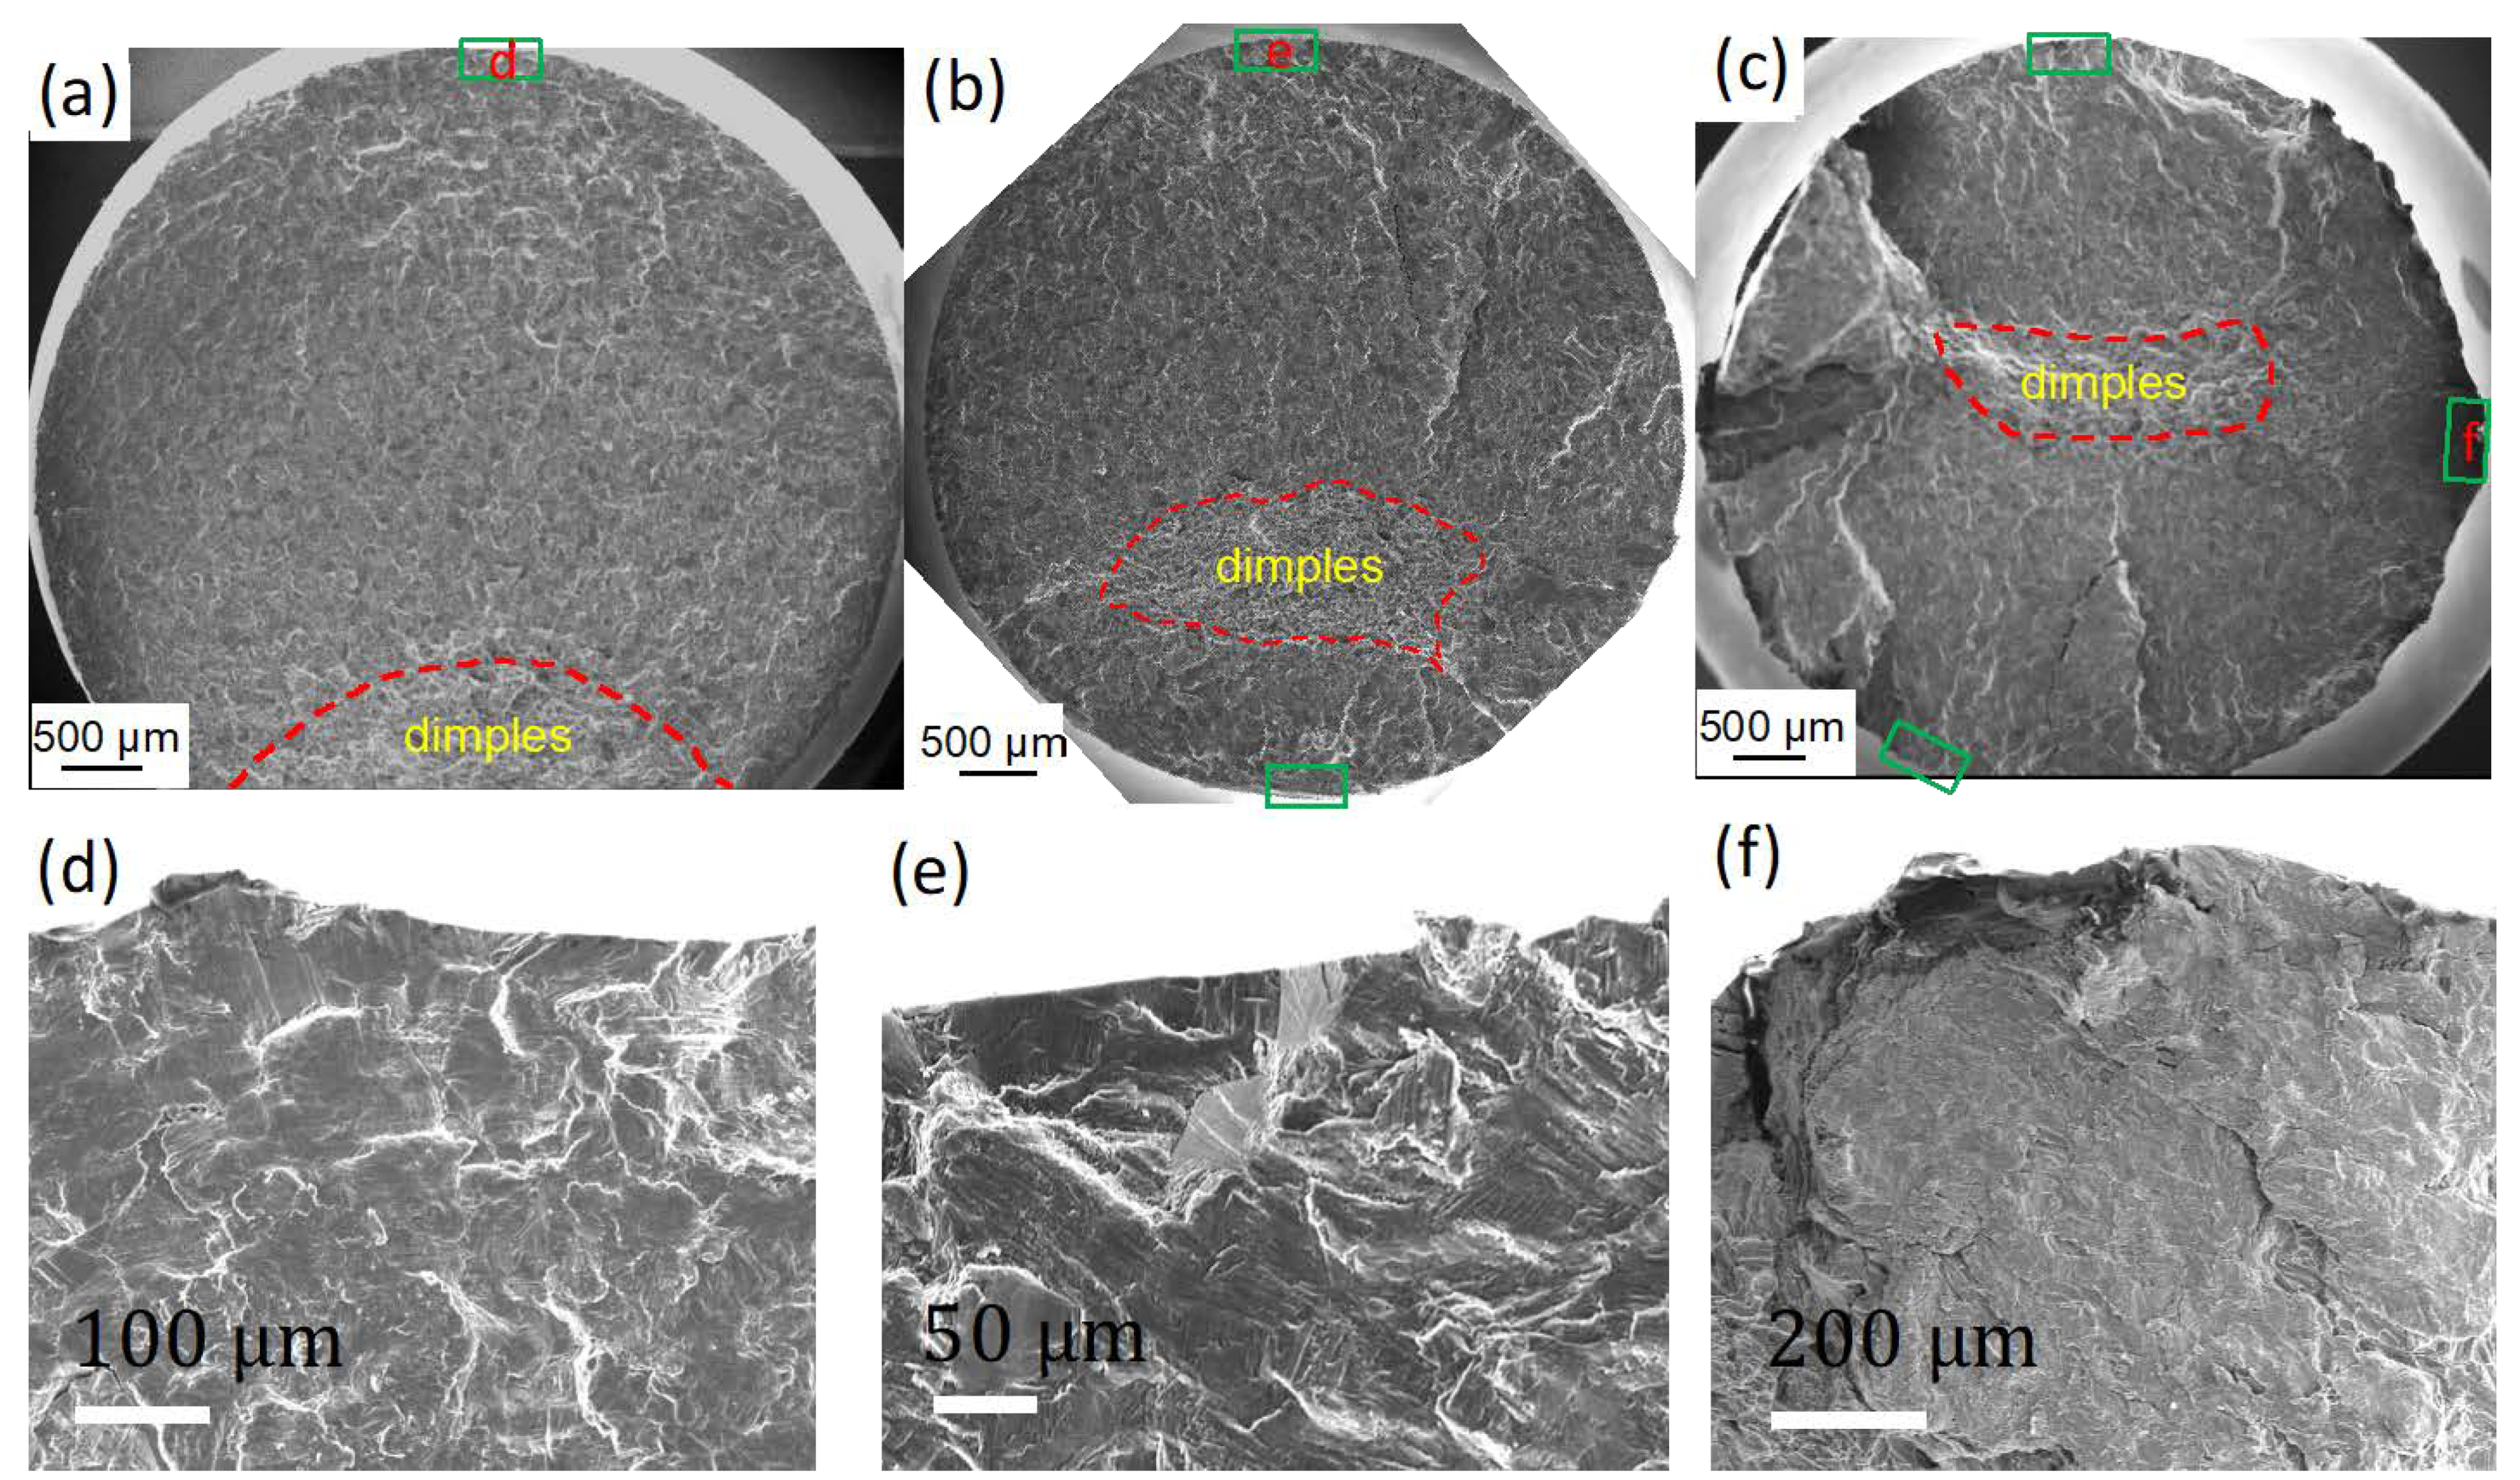
3.2. Fatigue Crack Nucleation and Propagation, Propagation Rate and Fractography

Figure 3 shows optical micrographs of the fatigue surface crack and its surroundings at various cycles at 175 MPa. The microstructure in Figure 3a shows an image taken before the test corresponding to a region where the main fatigue crack initiated. After 2 × 10⁵ cycles, a micro-sized crack located inside an α grain can be seen (Figure 3b). This indicates that the crack initiated between 1 × 10⁵–2 × 10⁵ cycles, as no crack was found after 1 × 10⁵ cycle (not shown here). Therefore, it is evident that most of the fatigue lifecycle was consumed by fatigue crack propagation considering total fatigue life (6.94 × 10⁵ cycles). Crack propagation and its features after 4 × 10⁵ cycles can be observed in Figure 3c, and was predominantly transgranular in nature and thus deflected by almost every grain. Following 6 × 10⁵ cycles (Figure 3d), crack propagation was incremental, continuing in transgranular mode. Some important fatigue crack propagation features, such as crack branching (Figure 3f,h) and fine scale zig-zag (Figure 3e–h) can also be seen. Some lines, presumably slip bands and/or deformation twinning, according to [14], appear in some grains (Figure 3f,h). Interactions between the crack and those lines confirm that cracking propagated along or across these slip bands/deformation twinning. Ismarrubie and Sugano [15] have also reported such lines belonging to slip bands. While crack branching in Figure 3f is transgranular, intergranular cracking also appears in Figure 3h.
Figure 4 delineates the initiation and subsequent propagation of the main crack at various cycles at 227 MPa. Figure 4a illustrates the main fatigue crack, with a zig-zag pattern, after 1 × 10⁵ cycles. This crack has been sectioned to understand its propagation mechanism. There are three sub-cracks labeled 1–3 connected to the main crack. Sub-cracks were labeled according to their connecting sequence with the main crack. Therefore, it can be seen that the fatigue crack of CP Ti tested at higher stress amplitude (227 MPa) grew by coalescing sub-cracks. Figure 4b shows the main crack after 0.4 × 10⁵ cycles, with the crack initiation site marked by red arrows. It is worth mentioning that the crack initiated between 0.2 × 10⁵–0.3 × 10⁵ cycles, as there was no crack at 0.2 × 10⁵ cycles (not shown here). Similar to the sample tested at 175 MPa, this condition also consumed majority of the total cycle of crack growth. Figure 4c–e show micrographs after 0.5 × 10⁵, 0.7 × 10⁵ and 0.9 × 10⁵ cycles, respectively, where pre-coalescence of the sub-cracks with the main crack are shown. Unlike the crack at 175 MPa, the crack at 227 MPa preferably propagated via coalescing sub-cracks. This is the first time we saw such a difference in crack propagation mechanism with respect to the stress amplitude in CP Ti. Of the fatigue characteristics, a zig-zag nature and fine-scale crack branching are also visible under this condition. As at 175 MPa, a transgranular fracture mode was also predominant in this case. It is worth mentioning that crack propagation behavior at 200 MPa was identical to that at 227 MPa.
Figure 5 shows the relationship between crack length and number of cycles, as well as crack propagation rate with respect to the crack length. These data have been calculated based on the crack paths shown in Figure 3 and Figure 4. While the crack length in the 175 MPa sample grows steadily, crack length at 227 MPa increases abruptly after around 300 µm (Figure 5a). On the other hand, the crack growth rate in the 227 MPa sample is significantly higher than that of the 175 MPa sample for cracks longer than 100 µm. Figure 6 shows the fracture surfaces of the samples tested at various stress amplitudes. Three main features, including (i) crack initiation site (marked with green boxes), (ii) crack propagation, and (iii) the final fracture as dimples can be observed in each sample. Higher magnification images of the crack initiation sites are shown in Figure 6d–f. Interestingly, the position of the dimples progressively moves toward centre of the sample with increased stress amplitude. This corresponds to the number of cracks responsible for fracture with stress amplitude; for instance, one single crack, two cracks and three cracks were responsible for fracture of samples tested at 175, 200 and 227 MPa, respectively.

4. Discussion

4.1. Fatigue Crack Initiation and Propagation

Fatigue cracks at various stress amplitudes evidently initiated from the surfaces of the specimens (Figure 6d–f). This is consistent with earlier claims that fatigue cracks in Ti and its alloys tend to initiate from surface in the case of continuous cyclic loading if the surface is free of residual stress [16]. In this study, mechanical polishing followed by chemical etching was performed in order to ensure a residual stress-free surface so that crack would start from specimen surface. The measured angle of ~50° (Figure 3b and Figure 4b) between crack initiation and the loading axis is close to that of the maximum critical resolved shear stress (45°). The cracks thereafter propagated along a direction of approximately 70° with respect to the loading axis, which is corresponded to mixed mode I and mode II crack growth. Close examination of crack path shows that a significant portion of the cracks propagated as zig-zag where the crack paths moved along or across slip bands/deformation twinning in short distances (Figure 4e–h). Such zig-zag phenomenon has been attributed to the alternative branching mode I and mode II in forged VT3-1 alloy [17]. Some portion of the crack propagated along the direction perpendicular to the loading axis, corresponding to mode II. It has been mentioned in [18,19] that a shift in direction perpendicular to the specimen may sometimes appear in crack branching. This is consistent with the results shown in Figure 4f. The nature of the crack path is likely not dependent on the stress amplitude, while the number of cracks causing failure is highly dependent upon the stress amplitude. At 175 MPa, a single crack was responsible for failure, whereas at higher stress amplitudes the number of cracks that are responsible for failure increases. For instance, two cracks and three cracks nucleated at different stages in samples tested at 200 and 227 MPa (Figure 3b,c), respectively. Each of the main crack propagated via the sub-crack coalescence mechanism (Figure 5). Therefore, it can be claimed that fatigue crack nucleation and their propagation in CP Ti are largely dependent on the stress amplitude.

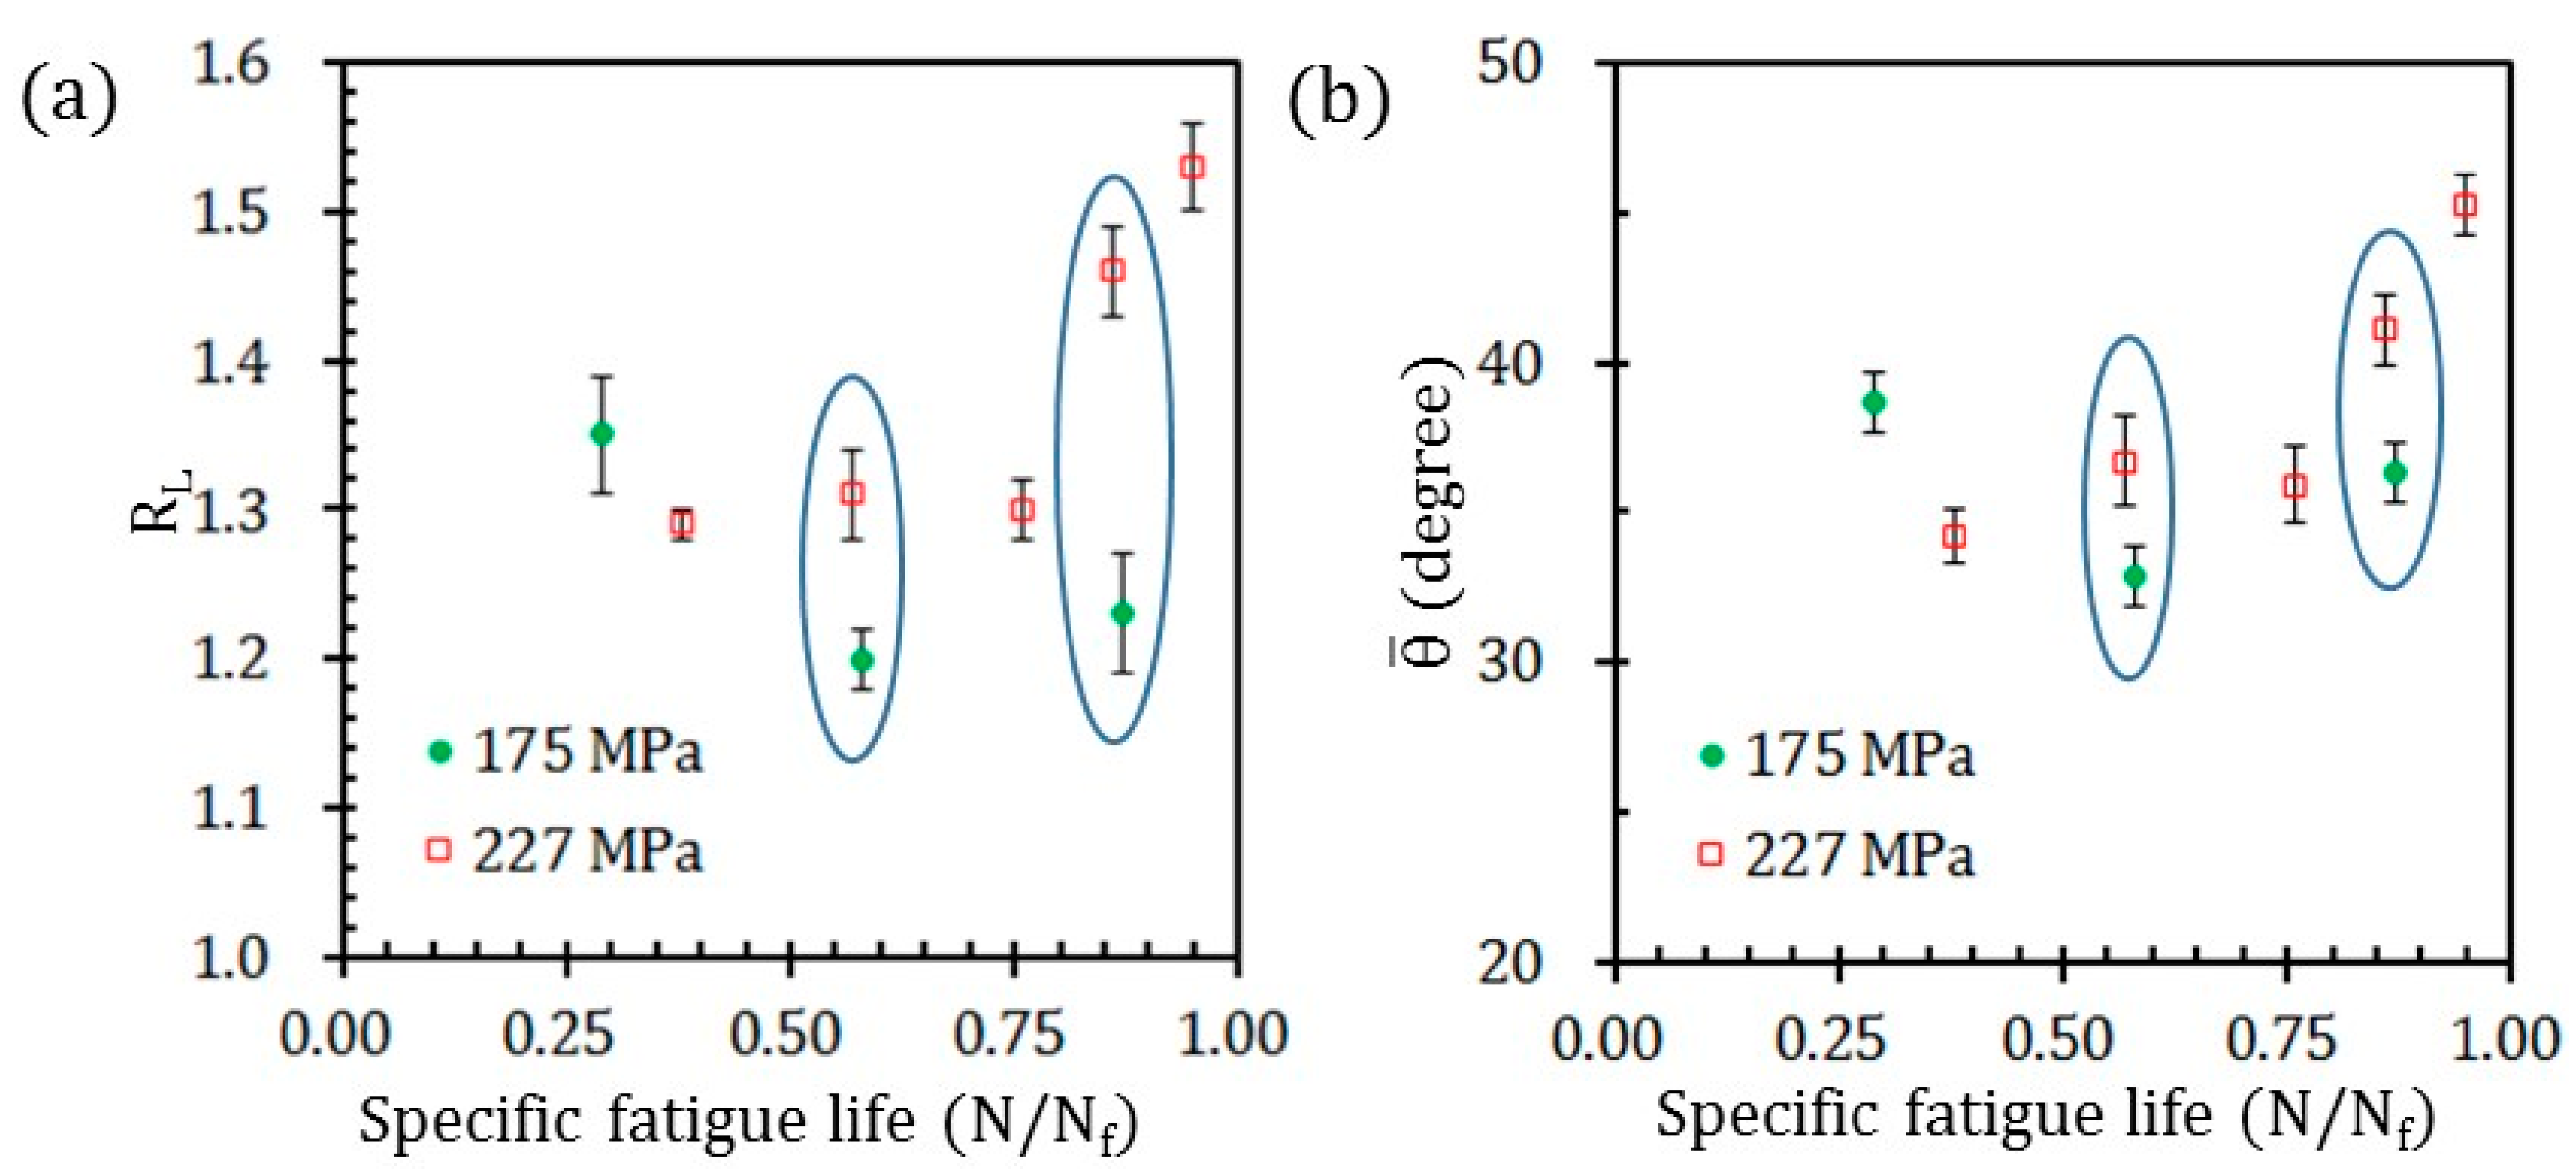
4.2. Role of Roughness Induced Crack Closure (RICC)

It is established that crack tortuosity, crack branching or their combination induce crack closure, as they promote higher roughness [19]. In this study, we have seen crack deflections with a zig-zag nature, crack branching, and a directional shift perpendicular to the specimen surrounding crack branching. Therefore, it is assumed that RICC has played a role in crack propagation. As such, the RICC for 175 and 227 MPa samples has been calculated; the stress amplitude dependence of RICC is discussed below.
A model proposed by Pokluda and Pippan is used to quantitatively measure RICC [20]. The total maximum level of RICC, ( δ cl δ max ) RICC , can be expressed as follows:
( δ cl δ max ) RICC   =   η ( R θ 2 1 )   +   3 η ( R θ 1 ) [ 6   + 3 ( R θ 1 ) ]
where C ≈ 10−1 is a dimensionless constant independent of material, Rθ = cos−1( θ ¯ ), is the arithmetic mean of the angle that dictates the crack deflection with crack propagation (Figure 7b). η is a parameter that strongly depends on the size ratio, SR = dm/rp where dm is the mean grain size and rp is the static plastic zone size. Static plastic zone size varies depending on the maximal applied intensity factor as a function of the applied stress amplitude and the crack length. Therefore, the value of η differs for different stress amplitudes and, moreover, significantly changes during crack propagation. To assess the values of η at various crack lengths, the following equation [21] is applied:
η = exp [−(0.886 rp/dm)2.2]
For a small crack length, 2a = 100 µm, we obtain η175 = 0.96, η227 = 0.88 and η175227 = 1.09. This means that there is still a substantial level of RICC for both stress amplitudes. For a longer crack of 2a = 300 µm, however, the result is η175 = 0.64, η227 = 0.25 and η175227 = 2.56. Interestingly, the level of RICC for σa2 (=227 MPa) becomes significantly lower than that for σa1 (=175 MPa). In the case of 2a = 500 µm, it holds η175 = 0.26, η227 = 0.014, η175227 = 18.6 and the level of RICC for σa2 (=227 MPa) already becomes negligible. The above comparative analysis clearly shows that there is a lower level of RICC related to the higher applied stress amplitude σa2 (=227 MPa) for all fatigue cracks longer than 100 µm, which corresponds to a higher crack growth rate under the applied stress amplitude σa2 (=227 MPa) than that for σa1 (=175 MPa). This clearly explains the slow crack growth up to around 100 µm of sample under the applied stress amplitude. Crack coalescence under the applied σa2 (=227 MPa) happened for cracks much longer than 100 µm with the level of RICC lower (or even negligible) compared to that under the stress σa1 (=175 MPa). Therefore, crack coalescence is considered to compensate for lower RICC level for σa2 (=227 MPa). On the other hand, the crack coalescence could compensate for the retardation of crack growth rate caused by a longer crack path due to a higher tortuosity (i.e., zig-zag growth) of the crack when σa2 (=227 MPa). This retardation is considered to be directly proportional to the linear roughness ratio, RL175/RL227 [21]. Indeed, the kinking geometry does not change the level of the maximum shear stress ahead of the crack front; therefore, the related decrease of KIa (geometrical shielding) has no considerable effect on the crack growth rate [22].

5. Conclusions

Fatigue crack growth behaviour such as crack propagation and its features, roughness-induced crack closure and fatigue striation with respect to various stress amplitudes (175, 200 and 227 MPa), were studied here for CP Ti. The followings are the main outcomes of the investigation:
  • Number of cycles to failure increased from 1.05 × 10⁵ to 3.40 × 10⁵ to 6.94 × 10⁵ with decreasing stress amplitude from 227 to 200 to 175 MPa, respectively. Throughout the total life cycle, most of the cycle was spent on crack growth for all stress conditions. It was found that cracks initiated from the surface of the samples.
  • A single fatigue crack was observed to be responsible for failure of sample tested at 175 MPa. At 200 MPa, two main cracks, and at 227 MPa three cracks were recorded for fatigue failure. Each of the cracks at 227 MPa propagated via sub-crack coalescence. In all conditions, crack deflection, crack branching and slip bands, which are characteristics of crack closure, were noticed. Beyond the initial 100 µm, crack growth rate for the 227 MPa sample was higher than that of the 175 MPa sample.
  • RICC calculation for crack lengths of 100, 300 and 500 µm under the 175 and 227 MPa conditions showed a remarkable outcome. Up to 500 µm crack length a substantial RICC was calculated at 175 MPa, while the same level of RICC for 227 MPa was found up to 300 µm. Beyond 100 µm, the RICC level for 175 MPa displayed a higher value than at 227 MPa. This gives a reasonable explanation for the abrupt increase of crack growth rate under the 227 MPa condition.

Author Contributions

Conceptualization, M.A. and D.R.; validation, M.A.; investigation, M.A., M.S.I.; resources, R.C., S.Y.; data curation, M.A.; writing—original draft preparation, M.A., M.S.I.; writing—review and editing, D.R.; visualization, M.A., M.S.I.; supervision, D.R.; funding acquisition, M.A. All authors have read and agreed to the published version of the manuscript.

Funding

This project has received funding from Enterprise Ireland and the European Union’s Horizon 2020 Research and Innovation Programme under the Marie Sklodowska-Curie grant agreement No 847402.

Institutional Review Board Statement

Not applicable.

Informed Consent Statement

Not applicable.

Data Availability Statement

Not applicable.

Conflicts of Interest

The authors declare no conflict of interest.

References

  1. Takao, K.; Kusukwa, K. Low-cycle fatigue behaviour of commercially pure titanium. Mater. Sci. Eng. A 1996, 213, 81–85. [Google Scholar] [CrossRef]
  2. Wang, S.-H. A study on the change of fatigue fracture mode in two titanium alloys. Fatigue Fract. Eng. Mater. Struct. 1998, 21, 1077–1087. [Google Scholar] [CrossRef]
  3. Suresh, S. Crack deflection: Implications for the growth of long and short fatigue cracks. Metall. Trans. A 1983, 14, 2375–2385. [Google Scholar] [CrossRef]
  4. Ogawa, T.; Tokaji, K.; Ohya, K. The effect of microstructure and fracture surface roughness on fatigue crack propagation in a Ti-6A1-4V alloy. Fatigue Fract. Eng. Mater. Struct. 1993, 16, 973–982. [Google Scholar] [CrossRef]
  5. Llorca, J. Roughness-induced fatigue crack closure: A numerical study. Fatigue Fract. Eng. Mater. Struct. 1992, 15, 655–669. [Google Scholar] [CrossRef]
  6. Wang, S.-H.; Müller, C. Fracture surface roughness and roughness-induced fatigue crack closure in Ti-2.5 wt% Cu. Mater. Sci. Eng. A 1998, 255, 7–15. [Google Scholar] [CrossRef]
  7. Suresh, S. Fatigue crack deflection and fracture surface contact: Micromechanical models. Metall. Trans. A 1985, 16, 249–260. [Google Scholar] [CrossRef]
  8. Antunes, F.V.; Ramalho, A.; Ferreira, J.M. Identification of fatigue crack propagation modes by means of roughness measurements. Int. J. Fatigue 2000, 22, 781–788. [Google Scholar] [CrossRef] [Green Version]
  9. Ritchie, R.O.; Suresh, S. Some considerations on fatigue crack closure at near-threshold stress intensities due to fracture surface morphology. Metall. Trans. A 1982, 13, 937–940. [Google Scholar] [CrossRef]
  10. Ding, Y.S.; Tsay, L.W.; Chen, C. The effects of hydrogen on fatigue crack growth behaviour of Ti–6Al–4V and Ti–4.5Al–3V–2Mo–2Fe alloys. Corros. Sci. 2009, 51, 1413–1419. [Google Scholar] [CrossRef]
  11. Okayasu, M.; Chen, D.; Wang, Z. Experimental study of the effect of loading condition on fracture surface contact features and crack closure behavior in a carbon steel. Eng. Fract. Mech. 2006, 73, 1117–1132. [Google Scholar] [CrossRef]
  12. Student, O.Z.; Cichosz, P.; Szymkowski, J. Correlation between the fracture roughness and fatigue threshold of high-temperature degraded steel. Mater. Sci. 1999, 35, 796–801. [Google Scholar] [CrossRef]
  13. Jiang, X.P.; Wang, X.Y.; Li, J.X.; Li, D.Y.; Man, C.S.; Shepard, M.J.; Zhai, T. Enhancement of fatigue and corrosion properties of pure Ti by sandblasting. Mater. Sci. Eng. A 2006, 429, 30–35. [Google Scholar] [CrossRef]
  14. Wojcik, C.C.; Chan, K.S.; Koss, D.A. Stage I fatigue crack propagation in a titanium alloy. Acta Metall. 1988, 36, 1261–1270. [Google Scholar] [CrossRef]
  15. Ismarrubie, Z.N.; Sugano, M. Environmental effects on fatigue failure micromechanisms in titanium. Mater. Sci. Eng. A 2004, 386, 222–233. [Google Scholar] [CrossRef]
  16. Nikitin, A.; Bathias, C.; Palin-Luc, T.; Shanyavskiy, A. Crack path in aeronautical titanium alloy under ultrasonic torsion loading. Frat. Integrita Strutt. 2015, 10, 213–222. [Google Scholar] [CrossRef]
  17. Fintová, S.; Arzaghi, M.; Kuběna, I.; Kunz, L.; Sarrazin-Baudoux, C. Fatigue crack propagation in UFG Ti grade 4 processed by severe plastic deformation. Int. J. Fatigue 2017, 98, 187–194. [Google Scholar] [CrossRef]
  18. Małecka, J.; Rozumek, D. Metallographic and Mechanical Research of the O–Ti2AlNb Alloy. Materials 2020, 13, 3006. [Google Scholar] [CrossRef]
  19. Gray, G.T.; Williams, J.C.; Thompson, A.W. Roughness-Induced Crack Closure: An Explanation for Microstructurally Sensitive Fatigue Crack Growth. Metall. Trans. A 1983, 14, 421–433. [Google Scholar] [CrossRef]
  20. Pokluda, J.; Pippan, R. Analysis of roughness-induced crack closure based on asymmetric crack-wake plasticity and size ratio effect. Mater. Sci. Eng. A 2007, 462, 355–358. [Google Scholar] [CrossRef]
  21. Pokluda, J.; Sandera, P. Micromechanisms of Fracture and Fatigue; Springer: London, UK, 2010. [Google Scholar]
  22. Pippan, R. The crack driving force for fatigue crack propagation. Eng. Fract. Mech. 1993, 44, 821–829. [Google Scholar] [CrossRef]
Figure 1. (a) Schematic of sample with the dimensions used for the rotating bending test (dimensions in mm); (b) Y-coordinates along the crack path profile with equidistant spacing.
Metals 11 01656 g001
Figure 2. (a) Initial microstructure; (b) Representative stress–strain curve of the studied CP Ti.
Metals 11 01656 g002
Figure 3. At 175 MPa: Images showing surface crack paths at different cycles: (a) Initial condition, i.e., N = 0 cycle; (b) After N = 2 × 10⁵ cycles; (c) After N = 4 × 10⁵ cycles; (d) After N = 6 × 10⁵ cycles. The free-shape object in (a) and (b) indicates a particular area where the crack started. The red arrows illustrate crack initiation sites, and black arrows delineate the crack tips. Examples of fine zig-zag (e,g), crack branching (f,g), and crack interactions with slip bands (e,h).
Metals 11 01656 g003
Figure 4. At 227 MPa: Images displaying crack paths at different cycles. After (a) N = 1 × 10⁵ cycles; (b) N = 0.4 × 10⁵ cycles; (c) N = 0.5 × 10⁵ cycles; (d) N = 0.7 × 10⁵ cycles; (e) N = 0.9 × 10⁵ cycles. Red arrows show the crack initiation line, while black arrows indicate crack tips; (c) shows the main crack and sub-crack 1 before coalescing, while the main crack and sub-crack 2 can be seen in (d); (e) shows the main crack and sub-crack 3 prior to coalescence. The yellow arrows in (a) indicate the junctions of crack coalescence.
Metals 11 01656 g004
Figure 5. (a) Relationship between fatigue crack length and number of cycles; (b) Crack growth rate with respect to fatigue crack length.
Metals 11 01656 g005
Figure 6. Fractography of the samples tested at (a) 175, (b) 200, and (c) 227 MPa. Green boxes indicate the nucleation sites of the main cracks. Crack nucleation sites for (d) 175, (e) 200, and (f) 227 MPa stress conditions.
Metals 11 01656 g006
Figure 7. Roughness parameters of samples tested at the stress of 175 and 227 MPa based on the surface crack path profile: (a) Linear roughness parameter, RL; (b) Arithmetic mean of the deflection angle, ( θ ¯ ). Specific fatigue life denotes the ratio of instantaneous fatigue life (N) to total fatigue life (Nf); the ellipses in (a,b) show a comparison at a specific point.
Metals 11 01656 g007
Table 1. Chemical composition (in wt%) of the CP Ti.
TiOHFe
Balance0.0780.0050.026
Table 2. Summary of fatigue tests results obtained in this study.
Stress Amplitude, MPaCrack Initiation Cycle (×105)Total Life Cycle (×105)
1751.0–2.06.94
2000.5–1.03.40
2270.2–0.31.05
Publisher’s Note: MDPI stays neutral with regard to jurisdictional claims in published maps and institutional affiliations.

