1. Introduction
Grain-oriented silicon steel, which is mainly used as the core material of transformers, is the only product manufactured through a secondary recrystallization process in the steel [
1]. The ultimate purpose of its production is to obtain the sharp {110}<001> Goss texture, which possesses the qualities of high magnetic induction and low iron loss, eventually guaranteeing the excellent stability and magnetic properties of finished products [
2]. The key technology used to produce grain-oriented silicon steel with the sharp Goss texture is effective control of the inhibitors [
3,
4,
5]. The most commonly used inhibitors in traditional grain-oriented silicon steel are MnS and AlN [
6,
7,
8], whose higher solution temperature (>1350 °C) results in a higher slab reheating temperature before hot rolling, inevitably resulting in many bad consequences, such as larger energy consumption, severe equipment damage and higher costs [
9]. As such, it is imperative to develop new types of inhibitors to realize slab reheating with a low temperature. The researchers in this study turned their focus to Cu sulfides, which mainly exist in the form of compounds, however, related reports do not express a consistent viewpoint about their specific types and precipitation mechanisms [
10,
11,
12]. Taking Cu sulfides as the main inhibitor, the slab temperature of grain-oriented silicon steel still needs to be reheated to above 1250 °C [
13]. Recently, niobium carbide/nitride is found to have a number of similar features to common inhibitors, such as the particle size, number and dispersity, and belongs to a kind of stable phase with a slow coarsening rate and low solution temperature, possibly playing a role as the inhibitor in the grain-oriented silicon steel to achieve the goal of slab reheating at a low temperature [
14]. Therefore, the element Nb was added into traditional grain-oriented silicon steel and the content of other elements was adjusted accordingly in order to obtain a new type of inhibitor composition on oriented silicon steel with Nb(C,N) as the main inhibitor, and, finally, to realize the slab reheating temperature at under 1250 °C [
15,
16].
The main inhibitor has changed to Nb-containing grain-oriented silicon, so it is necessary to study the solid solution precipitation behavior of Nb(C,N) in each stage and its influence on the microstructure, texture and magnetic properties. B. Liu et al. analyzed the microstructure and texture of hot rolled Nb-containing grain-oriented silicon steel [
17]. F. Fang et al. investigated the effect of Nb on the microstructure, texture and magnetic properties of strip-cast grain-oriented silicon steel [
18]. In our previous works, the effect of different slab reheating temperatures was systematically studied, and 1220 °C was found to be the best reheating temperature for Nb-containing grain-oriented silicon steel [
16,
19].
The decarburizing annealing process in the production of grain-oriented silicon steel is very important for forming good magnetic properties [
20]. To date, the reports related to the intermediate annealing of grain-oriented silicon steel are mainly focused on its heating temperature, holding time and annealing atmosphere [
21,
22,
23], but studies on the heating rate are rarely seen. In general, intermediate annealing is normally used for partial decarburization, while decarburizing annealing after secondary cold rolling is always carried out to ensure that the final carbon content is controlled within 8 × 10
−5 [
24]. Afterwards, W. Guo et al. found that full decarburizing during intermediate annealing in combination with recovery treatment after the secondary cold rolling can achieve a similar or even better decarbonization effect [
25]. The effect of intermediate annealing parameters on the primary recrystallization microstructure, texture and magnetic properties of Nb-containing grain-oriented silicon steel has not been reported, and thus it is not clear whether the same rule is shown with traditional grain-oriented silicon steel. On the basis of Guo’s idea, the different heating rates of intermediate annealing were chosen to first study their effects on the microstructure, texture, characteristic grain boundary and inhibitors of primary recrystallization, and then discuss the decarbonization effect, which ultimately helps in determining the best heating rate of Nb-containing grain-oriented silicon steel.
2. Materials and Methods
The material used in this work is the first cold-rolled plate of Nb-containing grain-oriented silicon steel with thickness of 0.75 mm. Its chemical compositions are listed in
Table 1. The reduction of the first cold rolling is 70%. Before the first cold rolling, the as-cast billet was first reheated to 1220 °C and held for 20 min in a nitrogen atmosphere, and then hot rolled in six passes to 2.3 mm in thickness with finishing rolling temperature of 870 °C. Subsequently, two-stage normalizing annealing was followed.
The intermediate annealing was conducted in a KBF11Q (Tianjin Zhonghuan Experimental Electric Furnace Co., Ltd., Tianjin, China) rapid thermal annealing furnace under a wet atmosphere of 25% H2 + 75% N2, with the water bath temperature of 60 °C. The specimens which were taken from the first cold-rolled plate were first heated to 840 °C at a heating rate of 10 °C/s, 15 °C/s, 20 °C/s, 25 °C/s and 30 °C/s, were then held for 10 min, and subsequently air cooled to room temperature. During the cooling process, H2 and N2 were stopped from flowing into the furnace. After intermediate annealing, the annealed plates were cold rolled for a second time, with a rolling reduction of 60%, and were recovered at 550 °C for 2 min, followed by high temperature annealing at 1200 °C for 8 h, with a heating rate of 50 °C /h and air cooling.
The carbon content of the specimens before and after intermediate annealing with different heating rates was measured by a LECO CS744 (LECO, St. Joseph, MI, USA) high frequency infrared carbon sulfur analyzer. The carbon content of the specimens, which were just heated to the intermediate annealing temperature (840 °C) and then immediately quenched in water, was also measured. Because the decarburization process stops due to a lack of access to gas during the quenching process, the carbon content of the water-quenched specimens was approximately considered as that of when the temperature had just reached 840 °C.
The microstructures of the plate surface and thickness direction of annealed specimens were observed by an Axiovert 200 MAT optical microscope (OM, ZEISS, Tokyo, Japan). The microstructures were characterized with a Zeiss optical microscope and a FEI Quanta FEG 650 field-emission scanning electron microscope (SEM, FEI, Hillsboro, OR, USA), equipped with an electron backscattering diffraction (EBSD, AMETEK, Berwyn, PA, USA) device and TSL OIM Data Collection Software. The grain size analysis, the boundary analysis and the texture analysis of each sample were all calculated from EBSD. The scanning step size was 1.5 μm. The clean-up procedures are as follows: the clean-up type is grain dilation, the grain tolerance angle is 2, and the minimum grain size is 3. The EBSD analysis of each sample is all calculated based on the data of more than 400 grains. The average grain size is calculated using the method of “grain diameter”. The {001} pole figures of specimens after high temperature annealing were measured using a Bruker D8 Discover X-ray diffraction and CuKα radiation (λ = 0.15406 nm, 40 kV, 40 mA) was used for the measurement. Here, the thickness layer was defined by the parameters S = 2a/d, where a represented the distance away from the center layer and d was the whole sheet’s thickness. S = 0, S = 0.5 and S = 1 represent the surface, subsurface and center layer, respectively.
The observation of inhibitors in the annealed plates was carried out on a JEM-2010 transmission electron microscope (TEM, Nippon Optical Limited, Tokyo, Japan). The specimens for TEM were, first, mechanically ground to 0.05 mm in thickness, and then thinned by a twin-jet electropolishing device at 25 V in a mixture of 5% perchloric acid and 95% ethyl alcohol, with the solution being cooled to about −25 °C with liquid nitrogen. For different heating rates of intermediate annealing, 10 random TEM fields of view with a magnification of 19,500 were chosen to do the quantitative analysis regarding the particle size, number and density. The average particle size was measured by the Image-Pro Plus software. The iron loss P1.7/50 (W/kg) and magnetic induction B800 (T) of the high temperature annealed plates were measured by a MATS-2010SA (Hunan Lianzhong Technology Co., Ltd., Hunan, China) alternating magnetic measurement device in a single sheet tester, using the permeameter with the size of 30 × 100 mm2.
4. Discussion
In order to investigate the effect of different heating rates during the intermediate annealing process, the recrystallized microstructure, texture, grain boundary characteristics and inhibitors are discussed below.
As the heating rate increases, the average grain size along the plate surface and thickness direction tends to decrease and is less than 15 µm, especially when the heating rate is 30 °C/s. In addition, when the heating rate is within 10~25 °C/s, the differences in the grain sizes do not exceed 5 µm with every 5 °C/s rate. However, when the heating rate increases from 25 °C/s to 30 °C/s, the differences in the grain size are all larger than 10 µm (see
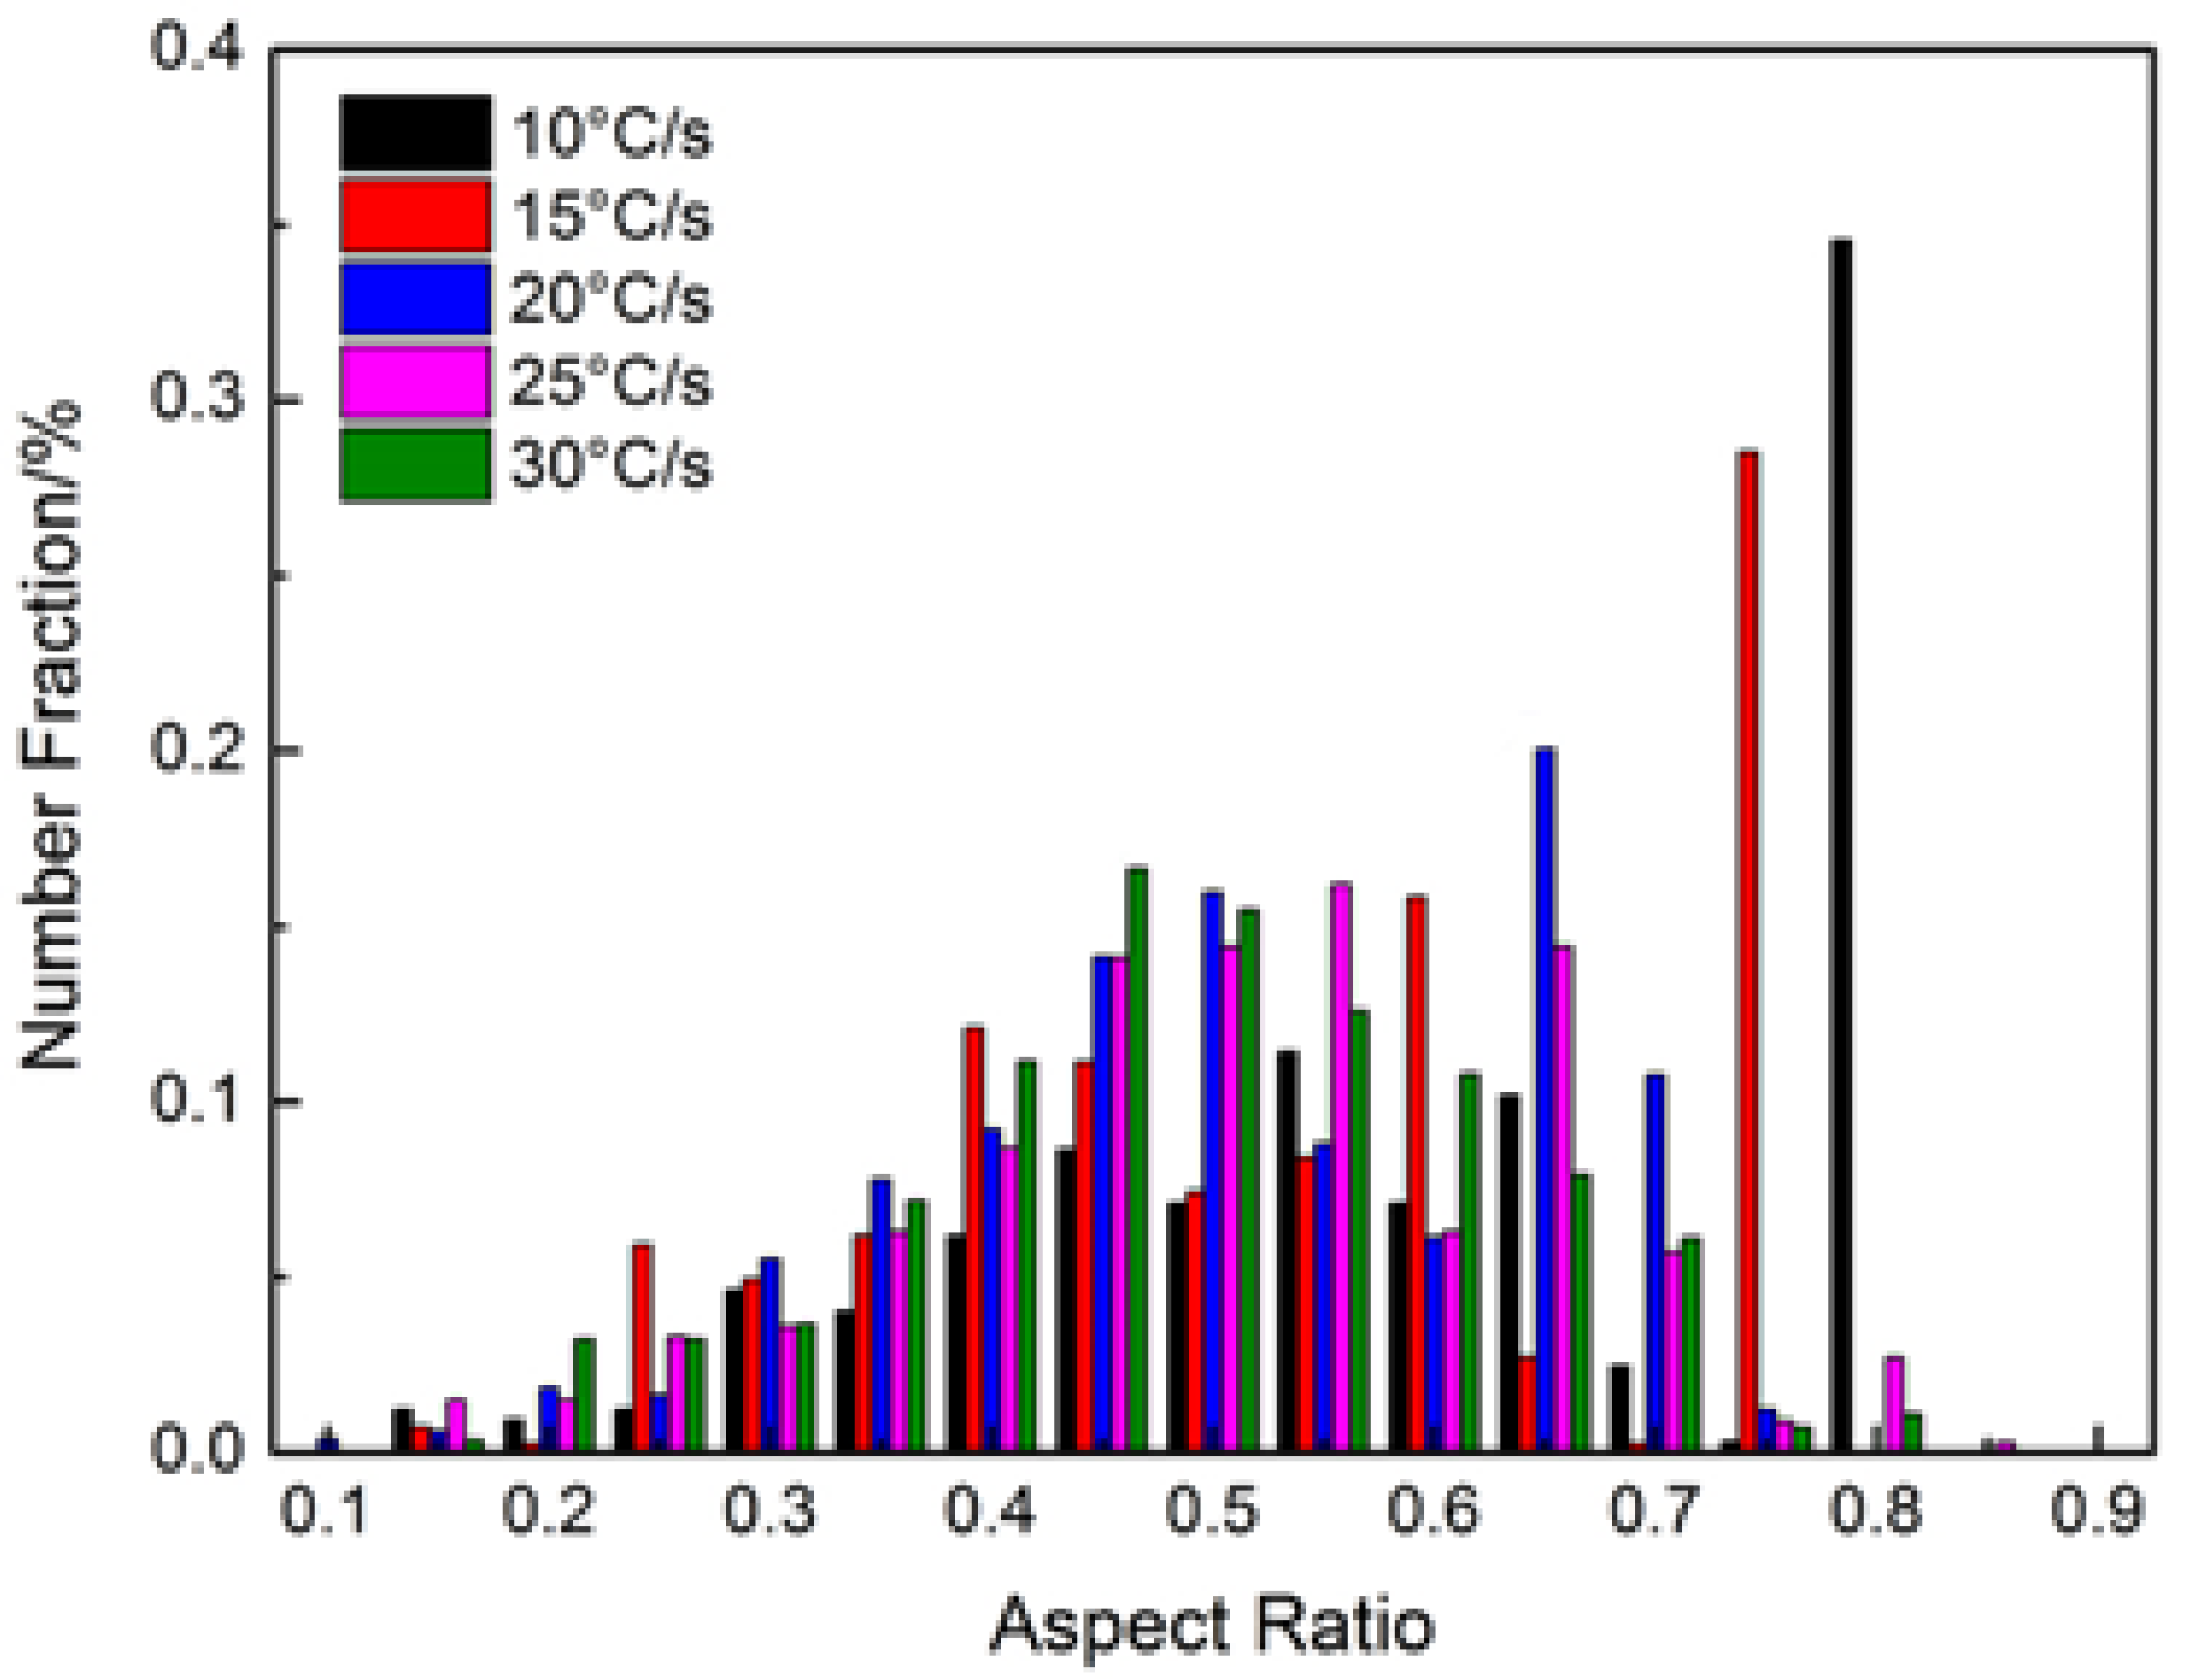
Table 2). This shows that the obtained grains are extremely small after intermediate annealing, with a heating rate of 30 °C/s. Moreover, with the increase of the heating rate, the aspect ratio shows a declining trend, which can effectively prevent recrystallized grains growing oversized and contribute to the abnormal growth of Goss grains during high temperature annealing.
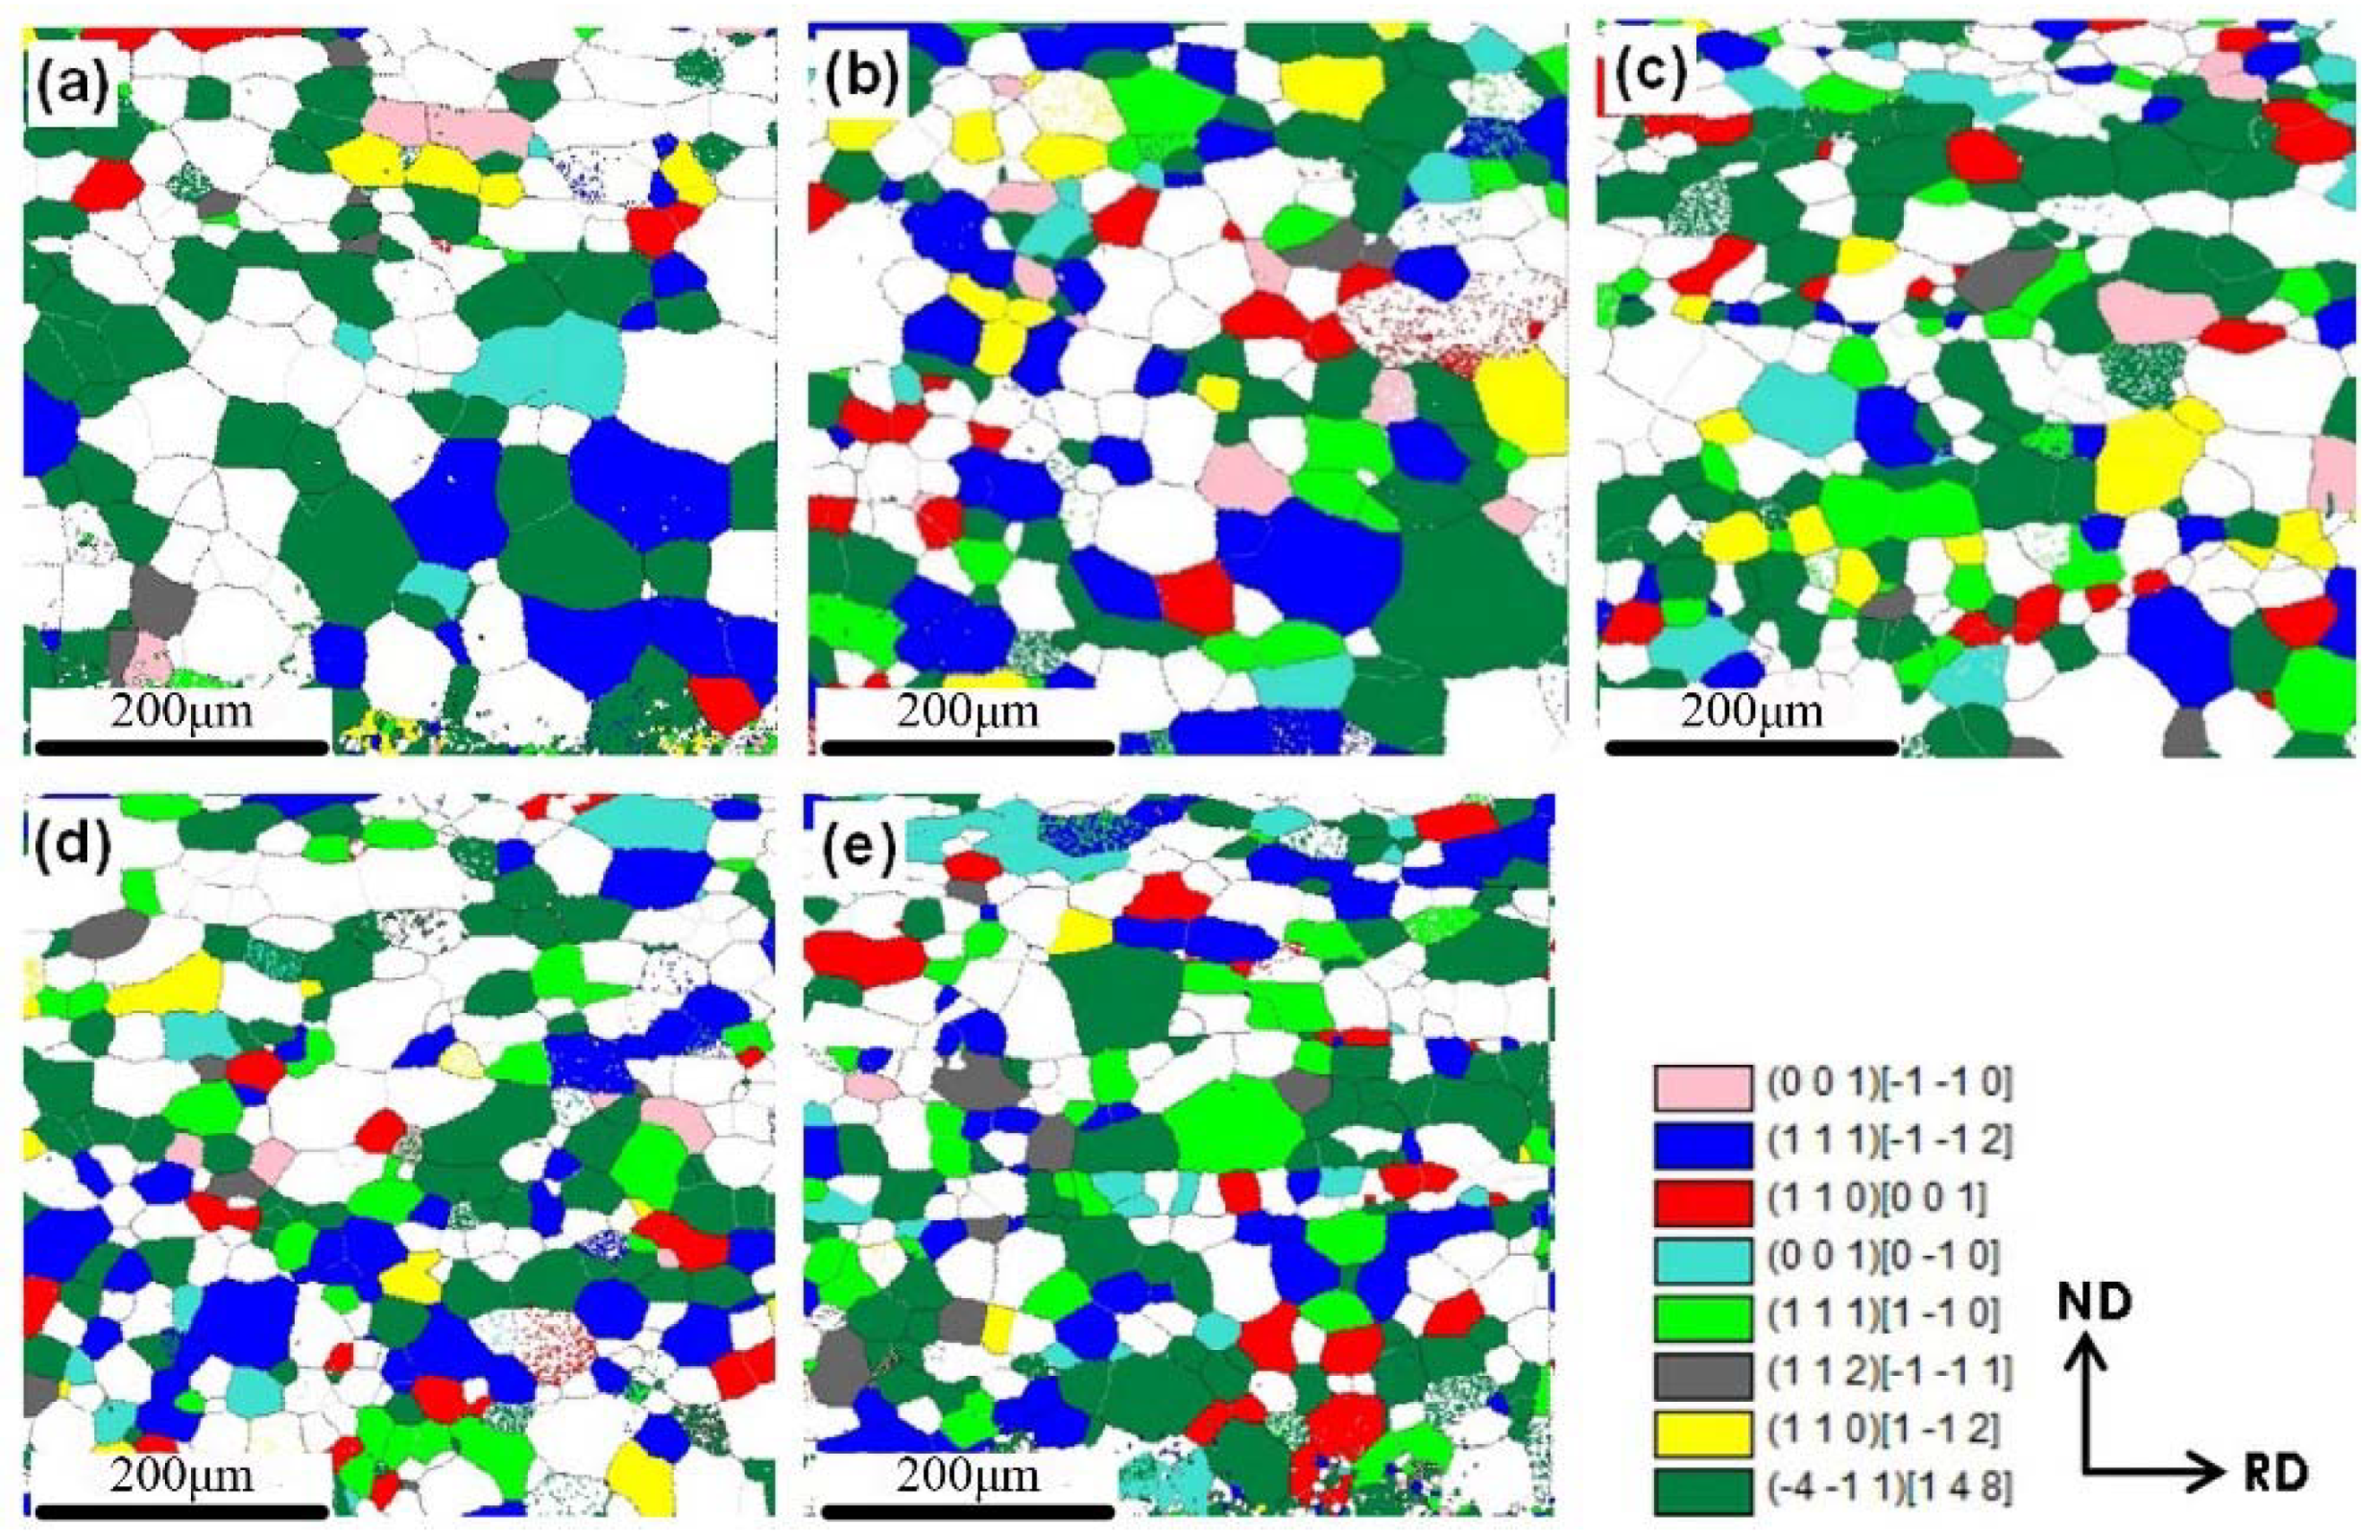
From the point of view of obtaining high magnetism of grain-oriented silicon steel, generally, the best texture distribution after primary recrystallization is strong γ-fiber texture and Goss texture distributing in the surface and subsurface, as well as some Goss grains being preserved at the center [
31]. Among the recrystallized grains in Nb-containing grain-oriented silicon steel, HEGBs are formed between Goss grains and γ-fiber {111}<112>/{411}<148> grains. It has been reported that the orientation between {111}<112> and Goss grains are close to Σ9 relationship, and {411}<148> grains are related to Goss grains by Σ9 orientation relationship (rotate along RD axis) [
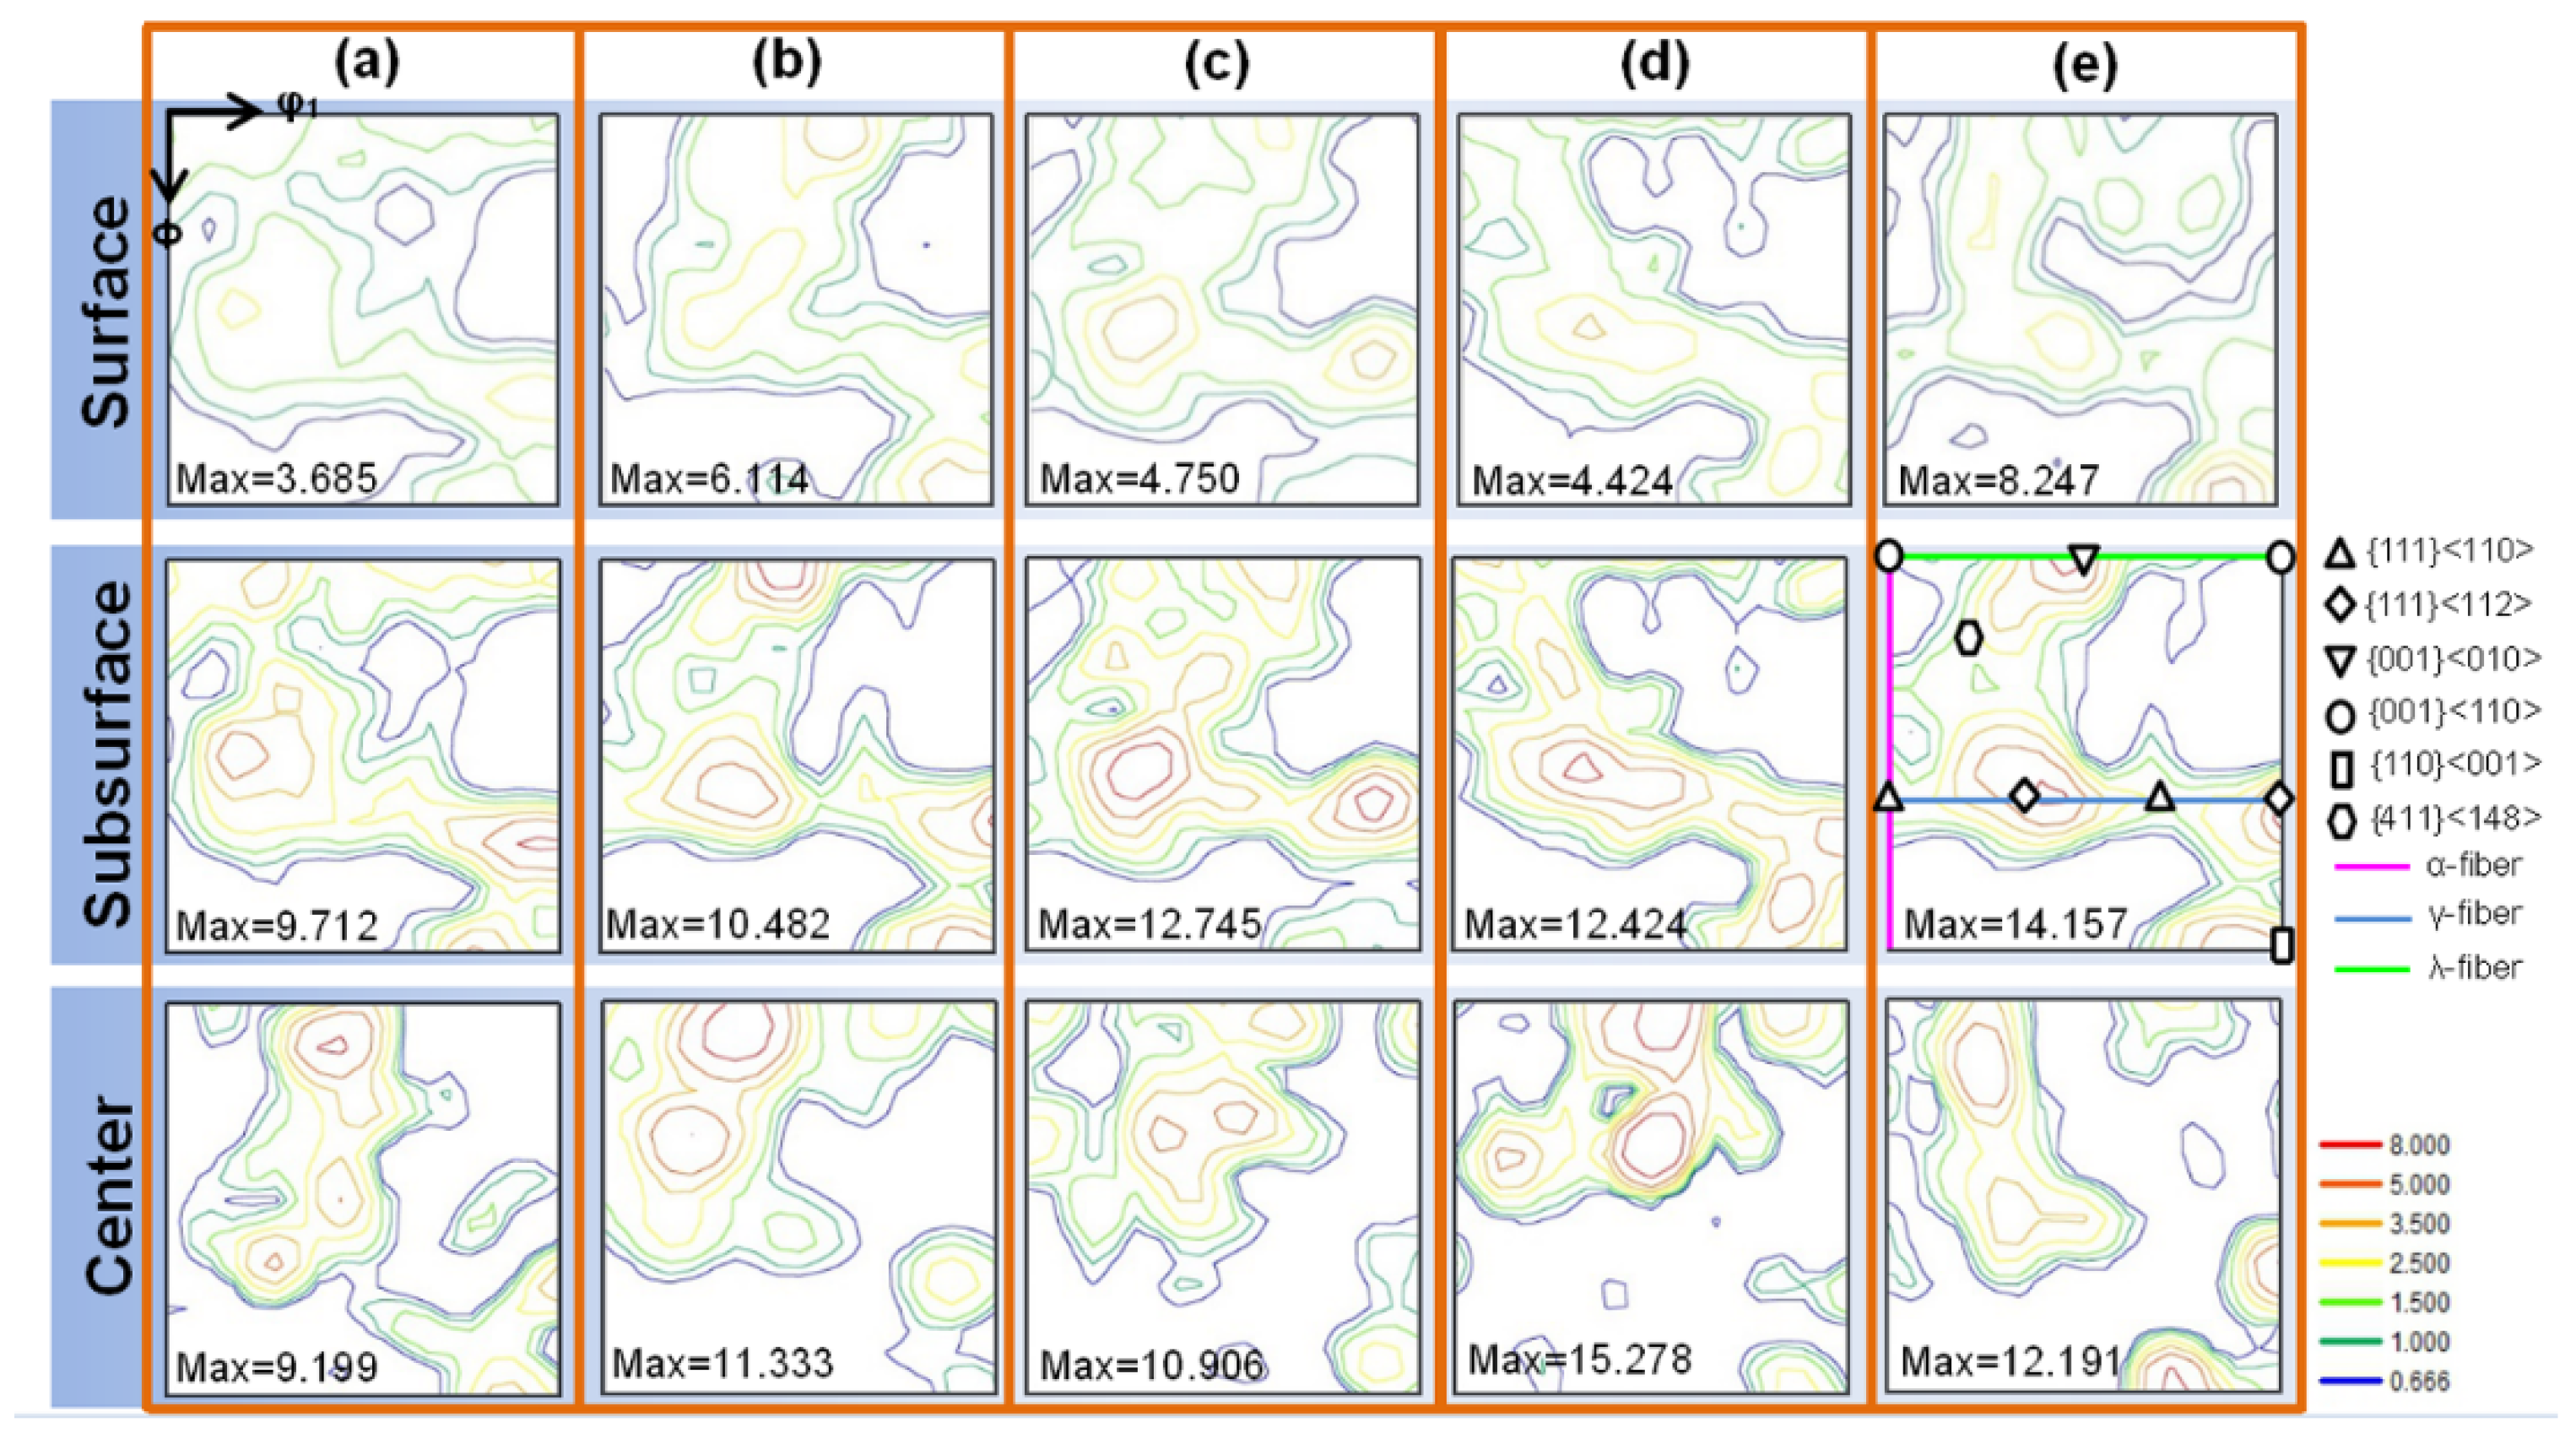
32]. Therefore, both {111}<112> and {411}<148> grains are beneficial to the secondary recrystallization of Goss grains, thus contributing to the useful texture. When the heating rate is 30 °C/s, γ-fiber and Goss textures in the surface and subsurface layer have a higher intensity compared with other heating rates, and {111}<112> orientation is relatively more accurate. In contrast, the γ-fiber texture has undergone a marked deflection with a heating rate of 10 °C/s and 15 °C/s (see
Figure 4). Meanwhile, the intensity of the {411}<148> texture at 30 °C/s nearly reaches the largest value in the surface, subsurface and center layers. It is also found that the {111}<112> texture has the highest content at 25 °C/s, but both the content of {411}<148> texture and total content of the useful textures {111}<112> and {411}<148> are the highest at 30 °C/s (see
Table 3), which demonstrate that the obtained texture after primary recrystallization with a higher heating rate is the most favorable for the growth of Goss grains.
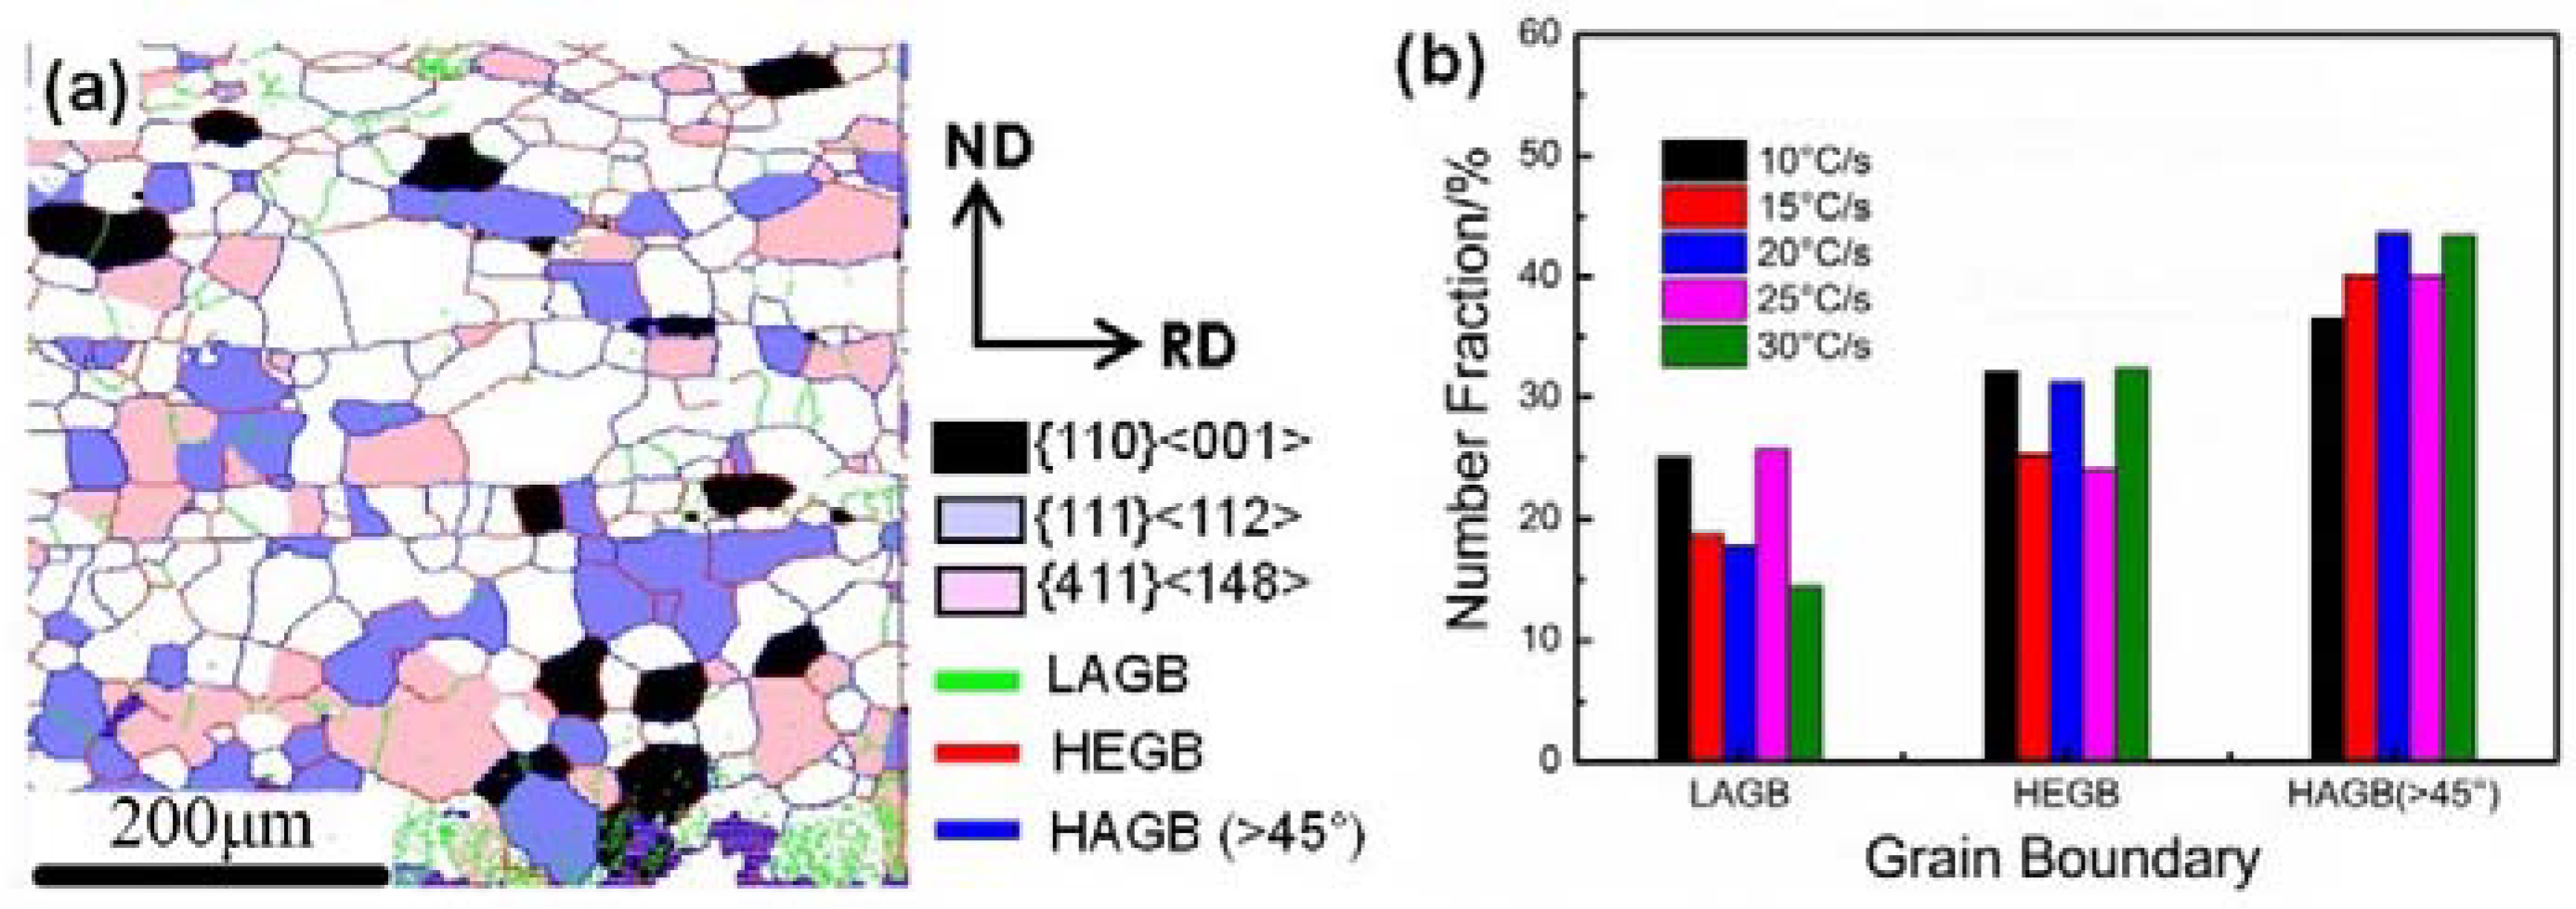
In consideration of characteristic grain boundary, the total content of HEGB and HAGB is the highest, while LAGB is the lowest after intermediate annealing with a heating rate of 30 °C/s (see
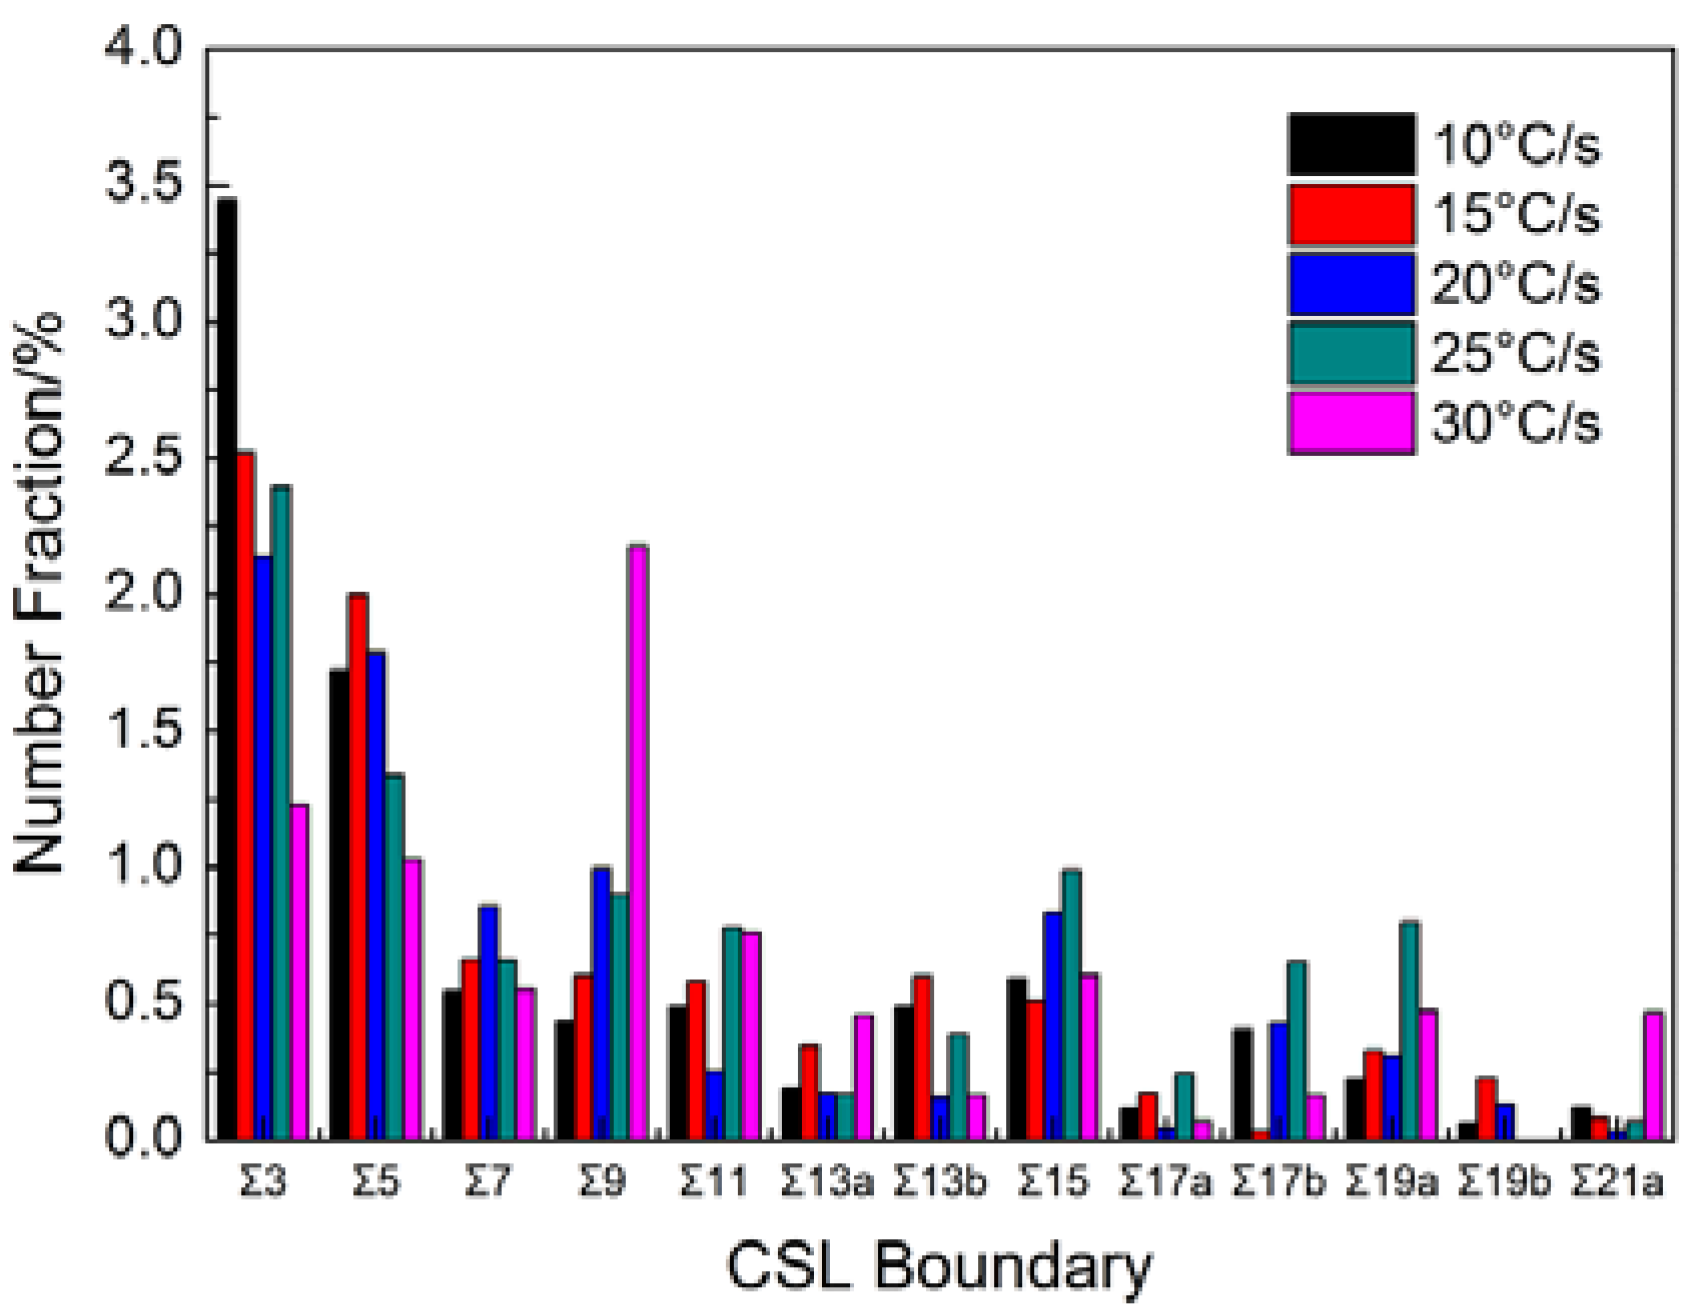
Figure 6). Additionally, the content of Σ9 boundaries reaches the maximum value at 30 °C/s and is much higher than those of other heating rates, followed by Σ3 and Σ5 boundaries (see
Figure 7). The above results show that the overall migration speed of the grain boundary is the fastest with a heating rate of 30 °C/s.
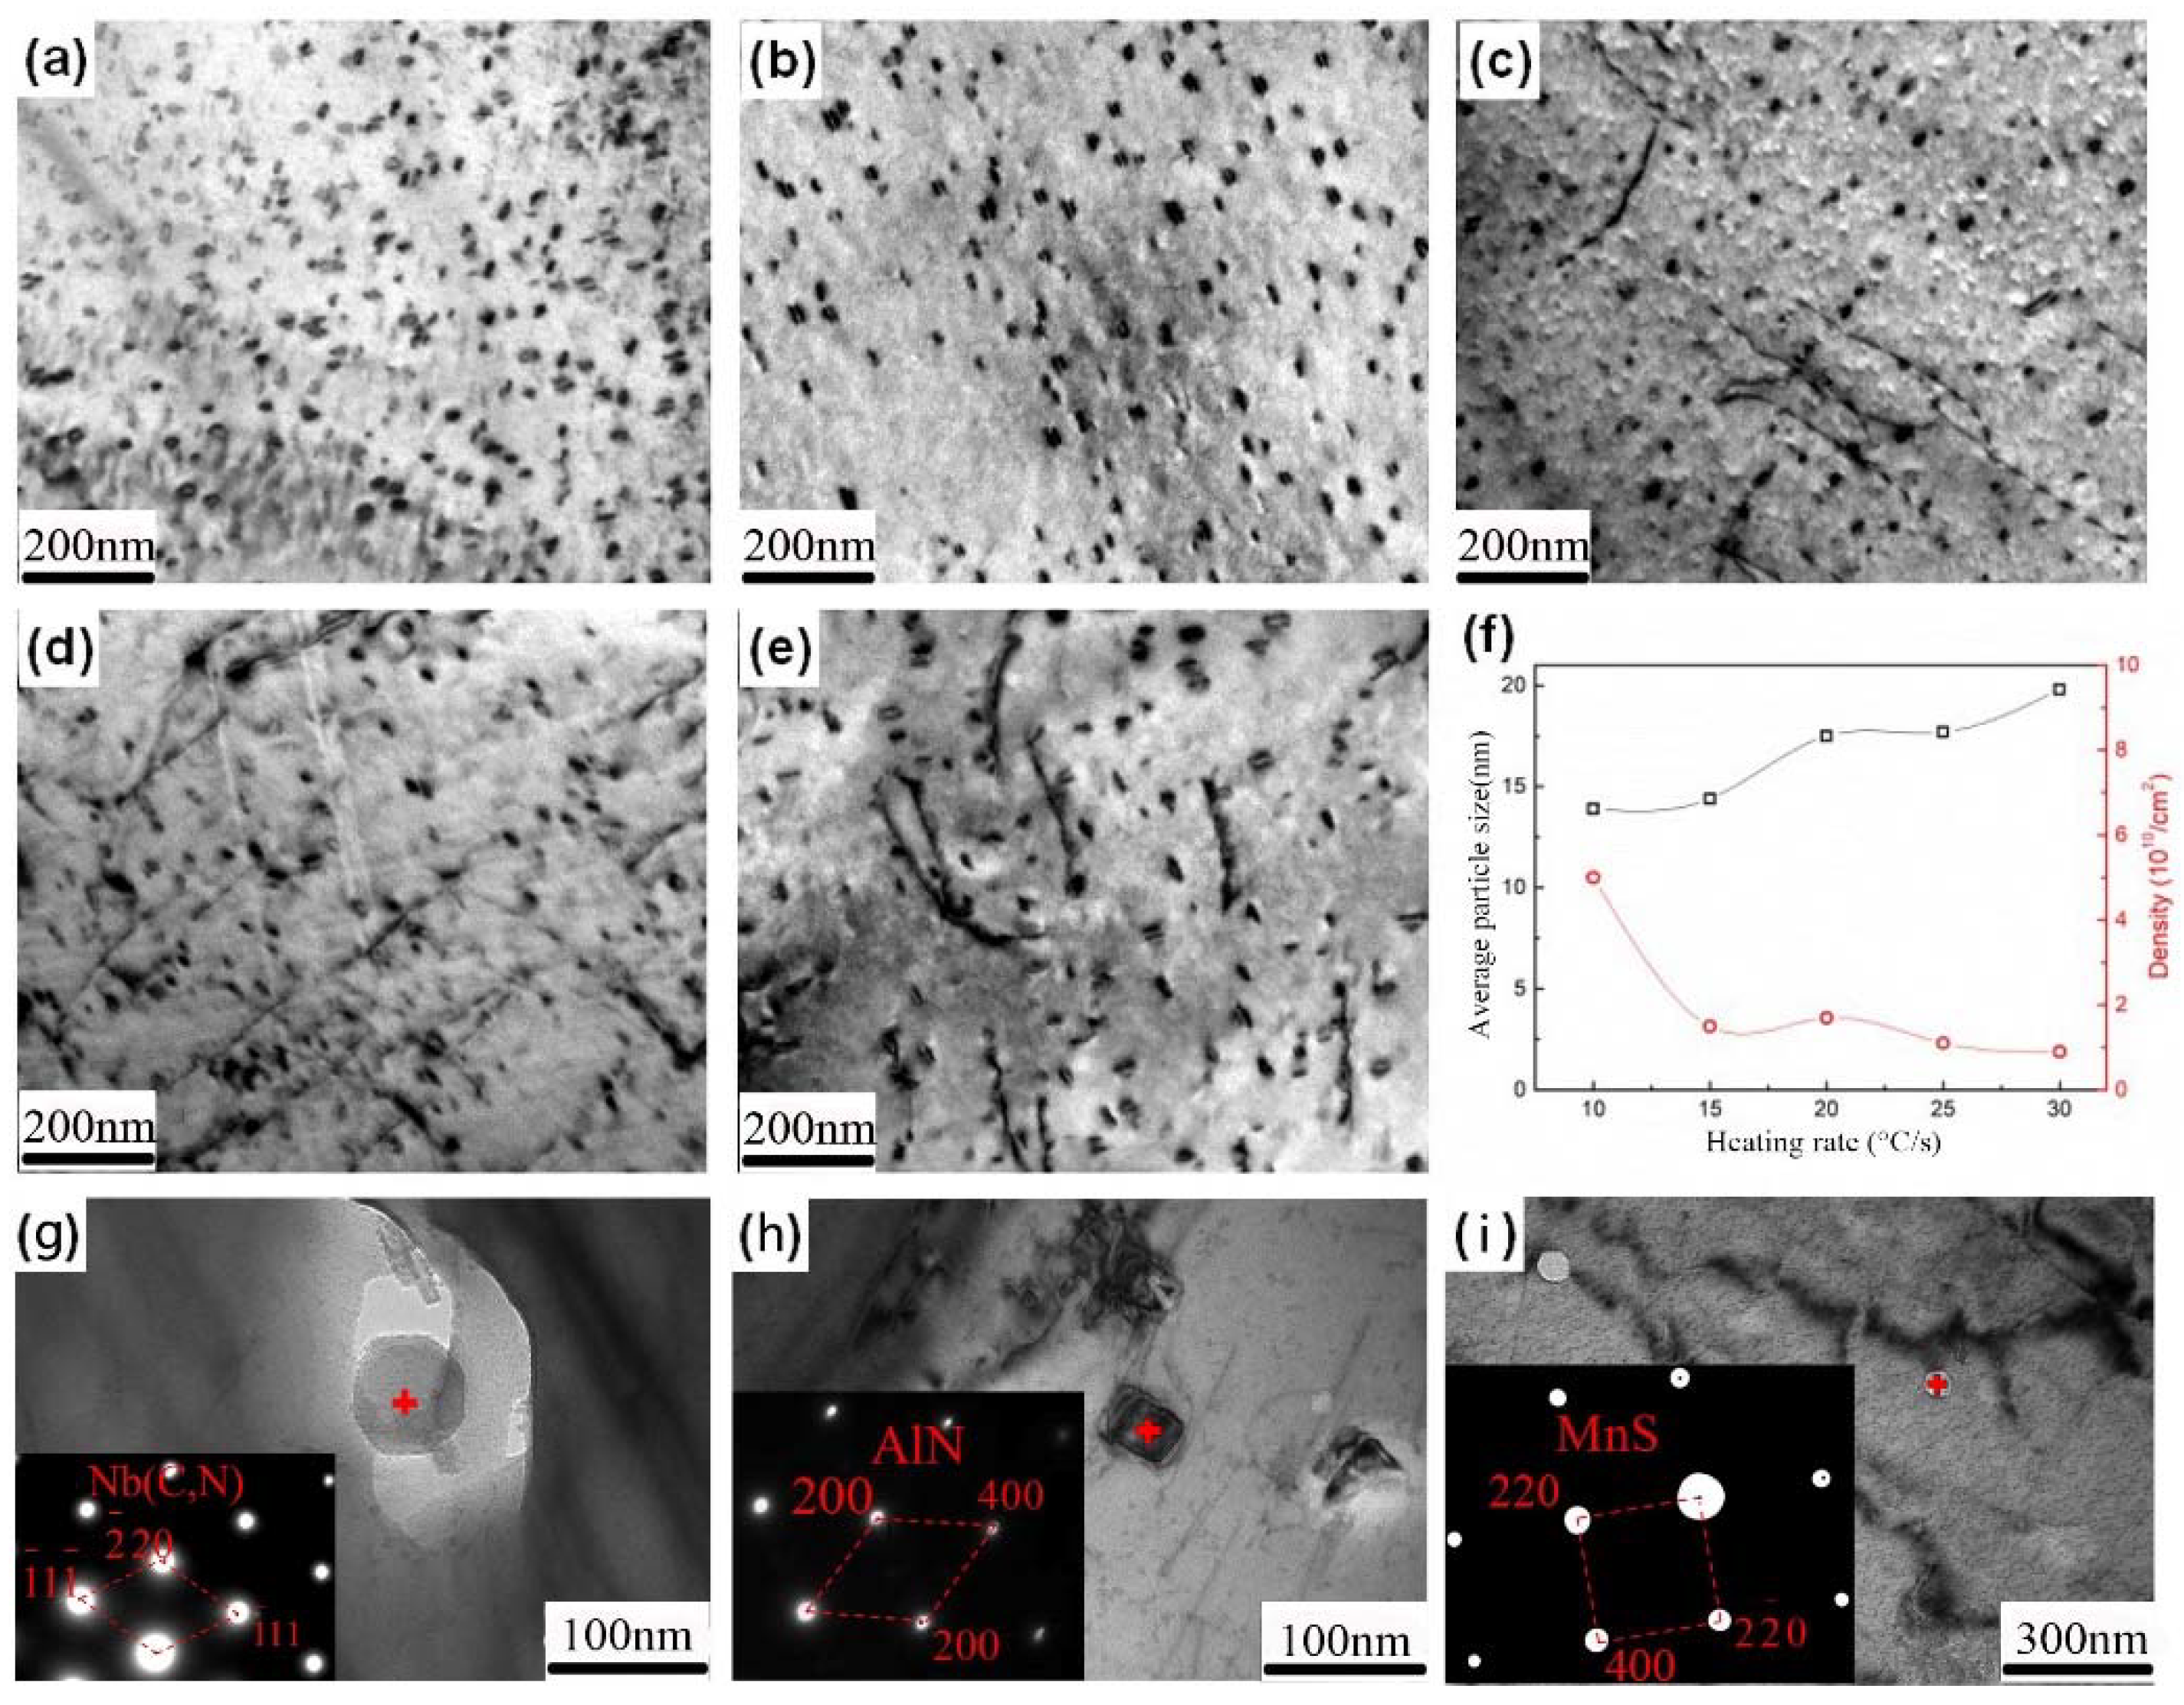
Generally, the inhibitors first dissolve into the matrix during the heating and insulation stage of the intermediate annealing, and then precipitate from the matrix during the cooling process. If the heating rate is fast, which means that the time for the heating process shortens accordingly, the inhibitors are not able to dissolve into the matrix completely, resulting in the amount of precipitation dropping inevitably during the subsequent cooling process. In addition, some inhibitors precipitate and center on the undissolved particles, forming the composite precipitations with a larger size. Finally, the number of the obtained inhibitors is relatively low and the size is relatively large (see
Figure 8). However, the results from using the faster heating rate show the better characteristics of primary recrystallization and the magnetic properties of the final product, which indicate that the inhibitors formed during primary recrystallization do not just require a large quantity and small size. Therefore, how to control the precipitation of inhibitors and maximize their role needs further investigation.
In conclusion, the specimen annealed with higher heating rate possesses the best primary recrystallized microstructure and texture, which guarantees the abnormal growth of Goss texture after high temperature annealing and results in the best magnetic properties.
Author Contributions
X.T.: Methodology, Writing—Original Draft, Investigation, Software, Formal analysis, Visualization. S.K.: Writing—Review & Editing. J.L.: Software, Validation, Methodology. J.G.: Software, Resources. Y.F.: Conceptualization, Supervision, Project administration, Funding acquisition. All authors have read and agreed to the published version of the manuscript.
Funding
The authors would like to express their gratitude for projects supported by National Natural Science Foundation of China (51974134 and 51674123), Major Science and Technology Special Project of Hebei Province (No. 21281008Z).
Institutional Review Board Statement
Not applicable.
Informed Consent Statement
Not applicable.
Data Availability Statement
No new data were created or analyzed in this study. Data sharing is not applicable to this article.
Acknowledgments
The authors would like to thank North China University of Technology for providing the materials and testing equipment for the experiments.
Conflicts of Interest
The authors declare no conflict of interest.
References
- Harase, J.; Shimizu, R.; Dingley, D.J. Texture evolution in the presence of precipitates in Fe-3%Si alloy. Acta Mater. 1991, 39, 763–770. [Google Scholar] [CrossRef]
- Hayakawa, Y.; Kurosawa, M. Orientation relationship between primary and secondary recrystallized texture in electrical steel. Acta Mater. 2002, 50, 4527–4534. [Google Scholar] [CrossRef]
- Fang, F.; Zhang, Y.-X.; Lu, X.; Wang, Y.; Cao, G.-M.; Yuan, G. Inhibitor induced secondary recrystallization in thin-gauge grain oriented silicon steel with high permeability. Mater. Des. 2016, 105, 398–403. [Google Scholar] [CrossRef]
- Nam, S.K.; Kim, G.H.; Lee, D.N.; Kim, I. New process for the Goss texture formation and magnetic property in silicon steel sheet by hot asymmetric rolling and annealing. Metall. Mater. Trans. A 2018, 49, 1841–1850. [Google Scholar] [CrossRef]
- Wang, Y.; Xu, Y.-B.; Zhang, Y.-X.; Xie, S.-Q.; Yu, Y.-M.; Wang, G.-D. On abnormal growth of {210}<001> grain in grain-oriented silicon steel. Mater. Res. Bull. 2015, 69, 138–141. [Google Scholar] [CrossRef]
- Kustas, A.B.; Sagapuram, D.; Trumble, K.P.; Chandrasekar, S. Texture development in high-silicon iron sheet produced by simple shear deformation. Metall. Mater. Trans. A 2016, 47, 3095–3108. [Google Scholar] [CrossRef]
- Li, H.; Feng, Y.-L.; Song, M.; Liang, J.-L.; Cang, D.-Q. Effect of normalizing cooling process on microstructure and precipitates in low-temperature silicon steel. Trans. Nonferrous Met. Soc. China 2014, 24, 770–776. [Google Scholar] [CrossRef]
- Salih, M.Z.; Weidenfeller, B.; Al-hamdany, N.; Brokmeier, H.-G.; Gan, W.M. Magnetic properties and crystallographic textures of Fe 2.6% Si after 90% cold rolling plus different annealing. J. Magn. Magn. Mater. 2014, 354, 105–111. [Google Scholar] [CrossRef]
- Matsuo, M. Texture control in the production of grain oriented silicon steels. ISIJ Int. 1989, 29, 809–827. [Google Scholar] [CrossRef] [Green Version]
- Jenkins, K.; Lindenmo, M. Precipitates in electrical steels. J. Magn. Magn. Mater. 2008, 320, 2423–2429. [Google Scholar] [CrossRef]
- Ueshima, N.; Maeda, T.; Oikawa, K. Effect of Cu addition on precipitation and growth behavior of MnS in silicon steel sheets. Metall. Mater. Trans. A 2017, 48, 3843–3851. [Google Scholar] [CrossRef]
- Cui, F.-E.; Yang, P.; Mao, W.-M. Behaviors of different inhibitors during secondary recrystallization of a grain-orientated silicon steel. Int. J. Min. Met. Mater. 2011, 18, 314–319. [Google Scholar] [CrossRef]
- Wu, Y.; Li, F.-J.; Wang, T.; Zhao, D.; Huang, H.-F.; Li, H.-G.; Zheng, S.-B. Influence of Cu2S precipitates dissolution on ferrite grain growth during heat treatment in the non-oriented electrical steel sheet. Met. Mater. Int. 2017, 23, 618–624. [Google Scholar] [CrossRef]
- Bian, X.-H.; Zeng, Y.-P.; Nan, D.; Wu, M. The effect of copper precipitates on the recrystallization textures and magnetic properties of non-oriented electrical steels. J. Alloys Compd. 2014, 588, 108–113. [Google Scholar] [CrossRef]
- Li, H.; Feng, Y.-L.; Zhang, D.; Song, M.; Cang, D.-Q. Balanced solubility product and enthalpies of formation of Nb compounds in 0.09% oriented silicon steel. Rare Met. 2013, 32, 318–322. [Google Scholar] [CrossRef]
- Feng, Y.-L.; Guo, J.; Li, J.; Ning, J.-L. Effect of Nb on solution and precipitation of inhibitors in grain-oriented silicon steel. J. Magn. Magn. Mater. 2017, 426, 89–94. [Google Scholar] [CrossRef]
- Liu, B.; Song, X.-L.; Zhu, R.-Q.; Jia, J. Analysis of textures and precipitates of hot rolled Nb-bearing low temperature oriented silicon steel strip. J. Iron Steel Res. 2017, 10, 823–830. [Google Scholar]
- Fang, F.; Lan, M.-F.; Lu, X.; Zhang, Y.-X.; Wang, Y.; Yuan, G.; Cao, G.-M.; Xu, Y.-B.; Misra, R.D.K.; Wang, G.-D. The impact of niobium on the microstructure, texture and magnetic properties of strip-cast grain oriented silicon steel. J. Magn. Magn. Mater. 2017, 442, 1–7. [Google Scholar] [CrossRef]
- Feng, Y.-L.; Li, Y.; Guo, J.; Li, J.; Du, T.-T. Effect of slab reheating temperature on recrystallization microstructure, texture and magnetic properties of Nb-containing grain- oriented silicon steel. J. Magn. Magn. Mater. 2017, 439, 135–143. [Google Scholar] [CrossRef]
- Song, H.-Y.; Liu, H.-T.; Liu, W.-Q.; Wang, Y.-P.; Liu, Z.-Y.; Wang, G.-D. Effects of two-stage cold rolling schedule on microstructure and texture evolution of strip casting grain-oriented silicon steel with extra-low carbon. Metall. Mater. Trans. A 2016, 47, 1770–1781. [Google Scholar] [CrossRef]
- Vorob’ev, G.M.; Popova, V.I. Texture of deformation and secondary recrystallization of silicon iron after intermediate annealing. Met. Sci. Heat Treat. 1969, 11, 889–891. [Google Scholar] [CrossRef]
- Salih, M.Z.; Weidenfeller, B.; Al-hamdany, N.; Brokmeier, H.-G.; Gan, W.M. The effect of intermediate annealing between cold rolled steps on crystallographic texture and magnetic properties of Fe–2.6% Si. J. Magn. Magn. Mater. 2014, 362, 141–149. [Google Scholar] [CrossRef]
- Lobanov, M.L.; Gomzikov, A.I.; Akulov, S.V.; Pyatygin, A.I. Decarburizing annealing of technical alloy Fe-3% Si. Met. Sci. Heat Treat. 2005, 47, 478–483. [Google Scholar] [CrossRef]
- He, Z.-Z.; Zhao, Y.; Luo, H.-W. Electrical Steel; Metallurgical Industry Press: Beijing, China, 2012; pp. 422–424. (In Chinese) [Google Scholar]
- Guo, W.; Mao, W.-M.; Li, Y.; An, Z.-G. Influence of intermediate annealing on final Goss texture formation in low temperature reheated Fe-3%Si steel. Mater. Sci. Eng. A 2011, 528, 931–934. [Google Scholar] [CrossRef]
- Ling, C.; Xiang, L.; Qiu, S.-T.; Gan, Y. Effects of normalizing annealing on grain-oriented silicon steel. J. Iron Steel Res. Int. 2014, 21, 690–694. [Google Scholar] [CrossRef]
- Tomida, T.; Tanaka, T. Development of (100) texture in silicon steel sheets by removal of manganese and decarburization. ISIJ Int. 1995, 35, 548–556. [Google Scholar] [CrossRef]
- Hayakawa, Y.; Szpunar, J.A. The role of grain boundary character distribution in secondary recrystallization of electrical steels. Acta Mater. 1997, 45, 1285–1295. [Google Scholar] [CrossRef]
- Hayakawa, Y.; Szpunar, J.A. A new model of Goss texture development during secondary recrystallization of electrical steel. Acta Mater. 1997, 45, 4713–4720. [Google Scholar] [CrossRef]
- Homma, H.; Hutchinson, B. Orientation dependence of secondary recrystallisation in silicon–iron. Acta Mater. 2003, 51, 3795–3805. [Google Scholar] [CrossRef]
- Chang, S.-K. Texture change from primary to secondary recrystallization by hot-band normalizing in grain-oriented silicon steels. Mater. Sci. Eng. A 2007, 452, 93–98. [Google Scholar] [CrossRef]
- Kim, J.K.; Lee, D.N.; Koo, Y.M. The evolution of the Goss and Cube textures in electrical steel. Mater. Lett. 2014, 122, 110–113. [Google Scholar] [CrossRef]
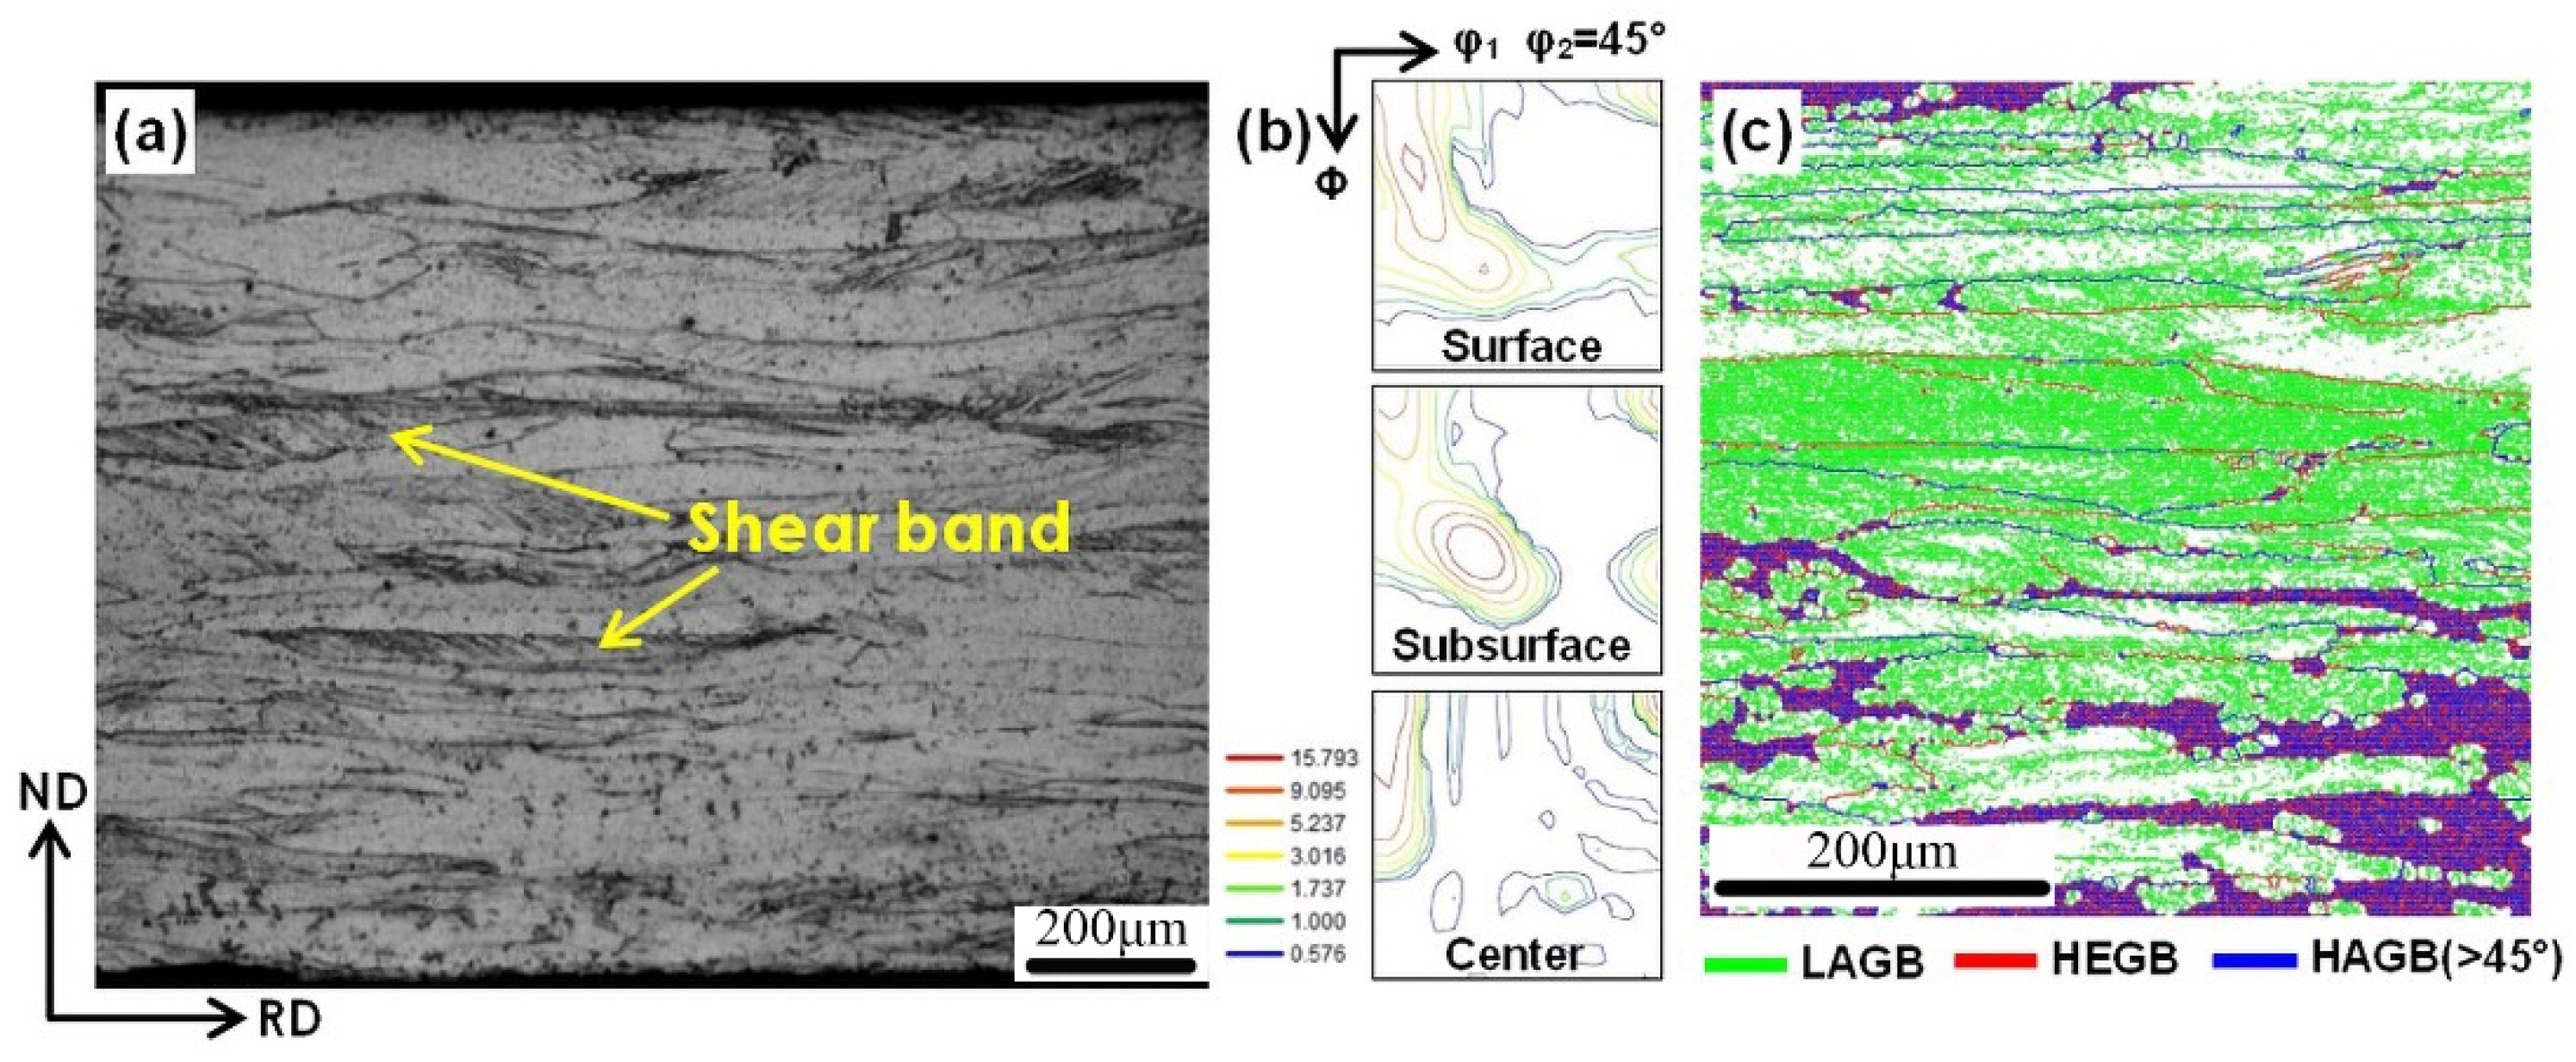
Figure 1.
Microstructure (a), orientation distribution function (ODFs) at φ2 = 45° section (b) and grain boundary misorientation distribution (c) along the thickness direction of first cold-rolled plate.
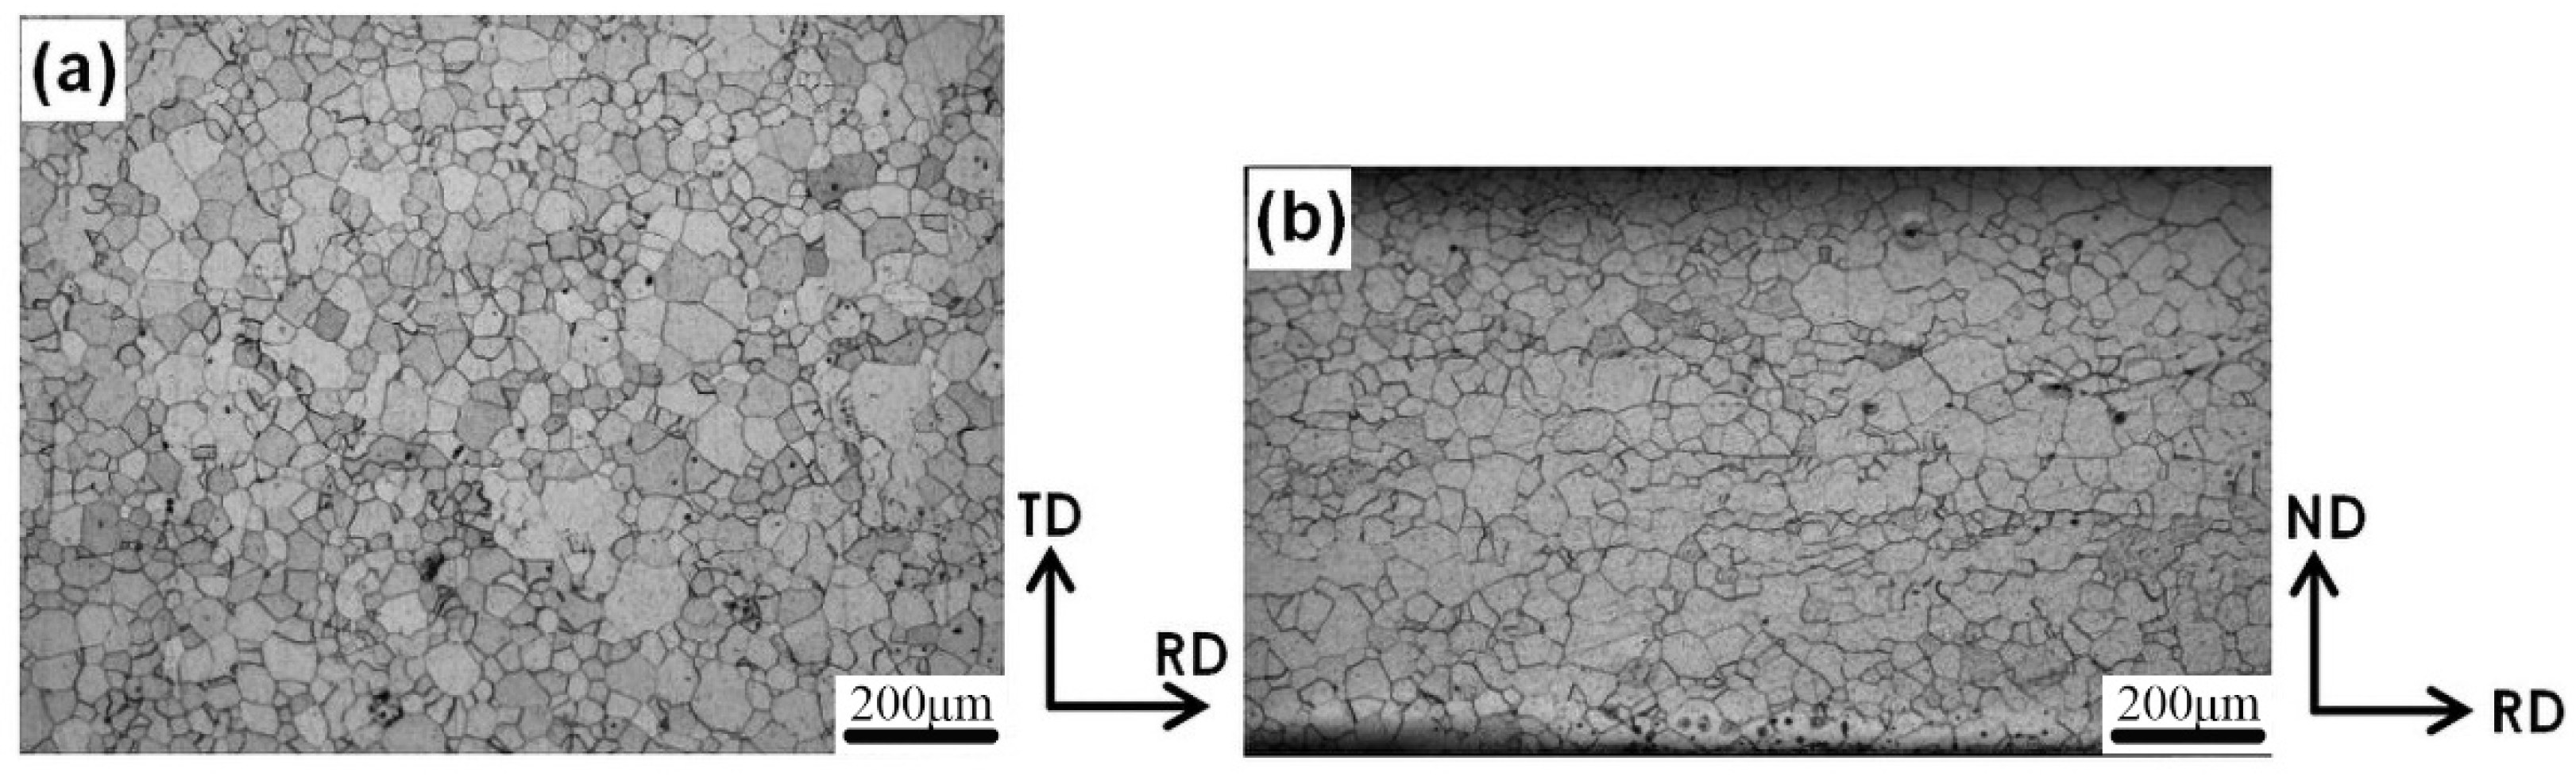
Figure 2.
Microstructure of (a) plate surface and (b) thickness direction after intermediate annealing with heating rate of 30 °C/s.
Figure 3.
The grain aspect ratio after intermediate annealing with different heating rates along the thickness direction.
Figure 4.
ODFs at φ2 = 45° section of surface, subsurface and center layer along the thickness direction after intermediate annealing with heating rate of (a) 10 °C/s, (b) 15 °C/s, (c) 20 °C/s, (d) 25 °C/s and (e) 30 °C/s.
Figure 5.
Orientation image maps of several main orientations along the thickness direction after intermediate annealing with heating rates of (a) 10 °Cs, (b) 15 °C/s, (c) 20 °C/s, (d) 25 °C/s and (e) 30 °C/s.
Figure 6.
Grain boundary misorientation distribution after intermediate annealing with heating rate of 30 °C/s (a) and LAGB, HEGB and HAGB (>45°) fractions with different heating rates of intermediate annealing (b).
Figure 7.
CSL boundary distribution after intermediate annealing with different heating rates.
Figure 8.
TEM morphology of the inhibitors after intermediate annealing with heating rate of (a) 10 °C/s, (b) 15 °C/s, (c) 20 °C/s, (d) 25 °C/s and (e) 30 °C/s, and (f) statistical results of the mean size and volume fraction of the inhibitors, the electron diffraction patterns of inhibitors (g) Nb(C,N), (h) AlN and (i) MnS.
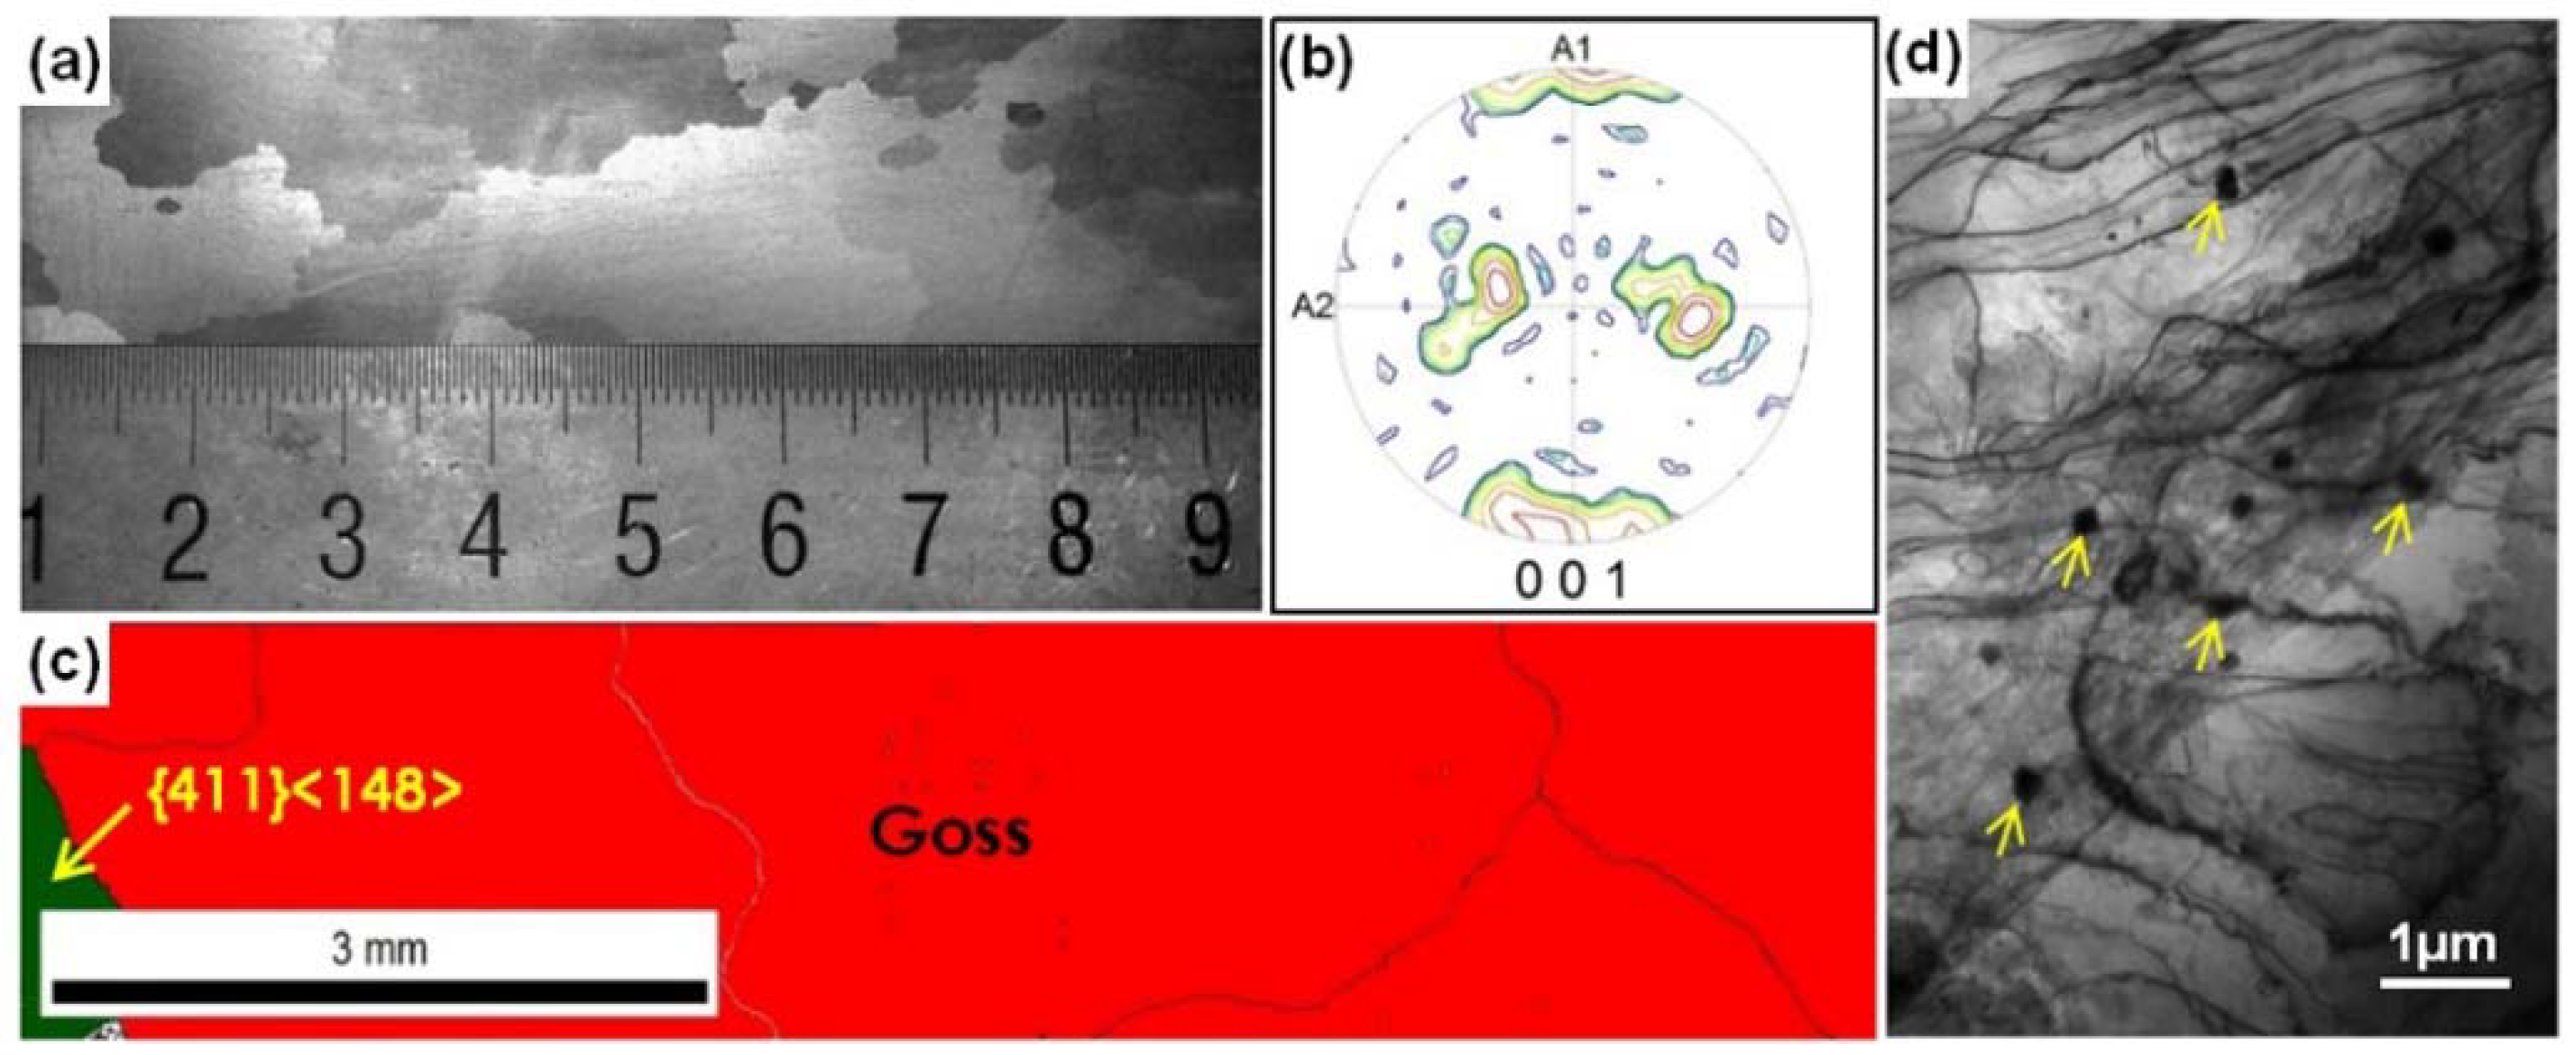
Figure 9.
Macrostructure (a), {001} pole figure (b), EBSD orientation image map (c) and TEM morphology (d) after high temperature annealing with heating rate of 30 °C/s.
Table 1.
Chemical compositions of Nb-containing grain-oriented silicon steel (wt.%).
| Element | C | Mn | Si | S | Cu | Al | Nb | N | P | Fe |
|---|
| Content | 0.041 | 0.04 | 3.2 | 0.0075 | 0.085 | 0.023 | 0.055 | 0.0085 | <0.008 | Bal. |
Table 2.
Average grain size of primary recrystallization.
| Heating Rate (°C/s) | 10 | 15 | 20 | 25 | 30 |
|---|
| Average grain size (µm) | Surface | 31.25 | 29.33 | 28.91 | 25.1 | 14.85 |
| Thickness | 32.44 | 28.18 | 27.04 | 25.38 | 13.78 |
Table 3.
Texture content after intermediate annealing.
| Heating Rate (°C/s) | Texture Type (%) |
|---|
| {111}<112 > | {111}<110 > | {411}<148 > | {110}<001> |
|---|
| 10 | 10.6 | 1.4 | 25.5 | 2.2 |
| 15 | 14.7 | 7.1 | 21.7 | 3.9 |
| 20 | 11.5 | 7.5 | 26.2 | 5.3 |
| 25 | 17.1 | 8.5 | 21.0 | 5.1 |
| 30 | 13.2 | 7.4 | 26.3 | 6.1 |
Table 4.
Original carbon content C0 before the intermediate annealing, carbon content when reaching the intermediate annealing temperature of 840 °C C840 °C and decarburization amount ΔC in heating stage. f is constant in Equation (2).
| Heating Rate (°C/s) | C0 (%) | C840 °C (%) | ΔC (%) | f |
|---|
| 10 | 0.040 | 0.021 | 0.019 | 0.190 |
| 15 | 0.040 | 0.027 | 0.013 | 0.195 |
| 20 | 0.040 | 0.030 | 0.010 | 0.200 |
| 25 | 0.040 | 0.032 | 0.008 | 0.200 |
| 30 | 0.040 | 0.033 | 0.007 | 0.210 |
Table 5.
Calculated and experimental carbon content and decarburization amount ΔC′ in the insulation stage of intermediate annealing.
Heating
Rate (°C/s) | Calculated Results (%) | Experimental
Results (%) | ΔC′ (%) |
|---|
| 0 s (C840 °C) | 120 s | 240 s | 360 s | 480 s | 600 s | 600 s |
|---|
| 10 | 0.021 | 0.013 | 0.008 | 0.005 | 0.004 | 0.003 | 0.002 | 0.019 |
| 15 | 0.027 | 0.014 | 0.010 | 0.006 | 0.005 | 0.004 | 0.003 | 0.024 |
| 20 | 0.030 | 0.017 | 0.013 | 0.010 | 0.008 | 0.006 | 0.005 | 0.025 |
| 25 | 0.032 | 0.020 | 0.014 | 0.010 | 0.008 | 0.006 | 0.006 | 0.026 |
| 30 | 0.033 | 0.025 | 0.018 | 0.012 | 0.009 | 0.007 | 0.007 | 0.026 |
Table 6.
Magnetic induction B800 and iron loss P1.7/50 after intermediate annealing.
| Heating Rate (°C/s) | B800 (T) | P1.7/30 (W/kg) |
|---|
| 10 | 1.63 | 1.42 |
| 15 | 1.80 | 1.39 |
| 20 | 1.72 | 1.36 |
| 25 | 1.83 | 1.37 |
| 30 | 1.88 | 1.34 |
| Publisher’s Note: MDPI stays neutral with regard to jurisdictional claims in published maps and institutional affiliations. |
© 2021 by the authors. Licensee MDPI, Basel, Switzerland. This article is an open access article distributed under the terms and conditions of the Creative Commons Attribution (CC BY) license (https://creativecommons.org/licenses/by/4.0/).


