Article

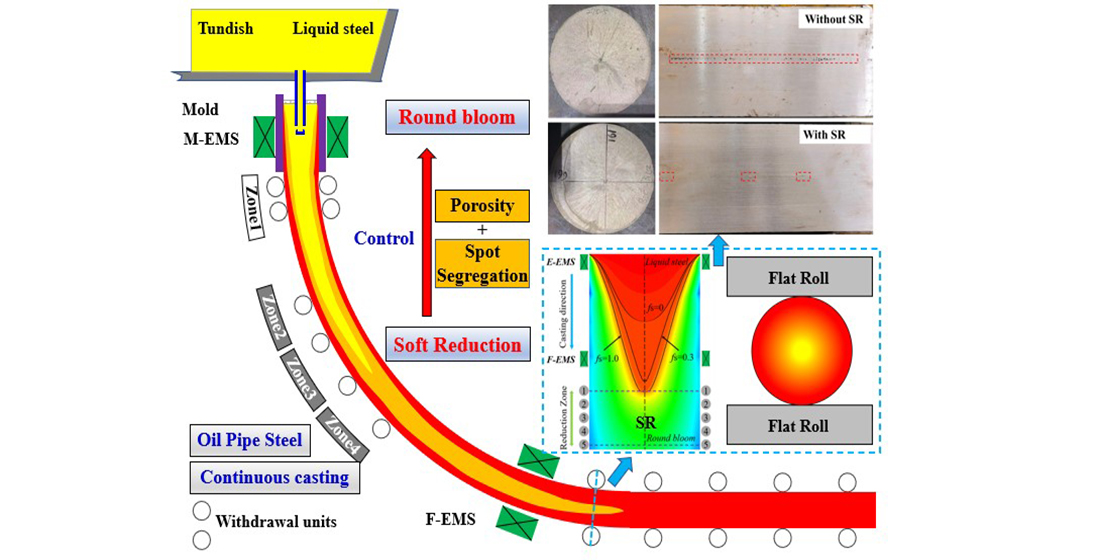
Control of Shrinkage Porosity and Spot Segregation in Ø195 mm Continuously Cast Round Bloom of Oil Pipe Steel by Soft Reduction

1
School of Metallurgical and Ecological Engineering, University of Science and Technology Beijing, Beijing 100083, China
2
Tube & Pipe Department, Baosteel Research Institute, Baoshan Iron & Steel Co., Ltd., Shanghai 201900, China
*
Authors to whom correspondence should be addressed.
Metals 2021, 11(1), 9; https://doi.org/10.3390/met11010009
Submission received: 26 November 2020 / Revised: 18 December 2020 / Accepted: 22 December 2020 / Published: 23 December 2020
(This article belongs to the Special Issue Numerical Modelling in Steel Metallurgy)

Abstract

:
Based on the Ø195 mm round bloom continuous casting of oil pipe steel, a two dimensional thermal-mechanical coupled model has been developed to investigate the deformation behavior of round bloom during soft reduction (SR) in the reduction force mode. Good agreement was achieved in surface temperature, shell thickness and contact zone width from modeling and measurement. Under the same reduction force, the reduction amount of round bloom at the front unit is much larger than back unit. Moreover, due to its higher temperature and lower center solid fraction, the deformation penetration before solidification is much stronger than that after solidification. Considering the limitation of the round bloom ovality, the maximum allowable force in reduction unit is calculated. According to the simulation results, a multi-unit soft reduction plan was proposed and carried out on the Ø195 mm round bloom. After the reduction process of No.1 to No.3 withdrawal units, the shrinkage porosity in the center of the round bloom was almost vanished, while the number and size of spot segregation were significantly reduced. Moreover, the oil pipe produced by the round bloom with SR got a better resistance to sulfide stress corrosion (SSC). It indicates that SR is an effective technology for the round bloom to control the shrinkage porosity and spot segregation in the continuous casting.

Graphical Abstract

1. Introduction

Oil pipe steel is widely used to produce petroleum pipe in oil exploration, exploitation, and transportation [1]. With the gradual depletion of shallow oil resources, the deep and ultra-deep oil and gas wells have been drawing increased attention in recent years. To better serve in the extreme high temperature, high pressure, and wet hydrogen sulfide (H2S) environment, higher quality requirements are put forward for the oil pipe steel, especially its raw material, continuous casting round bloom [2]. The shrinkage porosity and spot segregation defects in round bloom are difficult to eliminate through hot rolling and heat treatment, which will cause the formation of inhomogeneity structure in the final oil pipe product, resulting in the early failure due to sulfide stress corrosion (SSC) [3]. Therefore, it is extremely important to effectively control the shrinkage porosity and spot segregation in the continuously cast round bloom of oil pipe steel.
Shrinkage porosity occurs at the last stage of solidification in continuous casting, where the contraction of the central matrix cannot be fed completely by upstream molten steel due to high solid fraction [4]. Industrial practice has shown that soft reduction (SR) is an effective technology to compensate for the contraction and alleviate porosity in the continuous casting billet [5,6,7,8,9]. Thome [7] carried out SR on the 150 mm × 150 mm billet of 54SiCr6 steel, and found that the central porosity was obviously improved with 9 mm reduction amount. Rogberg [8] implemented SR on the 265 mm × 365 mm bloom of AISI 316 stainless steel, and the results showed that 5.5 mm reduction amount made a substantial closure of visual center porosity on the longitudinal samples. In our previous research [9], the shrinkage porosity in 180 mm × 240 mm bloom of tire cord steel was improved remarkably by 6 mm total reduction amount.
Spot segregation is mostly observed in the equiaxed region of continuously cast products. In the later stage of solidification, the negative pressure generated by the shrinkage of the matrix draws the concentrated molten steel surrounding the dendrites into a large cavity and then the spot segregation forms [10]. The SR at solidification end is regarded as the high efficiency method to control the spot segregation in the cast billet. Kojima [11] adopted continuous forging process on the 270 mm × 340 mm bloom in 0.27% C steel. The spot segregation above 300μm completely disappeared, while the number of spot segregation below 300μm greatly reduced. Nabeshima [12] obtained a similar conclusion for the 400 mm × 560 mm bloom, and found that forging at the center solid fraction of 0.87 is better than 0.92 for improving spot segregation.
The explanation on the control of shrinkage cavity and spot segregation in continuous casting by SR is the extra compensation by the withdraw units, closuring the shrinkage and preventing the suction flow of the residual melt [13]. However, unlike the rectangle billet or bloom, SR has not yet been widely used in round products. Rauter [14] applied SR on Ø230 mm round billet of high carbon steel by double-roll segment. The V-segregation and central porosity were almost vanished. Wimmer [15] conducted SR investigation on Ø800 mm round bloom with newly designed three-roll-segment in vertical continuous casting, and the central quality was improved remarkably. Although the positive effects of SR on the quality of round bloom are observed preliminarily, the deformation permeation parameters and features during the reduction process have not been reported.
In the present work, the deformation behavior of round bloom during SR has been investigated by a two dimensional thermal-mechanical coupled model. The proper reduction zone, the reduction amount and ovality of round bloom, the deformation of central porosity zone, and the suitable reduction force distribution were calculated and discussed. Based on these simulation results, a multi-unit soft reduction was carried out on a Ø195 mm round bloom of oil pipe steel, the central shrinkage porosity and spot segregation defects were effectively controlled.

2. Model Description

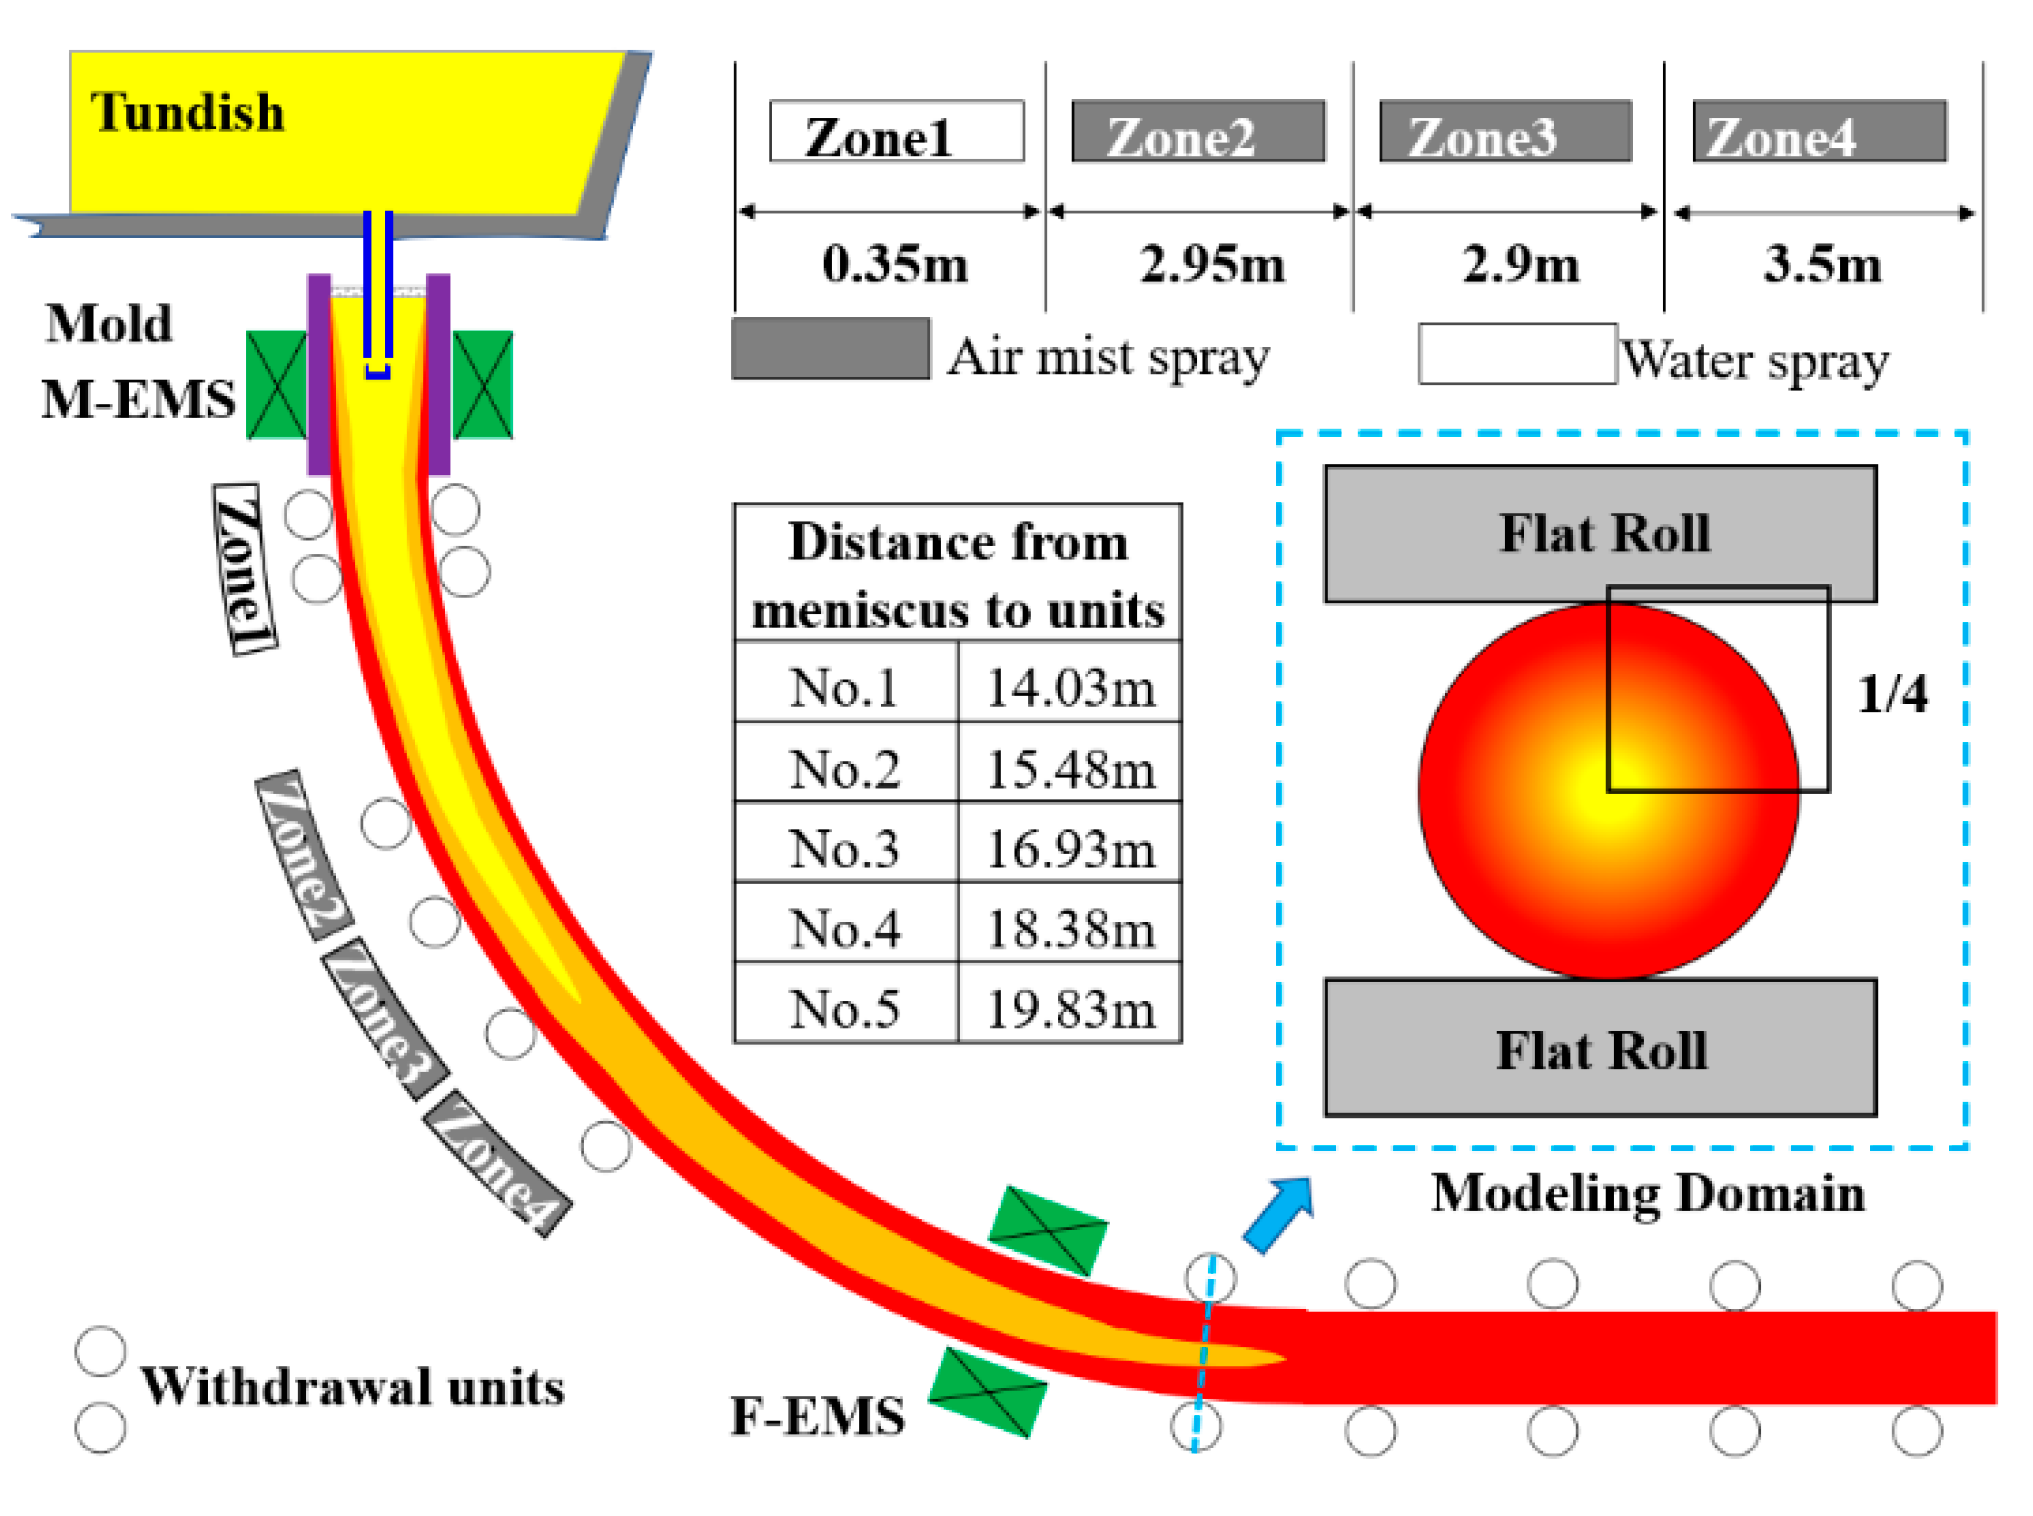
2.1. Simulation Conditions

Figure 1 shows the configuration of the continuous caster. It contains one water cooling zone and three air-mist cooling zones. Two electromagnetic stirrers are installed in different positions along the casting direction. There is a total of five withdrawal units, No.1 to No.5. In the present work, the diameter of the continuous casting round bloom is 195 mm. The steel grade is C110 oil pipe steel, contains 0.2C, 0.22Si, 0.48Mn, 0.5Cr, 0.66Mo, and 0.1 V(wt%). The liquidus temperature is 1511 °C and the solidus temperature is 1445 °C.
Based on some reasonable assumptions [9], a two dimensional thermal-mechanical model has been established to simulate the solidification and the reduction process of the round bloom during the continuous casting. The calculation domain is one quarter of the transverse section of the round bloom, as shown in Figure 1.

2.2. Heat Transfer Model

The heat conduction formula, Equation (1), is used to solve for the temperature field of round bloom in the polar coordinate system [16]:
λ 1 r r ( r T r ) + λ 1 r 2 2 T θ 2 = ρ C e f f v c a s t T z
where λ is thermal conductivity, r and θ are polar coordinates, T is temperature, ρ is density of steel, v c a s t is the casting speed, C e f f is equivalent specific heat, z is the distance from the meniscus.
Due to the different cooling mode in continuous casting, the boundary conditions of heat transfer are divided into three parts: mold zone, secondary cooling zone, and air cooling zone. The heat flux could be calculated as follows:
In mold zone [17]:
q m o l d = 2,680,000 b z v
b = 1.5 × ( 2,680,000 q ¯ ) L m / v
q ¯ = C w × m w × Δ T S e f f
where q m o l d is the heat flux in mold, b is the intermediate variable; z is the local distance to the meniscus, v is the casting speed; q ¯ is the average heat flux in the mold zone, L m is the effective length of the mold; C w is the specific heat of water, m w is the water flow rate for the mold cooling, Δ T is the temperature difference of the mold cooling water, S e f f is the effective area of mold.
In secondary cooling zone:
q s e c = h s e c ( T s u r f T a m b )
where q s e c is the heat flux in second cooling zone, T s u r f is the surface temperature of round bloom, T a m b is the ambient temperature, and h s e c is the equivalent convection coefficient related to water flow w which can be estimated by [18]:
Water spray region:
h s e c = 0 . 42 w 0.351
Air-mist spray region:
h s e c = 0 . 13 + 0 . 35 w
In air cooling zone:
q a i r = σ ε ( T s u r f 4 T a m b 4 )
where q a i r is the heat flux in air cooling zone, T s u r f is the surface temperature of round bloom, T a m b is the ambient temperature; σ is Stefan-Boltzmann constant; ε is the emissivity of steel.

2.3. Deformation Model

The two dimensional thermal-mechanical model is one-way coupling scheme. The temperature field calculated in the heat transfer model was added to the mechanical model as an initial condition. Because the stress environment in round bloom is quite diverse, the following assumptions are made in the present model: (1) The plain stress condition is satisfied. (2) The ferrostatic pressure is applied to the element at the solidification front before complete solidification. (3) The reduction roll is regarded as a rigid material. (4) The solidified shell is considered to be an elastic visco-plastic material, and the total strain rate could be divided into elastic, inelastic, and thermal components,
ε ˙ = ε ˙ e l + ε ˙ i n + ε ˙ t h
ε ˙ e l = ε e l ( T t + Δ t ) ε e l ( T t ) Δ t
ε ˙ t h = T L E ( T t + Δ t ) T L E ( T t ) Δ t δ
where ε ˙ is the total strain rate, ε ˙ e l is the elastic strain rate, ε ˙ i n is the inelastic strain rate, ε ˙ t h is the thermal strain rate; ε e l is the elastic strain, Δ t is the time interval; T L E is the thermal linear expansion, δ is the Kronecker delta.
The inelastic strain includes the combined effects of plastic strain and creep. The inelastic behavior of each phase is described by its own constitutive model. The unified constitutive model developed here uses the instantaneous equivalent inelastic strain rate, ε ˙ ¯ i n , as the scalar state function, which depends on the current equivalent stress, temperature, steel carbon content, and the current equivalent inelastic strain, which accumulates below the solidus temperature [19]. A power-law model based on the tensile test measurements by Wray [20], was developed to model the behavior of δ-ferrite, given as follow [21]:
ε ˙ ¯ i n δ ( 1 / s ) = 0.1 F δ | F δ | n 1 F δ = C σ ¯ f C ( T ( K ) 300 ) 5.52 ( 1 + 1000 | ε ¯ i n | ) m F C = 1.3678 × 10 4 ( pct   C ) 5.56 × 10 2 m = 9.4156 × 10 5 T ( K ) + 0.349501 n = ( 1.617 × 10 4 T ( K ) 0.06166 ) 1
where ε ˙ ¯ i n δ is the inelastic strain rate of δ-ferrite, σ ¯ is the equivalent stress, ε ¯ i n is the inelastic strain, pct C is the carbon content, T is the temperature; F δ , f C , m , n are empirical functions of temperature or steel grade.
The particular model below was chosen to match tensile test measurements of Wray [22] and creep test data of Suzuki [23] for plain carbon steel in the austenite phase [19]:
ε ˙ ¯ i n γ ( 1 / s ) = f p c t | F γ | f 3 1 F γ exp ( 4.465 × 10 4 T ( K ) ) F γ = C σ ¯ f 1 ε ¯ i n | ε ¯ i n | f 2 1 f 1 = 130.5 5.128 × 10 3 T ( K ) f 2 = 0.6289 + 1.114 × 10 3 T ( K ) f 3 = 8.132 1.54 × 10 3 T ( K ) f p c t = 4.655 × 10 4 + 7.14 × 10 4 ( pct   C ) + 1.2 × 10 5 ( pct   C ) 2
where ε ˙ ¯ i n γ acts as the inelastic strain rate; F γ acts as a strain-hardening back-stress term to achieve the Bauschinger effect, f 1 , f 2 , f 3 , f p c t are empirical functions of temperature or steel grade, C is equal to 1 for tensile strain or −1 for compression strain. The accuracy of the constitutive equations applied here have been validated by the predicted relationship between strain and stress under different temperatures in the reference [19].

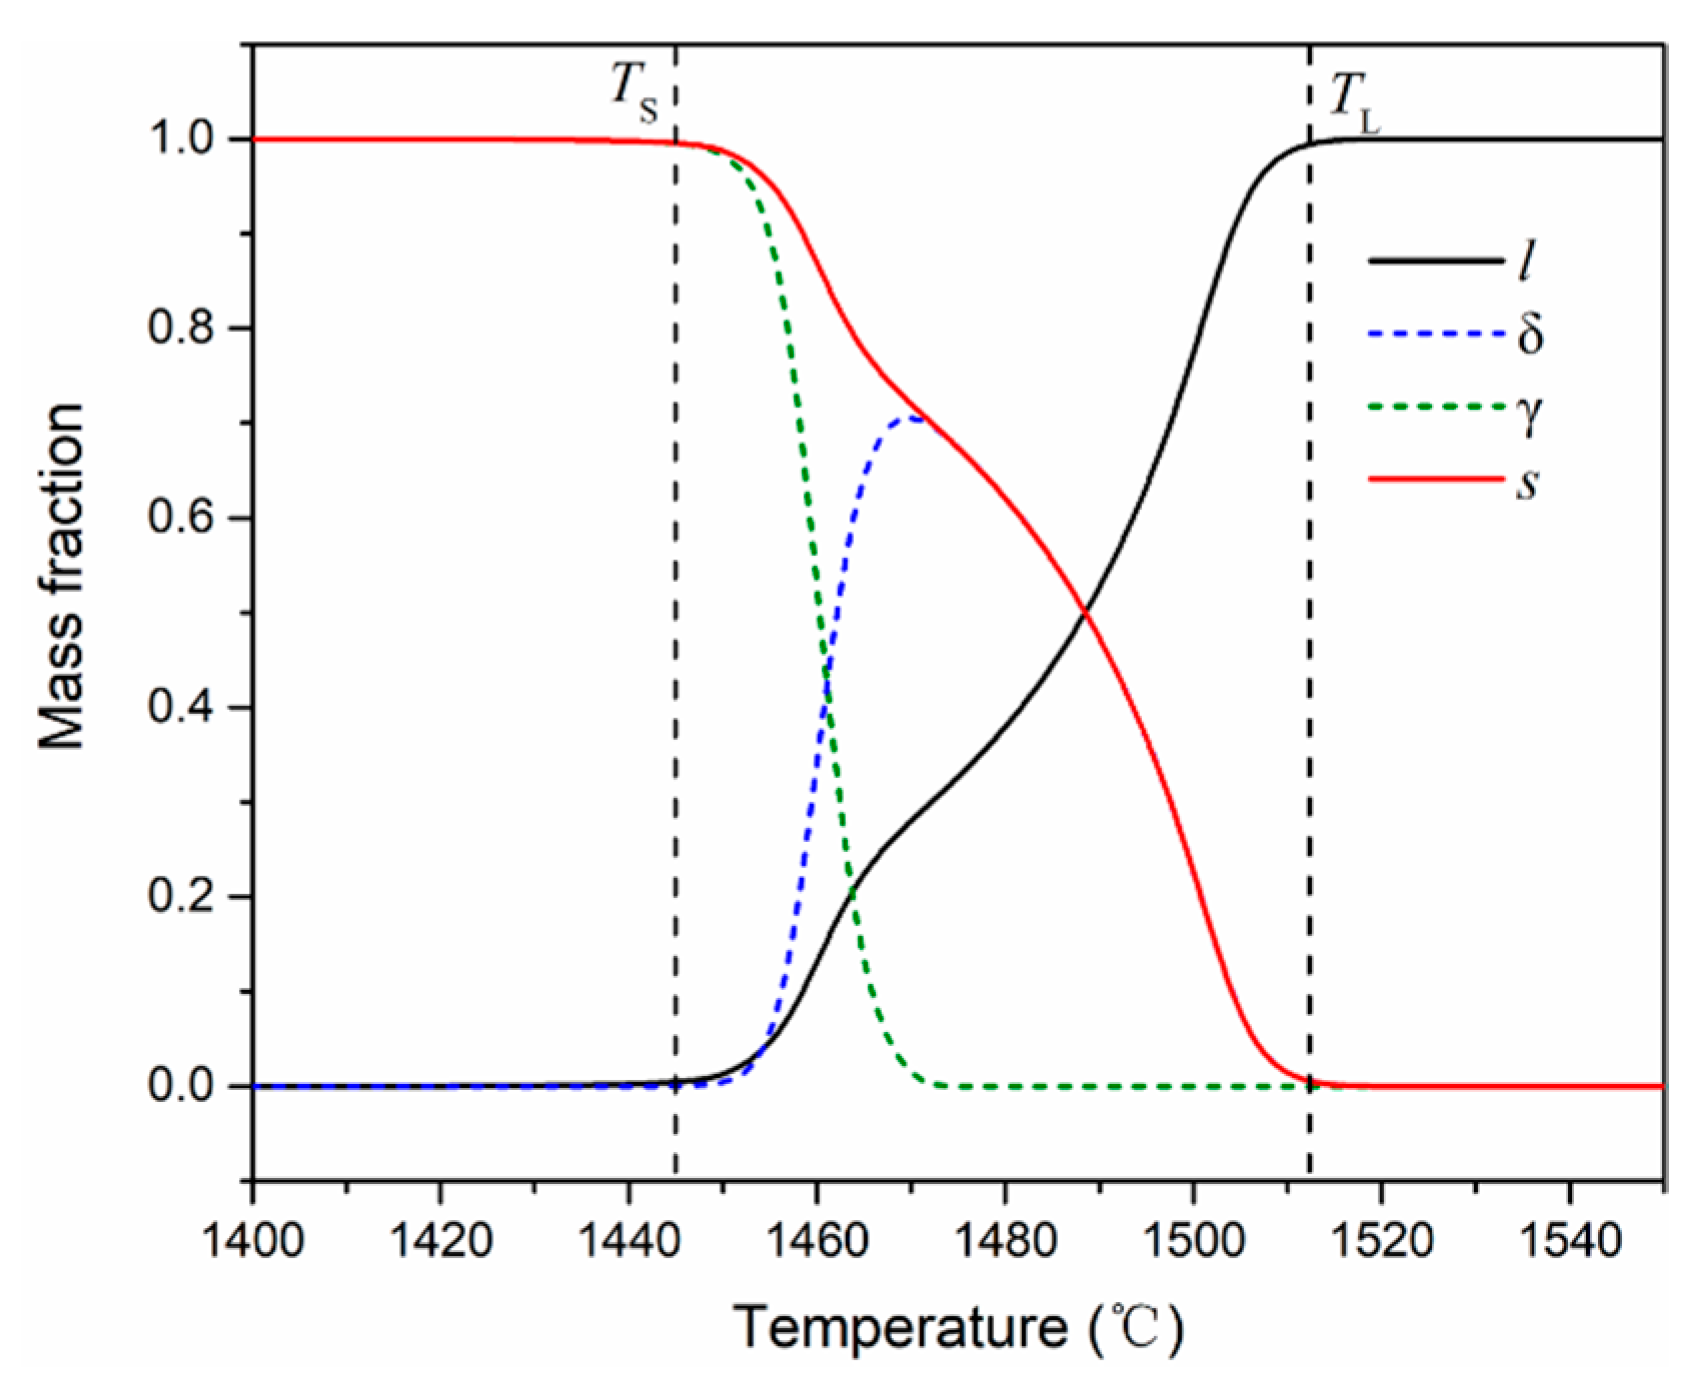
2.4. Material Properties

Figure 2 shows the faction of liquid phase, δ-Fe, γ–Fe and solid phase as a function of temperature during solidification by a micro-segregation model [24].
The equivalent specific heat is introduced [25], as shown in Equation (14):
C e f f = C p L f f s T
where C e f f is equivalent specific heat, L f is the latent heat, f s is the solid fraction, and C p is specific heat, which can be calculated by follows:
C p = C p l f l + C p δ f δ + C p γ f γ C p l = 824.6157 C p δ = 441.3942 + 0.17744236769 ( T + 273 ) C p γ = 429.8495 + 0.1497802 ( T + 273 )
L f = i = 1 n X i L i , f
where L f is the latent heat, the sum of the product of the latent heat of each element constituting the alloy and its mass percentage.
The temperature-dependent conductivity is determined by the solid fraction and conductivity of each phase [26]. The convective heat flow in the liquid region is simplified by multiplying the thermal conductivity λ L by m, where m = 3~7.
{ λ S = 18.4 + 0.0096 T λ f s = ( 1 f s ) λ L + f s λ s λ L = 32 m
The density for each phase is calculated by the following equations [27]:
ρ l = 7100 73.2 ( pct   C ) ( 0.828 0.0874 ( pct   C ) ) ( T ( ° C ) 1550 ) ρ δ = 0.4742 T ( ° C ) + 8010.71 ( 1.0 0.01 ( pct   C ) ( 1.0 + 0.01343 ( pct   C ) ) ) 3 ρ γ = 0.5091 T ( ° C ) + 8005.91 ( 1.0 0.01 ( pct   C ) ( 1.0 + 0.008317 ( pct   C ) ) ) 3
For mixed phases, the density is calculated by a phase fraction weighted average method. The Thermal Linear Expansion ( T L E ) function is then obtained by:
T L E = ρ ( T r e f ) ρ ( T ) 3 1
where T r e f is the reference temperature. The liner thermal expansion coefficient ( α ) is defined as follows:
α = d ( T L E ) d T
The temperature-dependent Young’s modulus is obtained by [28]:
E = 968 2.33 T + 1.9 × 10 3 T 2 5.18 × 10 7 T 3
The Young’s modulus of the liquid phase is supposed as 1 GPa. The Poisson’s ratios are calculated by Equation (22) [29]. The Passion’s ratio of the liquid phase is assumed as 0.4999.
υ = 0.278 + 8.23 × 10 5 T

3. Simulation Results

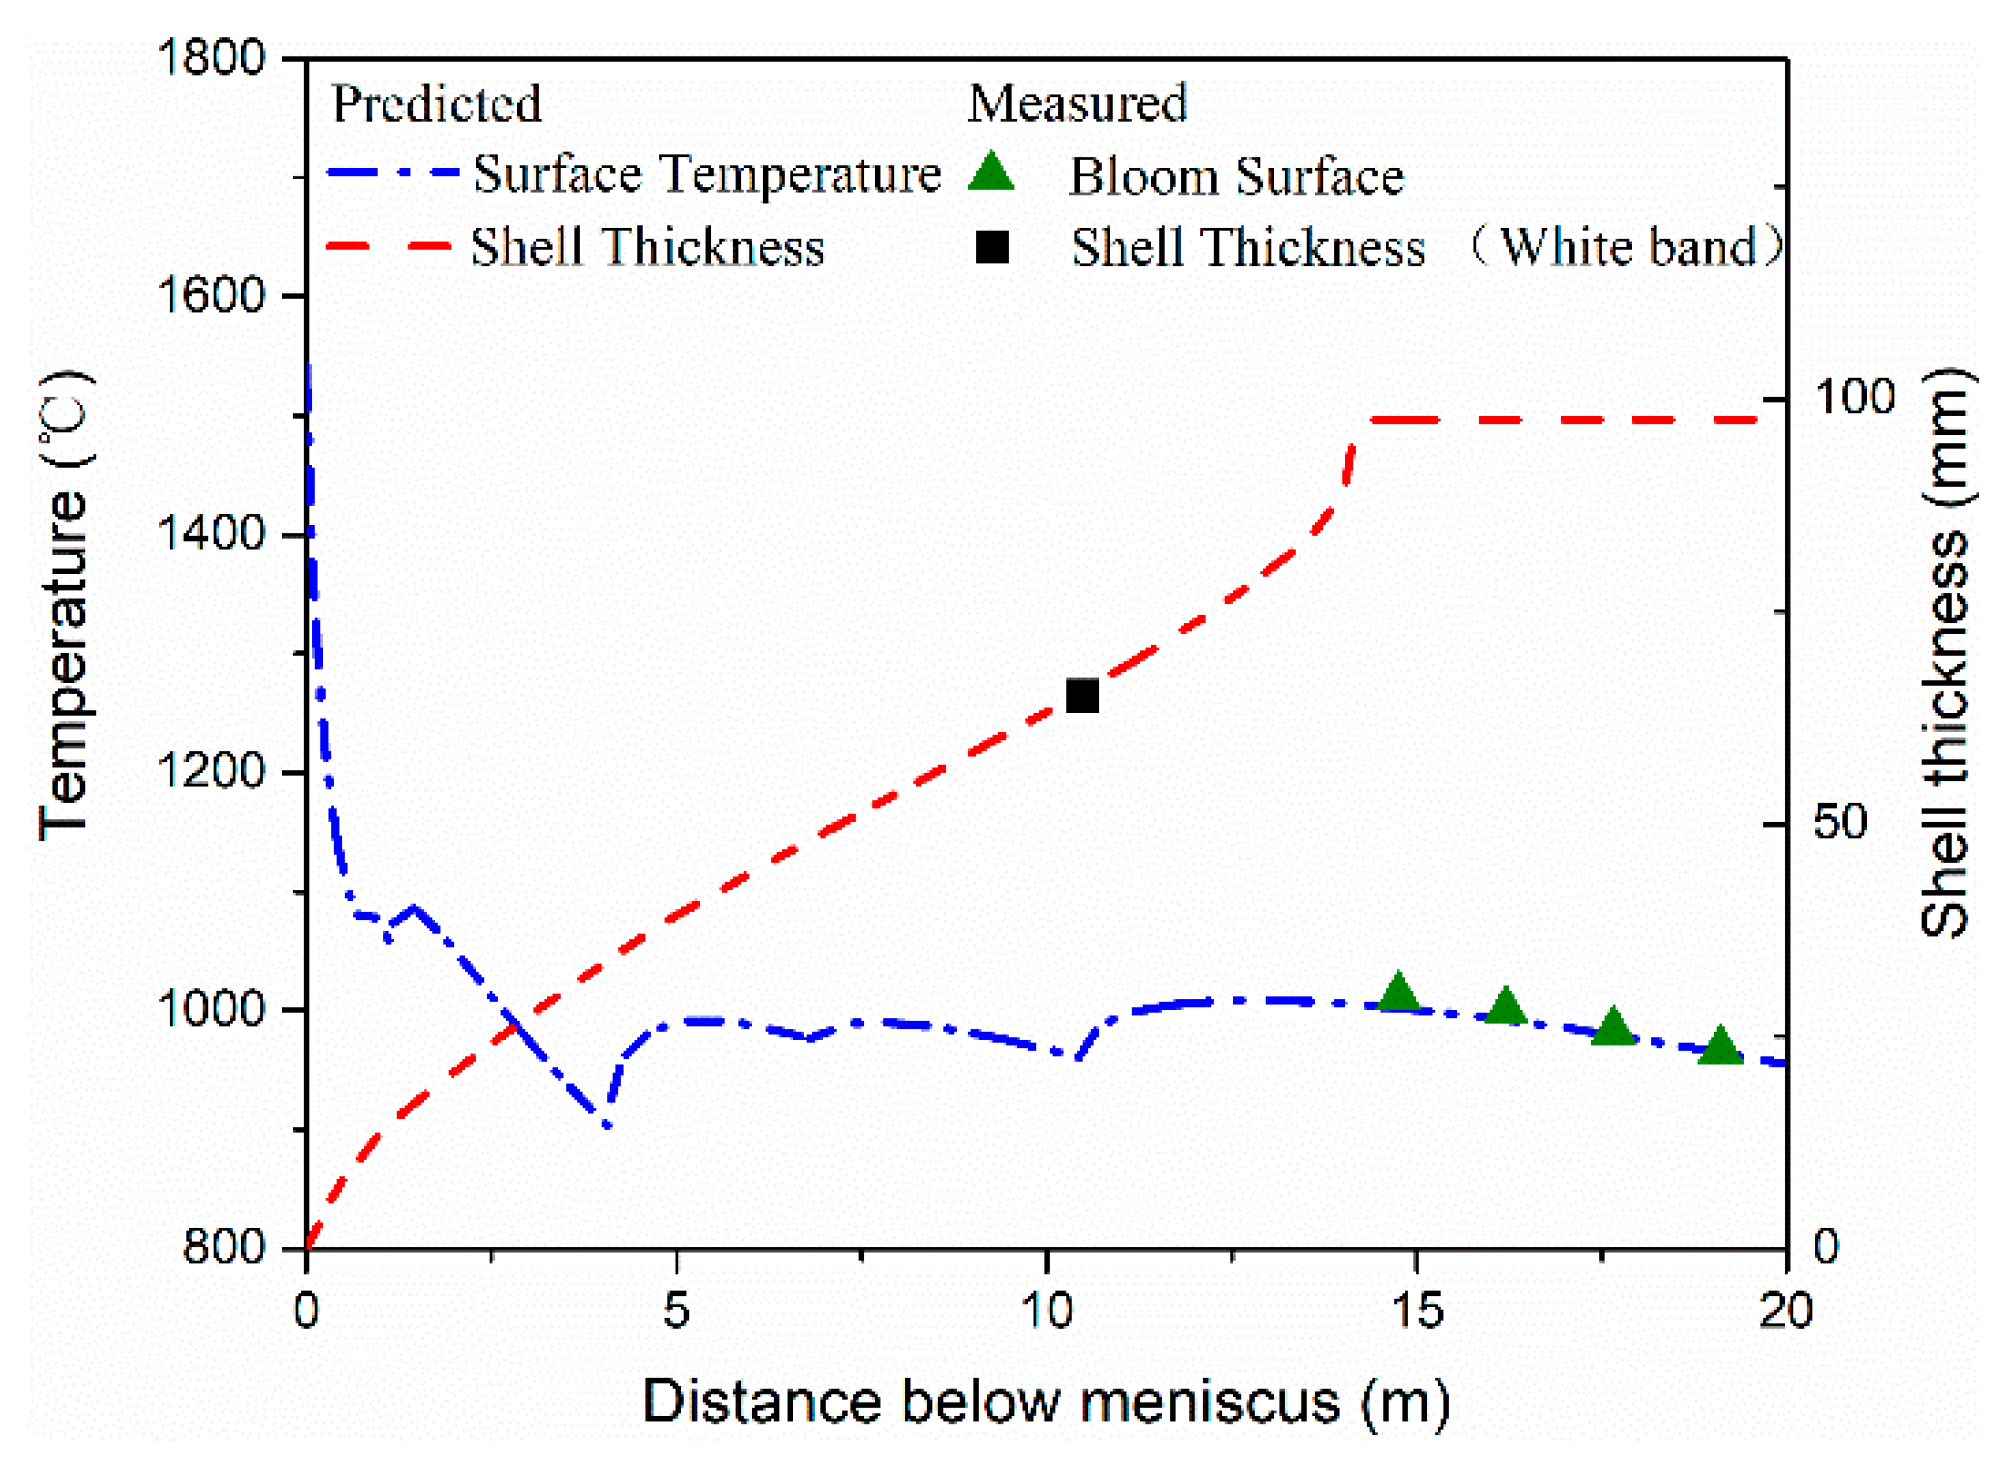
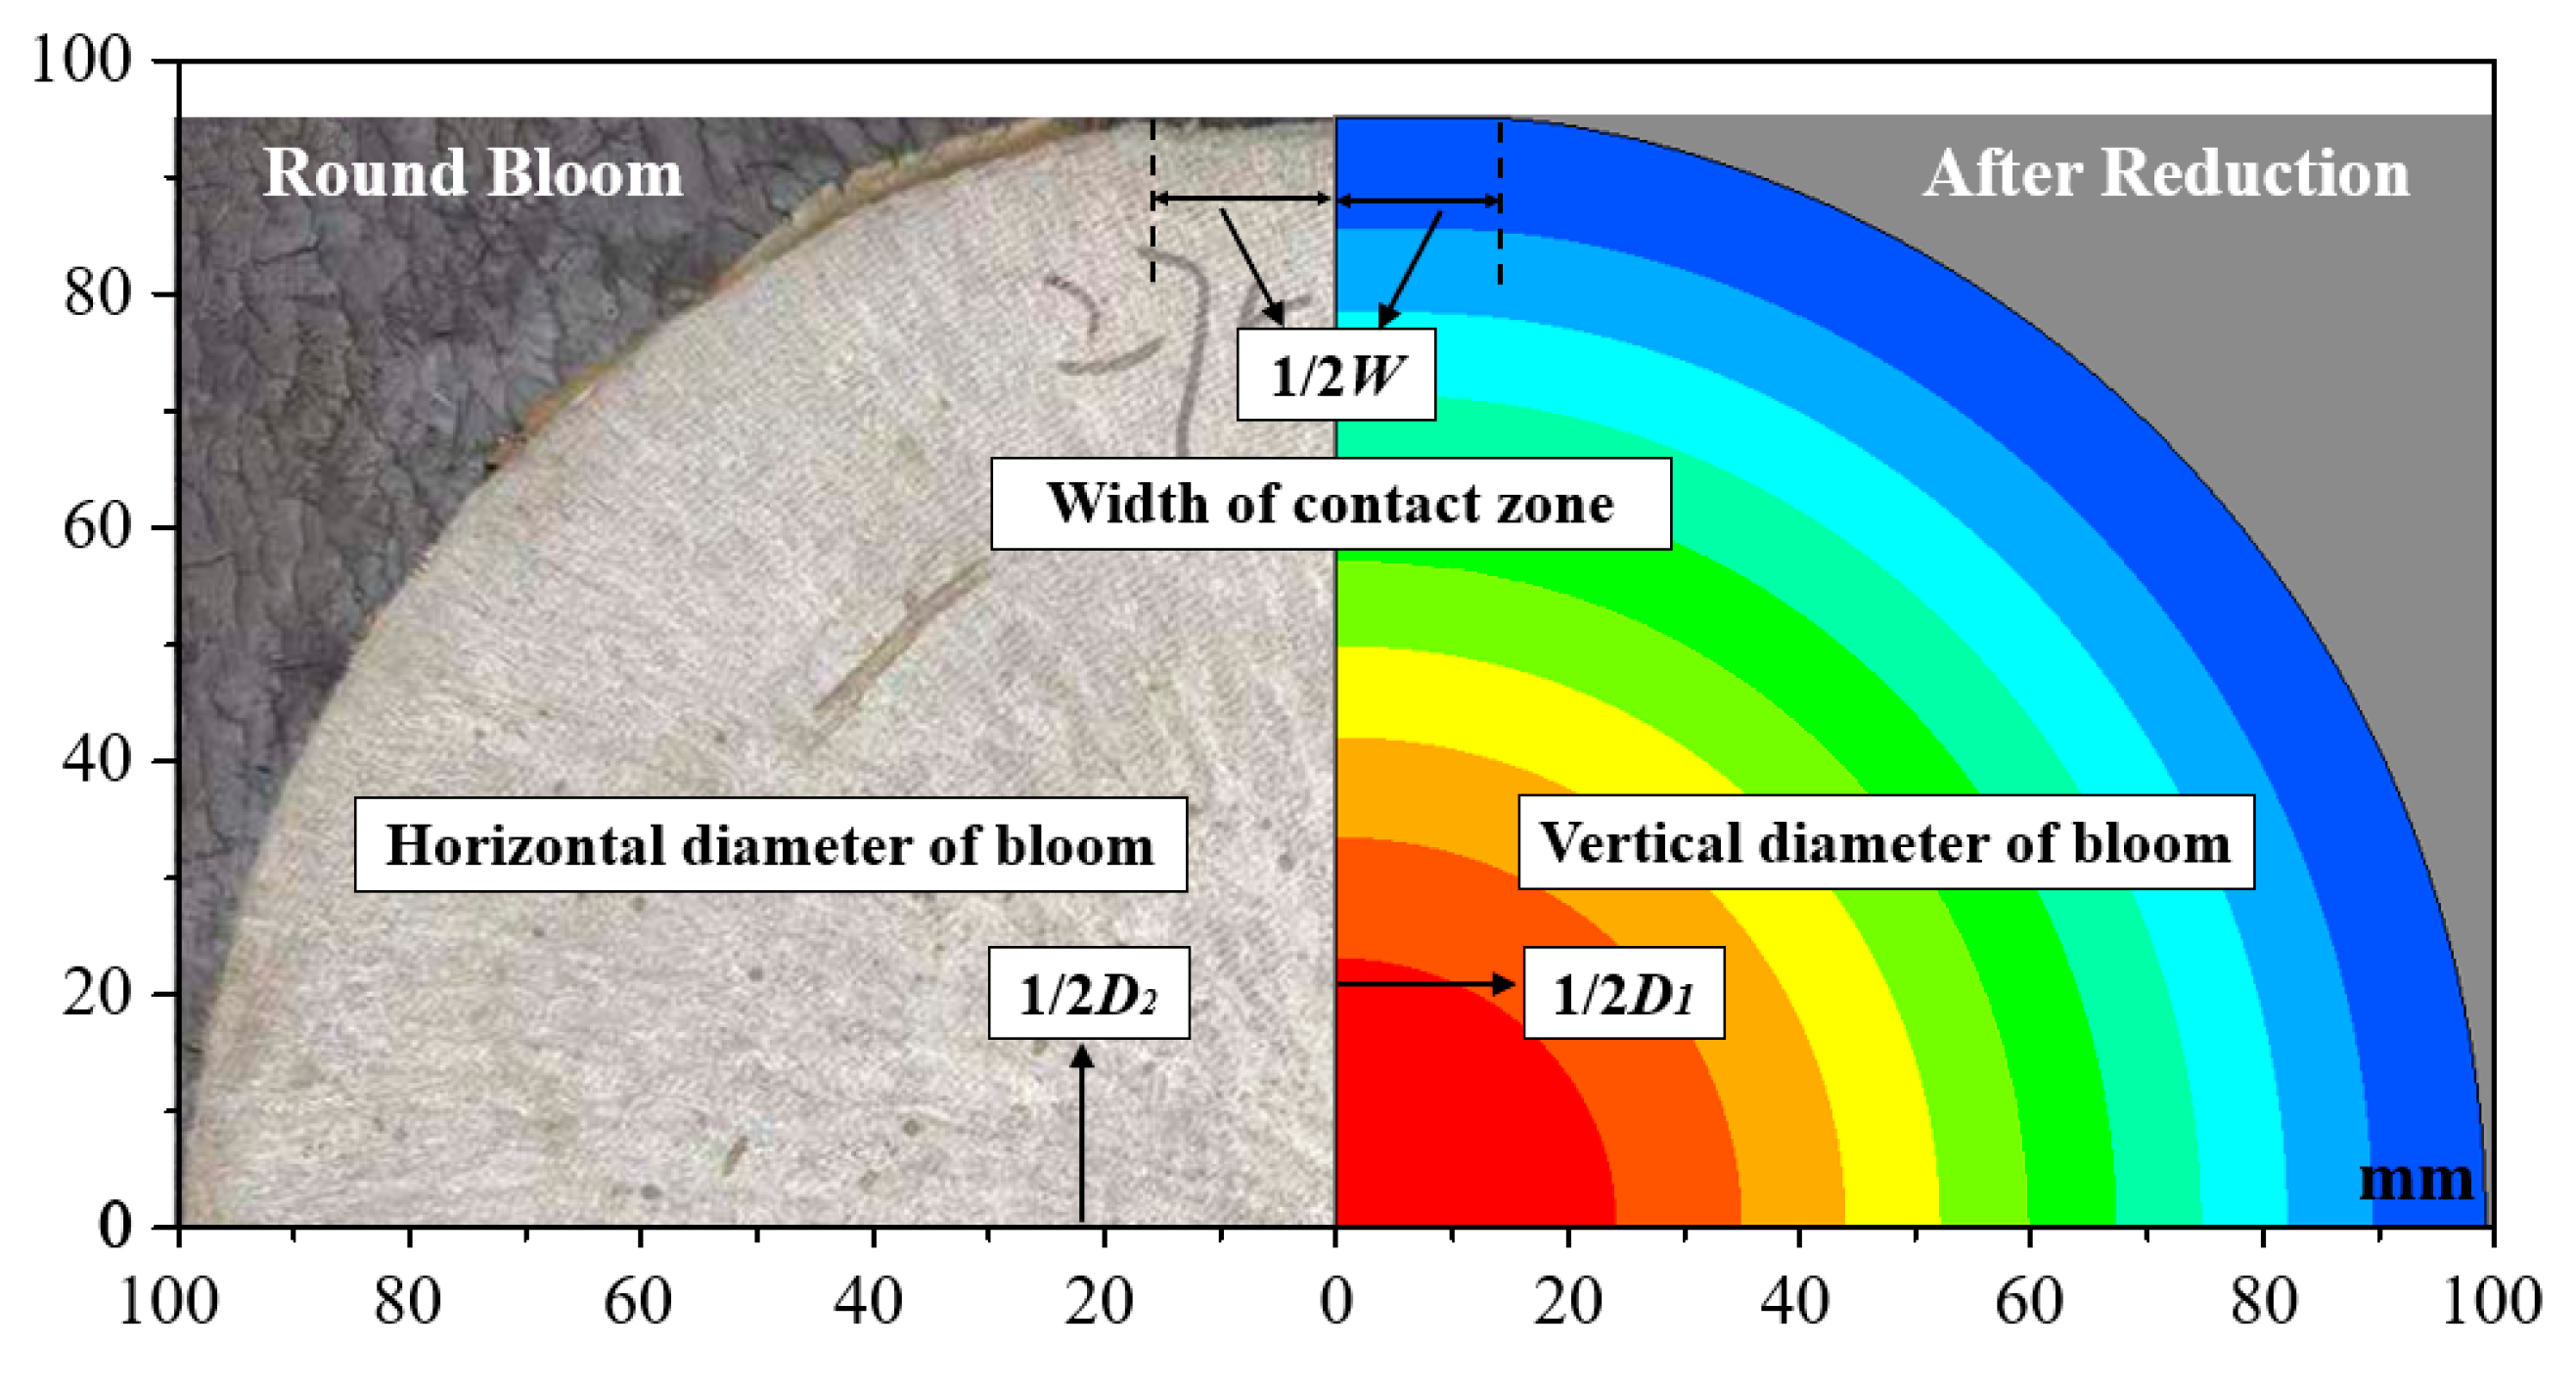
3.1. Model Validation

The Ø195 mm round bloom of C110 steel is cast at a casting speed of 1.7 m·min−1 and a casting temperature of 1541 °C. The location of white band caused by strong electromagnetic stirring is used to verify the heat transfer model. Figure 3 shows the surface temperature and shell thickness in modeling and experiment. It is evident that the prediction of the model matches well with the measurement.
In the previous work, this thermal-mechanical model has been verified by a SR process in the Ø690 mm round bloom continuous casting. With a reduction amount of 45 mm, the predicted horizonal diameter is 714 mm, agrees well with the measured result 710 mm, and the relative error does not exceed 1%. After this validation, the model was used to simulate and analyze the SR process in Ø195 mm round bloom continuous casting. Figure 4 compares the contour shape of Ø195 mm round bloom after the reduction process in simulation and experiment. The width of the contact zone between roll and round bloom in simulation is 28 mm, and the measured result is 30 mm. The length of the horizontal and vertical diameters in modeling are 197 mm and 190 mm, respectively, while the experimental values are 199 mm and 191 mm. It is obvious that the deformation results from the model and experiment are in good agreement.

3.2. Heat Transfer Result

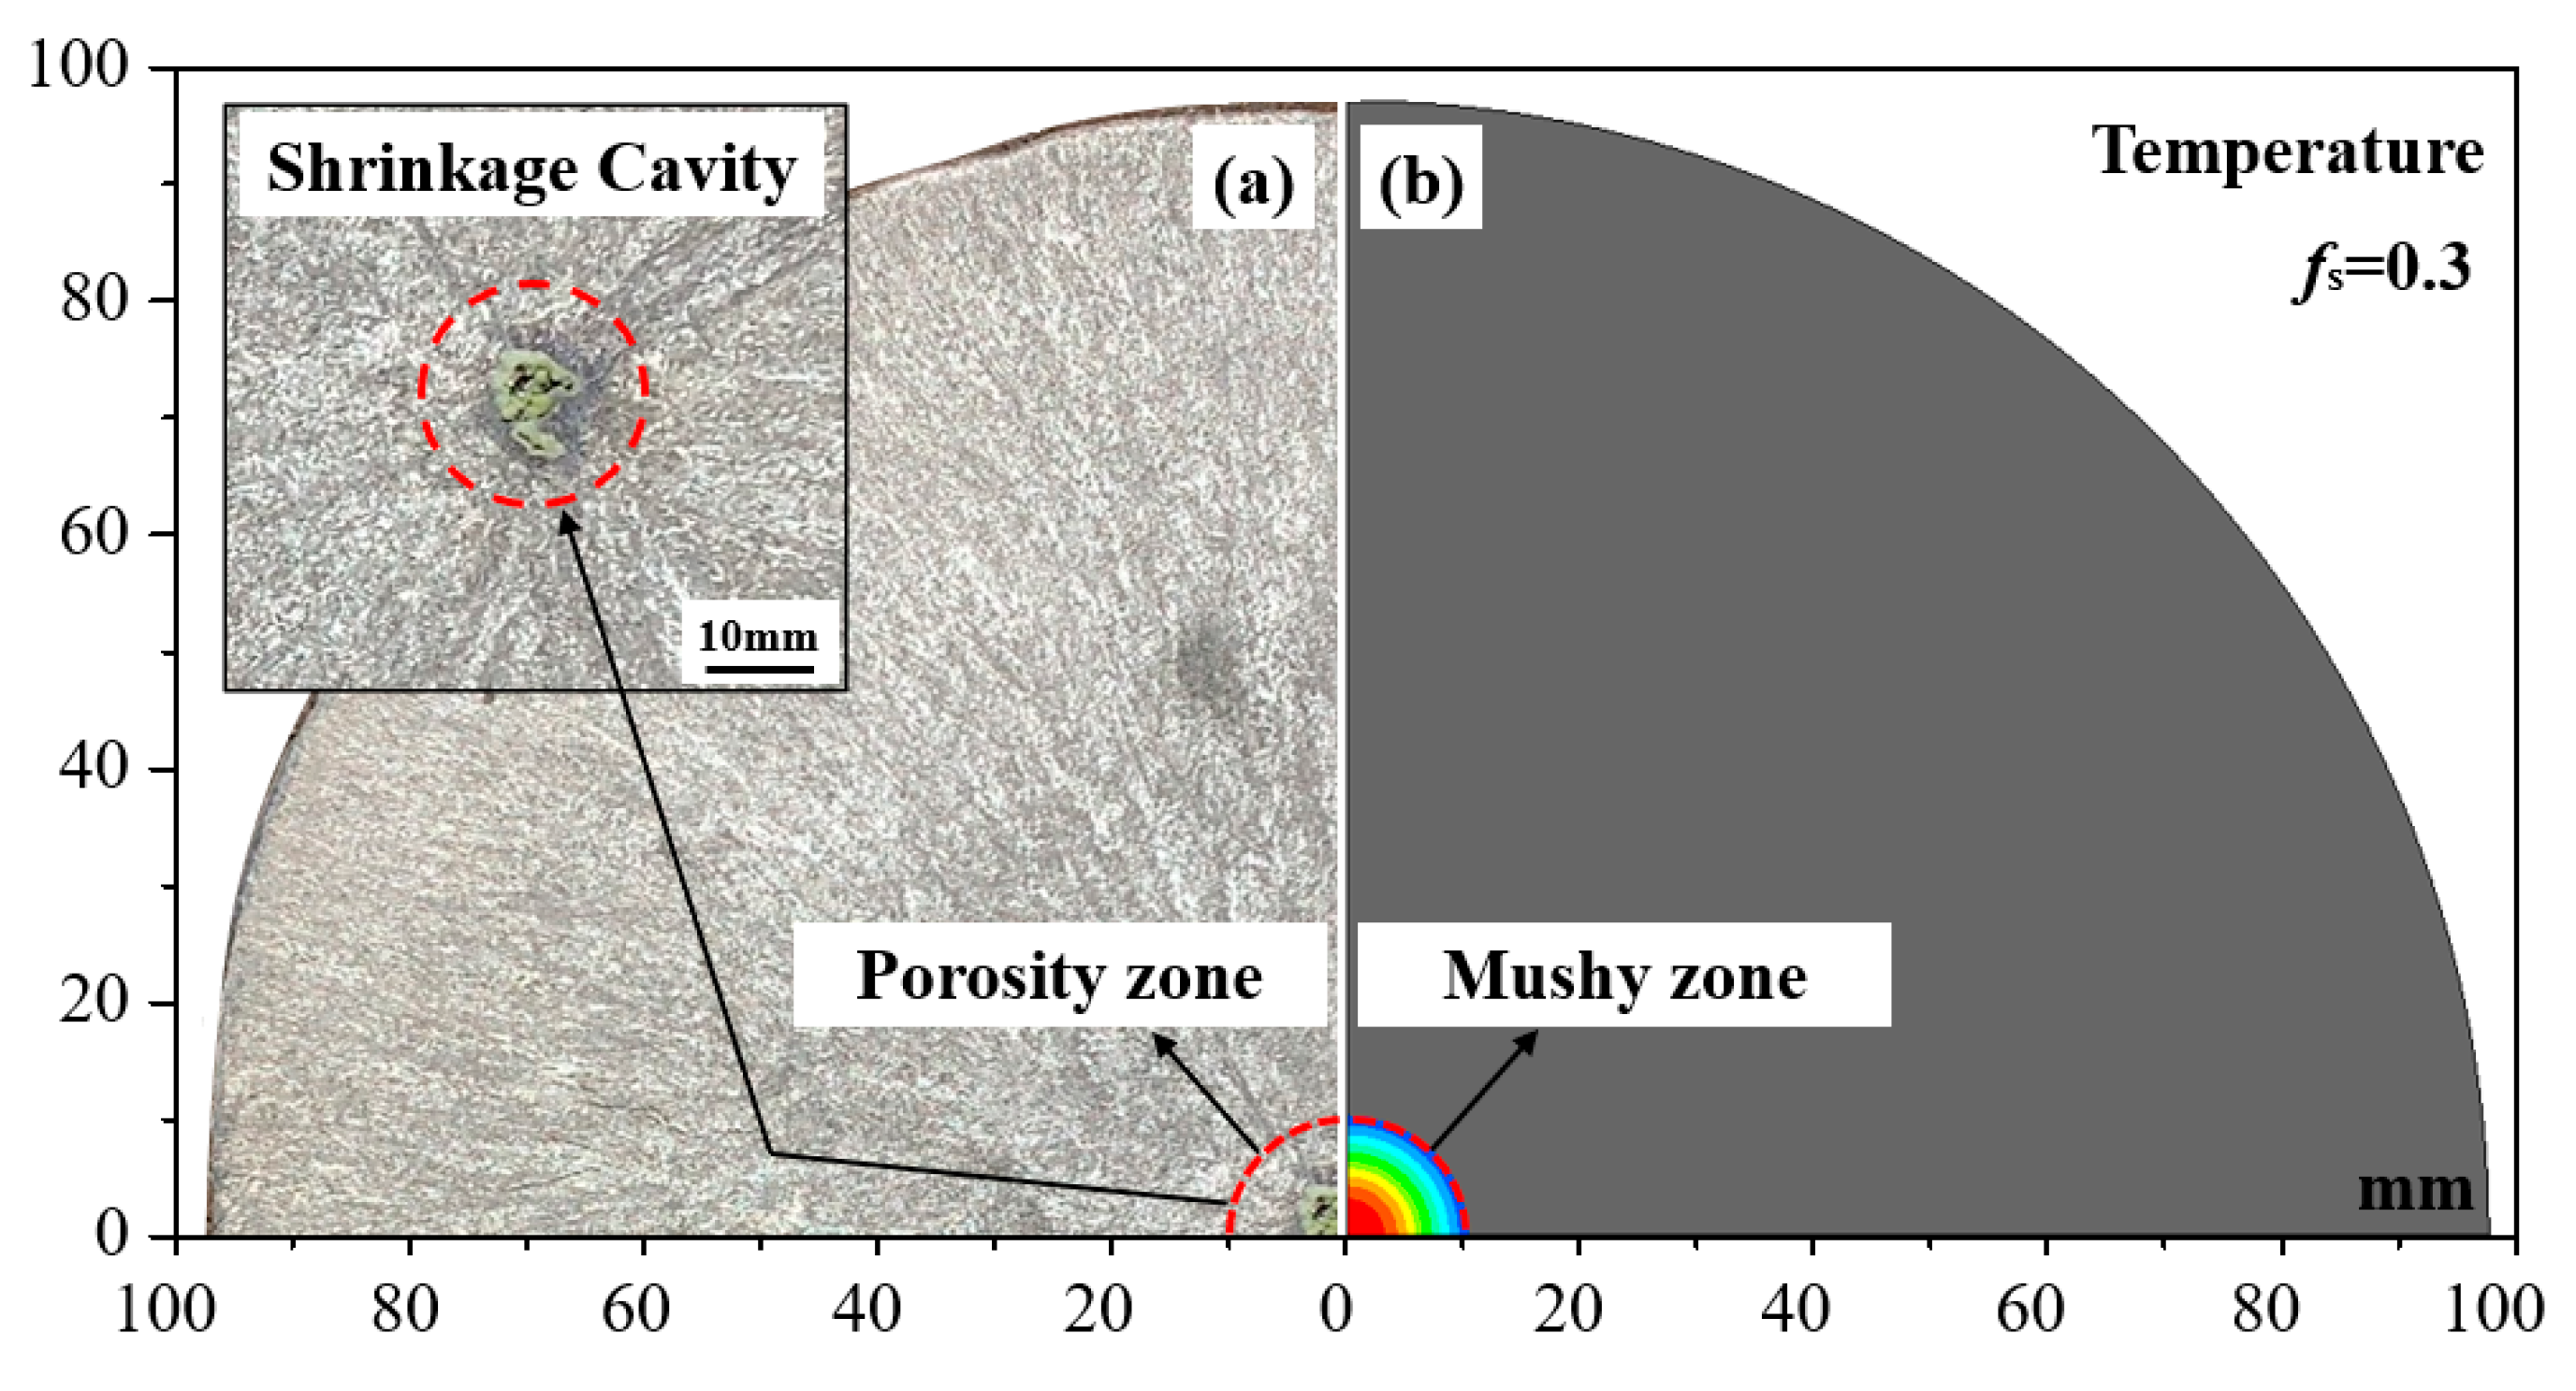
3.2.1. Shrinkage Porosity Zone

Figure 5b shows the temperature distribution of Ø195 mm round bloom with a center solid fraction of 0.3. The color part in the center is the mushy zone of round bloom, while the gray part is the solidified shell. When the center solid fraction is above 0.3 [30], the solidification shrinkage of mushy zone cannot be fed completely by the upstream liquid steel. Then the porosity occurs within this zone in the shape of a large cavity in the center or several medium- and small-sized cavities in the central region. According to the simulation result, the porosity zone of the Ø195 mm round bloom is a circular zone with a radius of 10 mm. In fact, this zone is consistent with the observation in the round bloom, as shown in Figure 5a. In the follow section, the above domain is selected when discussing the deformation behavior of the porosity zone in the round bloom.
In the 2D heat transfer model, the area of solidification shrinkage of mushy zone on the transverse section could be calculated by mass conservation as follows [9]:
Δ A i = 0 Y 0 X ( 1 ( ρ ( x , y ) ρ s ) ) d x d y
where Δ A i is the solidification shrinkage area of mushy zone, X is the width of mushy zone, Y is the thickness of mushy zone, ρ ( x , y ) is the local density in the mushy zone, which is a function related to temperature, ρ s is the steel density at solid temperature. When the center solid fraction reaches 0.3, the total solidification shrinkage area of mushy zone is about 30 mm2. The measured area of shrinkage porosity in the product is 32 mm2 average, and this agrees well with the predicted value.

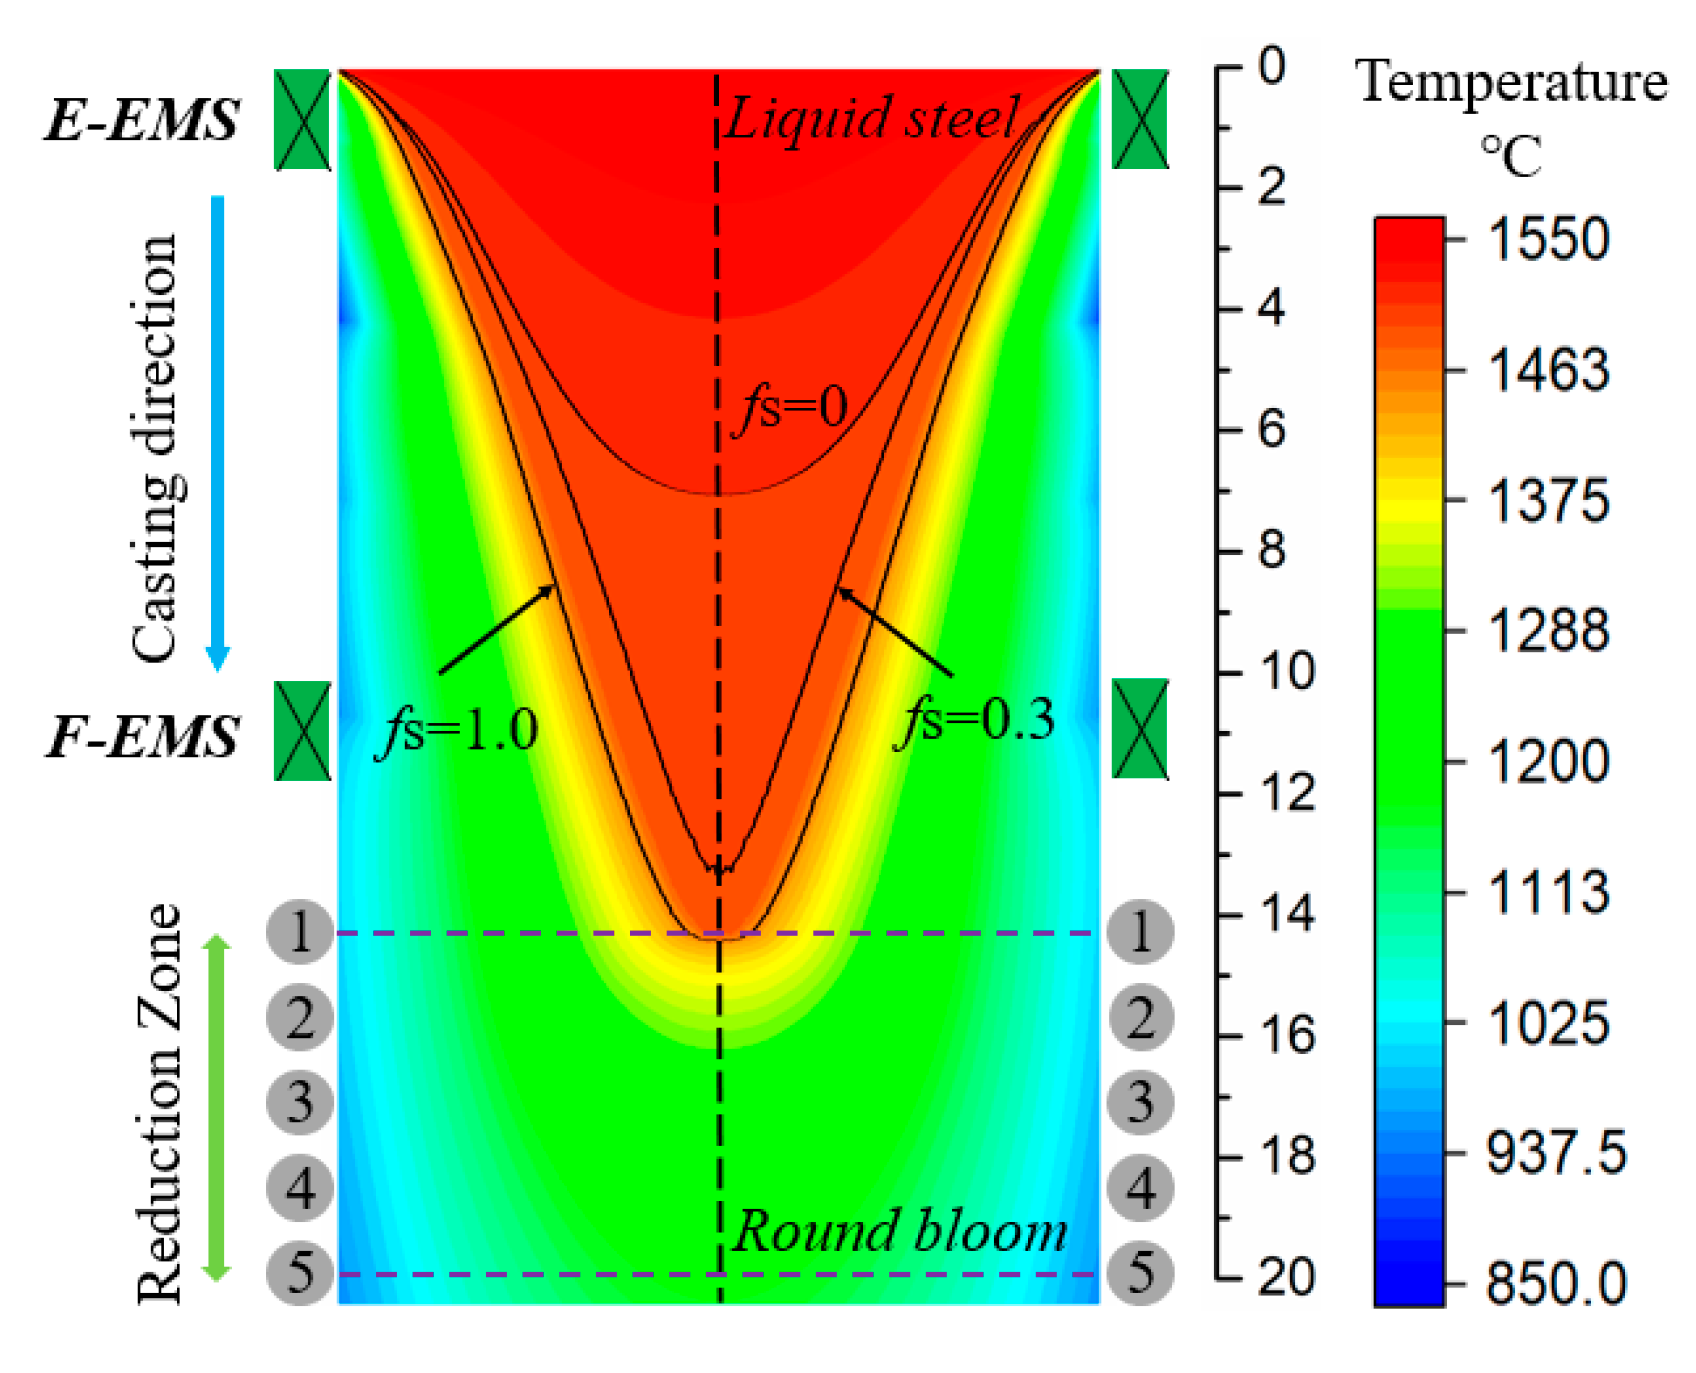
3.2.2. Reduction Zone

Figure 6 shows the temperature and solid fraction on longitudinal section of C110 steel from Ø195 mm round bloom. The solidification end of round bloom at casting speed of 1.7 m·min−1 is 14.3 m. To reduce the segregation and porosity in the continuously cast bloom, the soft reduction is usually used in a center solid fraction range of 0.3~0.7 [7,8,9]. In the case with a casting speed of 1.70 m·min−1, the center solid fraction of round bloom at No.1 withdrawal unit is 0.51, while at No.2 to No.5 withdrawal units is 1.0. Owing to the high temperature of bloom surface and low solid fraction in the center, implementing SR before solidification is more efficient than after solidification. However, according to the simulation results, only one withdrawal unit (No.1) can participate in the SR process before steel completely solidified, which cannot well balance the required compensation amount and contour ovality. Therefore, in order to better closure the shrinkage porosity, the SR is also applied on the round bloom after solidification in the present work.

3.3. Deformation Result

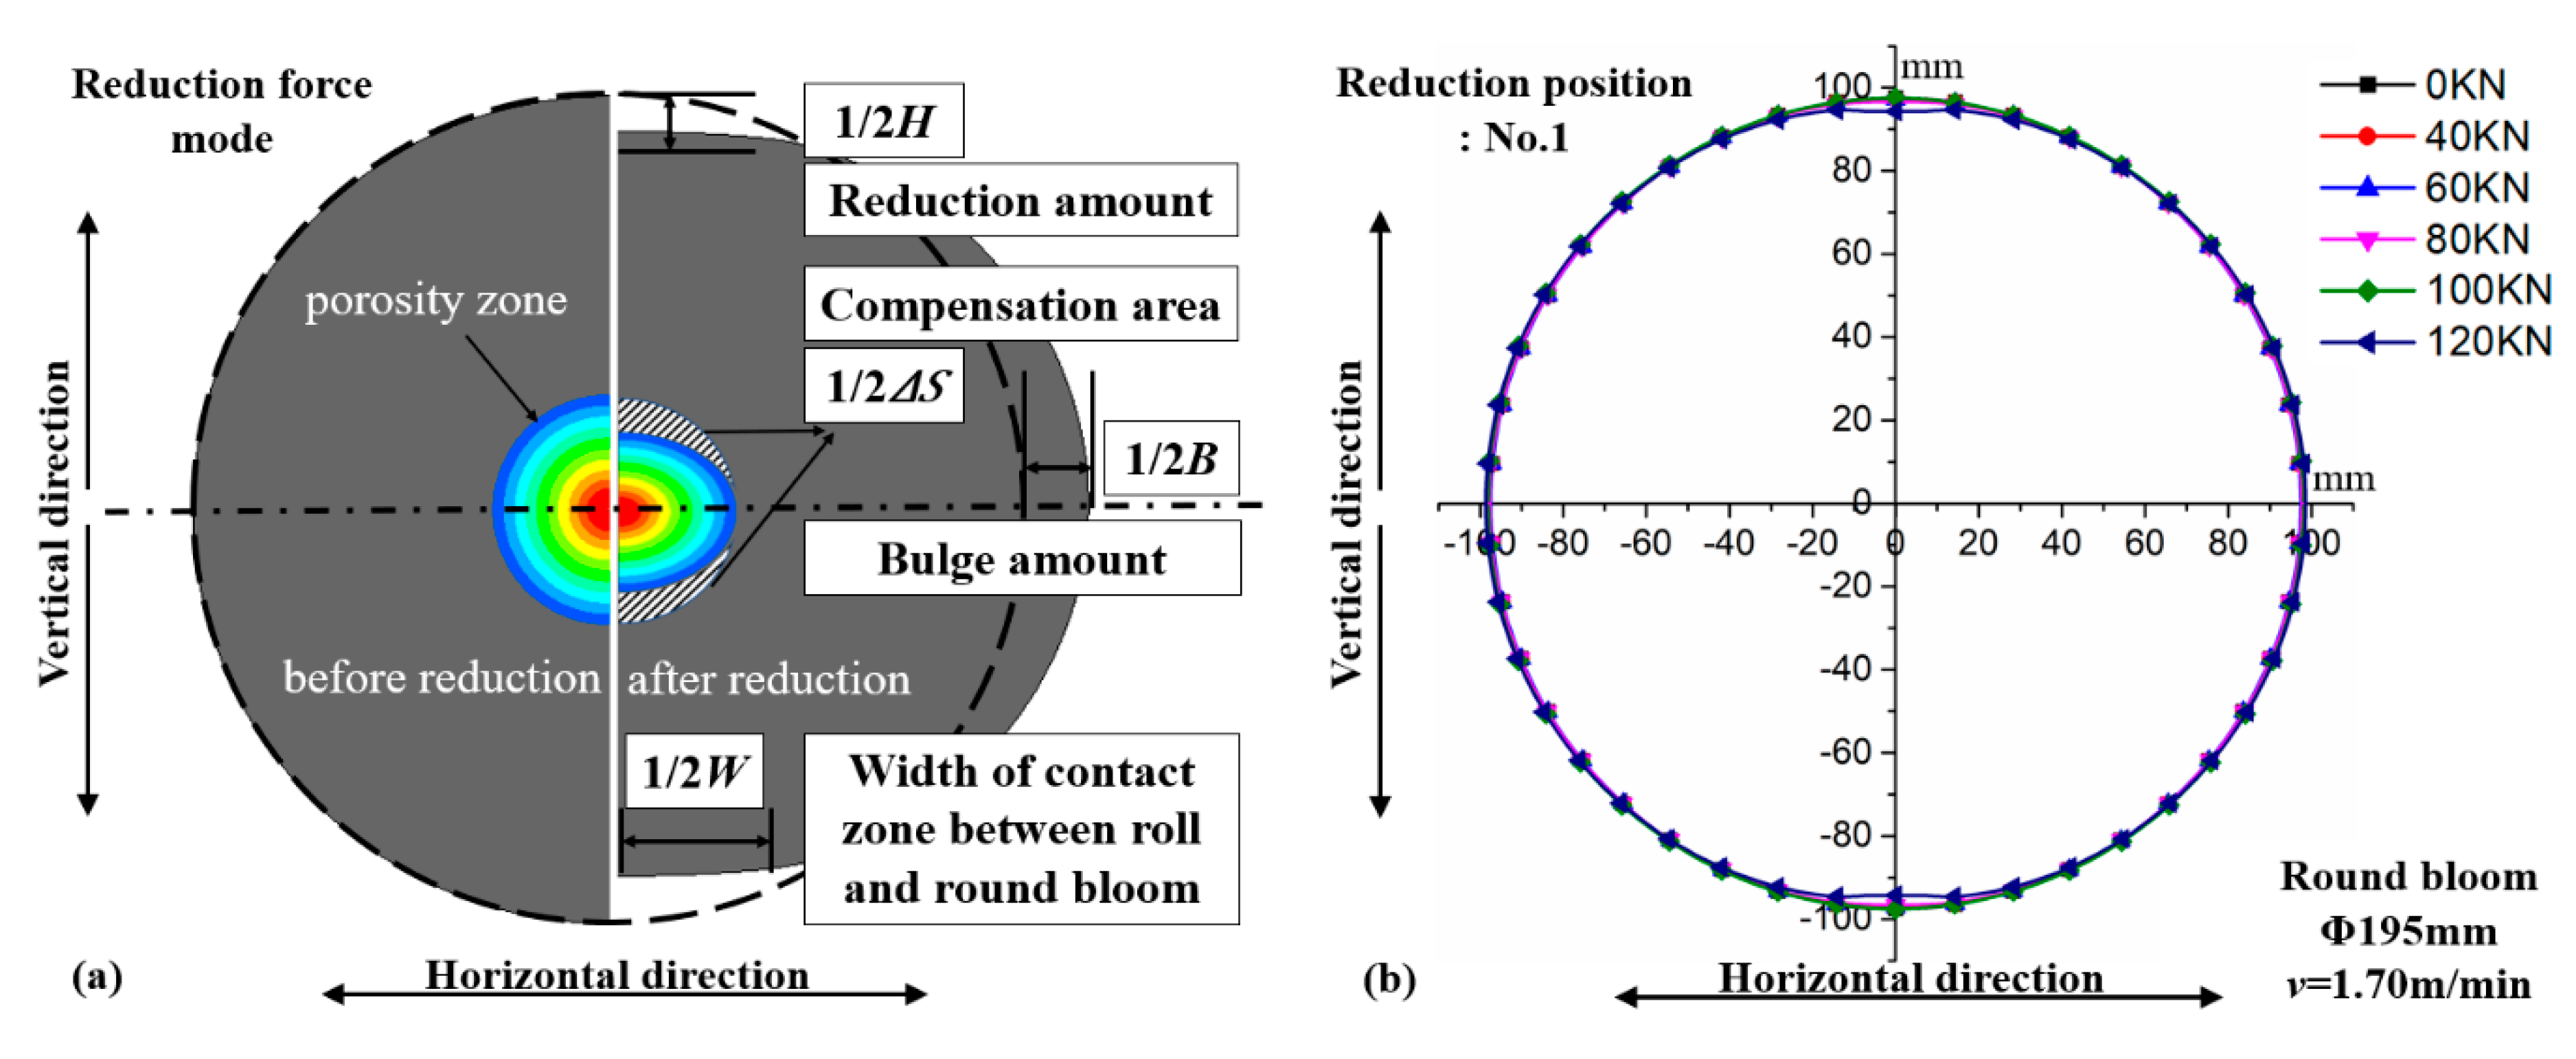
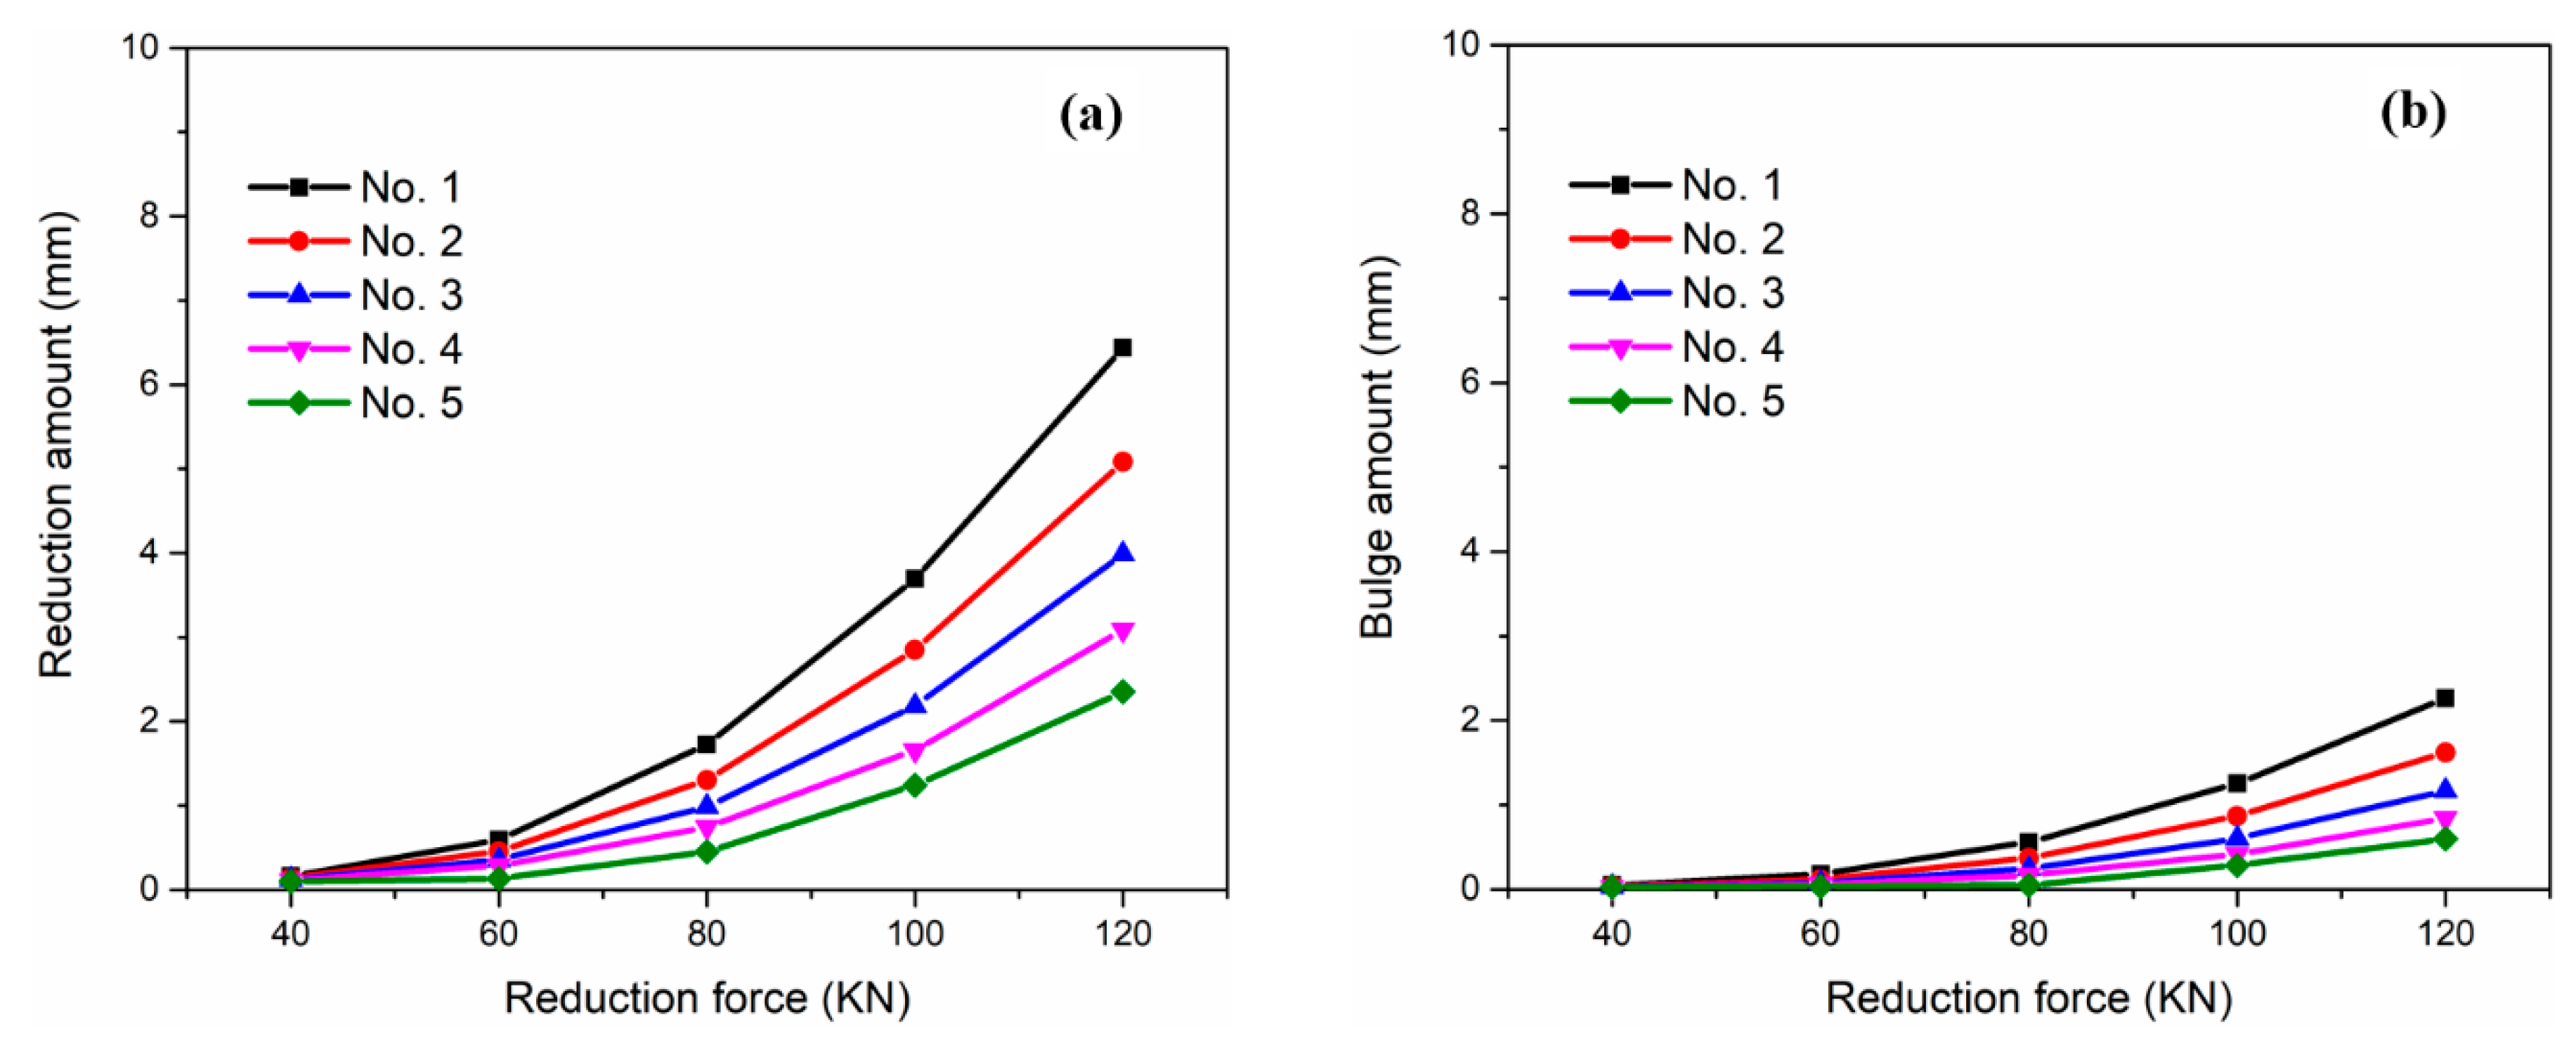
3.3.1. Reduction Amount and Bulge Amount

The reduction force mode is employed in the soft reduction process of Ø195 mm round bloom. A total of 25 controllable cases, including five reduction locations (No.1~No.5 withdrawal units) and five reduction forces (40 KN, 60 KN, 80 KN, 100 KN, 120 KN) at a single unit was analyzed. As shown in Figure 7a, when a certain reduction force is applied to the round bloom surface by withdrawal unit, the round bloom is compressed in the vertical direction, and the bulge occurs in the horizontal direction. The shape of round bloom is squeezed from a circle into an ellipse after soft reduction. Figure 7b shows the contours of Ø195 mm round bloom after reduction at the No.1 withdrawal unit. It is seen that under the given reduction force between 40~120 KN, the reduction amount and bulge amount of round bloom are very small, and the difference between them is almost impossible to distinguish with the naked eye, especially when the force is below 100 KN.
Figure 8a shows the reduction amounts of round bloom with different reduction forces at positions of No.1~No.5 withdrawal units. The reduction amount of round bloom increases with the increase of reduction force. At the No.1 withdrawal unit, when the reduction force increases from 40 KN to 120 KN, the reduction amount could increase from 0.16 mm to 6.44 mm. However, at the No.5 unit, the reduction amount just increases from 0.10 mm to 2.35 mm as the reduction force increases in the same range. It is obvious that the reduction amount in No.1 unit is the largest under the reduction force mode and the round bloom is more easily deformed in the front reduction unit.
In contrast to rectangular product, when the reduction operation is conducted on the round bloom, the contact zone between roll and bloom is quite small, resulting in a larger reduction amount for the round bloom under the same reduction force. Correspondingly, to achieve the same reduction amount, the force required for the round bloom is smaller. It indicates that the soft reduction process of round bloom is a highly efficient and energy-saving technology.
Figure 8b shows the bulge amounts of round bloom after reduction. The change trend of bulge amount is in line with the reduction amount. With the increase of reduction force, the bulge amount increases. At the No.1 withdrawal unit, when the reduction force increases from 40 KN to 120 KN, the bulge amount of round bloom could increase from 0.05 mm to 2.26 mm. However, the bulge amount only increases from 0.03 mm to 0.60 mm in the No.5 unit under the same reduction force change. The bulge amount of the rear unit is much lower than the front unit due to the lower shell temperature and the higher deformation resistance.

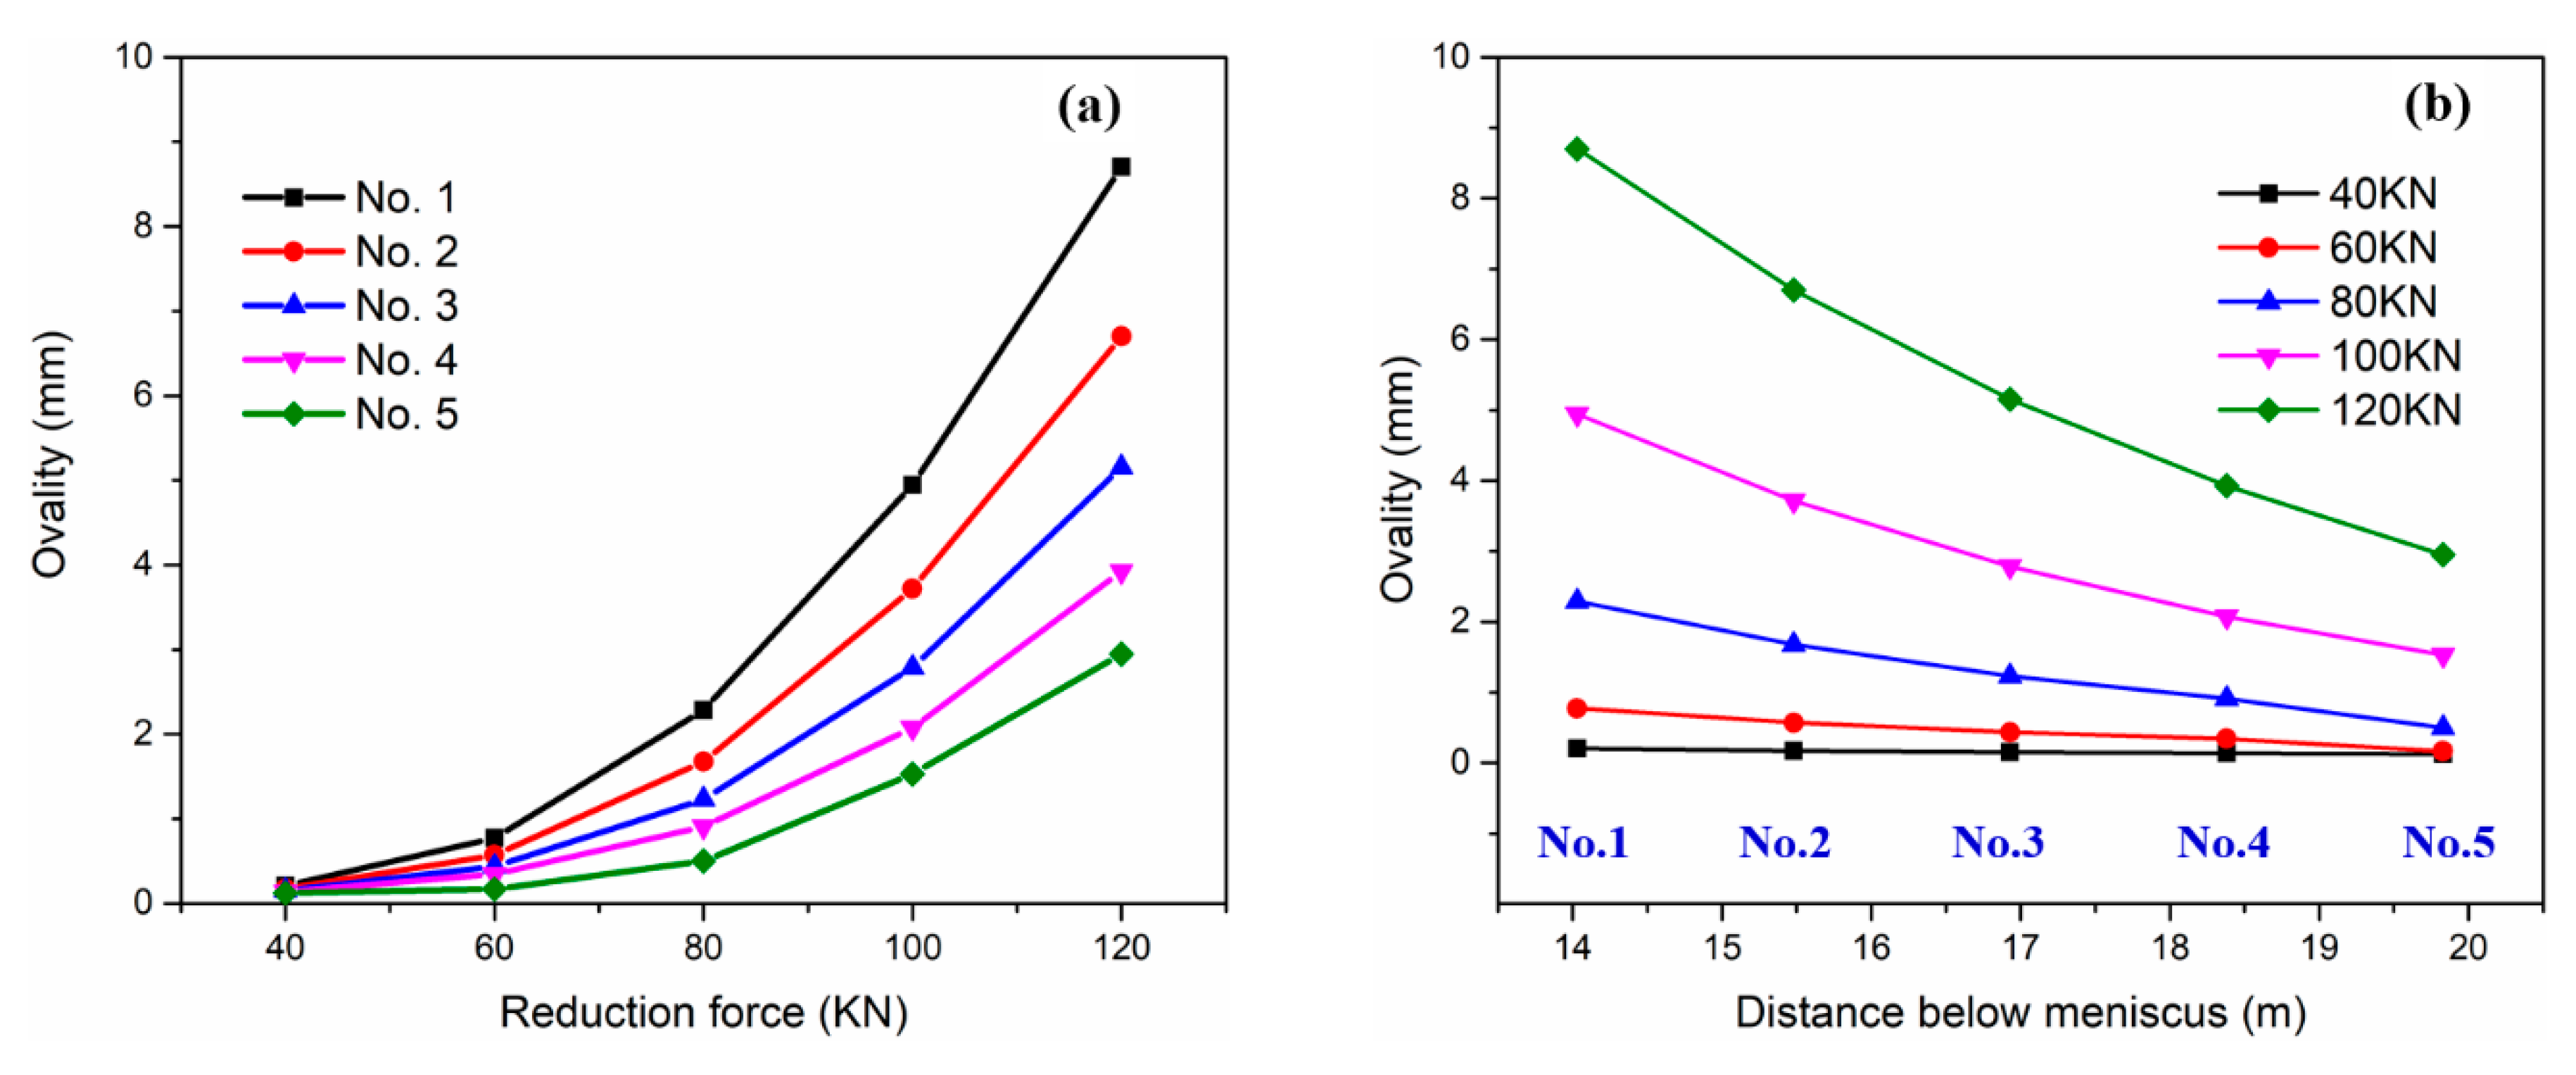
3.3.2. Ovality of Round Bloom

Ovality is defined as the difference between the horizontal and vertical diameters of the round bloom after reduction. For the round bloom product, the ovality is with different limitation for different steels. The high ovality will lead to the increase of operation difficulty or degradation yield. Figure 9 shows the ovality of the round bloom after different reduction. It is observed that the ovality increases with the increase of the reduction force, and decreases with the backward movement of reduction position. At the No.1 withdrawal unit, when the reduction force changes from 40 KN to 120 KN, the ovality changes from 0.21 mm to 8.70 mm. However, at the No.5 unit, the ovality only increases form 0.12 mm to 2.95 mm as the reduction force increases within the same range. For the present oil pipe product, the limitation of the ovality for Ø195 mm round bloom is 8 mm. Thus, according to the simulation results, in order to control the ovality of round bloom, the reduction force at the No.1 withdrawal unit should not exceed 115 KN.

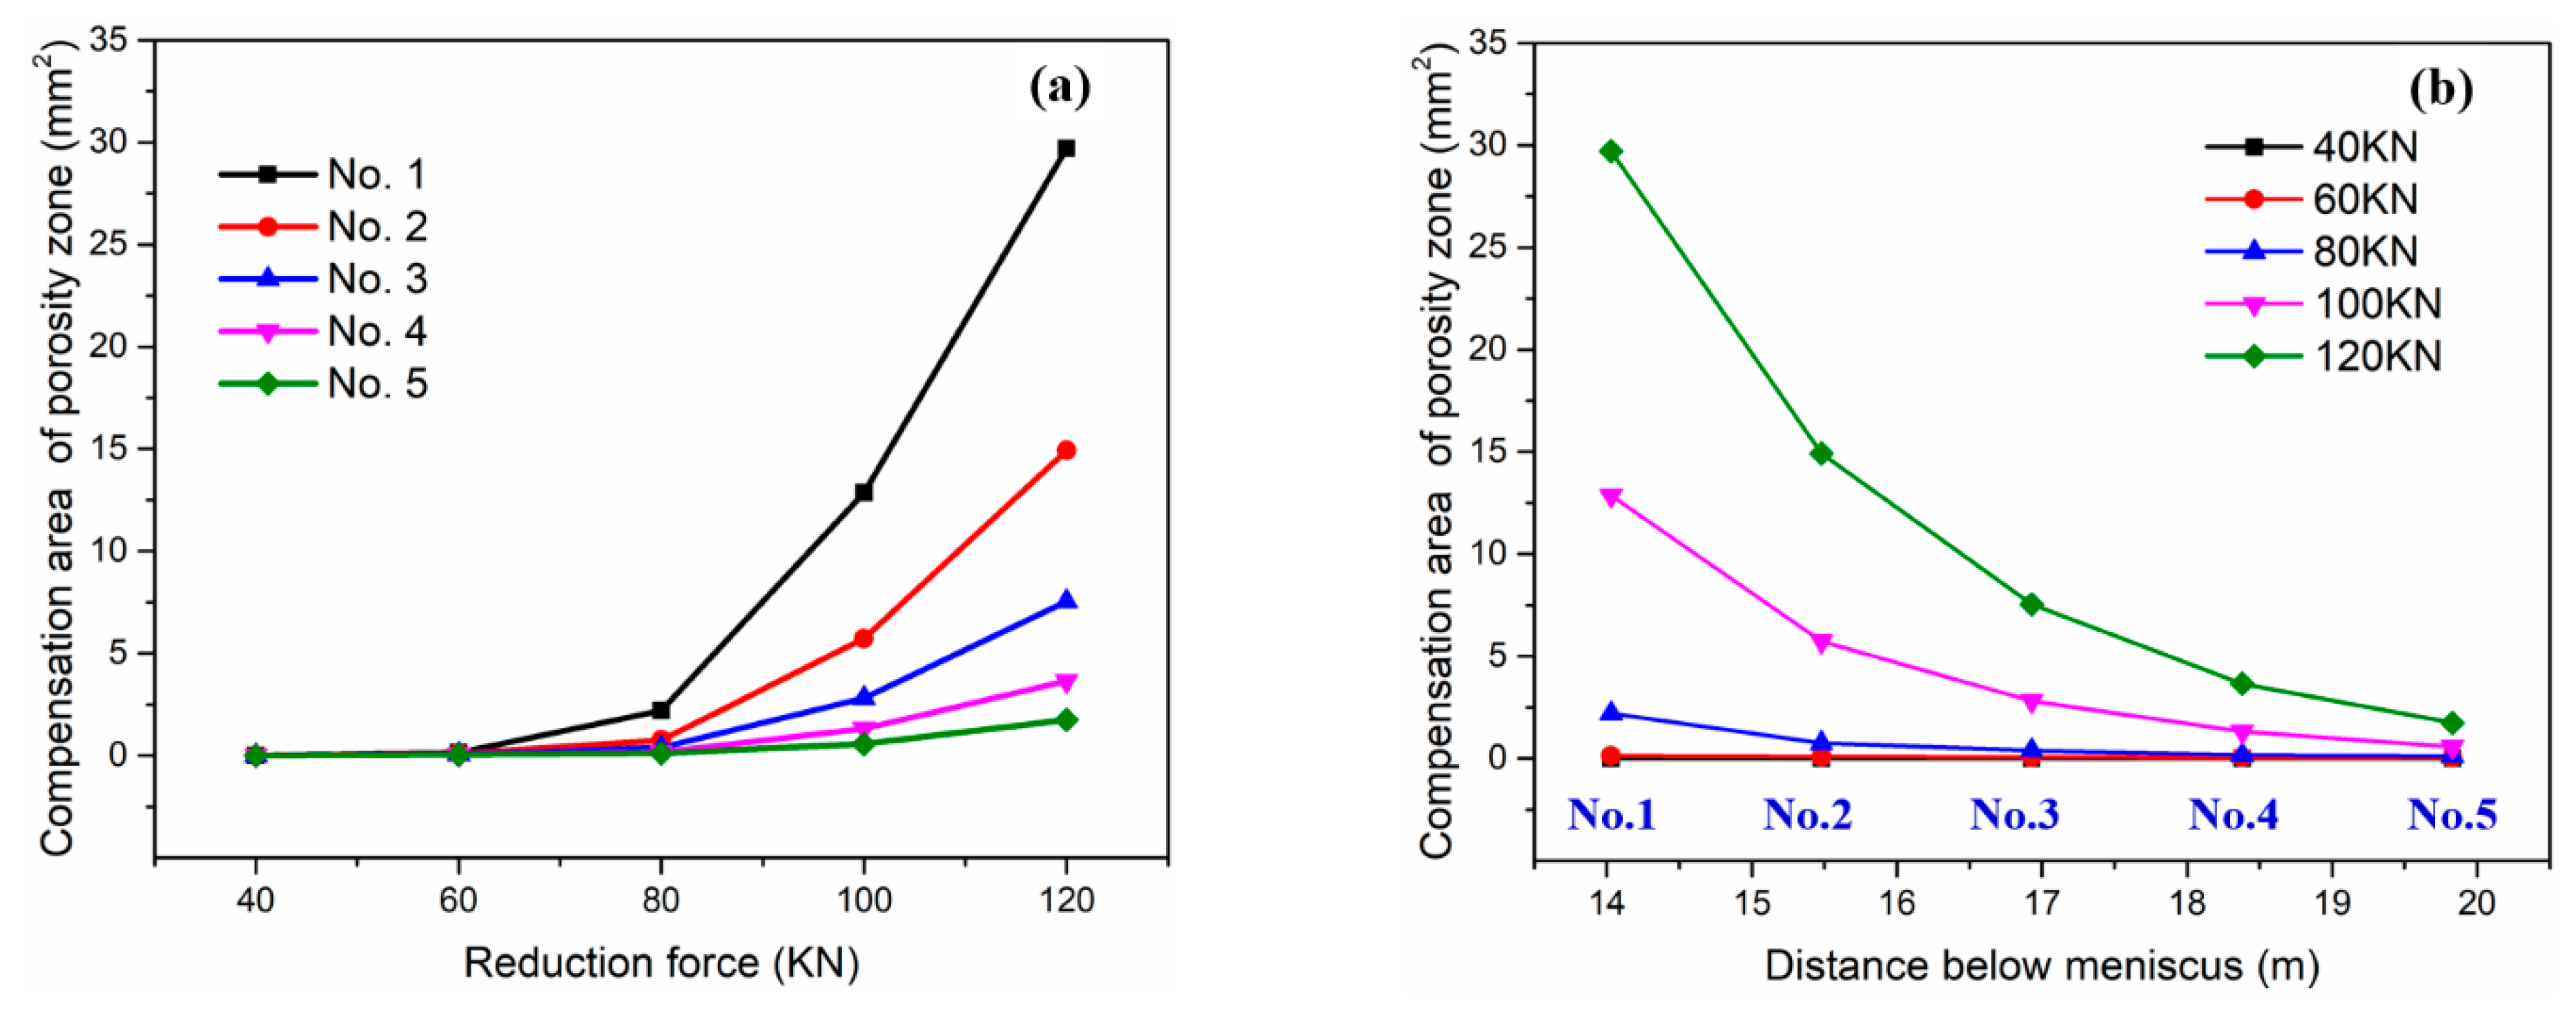
3.3.3. Compensation Area of Porosity Zone

The compensation area is defined as the area decrease of the porosity zone after reduction operation, as shown in Figure 7a. Figure 10 shows the compensation area of the porosity zone in the Ø195 mm round bloom after different reduction. It is seen that the compensation area in the porosity zone increases with the increase of reduction force. At the No.1 withdrawal unit, when the reduction force increases from 40 KN to 120 KN, the compensation area in porosity zone increases from 0.008 mm2 to 29.7 mm2. However, at the No.5 unit, the compensation area of the porosity zone just increases from 0.003 mm2 to 1.74 mm2 as the reduction amount increases in the same range. It reveals that the deformation penetration at No.1 unit is much stronger than other units. To control the central porosity defect in round bloom efficiently, the reduction operation should be executed by the forward units as the center solid fraction is above 0.3.
As shown in Figure 10a, when the reduction force is lower than 80 KN, the compensation area of the porosity zone at No.2~No.5 withdrawal units are almost 0 mm2, even at No.1 unit is only 2.2 mm2. It indicated that only when the reduction force is greater than 80 KN, the reduction deformation on the round bloom surface can penetrate into the porosity zone in the center of round bloom. In addition, as shown in Figure 10b, the compensation area of the porosity zone at No.4 and No.5 units is no more than 2.8 mm2 unless the maximum pressure of 120 KN is adopted. As the reduction position moves back along casting direction, the shell temperature decreases and the deformation resistance increases. Even if a substantial reduction force is applied to the back unit, a good compensation effect cannot be achieved. It suggests that the No.4 and No.5 units do not need to participate in the reduction process due to their low deformation permeability.

4. Soft Reduction Experiment

4.1. Multi-Unit Soft Reduction

According to the relationship between the compensation area in porosity zone and reduction force in Figure 10a, a reduction force of 120 KN is needed for the No.1 withdrawal unit to compensate the shrinkage cavity of 30 mm2 (calculated by Equation (23)) in Ø195 mm round bloom. However, in this situation, the ovality of round bloom exceeds the standard of 8 mm (Figure 9a). It is obvious that the soft reduction in No.1 unit alone cannot completely compensate for the shrinkage porosity with the limitation of ovality in round bloom. Therefore, multi-unit soft reduction process is required to control the central porosity under the present condition, as shown in Figure 11. According to the above discussion, the final reduction parameters for Ø195 mm round bloom continuous casting are determined as listed in Table 1. During the multi-unit soft reduction process of the round bloom, a reduction force of 100 KN is used on the No. 1 to No. 3 withdrawal units respectively.
The 2D thermal-mechanical coupled model is used to simulate this multi-unit reduction process, the reduction amount, bulge amount and compensation area of porosity zone are obtained as shown in Table 1. The calculated ovality of round bloom is 6.6 mm, which meets the standard requirement. In the single unit reduction, the reduction amount at No.2 unit is 2.85 mm under the reduction force of 100 KN (Figure 8). However, the reduction amount at No.2 unit is only 0.9 mm under the same reduction force during the multi-unit reduction. This is due to the increase in the contact zone between the roll and the round bloom, and the increase in deformation resistance.
It is obvious that the deformation of round bloom will be affected by the previous reduction process during the multi-unit SR, as shown in Figure 11. However, for the billet or bloom, the contact zone between roll and billet is always the width of billet and does not change in the multi-unit reduction process. It means that for those rectangular products, the reduction of the previous unit does not influence the subsequent reduction process. Therefore, compared to other blooms, the process of multi-unit soft reduction in round bloom is very special and different. The reduction parameters in the first reduction unit are extremely critical, and play a dominant role in compensating for shrinkage porosity and controlling ovality of round bloom.

4.2. Improvement of Round Bloom Quality

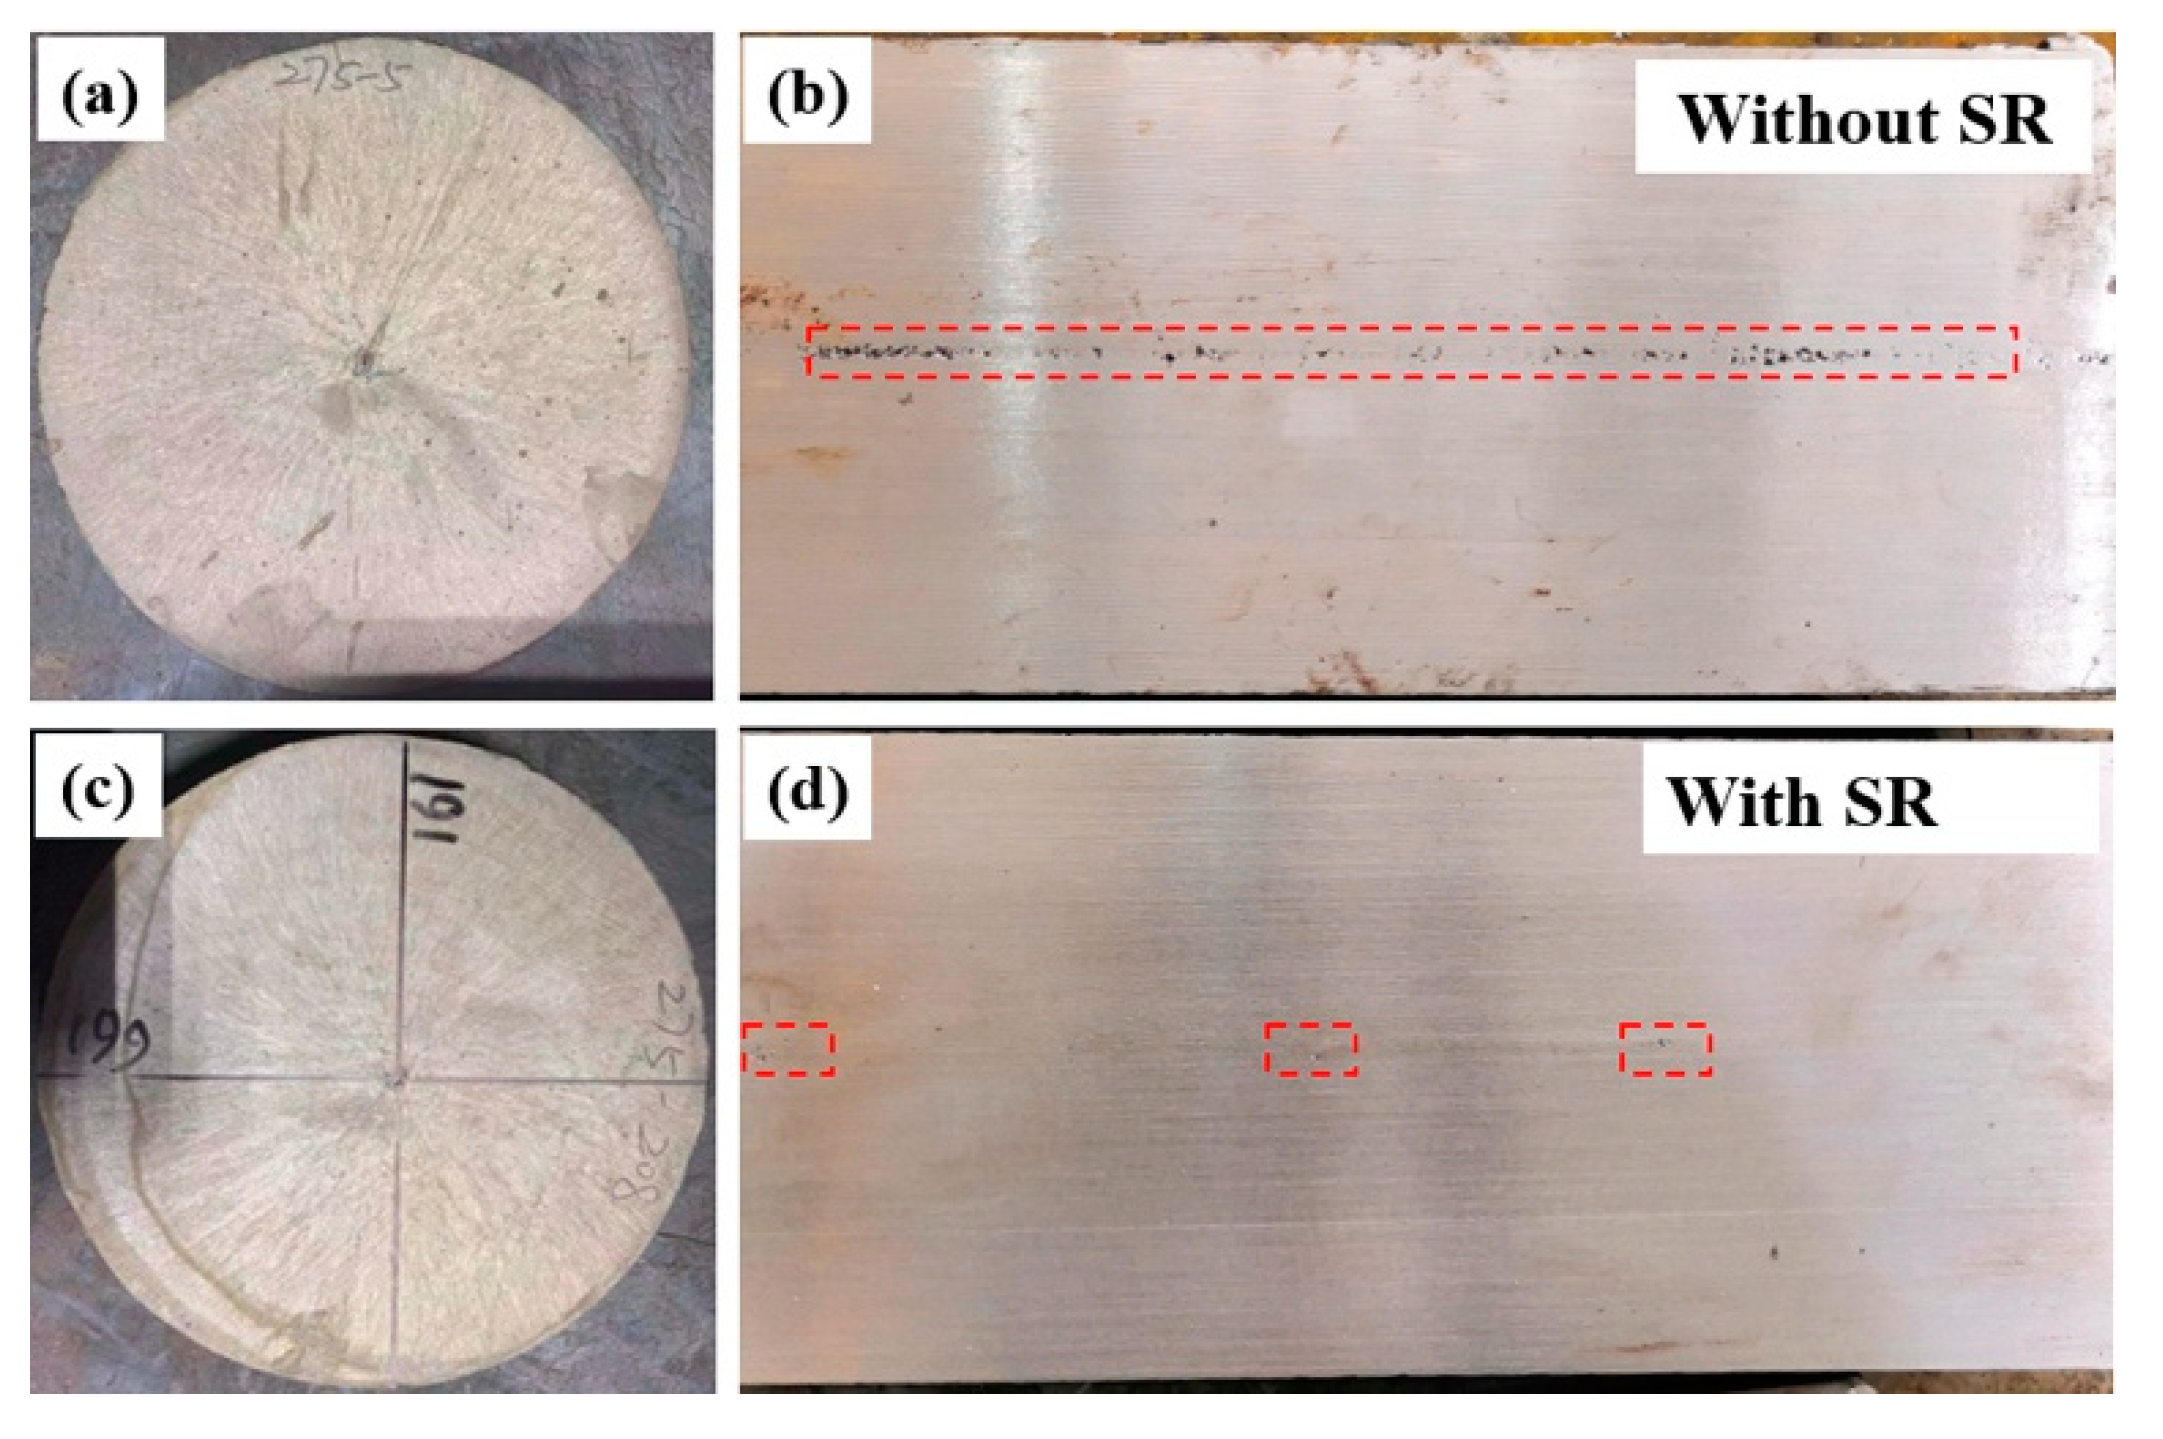
4.2.1. Shrinkage Porosity

The total compensation area of the porosity zone of prediction in the present reduction is 24 mm2 (Table 1). Assuming that the shrinkage porosity is concentrated in the center to present as a circular cavity on the cross section of round bloom. The diameter of the shrinkage cavity after reduction (DP) can be derived as follows:
D P = 4 × ( S m Δ S p ) π
where D P is the solidification shrinkage area, 30 mm2, Δ S P is the compensation area, 24 mm2. The calculated diameter of the shrinkage porosity after reduction D P is 2.8 mm.
Figure 12 compares the etched results of round bloom without and with SR. It is surprising that the shrinkage cavity is vanished in the round bloom center after the multi-unit soft reduction process. The maximum span of shrinkage cavity is 6 mm in the round bloom without reduction, and it decreases to 3 mm in the round bloom after reduction, quite close to the result by Equation (24). The multi-unit soft reduction has been proved an effective measure to control the shrinkage porosity defect in the round bloom continuous casting.

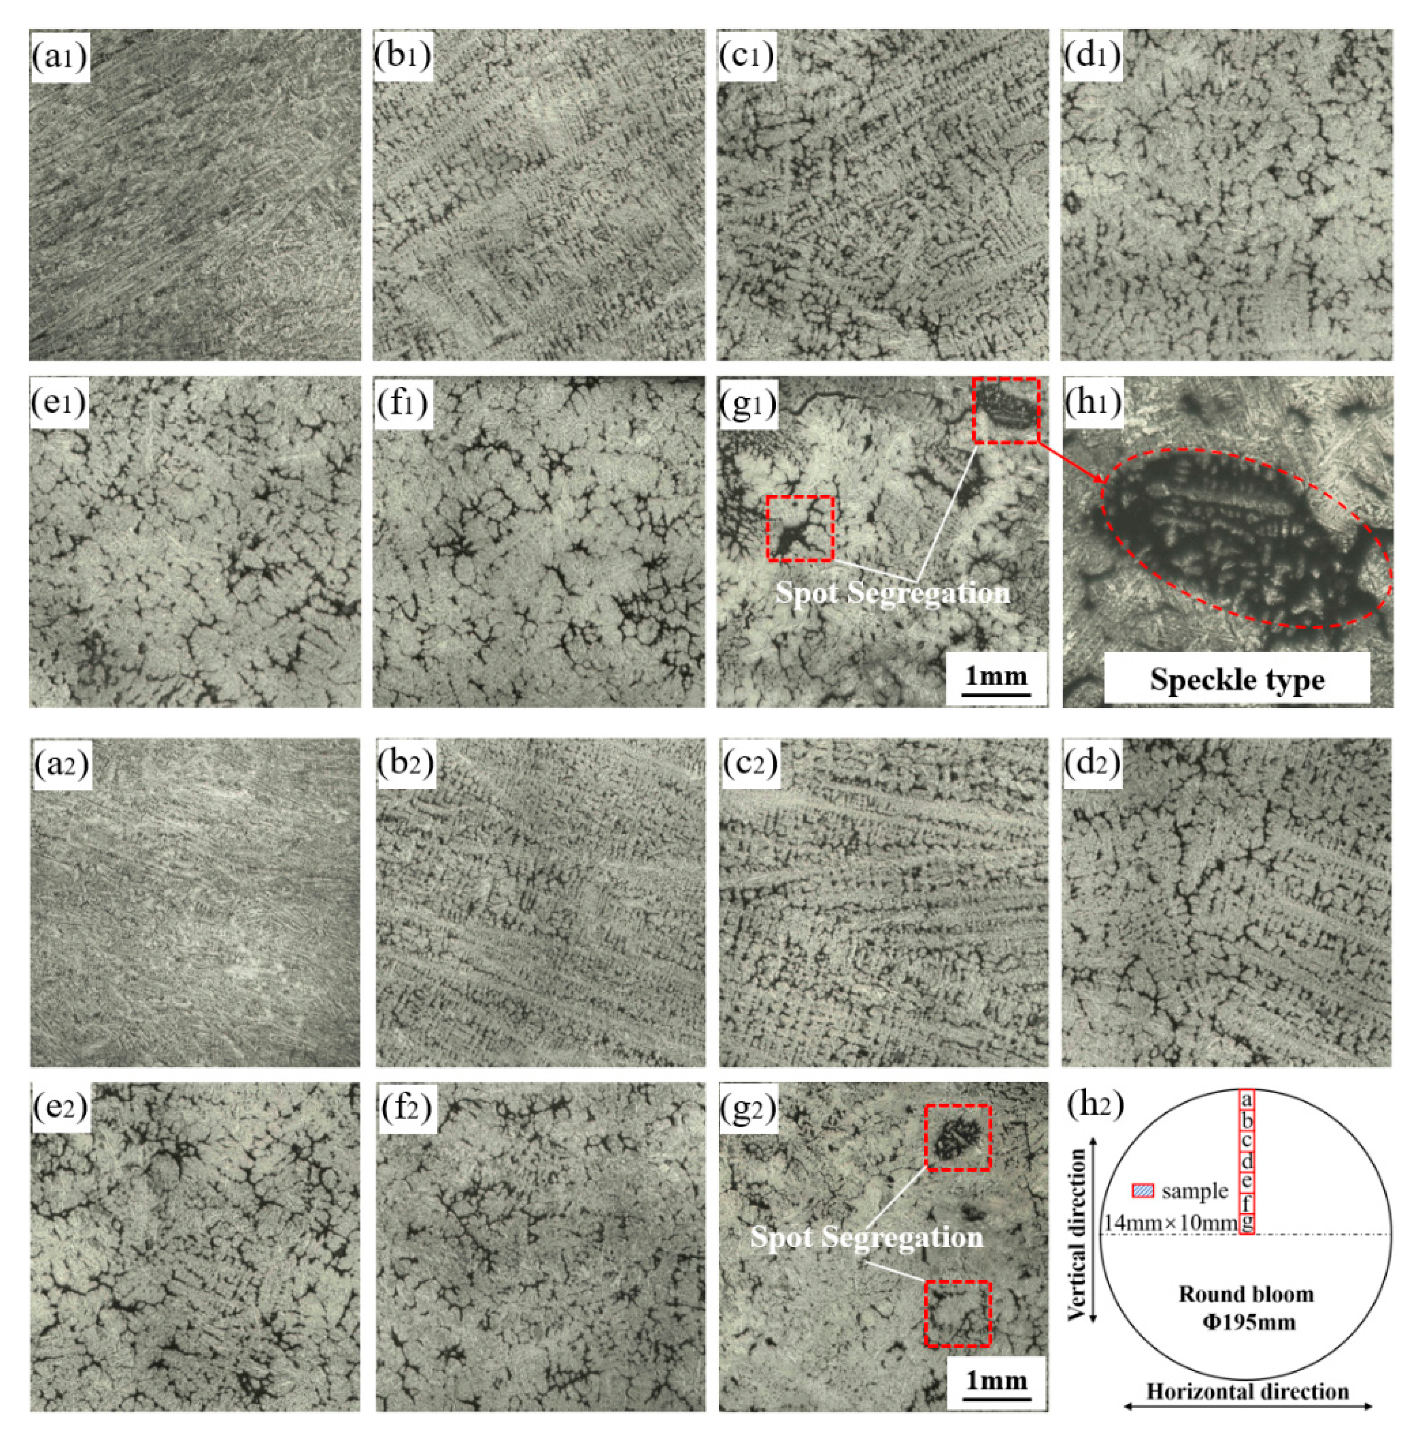
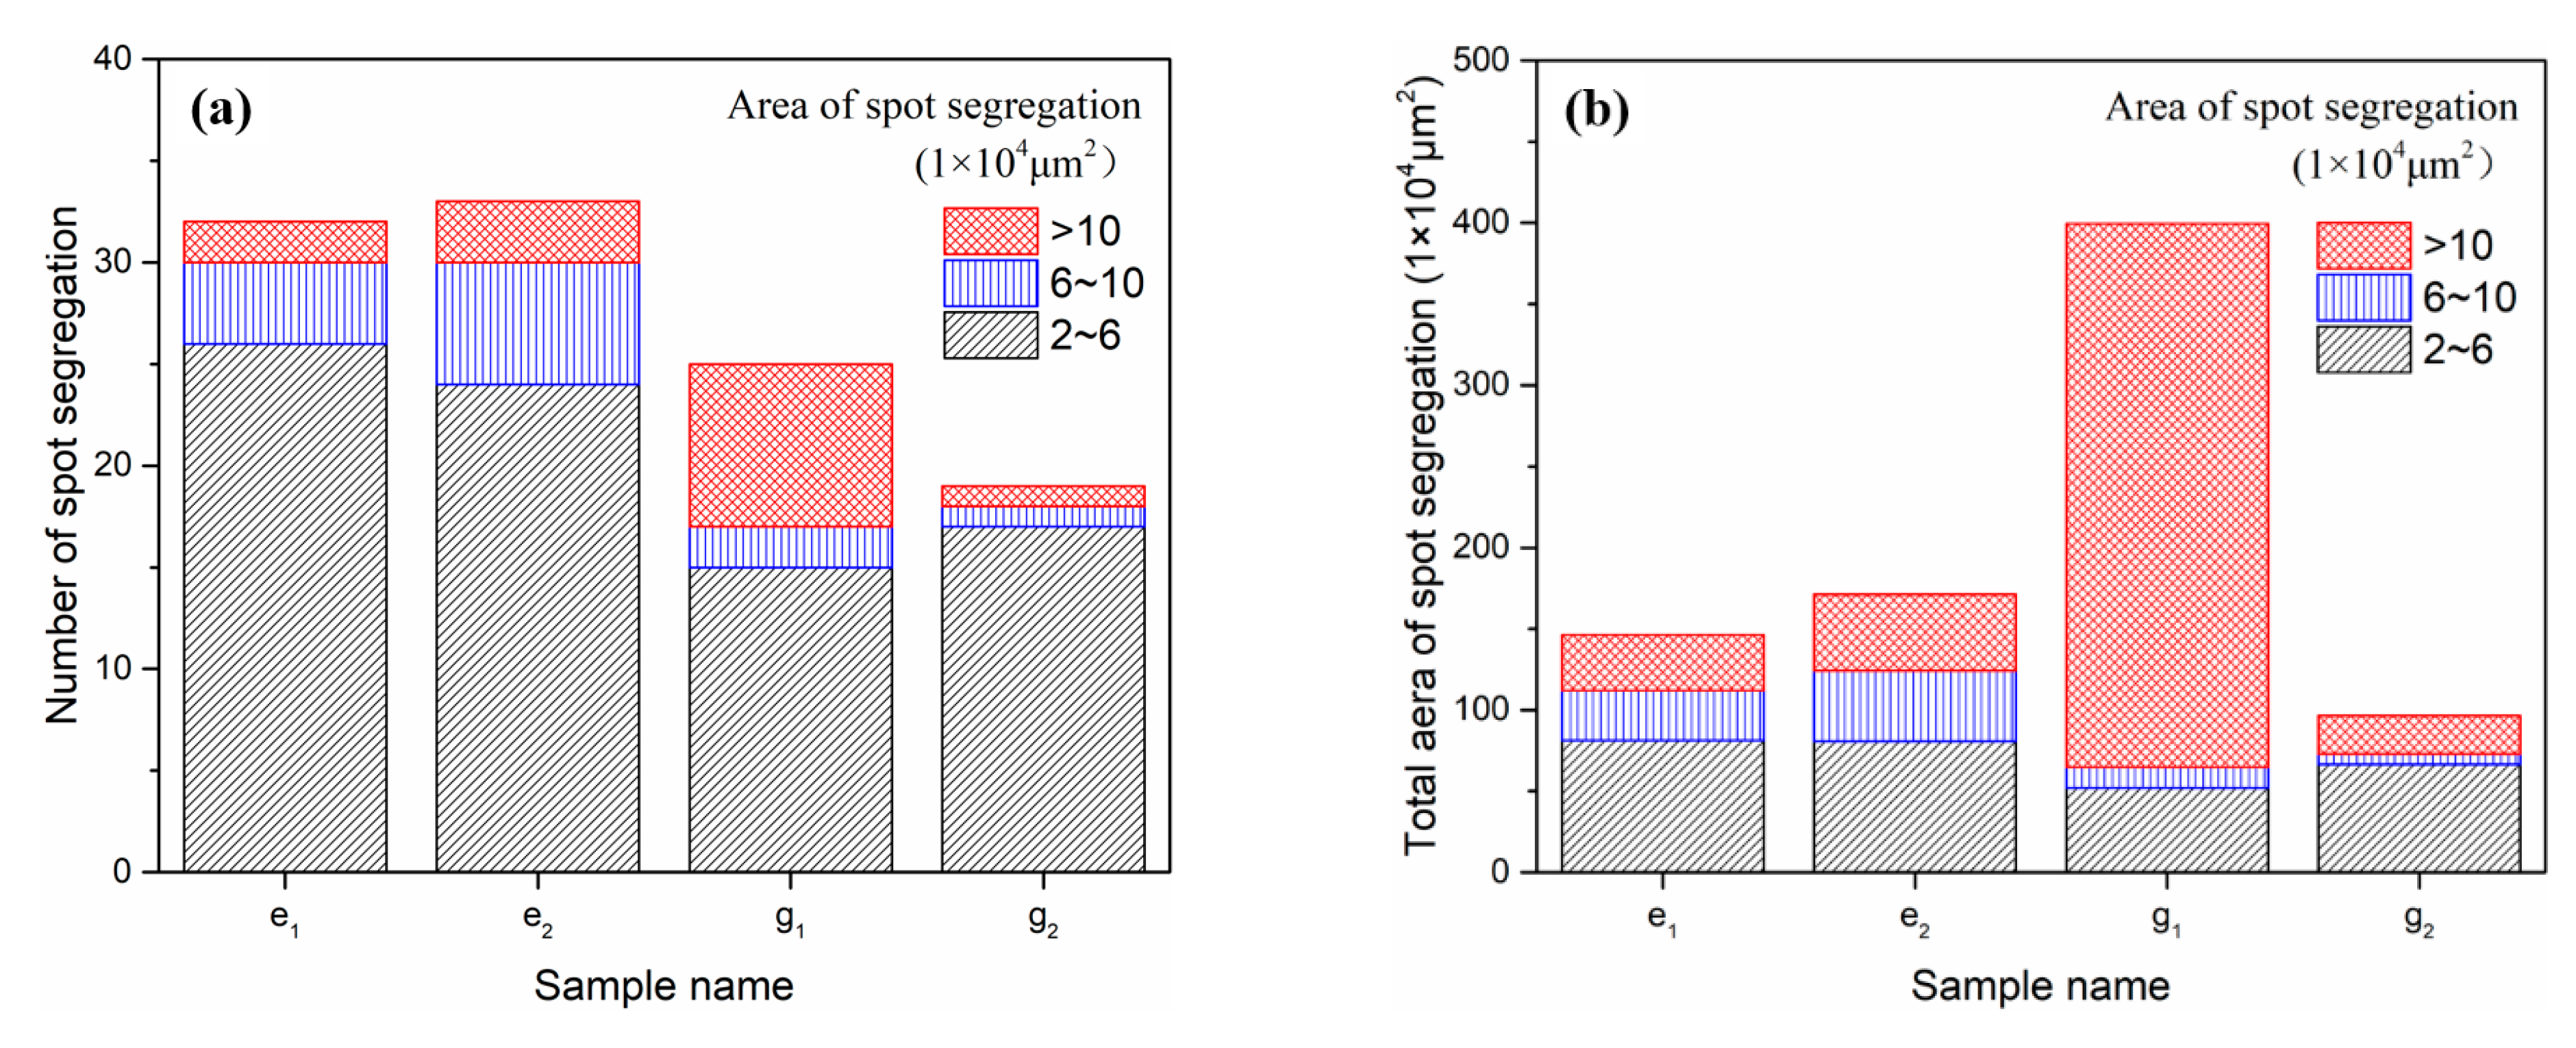
4.2.2. Spot Segregation

To observe the dendritic structure and spot segregation of the round bloom without and with SR, a total of 14 samples sized 14 mm × 10 mm were cut from the two round blooms along the vertical direction (reduction direction), as shown in Figure 13h2. After mechanically polishing the samples, they were etched with saturated picric acid at 70 °C for about 1 min, and then were observed by an optical microscope. As shown in Figure 13g1,g2, the spot segregation could be divided into two types, speckle type and porosity type [31]. The distributions of spot segregation of the samples (e1), (g1), (e2) and (g2) are shown in Figure 14. In the statistical process of spot segregation area, only the solute-rich interdendritic zone was measured. Compared with the (g1), the number the spot segregation in (g2) is greatly reduced after reduction. Especially for the large size spot, it decreases from 8 to 1. Moreover, the total area of spot segregation in (g2) is also decreased significantly, form 4.0 × 106 μm2 to 9.7 × 105 μm2. It reveals the soft reduction process helps to improve the spot segregation in sample (g2). However, this improvement does not appear in the sample (e2), where the number and size of spot segregation almost unchanged after reduction. Obviously, this is related to the solidification state of the sample when it is under the reduction process.
When the soft reduction is implemented at the No.1 unit, only the sample (g2) of the round bloom is still not yet completely solidified, and some molten steel remains. During the soft reduction process, the sample (g2) is squeezed under the mechanical force, thereby suppressing the suction of solute-enriched residual liquid steel caused by solidification shrinkage and reducing the occurrence of spot segregation. However, for other solidified samples, the spot segregation formed before reduction has not been greatly improved, as shown in Figure 13e1,e2. It indicates that the soft reduction before solidification is sure to reduce the spot segregation in the round bloom, but the reduction parameter needs further research to achieve the best improvement effect.

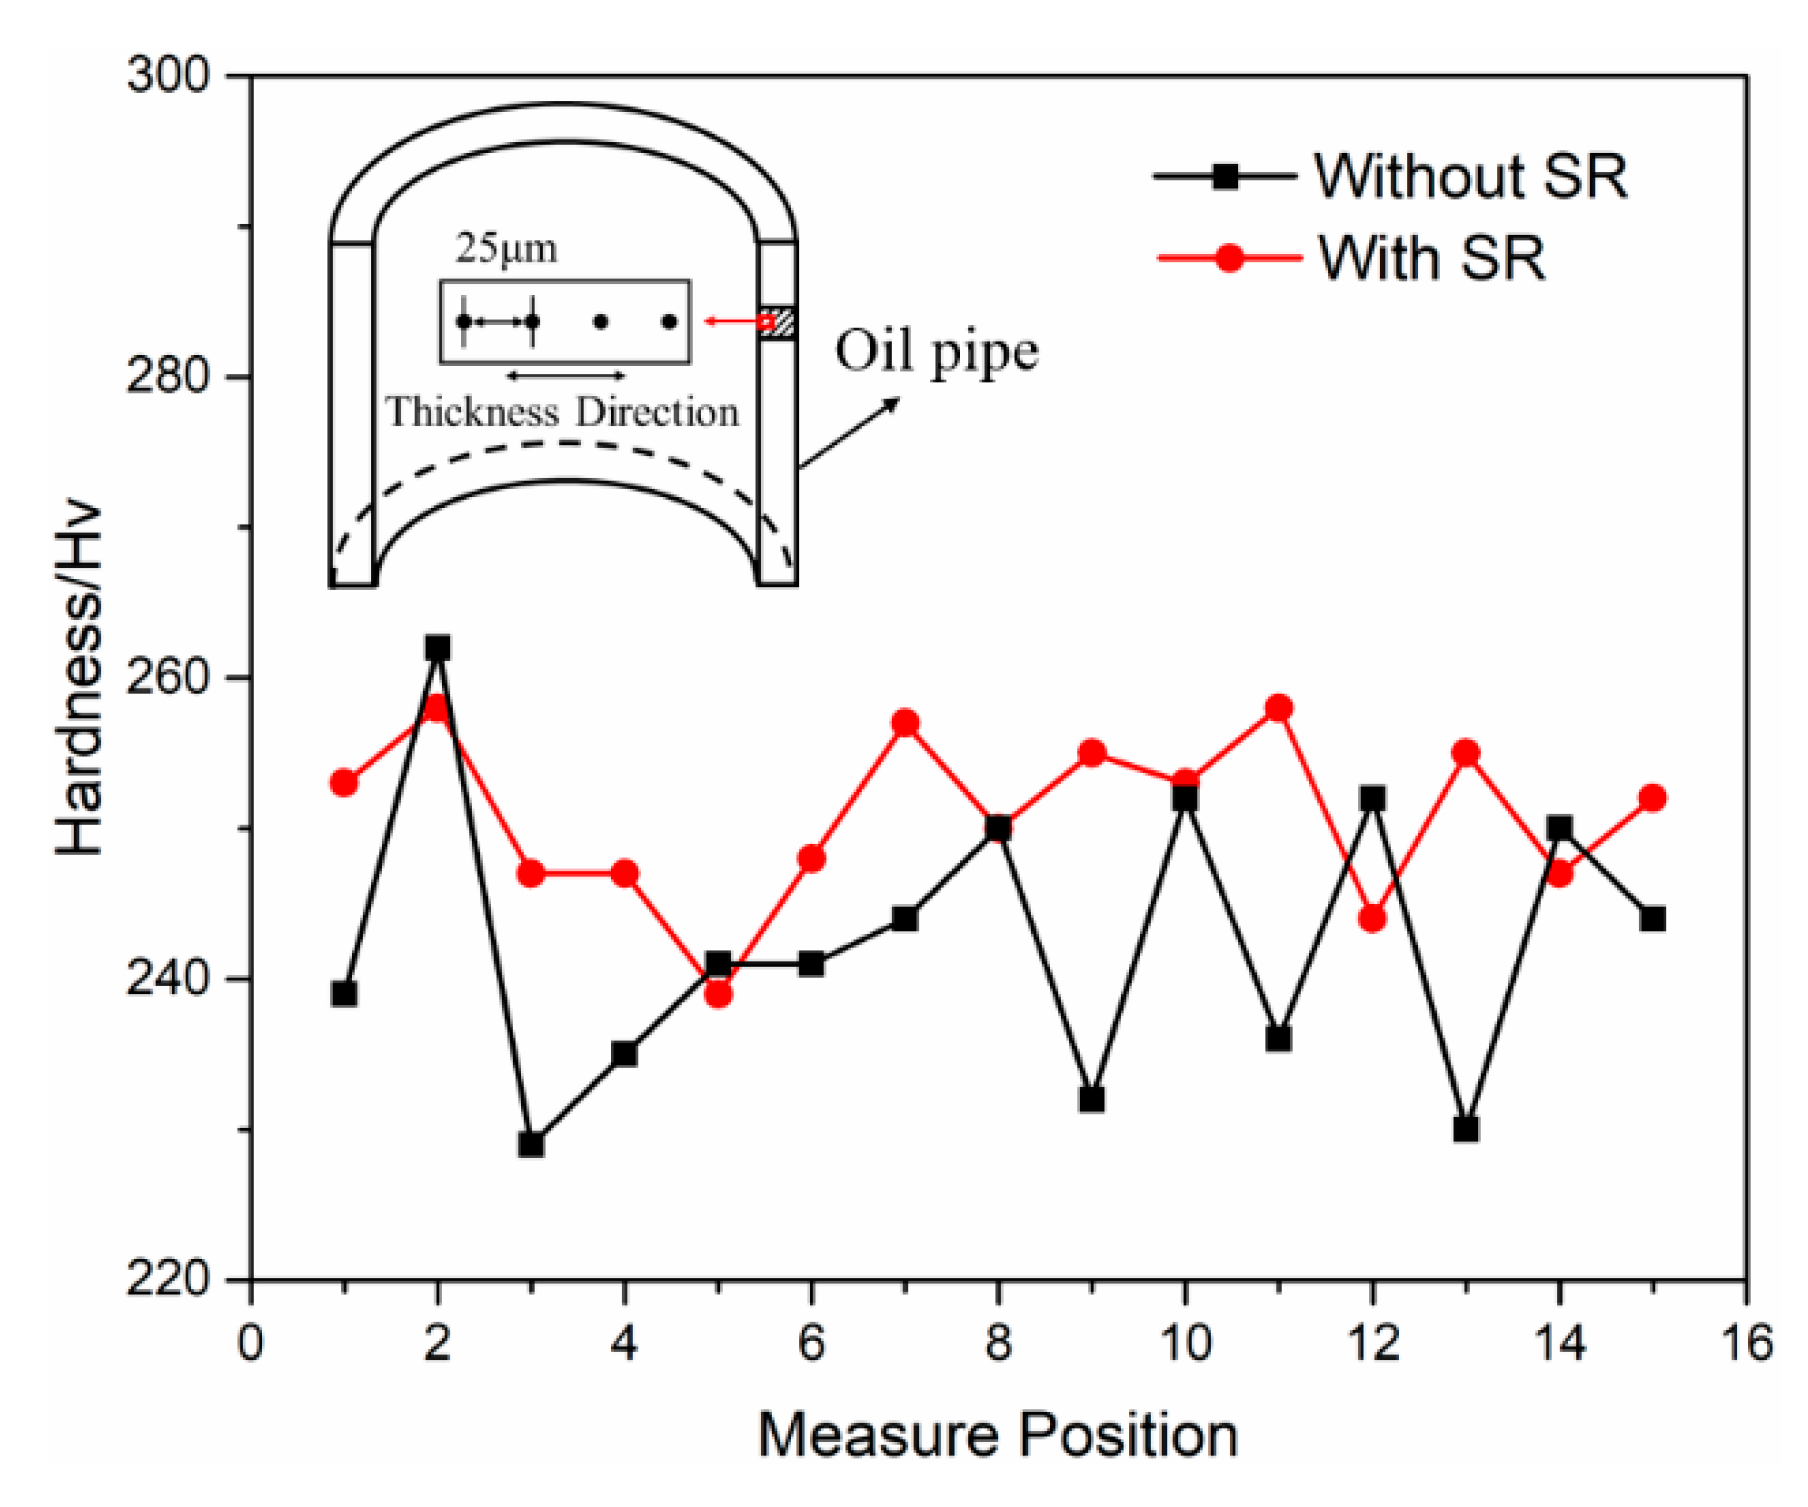
4.3. Oil Pipe Product

Figure 15 shows the sampling positions of oil pipe produced by the round blooms without and with SR. The hardness of the inner wall of the oil pipe is measured in the direction of thickness at an interval of 25μm. A total of 15 points is measured and the results are presented in Figure 15. The average hardness value of with SR process is greater than that without SR process. Furthermore, the fluctuation of the hardness value of the inner wall is improved remarkably by the application of SR. Obviously, this is related to the elimination of porosity and spot segregation defects in the center of the round bloom with the SR process.
The susceptibility of oil pipe to sulfide stress corrosion (SSC) was evaluated using the double cantilever beam (DCB) method provided by the NACE TM0177 standard [32]. After the test, the critical stress intensity factor, KISSC, is obtained, as shown in Table 2. In the standard, the high KISSC value of steel means its excellent resistance to SSC. With the application of soft reduction process, the average value of KISSC increases from 31.17 MPa·m0.5 to 34.56 MPa·m0.5. It indicates that applying multi-unit soft reduction on the round bloom can significantly improve the resistance to SSC of its final product oil pipe.

5. Conclusions

Effect of soft reduction on the shrinkage porosity and spot segregation in continuous casting round bloom was investigated by a two dimensional thermal-mechanical model and a multi-unit soft reduction experiment. The main conclusions are summarized as follows:
  • The reduction amount of round bloom at the front unit is much larger than the back unit under same reduction force. When reduction force increases from 40 KN to 120 KN, the reduction amount increases from 0.16 mm to 6.44 mm at No.1 withdrawal unit, while it only increases from 0.10 mm to 2.35 mm at No.5 unit in the present study.
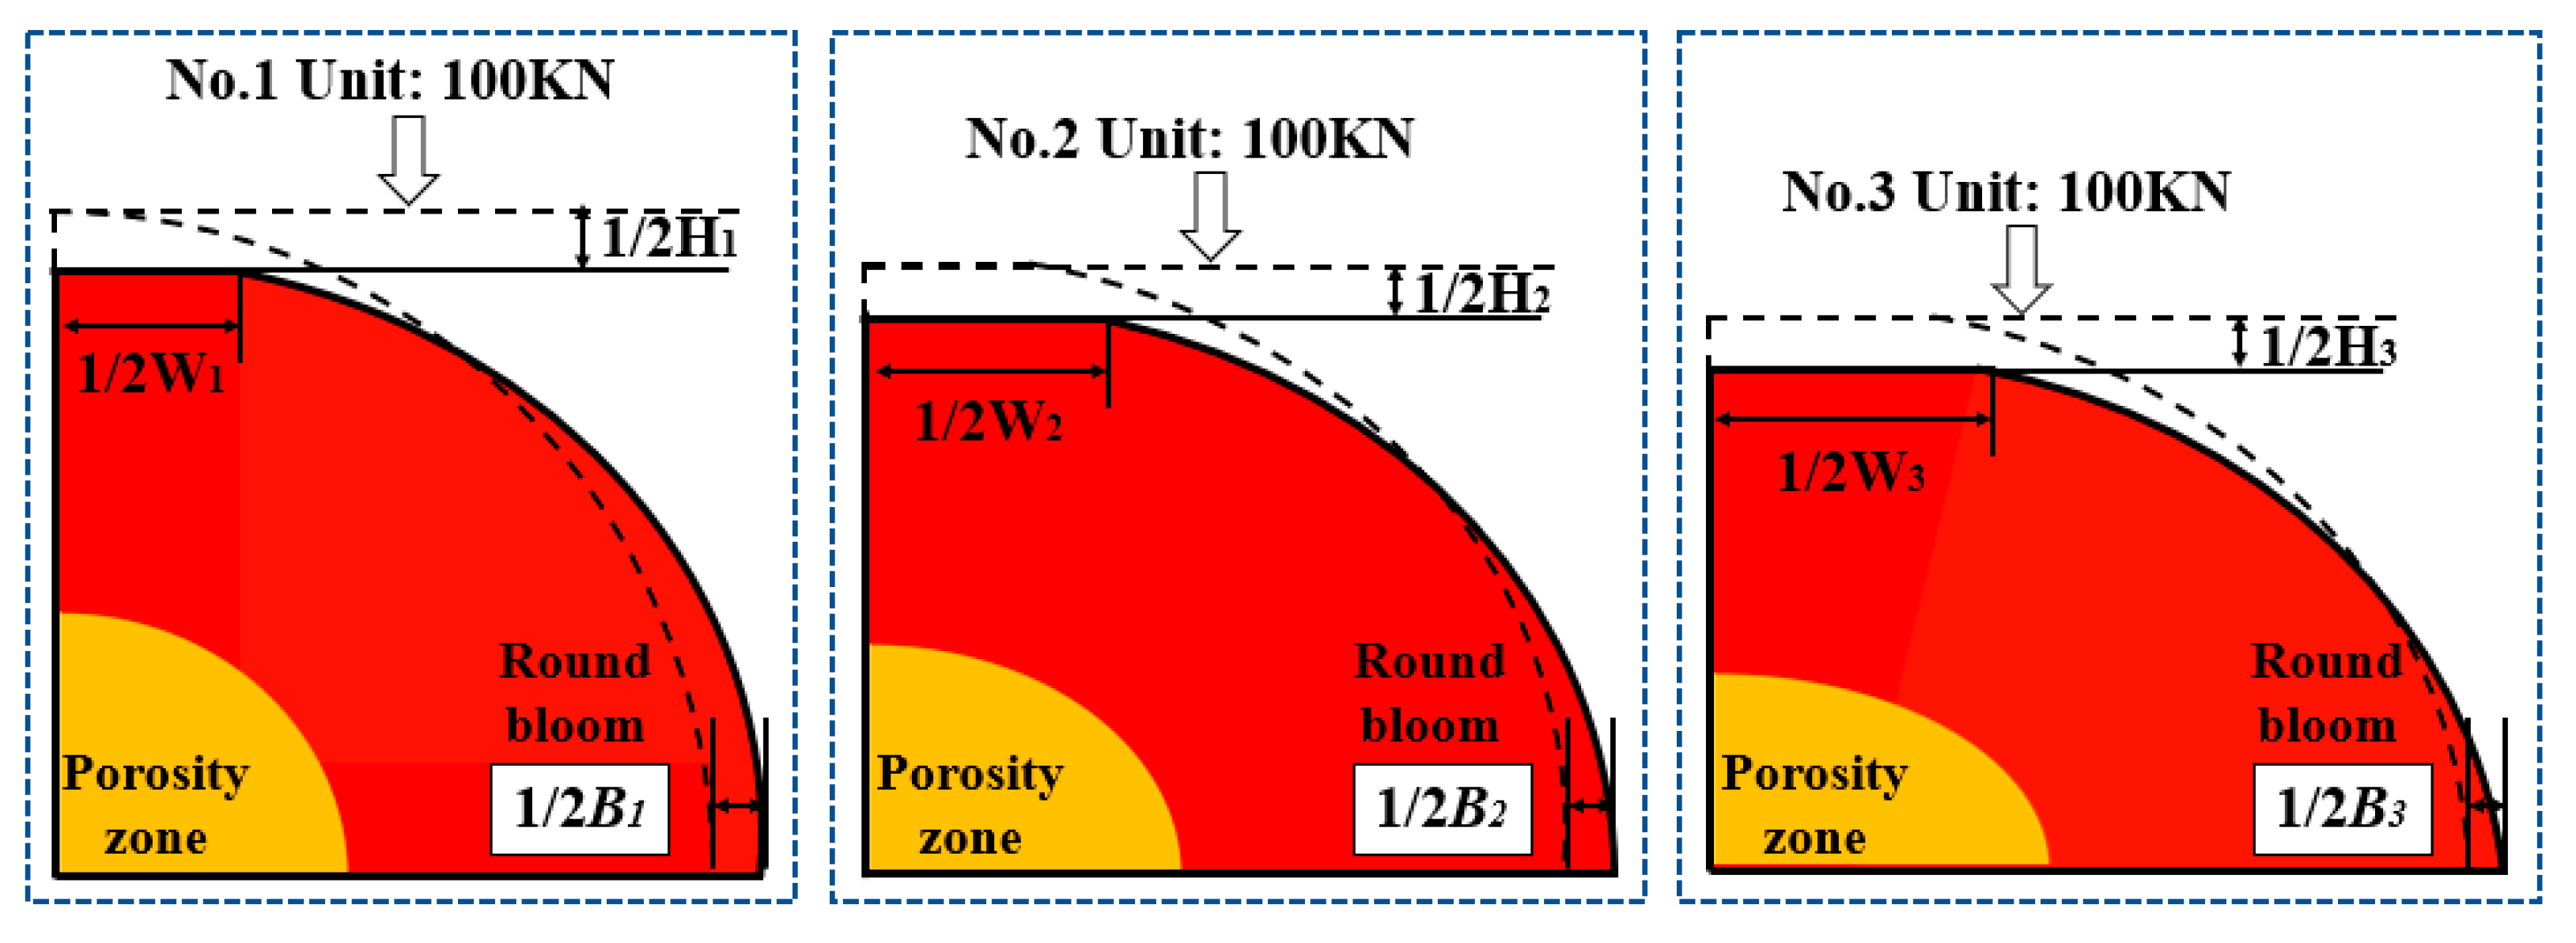
  • The deformation penetration at No.1 unit is much stronger than other units due to its higher temperature and lower center solid fraction. It suggests a high efficiency reduction should be executed by the forward units with a center solid fraction above 0.3 in the round bloom continuous casting.
  • Unlike rectangular products, the deformation of the round bloom will be affected by the previous reduction process during the multi-unit SR. The reduction parameter in the first reduction unit is the most critical, and plays a dominant role in compensating for the shrinkage porosity and controlling the ovality of round bloom.
  • The multi-unit soft reduction carried out by No.1 to No.3 withdrawal units with 100 KN can almost closure the shrinkage cavity in the center of the Ø195 mm round bloom. Furthermore, the number and size of spot segregation are significantly reduced after the reduction process.
  • The multi-unit soft reduction on the continuously cast round bloom can greatly improve the SSC resistance of the product oil pipe. With the application of the reduction process, the KISSC value of oil pipe steel could increase from 31.17 MPa·m0.5 to 34.56 MPa·m0.5.

Author Contributions

Conceptualization, L.L. and J.Z.; methodology, L.L. and P.L.; software, L.L.; validation, B.L., M.L. and Z.Z.; formal analysis, L.L. and P.L.; investigation, B.L.; resources, Z.Z. and M.L.; data curation, B.L.; writing—original draft preparation, L.L.; writing—review and editing, L.L. and J.Z. All authors have read and agreed to the published version of the manuscript.

Funding

This research is financially supported by Fundamental Research Funds for the Central University FRF-TP-19-017A3 and National Natural Science Foundation of China U1860111.

Institutional Review Board Statement

Not applicable.

Informed Consent Statement

Not applicable.

Data Availability Statement

The data presented in this study are available on request from the corresponding author. The data are not publicly available due to privacy.

Acknowledgments

Special thanks to Baoshan Iron & Steel Co., Ltd. for industrial trials and application.

Conflicts of Interest

The authors declare no conflict of interest.

References

  1. Zhang, Z.H.; Liu, M.; Liu, Y.H. A systematical analysis with respect to multiple hydrogen traps influencing sulfide stress cracking behavior of API-5CT-C110 casing steel. Mater. Sci. Eng. A 2018, 721, 81–88. [Google Scholar] [CrossRef]
  2. Li, B.; Luo, M.; Yang, Z.B. Microstructure evolution of the semi-macro segregation induced banded structure in high strength oil tubes during quenching and tempering treatments. Materials 2019, 12, 3310. [Google Scholar] [CrossRef] [PubMed] [Green Version]
  3. Ji, Y.; Lan, P.; Geng, H. Behavior of spot segregation in continuously cast blooms and the resulting segregated band in oil pipe steels. Steel Res. Int. 2018, 89, 1700331. [Google Scholar] [CrossRef]
  4. Xu, Z.G.; Wang, X.H.; Jiang, M. Investigation on improvement of center porosity with heavy reduction in continuously cast thick slabs. Steel Res. Int. 2017, 88, 1600061. [Google Scholar] [CrossRef]
  5. Luo, S.; Zhu, M.Y.; Ji, C. Characteristics of solute segregation in continuous casting bloom with dynamic soft reduction and determination of soft reduction zone. Ironmak. Steelmak. 2010, 37, 140–146. [Google Scholar] [CrossRef]
  6. Wu, C.; Ji, C.; Zhu, M.Y. Deformation behavior of internal porosity in continuous casting wide-thick slab during heavy reduction. Metals 2019, 9, 128. [Google Scholar] [CrossRef] [Green Version]
  7. Thome, R.; Harste, K. Principles of billet soft-reduction and consequences for continuous casting. ISIJ Int. 2006, 46, 1839–1844. [Google Scholar] [CrossRef] [Green Version]
  8. Rogberg, B.; Ek, L. Influence of soft reduction on the fluid flow, porosity and center segregation in CC high carbon and stainless steel blooms. ISIJ Int. 2008, 58, 478–487. [Google Scholar] [CrossRef] [Green Version]
  9. Li, L.; Zhao, X.; Tie, Z.P. Improvement of center segregation in continuous cast blooms by convex roll soft reduction. Suppl. Proc. TMS 2019, 51–61. [Google Scholar] [CrossRef]
  10. Lan, P.; Tie, Z.P.; Zhang, W. Research progress on spot segregation defects in continuously cast semi-products. Iron Steel 2019, 55, 11–12. [Google Scholar]
  11. Kojima, S.; Mizota, H.; Kushida, K. Concept of continuous forging process and experimental analysis of forged blooms. Kawasaki Steel Giho 1994, 26, 1–6. [Google Scholar]
  12. Nabeshima, S.; Nakato, H.; Fujii, T. Controlling of centerline segregation of continuously cast bloom by continuous forging process. ISIJ Int. 1995, 35, 673–679. [Google Scholar] [CrossRef] [Green Version]
  13. Sugimaru, S.; Nakashima, J.; Miyazawa, K. Theoretical analysis of the suppression of solidification shrinkage flow in continuously cast steel blooms. Mater. Sci. Eng. A 1993, 173, 305–308. [Google Scholar] [CrossRef]
  14. Rauter, W.; Reiter, J.; Srienc, K. Soft reduction at a round bloom caster: Implementation and results. BHM Berg-und Hüttenmännische Monatshefte 2014, 159, 454–460. [Google Scholar] [CrossRef]
  15. Winner, F.; Pennerstorfer, P.; Thone, H. Operation results of vertical casting of heavy round blooms at Zhong yuan special steel. In Proceedings of the European Continuous Casting Conference, Vienna, Austria, 26–29 June 2017; pp. 227–236. [Google Scholar]
  16. Fan, H.; Long, M.J.; Yu, S. Uniform secondary cooling pattern for minimizing surface reheating of the strand during round bloom continuous casting. JOM 2018, 70, 237–242. [Google Scholar] [CrossRef]
  17. Li, Y.J.; Li, H.; Lan, P. Thermo-elasto-visco-plastic finite element analysis on formation and propagation of off-corner subsurface cracks in bloom continuous casting. J. Iron Steel Res. Int. 2017, 11, 1159–1168. [Google Scholar] [CrossRef]
  18. Brimacombe, J.K.; Samarasekera, I.V.; Mahapatra, R.B. Basic knowledge and the achievement of quality in continuous casting. Sixth IISC 1990, 3, 246–255. [Google Scholar]
  19. Li, C.; Thomas, B.G. Thermomechanical finite-element model of shell behavior in continuous casting of steel. Metall. Mater. Trans. B 2004, 35, 1151–1172. [Google Scholar] [CrossRef]
  20. Wray, P.J. Plastic deformation of delta-ferritic iron at intermediate strain rates. Metall. Mater. Trans. A 1976, 7, 1621–1627. [Google Scholar] [CrossRef]
  21. Zhu, H. Coupled Thermal-Mechanical Finite-Element Model with Application to Initial Solidification. Ph.D. Thesis, University of Illinois at Urbana Champaign, Champaign County, IL, USA, 1993. [Google Scholar]
  22. Wray, P.J. Effect of carbon content on the plastic flow of plain carbon steel at elevated temperatures. Metall. Mater. Trans. A 1982, 13, 125–134. [Google Scholar] [CrossRef]
  23. Suzuki, T.; Take, K.H.; Wunnenberg, K. Creep properties of steel at continuous casting temperatures. Ironmak. Steelmak. 1988, 15, 90–100. [Google Scholar]
  24. Ueshima, Y.; Mizoguchi, S.; Matsumiya, T. Analysis of solute distribution in dendrites of carbon steel with δ/γ transformation during solidification. Metall. Mater. Trans. B 1986, 4, 845–859. [Google Scholar] [CrossRef]
  25. Crank, J. Free and Moving Boundary Problems; Clarendon Press: Oxford, UK, 1984. [Google Scholar]
  26. Zappulla, M.S.; Hibbeler, L.C.; Thomas, B.G. Effect of Grade on Thermal–Mechanical Behavior of Steel during Initial Solidification. Metall. Mater. Trans. B 2017, 8, 3777–3793. [Google Scholar] [CrossRef]
  27. Harste, K. Investigation of the Shrinkage and the Origin of Mechanical Tension during the Solidification and Successive Cooling of Cylindrical Bara of Fe-C Alloys. Ph.D. Thesis, Technical University of Clausthal, Clausthal-Zellerfeld, Germany, 1989. [Google Scholar]
  28. Mizukami, H.; Murakami, K.; Miyashita, Y. Mechanical properties of continuously cast steel at high temperatures. Tetsu-to-Hagane 1977, 146, S652. [Google Scholar]
  29. Uehara, M.; Samarasekera, I.V.; Brimacombe, J.K. Mathematical modeling of unbending of continuously cast steel slabs. Ironmak. Steelmak. 1986, 13, 138–153. [Google Scholar]
  30. Takahashi, T.; Ohsasa, K.; Katayama, N. Simulation for progress of solid-liquid coexisting zone in continuous casting of carbon steels. Tetsu-to-Hagane 1990, 76, 728–734. [Google Scholar] [CrossRef]
  31. Li, B.; Zhang, Z.H.; Liu, H.S. Characteristics and evolution of the spot segregations and banded defects in high strength corrosion resistant tube steel. Acta Metall. Sin. 2019, 55, 762–772. [Google Scholar]
  32. NACE Stand. TM0177-2016, Laboratory Testing of Metals for Resistance to Sulfide Stress Cracking and Stress Corrosion Cracking in H2S Environments; NACE International: Houston, TX, USA, 2016. [Google Scholar]
Figure 1. Schematic of continuous casting machine and modeling domain of round bloom.
Metals 11 00009 g001
Figure 2. Phase fraction as a function of temperature for the C110 oil pipe steel.
Metals 11 00009 g002
Figure 3. Comparison between the predicted and measured surface temperature and shell thickness.
Metals 11 00009 g003
Figure 4. Round bloom shape in the simulation and experiment.
Metals 11 00009 g004
Figure 5. (a) Porosity zone in practice, (b) Mushy zone in simulation.
Metals 11 00009 g005
Figure 6. Temperature distribution on longitudinal section of round bloom.
Metals 11 00009 g006
Figure 7. (a) Schematic of round bloom and porosity zone deformation, (b) Round bloom shape after SR.
Metals 11 00009 g007
Figure 8. Deformation of round bloom after reduction (a) reduction amounts, (b) bulge amounts.
Metals 11 00009 g008
Figure 9. Ovality of round bloom after SR (a) different reduction forces, (b) different reduction positions.
Metals 11 00009 g009
Figure 10. Compensation area of porosity zone (a) different reduction amounts, (b) different reduction positions.
Metals 11 00009 g010
Figure 11. Schematic of multi-unit reduction on round bloom in reduction force mode.
Metals 11 00009 g011
Figure 12. Macrographs of round bloom: (a,b) are the transverse and longitudinal sections without SR, (c,d) are the transverse and longitudinal sections with SR.
Metals 11 00009 g012
Figure 13. Dendritic morphologies: (a1h1) are the samples without SR, (a2g2) are the samples with SR, (h2) is sampling scheme.
Metals 11 00009 g013
Figure 14. Distribution of spot segregation (a) number, (b) total area.
Metals 11 00009 g014
Figure 15. Hardness distribution of inner wall of oil pipe.
Metals 11 00009 g015
Table 1. Reduction parameters during soft reduction process.
Withdrawal Unit NumberNo.1No.2No.3Total
Center solid fraction0.511.01.0-
Reduction force-KN100100100-
Reduction amount-mm3.70.90.34.9
Bulge amount-mm1.30.30.11.7
Compensation area of porosity zone-mm212.97.93.224.0
Table 2. KISSC of oil pipes in DCB test.
Soft ReductionKISSC-MPa·m0.5
Test ValueAverage Value
Without31.7831.3030.4431.17
With34.8734.1334.6734.56
Publisher’s Note: MDPI stays neutral with regard to jurisdictional claims in published maps and institutional affiliations.

