Experimental and Numerical Study of the Effects of the Reversal Hot Rolling Conditions on the Recrystallization Behavior of Austenite Model Alloys

 ,
,  , , , , ,
Abstract
:1. Introduction
2. Experimental
2.1. Initial Rolling Trials
2.2. Continuous Cooling Deformation Tests
3. Results
4. Multiscale Computer Simulation of the Rolling Process
5. Conclusions
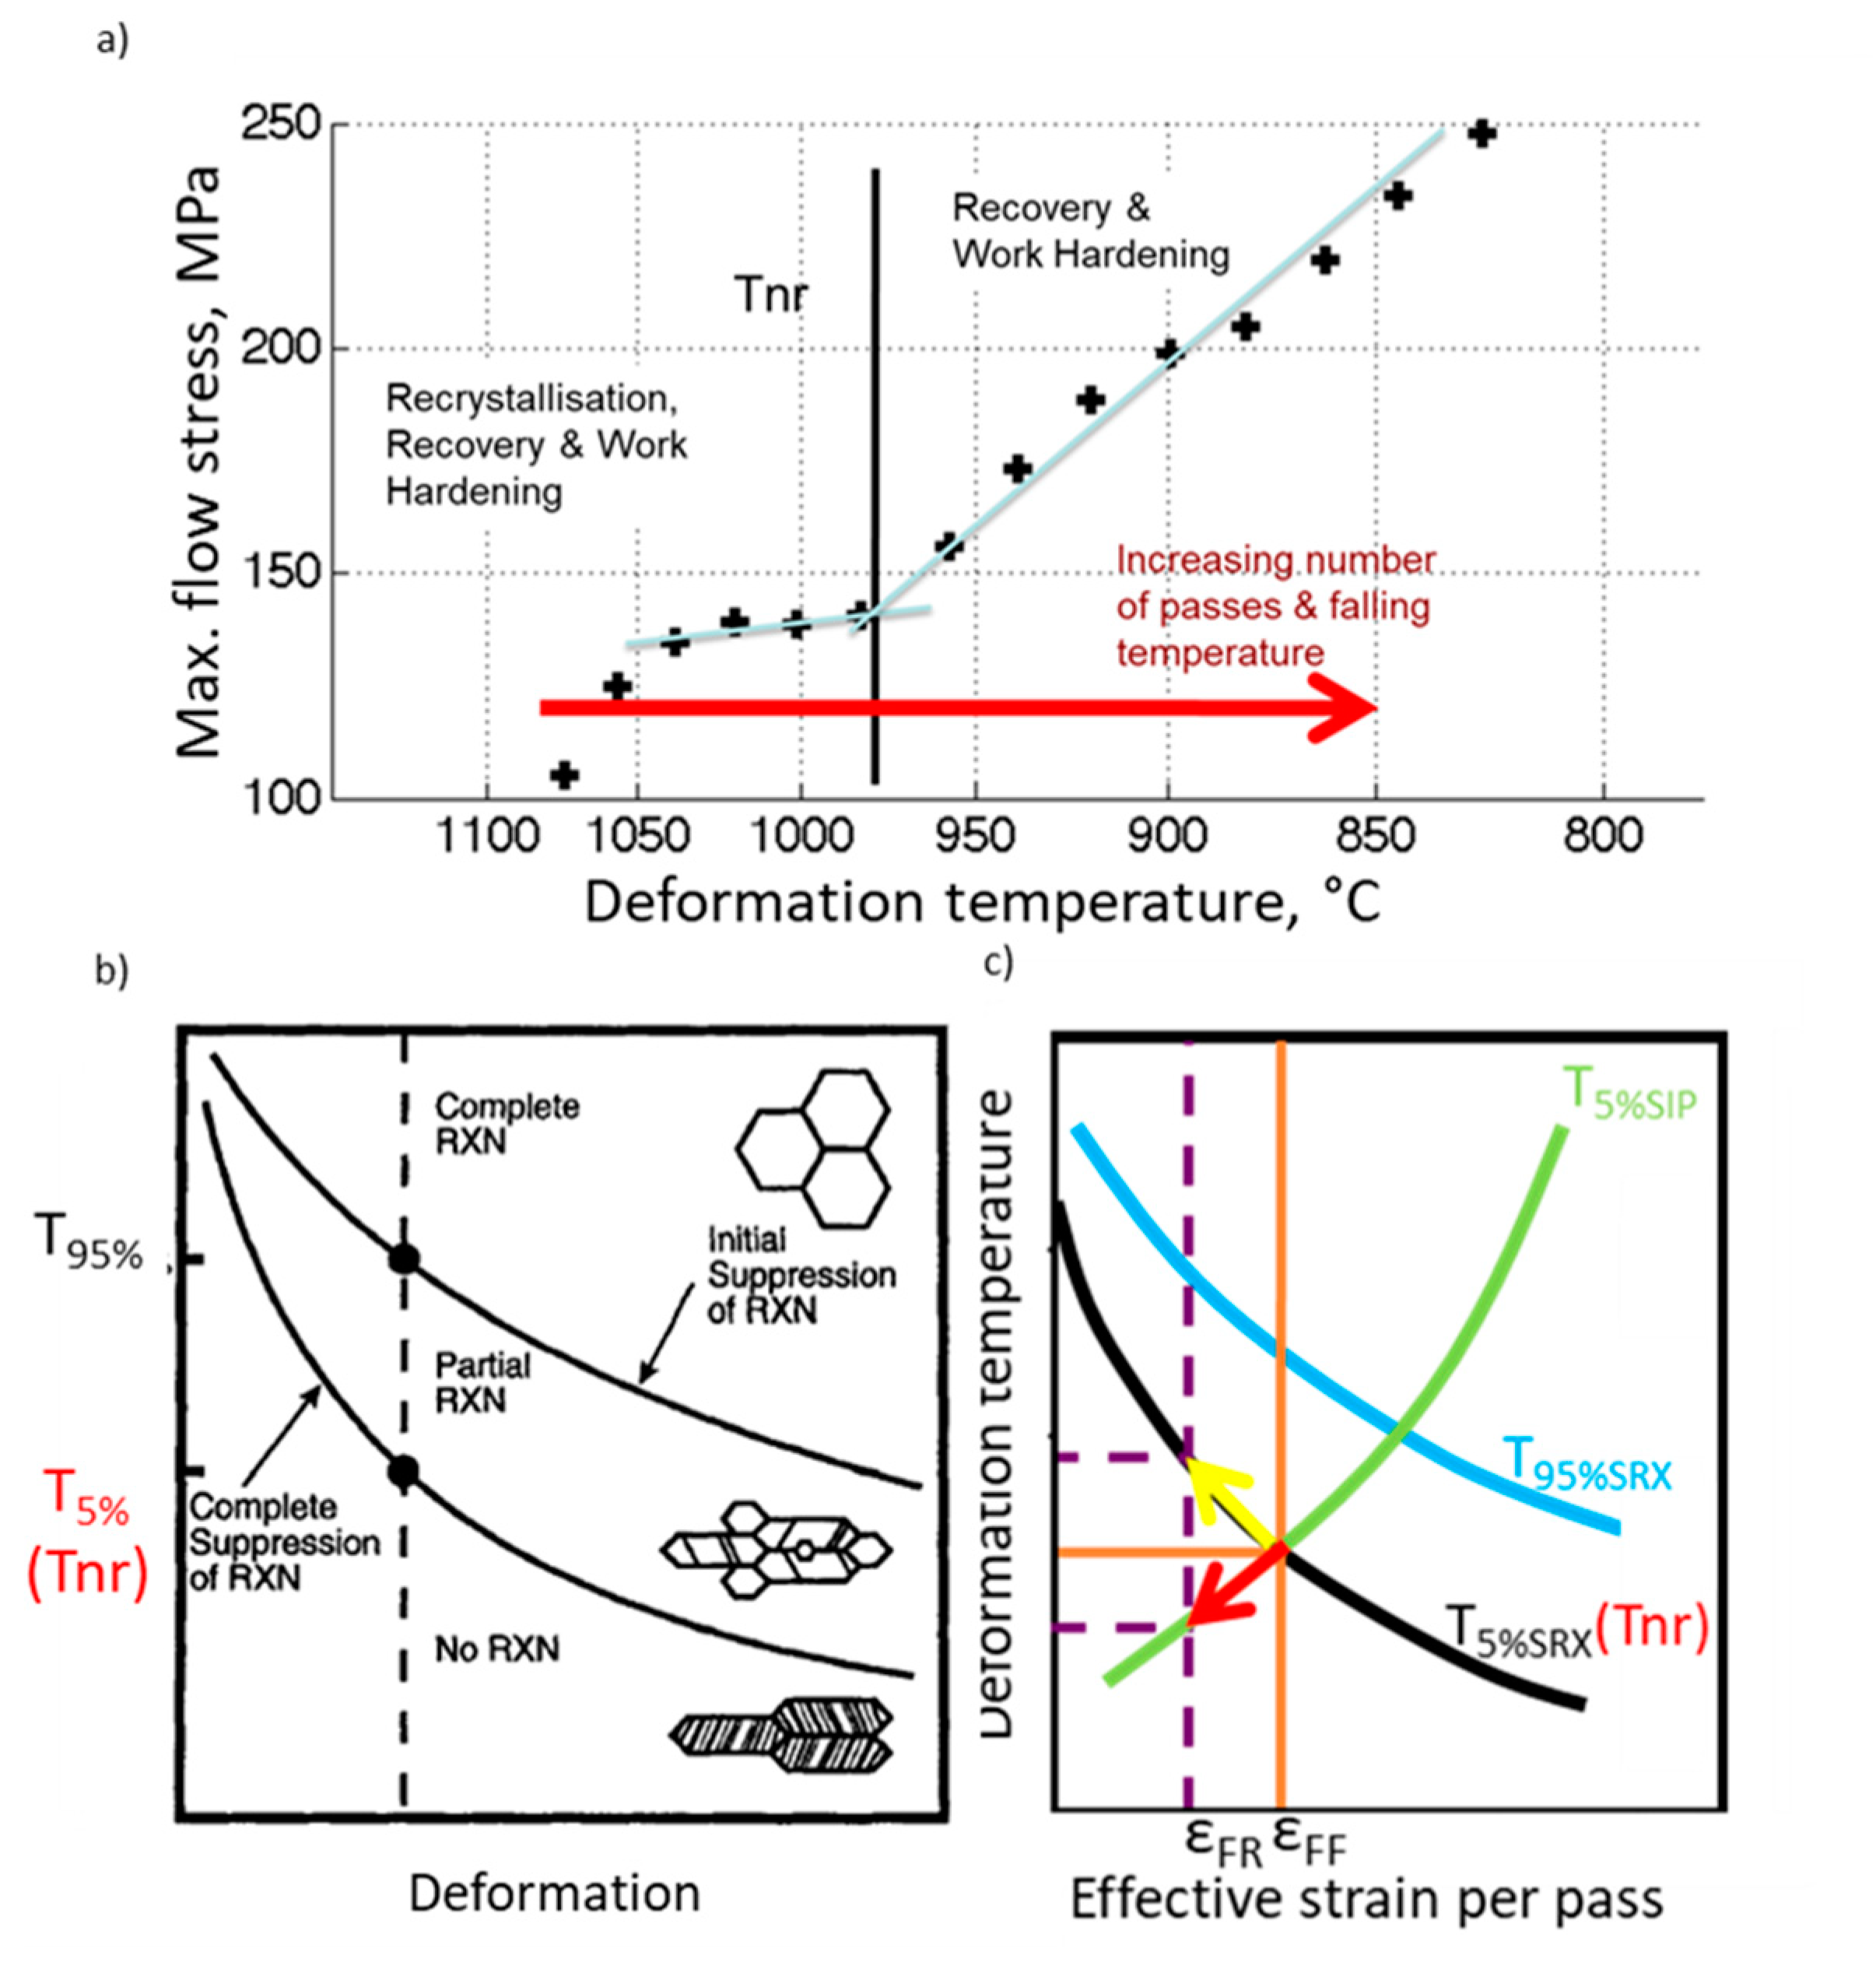
- Continuous cooling deformation tests using forward–forward and forward–reverse torsion allows for precise determination of the effects of the deformation path on the non-recrystallization temperature;
- In the case of non-microalloyed austenite, the influence of the strain path on the Tnr is clearly connected with the amount of deformation energy, and thus the driving force for static recrystallization. The rearrangement of dislocation structures upon full or partial strain reversal leads to lower dislocation density values and possible nucleation sites for recrystallization. As a result, the Tnr increases as the strain reversal increases. Therefore, in the case of non-microalloyed austenite, the deformation temperatures for all rolling passes should be increased (depending on the amount of strain reversal with respect to monotonic deformation) in order to avoid partial recrystallization regimes and to ensure a homogeneously refined austenite microstructure;
- In the case of the Fe30wt%NiNb alloy, the SIP kinetics are affected by strain reversal. This, in turn, leads to more complex interactions between the driving force for the recrystallization process and the pinning pressure for the strain-induced precipitation process. As a result, the Tnr decreases as the strain reversal increases. Therefore, in the case of Nb-microalloyed austenite, rolling temperatures should be lowered proportionally with the increasing strain reversal in order to ensure full deformation in the non-recrystallization regime and austenite pancaking, which leads to a significant increase in nucleation sites for the ferrite phase and a much more refined final microstructure;
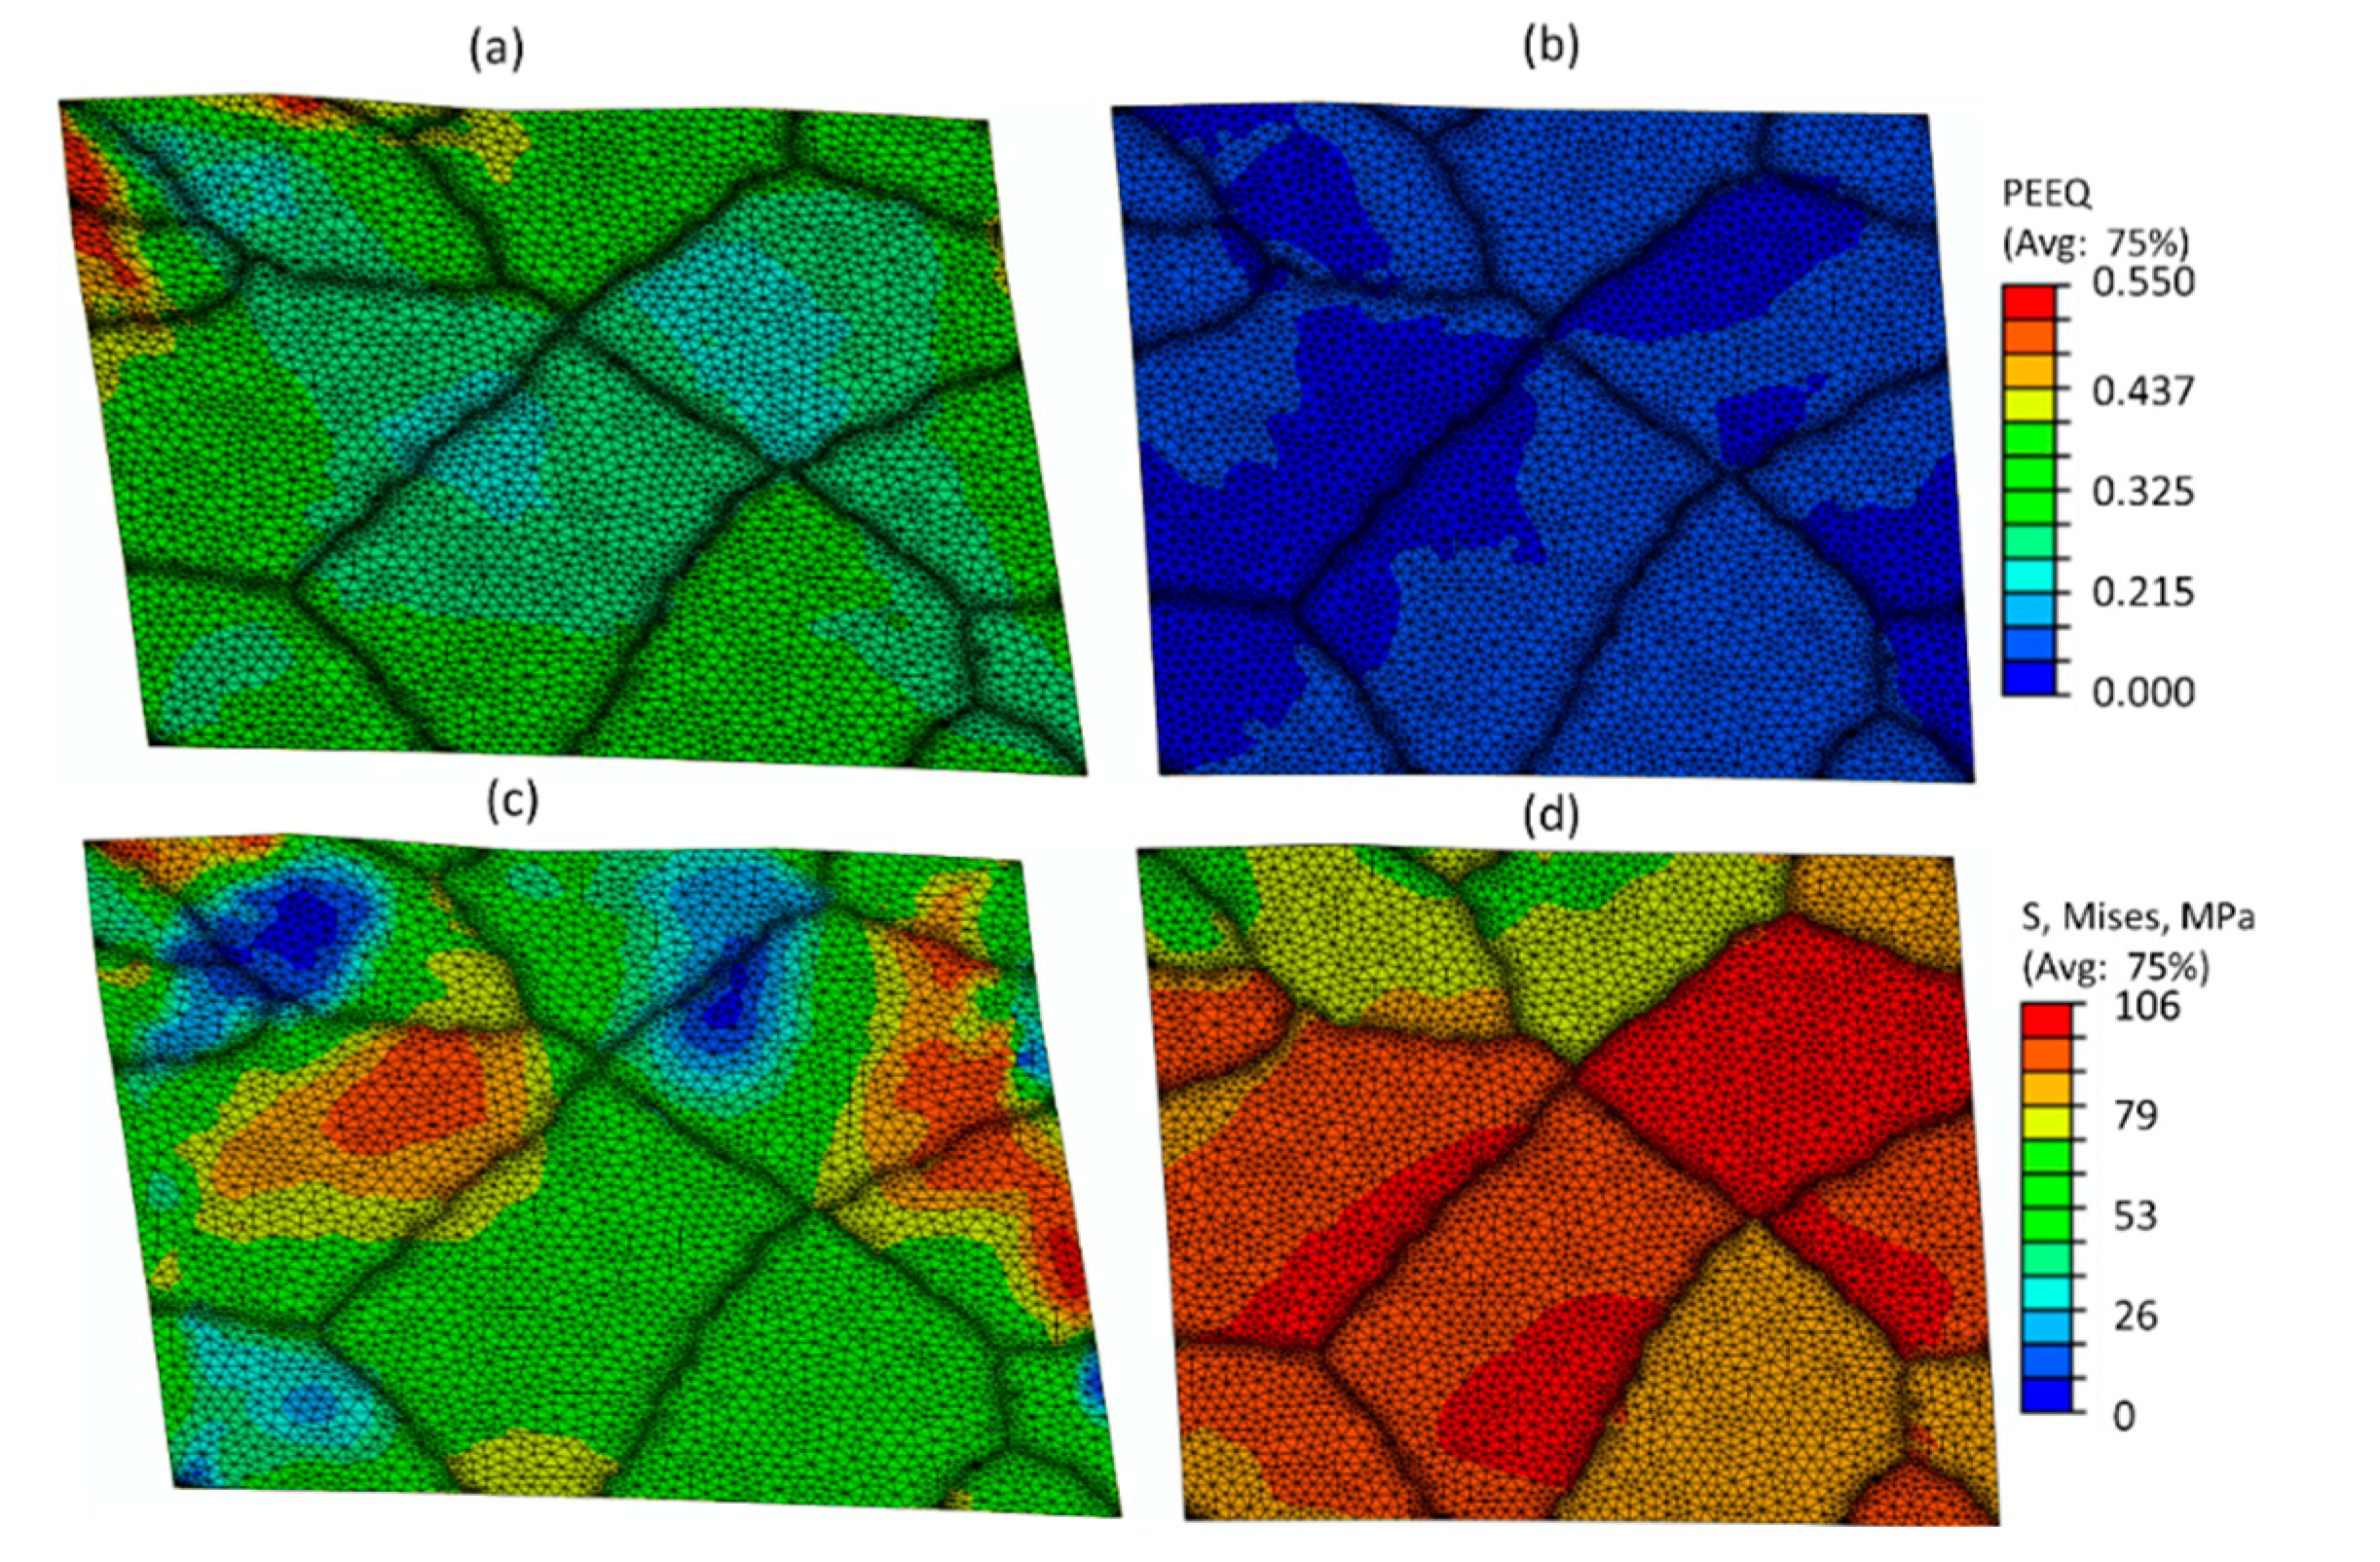
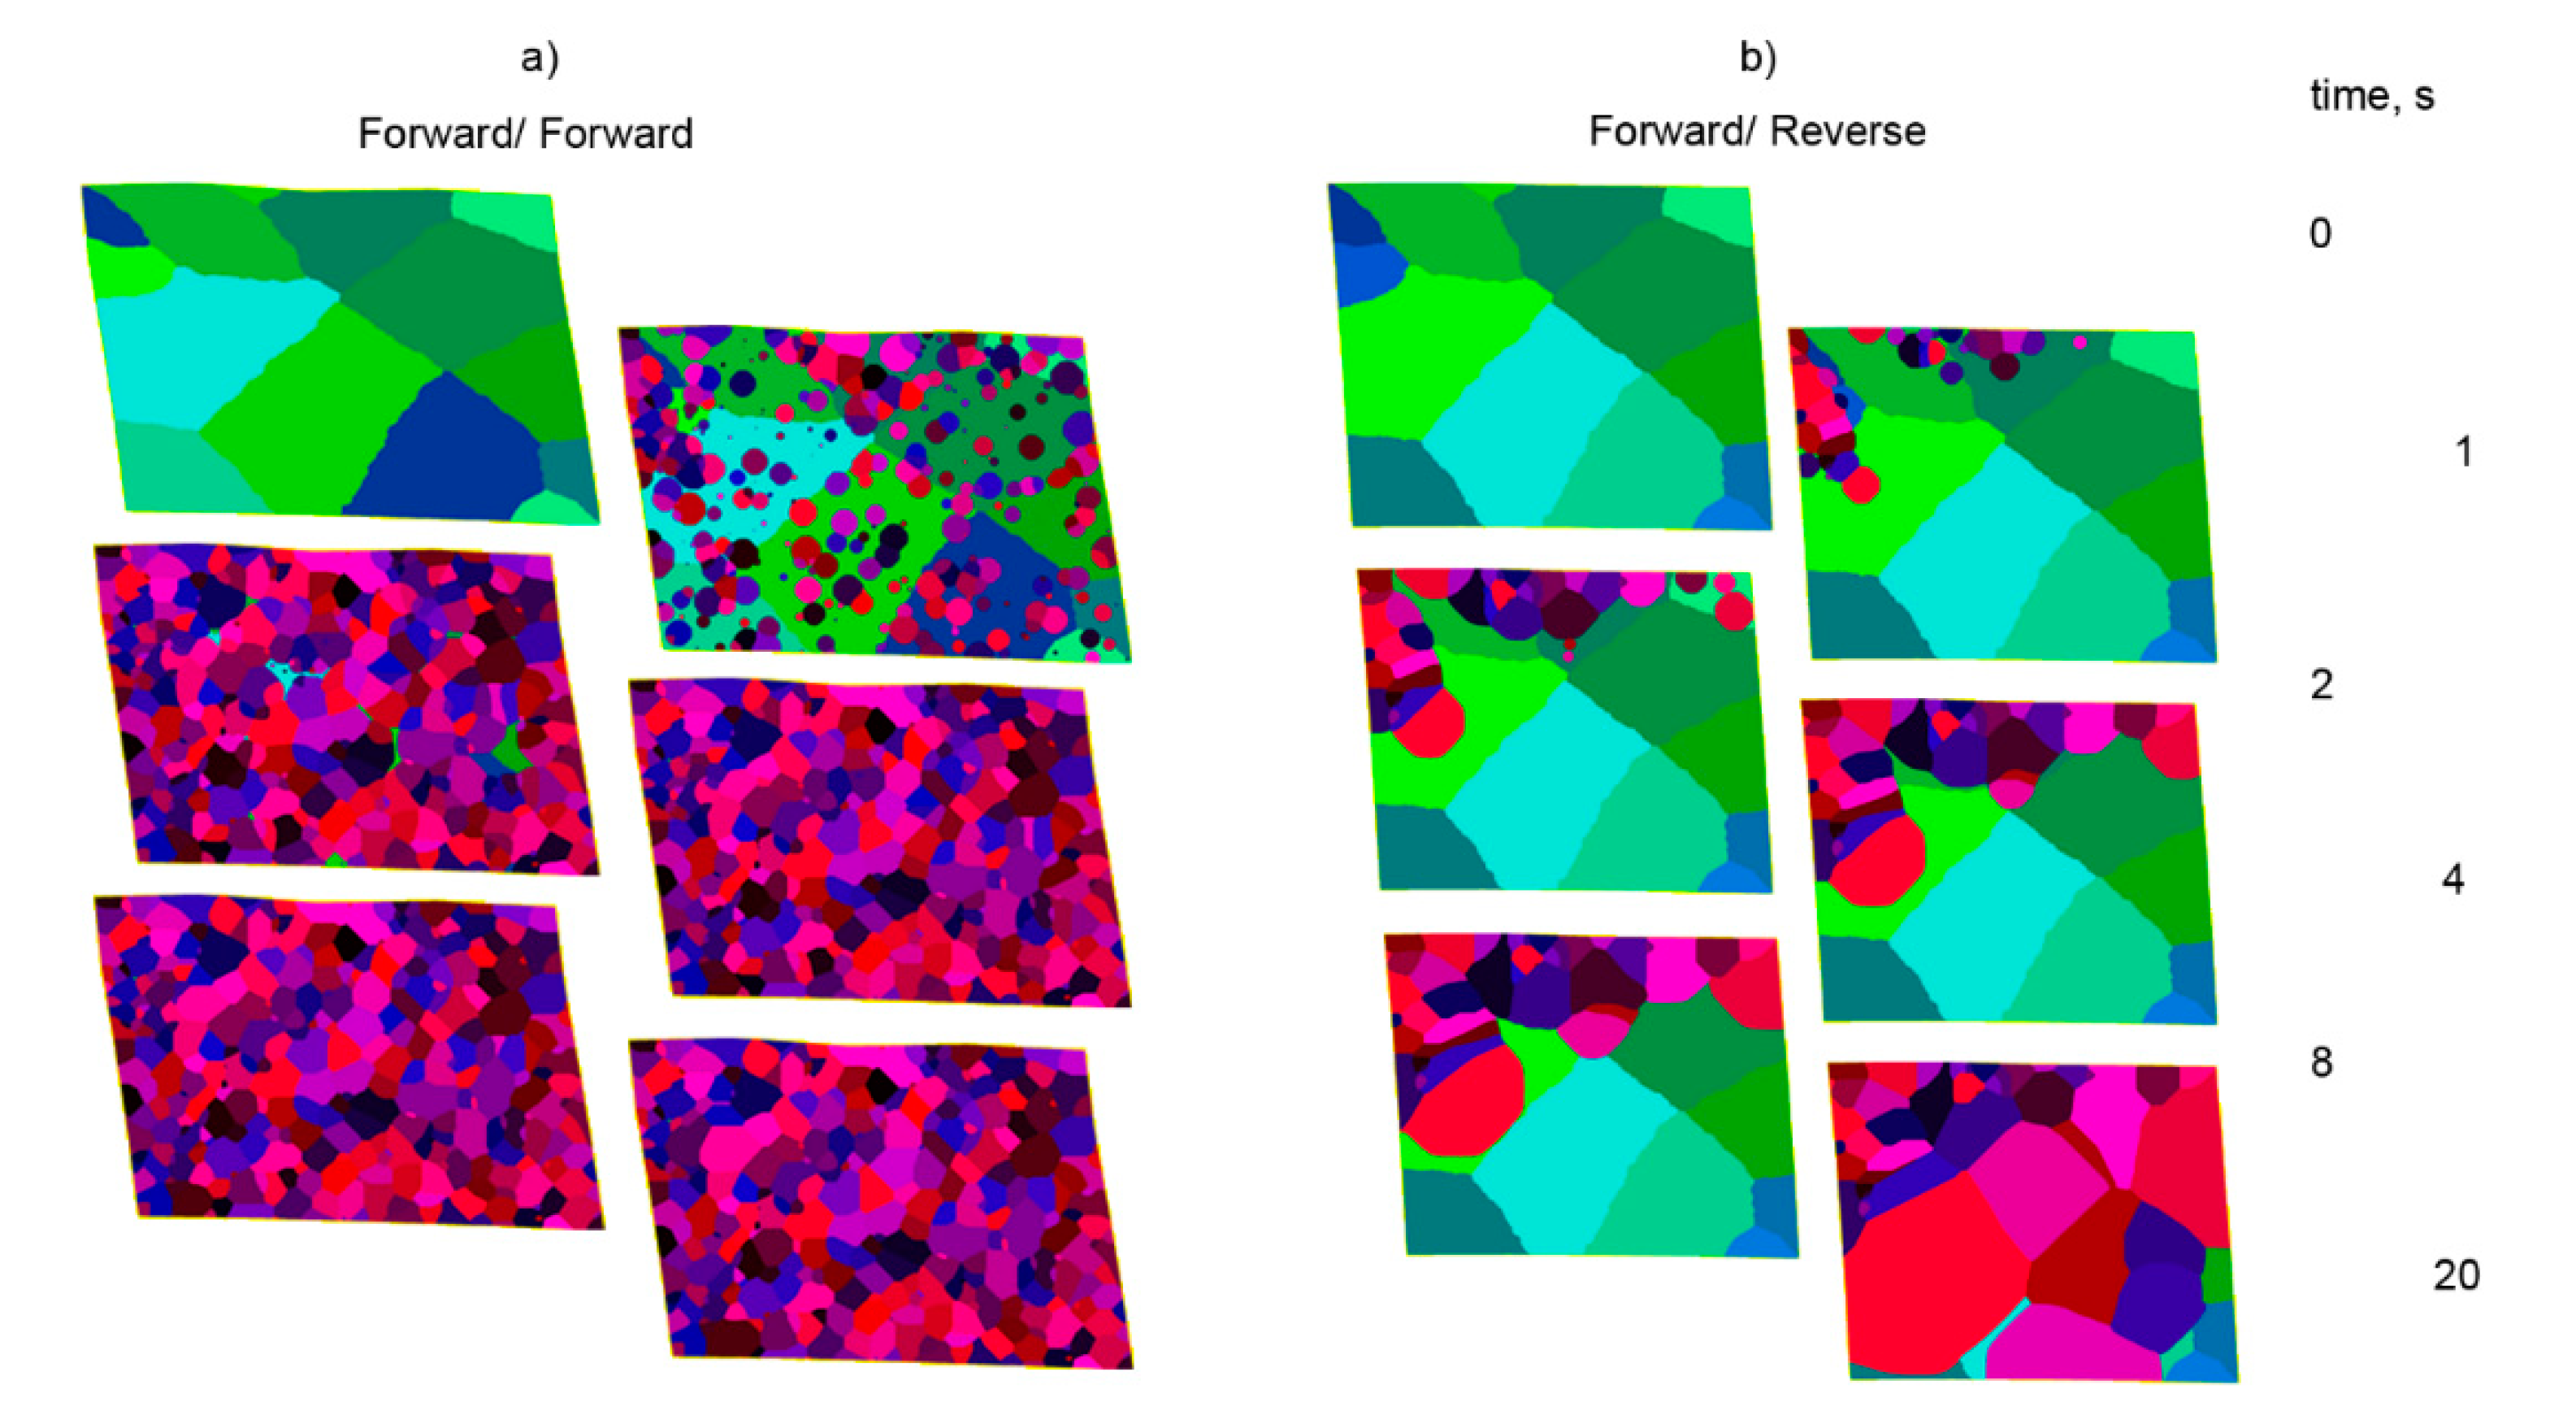
- By using a multiscale modeling approach that takes into account the strain path sensitivity (via a properly selected hardening model), it is possible to predict the static recrystallization progress as a function of the strain path.
Author Contributions
Funding
Institutional Review Board Statement
Informed Consent Statement
Data Availability Statement
Acknowledgments
Conflicts of Interest
References
- Grajcar, A.; Kuziak, R.; Zalecki, W. Third generation of AHSS with increased fraction of retained austenite for the automotive industry. Arch. Civ. Mech. Eng. 2012, 12, 334–341. [Google Scholar] [CrossRef]
- Takahashi, M. Sheet Steel Technology for the Last 100 Years: Progress in Sheet Steels in Hand with the Automotive Industry. ISIJ Int. 2015, 55, 79–88. [Google Scholar] [CrossRef] [Green Version]
- Yuan, G.; Huang, M. Supper strong nanostructured TWIP steels for automotive applications. Prog. Nat. Sci. 2014, 24, 50–55. [Google Scholar] [CrossRef] [Green Version]
- McLaren, A.J.; Sellars, C.M. The Effects of Transients in Conditions of Hot Deformation on the Kinetics of Static Recrystallisation. In Proceedings of the International Symposium on Strip Casting, Hot and Cold Working of Stainless Steels, Quebec City, QC, Canada, 29 August–2 September 1993; Ryan, N.D., Brown, A.J., McQueen, H.J., Eds.; Canadian Institute of Mining, Metallurgy and Petroleum: Quebec City, QC, Canada, 1993; pp. 107–115. [Google Scholar]
- Raabe, D. Microstructure and crystallographic texture of strip-cast and hot-rolled austenitic stainless steel. Met. Mater. Trans. A 1995, 26, 991–998. [Google Scholar] [CrossRef]
- Embury, J.D.; Poole, W.J.; Koken, E. Some views on the influence of strain path on recrystallisation. Scripta Metall. Mater. 1992, 27, 1465–1470. [Google Scholar] [CrossRef]
- Cowan, J.R.; Higginson, R.L.; Hutchinson, W.B.; Bate, P.S. Recrystallisation following non-proportional straining in aluminium. Mater. Sci. Technol. 1995, 11, 1104–1109. [Google Scholar] [CrossRef]
- Canova, G.; Kocks, U.; Jonas, J. Theory of torsion texture development. Acta Met. 1984, 32, 211–226. [Google Scholar] [CrossRef]
- Barnett, M.R.; Jonas, J.J. Influence of Ferrite Rolling Temperature on Microstructure and Texture in Deformed Low C and IF Steels. ISIJ Int. 1997, 37, 697–705. [Google Scholar] [CrossRef]
- Hutchinson, W.B.; Davis, T. The Effect of Strain Path Changes on the Plastic Flow Properties of Steel. In Proceedings of the 4th International Conference on Mechanical Behaviour of Materials, Stockholm, Sweden, 15–19 August 1983; Carlsson, J., Ohlson, S.N.G., Eds.; Pergamon: Oxford, UK, 1983; pp. 1227–1236. [Google Scholar]
- Rollett, A.D.; Lowe, T.; Kocks, U.K.; Stout, M.G. The Microstructure and Texture Torsion-Reverse Torsion Experiments. In Proceedings of the 8th International Conference on Textures of Materials (ICOTOM 8), Santa Fe, NM, USA, 20–25 September 1987; Kallend, S., Gottstein, G., Eds.; The Minerals, Metals & Materials Society: Warrendale, PA, USA, 1988; pp. 473–478. [Google Scholar]
- Sakai, T.; Saito, Y.; Kato, K. Recrystallisation and texture formation in high speed rolling of austenitic strainless steel. Trans. Iron Steel Inst. Jpn. 1987, 27, 520–525. [Google Scholar] [CrossRef] [Green Version]
- Sellars, C.M.; Zhu, Q. Microstructural Evolution During Hot Deformation of Aluminium–Magnesium Alloys. In Proceedings of the Symposium on Hot Deformation of Aluminium Alloys II, TMS Fall Meeting, Chicago, IL, USA, 11–15 October 1998; The Minerals, Metals and Materials Society: Wareendale, PA, USA, 1998; pp. 185–197. [Google Scholar]
- Zhu, Q.; Sellars, C.M. Effect of Deformation Paths on Static Recrystallisation Behaviour of an Al-2Mg Alloy. In Proceedings of the 3rd International Conference on Recrystallisation and Related Phenomena (ReX’96), Monterey, CA, USA, 21–24 October 1996; Monterey Institute of Advanced Studies: Monterey, CA, USA, 1996; pp. 195–202. [Google Scholar]
- Jorge-Badiola, D.; Gutiérrez, I. Study of the strain reversal effect on the recrystallization and strain-induced precipitation in a Nb-microalloyed steel. Acta Mater. 2004, 52, 333–341. [Google Scholar] [CrossRef]
- Gurao, N.; Sethuraman, S.; Suwas, S. Effect of strain path change on the evolution of texture and microstructure during rolling of copper and nickel. Mater. Sci. Eng. A 2011, 528, 7739–7750. [Google Scholar] [CrossRef]
- Sun, L.; Muszka, K.; Wynne, B.; Palmiere, E. Effect of strain path on dynamic strain-induced transformation in a microalloyed steel. Acta Mater. 2014, 66, 132–149. [Google Scholar] [CrossRef]
- Sun, L.; Muszka, K.; Wynne, B.P.; Palmiere, E.J. Influence of Strain History and Cooling Rate on the Austenite Decomposition Behavior and Phase Transformation Products in a Microalloyed Steel. Met. Mater. Trans. A 2014, 45, 3619–3630. [Google Scholar] [CrossRef]
- Taylor, A.; Cizek, P.; Hodgson, P. Comparison of 304 stainless steel and Ni–30wt.% Fe as potential model alloys to study the behaviour of austenite during thermomechanical processing. Acta Mater. 2011, 59, 5832–5844. [Google Scholar] [CrossRef]
- Bai, D.Q.; Yue, S.; Sun, W.P.; Jonas, J.J. Effect of deformation parameters on the no–recrystallization temperature in Nb–bearing steels. Metall. Trans. A 1993, 24A, 2151–2158. [Google Scholar] [CrossRef]
- Gao, H.; Huang, Y.; Nix, W.D.; Hutchinson, J.W. Mechanism-based strain gradient plasticity-I. Theory. J. Mech. Phys. Solids 1999, 47, 1239–1263. [Google Scholar] [CrossRef]
- Kubin, L.; Mortensen, A. Geometrically necessary dislocations and strain-gradient plasticity: A few critical issues. Scr. Mater. 2003, 48, 119–125. [Google Scholar] [CrossRef] [Green Version]
- Muszka, K.; Sun, L.; Wynne, B.P.; Palmiere, E.; Rainforth, W.M. On the Effect of Strain Reversal on Static Recrystallisation and Strain-Induced Precipitation Process Kinetics in Microalloyed Steels. Mater. Sci. Forum 2012, 715–716, 655–660. [Google Scholar] [CrossRef]
- Muszka, K.; Wynne, B.P.; Palmiere, E.J.; Rainforth, W.M. Effect of deformation mode on microstructure evolution in Nb-microalloyed steel. Steel Res. Int. 2010, 81, 70–73. [Google Scholar]
- Szyndler, J.; Madej, L. Numerical analysis of the influence of number of grains, FE mesh density and friction coefficient on representativeness aspects of the polycrystalline digital material representation—Plane strain deformation case study. Comput. Mater. Sci. 2015, 96, 200–213. [Google Scholar] [CrossRef]
- Madej, L.; Rauch, L.; Perzynski, K.; Cybulka, P. Digital Material Representation as an efficient tool for strain inhomogeneities analysis at the micro scale level. Arch. Civ. Mech. Eng. 2011, 11, 661–679. [Google Scholar] [CrossRef]
- Madej, L.; Sieradzki, L.; Sitko, M.; Perzynski, K.; Radwanski, K.; Kuziak, R. Multi scale cellular automata and finite element based model for cold deformation and annealing of a ferritic–pearlitic microstructure. Comput. Mater. Sci. 2013, 77, 172–181. [Google Scholar] [CrossRef]
- Sitko, M.; Chao, Q.; Wang, J.; Perzynski, K.; Muszka, K.; Madej, L. A parallel version of the cellular automata static recrystallization model dedicated for high performance computing platforms—Development and verification. Comput. Mater. Sci. 2020, 172, 109283. [Google Scholar] [CrossRef]
- Lisiecka–Graca, P.; Kwiecień, M.; Madej, L.; Muszka, K.; Majta, J.; Wynne, B.P. Controlling deformation inhomogeneity in the Accumulative Angular Drawing Process assisted by constitutive and multiscale numerical modelling. Comput. Methods Mater. Sci. 2019, 19, 113–121. [Google Scholar]


| Alloy | C | Ni | Si | Mn | Nb | Ti | P | S | Fe |
|---|---|---|---|---|---|---|---|---|---|
| A | 0.08 | 30.9 | 0.25 | 1.75 | – | 0.003 | 0.01 | 0.013 | Bal. |
| B | 0.089 | 29.8 | 0.27 | 1.73 | 0.09 | 0.003 | 0.01 | 0.016 | |
| C | 0.069 | 31.6 | 0.29 | 1.67 | – | 0.001 | 0.001 | 0.005 | |
| D | 0.077 | 31.7 | 0.28 | 1.65 | 0.09 | 0.002 | 0.001 | 0.008 |
| Rolling Schedule | 1st Rolling Pass | 2nd Rolling Pass |
|---|---|---|
| Forward | A1, B1 Forward A2, B2 Reverse | |
| Initial temperature, °C | 1200 | 950 |
| Initial thickness, mm | 3 | 2.6 |
| Final thickness, mm | 2.6 | 2.3 |
| True strain | 0.14 | 0.12 |
| Strain rate, 1/s | 17.3 | 17.2 |
| Interpass time, s | 3 | |
| Strain Path | Alloy | Total Strain Per Deformation Pass | Strain in the Forward Direction (F) | Strain in the Reverse Direction (R) |
|---|---|---|---|---|
| 0.100F | A, B | 0.1 | 0.1 | - |
| 0.083F-0.017R | 0.083 | 0.017 | ||
| 0.075F-0.025R | 0.075 | 0.025 | ||
| 0.150F | C, D | 0.15 | 0.15 | - |
| 0.125F-0.025R | 0.125 | 0.025 | ||
| 0.100F-0.050R | 0.1 | 0.050 |
| Total Strain Per Pass εc | Deformation Schedule | Tnr, °C | |
|---|---|---|---|
| A | B | ||
| 0.1 | 0.100F | 892 | 980 |
| 0.083F 0.017R | 930 | 970 | |
| 0.075F 0.025R | 956 | 942 | |
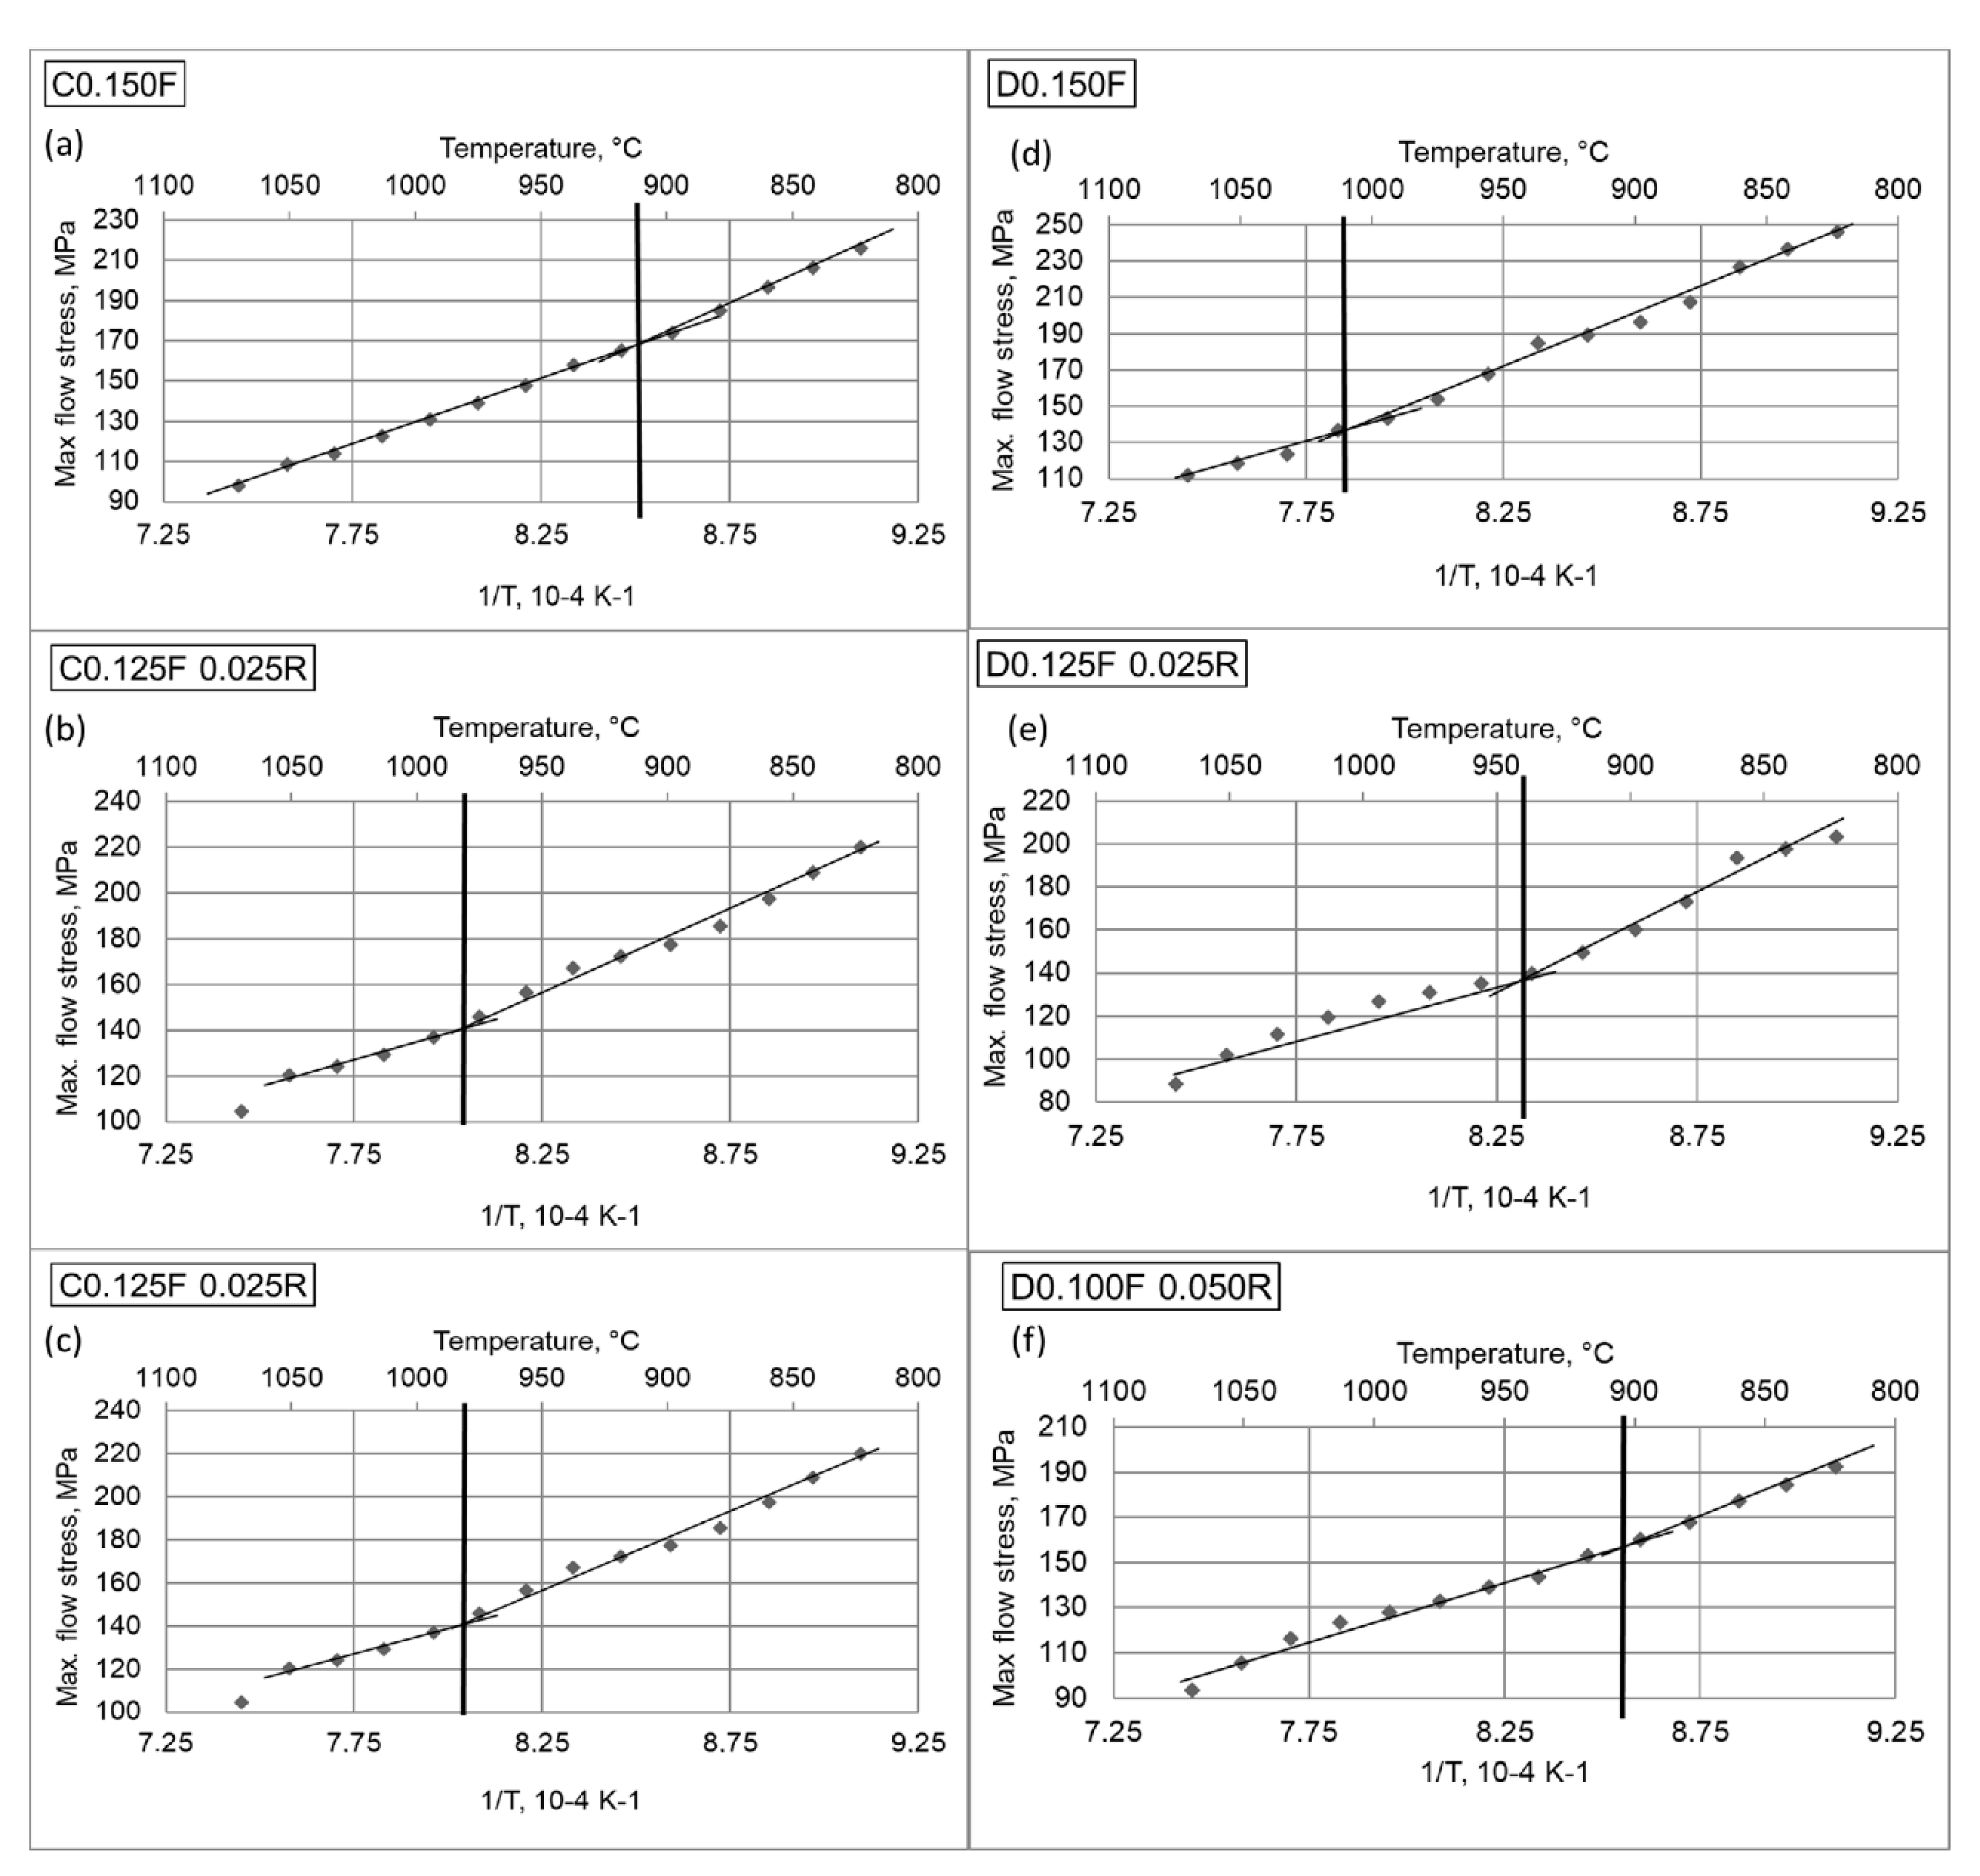
| 0.15 | Deformation Schedule | C | D |
| 0.150F | 911 | 1009 | |
| 0.125F 0.025R | 980 | 939 | |
| 0.100F 0.050R | 1011 | 903 | |
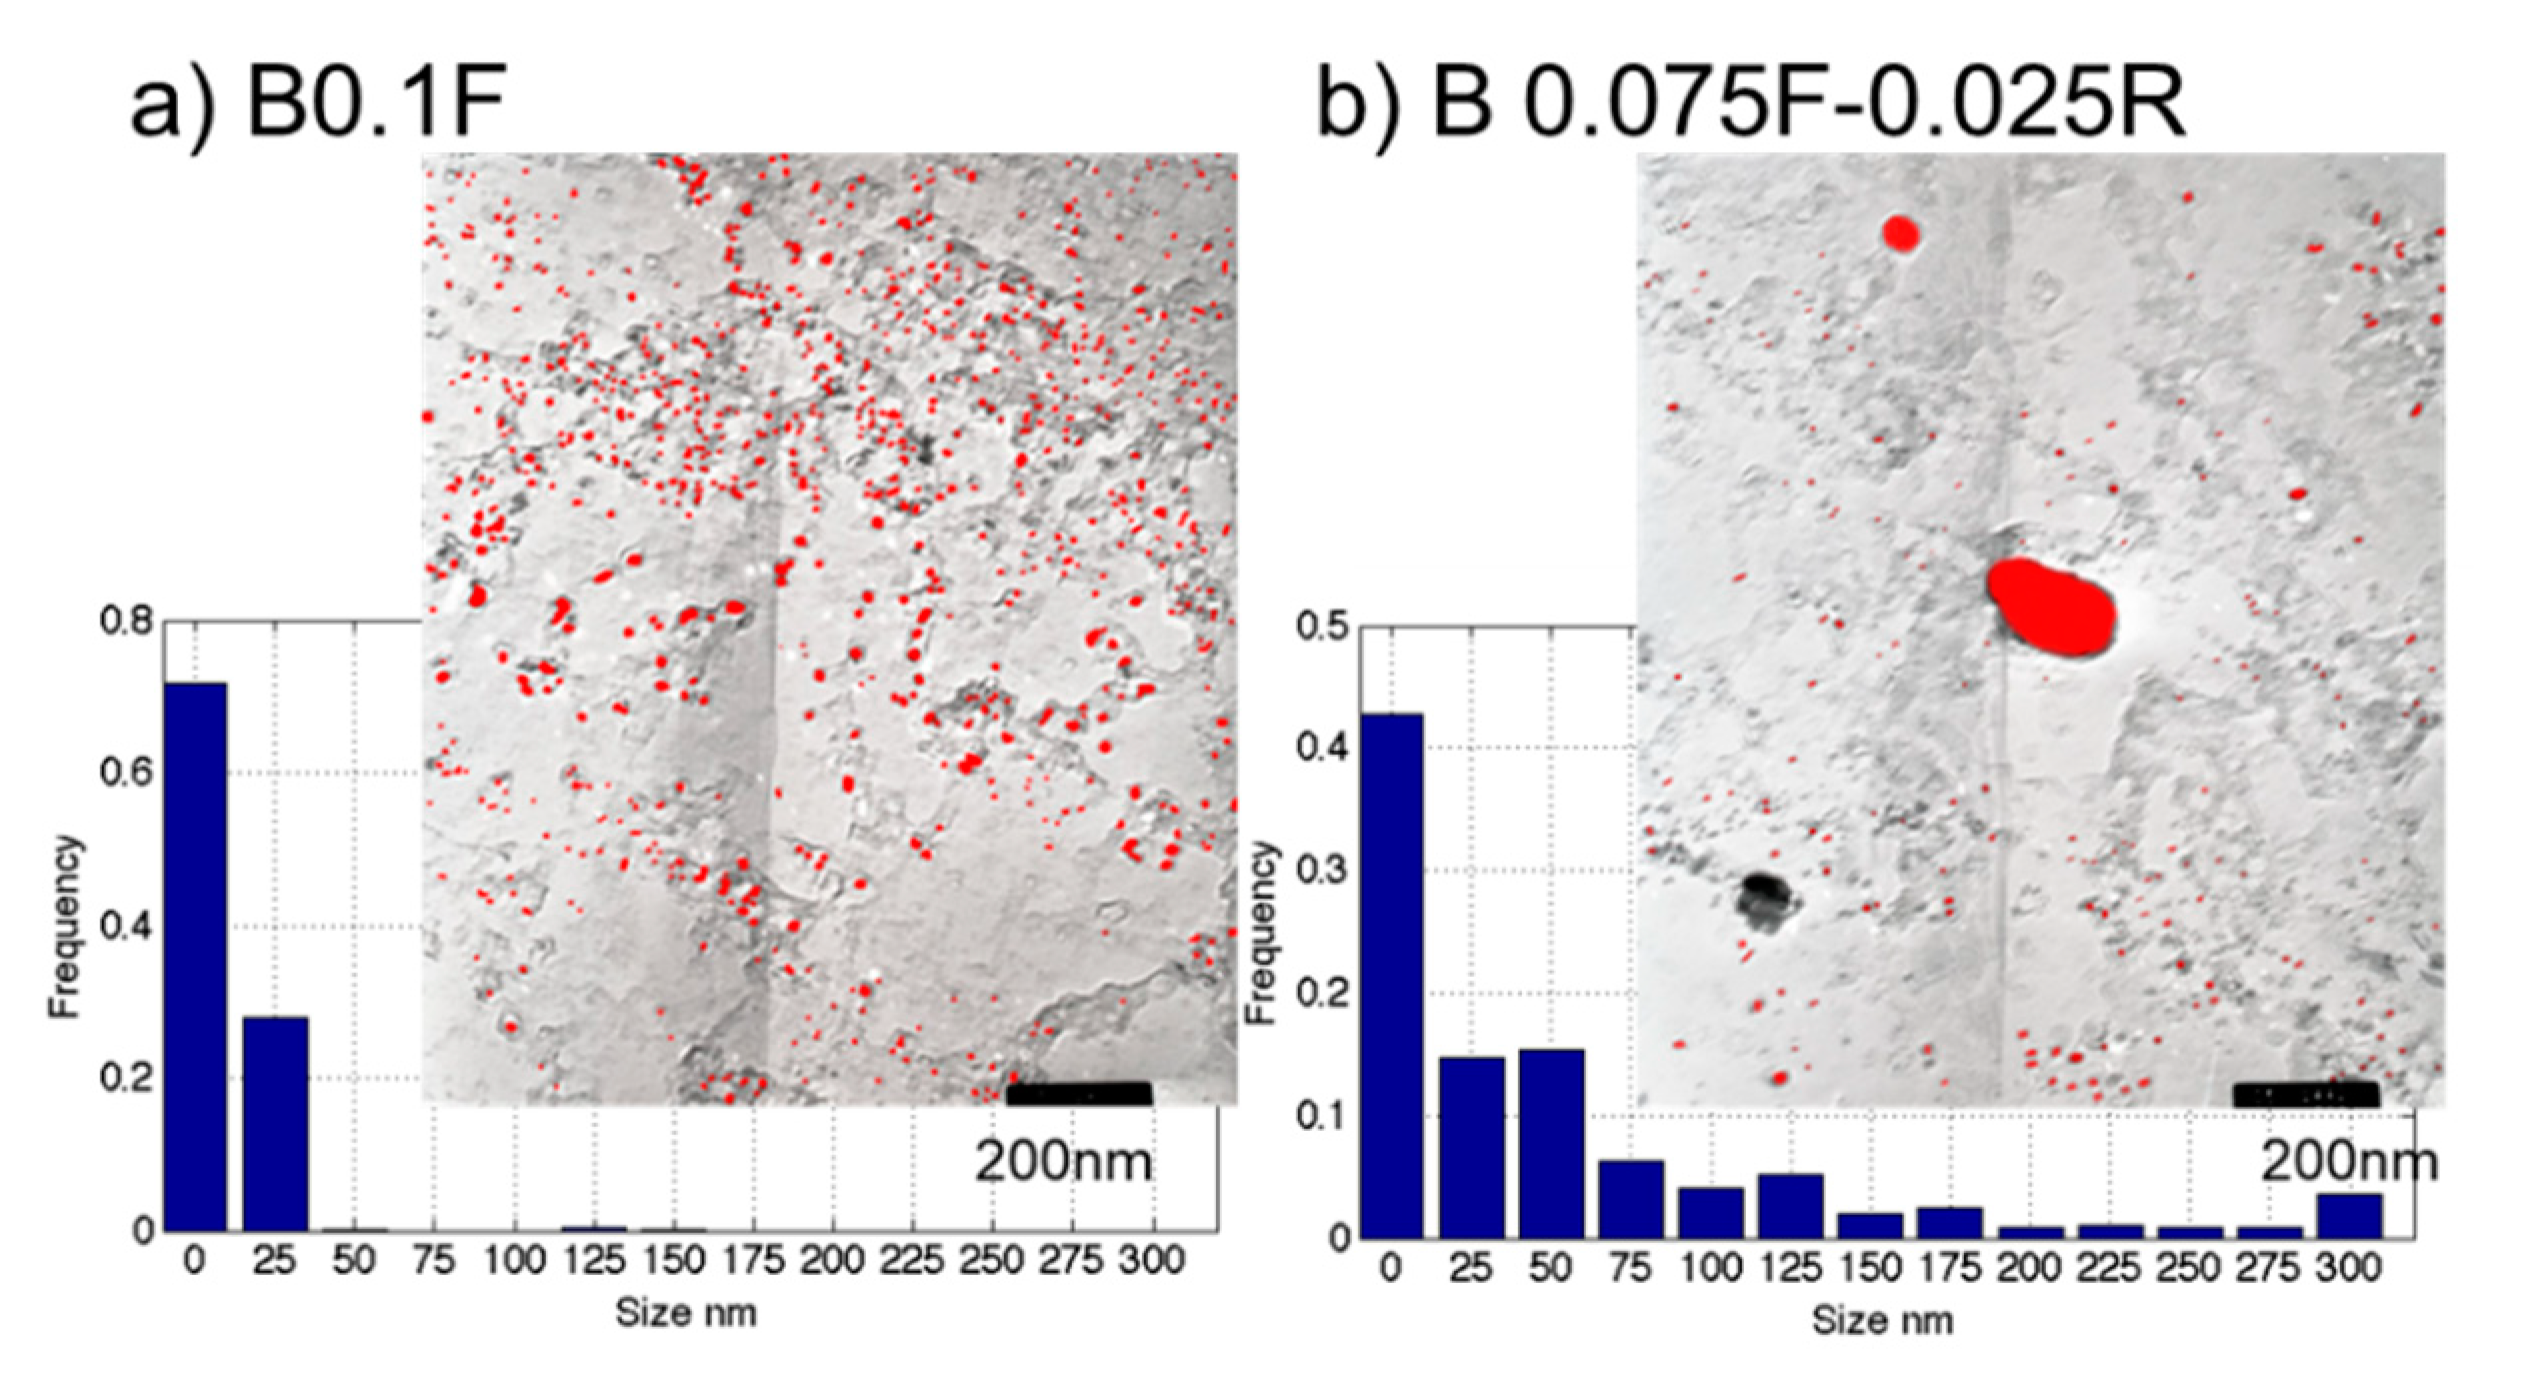
| Strain Path | Mean Particle Size, nm (stdev) | Area Fraction |
|---|---|---|
| 0.100F | 10.6 (3) | 0.02 |
| 0.075F–0.025R | 9.5 (4) | 0.003 |
Publisher’s Note: MDPI stays neutral with regard to jurisdictional claims in published maps and institutional affiliations. |
© 2020 by the authors. Licensee MDPI, Basel, Switzerland. This article is an open access article distributed under the terms and conditions of the Creative Commons Attribution (CC BY) license (http://creativecommons.org/licenses/by/4.0/).
Share and Cite
Muszka, K.; Sitko, M.; Lisiecka-Graca, P.; Simm, T.; Palmiere, E.; Schmidtchen, M.; Korpala, G.; Wang, J.; Madej, L. Experimental and Numerical Study of the Effects of the Reversal Hot Rolling Conditions on the Recrystallization Behavior of Austenite Model Alloys. Metals 2021, 11, 26. https://doi.org/10.3390/met11010026
Muszka K, Sitko M, Lisiecka-Graca P, Simm T, Palmiere E, Schmidtchen M, Korpala G, Wang J, Madej L. Experimental and Numerical Study of the Effects of the Reversal Hot Rolling Conditions on the Recrystallization Behavior of Austenite Model Alloys. Metals. 2021; 11(1):26. https://doi.org/10.3390/met11010026
Chicago/Turabian StyleMuszka, Krzysztof, Mateusz Sitko, Paulina Lisiecka-Graca, Thomas Simm, Eric Palmiere, Matthias Schmidtchen, Grzegorz Korpala, Jiangting Wang, and Lukasz Madej. 2021. "Experimental and Numerical Study of the Effects of the Reversal Hot Rolling Conditions on the Recrystallization Behavior of Austenite Model Alloys" Metals 11, no. 1: 26. https://doi.org/10.3390/met11010026