2. Materials and Methods
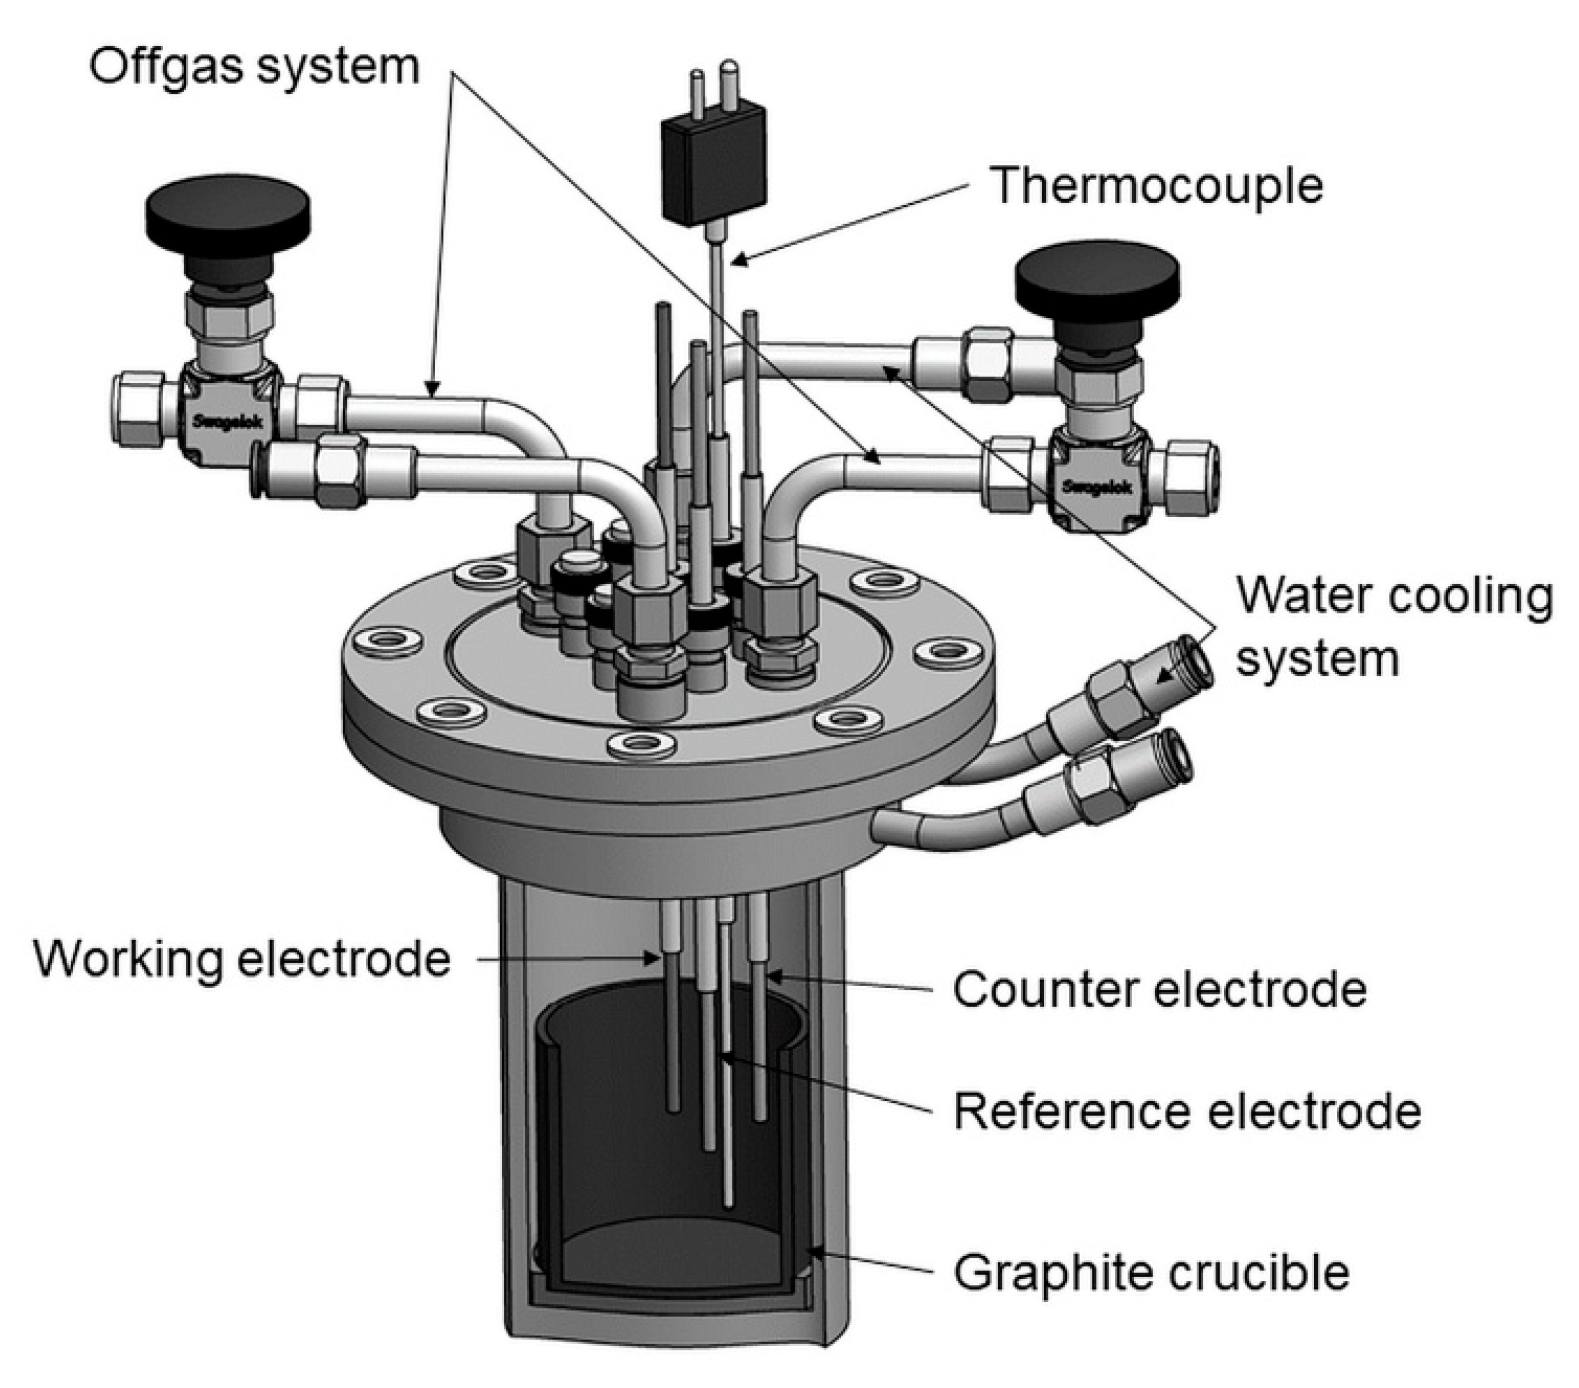
The stainless-steel cell, which was used for the electrochemical experiments, is shown in
Figure 1. A graphite crucible was filled with electrolyte and placed in the cell. The electrolyte consisted of 87.5 wt.% neodymium fluoride (NdF
3, Treibacher, Althofen, Austria, ≥99.9%) and 12.5 wt.% lithium fluoride (LiF, STREM Chemicals, Inc., Newburyport, MA, United States, 99.9%). This molar ratio of 47.5 mol% NdF
3 and 52.5 mol% LiF proved to be the most suitable in terms of the melting temperature and viscosity of the electrolyte [
22]. The preparation of these electrolyte components included drying for 24 h at 523 K before the two powders were premixed, fed into a high purity graphite crucible, then melted and homogenized in a vacuum induction furnace under an argon atmosphere of 1800 mbar at up to 1373 K. An additional chemical compound was added to the electrolyte, neodymium oxide (Nd
2O
3, Treibacher, Althofen, Austria, 99.8%), which was dried for 24 h at 393 K. In order to make this material more suitable for the feeding process (the addition into the electrolyte already in the cell), the dried powder was pressed, crushed, and sieved to achieve a powder particle size between 0.71 mm and 2 mm. All of the experiments were conducted with 2 wt.% of Nd
2O
3 in the NdF
3–LiF electrolyte in order to minimize sample to sample variation.
The working electrode (WE) was a molybdenum wire (Mo, 1 mm diameter, EWG, Weissach-Flacht, Germany, 99.95%), the reference electrode (RE) was a tungsten wire (W, 2 mm diameter, EWG, Weissach-Flacht, Germany, 99.9%), and the counter electrode was a glassy carbon rod (GC, 4 mm diameter, HTW SIGRADUR® G, Thierhaupten, Germany, >99.99%). All the reported potentials of WE in this work were measured relative to the tungsten RE in the melts used under given conditions.
All the electrodes were polished and, prior to each experiment, rinsed with deionized water and methanol, dried, and mounted into the cell. The immersion depth of the electrodes into the electrolyte was 1 cm.
The cell was placed into a resistance-heated furnace and heated up to 1433 K in order to reach the target temperature of 1323 K in the electrolyte. The temperature was measured by a thermocouple Type B via the Swagelok connection. The cell was supplied with a water-cooled lid with Swagelok connections, which assured that the electrodes can be inserted into the cell while it was still gas-tight (
Figure 1). This was necessary to prevent the escape of harmful gases formed in the cell during the experiments.
During the experiments, argon flow (1.5 L/min) was introduced into the cell to flush the system and prevent the melt from having contact with air. The offgases formed were led into washing bottles filled with water and NaOH, before being treated by the exhaust system.
The electrochemical measurements were conducted by an IviumStat potentiostat (5 A and 10 V; Ivium Technologies, Eindhoven, The Netherlands).
The characterization of the cathodic behaviour was done using the electrochemical measuring methods, cyclic voltammetry and chronoamperometry.
The cyclic voltammograms were obtained on a molybdenum working electrode in a molten NdF3–LiF–Nd2O3 electrolyte, and started from potential EI, usually 0.05 V more negative than the Mo open-circuit potential (measured against the tungsten reference electrode), changed to a final cathodic end potential, EF, and back with various sweep rates.
In the second procedure, the same potential range was scanned with a sweep rate of 100 mV·s−1, but the scan was interrupted when the potential reached −0.80 V; and this potential was held for 5, 60, and 180 s before starting the return scan.
Potentiostatic electrodeposition onto molybdenum and tungsten electrodes in the molten NdF3–LiF–Nd2O3 electrolyte system was initiated 5 min after insertion of the working electrode into the melt, in order to allow thermal equilibrium. Neodymium was electrodeposited at a different constant overpotential at 1323 K. After the deposition, the working electrode was taken out of the melt, but kept inside the cell. The system was then cooled, and the electrode was taken out from the cell and kept under vacuum, awaiting further analysis. The morphology of the sample deposits were explored by optical microscope (Keyence; model VH-Z100R, Osaka, Osaka Prefecture, Japan). The deposit obtained on the working electrode and electrolyte collected near the working electrode at 1323 K were analysed by X-ray diffraction (XRD) with a Philips PW 1050 powder diffractometer (Philips, Delft, The Netherlands) at room temperature with Ni filtered CuKα radiation (λ = 1.54178 Å), scintillation detector within 20–85° 2θ range in steps of 0.05°, and scanning time of 5 s per step, or by SmartLab® X-ray diffractometer (Rigaku Co., Tokyo, Japan) using Cu Kα radiation (λ = 1.542 Å). The patterns were collected within a 2θ range of 10–90° at a scan rate of 0.5°/min with divergent slit of 0.5 mm, operated at 40 kV and 30 mA. The phases formed during the deposition were identified by comparison of the recorded diffraction peaks with the references from the Joint Committee on Powder Diffraction Standards (JCPDS) database. During electrodeposition, off-gas measurements were done by Gasmet DX4000 Fourier transformation infrared spectrometer (FTIR, Ansyco, Karlsruhe, Germany).
3. Results and Discussion
Cyclic voltammograms were first recorded on a molybdenum working electrode in the electrolyte made of NdF
3–LiF molten salt mixture. Although the melt composition is very important for potential use in the extraction processes of neodymium, only little research has been focused on the structure of neodymium electrolytes, and only some qualitative results about the forms of complex ions have been published [
28]. In the NdF
3–LiF molten salt mixture, NdF
3 reacts with F
−, dissociated from molten LiF, to form Nd–F complex ions. Some authors assumed [
28] that the main form of the Nd–F complex ion is [NdF
4]
−, others [
17], after studying the structure of NdF
3–LiF melt by Raman spectrometry, recommended the existence of [NdF
6]
3−. The generally accepted viewpoint is that [NdF
6]
3−, [NdF
4]
−, and F
− coexist in these melts [
28,
29]. In the temperature range of 1223–1323 K, the molar fraction of [NdF
6]
3−, [NdF
4]
−, and F
− in all anions is expected to be 22 to 25 mol%, 25 mol%, and 50 to 52 mol%, respectively. It appears that [NdF
6]
3− is prone to decomposing into [NdF
4]
− and F
− with an increase in temperature [
28].
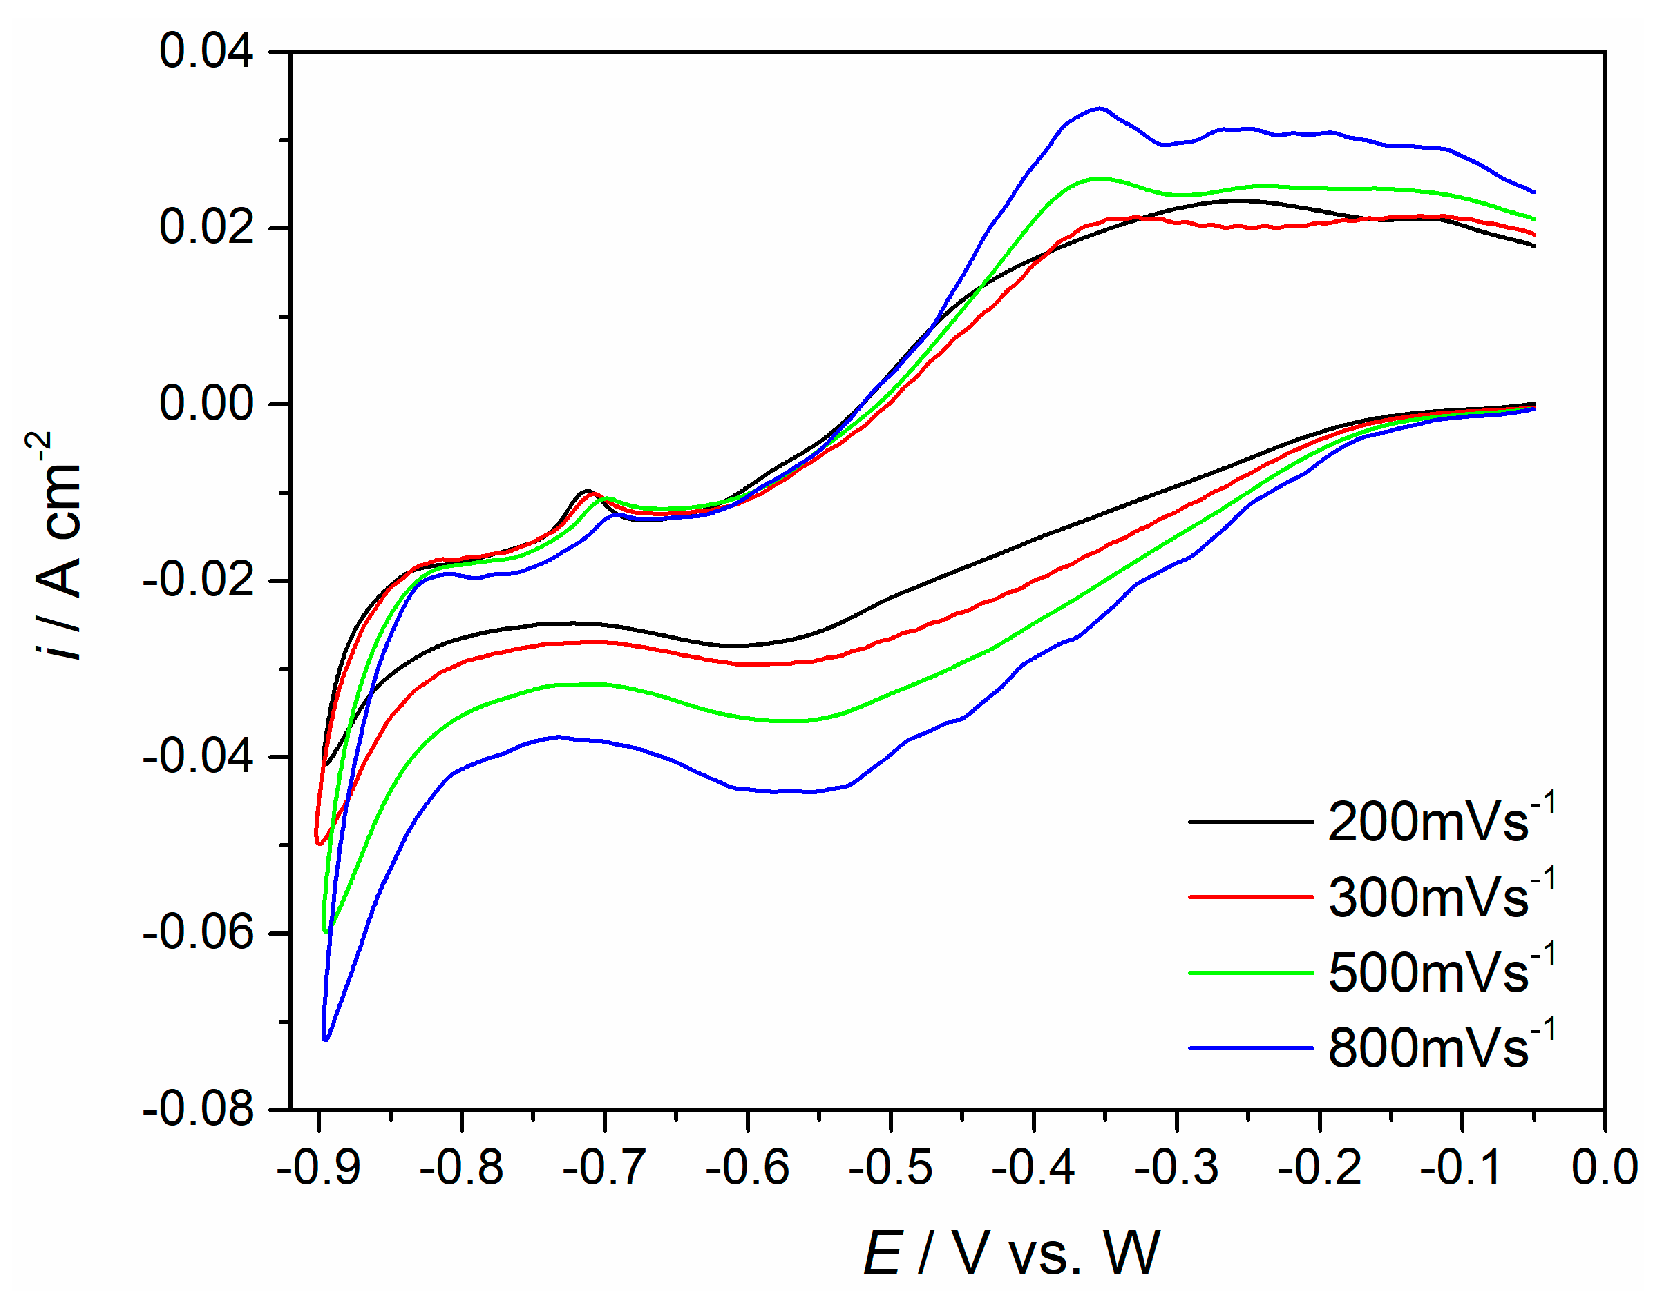
The voltammograms obtained using various scan rates on the Mo electrode, from the NdF
3–LiF molten salt electrolyte, are presented in
Figure 2. In the potential range between −0.05 V and −0.90 V, two cathodic current waves can be registered and attributed to the reduction of Nd ions: a broad cathodic wave at around −0.55 V, and its anodic counterpart at ≈−0.35 V; and a second cathodic peak starting at around −0.83 V, and its anodic response at ≈−0.70 V. These voltammograms suggest that the cathodic and anodic processes recorded reflect the deposition and dissolution of the Nd metal on the cathode [
18,
20,
25].
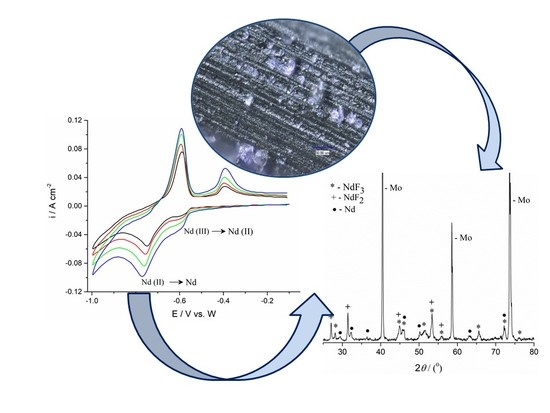
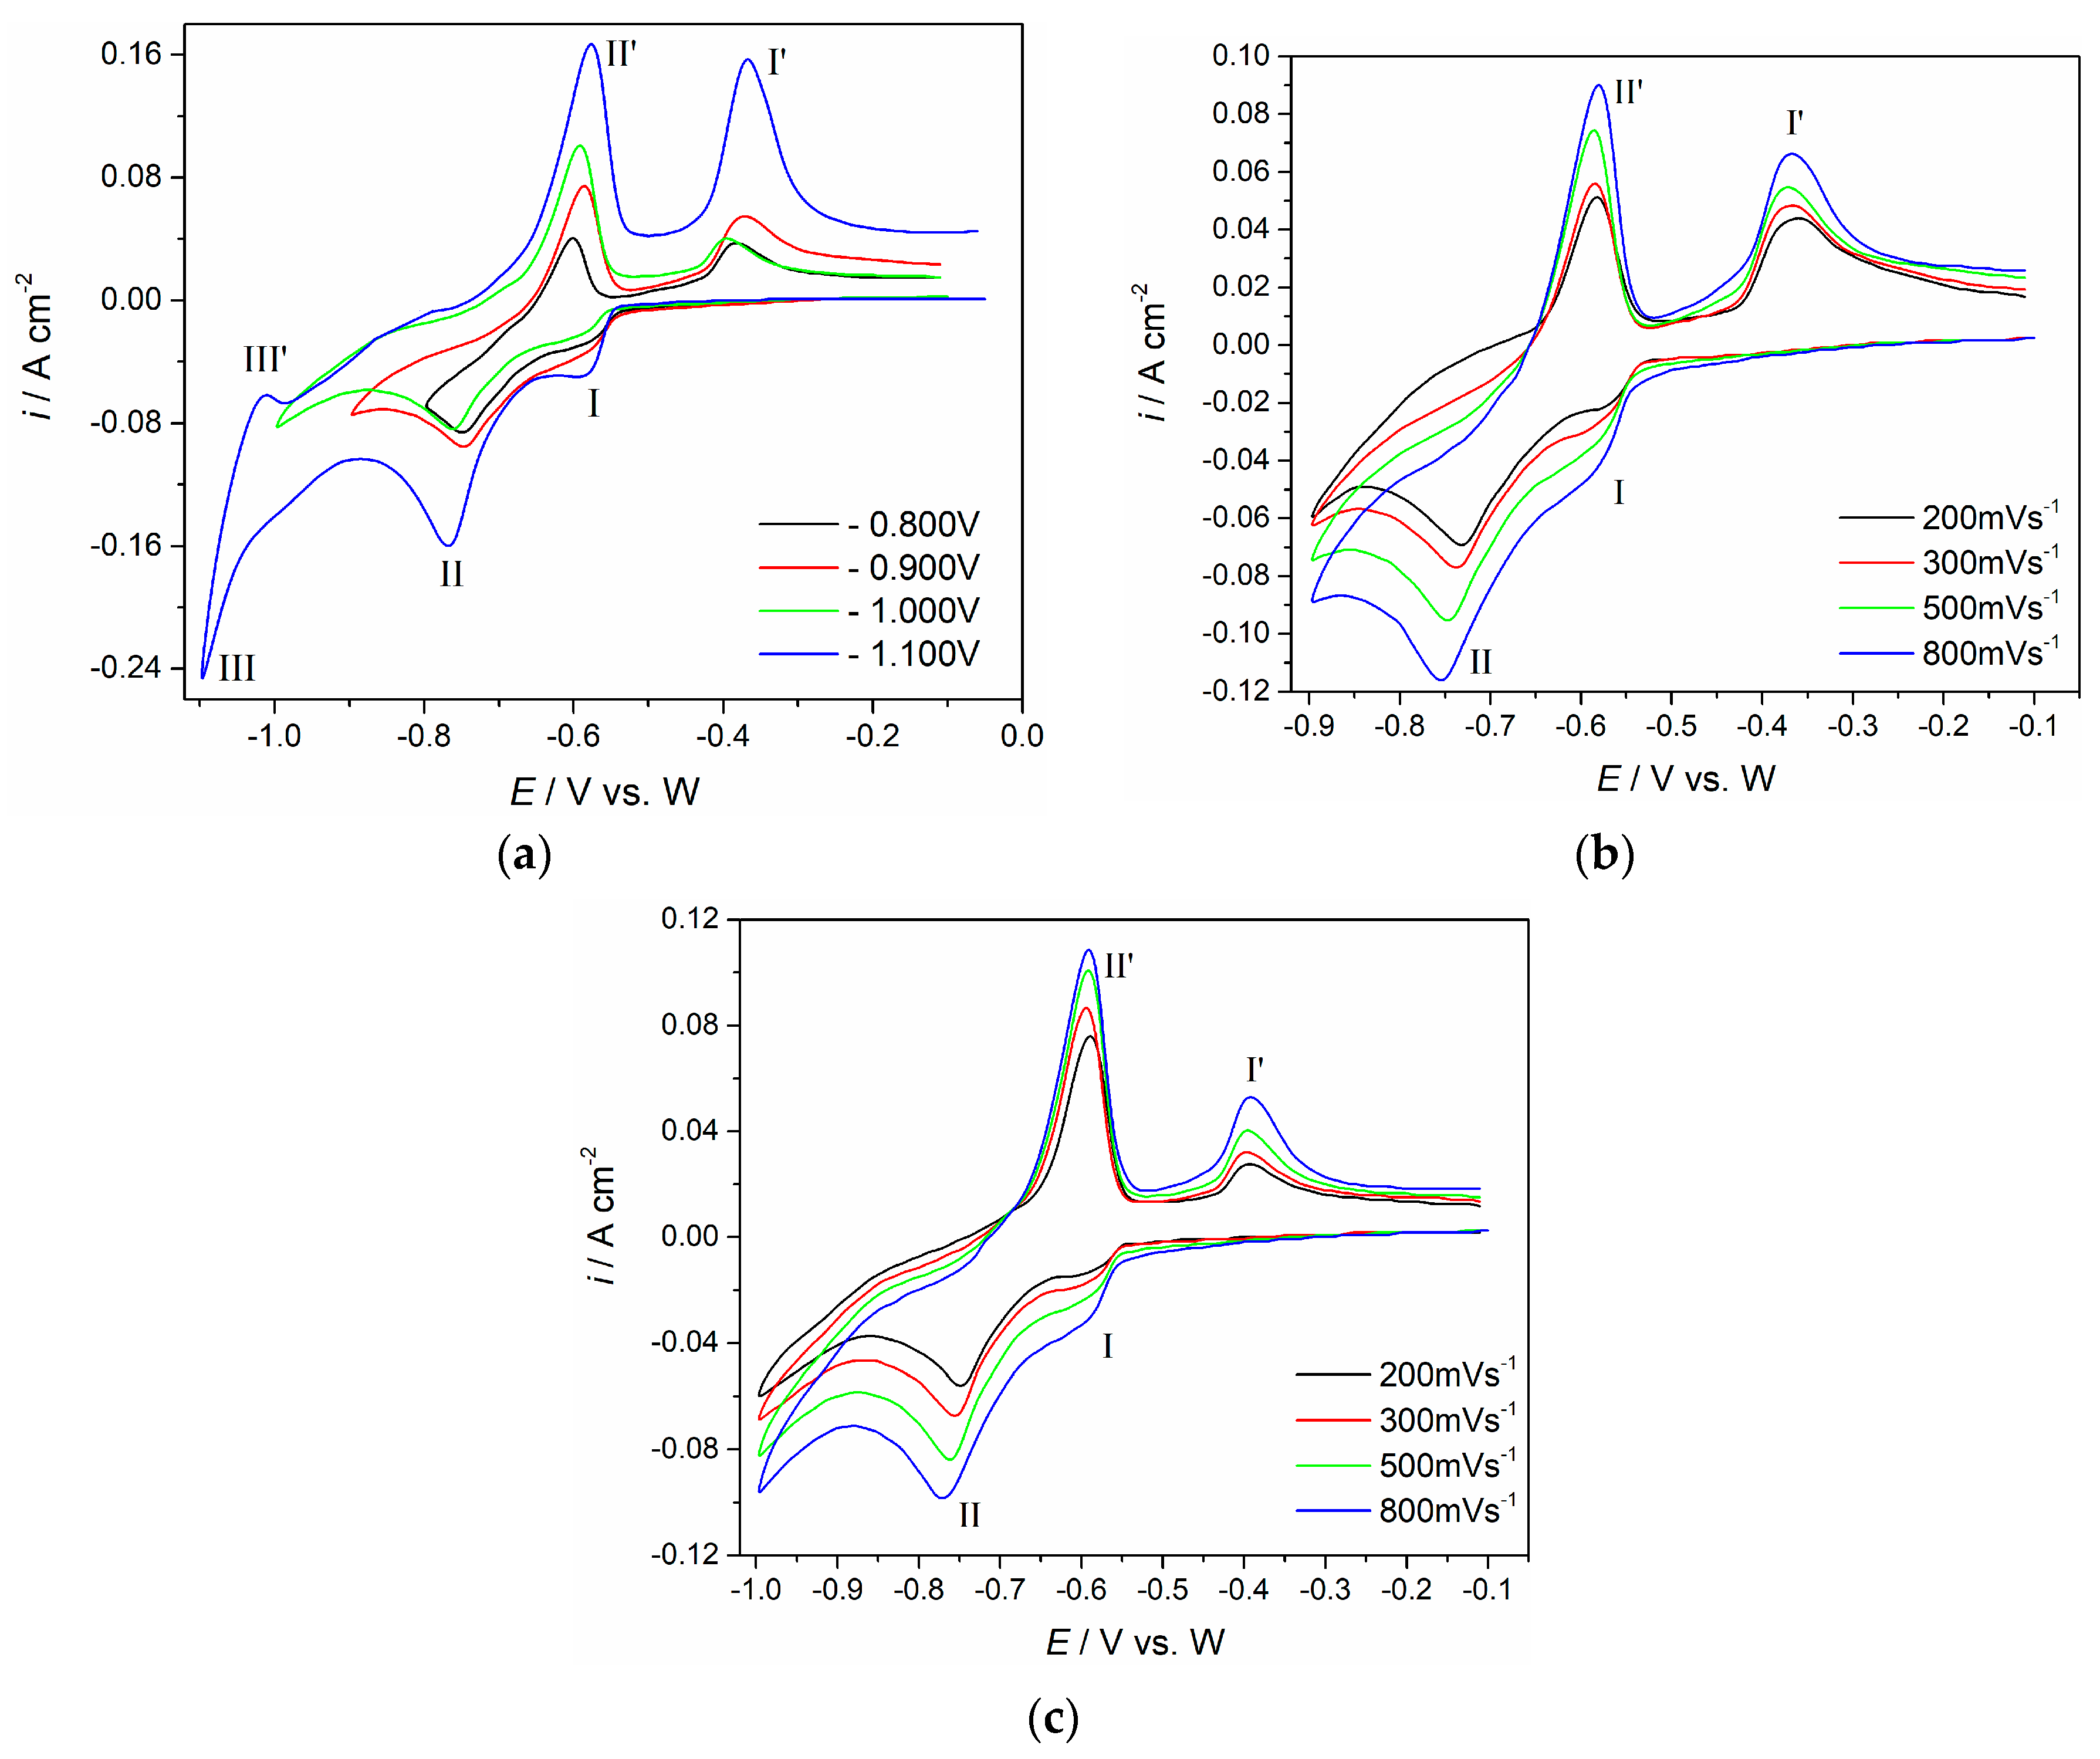
The voltammograms recorded using the same working electrode (Mo) in the same NdF
3–LiF electrolyte but with added Nd
2O
3 (2 wt.%), are shown in
Figure 3. In the electrolyte with the Nd
2O
3 added, the cathodic and anodic current waves are more clearly defined, and the maximum peak current densities recorded are several times higher (
Figure 3) than in the electrolyte without Nd
2O
3 present (
Figure 2). In the presence of Nd
2O
3 and at potentials negative to −0.10 V, (
Figure 3a,b), two distinct regions of cathodic/anodic activities can be observed. The peak pair at ≈−0.59 V (I) and ≈−0.39 V (I′), and the second peak pair at ≈−0.76 V (II) and ≈−0.59 V (II′) indicate two consecutive reversible redox reactions. When the applied potential was shifted more cathodic to −1.00 V, a new pair of current waves was observed (III/III′).
The cathodic peak (I) at ≈−0.59 V (
Figure 3a–c should reflect the reduction of Nd(III) to Nd(II)) and the reduction peak (II) at ≈−0.76 V should record reduction of Nd(II) into metal Nd. The corresponding anodic signals in the reverse scan, (II′) at ≈−0.59 V should relate to the dissolution of metal Nd, and the anodic peak at ≈−0.37 V to the oxidation of Nd(II) into Nd(III). The cathodic peak (III) and the corresponding anodic peak (III′) in the reverse scan (
Figure 3a) were not subjects of this investigation. The same conclusions based on very similar voltammograms obtained from identical or very similar fluoride electrolytes support the said deliberations [
18,
20,
25].
The dissolution of Nd
2O
3 in molten fluoride (LiF–NdF
3) is a diffusion-controlled process which can be accelerated if the temperature and NdF
3 concentration in the melt are increased [
30]. However, Nd
2O
3 has very limited solubility in fluoride melts (LiF–CaF
2–NdF
3, LiF–KF–NdF
3, etc.). Its concentration in the melts is 1–5 mass% at 1373 K and much smaller than the concentrations of LiF, CaF
2, or NdF
3 [
31]. Nevertheless, when added to the fluoride melt, Nd
2O
3 dissolves in the presence of LiF and NdF
3 and forms oxyfluorides, NdOF or [NdOF
5]
4− [
28,
29,
31,
32]:
Given that the electrolyte has an excess of F
−, [NdF
6]
3− and [NdOF
5]
4− coexist. Which of the two species will be predominantly involved in the neodymium deposition reaction should depend on the neodymium oxyfluoride ions/neodymium fluoride ions molar ratio [
17,
29], electrode potential, and current density applied [
24]. The source of Nd metals at high current densities, high voltage electrolysis, and low [NdOF
5]
4−/[NdF
6]
3− molar ratio is [NdF
6]
3-. At low current densities, low voltage electrolysis, and high [NdOF
5]
4−/[NdF
6]
3− molar ratio, it is [NdOF
5]
4− [
29]. The electroreduction of neodymium from neodymium fluorides or neodymium oxyfluorides on inert electrodes (W, Mo, glassy carbon) is a process that is still not defined. In fact, the electroreduction of Nd(III) to Nd(0) from fluoride electrolytes was explained in the literature as a one-step [
6,
17,
19,
21,
26,
27,
29,
32] or a two-step process [
18,
20,
25]:
(A) from neodymium fluorides:
(B) from neodymium oxyfluoride, a very complicated process, but can be described as:
To follow up on the processes indicated in neodymium deposition/dissolution in the NdF
3–LiF–Nd
2O
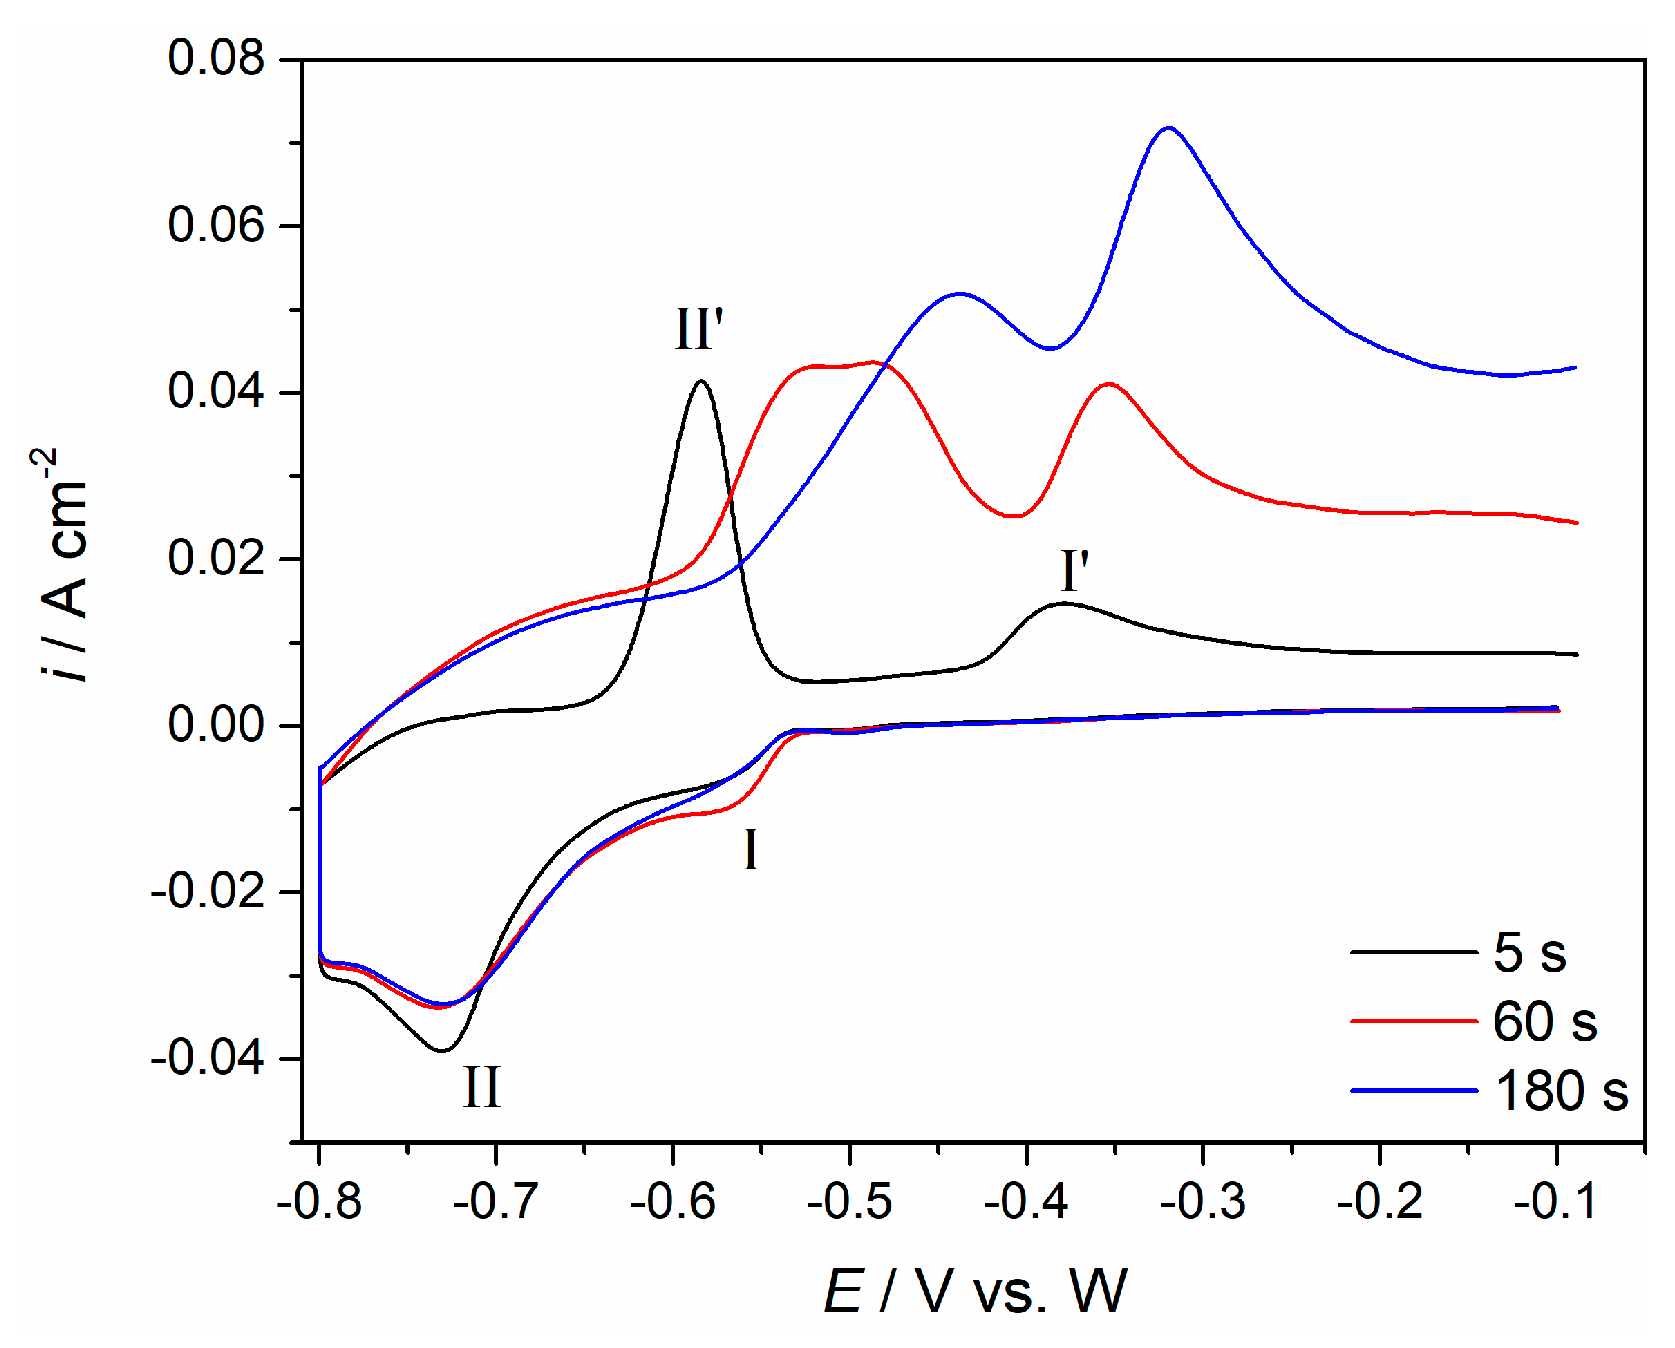
3 melt on Mo revealed by cyclic voltammograms, cyclic voltammetry using different holding times at negative potential end of the cycle was applied (
Figure 4).
The cathodic end potential of the molybdenum working electrode was held at −0.80 V for 5, 60, and 180 s, before letting the potential return to positive values (
Figure 4). According to the results presented in
Figure 3, the chosen cathodic end potential should represent the neodymium deposition overpotential of
≈−0.15 V. This assumption was very well supported by the increase of maximum peak currents and the charge encompassed by the anodic current waves (II′ and I′), with increased deposition time. Increased charge within anodic current wave II′, which reflects reaction Nd − 2e
− → Nd(II) with increased deposition time indicates more metal neodymium being dissolved. This confirms, that with prolonged times of the deposition under the applied overpotential (
≈−0.15 V), more metal Nd was previously deposited. The enlarged quantity of the Nd(II) complexed ions provided by the neodymium (anodic peaks II′) increases the quantity of the Nd(III) ions formed in the consecutive oxidation Nd(II) → Nd(III) reaction (anodic peak I′).This is reflected as increased peak currents and increased charges encompassed by the anodic current wave (I′), in
Figure 4.
This confirmed the assumption, that Nd metal can be electrodeposited on molybdenum electrode, in a two-step reduction process of Nd(III) → Nd(II) and Nd(II) into Nd(0) [
18,
20,
25]. This was reflected in our measurements at ≈−0.57 V and ≈−0.73 V, respectively.
The results recorded by the applied electrochemical techniques are in accordance with the literature that states that the electrochemical reduction of Nd(III) ions on molybdenum electrode in molten NdF
3–LiF–Nd
2O
3 electrolyte is a two-step process [
18,
20,
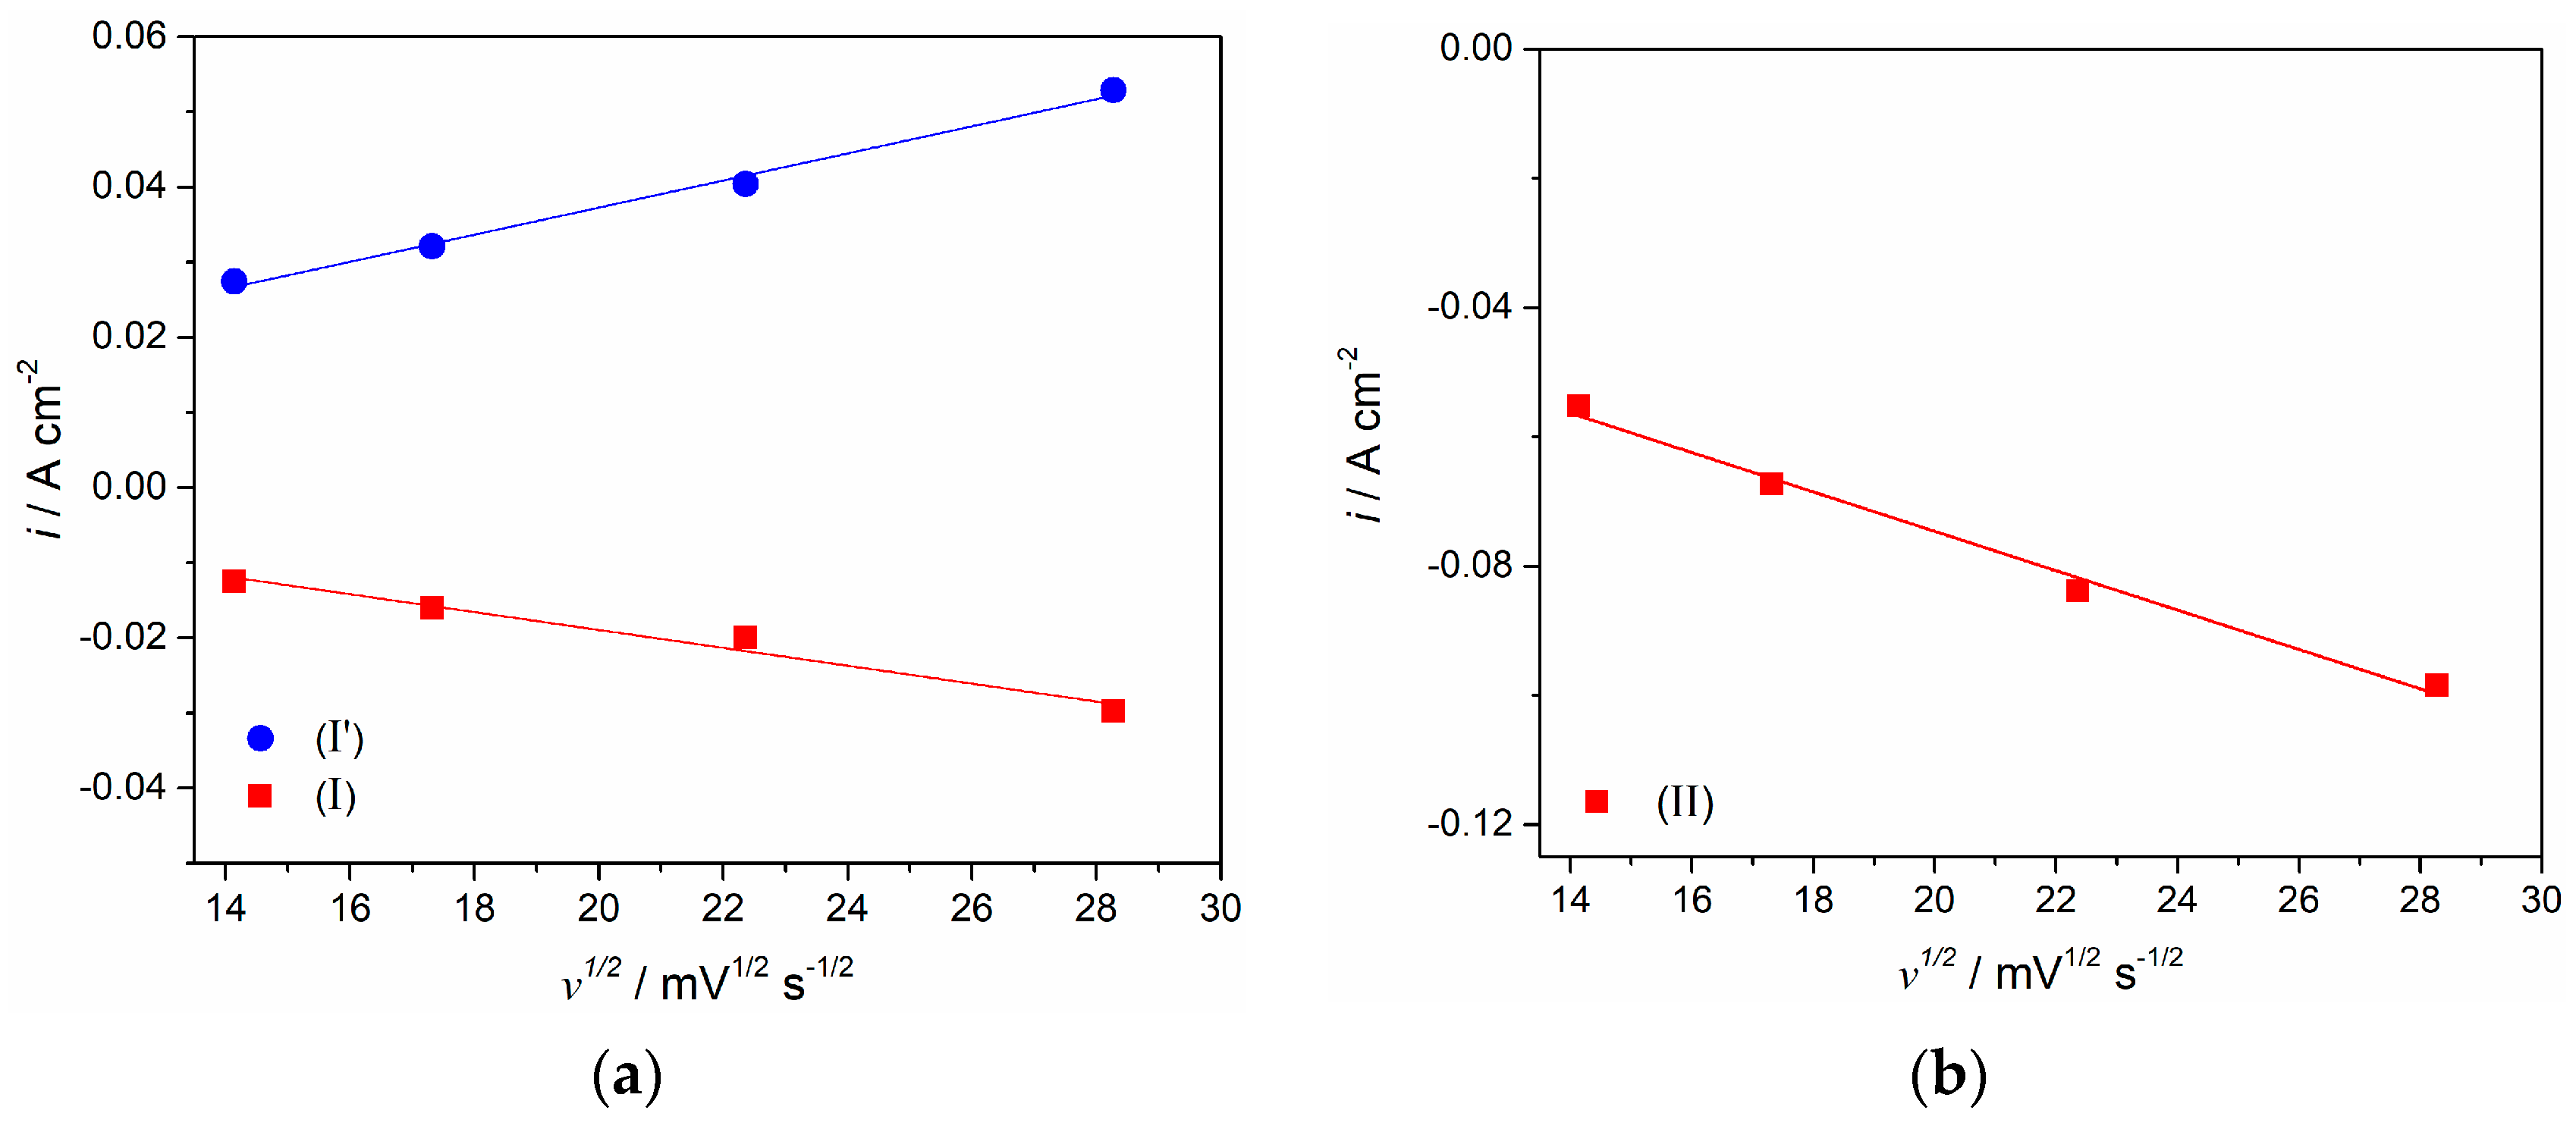
25]. The possibility that the two redox reactions (namely: Nd(III) ↔ Nd(II) and Nd(II) ↔ Nd(0)) reflected by the current peaks, I/I′ and II/II′, shown in the voltammograms in
Figure 3 are reversible and diffusion controlled, was investigated in the analysis (
Figure 5), which included the relationship between peak currents recorded and the square root of the scanning rates applied [
33]. Voltammograms shown in
Figure 3b,c exhibit responses to the scan rates increased from 200 mV·s
−1 to 800 mV·s
−1, within the potential range from −0.10 V to −0.80 V and −1.00 V. Maximum current densities of the cathodic ((I) and (II)) and anodic peaks ((I′) and (II′)) increased, but their peak potential differential was relatively small. The plots derived from
Figure 3c using the cathodic (I) and its counterpart anodic peak (I′) current densities versus the square root of the scan rates applied, appeared to be linear but did not pass through the origin (
Figure 5a). This should indicate that the redox process Nd(III) ↔ Nd(II) is under mixed control: by the diffusion of the complexed Nd ions and the rate of their charge transfer step, which includes complicated disbanding and formation of the ligand complexes [
18]. In addition, the plots derived from
Figure 3c, representing the peak currents for the peak (II) versus the square root of the scan rates applied, proved to be linear as well and it also did not pass through the origin (see
Figure 5b). This implies that the redox process of Nd(II) ↔ Nd(0) on the molybdenum cathode is also controlled by diffusion of complexed Nd ions in the molten NdF
3–LiF–Nd
2O
3 electrolyte, and the rate of the charge transfer step is additionally complicated by the dismantling of fluoride and oxyfluoride complex formations [
18,
20,
25].
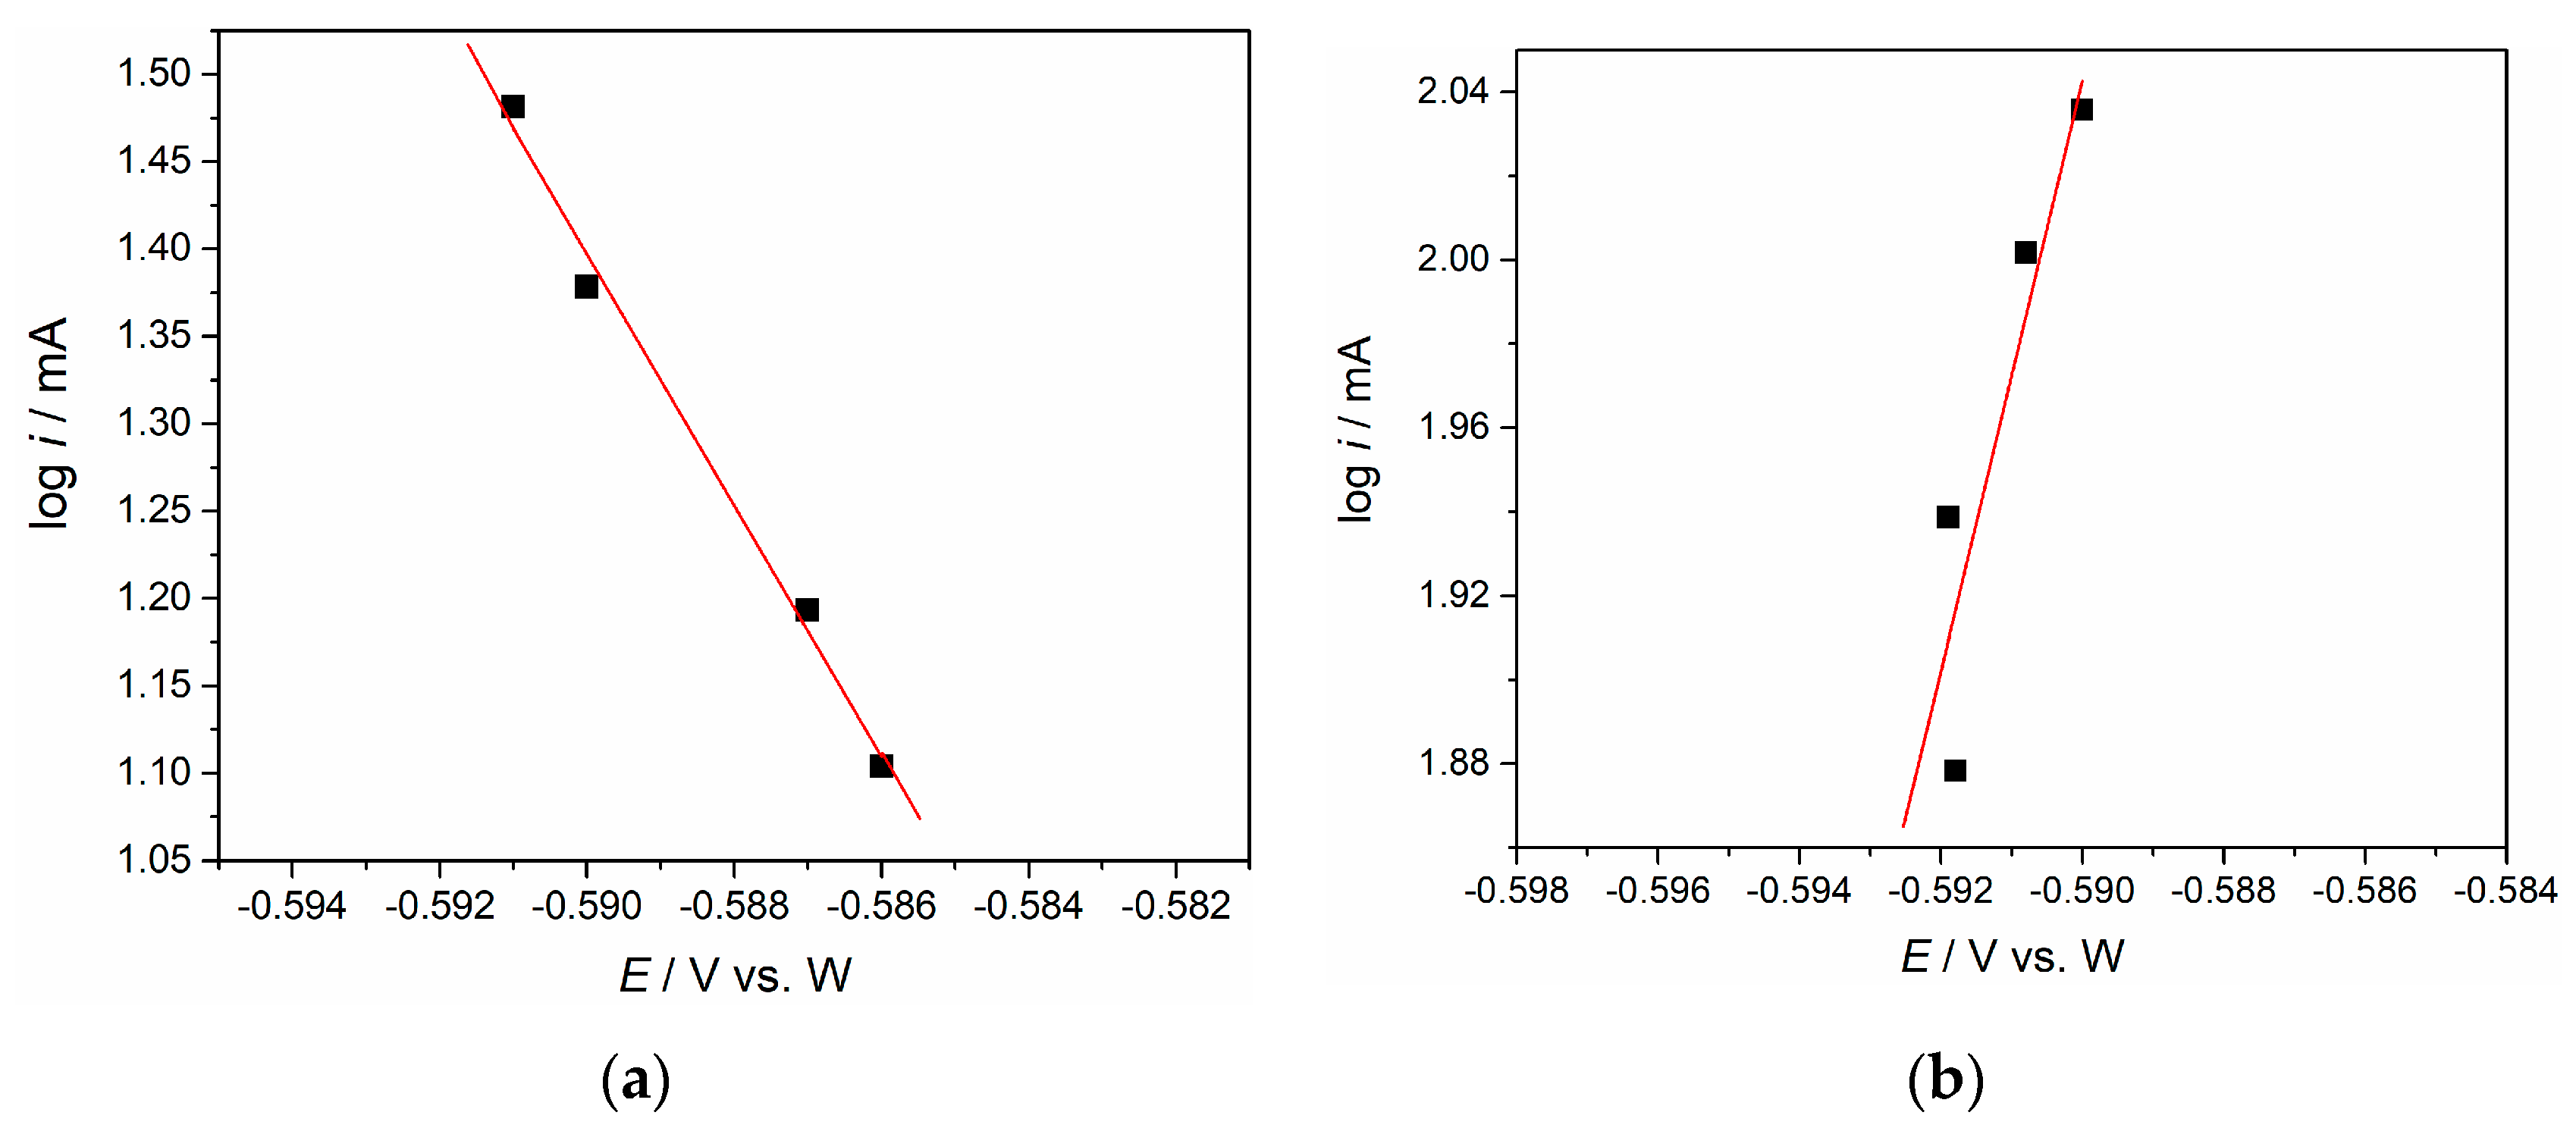
The data recorded in
Figure 3 offers the possibility of establishing the number of exchanged electrons in the reversible reactions represented by the peak pairs, I/I′ and II/II′ [
18,
34].
Figure 6 provides a graphical presentation of the function log i
P = f(E
P), obtained by correlating the values of the peak current logarithms with the peak potentials recorded for different potential scan rates in
Figure 3. The logarithms of the current density values characteristic for the cathodic (I) peak potentials recorded for four different scan rates are plotted in
Figure 6a.
Figure 6b shows the results of the same procedure applied to the anodic peak (II′). The dissolution peak was used to additionally support the claim for the reversibility of the Nd(II) ↔ Nd(0) reaction. According to the deliberations already mentioned [
18,
34], the slope K of the functions log i
P = f(E
P) graphically presented in
Figure 6 is defined as:
where α = 0.5, F is the Faraday constant, R is the gas constant, T is the absolute temperature, and z is the number of exchanged electrons. The slope for the cathodic peaks I (
Figure 6a) was 2.12, and the electron transfer number is 1.1 which is close to 1, implying electrochemical reduction of Nd(III) → Nd(II). According to the data in
Figure 6b, the slope was 3.3 and the electron transfer number is 1.73 which is close to 2, implying electrochemical oxidation of Nd(0) → Nd(II).
These results should confirm that in the system investigated, neodymium Nd(III) ions are electrochemically reduced to Nd(0) in two reversible steps: Nd(III) + e− ↔ Nd(II) and Nd(II) + 2e− ↔ Nd(0), both of which are complicated by Nd ion mass transfer and construction, as well as decomposition of their ligand shells.
Meanwhile, in this system, there are a number of possible reactions that can take part on the anode:
When a GC electrode is used, the produced oxygen species can subsequently react with carbon producing CO and CO
2. With F
− present, CF
4 and C
2F
6 gases could also be evolved from a GC anode [
22,
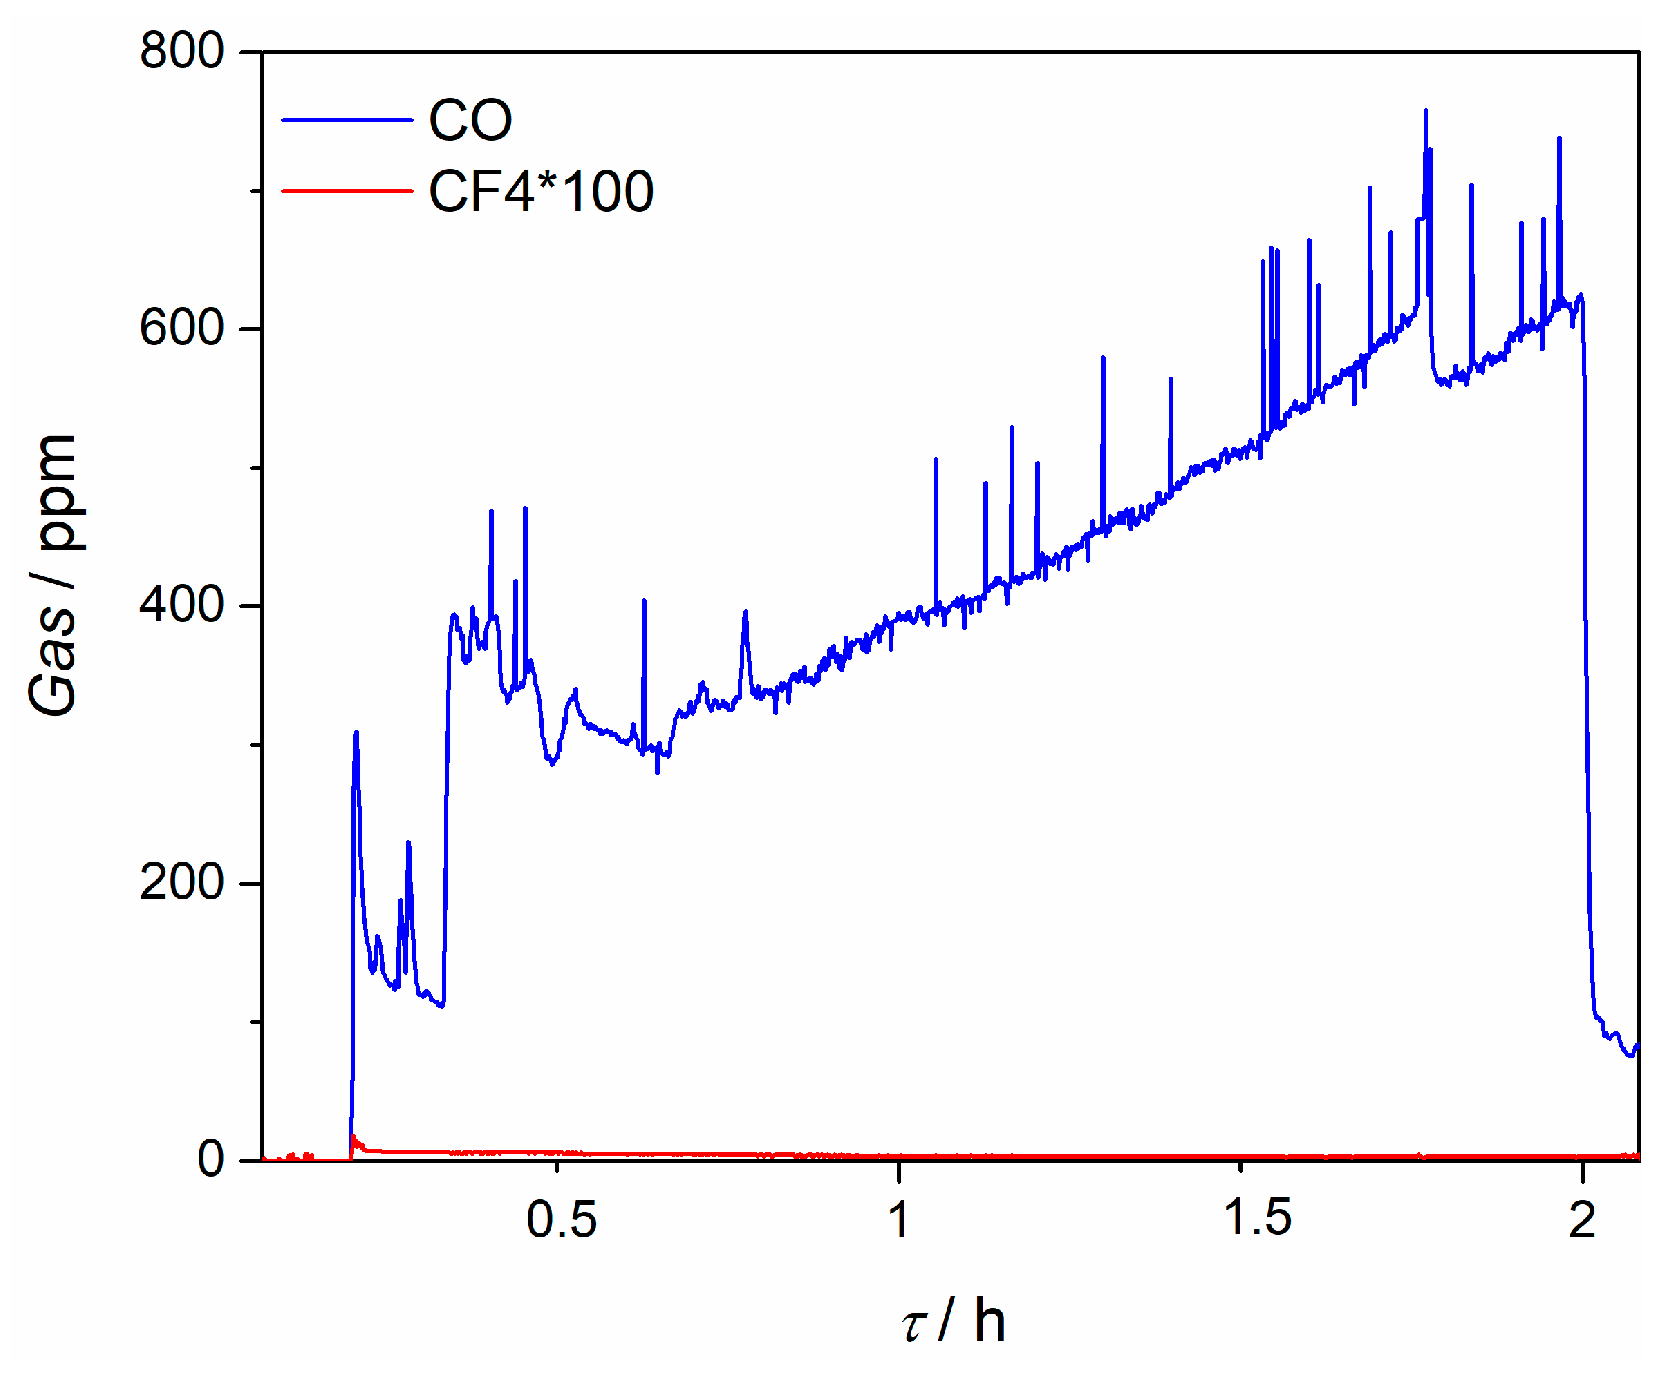
35]. Serious efforts by the workers in this field are devoted to restricting the gas evolution to only oxygen, if possible. Anodic gases observed during the neodymium depositions performed, were recorded and their evolved amounts were measured, see
Figure 7.
Carbon monoxide was observed in variable quantities, but always below 600 ppm. After a certain period of deposition time, the quantity of CO became substantially smaller, which might be attributed to the partial passivation of the anode active sites with oxygen containing ions [
22]. CF
4 was recorded in very small quantities, well below 10 ppm. These findings might be attributed to a low deposition overpotential used at the cathode side of the cell, which was matched with an equally small anodic overpotential, which was obviously more negative than the fluorine evolution potential.
It should be noted that there are several other oxidation side reactions that may take place in the electrolyte used in this work [
31]:
It can be assumed that the abundance of F
− in the vicinity of Nd
3+, produced at the anode from oxidation of [NdOF
5]
4−, leads to the formation of the [NdF
6]
3− species. Thus, the neodymium fluoride, which is consumed at the cathode through Equation (1), is eventually regenerated at the anode. Therefore, the electrodeposition of Nd proceeds at the expense of the neodymium oxide, provided that the electrolysis voltage is controlled so that no oxidation of fluoride ions is allowed. The fluoridising agent is constantly regenerated in-situ, which enables the continuous conversion of the added neodymium oxide into the corresponding fluoride [
32].
When a constant potential of −0.90 V was applied for 5400 s on the Mo working electrode in the electrolyte made of NdF
3–LiF, the XRD analysis of the electrolyte layer closely attached to the electrode, exhibited the presence of NdF
3, NdF
2, and LiF, which was very similar to the results obtained from the analysis of the NdF
3–LiF–Nd
2O
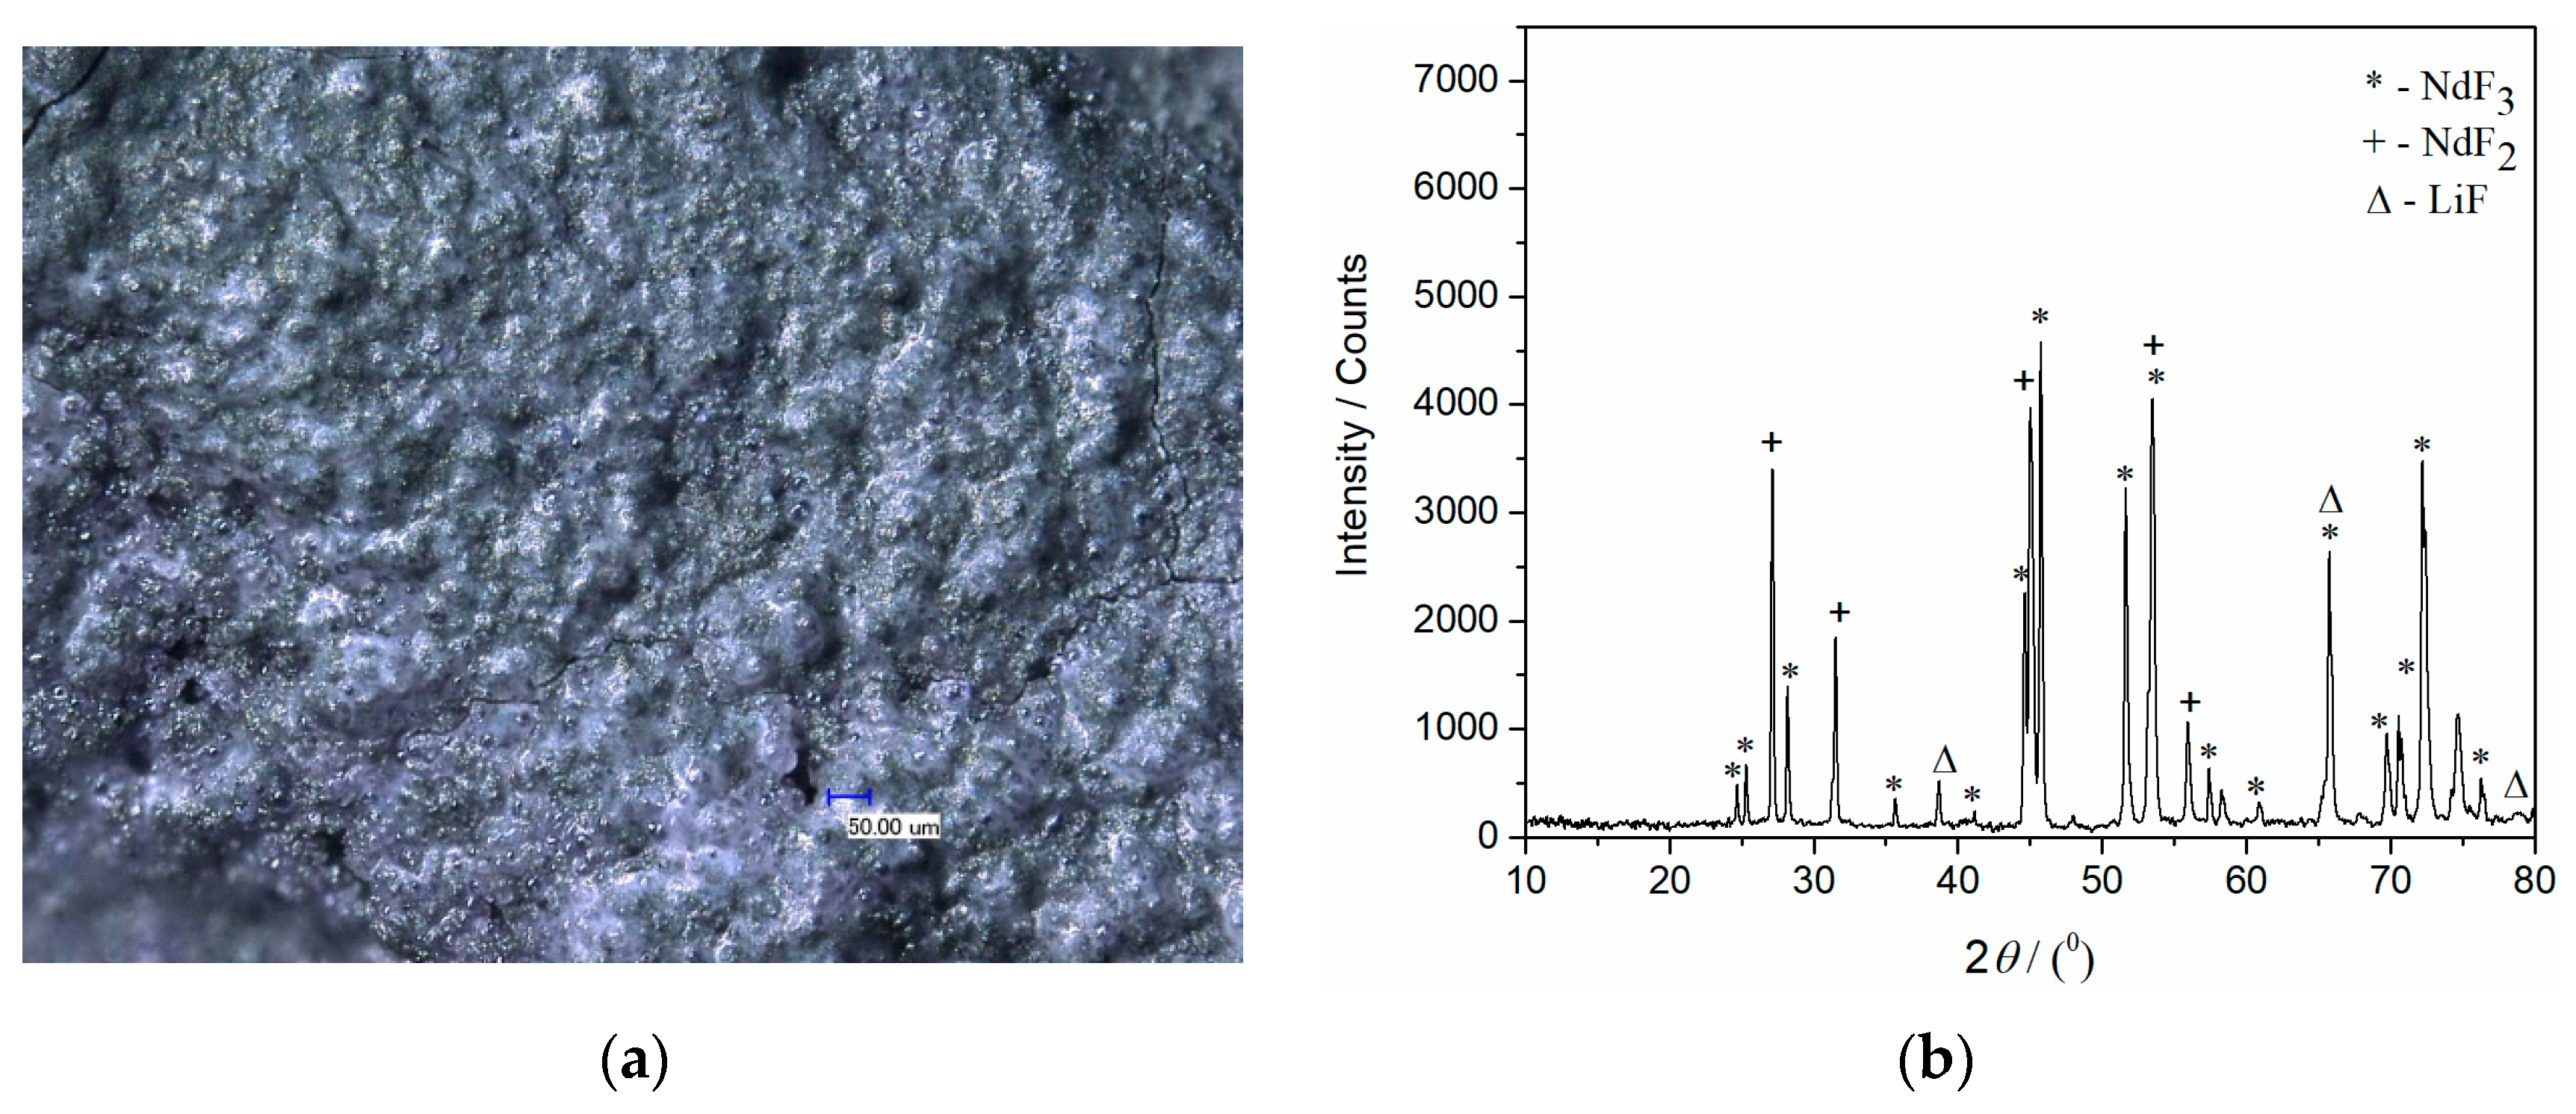
3 electrolyte layer formed on the same electrode under similar conditions (−0.80 V), shown in
Figure 8.
Considering that the applied potential was 100 mV more negative than the peak potential value of the current wave (II) in
Figure 3, which is suspected to reflect the Nd(II) into Nd(0) process, the XRD analysis of the electrolyte layer adhering to the electrode and electrode surface itself should have shown the presence of Nd. However, XRD analysis of the Mo electrode with a thin film of solidified electrolyte did not show Nd being present (
Figure 8). The XRD spectrum for the sample in
Figure 8a, obtained after deposition at −0.80 V for 7200 s, in the molten NdF
3–LiF–Nd
2O
3 electrolyte system, is exhibited in
Figure 8b. The diffraction peaks recorded at 2
θ = 24.71°, 25.31°, 28.23°, 35.67°, 41.15°, 44.61°, 45.71°, 50.67°, 51.66°, 53.63°, 56.47°, 58.38°, 65.80°, 69.78°, 70.63°, 72.53°, 75.55°, and 76.34° are characteristic of hexagonal NdF
3 [JCPDS No. 01-078-1859]. The diffraction peaks identified at 2
θ = 38.76°, 65.63°, and 78.91° are attributed to face centered cubic LiF [01-072-1538]. The diffraction peaks at 2
θ = 27.25°, 31.47°, 45.13°, 53.51°, and 56.02° should reflect face centered cubic NdF
2 [JCPDS No. 00-033-0934]. However, the peaks with slight variations in 2
θ values at 27.1°, 31.44°, 45.03°, 53.39°, and 55.99° could indicate the presence of NdOF, but such a diffractogram should show some additional peaks characteristic of NdOF also [JCPDS No. 00-050-0635]. Those additional peaks were not recorded and we selected NdF
2 as the recognised phase. Also, the presence of NdF
2 in the deposit close to the working electrode surface should reflect the disproportionate reaction between Nd
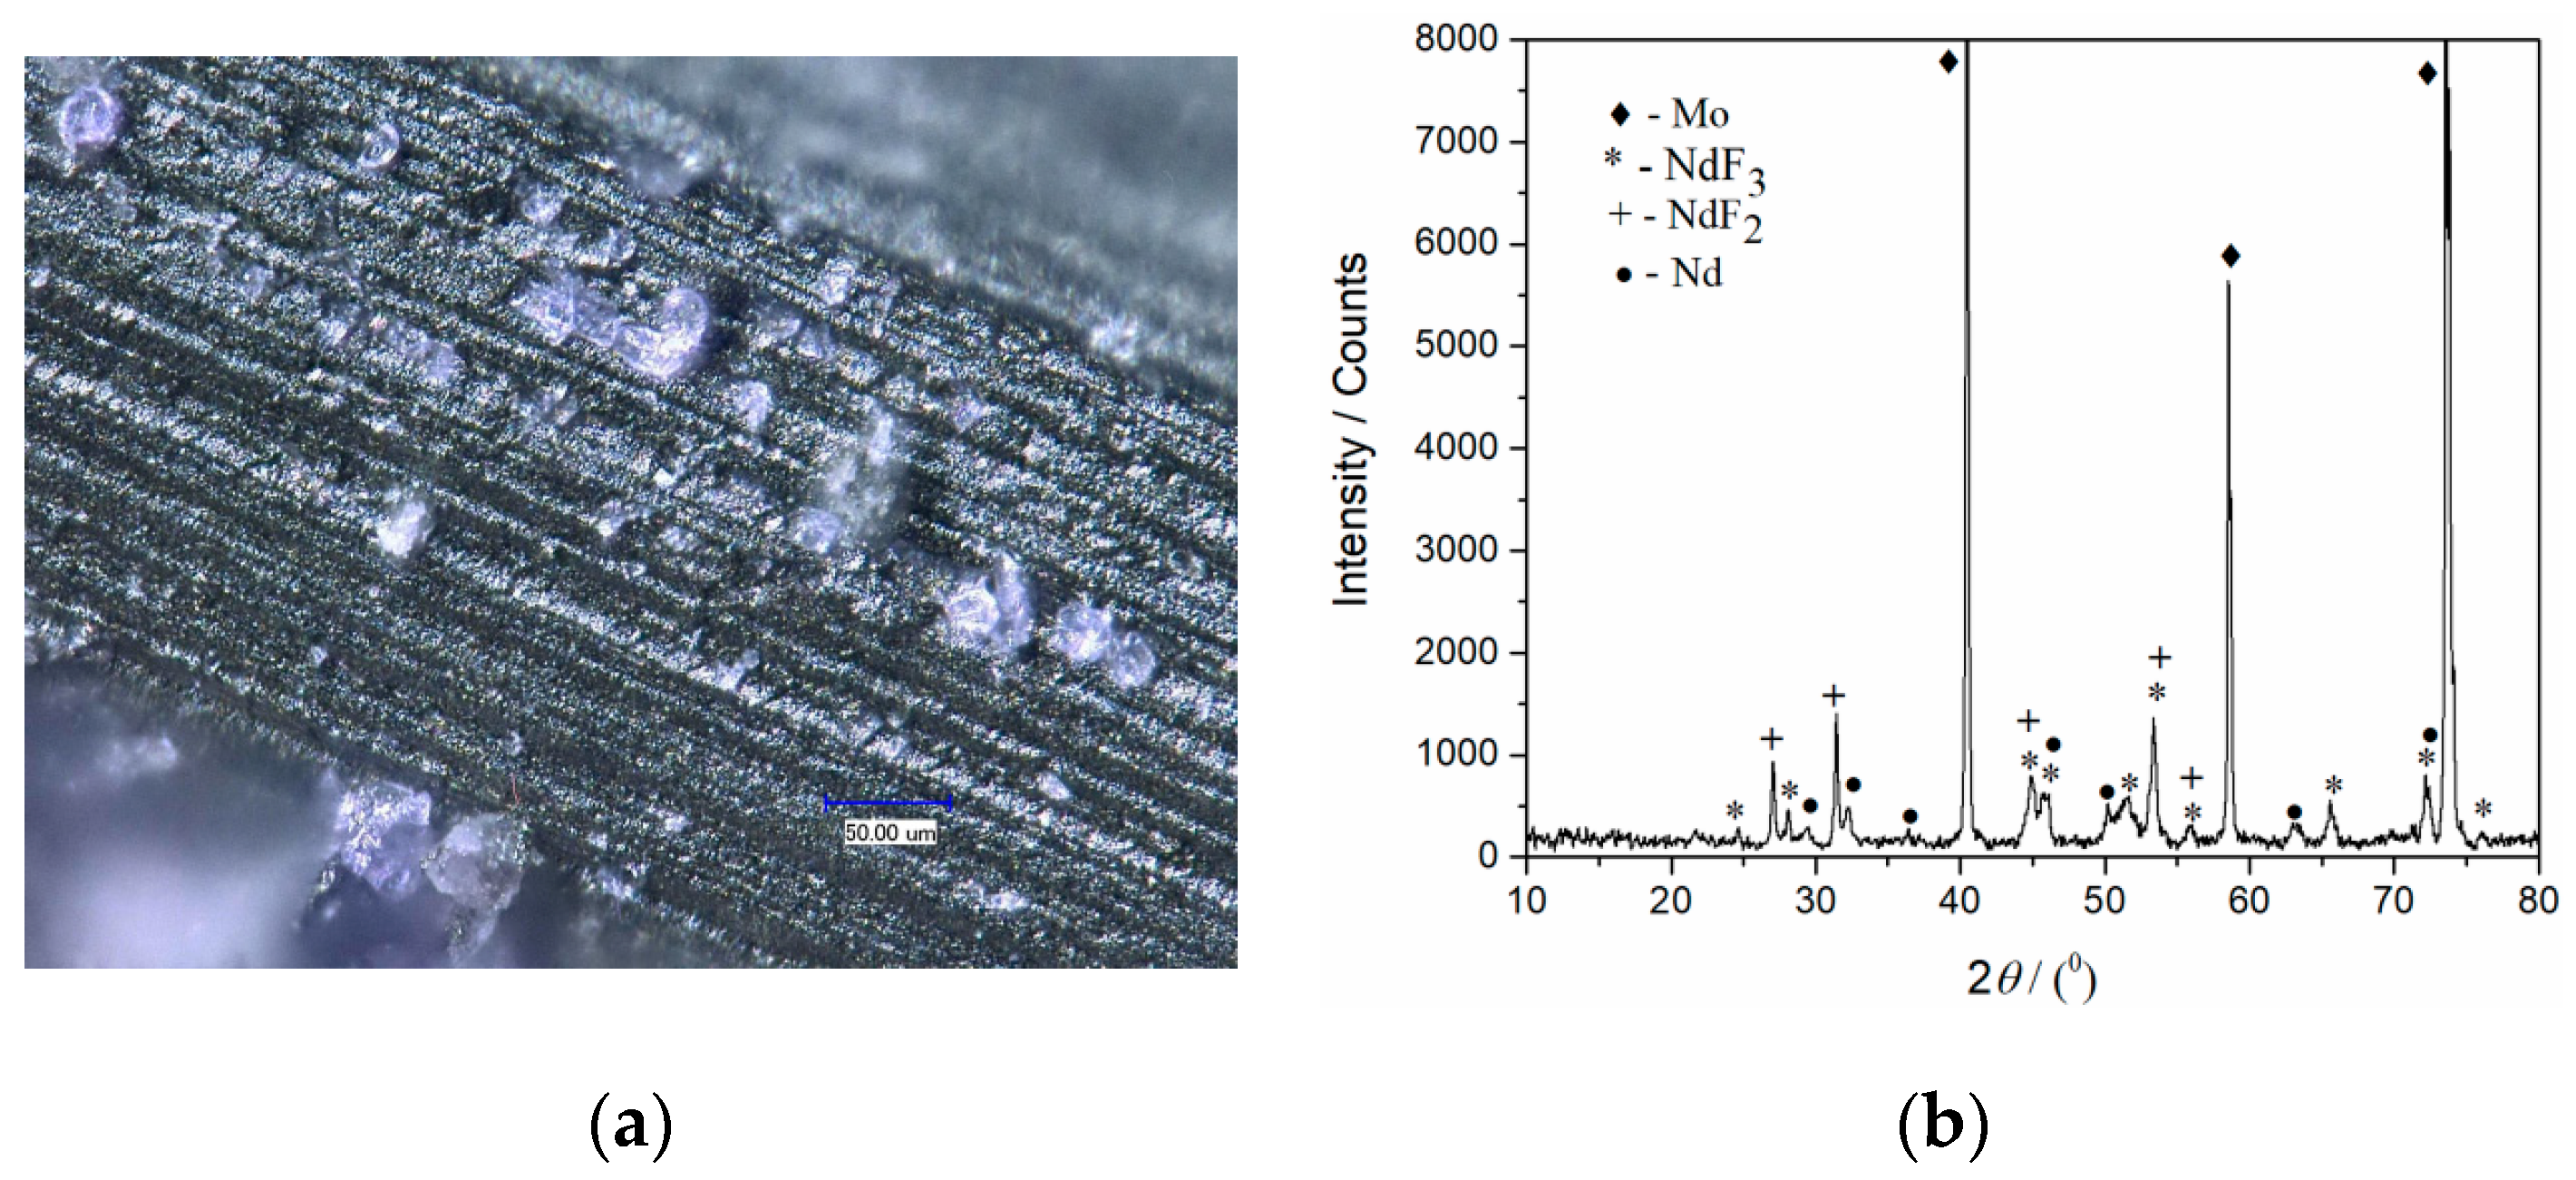
3+ and Nd metal deposited. When the solidified electrolyte seen in
Figure 8a was removed from the electrode and the Mo electrode surface in
Figure 9a and analyzed again by XRD, metal neodymium was recognized on the electrode surface in addition to Mo, NdF
2, and NdF
3 (
Figure 9b). The diffraction peaks identified at 2
θ values of 29.18°, 32.06°, 36.40°, 46.13°, 49.85°, 63.29°, and 75° are characteristic of hexagonal Nd [JCPDF No. 03-065-3424].
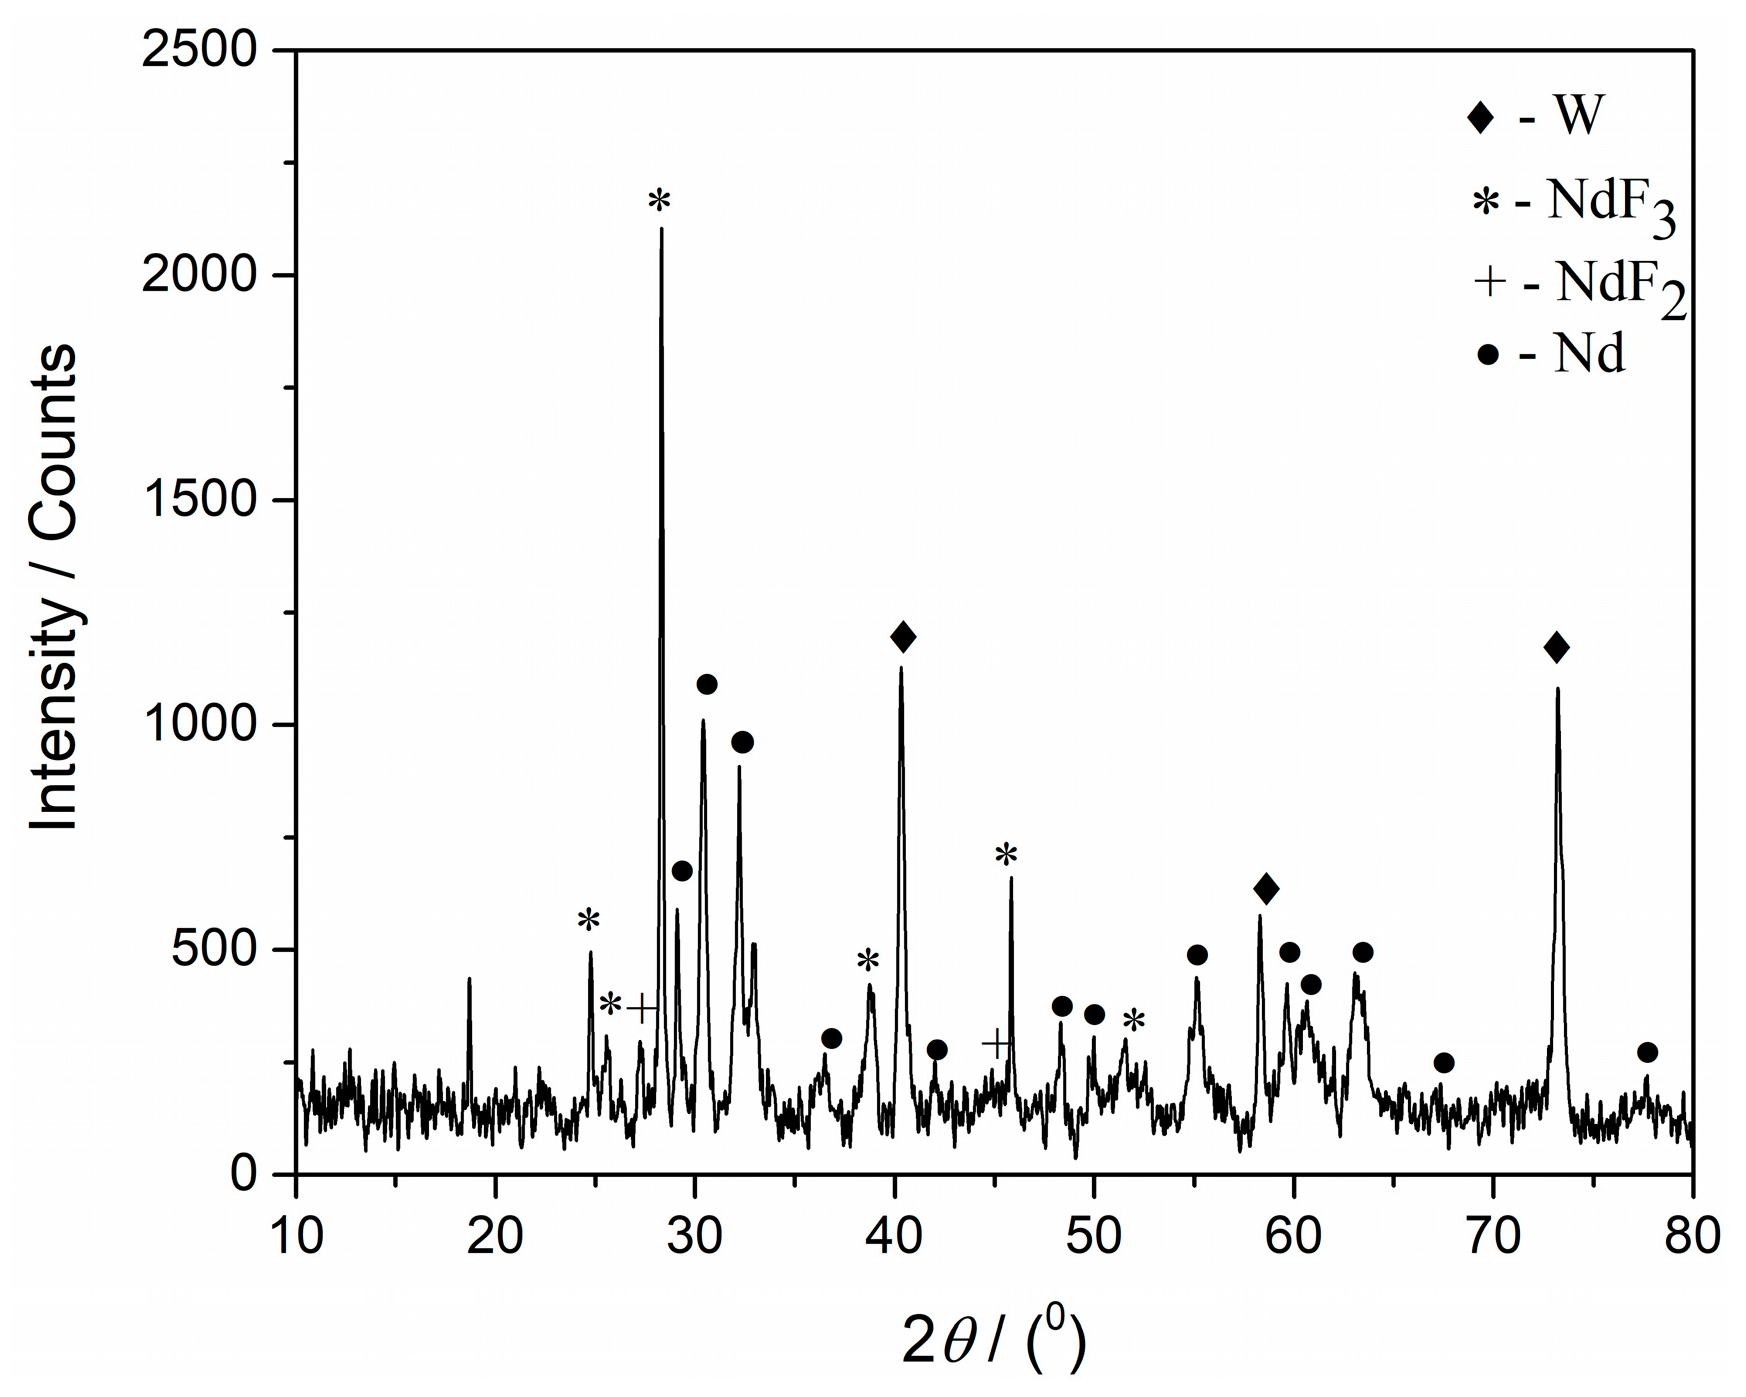
Similar results were obtained in XRD analysis of the W working electrode exposed to the similar potentiostatic regime in the same electrolyte (
Figure 10). The deposition was done in the same time period and at the potential of −0.78 V.
Neodymium metal was registered in a substantial quantity, and the peaks with 2θ values of 30.28°, 41.83°, 48.06°, 54.93°, 59.45°, 60.52°, 62.98°, 67.05°, and 77.30°, characteristic of metal Nd were recognized [JCPDF No. 03-065-3424].
References to chronopotentiometric electrodeposition found in literature describe getting neodymium metal in the form of drops found in the electrolyte after cooling off the system [
6,
20,
21,
24,
26,
31].
There is only one example of Nd metal being identified on the inert cathode (Mo and W) surface by a deposition similar to the potentiostatic deposition from a fluoride molten salt electrolyte of the same composition in the literature available [
18]. There are, however, papers showing XRD results of neodymium being deposited from fluoride melts on the working electrode, but only in the form of alloys [
6,
29,
31].
There is also one identifying Nd metal on Mo substrate obtained by galvanostatic electrodeposition [
26]. In the present literature, one can find many more references to the galvanostatic electrodeposition of Nd from fluoride melts than about potentiostatic electrodeposition [
6,
20,
21,
24,
31]. All of the above suggests that the amount of the deposited Nd metal that remains on the electrode surface is very small, and therefore it is difficult to be recognized by XRD methods when even a very thin layer of the solidified electrolyte is covering the electrode. Usually, the metal, which is in a liquid state due to the working temperature, is forced by gravitation to leave the electrode surface in the shape of drops and finds the way through the electrolyte to the bottom of the cell.
The coexistence of Nd(II) and Nd(III) in the electrolyte in the presence of metal Nd leads to a spontaneous reaction of disproportionation (comproportionation) [
18]:
This disproportionation reaction is unavoidable as soon as the first amounts of Nd metal are electrodeposited on a working electrode.
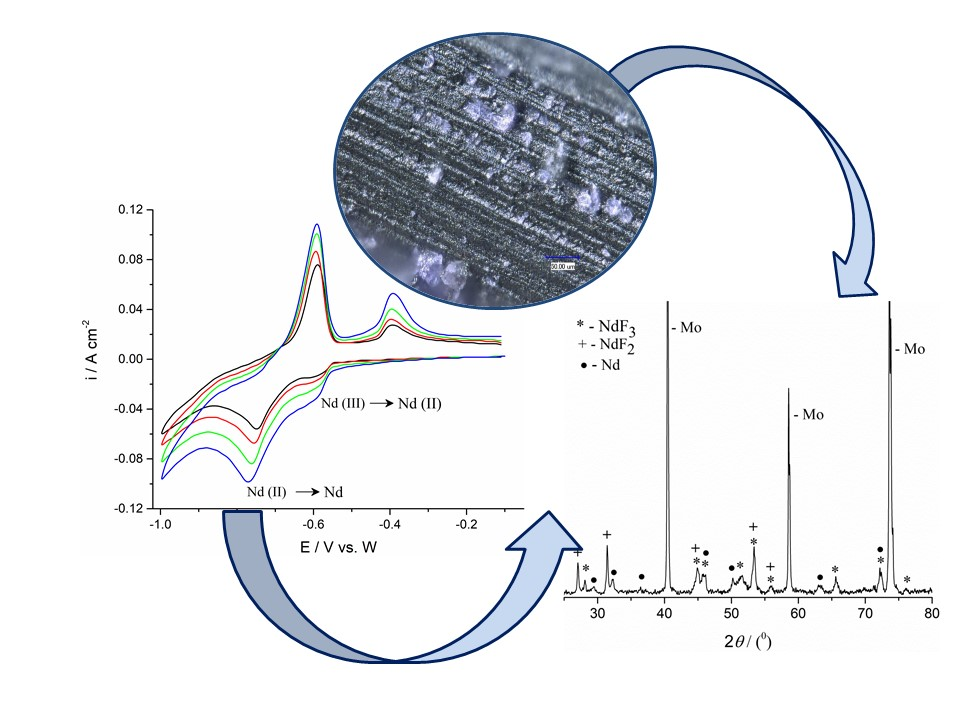
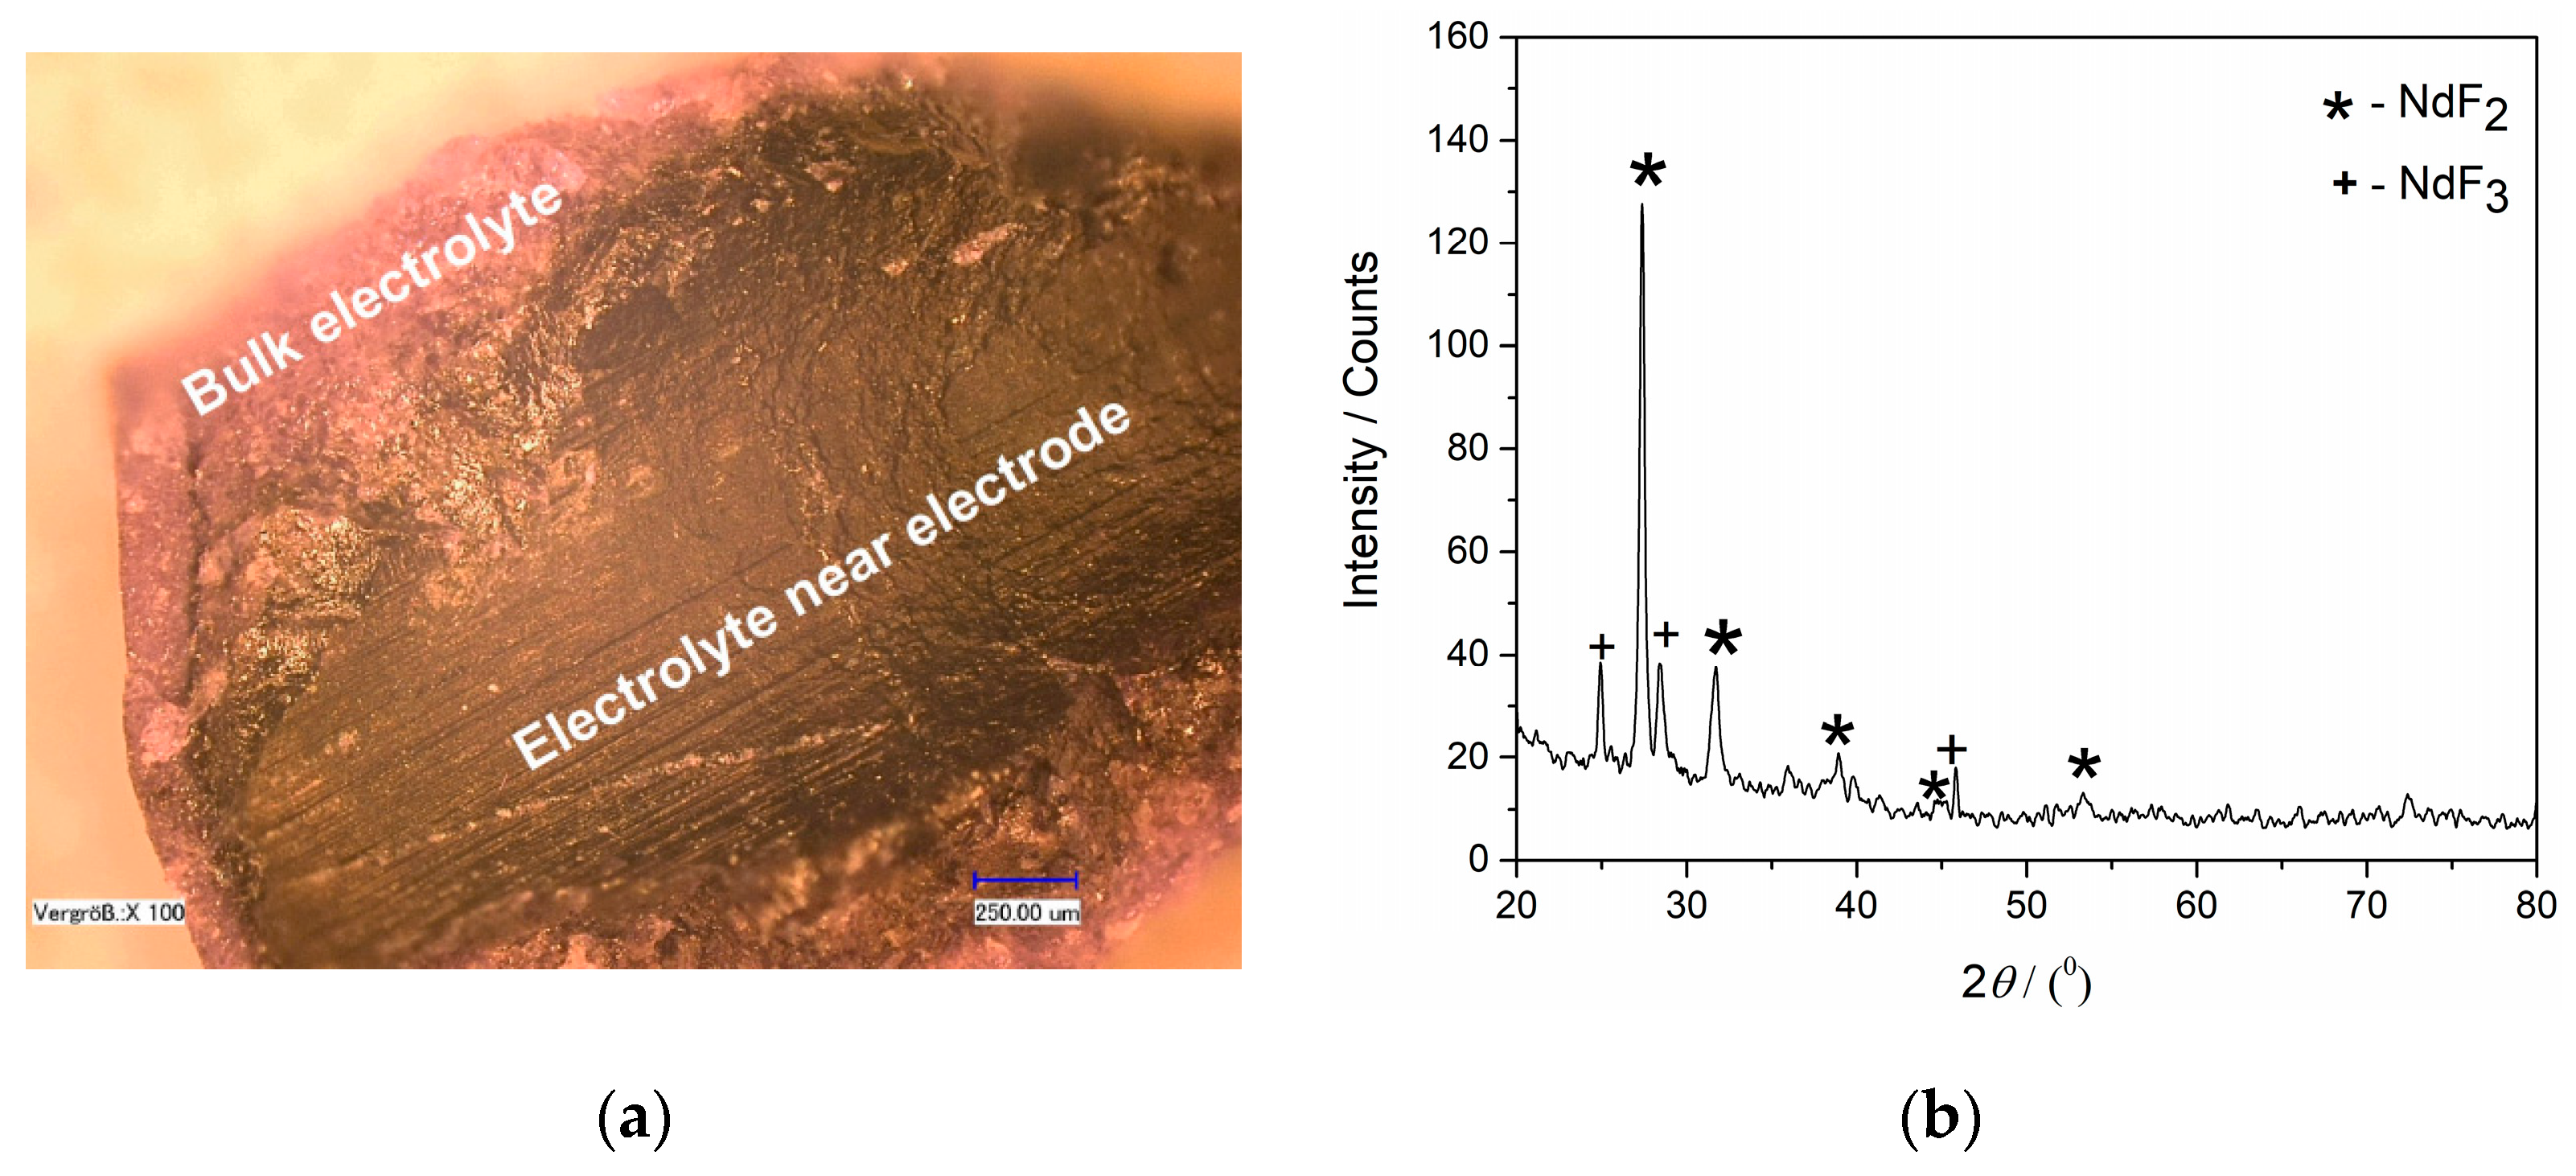
Figure 11 exhibits a micrograph of the surface of a thin layer of the electrolyte adherent to the Mo cathode, obtained after 3600 s of potentiostatic deposition. The XRD analysis revealed that the black layer, which was closely attached to the Mo WE, consists entirely of NdF
2 and NdF
3 in accordance with Equation (14). In order to downgrade the influence of the disproportionation on the Nd electrodeposition yield efficiency, metal neodymium is sometimes added to the electrolyte to replace the freshly deposited Nd in the reaction Equation (14) [
20].

 ,
, 


