Article

Recovery of Gallium from Smartphones—Part II: Oxidative Alkaline Pressure Leaching of Gallium from Pyrolysis Residue

IME, Institute for Process Metallurgy and Metal Recycling, RWTH Aachen University, Intzestraße 3, 52056 Aachen, Germany
*
Author to whom correspondence should be addressed.
Metals 2020, 10(12), 1565; https://doi.org/10.3390/met10121565
Submission received: 22 October 2020 / Revised: 19 November 2020 / Accepted: 22 November 2020 / Published: 24 November 2020
(This article belongs to the Special Issue 10th Anniversary of Metals: Metallurgy and Metal Technology)

Abstract

:
In this article, we examine the selective hydrometallurgical extraction of gallium from pyrolyzed smartphones. Gallium-enriched pyrolysis residue originating from pyrolyzed smartphones was leached using NaOH and gaseous oxygen at elevated temperatures and pressures. The high content of organic carbon in the material strongly influenced the leaching performance. Oxygen, which is indispensable for the dissolution of gallium, also oxidized the organic carbon in the feed so that CO2 was released, which had a neutralizing effect on the alkaline solution. As a result, the CO2 formation complicated the accurate process control as the leaching temperature increased. The highest gallium yield of 82% was obtained at 180 °C, 5 g/L NaOH and 5 bar oxygen pressure. Decreased temperatures, NaOH concentrations and oxygen pressures resulted in lower leaching yields but with a higher selectivity for Ga. Temperatures higher than 180 °C resulted in extensive carbon oxidation, NaOH consumption and the coextraction of Cu and Ag. We propose that those conditions also facilitated the formation of water-soluble organic compounds, which would also influence the metal dissolution.

1. Introduction

The high complexity of electronic waste (e-waste) is a major constraint in a holistic recycling process—particularly regarding the recovery of ignoble trace elements [1,2]. However, the amount of globally generated waste electric and electronic equipment (WEEE)—exhibiting a value of 53.6 Mt in 2019—is expected to increase further [3]. Therefore, proper recycling solutions are required to maximize the recovery rate of all materials/elements in the input material and minimize environmental impacts through landfill or other harmful practices.
In a previous work [4], smartphones were identified as a suitable material for scientific activities that aim for recycling solutions with the potential to overcome the issues of highly complex waste streams. As a first approach, a combination of thermal treatment (pyrolysis) and mechanical processing was performed, resulting in the production of a carbon-rich fraction with a grain size of less than 500 µm. In addition to carbon and minerals, these pyrolysis fines contain increased amounts of a broad range of both base and trace metals. With respect to gallium, neodymium, dysprosium and gold, a significant enrichment of these elements in the fines was achieved. Figure 1 illustrates the chain of thermal and mechanical processes [4].
After a brief metallurgical assessment, hydrometallurgical processing is recommended as an appropriate way to extract gallium selectively from the fine-sieve fraction. Mineral acids (HCl, H2SO4, and HNO3) can dissolve gallium but do not fulfill the required selectivity. Hence, alkaline pressure leaching appears to be a promising procedure for selective Ga extraction [4], thus, this particular matter is examined in the present article.

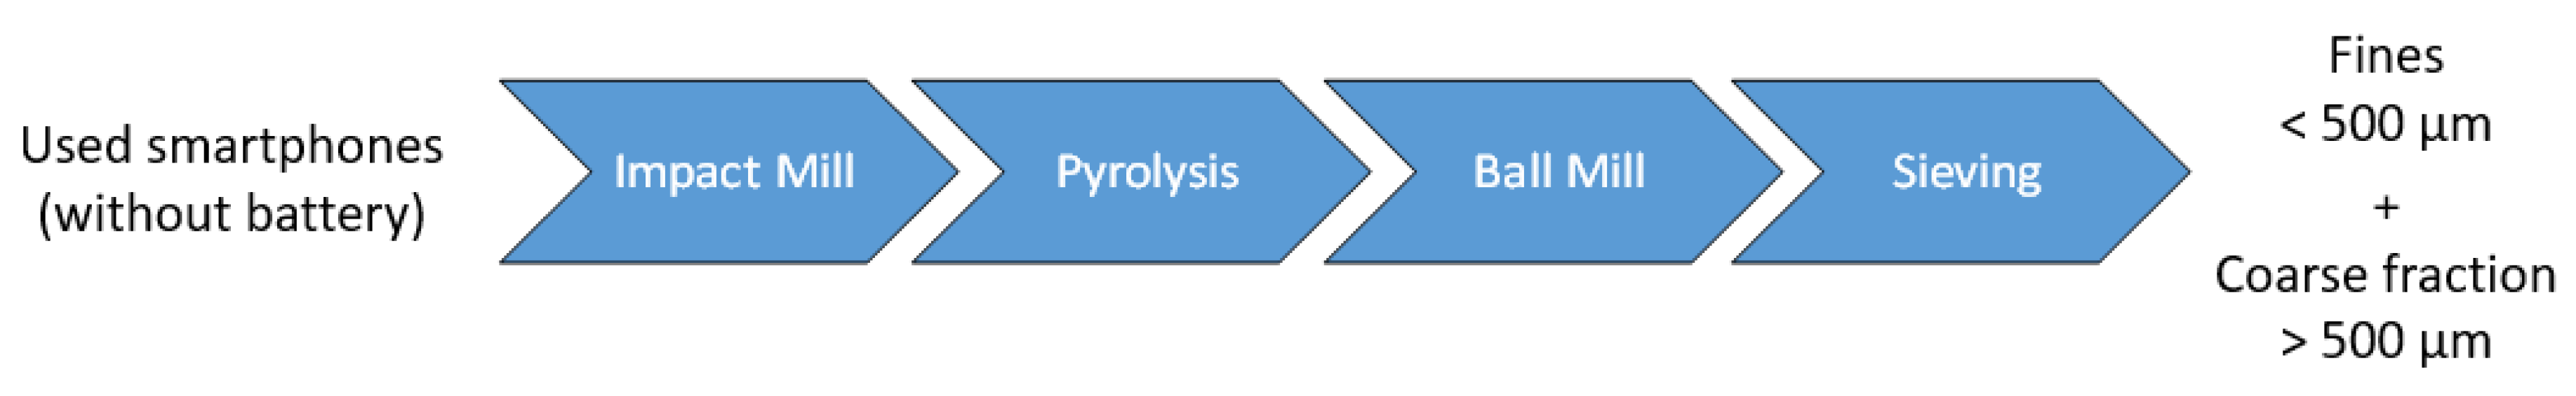
2. Characterization of the Input Material

The metal content in the fines (Figure 1) was identified by digestion in both aqua regia, and HNO3, followed by ICP-OES analysis (Perkin Elmer Optima 8300, Waltham, MA, USA). Table 1 depicts the results of the elemental analysis.
The silicon listed in Table 1 is present as SiO2, which originates from glass fibers in the printed circuit boards and glass layers from the displays. The same is expected for aluminum which is present as Al2O3.
In addition to metal analysis, a measurement of the elemental carbon, inorganic carbon, and organic carbon in the fines was performed by means of a multiphase carbon determinator (LECO R612, Leco Instrumente GmbH, Mönchengladbach, Germany). The carbon contents are shown in Table 2. Clearly, most of the carbon in the material is still incorporated into organic structures, although the material has previously undergone pyrolysis.

3. Previous Research and Theoretical Background

As a result of the chemical characterization, we concluded that the fines, which were obtained from thermally and mechanically treated smartphones, exhibited an extremely complex composition of metallics, non-metallics, and even organics. With respect to the aspired alkaline pressure leaching of gallium, no examples that discussed the handling of this kind of input material were found in the scientific literature. To accomplish any theoretical background, it is necessary to look at several related research fields, which include parts of the present question. Eventually, three basic research fields were identified, each field provides relevant information from the scientific literature:
  • the leaching/etching of GaAs semiconductors and the importance of pH and redox potential,
  • the alkaline gallium extraction from Bayer liquor, and
  • the alkali-oxygen oxidation of lignite.
The importance of each research field is examined in the following.

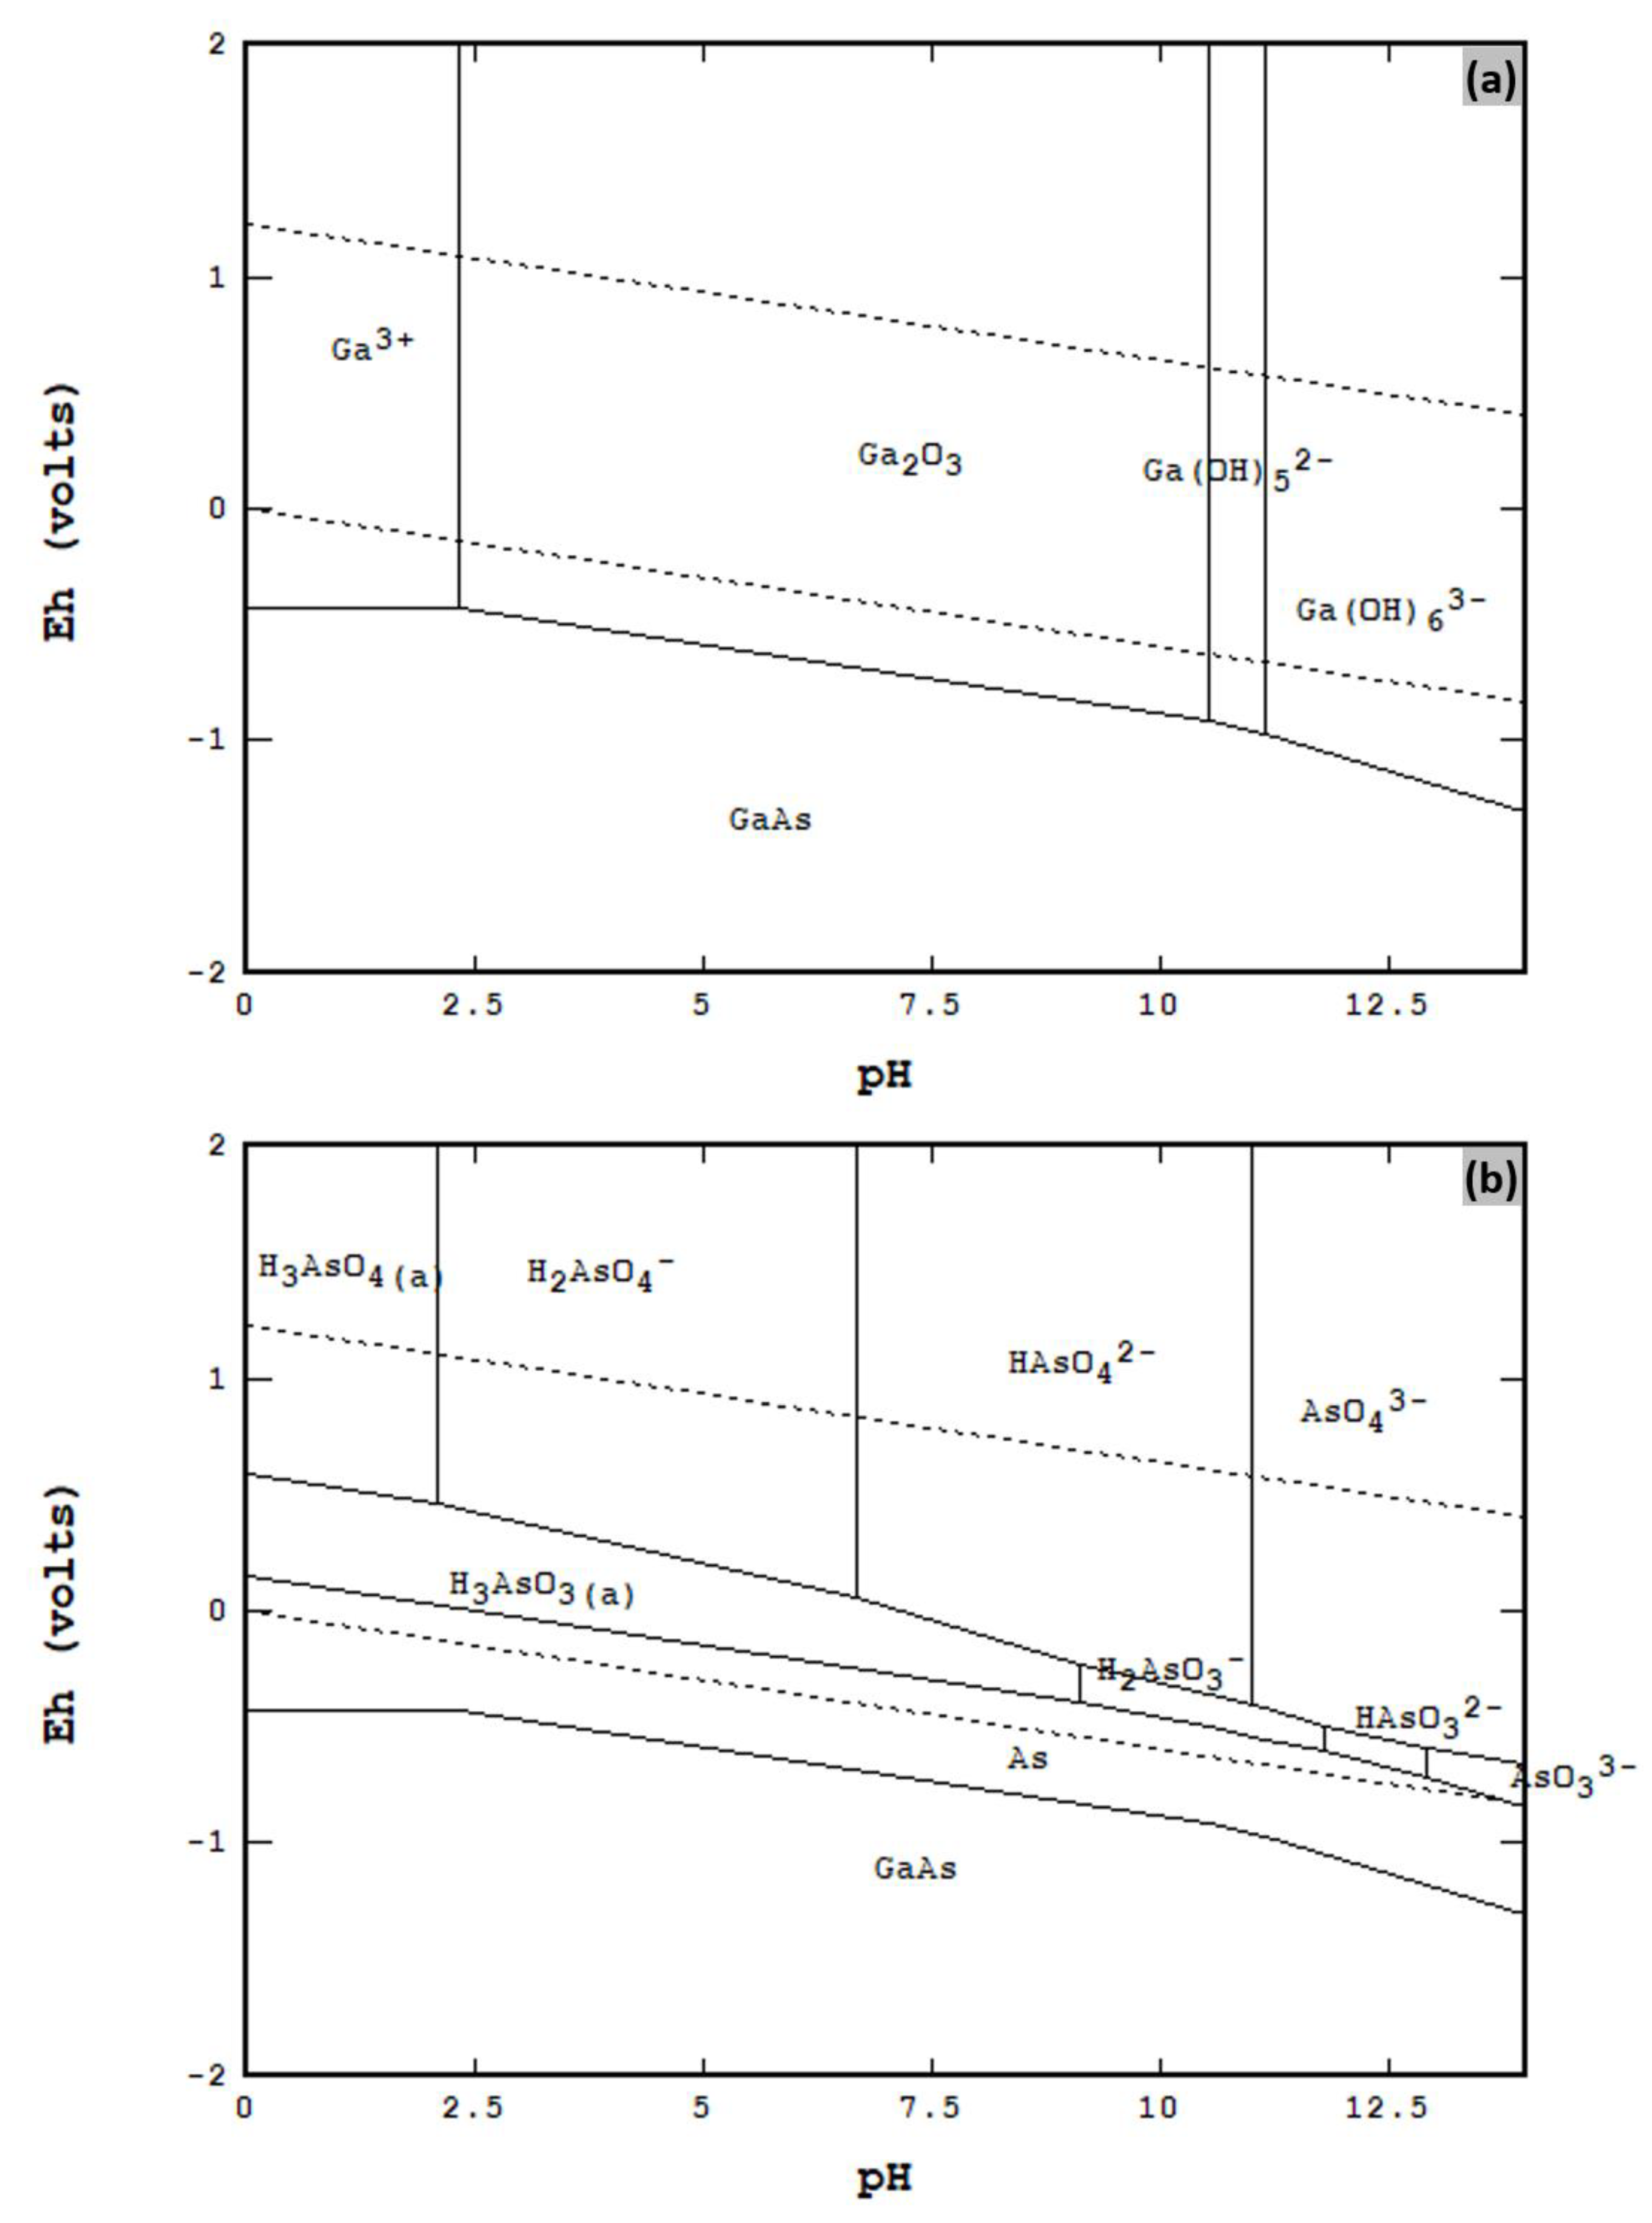
3.1. Leaching/Etching of GaAs Semiconductors and the Importance of the pH and Redox Potential

Since gallium is present as GaAs in smartphones and also in the pyrolysis fines (the present input material), the required conditions for a successful dissolution of Ga and GaAs are discussed. As a first approach, the Pourbaix diagrams (E–pH diagrams) of Ga and As were calculated and plotted with STABCAL [5] using the database created by Naumov [6].
Figure 2a provides information on gallium solubility between pH 0 and 14 whereas Figure 2b is associated with the stable As compounds. The calculations refer to a system consisting only of Ga and As and a GaAs concentration of 10−4 mol/L. The temperature was set to 25 °C due to the unavailability of the thermodynamic data. With respect to Figure 2b, arsenic forms soluble compounds at any pH if the potential is higher than 0.2 V, which means that oxidizing conditions must be maintained. Unlike arsenic, gallium is oxidized to insoluble gallium oxide between pH 2.5 and 10.5, at which a minimum potential of −0.4 V is required. At a low pH, Ga3+ is the predominant species whereas pH values higher than 10.5 cause the generation of Ga(OH)52− and Ga(OH)63−.
Similar Pourbaix plots for GaAs were obtained by Liu [7] and Price et al. [8], who both used different activities and databases, and thus produced plots that deviate from Figure 2. The major difference to mention is the occurrence of Ga(OH)52− in the E–pH plot of gallium. Neither Liu nor Price et al. obtained this species.
In another publication by Sipos et al. [9], the authors put the general existence of Ga(OH)63− and other higher hydroxo complexes, such as Ga(OH)52−, into question as only the tetrahedral hydroxo complex Ga(OH)4− was identified in strongly alkaline, highly concentrated gallate solutions.
Despite this fact, all calculations and studies agreed, that GaAs can be decomposed by oxidation even in a neutral solution, because arsenic is able to form water-soluble compounds. Although gallium can be oxidized as well, it is not dissolved due to passivation by formation of solid Ga2O3. However, if the pH is increased to values higher than 10, Ga2O3 can be brought into solution. Hence, gallium is the limiting component in the system and requires both oxidizing and sufficiently alkaline conditions, which is also in accordance with Pourbaix [10].
A kinetic study on the dissolution of GaAs during the etching of semiconductors was performed by Kelly et al. [11]. In their research, they reported that the etching kinetics strongly depend on the supply of oxidizing agent (H2O2) as well as the OH concentration. In other words, the dissolution kinetics are controlled by the oxidation and desorption of reaction products. At pH values below 10, passivation occurred through insoluble gallium oxides and hydroxides due to their low solubility at low pH levels.
Ramos-Ruiz et al. [12] investigated the release of soluble gallium and arsenic from disposed GaAs into soil. In contrast to Kelly et al., Ramos-Ruiz et al. used gaseous O2 to oxidize GaAs. The authors found that an increase in the O2 concentration in the gas phase strongly facilitated the corrosion and dissolution of gallium and arsenic. They also confirmed the beneficial influence of a higher pH on the release of soluble species of both elements. Even at a pH between 6.7 and 8.5, a remarkable gallium dissolution was observed, which disagrees with their previous thermodynamic calculations as well as the Pourbaix plots in Figure 2. The authors supposed that bicarbonate in the solution could have acted as a complexing agent for gallium so that it also dissolved at a relatively low pH.

3.2. Primary Gallium Extraction from Bayer Liquor

In consideration of industrial-scale production, the recovery of gallium from Bayer liquor parallel to alumina production is the predominant procedure [13]. From the economic point of view, existing, well-known technologies are of value over developing a completely new process from scratch. The studies presented in Section 3.1 refer to the leaching of pure GaAs. However, the input material in this research contains only traces of the latter, whereas a major proportion consists of minerals, particularly SiO2 and Al2O3; therefore, experience in the field of primary gallium processing is required.
Several processes are available to purify Bayer liquor and finally extract gallium—either as hydroxide or pure metal. Apart from ion exchange (which is the most widely used extraction method) the so-called Pechiney Process (based on fractional carbonization) represents an alternative route [14]. This option is more environmentally friendly and cost-effective, but it also requires numerous process steps, making this procedure complex. By injecting gaseous CO2 into the highly alkaline sodium aluminate solution, the pH is lowered, resulting in the stepwise precipitation of solid compounds according to their solubility [15,16]. The neutralizing role of CO2 can be exemplified by the following reactions [13]:
CO 2 + 2   NaOH     Na 2 CO 3 +   H 2 O
CO 2 + Na 2 CO 3 +   H 2 O     2   NaHCO 3  
According to Xu et al., Al(OH)3 is precipitated at pH 10.6, whereas Ga(OH)3 precipitates at pH 9.4–9.6 [17]. Due to the isomorphic similarity of gallium and aluminum and the subsequent substitution of Al3+ by Ga3+, co-precipitation cannot be avoided, and thus the precipitate consists of both Ga(OH)3 and Al(OH)3 [13]:
Na [ Al ,   Ga ] ( OH ) 4   [ Al ,   Ga ] ( OH ) 3 + NaOH
Hence, the leaching and precipitation must be repeated to achieve a complete separation of gallium and aluminum. Co-precipitation of gallium and aluminum during carbonization was also observed by Lilia et al. [18].
Apart from primary processing, the process of alkaline leaching and precipitation through CO2 was studied for gallium recovery from industrial by-products. Wen et al. [19] investigated extraction from corundum flue dust and found that increasing the alkali concentration and temperature facilitated gallium leaching. In this work, the concentration of NaOH was varied from 35 to 55 wt.% and maximum temperature was set to 90 °C. Depending on alkali concentration, the liquid to solid ratio had a considerable influence on the leaching efficiency of gallium. Subsequent purging with CO2 resulted in complete gallium precipitation. Another study by Abdulvaliyev et al. [20] focused on the treatment of coal fly ash red mud originating from an alumina refinery plant. Prior to CO2 carbonization, silica was removed by the addition of lime milk (hydrogarnet process). During the initial leaching, the temperature (260 °C) and the Na2O concentration (240 g/L) were adjusted to relatively high values. Finally, gallium was successfully precipitated via CO2 injection.

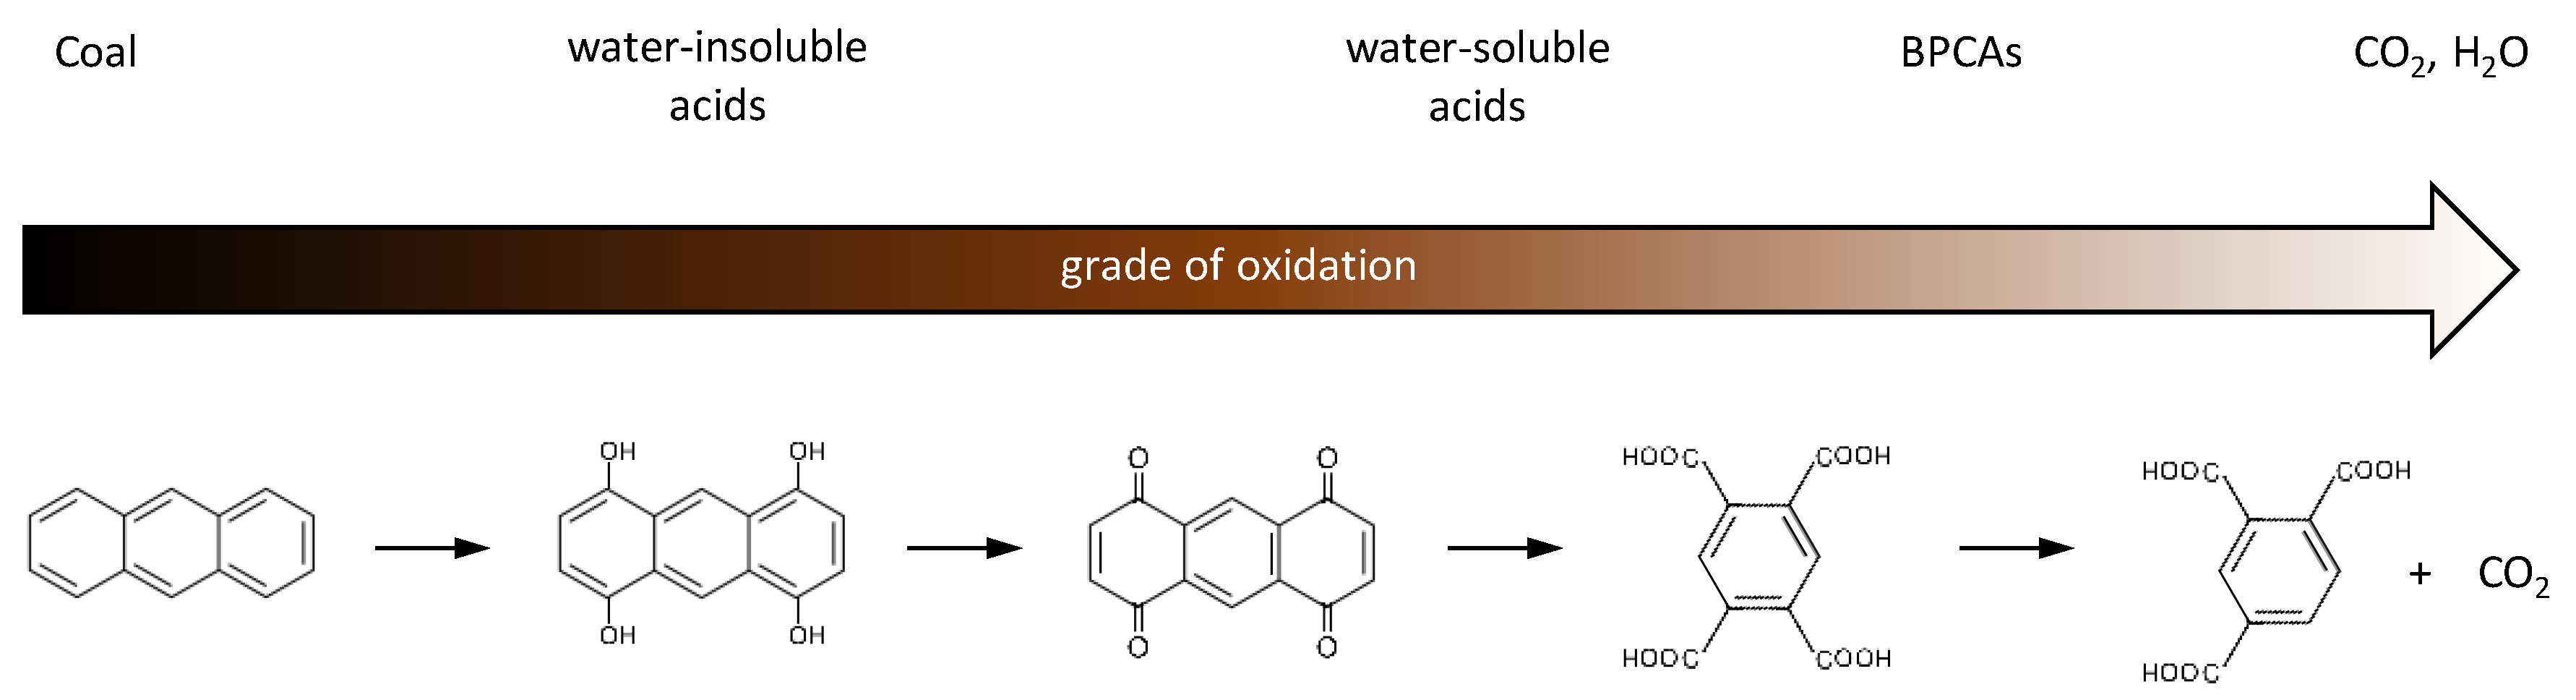
3.3. Alkali-Oxygen Oxidation of Lignite

The results of the carbon analysis demonstrated a significant share of organic carbon in the fines, which is intended to be leached. Regarding the fact that the material will be exposed to an oxidative pressure leaching at elevated temperatures, the role of carbon in the system is discussed in the following.
Aqueous oxidation of carbon and hydrocarbons is a matter of interest in the field of lignite processing where it can be applied to produce several kinds of aliphatic and organic acids. Due to the occurrence of aromatic compounds in lignite, high-temperature alkali–oxygen oxidation enables the decomposition and oxidation of those structures. The process is executed at elevated temperature and pressure using NaOH and gaseous oxygen or other oxidizing agents. Reaction products under these conditions are diverse benzene polycarboxylic acids (BPCAs) and aliphatic acids such as oxalic acid or acetic acid. These products are further used in the chemical industry [21,22,23]. The general evolution of reaction products during the alkali–oxygen oxidation of coal is depicted above the arrow in Figure 3. Underneath the arrow, the oxidative decomposition of anthracene is pointed out as an example [23].
Numerous scientific studies have been conducted to explore the relations between the input material, process conditions, and reaction products.
Wang et al. [23] conducted an extensive study of alkaline lignite leaching by adjusting the alkali concentration (25–300 g/L), oxygen pressure (40–60 bar), temperature (220–260 °C), and reaction time (10–60 min). They found that an excess of NaOH effectuates the salting-out of humic acids.
High temperature, oxygen pressure, and reaction times cause the overoxidation of formed BPCAs which correlates with elevated CO2 formation (Figure 3). As already mentioned in Section 3.2, the purification and, according to Equations (1) and (2), the formation of CO2 resulted in high alkali consumption.
In a subsequent study by Wang et al. [24], these findings—particularly the role of alkali concentration—were confirmed. The promoting effect of the higher ion concentration on salting-out was proven as well.
Kapo and Calvert [25] performed a similar series of experiments under milder conditions. The temperature was adjusted between 60 and 110 °C, the oxygen pressure was set below 10 bar, and the NaOH concentration was up to 47 g/L. The authors also concluded that the ionic strength and NaOH concentration played a key role in the system. Ionic strengths higher than 0.5 led to flocculation and the formation of insoluble humic acids (salting out).
Miura et al. [26] and Mae et al. [27] successfully oxidized lignite with H2O2 at 80 and 60 °C and atmospheric pressure. Their results demonstrate that this approach enabled the oxidation of organic compounds, resulting in the formation of small aliphatic acids such as oxalic acid, formic acid, and acetic acid.
This aspect was further investigated by Karnowo et al. [28], who measured a significant drop of pH after coal leaching through H2O2. They also stated the ability of both solid and dissolved carboxylic species to build complexes with metallic cations.

4. Innovative Approach of this Work

The aim of this work was to determine if there is a possibility to selectively extract gallium from a fine pyrolysis residue via alkaline leaching. According to the preceding literature review, oxidizing conditions and a high pH are required to successfully corrode GaAs and transfer gallium into solution. However, as described in Section 3.3, an oxidizing environment also promoted the oxidation of (organic) carbon in the fines, resulting in the formation of carboxyl and CO2. Both can lower the pH, and thus decrease the gallium solubility in situ. This topic has not been previously investigated.
Hence, several series of leaching experiments were performed by varying the NaOH concentration, initial oxygen pressure, temperature, and reaction time. Indeed, the liquid–solid ratio and agitation also have an impact, however, examining these factors would have exceeded the extent of this paper.

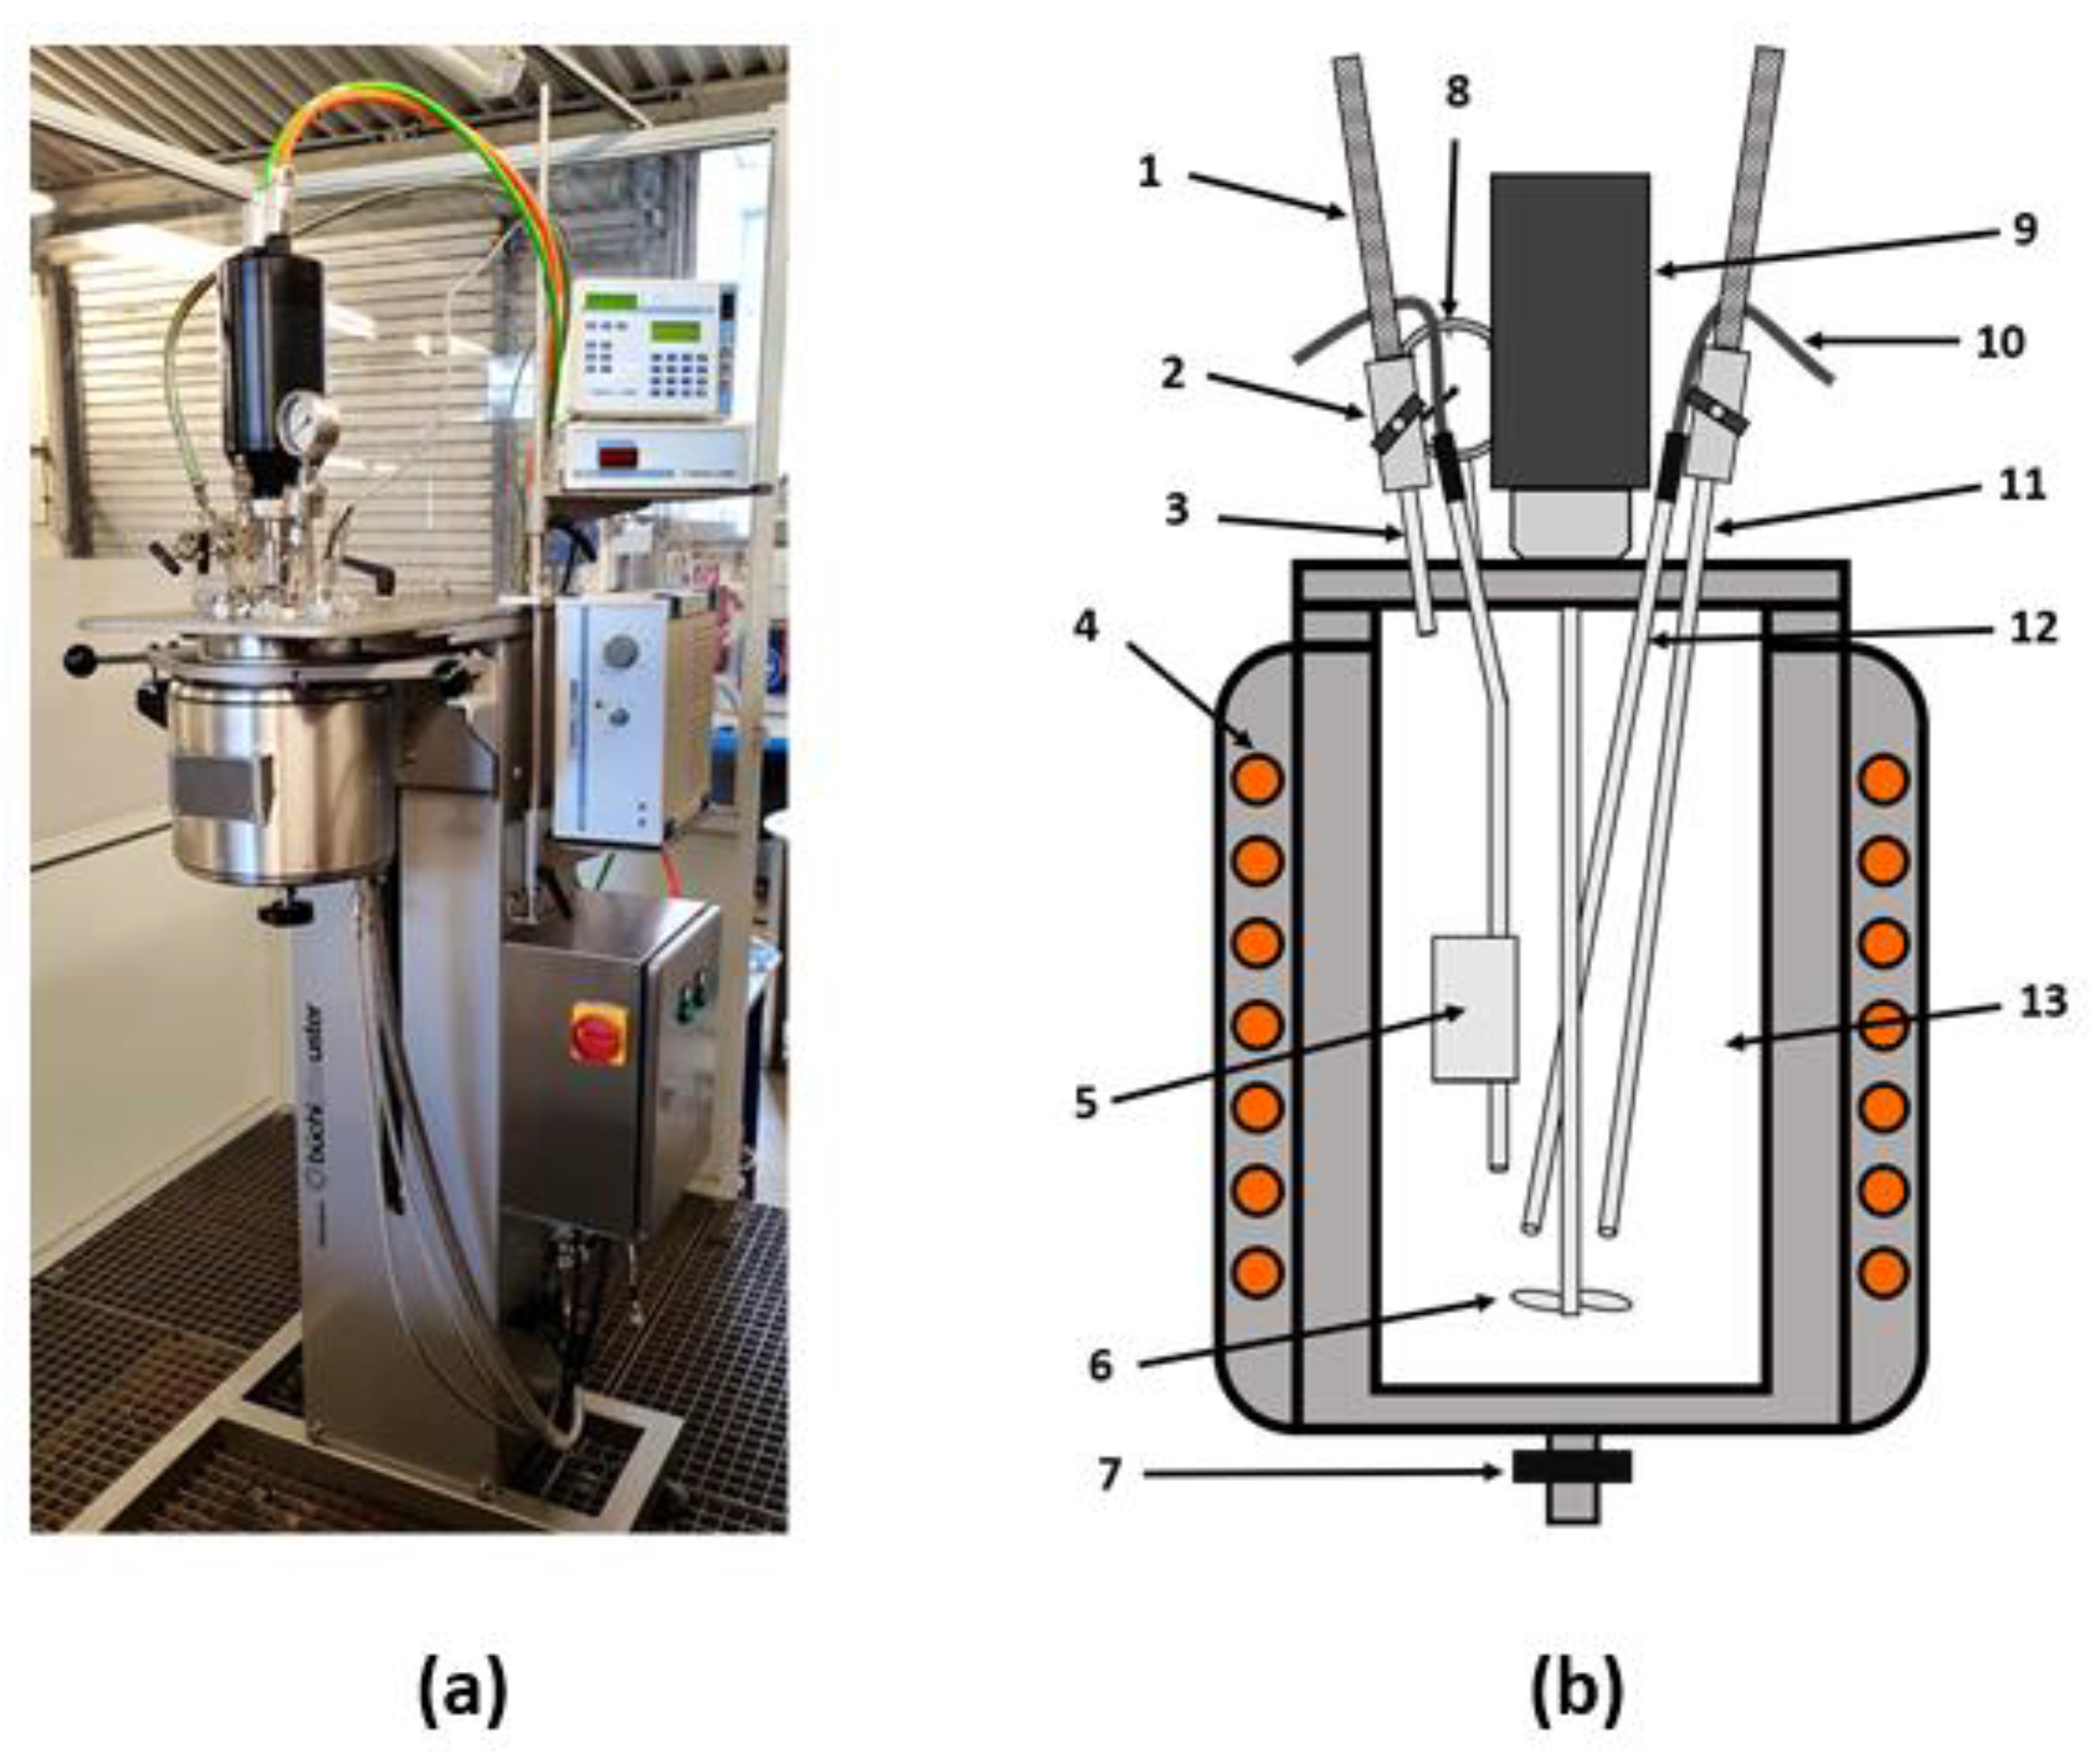
5. Experimental and Analytical Methods

Leaching experiments were performed in a high-pressure autoclave (Kiloclave Type 3, Büchi AG, Uster, Switzerland) (Figure 4). The reaction vessel was made of highly corrosion-resistant haste alloy and held an inner volume of 1 L. As can be seen in the cross-section of Figure 4, the lid was equipped with several sensors and feed lines. For adjustment of the favored gas atmosphere, two needle valves for the gas inlet and outlet were available. An infinitely variable stirrer with a propeller on its end and a baffle ensured turbulent bath agitation. The temperature and pressure were measured by corresponding sensors. A mechanical gauge and a piezoelectric transducer quantified the pressure. Heating elements and a water cooling system in the reactor shell realized sensitive temperature adjustment. The thermocouple, pressure transducer, stirrer, and heating/cooling system were connected to several electronic interfaces, which were linked to a computer. The heating profile and stirring were monitored and manipulated through the use of an operating software (bls 2.0, Büchi AG, Uster, Switzerland). Once the heating rate and final temperature were fed to the software, the system ran the process automatically. At the same time, all parameters, including the temperature, pressure, stirring speed, and torque on the stirrer, were logged continuously over time.
Before every test run, 50 g of fines and 500 mL of NaOH were filled into the reaction vessel. After closing the vessel, the system was purged with oxygen for 10 s to ensure a gas phase of 100% oxygen. Subsequently, the initial oxygen pressure was adjusted. The stirring speed was set to 800 rpm. In all experiments, a heating rate of 5 °C per minute and the maximum cooling rate after the residence time were applied. Therefore, the fines that were processed at higher temperatures had longer contact with the leaching solution, due to the longer heating and cooling. After reaching the desired process temperature, the latter was maintained for 1 h in most experiments. In a few of the test runs, the residence time was set to 2 h. As soon as the residence time was over, the vessel was cooled down to 35 °C before the reactor was opened and the slurry was pumped out of the vessel.
Subsequently, the liquid–solid separation was executed using a suction filter so that samples of the liquor could be taken. The solid residue was washed with demineralized water and dried afterward. In the following, the dry residue was milled and homogenized in a ball mill to achieve a maximum grain size of 90 µm. Finally, the elemental composition of the liquor was analyzed using ICP–OES. The analysis of total carbon in the residue was performed by use of an Eltra CS 2000 (ELTRA GmbH, Haan, Germany), whereas a WTW inoLab pH 7310 pH meter made by Xylem analytics (Xylem Analytics Germany Sales GmbH & Co. KG, Weilheim, Germany) was used to determine the pH of the liquid samples.
The different experimental trials are summarized and grouped into four series:
As we had no prior experience with a similar material, it was necessary to proceed in an iterative way to identify the importance of every parameter and simultaneously achieve a complete and selective gallium extraction. This means that the parameters of series B and C were adjusted according to the analytical results of the previous series A and B, respectively. Considering Table 3, it can be generally stated that the leaching conditions were adjusted to be milder with the progress of the trials, which reveals a hint regarding the general outcome of the whole study.
Since the autoclave does not offer any equipment to take samples during the leaching process, it was not possible to realize a kinetic study, although such data are expected to be valuable to identify the fundamental reaction mechanisms. In the following, the results of the particular trial series are presented and discussed.

6. Results and Discussion
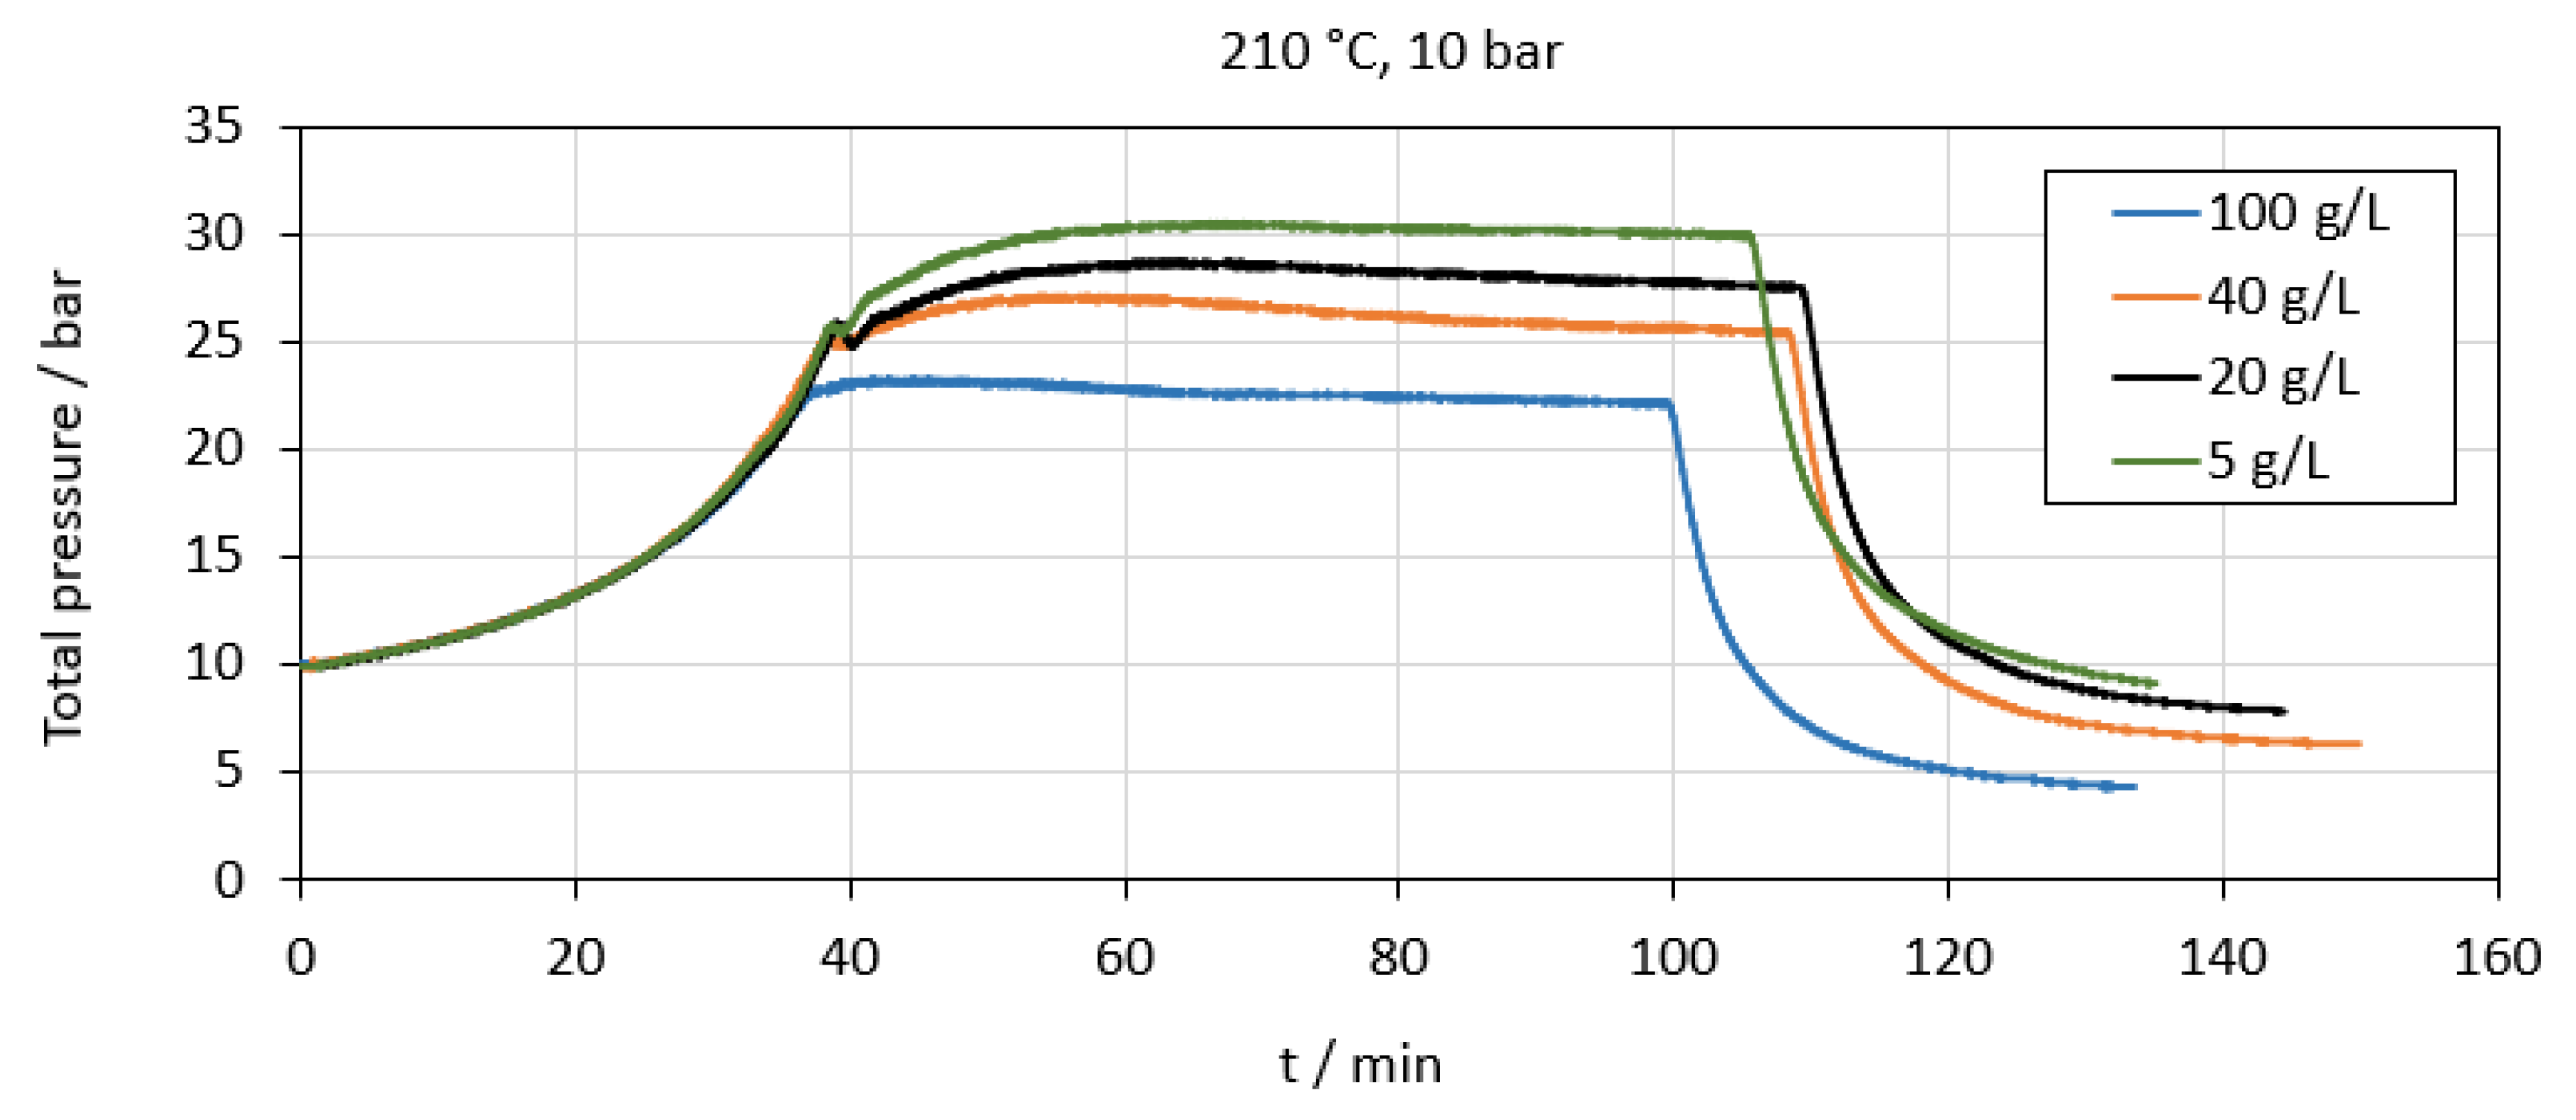
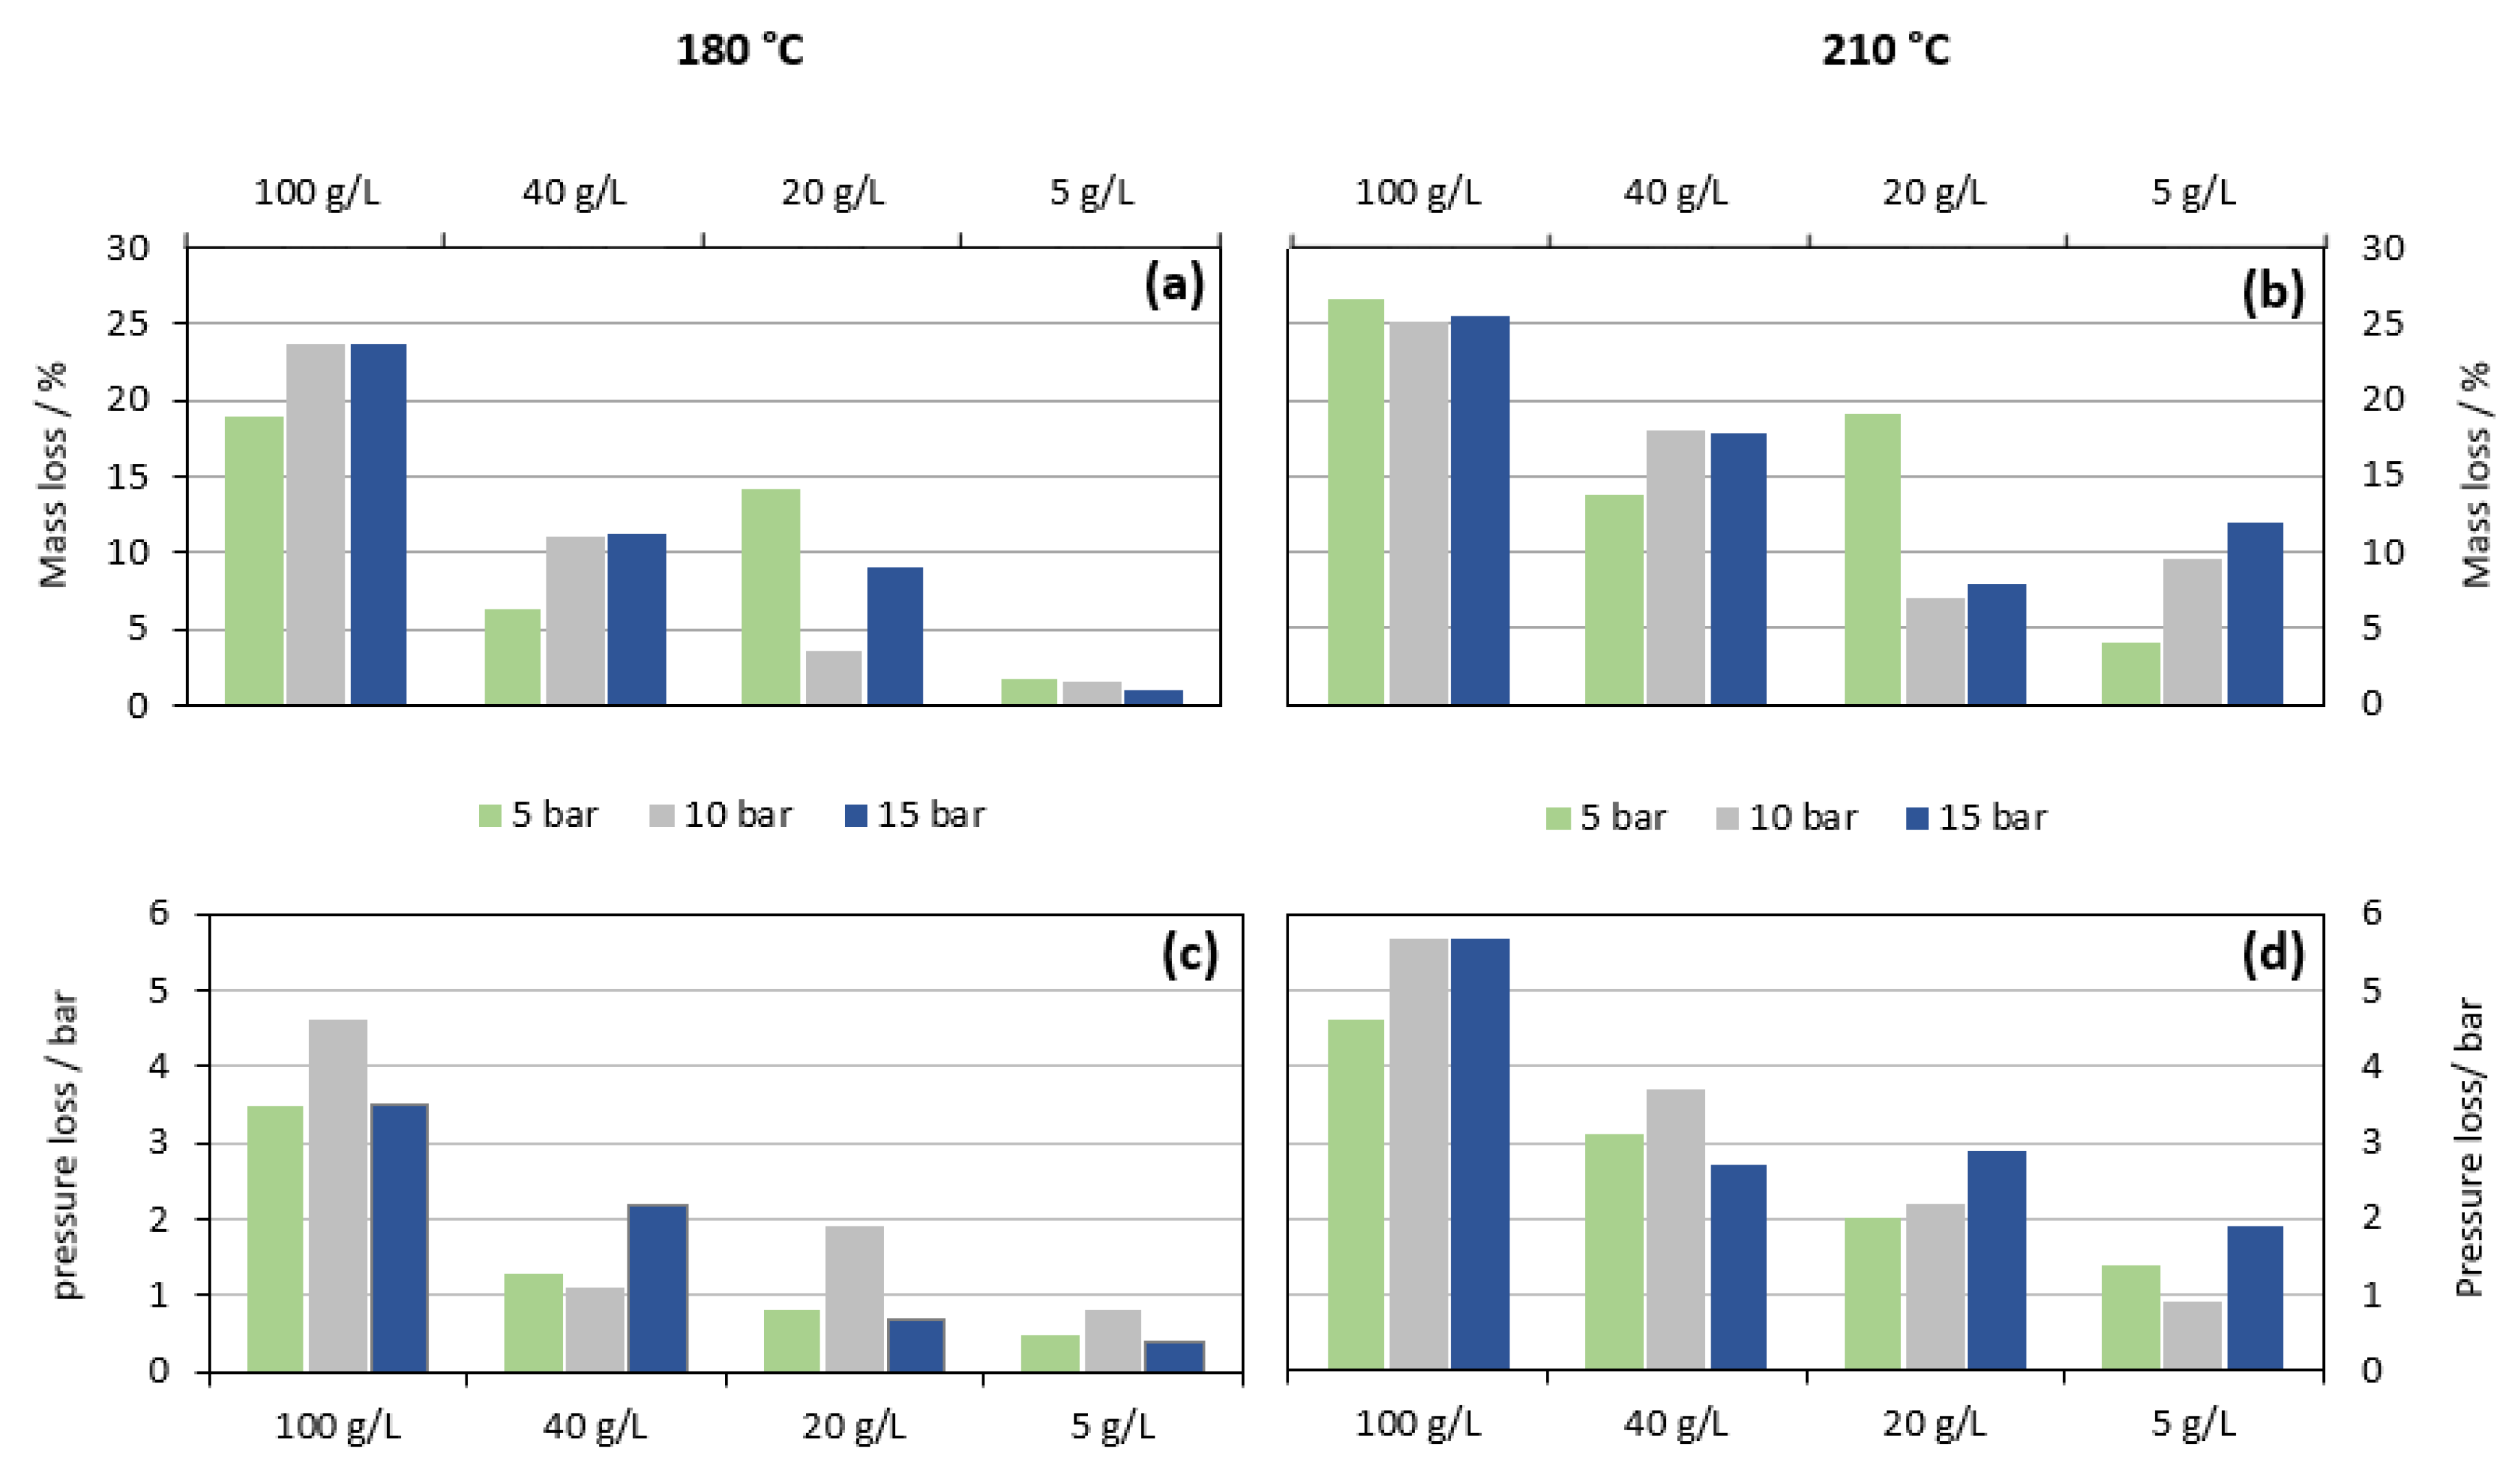
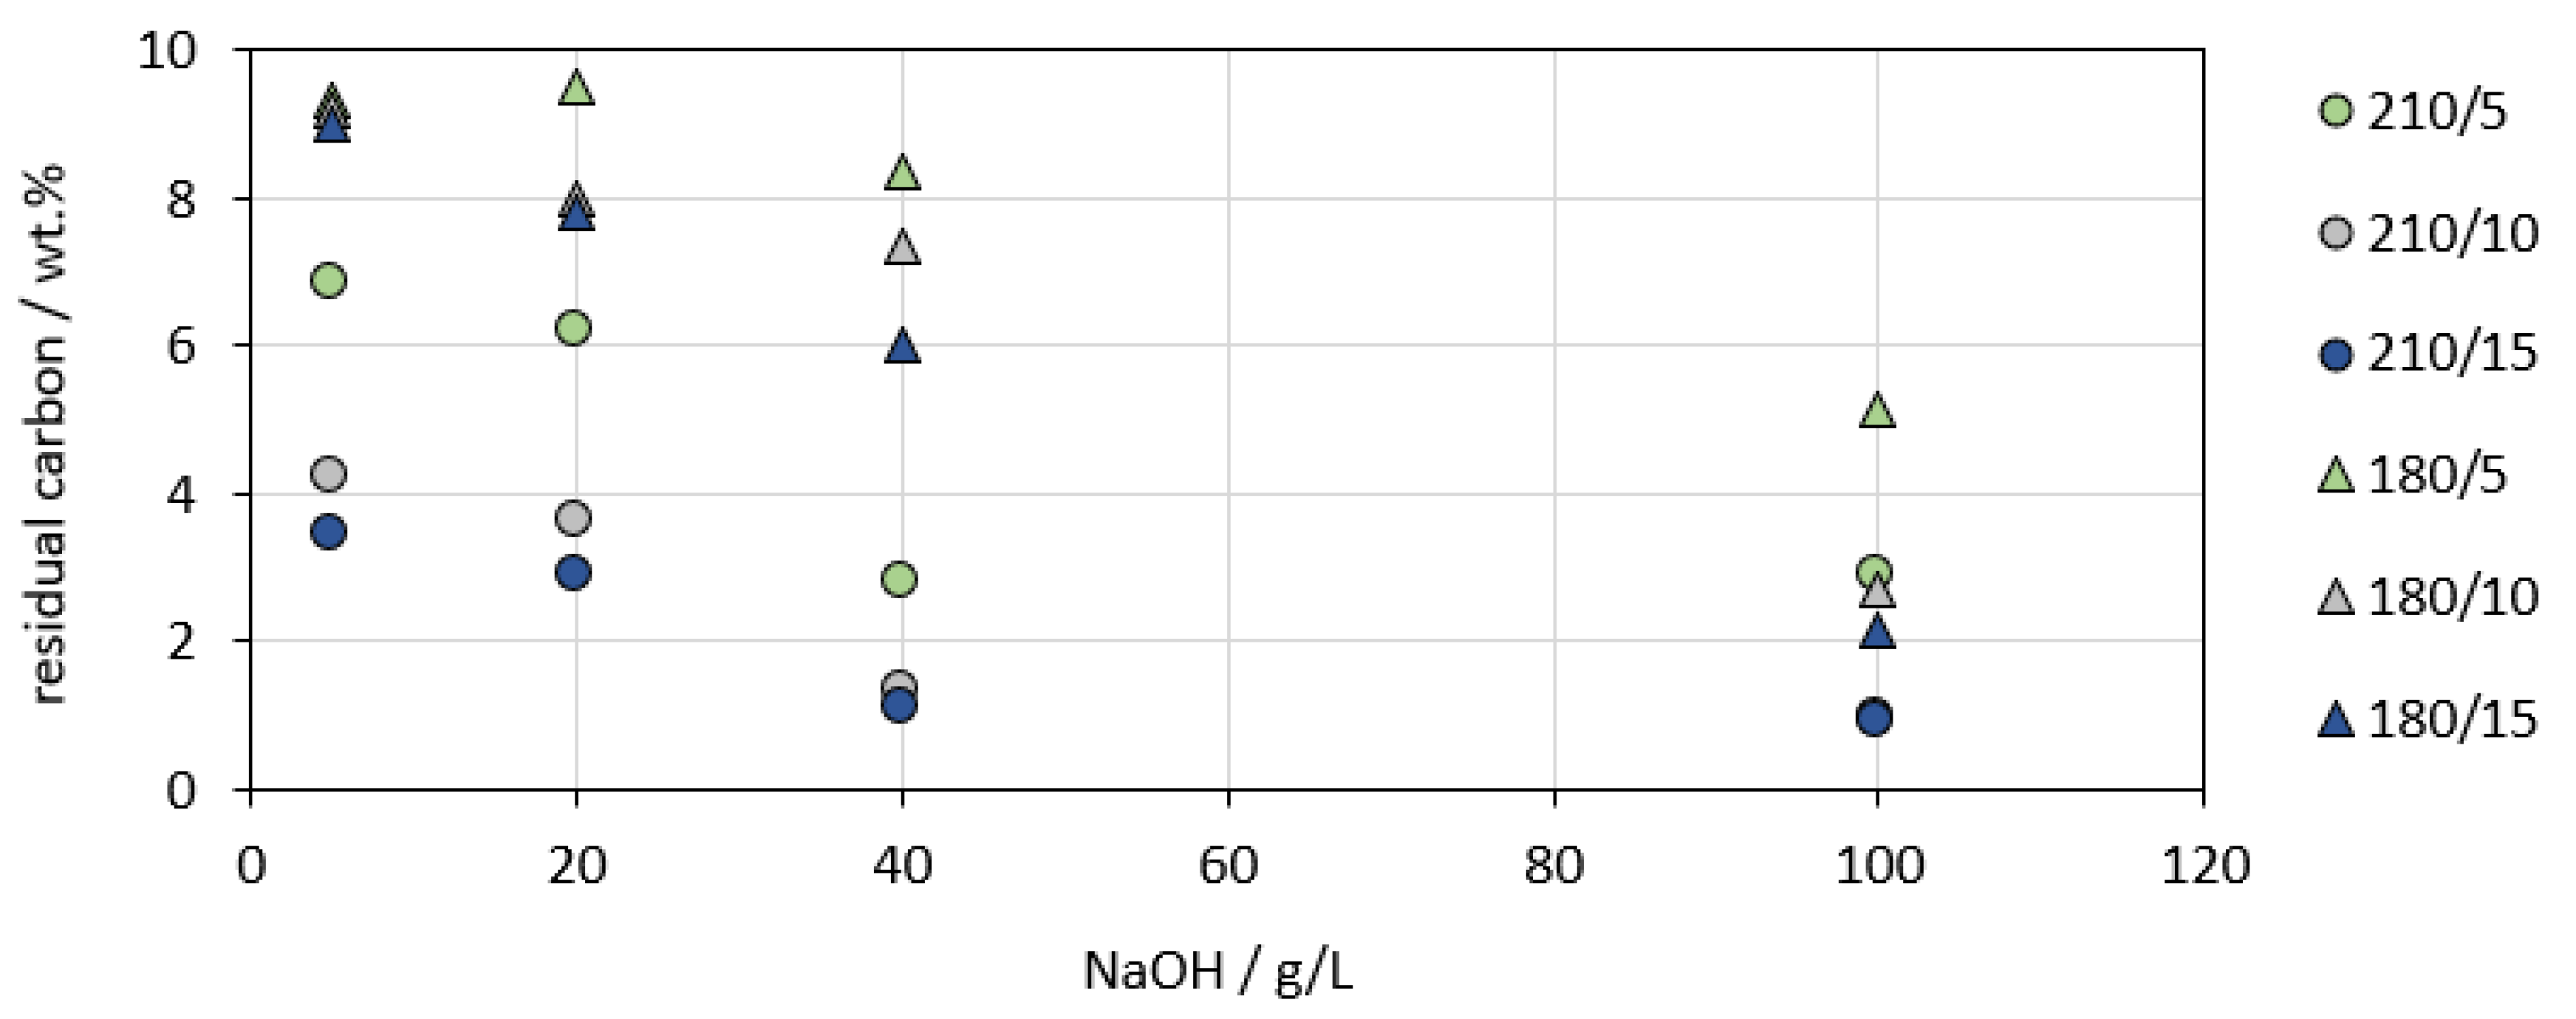
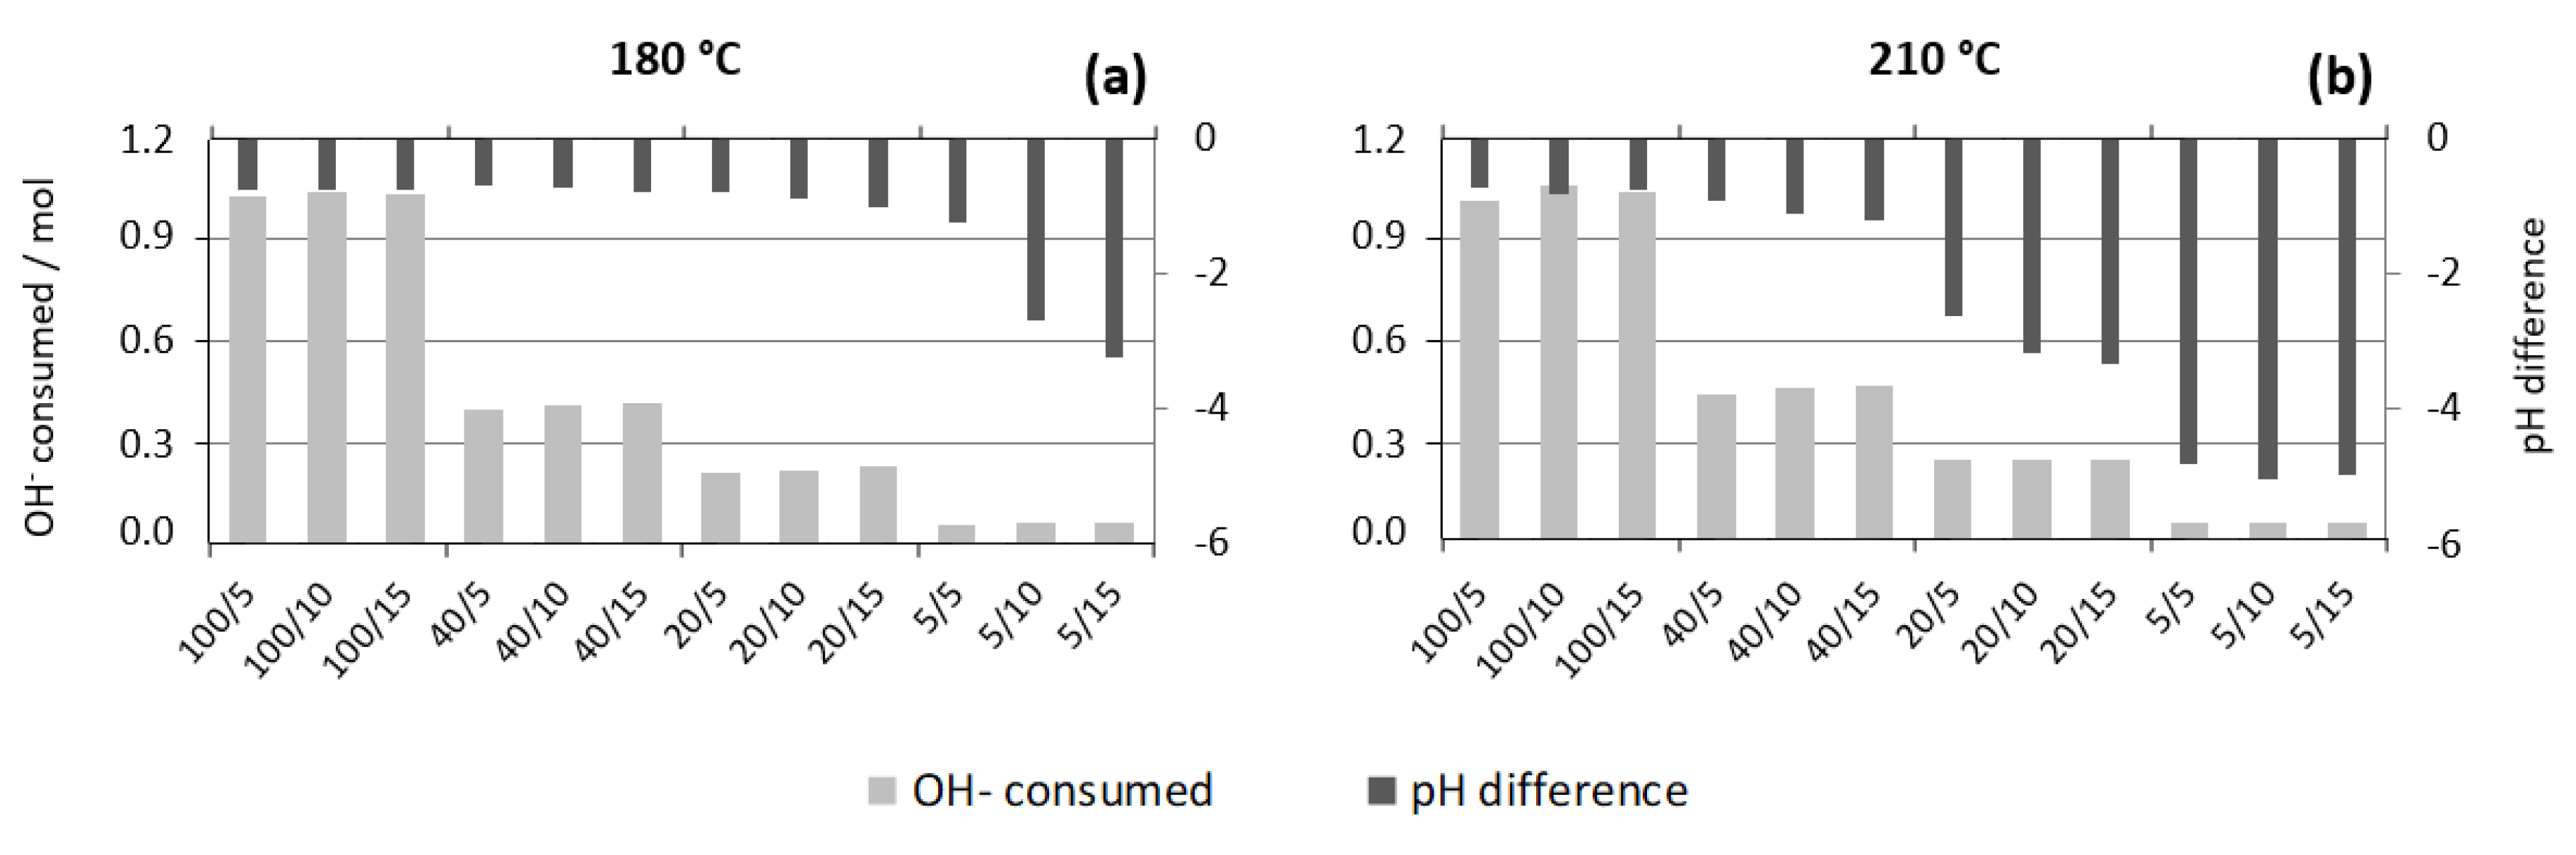
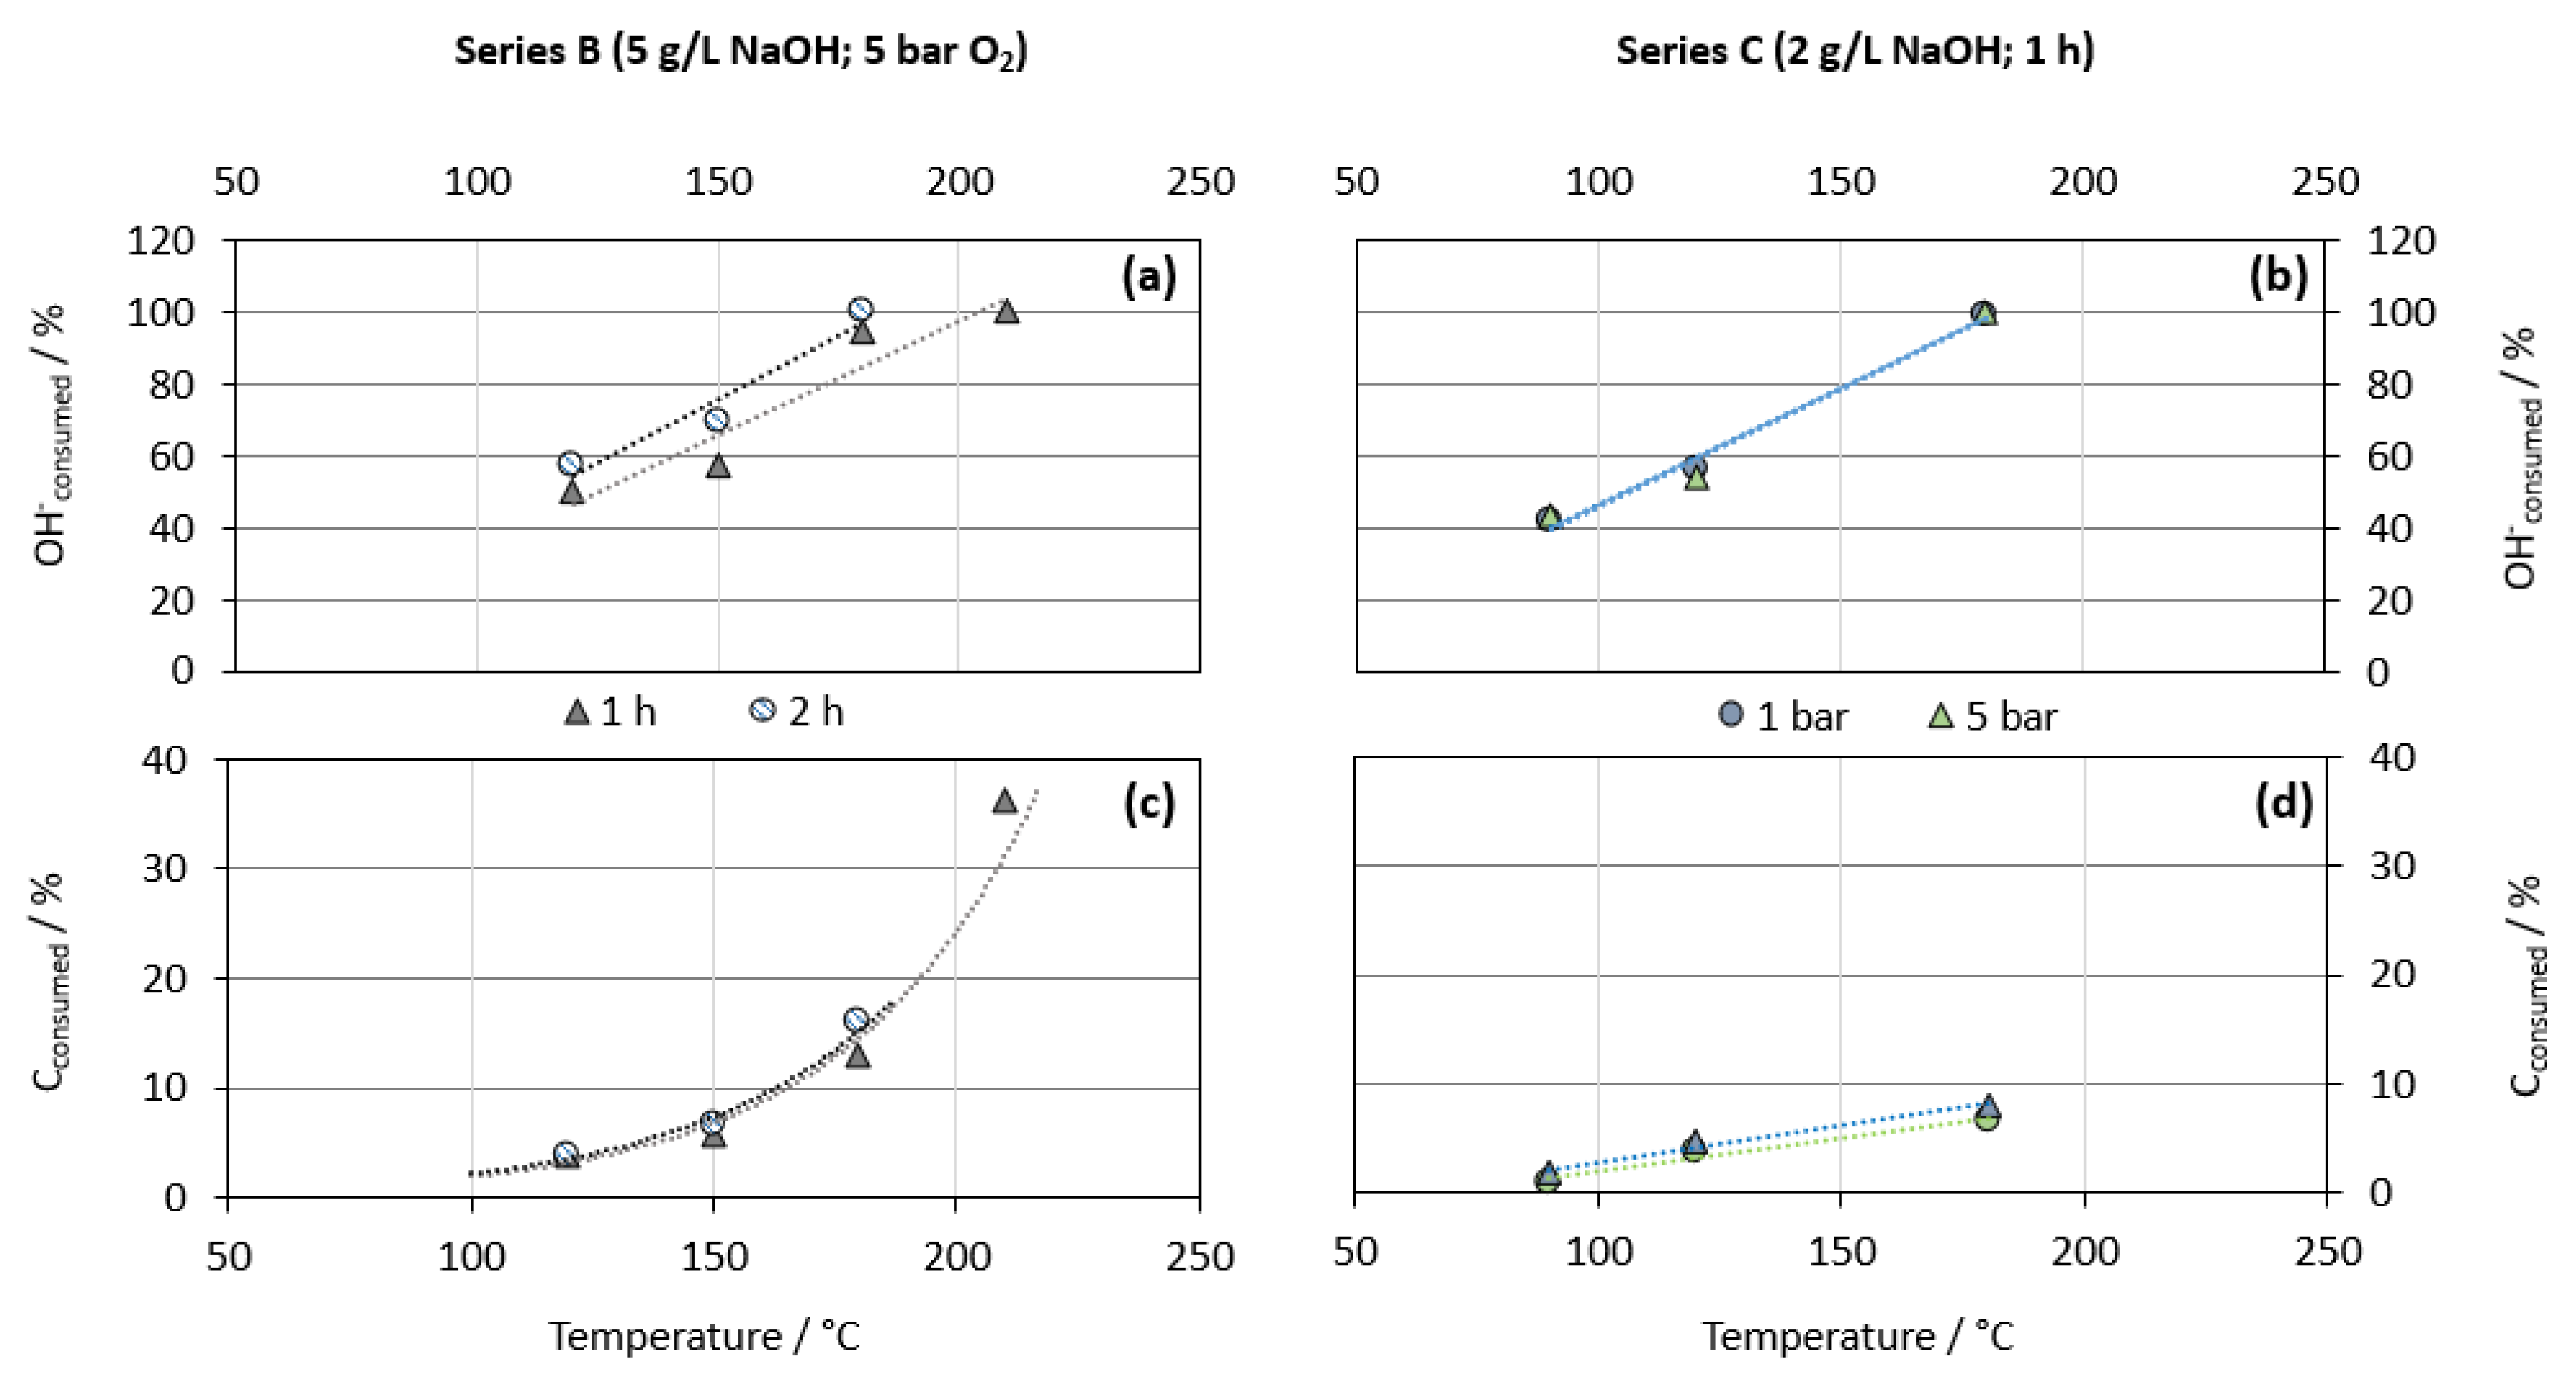
6.1. The Depletion of Carbon and OH at 210 °C and 180 °C

Figure 5 represents the exemplary pressure course for several alkali concentrations at 210 °C and 10 bar O2 (=total pressure). The graphs also indicate a rough shape of the temperature profile due to the correlation between temperature and pressure. The NaOH content appears to have a beneficial influence on the heat input into the solution, because solutions with more alkali reached the final processing temperature earlier. Therefore, the start of cooling was initialized earlier after the residence time as can be retraced by considering the graph for 100 g/L.
A conspicuous point is the residual pressure values after cooling down to 35 °C. All curves in Figure 5 end at different pressures below the initial pressure of 10 bar. This observation was made in every experiment of series A1 and A2 and is visualized in Figure 6c,d. Due to the high difference in pressures before and after the experiments, we concluded that elevated temperatures and high alkali contents facilitated the consumption of oxygen. The difference between experiments at harsh (210 °C, 100 g/L) and milder (180 °C, 5 g/L) conditions is major, which applies to the mass loss during leaching as well (Figure 6a,b).
The mass losses can be partially associated with the depletion of carbon as shown in Figure 7. Particularly at 210 °C, the temperature and oxygen pressure had a considerable impact on the carbon content, which is evidence for the oxidation of carbon during leaching.
Figure 8 depicts the difference in the pH before and after leaching as well as the resulting amount of consumed alkali. The initial pH was calculated based on the known alkali concentration from the beginning. At elevated initial NaOH concentrations a considerable consumption of OH occurred. In the case of test runs at 210 °C and 5 g/L NaOH, the alkali consumption resulted in a drop of the pH down to 8.
It is unlikely that the high alkali consumption was only caused by the dissolution of minerals and metals in the fines. With respect to the negative pressure difference (Figure 6c,d), the carbon content of the fines (Figure 7), and the drop in pH (Figure 8), we concluded that gaseous oxygen was consumed to oxidize organic carbon to CO2. Afterward, CO2 was dissolved by neutralizing the solution according to Equations (1) and (2).
In this context, the color of both the sampled liquor and the leach residue is of high interest. After test runs at high alkali concentrations, the liquor had a dark brown, coffee-like color and the color of the fines changed from anthracite to lighter gray. As alkali concentrations were lowered, the liquor’s color went to lighter brown-reddish, and the fines remained at darker shades closer to the initial color. Similar observations were made by Wang et al. [23] and Kapo et al. [25] who worked on the production of organic acids from lignite. Thus, oxidation may have resulted in the formation of water-soluble organic compounds as well. However, there was no procedure available to identify such compounds in the solution.

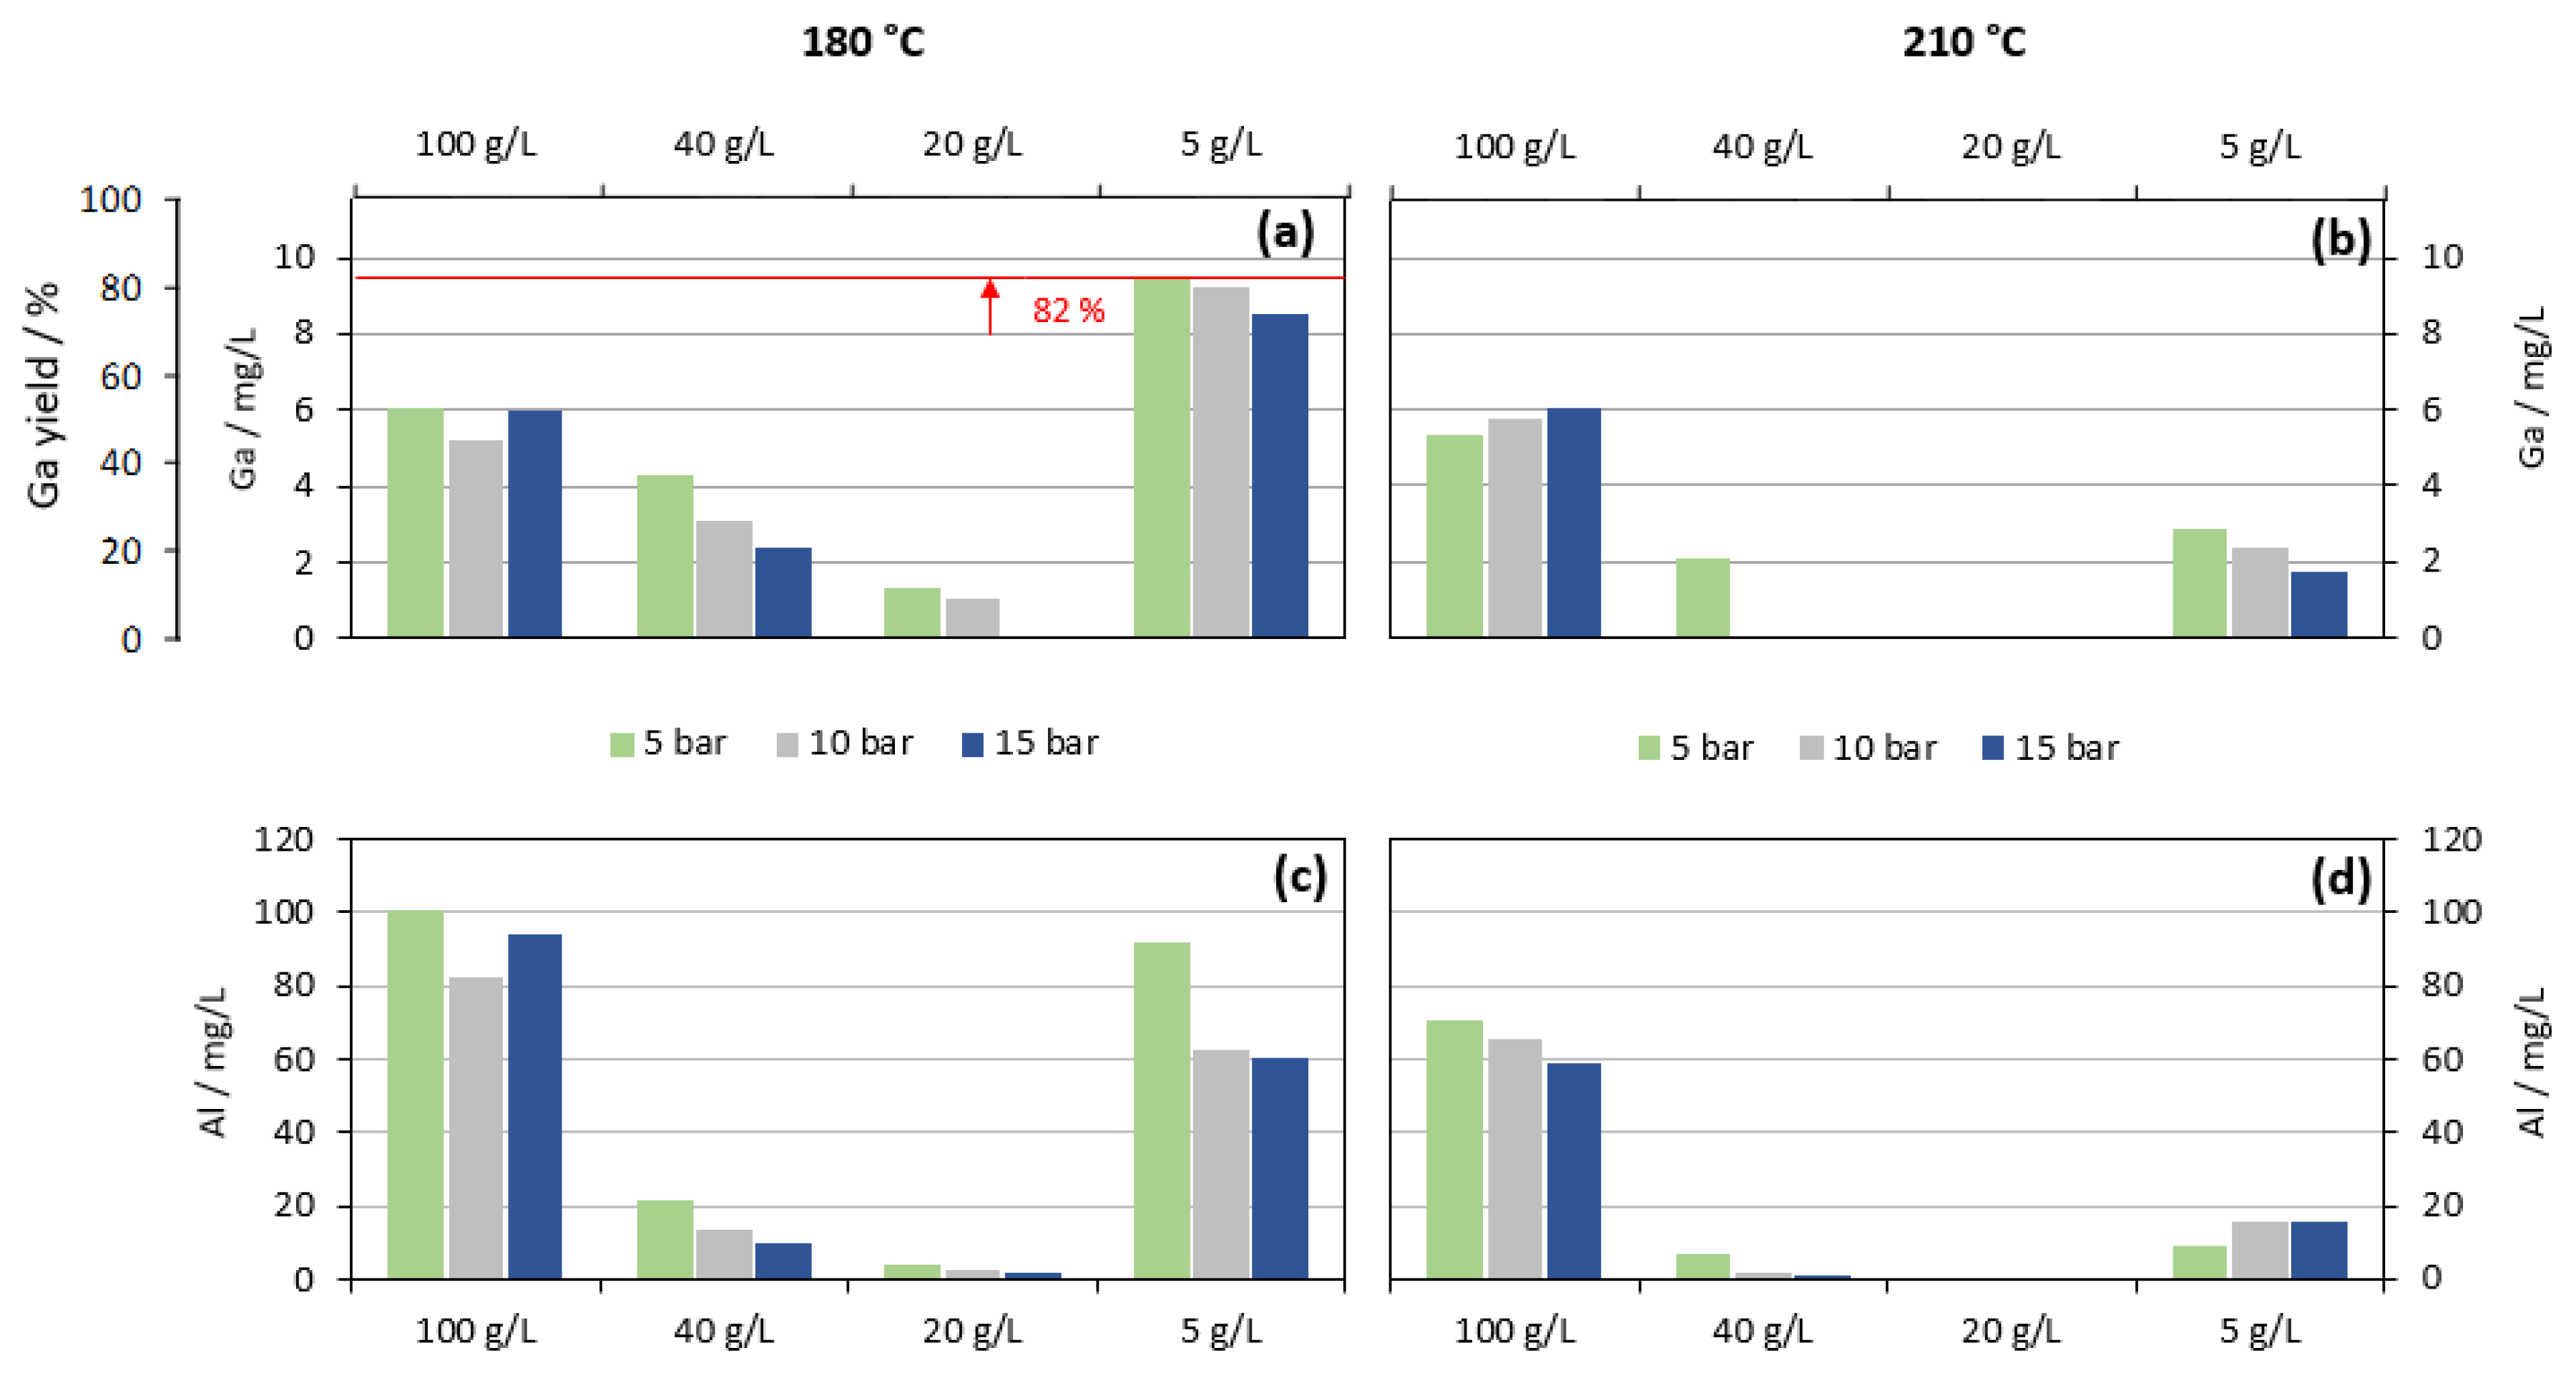
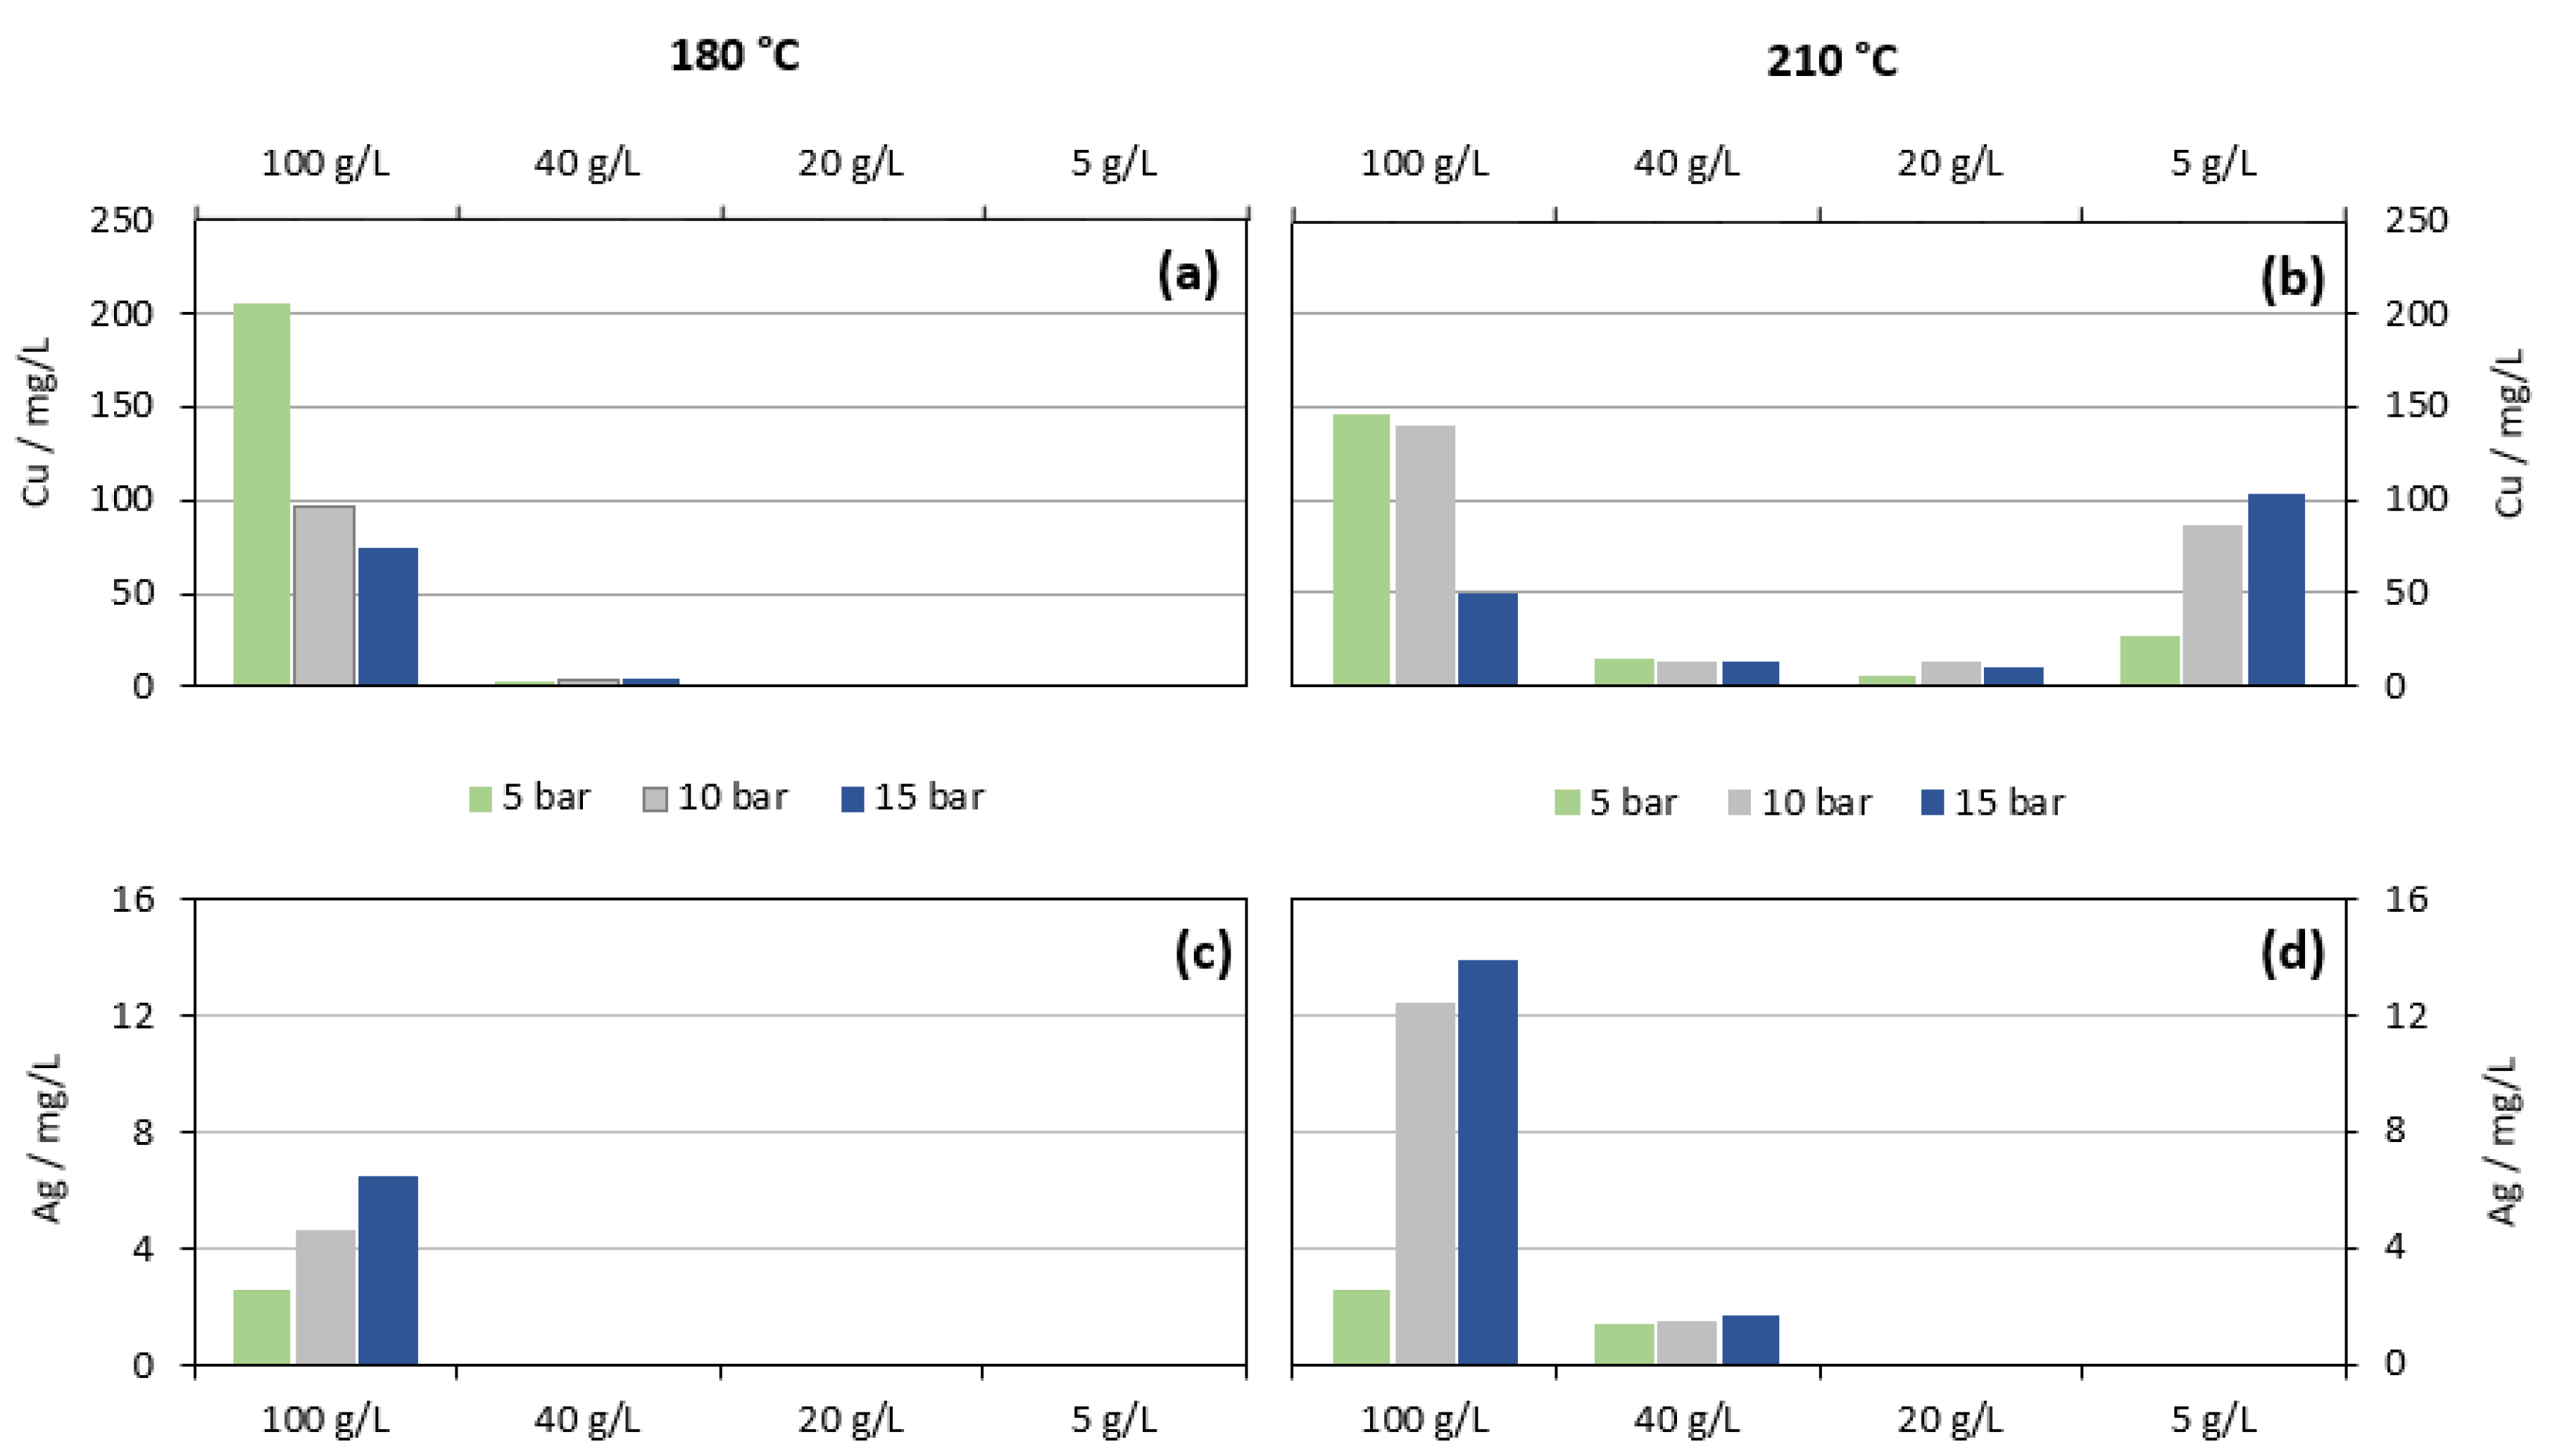
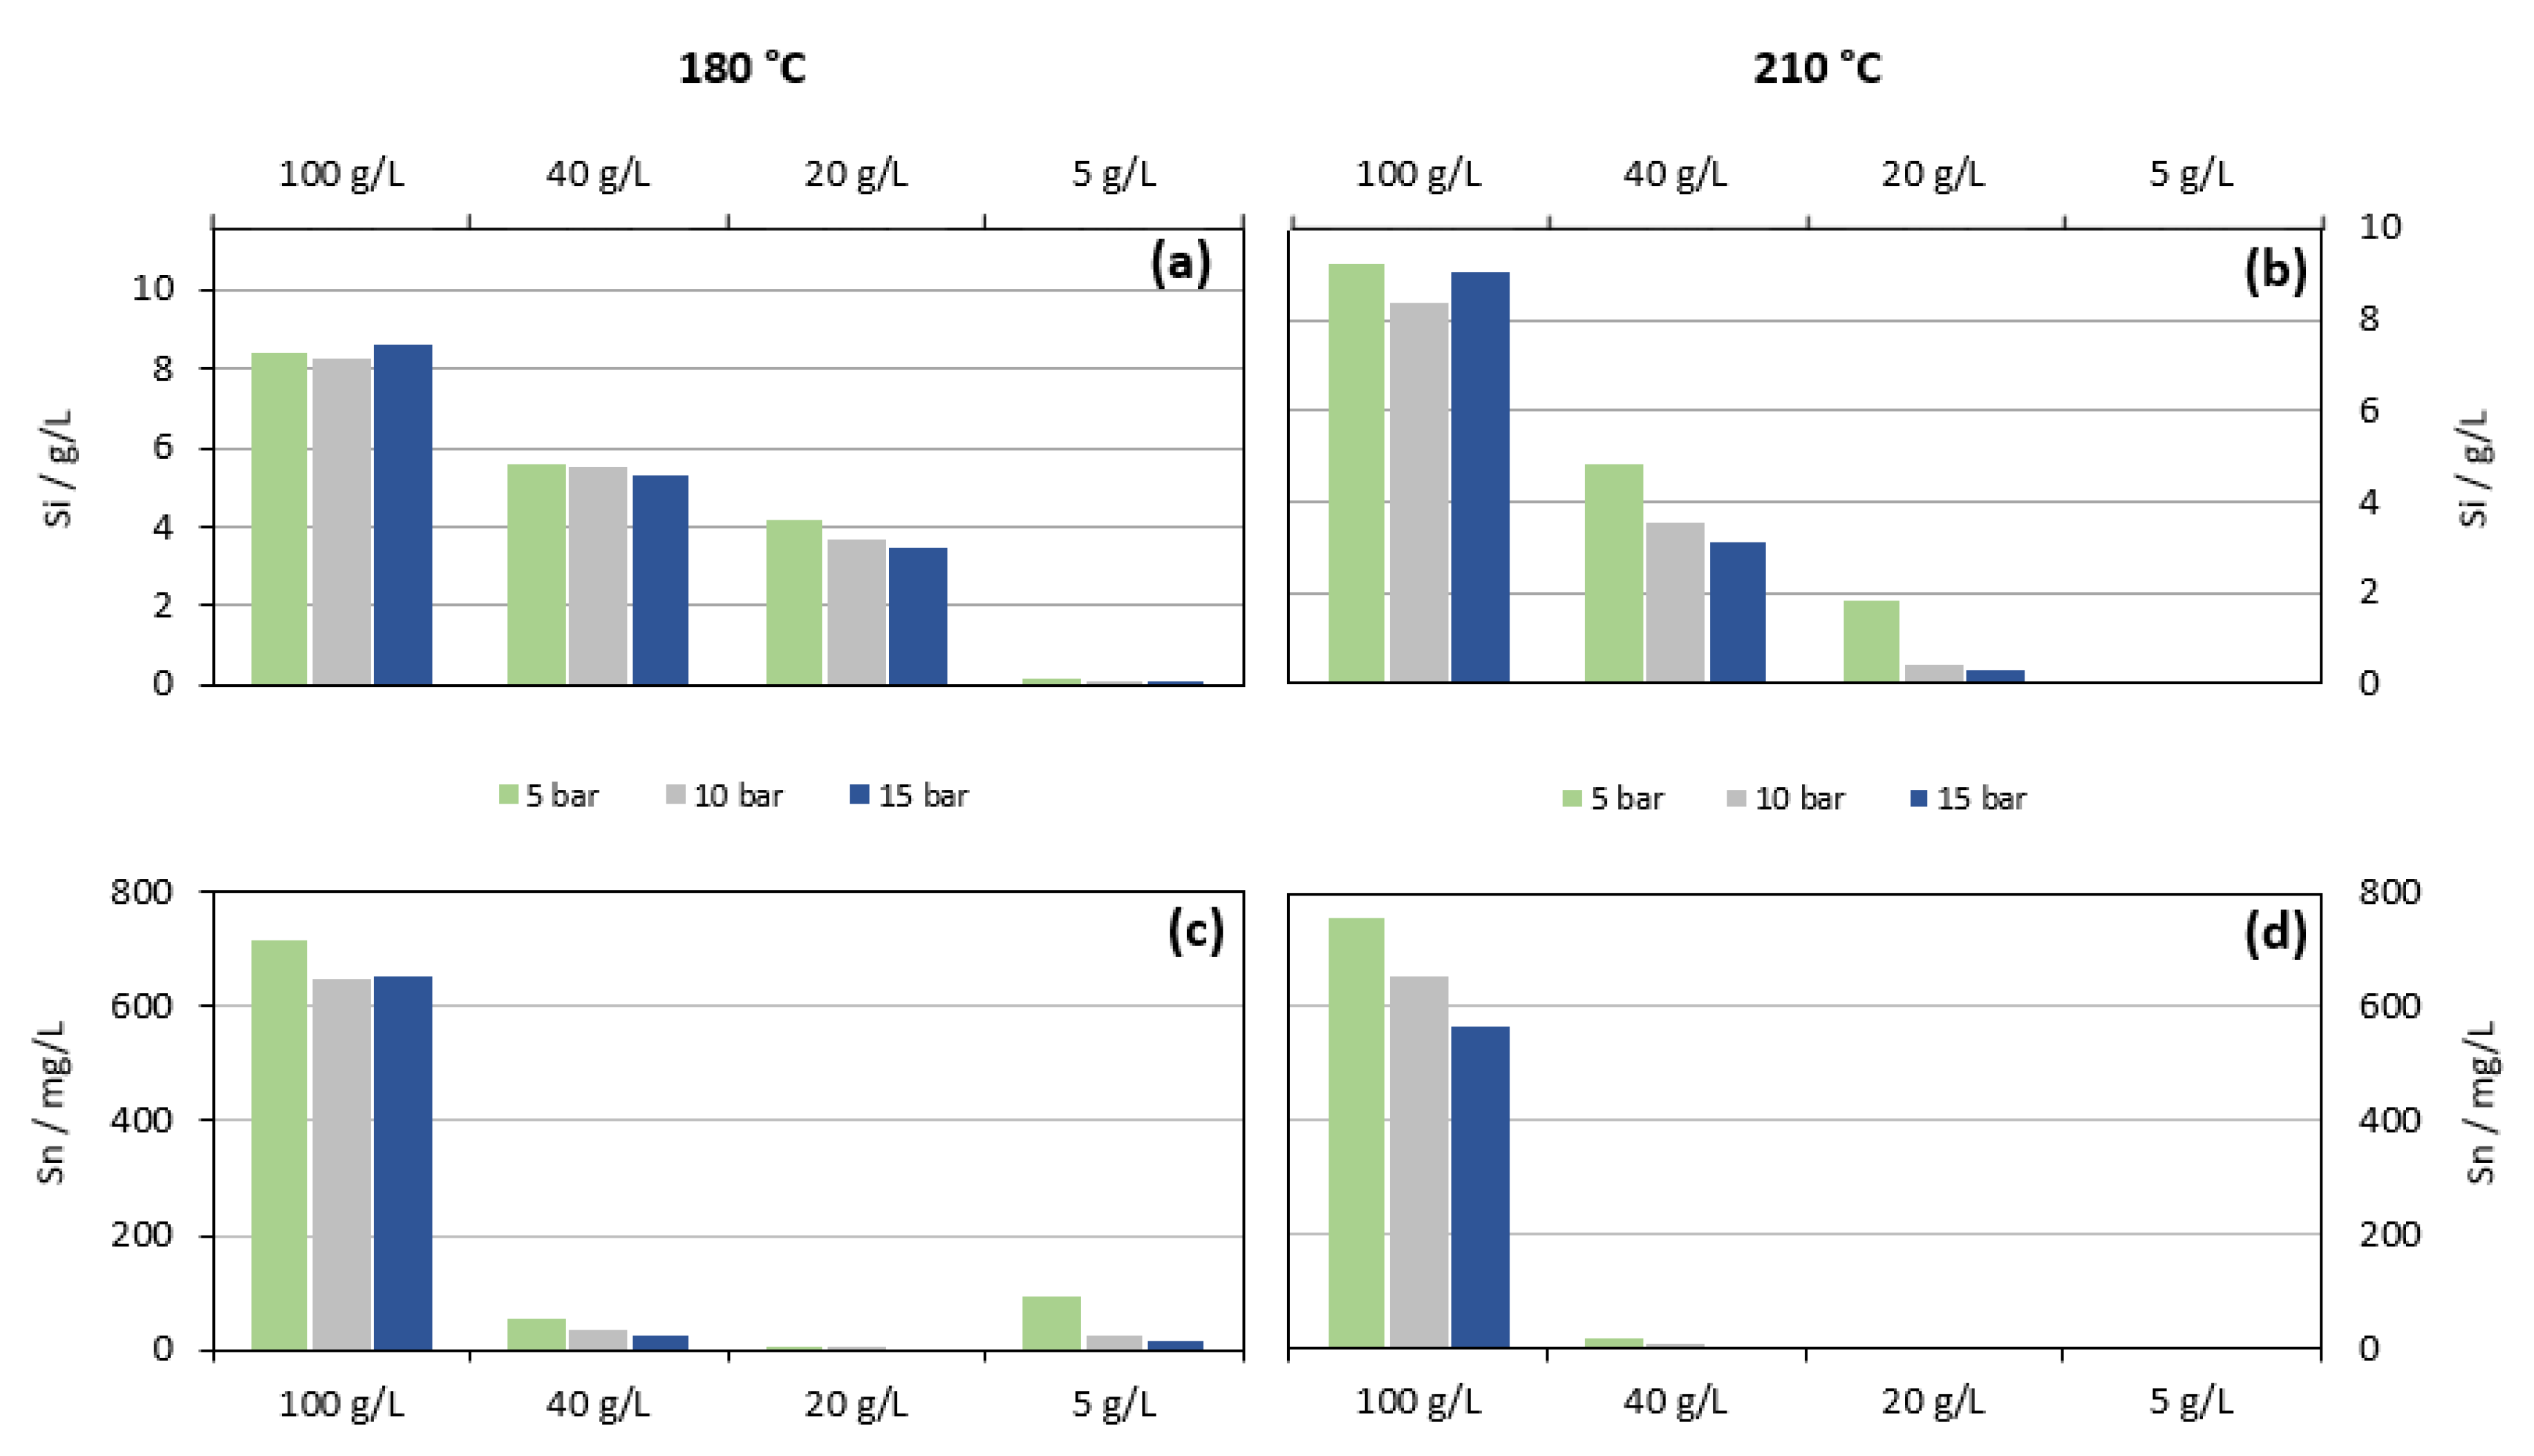
6.2. Dissolved Elements in the Liquor at 210 and 180 °C

The following figures illustrate the concentrations of different elements that were brought into solution during series A1 and A2. Gallium was the target metal to be dissolved, and all other elements were regarded as undesired impurities.
Concentrations of gallium and aluminum in different solutions are shown in Figure 9. For gallium, a second ordinate is pictured to give information about the yield where the red line indicates the maximum yield. While the behavior of both elements appeared to be similar, the results were unexpected. At both temperatures, either the highest or the lowest NaOH concentration enabled the highest extraction rates. In the case of gallium, the maximum concentration of 9.48 mg/L in the liquor was achieved at the mildest conditions (180 °C, 5 g/L, and 5 bar), whereas test runs at 210 °C and 20 g/L did not result in any gallium or aluminum dissolution. According to the initial analysis of the input material, the highest extraction rate was 82% for Ga and 1.7% for Al. Decreasing the oxygen pressure had a slight enhancing effect on the Ga and Al recovery.
These findings are in conflict with information from thermodynamic calculations [5,6] and the results of earlier studies [7,8,10,11,12] where high oxygen and alkali concentrations facilitated Ga dissolution. This fact becomes more remarkable when the gallium concentration in the leach residue is included in the discussion: no sample of leach residues from series A1 and A2 exhibited gallium concentrations above the detection limit at 5 ppm. Hence, Ga must have dissolved completely in any trial but did not end up in the liquor. The explanation for this observation is the formation of solid, Ga-containing intermediate products, which formed inside the autoclave. After leaching, these solids were withheld in the filter and redissolved when the residue was washed with distilled water so that gallium was leached from the leach residue. With respect to the occurring anions in the solution, one possible option could be the precipitation of gallium hydroxide or carbonate, however, these substances are either unstable (gallium carbonate) or poorly soluble in cold water (gallium hydroxide) [30].
Another possibility is provided by consulting the works of Wang et al. [23] as well as Kapo and Calvert [25]. In both works, the salting-out of humic acids or other organic compounds due to high ionic strengths was reported. Karnowo et al. [28] mentioned the ability of carboxylic acids to act as complexion agents. Thus, it appears to be possible that dissolved gallium and aluminum were bound to those organic complexes that were first precipitated and redissolved as the residue was washed. Clearly, the formation of complexes must have been favored at 20 and 40 g/L NaOH. However, the described mechanism is merely a hypothesis and must be investigated further.
From Figure 10a,b, it becomes clear that copper exhibited a similar performance at 210 °C to gallium and aluminum. The maximum extraction rate was 2.9% at 100 g/L NaOH and 5 bar O2 pressure. By decreasing the temperature to 180 °C, the extraction increased to 4.1% (201 mg/L), but lowering the alkali content to 5 g/L resulted in a decrease of copper below the detection limit of 0.5 mg/L. We propose that the same mechanism that led to the reduced content of gallium and aluminum also limited the copper content in solution at 20 and 40 g/L NaOH.
Graphs for the silver dissolution (Figure 10c,d) prove that 13.9 mg/L (= 9.9%) silver was transferred from the fines into the liquor. As milder conditions were applied, silver was pushed below the detection limit. Unlike copper, increasing oxygen pressures facilitated silver dissolution.
In terms of the silicon and tin extraction, the influence of temperature was less significant, whereas the NaOH concentration was the main driving force, whose increase enabled a higher coextraction of these elements (Figure 11).
To state an interim result, the essential findings from series A1 and A2 were that the highest gallium extraction yields were achieved at 180 °C rather than 210 °C and while maintaining low NaOH concentrations and O2 pressures, although Ga dissolution is expected to comprise the full range of alkali concentration. The oxidation of organic carbon makes the process hard to control and it likely has an influence on the metal yield due to the formation of water-soluble organic compounds. At mild conditions, all other (undesired) elements are poorly extracted, making aluminum and silicon the main impurities in the liquor.

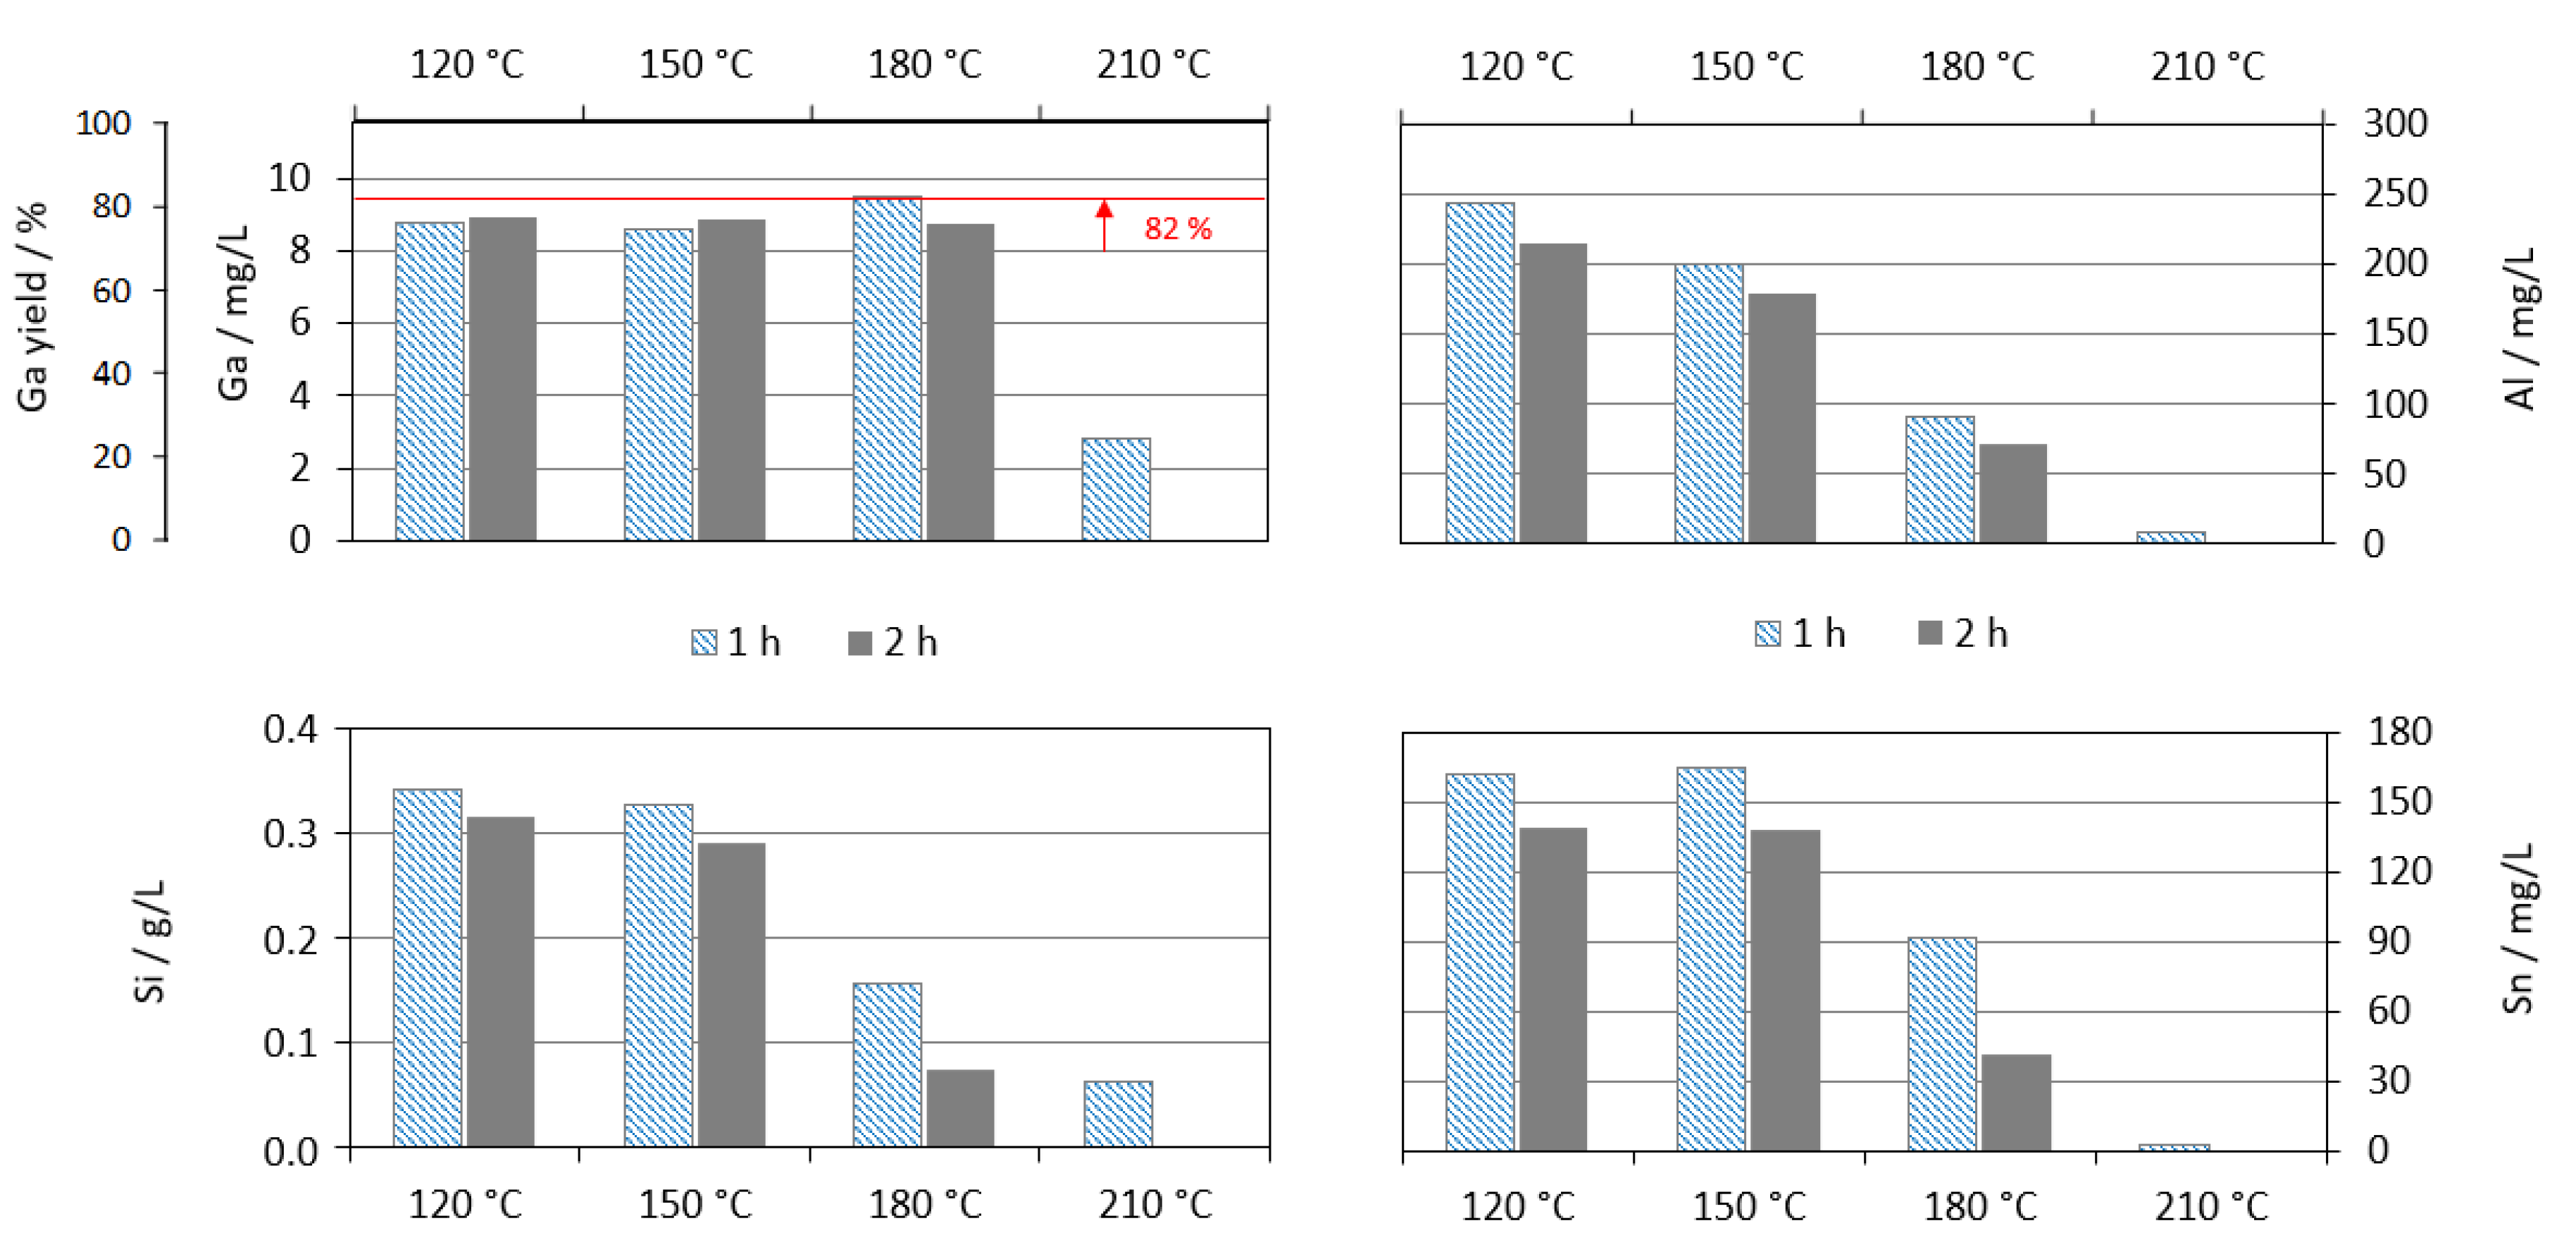
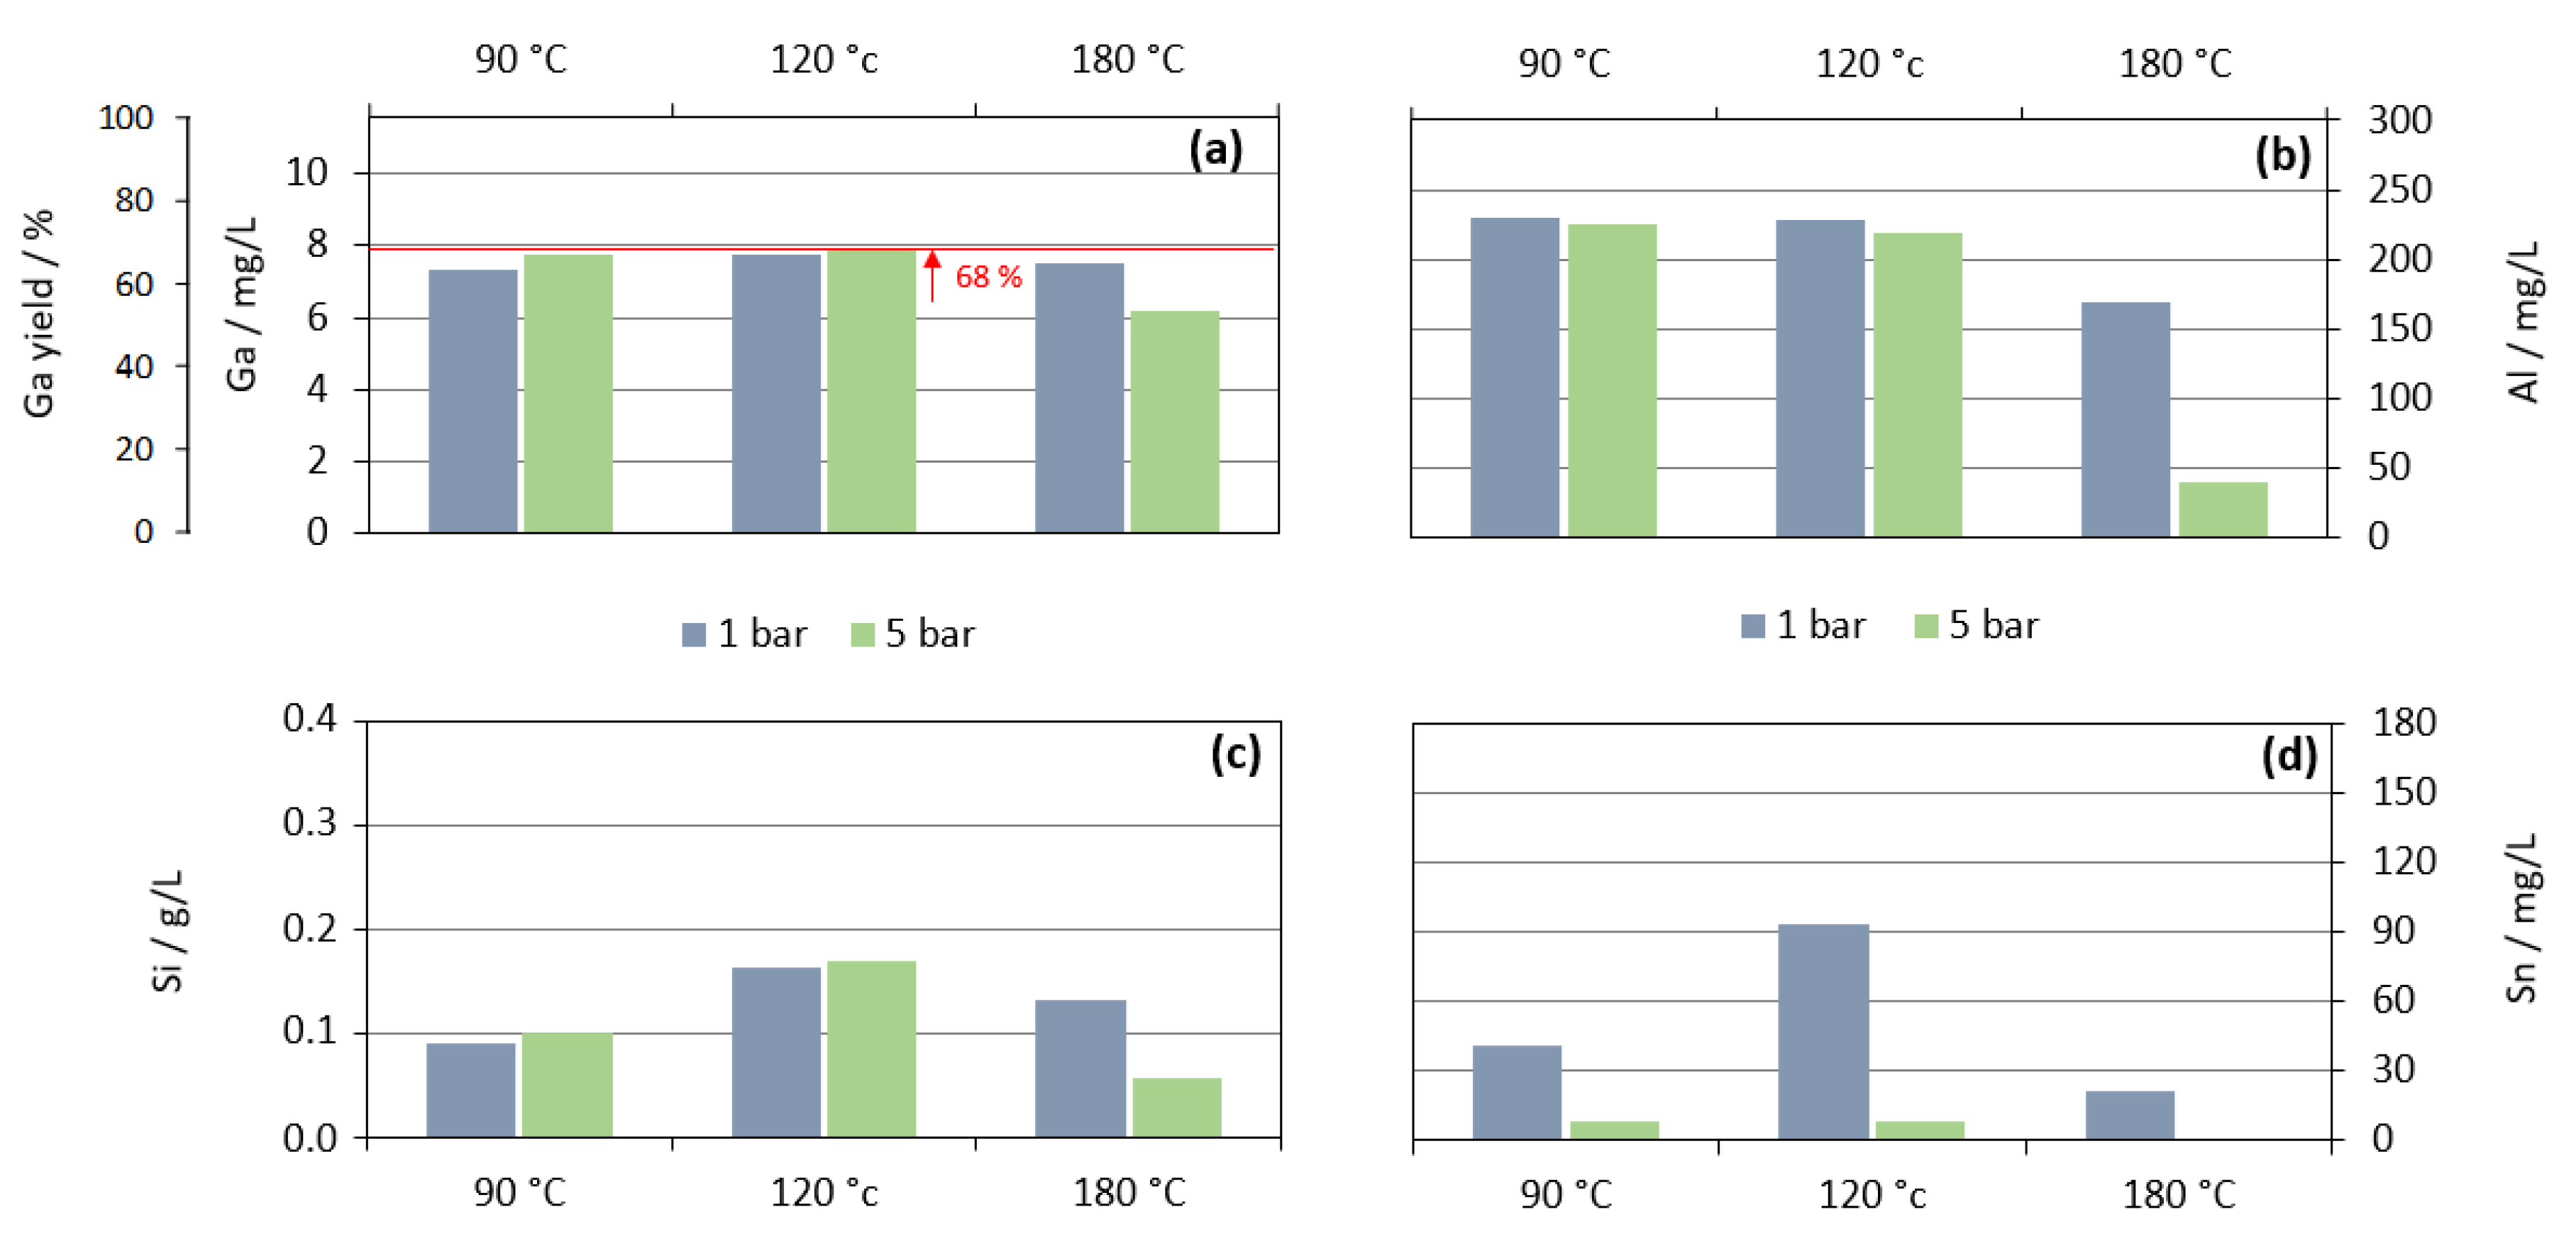
6.3. Dissolved Elements in the Liquor at 120, 150, and 180 °C by Varying Reaction Time

Therefore, the experimental parameters for the trial series B were adjusted toward lower parameters; while the O2 pressure was kept at 5 bar and the NaOH content remained at 5 g/L, the temperature was decreased to 150 and 120 °C. Additionally, experiments were conducted with a residence time of 60 and 120 min to examine the influence of longer reaction times.
Figure 12 depicts the amounts of gallium, aluminum, silicon, and tin in the leach solution after series B. In addition, two results from series A1 (210 °C) and A2 (180 °C) were added to the diagrams to better recognize the influence of temperature. There was no experiment at 210 °C and 2 h.
Concerning gallium, the yield slightly decreased between 120 and 180 °C and was poorly affected by the leaching time. In the case of the other shown elements, however, there was a significant increase along with the decreasing temperature and residence time. At first glance, this appears to be contradictory to general kinetics laws, however, the formation of CO2 and its neutralizing effect on alkaline solutions must be regarded. Lower temperatures also constrain the oxidation of organic carbon and, thus, the formation of CO2. If less CO2 is formed, the solution is less depleted of OH, which apparently results in a higher solubility of Al, Si, and Sn. When a residence time of 2 h was applied, the overall reaction time was longer. Concerning this, there are two mechanisms, occurring simultaneously and working for and against metal dissolution: the leaching reaction is facilitated by high OH concentrations, whereas the formation of CO2 results in the decrease of alkali, and, thus, inhibits metal dissolution. Both reactions are enhanced by higher temperatures.
According to Figure 12, elevating the residence time to 120 min resulted in lower leaching rates for all elements except for gallium. Therefore, the CO2-induced decrease of OH must be the dominating mechanism rather than the alkaline dissolution of elements when a longer leaching duration is applied. For gallium, this argumentation appears not to be valid because, between 120 and 180 °C, its concentration in the liquor is affected marginally by the temperature and trial duration. However, differences in the Ga concentration in series B were too small to state a final hypothesis.

6.4. Dissolved Elements in the Liquor at 90, 120, 180 °C, and Low Alkali Concentrations

Based on these findings, the parameters for series C were set towards milder conditions: the NaOH concentration was further decreased to 2 g/L and the oxygen pressure was lowered to 1 bar. In addition, 90 °C was set as the lowest temperature. As the detailed investigation of the reaction time dependence would have exceeded the extent of this study, this aspect was not followed further in series C. The results of this series are shown in Figure 13.
In comparison to series B, the maximum gallium yield declined to 68% at 120 °C and 5 bar. At the same time, co-extraction of silicon and tin could be reduced significantly. The latter is still strongly affected by the amount of oxygen. During this series, oxygen pressure only plays an important role in metal extraction at 180 °C.

6.5. The Depletion of Carbon and OH at Low Temperatures, Alkali Concentrations, and O2 Pressures

Figure 14 offers the consumption of OH and carbon during series B and C. Applying the lowest alkali concentration of 2 g/L (Figure 14b,d) resulted in a linear increase of both carbon and NaOH consumption between 90 and 180 °C. Under these conditions, the increase of oxygen pressure from 1 to 5 bar did not have a significant influence within the full temperature range. However, when the alkali concentration was 5 g/L (Figure 14c), the relation between the carbon consumption and temperature became exponential, and the reaction time had only a small enhancing effect. In contrast, the graph of alkali consumption (Figure 14a) remained linear with a more substantial influence from the reaction time.

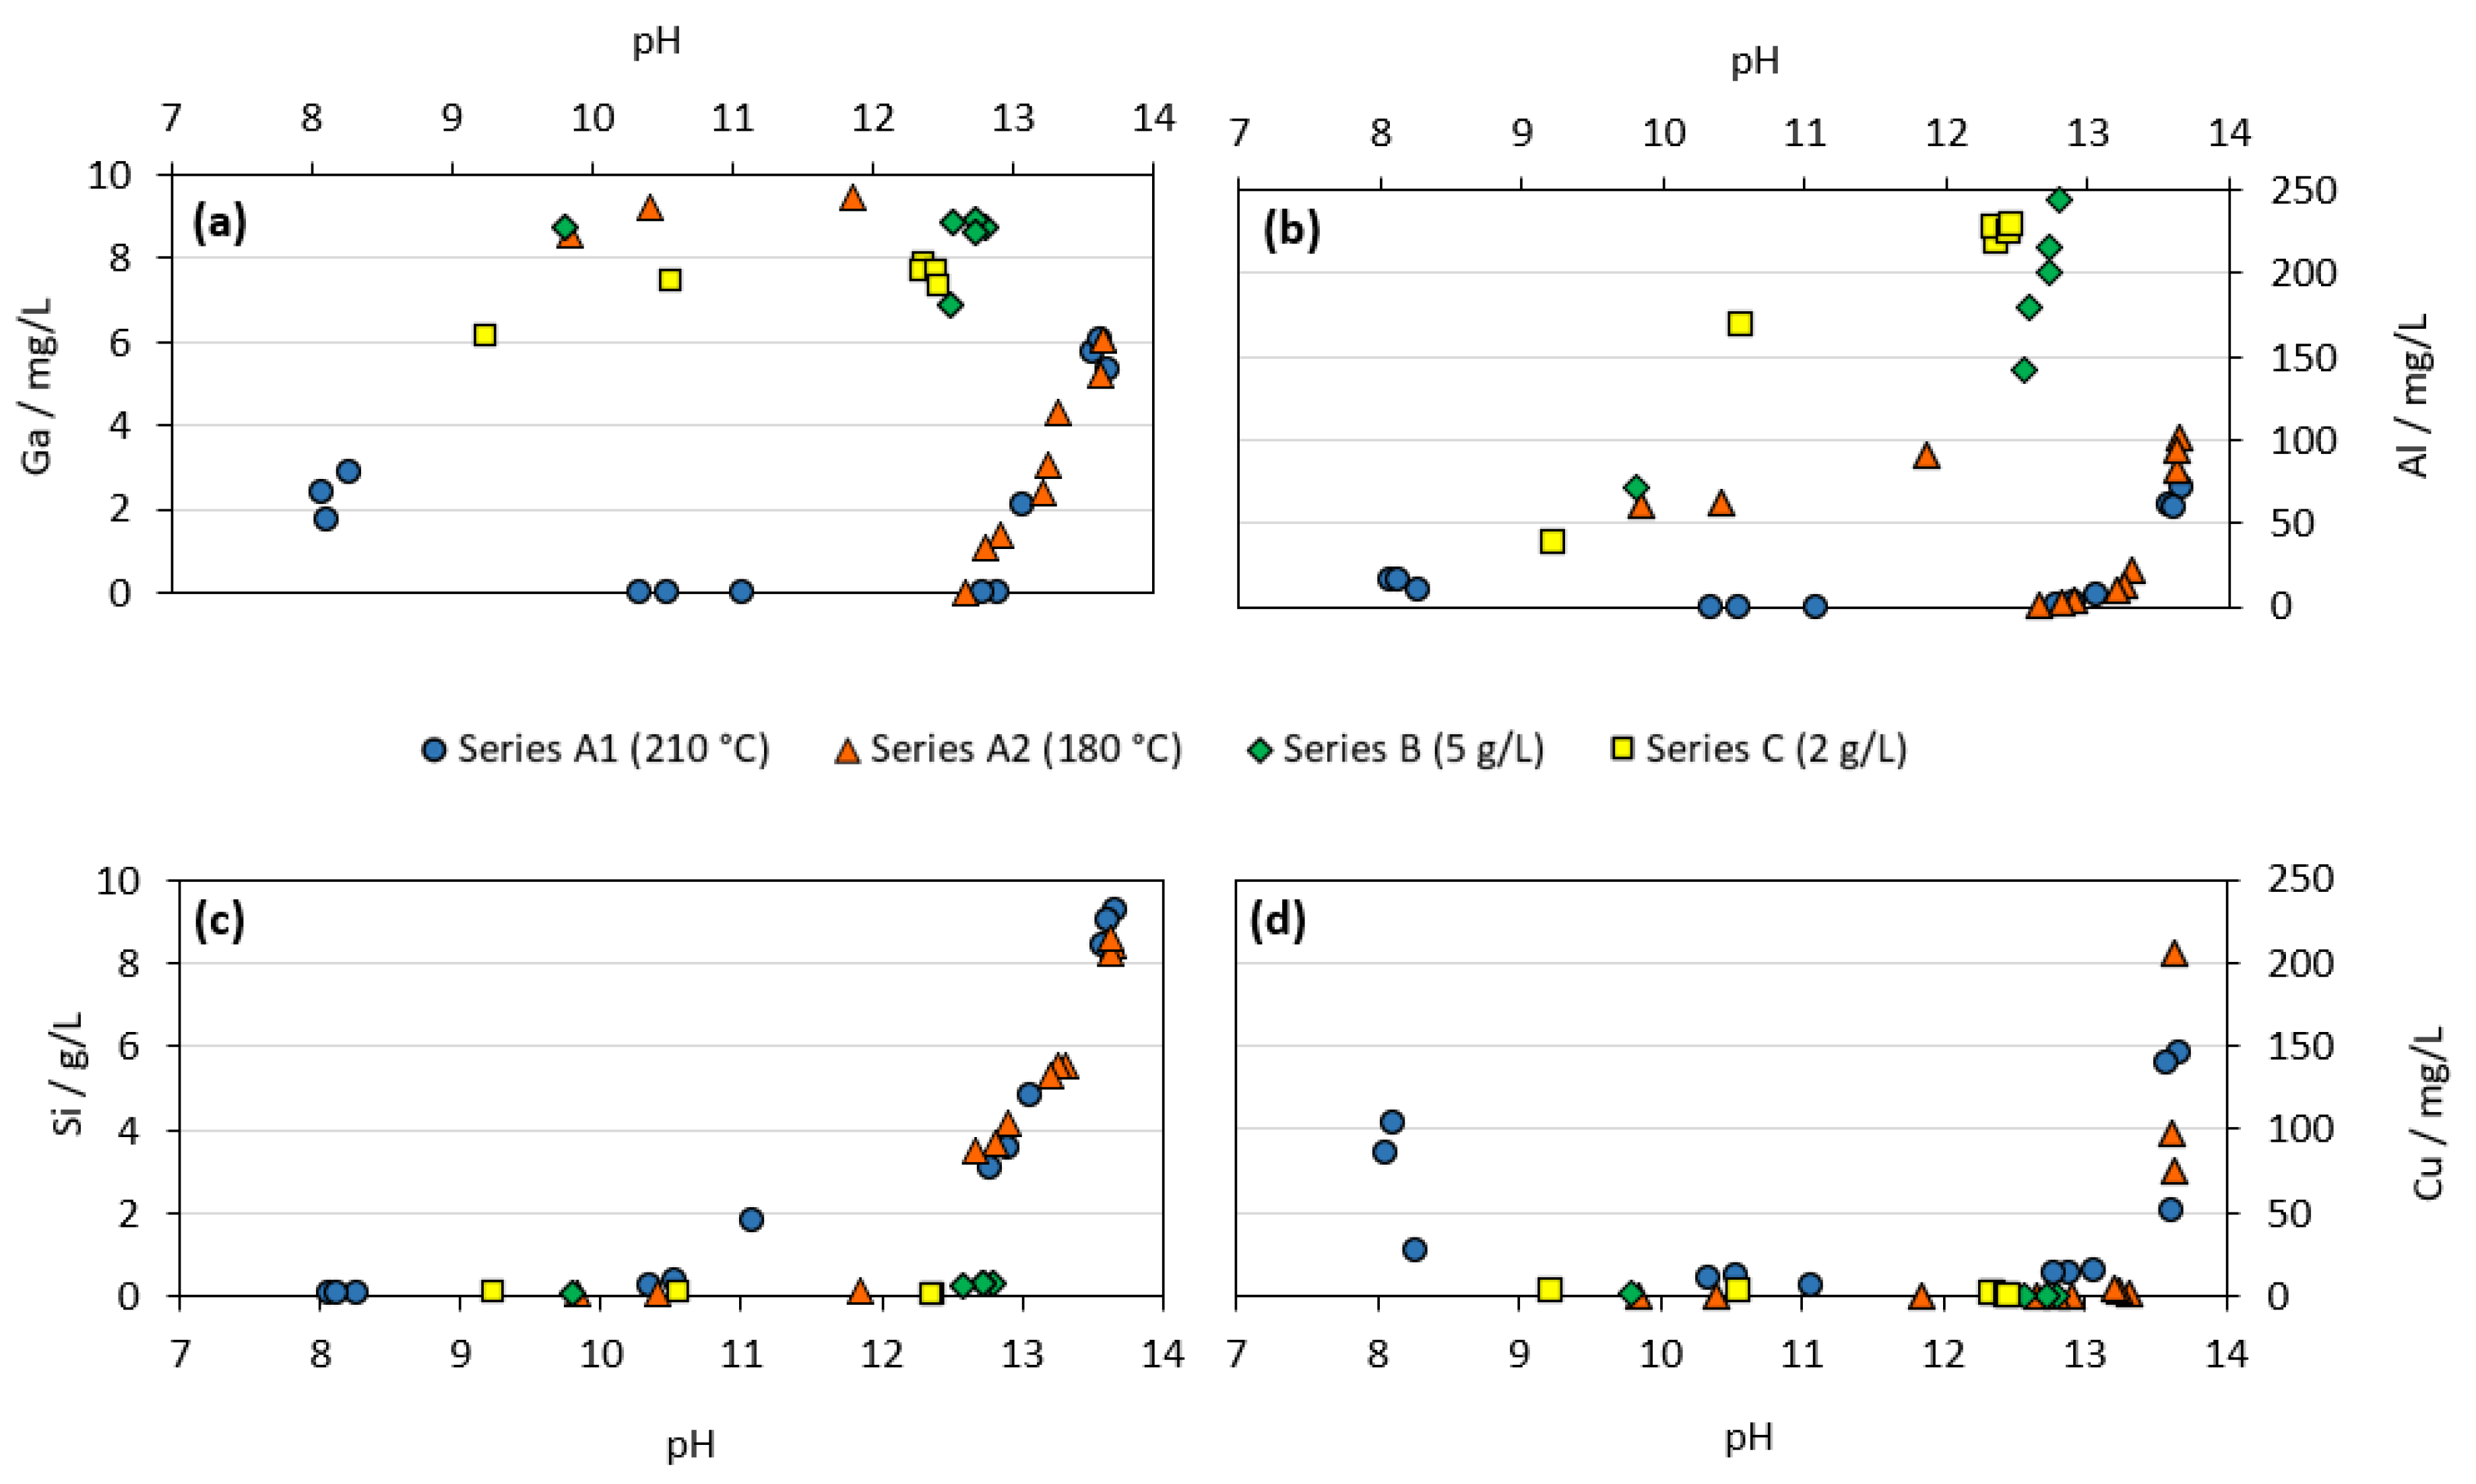
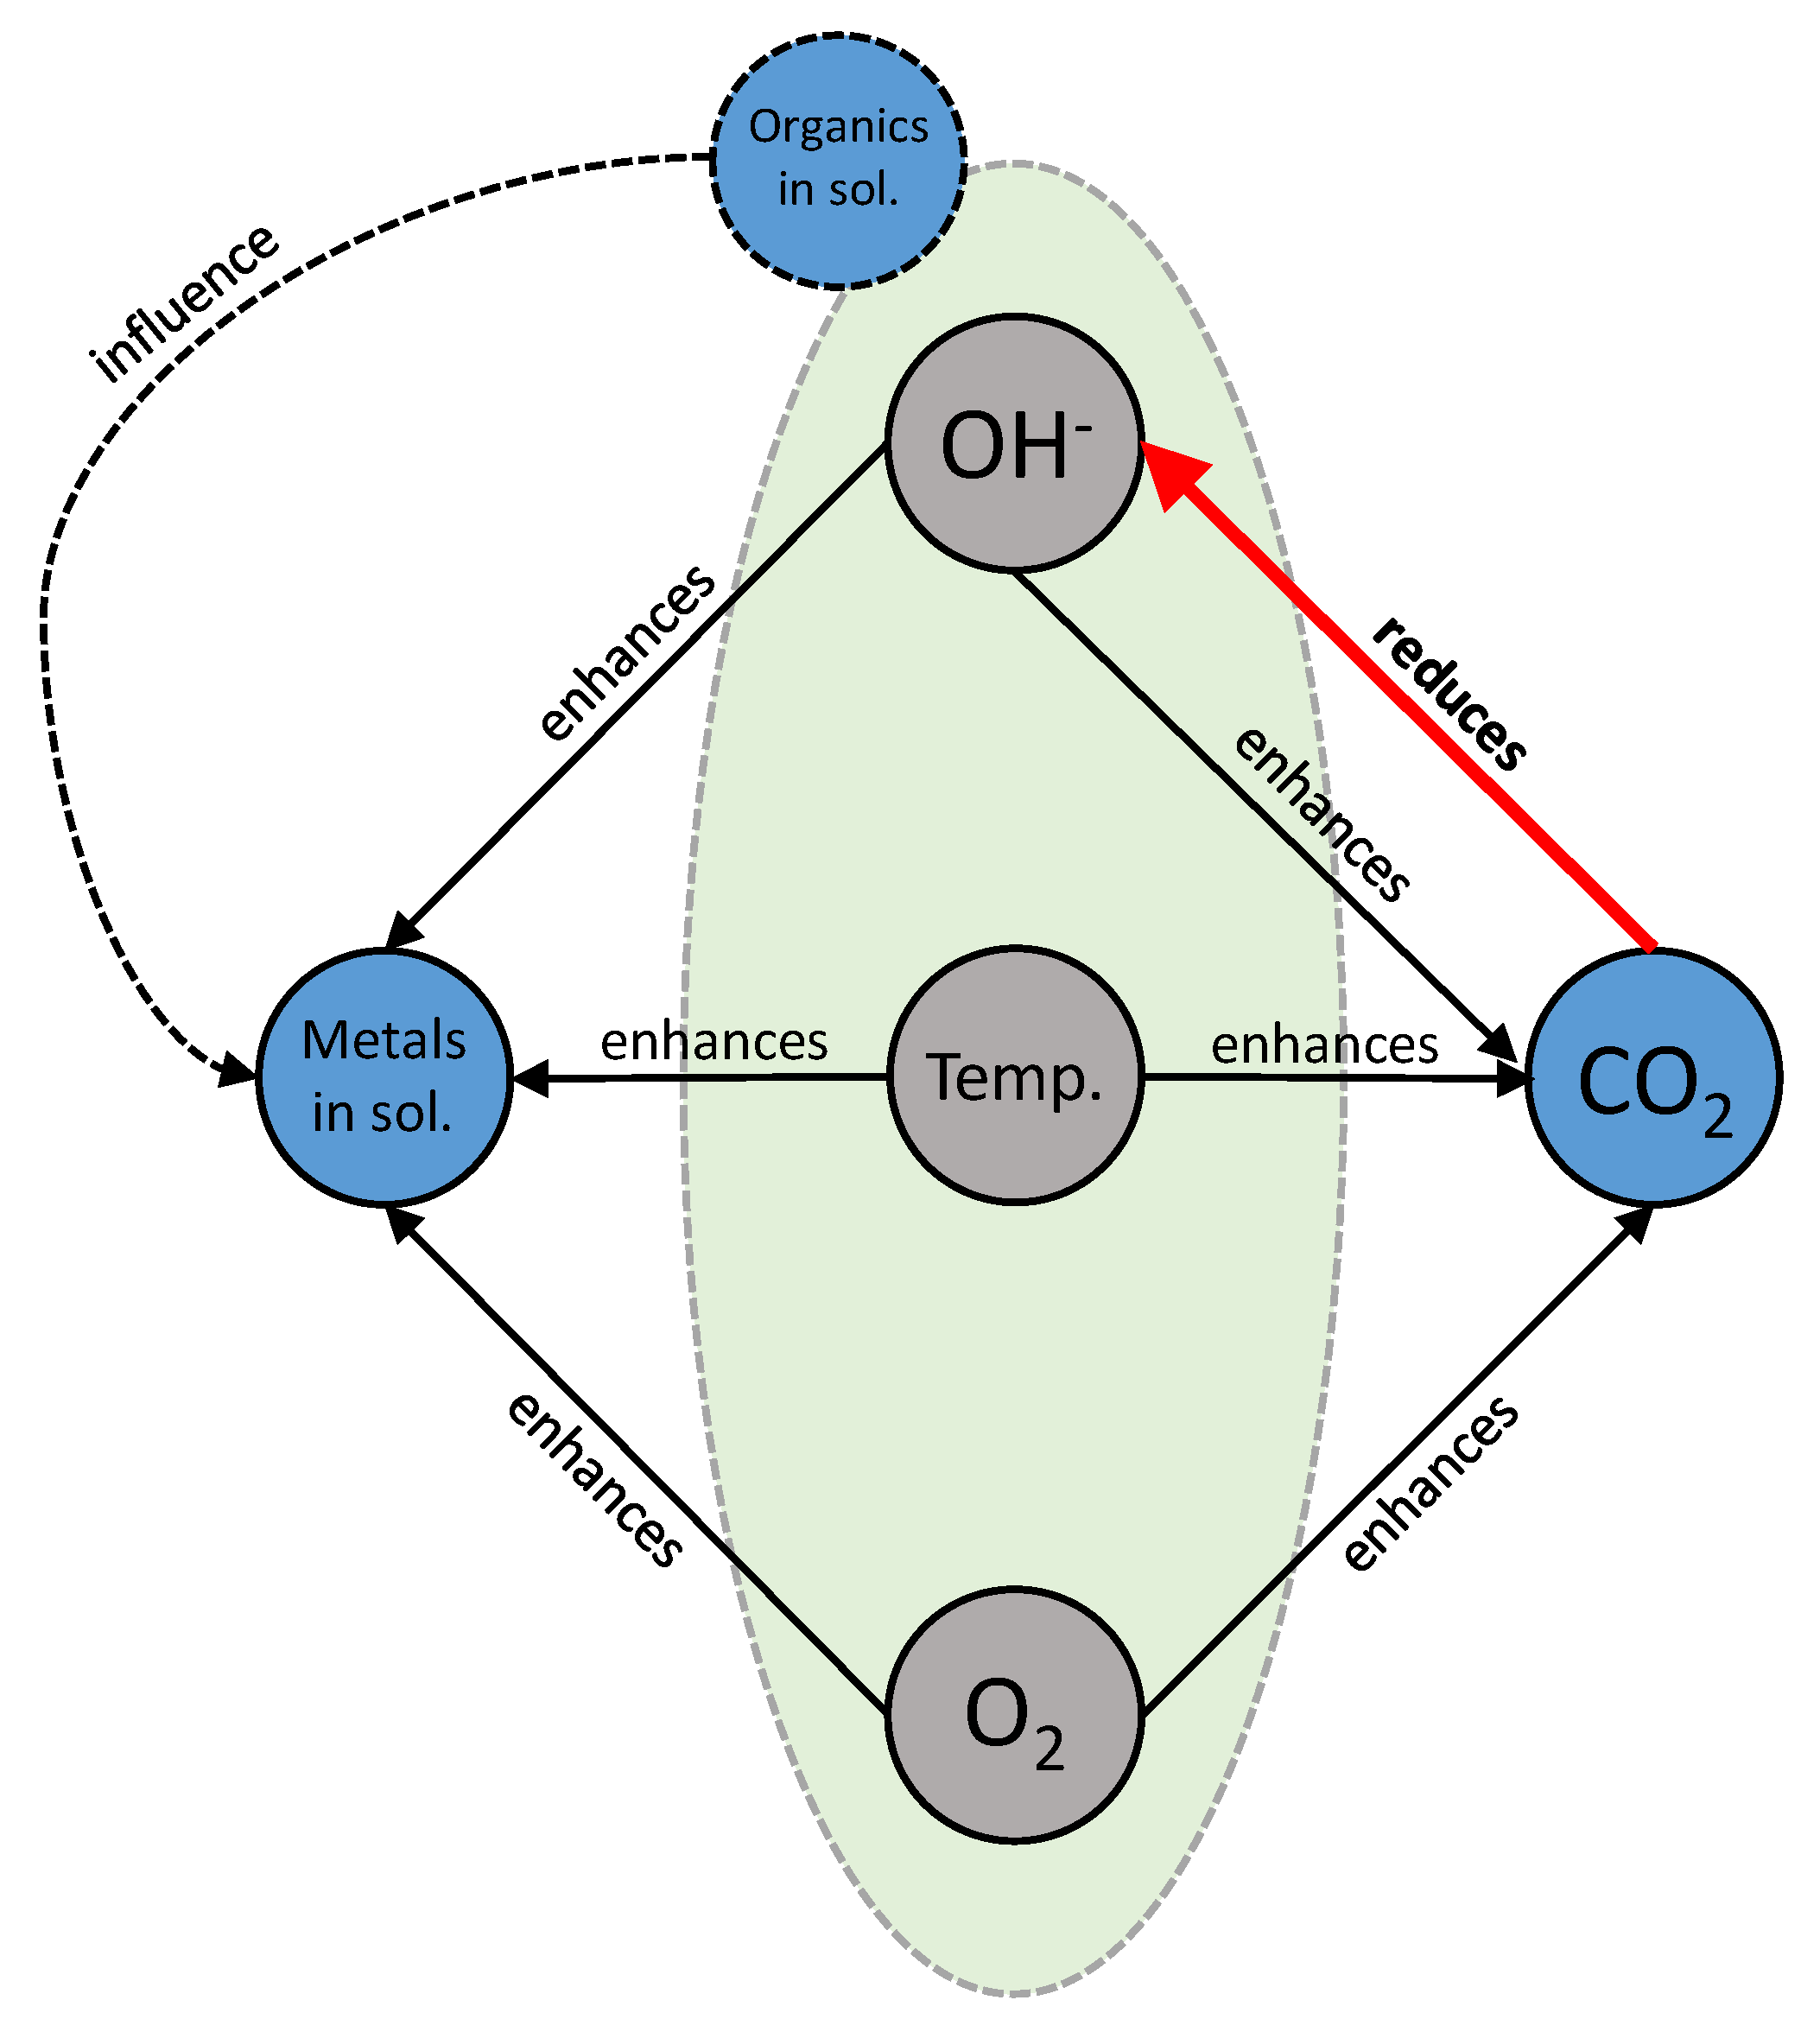
6.6. The Influence of the pH on Metal Solubility and Summary of Results

To summarize the results from series A1, A2, B, and C, Figure 15 illustrates the plot of the metal concentrations in the liquor versus the measured pH after all test runs. The pH values in the plot do not correlate with the initial alkali concentration because, in some experiments, the pH was drastically lowered by CO2 generation in situ. In the cases of silicon and copper, the extraction strongly depended on the pH and temperature. The only anomaly was a considerable copper dissolution around pH 8, which was related to the test runs at special conditions (210 °C, 5 g/L NaOH) and could be related to the influence of colloidal organic compounds.
Plots for silver and tin are not shown, because they exhibited the same performance as copper. Regarding aluminum and gallium, a completely different situation was demonstrated: gallium possesses a high solubility within a wide pH range, which even exceeded the solubility area from previous calculations (Figure 2). This unexpected Ga solubility at low pH fits with the observations made by Ramos-Ruiz et al. [12]. Probably, the fate of the elements is affected by formation of organic complexes, which could not be confirmed. Apart from low pH values, the situation around pH 12.5 is remarkable for both Ga and Al. It is clear that high pH values were not required to achieve high extraction rates. Clearly, mild conditions, as set in series B and C, produced much higher extraction rates than did a harsh environment.
The interdependence of all leach parameters in the system is summarized graphically in Figure 16. The grey colored spots represent the initial process parameters (OH-concentration, temperature, and O2-pressure), whereas the blue spots are associated with intermediate products (formed CO2, the amount of metals in the solution, and formed organics). As already mentioned, we assume that the formation of dissolved organics depended on the alkali concentration, temperature, and oxygen pressure, which are indicated by the green oval area. However, neither the mechanism of formation, nor the exact influence of these compounds on metal extraction could be clarified.

6.7. Outlook

Clearly, there is space for subsequent studies to obtain further information on the interdependence of all process parameters and (intermediate) products in the examined system. In this context, optimizing the gallium extraction must be the final goal. A kinetic study on the oxidation and dissolution of gallium as well as the oxidation of carbon would be a promising approach. An investigation of organic compounds in the system would also provide valuable information. If there is a complexion or colloidal behavior of these substances, they could be applied for beneficial purposes as well.
In order to finally extract gallium from the solution, the liquor can be treated according to the known processes which refer to the gallium extraction from Bayer liquor [13,14,15,16,17,18] (see Section 3.1). Another innovative approach for Ga recovery from acidic and alkaline solutions was developed by Stelter and Zeidler [31] by using dialysis and electrolysis.
The leach residue can be further processed aiming for extraction of precious and base metals (Ag, Au, Cu, Sn) which are not dissolved during leaching. Due to carbon in the material, reductive pyrometallurgical smelting will be an appropriate way to accomplish this aim.

7. Conclusions

The presented experimental trials have demonstrated that it was possible to achieve a maximum gallium extraction rate of 82% at 180 °C, 5 g/L NaOH, 5 bar oxygen, and 1 h of residence time. Other elements, such as silicon, copper, tin, and silver, were not or were marginally co-extracted as high recovery rates of Ga were obtained. Due to the isomorphic similarity of gallium and aluminum, a certain co-extraction of the latter must be accepted. We further found, that gallium extraction decreased to values between 60% and 68% at lower amounts of alkali, oxygen, and heat. Simultaneously, the coextraction of other elements (except aluminum) was lowered drastically. The application of harsh conditions (T > 180 °C, c(NaOH) > 5 g/L, P(O2) > 5 bar) was proved to be inappropriate, because the gallium yield became lower and the enrichment of impurities in the liquor increased. Another important finding of this work is the subordinated role of pH in gallium dissolution.
Due to the high content of organic carbon in the fines, we determined that several other mechanisms and reactions occurred in addition to the actual leach reaction. One of those mechanisms is the oxidation of organic carbon and the subsequent formation of CO2. Hence, the pH was lowered in situ, which makes the process difficult to control at elevated temperatures (180 °C and higher). As soon as the temperature and NaOH concentration were lowered, the carbon oxidation and NaOH consumption were reduced significantly. There was evidence for the generation of organic compounds that affected extraction rates of various elements, including gallium.
Overall, oxidative alkaline pressure leaching was shown to be a suitable procedure to separate gallium from pyrolyzed smartphones. The process was proved to be selective and can be realized easily with low investments of energy and reagents.

Author Contributions

Conceptualization, methodology, calculations, experimental work, writing, and original draft preparation: B.F. (Benedikt Flerus); supervision and resources: B.F. (Bernd Friedrich). All authors have read and agreed to the published version of the manuscript.

Funding

This research received no external funding

Conflicts of Interest

The authors declare no conflict of interest.

References

  1. Reuter, M.A.; Hudson, C.; van Schaik, A.; Heiskanen, K.; Meskers, C.; Hagelüken, C. Metal Recycling: Opportunities, Limits, Infrastructure; Report 2b of the Global Metal Flows Working Group of the International Resource Panel of UNEP; United Nations Environment Programme: Nairobi, Kenya, 2013. [Google Scholar]
  2. Bakas, I.; Fischer, C.; Haselsteiner, S.; McKinnon, D.; Milios, L. Present and Potential Future Recycling of Critical Metals in WEEE; Report; Copenhagen Resource Institute: Copenhagen, Denmark, 2014. [Google Scholar]
  3. Forti, V.; Baldé, C.P.; Kuehr, R.; Bel, G. Global E-Waste Monitor 2020: Quantities, Flows and the Circular Economy Potential; Report; United Nations University (UNU)/United Nations Institute for Training and Research (UNITAR)—Co-Hosted SCYCLE Programme, International Telecommunication Union (ITU) & International Solid Waste Association (ISWA): Bonn, Germany; Geneva, Switzerland; Rotterdam, The Netherlands, 2020. [Google Scholar]
  4. Flerus, B.; Billmann, L.; Bokelmann, K.; Stauber, R.; Friedrich, B. Recovery of Gallium from Smartphones—Part I: Thermal and Mechanical Pretreatment. In Proceedings of the European Metallurgical Conference 2019, Düsseldorf, Germany, 25 June 2019; GDMB Verlag GmbH: Clausthal-Zellerfeld, Germany, 2019. [Google Scholar]
  5. Hsin-Hsiung, H. STABCAL; Montana Tech: Butte, MT, USA, 2019. [Google Scholar]
  6. Naumov, G.B.; Ryzhenko, B.N.; Khodakovskii, I.L.; Barnes, I.; Speltz, V. Handbook of Thermodynamic Data; U.S. Geological Survey, Water Resources Division: Menlo Park, CA, USA, 1974.
  7. Liu, G.G. Electrochemical Behaviour of Gallium Arsenide. Master’s Thesis, University of British Columbia, Vancouver, CO, USA, 1991. [Google Scholar]
  8. Price, J.M.; Barnett, J.; Raghavan, S.; Keswani, M.; Govindarajan, R. A study of the interaction of gallium arsenide with wet chemical formulations using thermodynamic calculations and spectroscopic ellipsometry. Microelectron. Eng. 2010, 87, 1661–1664. [Google Scholar] [CrossRef]
  9. Sipos, P.; Megyes, T.; Berkesi, O. The Structure of Gallium in Strongly Alkaline, Highly Concentrated Gallate Solutions—A Raman and 71Ga-NMR Spectroscopic Study. J. Solut. Chem. 2008, 37, 1411–1418. [Google Scholar] [CrossRef]
  10. Pourbaix, M. Atlas of Electrochemical Equilibria in Aqueous Solutions, 2nd ed.; National Association of Corrosion Engineers: Houston, TX, USA, 1974; ISBN 9780915567980. [Google Scholar]
  11. Kelly, J.J.; Reynders, A.C. A study of GaAs etching in alkaline H2O2 solutions. Appl. Surf. Sci. 1987, 29, 149–164. [Google Scholar] [CrossRef]
  12. Ramos-Ruiz, A.; Field, J.A.; Sun, W.; Sierra-Alvarez, R. Gallium arsenide (GaAs) leaching behavior and surface chemistry changes in response to pH and O2. Waste Manag. 2018, 77, 1–9. [Google Scholar] [CrossRef] [PubMed]
  13. Zhao, Z.; Yang, Y.; Xiao, Y.; Fan, Y. Recovery of gallium from Bayer liquor: A review. Hydrometallurgy 2012, 125–126, 115–124. [Google Scholar] [CrossRef]
  14. Beja, M. Method of Extracting Gallium Oxide from Aluminous Substances. U.S. Patent 2,574,008, 6 November 1951. [Google Scholar]
  15. Arpe, H.-J.; Ullmann, F. Ullmann’s Encyclopedia of Industrial Chemistry. Gallium and Gallium Compounds, 5th ed.; Wiley-VCH Verlag GmbH & Co. KgaA: Weinheim, Germany, 1989; ISBN 3527201122. [Google Scholar]
  16. Bartholomé, E.; Ullmann, F. Ullmanns Encyklopädie der Technischen Chemie. Gallium und Gallium-Verbindungen, 4th ed.; Verlag Chemie GmbH: Weinheim, Germany, 1972; ISBN 3527200002. [Google Scholar]
  17. Xu, F.-J.; Xu, N.-Z. Gallium Production of Three Stage Carbonization Process. Henan Chem. Ind. 2002, 10, 21–24. [Google Scholar]
  18. Lilia, A.; Pasechnik, S.; Yatsenko, P. Study of the Behaviour of Gallium during Reagent Carbonozation of Aluminate and Zinate Solutions. Chem. Sustain. Dev. 2004, 12, 239–241. [Google Scholar]
  19. Wen, K.; Jiang, F.; Zhou, X.; Sun, Z. Recovery of Gallium from Corundum Flue Dust by Two-Stage Alkali Leaching, Carbonation, Acid Leaching and Solvent Extraction Process. Metals 2018, 8, 545. [Google Scholar] [CrossRef] [Green Version]
  20. Abdulvaliyev, R.A.; Akcil, A.; Gladyshev, S.V.; Tastanov, E.A.; Beisembekova, K.O.; Akhmadiyeva, N.K.; Deveci, H. Gallium and vanadium extraction from red mud of Turkish alumina refinery plant: Hydrogarnet process. Hydrometallurgy 2015, 157, 72–77. [Google Scholar] [CrossRef]
  21. Solomon, I.J.; Eisenber, W.C.; Giori, C.; Yamauchi, T. The Utilization of Coal Conversion Process by-Products; Report; United States Department of Energy: Washington, DC, USA, 1978.
  22. Kamiya, Y. Formation of aromatic polycarboxylic acids from bituminous coal by oxygen-oxidation in alkaline medium. Fuel 1961, 40, 149–153. [Google Scholar]
  23. Wang, W.; Hou, Y.; Wu, W.; Niu, M.; Liu, W. Production of Benzene Polycarboxylic Acids from Lignite by Alkali-Oxygen Oxidation. Ind. Eng. Chem. Res. 2012, 51, 14994–15003. [Google Scholar] [CrossRef]
  24. Wang, W.; Hou, Y.; Wu, W.; Niu, M.; Wu, T. High-Temperature Alkali-Oxygen Oxidation of Lignite to Produce Benzene Polycarboxylic Acids. Ind. Eng. Chem. Res. 2013, 52, 680–685. [Google Scholar] [CrossRef]
  25. Kapo, G.; Calvert, S. Liquid Phase Oxidation of Coal in Alkali. Ind. Eng. Chem. Proc. Des. Dev. 1966, 5, 97–104. [Google Scholar] [CrossRef]
  26. Miura, K.; Mae, K.; Okutsu, H.; Mizutani, N. New Oxidative Degradation Method for Producing Fatty Acids in High Yields and High Selectivity from Low-Rank Coals. Energy Fuels 1996, 10, 1196–1201. [Google Scholar] [CrossRef]
  27. Mae, K.; Shindo, H.; Miura, K. A New Two-Step Oxidative Degradation Method for Producing Valuable Chemicals from Low Rank Coals under Mild Conditions. Energy Fuels 2001, 15, 611–617. [Google Scholar] [CrossRef]
  28. Karnowo; Kudo, S.; Mori, A.; Zahara, Z.F.; Norinaga, K.; Hayashi, J. Modification of Reactivity and Strength of Formed Coke from Victorian Lignite by Leaching of Metallic Species. ISIJ Int. 2015, 55, 765–774. [Google Scholar] [CrossRef] [Green Version]
  29. Stopic, S.; Dertmann, C.; Sievers, M.; Koiwa, I.; Knops, P.; Friedrich, B. High pressure carbonation of olivine. In Proceedings of the European Metallurgical Conference 2019, Düsseldorf, Germany, 25 June 2019; GDMB Verlag GmbH: Clausthal-Zellerfeld, Germany, 2019. [Google Scholar]
  30. Wade, K.; Banister, A.J.; Bailar, J.C.; Emeléus, H.J.; Nyholm, R. The Chemistry of Aluminum, Gallium, Indium and Thallium. Comprehensive Inorganic Chemistry, 1st ed.; Elsevier Reference Monographs: Saint Louis, MO, USA, 1973; ISBN 9781483153223. [Google Scholar]
  31. Zeidler, O.; Stelter, M. Recycling von Gallium aus Prozessrückständen. Recycling und Rohstoffe, Band 6; TK Verlag Karl Thomé-Kozmiensky: Neuruppin, Germany, 2013. [Google Scholar]
Figure 1. Process chain for the production of a gallium-rich fraction from used smartphones [4].
Metals 10 01565 g001
Figure 2. E-pH diagrams for Ga (a) and As (b) with c(GaAs) = 10−4 mol/L.
Metals 10 01565 g002
Figure 3. Oxidation of coal and anthracene depending on oxygen amount [23].
Metals 10 01565 g003
Figure 4. The autoclave including the peripheral device (a) and cross-section of the pressure vessel (b): 1: pressure hose; 2: needle valve; 3: exhaust; 4: stainless steel shell with heating and cooling elements; 5: thermocouple and baffle; 6: propeller; 7: bottom outlet (liquids); 8: pressure gauge; 9: motor for stirrer; 10: connection wire to interface; 11: gas inlet; 12: pressure sensor; 13: reaction space [29].
Metals 10 01565 g004
Figure 5. The pressure course during leaching at 210 °C and 10 bar initial oxygen pressure.
Metals 10 01565 g005
Figure 6. The mass loss at 180 °C/series A2 (a); the mass loss at 210 °C/series A1 (b); the pressure loss at 180 °C/series A2 (c); the pressure loss at 210 °C/series A1 (d); constants: 1 h, 800 rpm, S/L: 0.1.
Metals 10 01565 g006
Figure 7. The carbon content in the leach residue of series A1 and A2; constants: 1 h, 800 rpm, S/L: 0.1.
Metals 10 01565 g007
Figure 8. The difference in the pH and calculated consumption of OH at 180 °C/series A2 (a) and 210 °C/series A1 (b); constants: 1 h, 800 rpm, S/L: 0.1; caption horizontal axis: NaOH conc./oxygen pressure.
Metals 10 01565 g008
Figure 9. The gallium concentration in the liquor and max. yield at 180 °C (a) and 210 °C (b); the aluminum concentration in the liquor at 180 °C (c) and 210 °C (d); constants: 1 h, 800 rpm, S/L: 0.1.
Metals 10 01565 g009
Figure 10. The copper concentration in the liquor at 180 °C (a) and 210 °C (b); the silver concentration in the liquor at 180 °C (c) and 210 °C (d); constants: 1 h, 800 rpm, S/L: 0.1.
Metals 10 01565 g010
Figure 11. The silicon concentration in the liquor at 180 °C (a) and 210 °C (b); the tin concentration in the liquor at 180 °C (c) and 210 °C (d); constants: 1 h, 800 rpm, S/L: 0.1.
Metals 10 01565 g011
Figure 12. The elemental concentrations of gallium (a), aluminum (b), silicon (c), and tin (d) in the liquor after trial series B; the (maximum) gallium yield is indicated additionally; constants: 5 g/L NaOH, 5 bar O2, 800 rpm, S/L = 0.1.
Metals 10 01565 g012
Figure 13. The elemental concentrations of gallium (a), aluminum (b), silicon (c), and tin (d) in the liquor after trial series C; the (maximum) gallium yield is indicated additionally; constants: 2 g/L NaOH, 1 h, 800 rpm, S/L = 0.1.
Metals 10 01565 g013
Figure 14. The OH consumption in series B (a) and C (b); the residual carbon in series B (c) and C (d).
Metals 10 01565 g014
Figure 15. Elemental concentrations of gallium (a), aluminum (b), silicon (c), and copper (d) at a final pH after leaching for all test runs (series A1, A2, B, and C).
Metals 10 01565 g015
Figure 16. The influence of the leaching conditions on the (intermediate) products.
Metals 10 01565 g016
Table 1. Elemental composition of fines.
Elementconc. in Fines
Ag0.14wt.%
Al5.82wt.%
As19ppm
Au325ppm
Cu5.06wt.%
Dy306ppm
Fe2.48wt.%
Ga116ppm
Nd0.56wt.%
Si19.85wt.%
Sn1.37wt.%
Zn0.28wt.%
Table 2. Carbon analysis of fines; TIC = total inorganic carbon, TOC = total organic carbon, EC = elemental carbon, and TC = total carbon.
TIC/wt.%TOC/wt.%EC/wt.%TC/wt.%
0.249.770.5810.60
Table 3. The examined parameters during the leaching experiments.
SeriesT/°Ctresidence/minNaOH/g/LpOx/barStirr. Speed/rpmS/L/g/mL
A1210605–1005–158000.1
A2180605–1005–158000.1
B120–18060, 120558000.1
C90–1806011, 58000.1
Publisher’s Note: MDPI stays neutral with regard to jurisdictional claims in published maps and institutional affiliations.

