Article

Evaluation of Welded Joints in P91 Steel under Different Heat-Treatment Conditions

by
Francisco José Gomes Silva
1,2,*,
António Pedro Pinho
1,
António Bastos Pereira
2 and
Olga Coutinho Paiva
1
1
ISEP—School of Engineering, Polytechnic of Porto, 4200-072 Porto, Portugal
2
TEMA—Centre for Mechanical Technology and Automation, Department of Mechanical Engineering, University of Aveiro, Campus de Santiago, 3810-193 Aveiro, Portugal
*
Author to whom correspondence should be addressed.
Metals 2020, 10(1), 99; https://doi.org/10.3390/met10010099
Submission received: 18 December 2019 / Revised: 5 January 2020 / Accepted: 7 January 2020 / Published: 8 January 2020
(This article belongs to the Special Issue Characterization of Welded Joints)

Abstract

:
P91 steel has been of interest to many researchers over the past two decades. This interest is because this steel has very interesting characteristics for application in power plants, where it is common to have pipes that need to support steam at temperatures between 570 and 600 °C, and at pressures in the range of 170 to 230 bar. These working conditions are quite severe for most common steels, requiring increased high-temperature mechanical strength as well as high creep resistance. The manufacture of these pipes normally includes welding operations, which must preserve the main characteristics of this type of steel. This justifies the concern of the researchers to ensure the best welding conditions so that the preservation of the properties of these steels becomes possible. The present work intends to depict the best results obtained varying the heat-treatment conditions applied to weldments made on heat-resistant steel P91. This steel usually takes the designation SA 213 T91 (seamless tube) or SA 335 P91 (seamless pipe), according to ASME II, as well as the designation X10CrMOVNb9-1 according to EN 10216-2. The purpose of this study is to compare the behavior of pipe welding under different post-welding heat-treatment (PWHT) conditions. One of them is performed with thermal cycles (preheating, post-heating, and the post-weld heat treatment) in agreement with most construction codes and standard rules. The second one is performed without any thermal cycle before and after welding. Both welds were made by the same process, TIG (Tungsten Inert Gas, or GTAW—Gas Tungsten Arc Welding) in the horizontal position (2G according to ASME IX) and the same welding parameters. In order to evaluate the results obtained in the welds, microstructure analyses, hardness measurements, bending tests, and tensile tests at room and high temperature (600 °C) have been performed. Other tests were also carried out according to the quality procedures, such as visual, penetrant dye, and X-ray tests. Regarding the different strategies used in the heat treatments, the best results have been obtained using a strategy similar to the one currently in use and recommended by construction codes and steel manufacturers but excluding the phases’ transformation time, and it was possible to observe that the tensile strength is impaired by about 2% to 9% at room and elevated temperatures, respectively; the elongation is reduced by 39% at room temperature but keeps a good performance at elevated temperature; the hardness profile is very similar at both temperatures; the microstructure presented is compatible with the requirements; and no cracking trend has been reported. Thus, a new strategy for the welding heat treatment of grade 91 steels was drawn, saving energy and processing time.

1. Introduction

Grade 91 steel was developed based on steels that emerged in the 1960s with typically 12% Cr content. The development of grade 91 was mainly due to creep problems, as 12% Cr steels traditionally failed when exposed to prolonged creep conditions such as those in power plants where these steels were used, exposing them to high pressures and temperatures of around 565 °C. Thus, steels with increased creep resistance have emerged. Grade 91 was originally developed by Oak Ridge National Laboratory in Tennessee, USA, typically consisting of 9% Cr and 1% Mo, which were initially called P9 steel presented as its main focus use in power plants [1]. Subsequently, this steel was studied and its composition was evolved through the addition of other elements, such as vanadium and Nb, and with controlled N content, thus giving rise to 91 steel grade. This new grade of steel substituted the P22 steel grade and can assume various designations, unfolding under designations such as SA 213 P91 (seamless tube) and SA 335 P1 (seamless pipe) according to ASTM, or X10CrMoVNb9-1 according to BS EN 10216-2 [2]. The P91 steel grade also responded to the demand for the increased efficiency of power plants, which now need to operate at higher temperatures in order to release lower amounts of CO2 for the same volume of energy generated. Indeed, the latest composition of the P91 steel grade allows continuous working at temperatures in the range of 600 °C without being affected by creep phenomena, even under elevated stress conditions. Since welding of the various components that form part of the power plants is required, P91 steel has been the subject of numerous studies, most of which are briefly described below. The excellent properties of P91 steel also come from the careful distribution of fine Nb and V carbonitrides, which have a microstructure that can be changed during the welding process [3].
Several researchers have devoted their attention to the characterization of P91 steel welds made using different processes. In a recent study, Vidyarthy and Dwivedi [4] compared the use of TIG and A-TIG (Activated Flux TIG) processes (GTAW) on P91 steel welds, investigating the influence of CeO2 and MoO3-based activating flux on some factors that strongly condition welding, such as such as heat input, weld bead geometry, and angular distortion during single-pass execution. The use of A-TIG aims to overcome the productivity limitations imposed by the conventional TIG process, which is essentially geared to small thicknesses. The thin activated flow layer used in the A-TIG process substantially improves the process productivity [5]. Welding beads performed by both processes were also investigated, analyzing the resulting microstructure, mechanical strength, microhardness, and impact strength (Charpy). It was observed that for the same set of parameters used in both welding processes, the A-TIG process promoted an increase in the heat input transmitted to the joint due to the action of the activating fluxes, which resulted in an increase of 200% in the joint penetration when CeO2 flux is used, and 300% when MoO3 flux is used, compared to the conventional TIG process. In the analysis of welded joints, other benefits were also observed, such as less angular distortion, which dropped from 1.96° in conventional TIG welding to 0.78° using CeO2 flux or 0.12° when using MoO3 flux. The microstructure was predominantly dominated by martensite in the welding zone, and coarse precipitates such as M23C6 carbides were also observed in the primary austenite grain boundaries. The ultimate tensile strength (UTS) in welded samples increased by 2% related to the parent metal, and the microhardness increased as well. Conversely, impact resistance decreased in the A-TIG process compared to the conventional TIG process. Dhandha and Bandheka [5] also studied the A-TIG process applied to P91 steel using as fluxes Fe2O3, ZnO, MnO2, and CrO3. These authors also confirmed that penetration is always improved at least 100% using these kind of activated fluxes in that process, and a decrease in bead width was observed as well, as usually required. The best results were achieved using ZnO activated flux. The surface appearance/morphology of the weldments was considered as very good.
Marzocca et al. [3] studied P91 steel welds performed by means of the flux cored arc welding (FCAW) process, using two different rutilic filler metals (E91T1 and E91T1-G) and 80% Ar/20% CO2 shielding gas. The main focus of that work was to study the resulting microstructure of the welded zone, using five welding passes to fill up the chamfer previously prepared and a heat input energy of 1.5 kJ/mm. M23C6 carbides were found in all zones, i.e., the parent metal (PM), fused zone (FZ), and heat-affected zone (HAZ). VN (Vanadium-based) precipitates were also observed in all zones but with a decreased size and greater dispersion. However, NbCN was only found in the PM and HAZ. In addition, trying to overcome the lack of productivity characteristic of the conventional TIG process, Krishnan et al. [6] used the pulsed gas arc welding (GMAW-P) process using a cored wire filler material to weld 12 mm thick P91 steel sheets in a single pass. The authors reported that the best welding results were obtained using 75° bevel aperture and 1.38 kJ/mm heat input, which corresponds to a welding speed of 320 mm/min and a current intensity of 270 A. Very interesting properties of mechanical strength (UTS = 812–849 MPa) and the impact strength of the weld bead (104–127 J) have also been reported. The deposition rate with flux cored wire was increased by about 42% compared to the use of a common solid wire, considering the same set of parameters and welding conditions. Other authors using the same process reported a significant decrease in the defects generated during the welding process, namely spatter, welding porosity, and lack of fusion decreasing, as well the weld width [7,8]. Other processes such as shielded metal arc welding (SMAW), submerged arc welding (SAW), and flux cored arc welding (FCAW) have also been tested to maximize the welding efficiency of P91 steels, but non-metallic inclusions have been observed in the weld beads, loss of toughness, and excessively high oxygen content in the welds, considering the studies conducted during the 2000–2009 decade [9,10]. However, a further study developed by Arivazhagan and Kamaraj [11] in 2015 is in line with other works published more recently, which reported a very low amount of fine microinclusions less than 2 μm in size, allowing toughness values around 47 J. However, this value can be improved by 15%–25% using 100% Argon instead 80% Ar/20% CO2. An increase in the post-welding heat-treatment (PWHT) duration at 760 °C from 2 to 5 h has been reported as the main factor behind the 30% to 50% toughness improvement in welded joints.
Shanmugarajan et al. [12] used an autogenous laser beam in P91 steel welding but reported the presence of the delta ferrite phase in the weld beads, which was attributed to the amount of heat given to the joint. Kundu et al. [13] used an electron beam to weld P91 steel, but too high residual stresses were observed in welding of thicker thicknesses. In order to increase the efficiency in the GTAW process, Pai et al. [14] reached an increased filler metal deposition rate using it in preheated conditions, but in contrast, they observed a significant decrease in the joint toughness, which was attributed to the excessive heat passed to the joint in the process.
One of the main problems that has been worrying researchers is the possible drop in toughness and creep behavior due to the welding process. This has motivated several studies. El-Dosoky et al. [15] investigated the behavior of welded joints subjected to prolonged exposure at 600 °C under 120 MPa and 70 MPa loads, verifying that the creep resistance is conditioned by the fine grain of the heat-affected zone (FGHAZ). It has also been reported that welded samples have a higher creep rate than the parent metal mainly in the tertiary region, and that creep begins earlier in welded samples relative to the parent metal for the same load applied at 600 °C. Hyde et al. [16] studied the crack growth in welded P91 steel samples by creep crack growth tests at 650 °C, using compact strain (CT) test specimens, comparing the results obtained experimentally with simulations performed by the finite element method (FEM). The authors also confirmed a good correlation between the creep crack growth rates in the P91 parent metal and the cross-weld specimens for a given contour-integral (C*) [17], in which the crack growth rate was 10 times higher in the cross-welded CT specimens than those of the parent metal. Using the same type of specimens, Kumar et al. [18] reported similar conclusions, adding the idea that the HAZ enables the faster generation and growth of cracks to the detriment of the parent material and melted zone, creating the best conditions for the deviation of crack paths from those zones to the HAZ. In addition, using CT specimens of P91 steel welded and non-welded, Venugopol et al. [19] reached similar conclusions, using the fracture mechanics parameter C*. The conclusion drawn by these researchers, which was later confirmed by other works already cited here, emphasized that the creep crack growth rate is higher at the HAZ, which is especially true when lower C* values are reported. A similar study was recently conducted by Baral et al. [20], using non-welded P91 steel samples and welded samples of the same material, in a temperature range between 600 and 650 °C, and loads between 50 and 180 MPa. The observations made by these authors allowed ratifying the previous opinion of other researchers, in which the influence of the Cr23C6 coarse grains in the HAZ intercritical zone is clear, significantly conditioning the creep resistance, and that the minimum creep rate clearly follows Norton’s power law. Trying to minimize the HAZ width, Divya et al. [21] carried out a comparative study between the laser welding (LW) of P91 steel welding, which leaves a HAZ of about 1 mm, with shielded metal arc welding (SMAW), which leaves a HAZ of about of 2.5 mm. The study was conducted to study the failure under creep conditions in the HAZ, which is commonly known as Type IV cracking. It was found that the microstructural damage induced by the LW is lower than in the case of the SMAW process. Although the width of the HAZ was effectively smaller in the case of LW, all specimens failed in the intercritical region of the HAZ. This shows that there is no benefit brought by LW in this case, because no significant improvements are brought to the Type IV cracking resistance. Wang et al. [22] performed PWHT at different temperatures on P91 welds, noting that there is a transition from Type IV cracking to Type I cracking in the HAZ intercritical region when moving from 600 to 840 °C treatment temperatures. In fact, the authors emphasize the idea that it is impossible to eliminate the HAZ intercritical region by PWHT if the temperature at which this treatment is performed does not exceed the Ac1 critical temperature of the parent metal. The intercritical structure formed on the basis of transformed austenite grains and untransformed ferrite grains in the fused zone may be the source of creep failure, i.e., Type IV cracking. These conclusions emphasize the importance of the temperature at which the PWHT must be conducted. Thus, PWHT conditions deserve special attention.
Sharma et al. [23] recently studied the effect of PWHT on welded P91 steel, reporting that the best conditions encountered to maximize the mechanical strength of welded pipe would be a 2 h treatment at 760 °C. In this study, the TIG process with heated wire was used, which allowed a smaller heat passage to the welded joint, minimizing the HAZ. In 2014, Venkata et al. [24] reported that the maximum temperature at which a PWHT should be performed is 770 °C and should always be lower than the austenite starting temperature (Ac1). In a study conducted in 2012 by Paddea et al. [25], the highest residual stresses (600 MPa) have been reported to be located near the outer boundary of the HAZ and toward the weld root in both PWHT and as-welded samples. As a result of these residual stresses, premature Type IV creep failures were observed in these 9–12% Cr (P92) steel welds. However, after PWHT, the residual stresses dropped to values around 50 MPa in the vicinity of the HAZ. Regardless of PWHT, the region where the highest level of residual stresses was measured has always been HAZ’s intercritical region, which is the most vulnerable to Type IV cracking phenomena. Pandey et al. [26] performed creep tests at a temperature of 620 °C and loaded in the range of 150 to 200 MPa in multi-pass welded samples in P91 steel both in an as-welded condition and subjected to a set of heat treatments after welding. This set of treatments consisted of keeping the samples at 760 °C for 2 h with subsequent air cooling, followed by a re-austenitization treatment at 1040 °C for 1 h, and then further tempering at 760 °C again for 2 h, with a new air cooling process. It was reported by the authors that this treatment substantially increased the creep life of the samples, especially for a 150 MPa load. Laves phases have also been reported, as well as the change in the preferred failure location which, when in the as-welded condition, was caused by Type IV cracking in the HAZ intercritical region, but when subjected to the latter treatment, the breaking zone happened in the base material because the treatment conveniently unifies the structure along the samples. The same results are also reported by some of the same authors in [27]. Similar experiments carried out by a similar team of authors but using multi-pass shielded arc welded metal (SMAW) in P91 steel butt joints on 18 mm thick plate samples, which showed that the hydrogen taken to the joint in the welding process (6.21 mL/100 g) gave rise to hydrogen embrittlement, which is a situation that cannot be overcome by the sequence of treatments performed (identical to that described above). However, without such a large content of hydrogen present, the treatment produces a clear uniformity of the microstructure in the welded samples [28].
Several studies focusing on welding P91 steel with other materials, i.e., dissimilar joint, including P92 steel [29], PM2000 steel [30], AISI 304 stainless steel [31], and IASI 316L stainless steel [32], have also been carried out. The results are promising and some of the problems reported above when using P91/P91 joints seem to tend to be softened, depending on the welding process and conditions used.
Studies in recent years reveal how important it is to know how to properly weld and treat P91 steel welds. Thus, this work aims to deepen the previous studies by performing different PWHT cycles to welded P91 steel samples, analyzing the resulting microstructure, mechanical strength, and hardness.

2. Materials and Methods

2.1. Materials

In order to carry out the experimental work, a pipe with Ø48.3 mm and a thickness of 5 mm in SA 355 P91 steel provided by Vallourec Brazil (Belo Horizonte, Brazil) was selected. Its chemical composition and main mechanical properties provided by the supplier can be seen in Table 1 and Table 2, respectively. The length of each sample was 150 mm, and the preparation (chamfer) was made in just one tip of the pipe. The preparation details can be seen in Table 3. Twenty-five samples have been produced under each set of conditions, in order to provide at least five samples for each kind of destructive test. The results of the tests carried out in this work present the average value followed by the standard deviation.
As filler metal, wire with Ø2 mm with the reference ER90S-B9 was used, which was provided by Electro Portugal, Lda. (Porto, Portugal); its chemical composition can be observed in Table 3. The mechanical properties of this filler metal follow the EN10204 standard. This filler metal was selected because it is recommended by the ASME manufacturing code for P91 steel.

2.2. Methods

Since the main objective of this work is to analyze the influence of different heat treatment cycles on P91 steel welded joints, the welding conditions were kept constant for producing the samples. Initially, the pipes were cut in a circular sawing machine Kaltenbach KKS 450 S, and the chamfer was performed in a conventional lathe Knuth V-Turn Pro (KNUTH Werkzeugmaschinen GmbH, Wasbek, Germany). After that, the samples were properly cleaned, avoiding the presence of chips. The welding process used in this work was GTAW in the position of 2G using a Kemppi (Kemppi, Lahti, Finland) Master TIG MLS 4000 multi-process power source welding machine. To perform the welding, the samples were properly aligned, and thermocouples were attached to the surface close to the weld joint. Following Kobelko’s recommendation for this type of material (between 0.8 and 1.6 kJ/mm), a thermal delivery of 1.33 kJ/mm was selected, which conditioned the welding parameters. Good engineering practice recommends that a current rating of about 45 A per each millimeter diameter of the filler material should be used. Thus, a current intensity of 95 A was selected, as the diameter of the wire used as the filler metal was ±2 mm. The main parameters used in the welding process are shown in Table 4.
The voltage was adjusted automatically, following the characteristic curve of the welding machine. After the welder obtained the current intensity, the voltage, and the range of thermal delivery, the traveling speed was adjusted, taking into account the welding position and the thickness of the pipe to be welded. For calculating the traveling speed, the following expression for the thermal delivery was used:
Q = k × ( U × I v ) × 10 3
where Q is the thermal delivery (kJ/mm), k is the thermal efficiency factor, U is the arc voltage (V), I is the current intensity (A), and v is the traveling speed (mm/s). This is valid for the first pass, because it is well known that for the second pass, a higher level of current can be used (+10%), as well as a lower traveling speed (−20%), in order to properly fulfill the chamfer. These new parameters for the second pass will result in higher thermal delivery, although it is controlled in order to prevent the appearance of welding defects.
For preheating, post-heating, and PWHT processes, a Weldotherm (Weldotherm, Essen, Germany) VAS 82-12 Digit 1000 Heat Treating Unit provided with 12-channel capacity was used, with six channels that were capable of using electrical resistances up to 135 A and another six channels that were capable of using electrical resistances up to 90 A.
Different thermal cycles have been applied to the welded samples in order to study the mechanical behavior of the joints. In Figure 1, it is possible to observe the different cycles selected, as well as the code used in this work, making the correlation with the subsequent analyses easier. Table 5 presents the main levels of temperature used in each set of heat treatments. The main argumentation behind the selection of the different thermal cycles imposed to the samples used in this study can be found below:
  • P_APP_T00: these samples were used in the basic condition, i.e., without any kind of pre- or post-treatment. Although it is well known that this condition does not present the best conditions to be used in practice, it can be useful to know what happens when the best practices are not applied and compare the results with the other sets of heat treatment applied to the other sets of samples;
  • P_APP_T01: the procedure used in this set of samples followed the rules recommended by the construction codes, standards, and some important manufacturers. This procedure uses all the advantageous settings and is considered as ideal for this kind of base material. The complete procedure includes preheating, welding, post-heating, transformation time, and finally, PWHT. Its main disadvantages are the long processing time as well as the energy consumed; furthermore, it is not environmentally friendly or productive;
  • P_APP_T02: this batch of samples has been produced to verify the influence of hydrogen (if inserted into the weld), and how it interferes with bonding, along with residual stresses in the weld and corrosion phenomena. In order to simulate this situation, preheating was used, but without post-heating treatment. At the end of the welding process, the samples have been protected with a ceramic fiber blanket, avoiding a fast cooling process until it reached room temperature. No phases’ transformation time was used. The PWHT was applied just six months later;
  • P_APP_T03: the purpose of the selection of these conditions is the same as that for P_APP_T02 but, in this case, a post-welding treatment was performed in order to eliminate any possible retained hydrogen. It is intended to compare this situation with the previous one, analyzing the effect of the post-welding treatment;
  • P_APP-T08: the conditions used in this set of parameters are very similar with those of the P-APP_T01 set but, in this case, the time of transformation was changed. After cooling to room temperature, the samples have been subjected immediately to PWHT. The main purpose of this procedure is to save energy and time in the process.
The purpose of this test is to verify to what extent hydrogen, if inserted into the weld, interferes with the joint together with the internal stress and corrosion in the weld. It is well known that the lack of tempering of this material after welding for extended periods can be detrimental. This is because, due to their late performance, the welds have a microstructure that is susceptible to internal stresses and often external stresses which, together with a certain level of hydrogen, can result in cold cracking, which is also known as hydrogen cracking. Apart from the presence of these agents, it is possible that welds may also be subject to corrosion, which may lead to stress cracking in addition to cold cracking. This was the main reason to include a waiting period of 6 months after the welding and before PWHT.
Figure 2 shows the setup used to perform the preheating process (a), as well as the welding process (b).
The characterization of the joints has been carried out following different techniques with a view to get important information about the properties achieved by the samples under each set of thermal cycles used. Thus, the characterization techniques used can be seen below, as well as the main reasons behind their selection.
  • Liquid penetrant testing: used after the chamfer preparation;
  • Visual testing: immediately before the welding process, checking the morphology of the welds and possible external defects;
  • X-ray analysis: looking for internal defects;
  • Hardness surface testing: checking for possible deviations regarding the expected values;
  • Bending tests: trying to explore the appearance of eventual defects when loaded by bending;
  • Tensile testing at 20 °C: checking the mechanical strength of the joint at room temperature;
  • Tensile testing at 600 °C: checking the mechanical strength of the joint at high temperature;
  • Hardness profile: analyzing the hardness along the cross-section of the welds;
  • Chemical composition: trying to characterize the weld’s composition;
  • Electronic and optical microscopy: observing the resulting microstructure;
  • Microhardness: trying to identify soft spots, where Type IV cracking usually appears.
After welding, the samples were immediately subjected to a first check in order to verify if the samples met the acceptance criteria defined in EN ISO 5817–Level C [33]. Afterwards, an additional visual inspection following ISO-17637:2003 standard [34] was performed, getting the corresponding approval. After that, samples were checked using liquid penetrant following the ISO 3452-1:2013 [35], looking for defects that had reached the surface. Since all the samples did not present surface signs of defects, they obtained the corresponding approval. Trying to detect internal defects, the samples also were subjected to X-ray inspection following the ISO 20769-2:2018 standard [36], using an ICM machine with 300 kVA, obtaining the corresponding approval as well. Indeed, some samples presented an excess of penetration, which is a defect that is acceptable, but there were no other defects such as root lack of penetration, porosities, or inclusions. The criteria used to approve the welds also followed ASME Code Sections I, V, VIII Div. 1 and 2, ASME B31.1 [37]. After these previous non-destructive tests, the samples were cut and machined in a vertical milling machine Baileigh VM-1054-3. A summary of these previous tests can be seen in Figure 3. After machining, it was necessary to smooth the weld until it is leveled with the base material, so that the entire test area was of the same thickness and section in order to remove the notch factor resulting from the border of the bead with the base material. This operation was performed for the tensile and bend samples.
In order to perform the other tests, different equipment was used, which is described as follows. Regarding the hardness assessment, three different tests were performed: hardness tests with portable equipment to carry out a first evaluation of the welded joints, a microhardness cross-section evaluation in order to assess the hardness reached in each zone of the joint, and finally another microhardness test allowing the detection of soft spots. Thus, the surface preparation was carried out using sandpaper provided with different grain sizes (80, 220, 310, 500, and 1000 mesh) until the Rz roughness parameter was lower than 5 μm. A Krautkramer–MIC 10 equipment provided with a MIC 205-A probe was used because it is portable and easy to handle, providing results accurate enough regarding the level required at this stage, which was just a general previous evaluation. The load used to perform these tests was 49 N (5 kgf) with a dwell time of 30 s, and a diamond Vickers indenter with 136° was used to perform the indentations. In order to obtain more accurate results, further microhardness tests were carried out using Shimadzu HSV-20 equipment, following the NP EN 1043-1 standard, using as the load 98.1 N (10 kgf) and a Vickers diamond indenter. However, to do that, it was necessary to improve the surface roughness through a new polishing process with diamond slurry of 1 µm over 10 min in order to decrease the Rz roughness to values under 2 µm. Two rows of indentations were produced as depicted in Figure 4. Finally, the opposite surface of the same samples was prepared following the same procedure as well, in order to identify soft spots close to the base material. Indeed, Newell [38] argues that these soft points are responsible for a decrease in creep resistance by about 20% compared to an unaffected base material and are formed mainly in the fine grain region of the HAZ. Using the same microhardness equipment and indenter, these tests have been carried out using just 1 kgf (HV1) and a dwell time of 30 s, still following the ISO 6507:2018 standard [39]. Three rows of indentations were produced, one close to the weld root, another in the middle of the cross-section, and the last one close to the surface of the base material; all of the indentations were distanced 0.5 mm each other, which is the minimum distance recommended by the standard, avoiding the influence on the results among indentations. This value was selected based on a good compromise between the lowest value recommended for this effect and the small grain size usually observed close to the HAZ. In this case, just one sample was analyzed regarding each set of welding and heat-treatment conditions.
In order to analyze the chemical composition of the weld, an optical emission spectrometer Spectro, model Spectrolab M8 was used. This test was performed trying to understand the composition of the weld and corresponding dilution. The values achieved are based on six analyses in different samples, and the results presented are average values with standard deviations lower than 5%.
The micrographic analysis aims to analyze the microstructure present in the samples, thus allowing verification of the grain size and its distribution. In order to perform these analyses, a Carl Zeiss (Carl Zeiss, Oberkochen, Germany) optical microscope model Axioskop 2 Mat was utilized, using different lens and magnifications. This analysis was also an important tool to verify the influence of thermal cycles on the steel microstructure, both in melted zone (MZ) and the HAZ. This optical microscopy technique is ideal for microstructure analysis, grain size analysis, particle analysis, and the identification of voids or cracks. For this purpose, the samples were prepared by sanding and polishing with 80 mesh sandpapers, followed by 220, 310, 500, and finally 1000 mesh. Then, the samples were polished sequentially with 3 µm and 1 µm diamond slurry, after which the samples were etched using a reagent called Vilella, which consists of hydrochloric acid, 5 mL; picric acid, 2 g; and ethyl or methyl alcohol, 100 mL. The etching time was 20 s. The test was performed according to BS EN 1321:1997—Destructive test on welds in metallic materials—Macroscopic and microscopic examination of welds [40].
Tensile tests allow a vast characterization of the materials, both in terms of mechanical strength and ductility. Moreover, this type of test can be performed at different temperatures, simulating hard work conditions that can be applied to the materials and joints in service. In this case, tensile tests were performed at room temperature, 20 °C, and at high temperature, 600 °C, from which yield strength, rupture and elongation data were collected. In order to increase the confidence in the values collected, three tests were carried out for each condition considered in this work. In order to perform the tensile tests, as Instron universal testing machine model 4208 was used, which was provided with a load cell of 300 kN. Tensile test specimens were taken from the weld cross-section and prepared according to ASME IX: 2015–QW 150 [41]. Regarding the tensile tests carried out at elevated temperature (600 °C), they were performed in a similar universal testing machine (Instron 8562) provided with a heated camera where the samples are kept at constant temperature during the tensile tests. The load cell used is a 100 kN cell. The samples were prepared following the ISO 6892-2:2018 standard [42].
Bending tests are usual in welded samples because they allow the assessment of the samples’ behavior under very demanding work circumstances. In this work, bending tests were performed using a hydraulic CIATA press, model P-115/HP provided with a maximum compression capacity of 147 kN (15 tons). Samples were tested according to ASME IX–QW163 [43], with a bending angle of 180°, a bearing distance of 36 mm, and a spindle diameter of 24 mm. Samples were used in which the compressive effort was performed on the welding face and others were performed on the welding root to cover all situations. After the tests, the samples were analyzed using the penetrant liquid technique, which was previously described in this work.

3. Results and Discussion

3.1. Non-Destructive Test Results

Some of the initially performed tests were merely qualitative, thus providing information about whether the samples were ready to pursue the analysis or not. These tests were already described before in this work.

3.2. Hardness and Microhardness Analyses

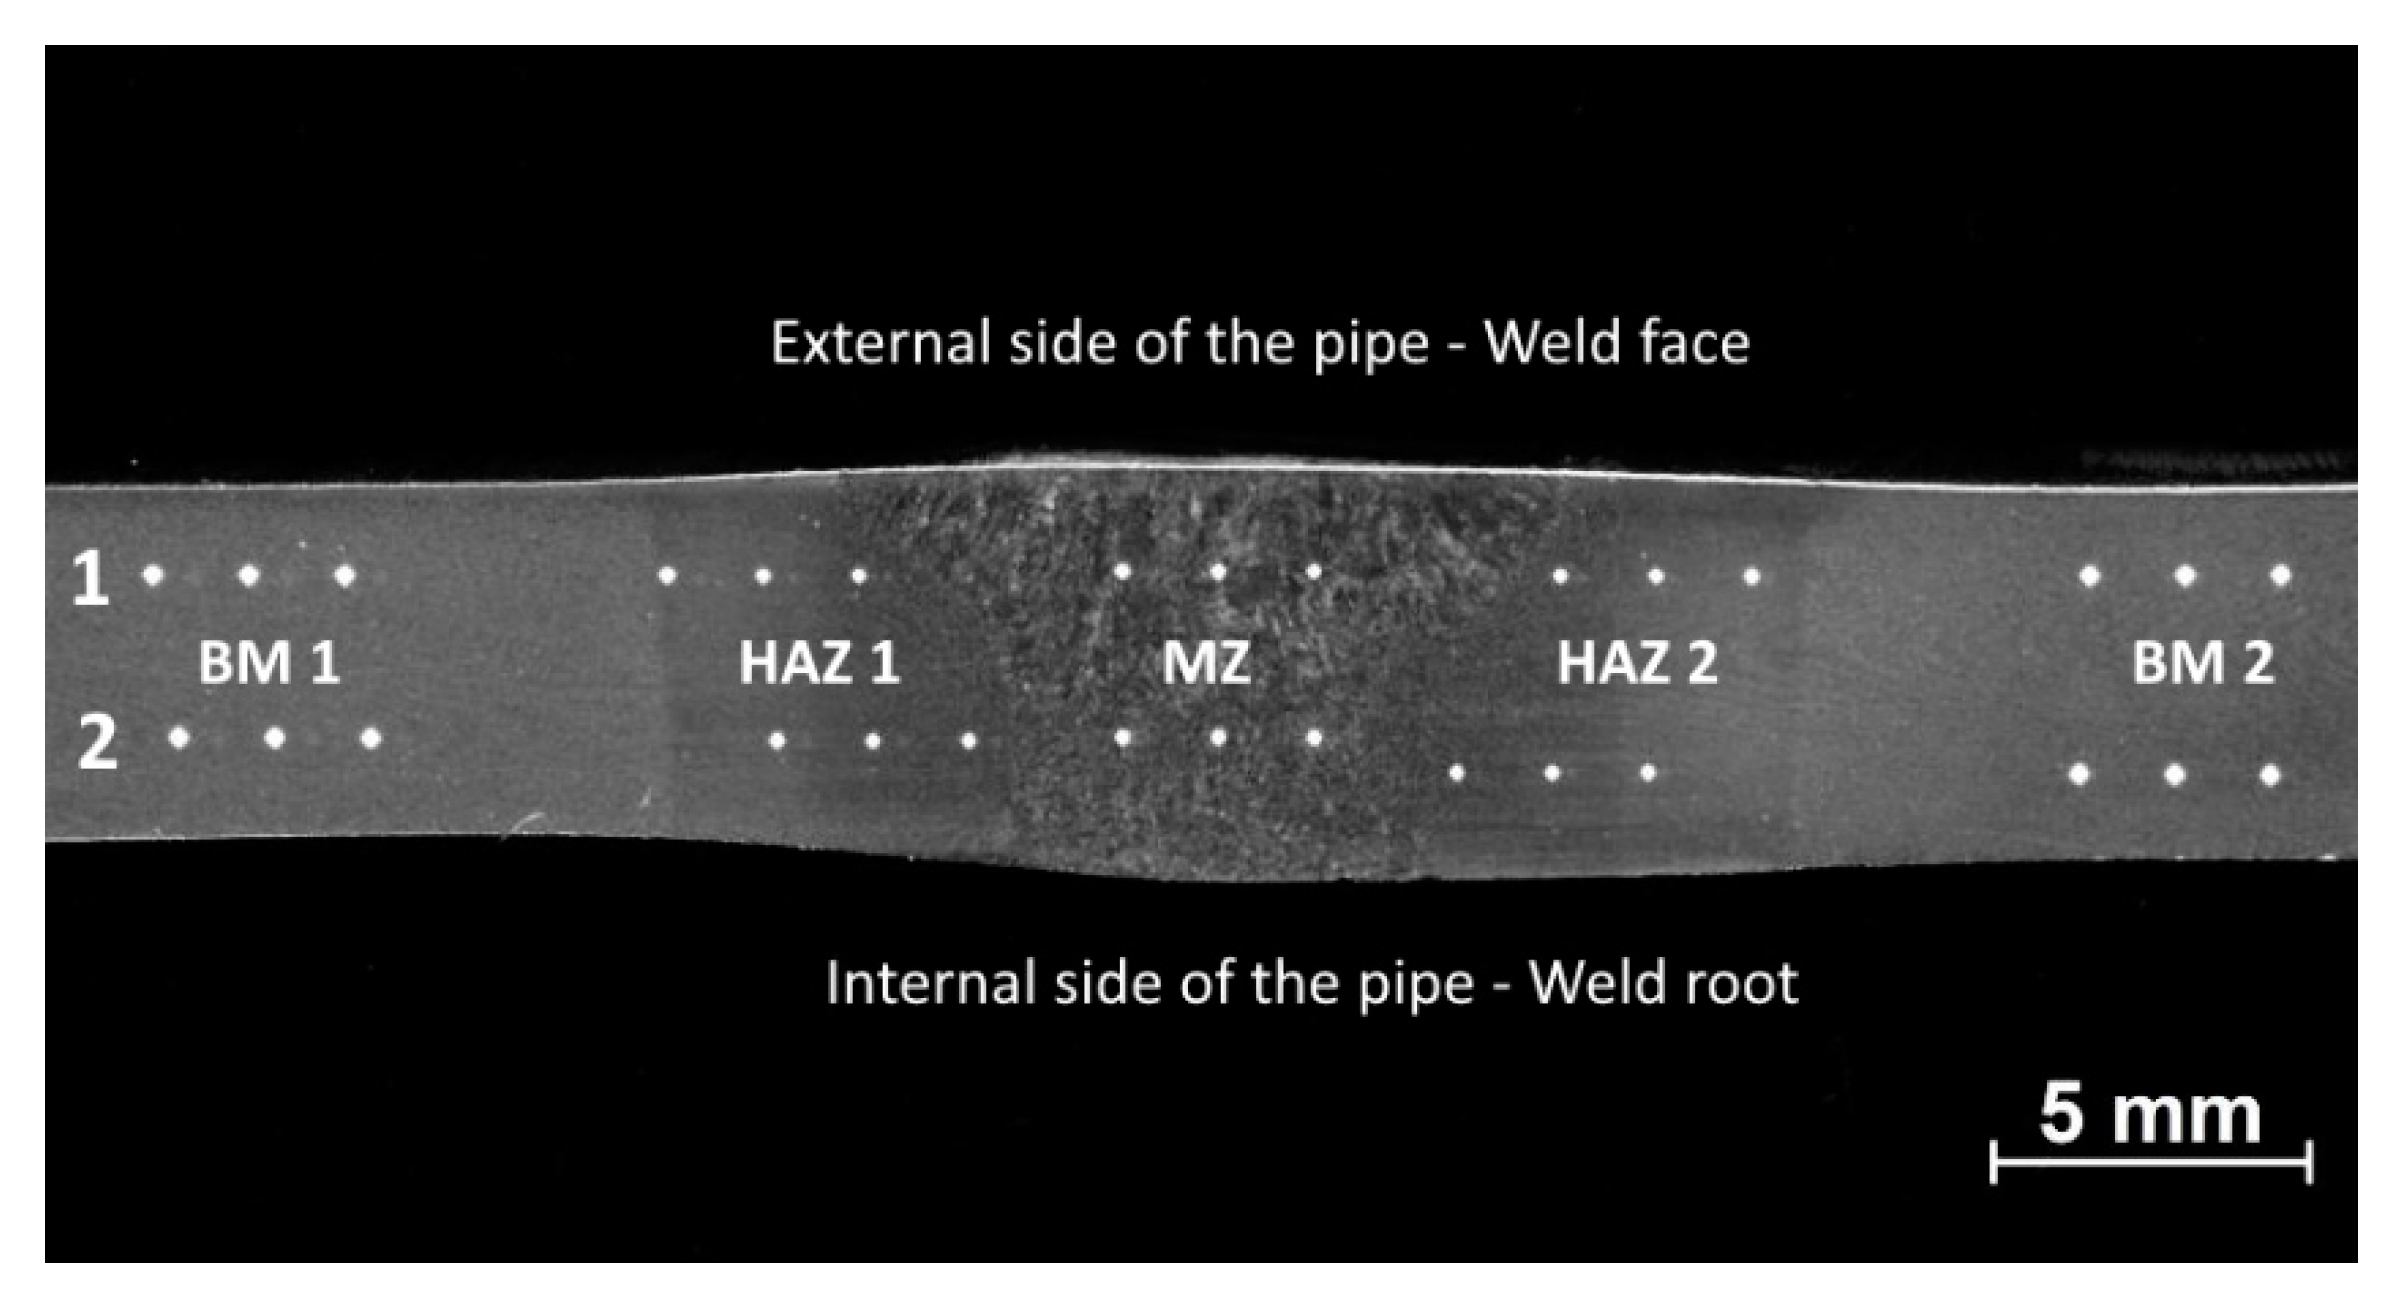
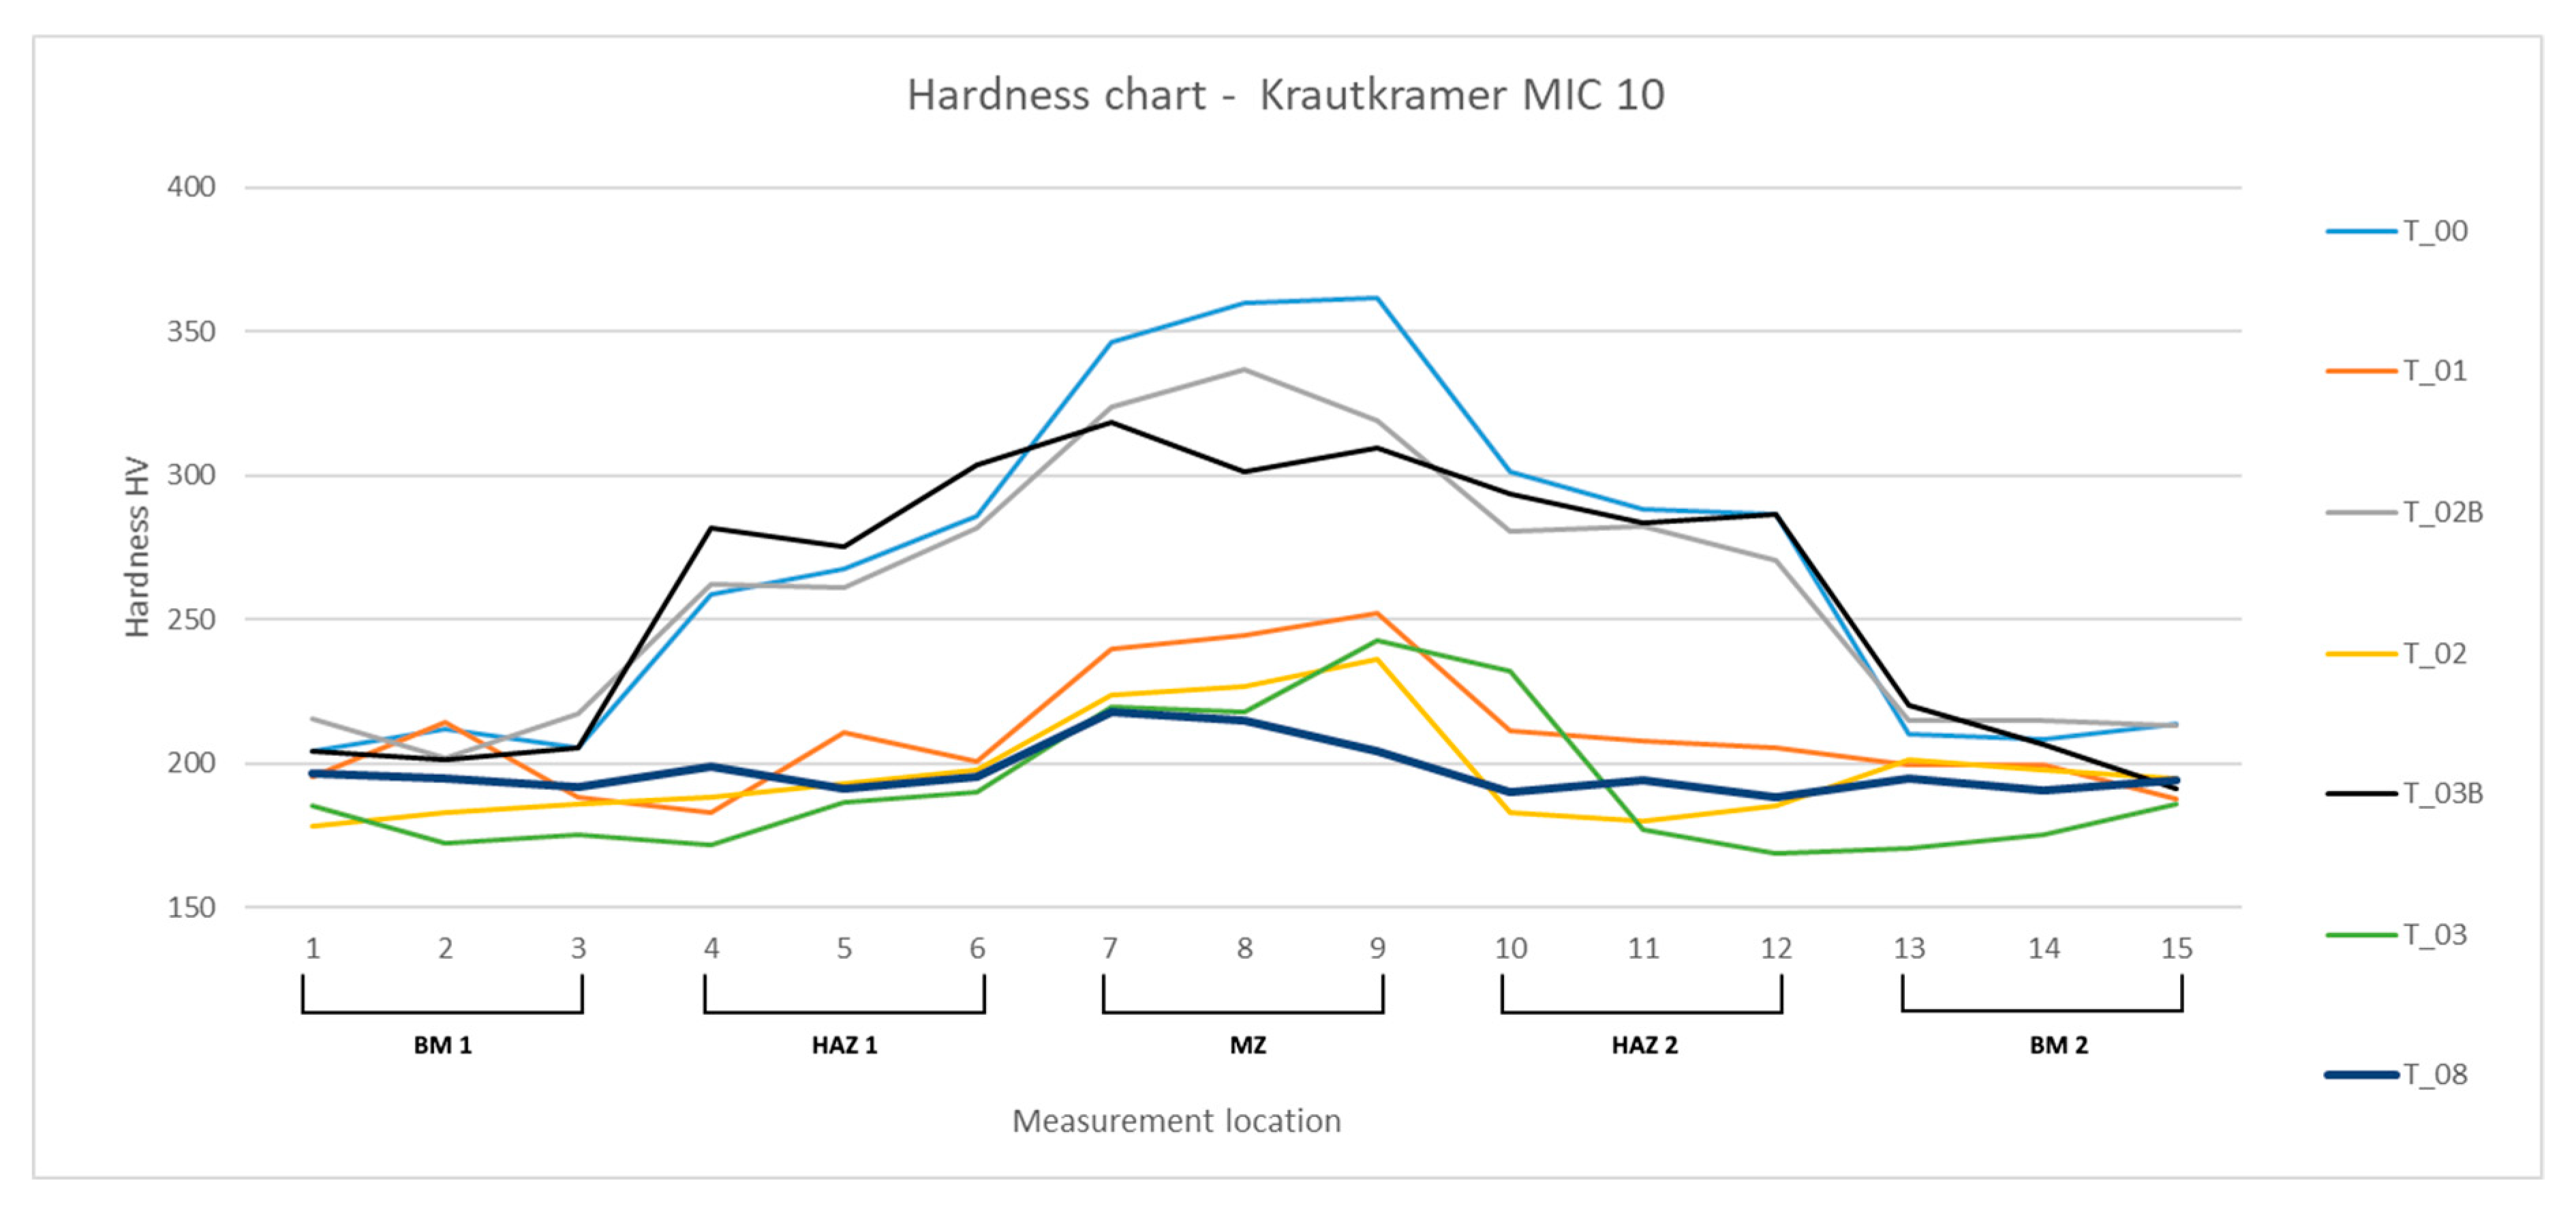
The hardness tests performed allowed assessing the hardness profile across the joint, from the base material 1 (BM1) to the base material 2 (BM2), passing by the thermal-affected zones 1 and 2 (HAZ1 and HAZ2) and the melted zone (MZ). The microhardness values can be observed in Table 6, and the profiles corresponding to the different samples can be seen in Figure 5, resulting from the average values of five samples measured in the same places (15 indentations per sample), taking into account the central area of each sample. The calculated standard deviation can be observed in 
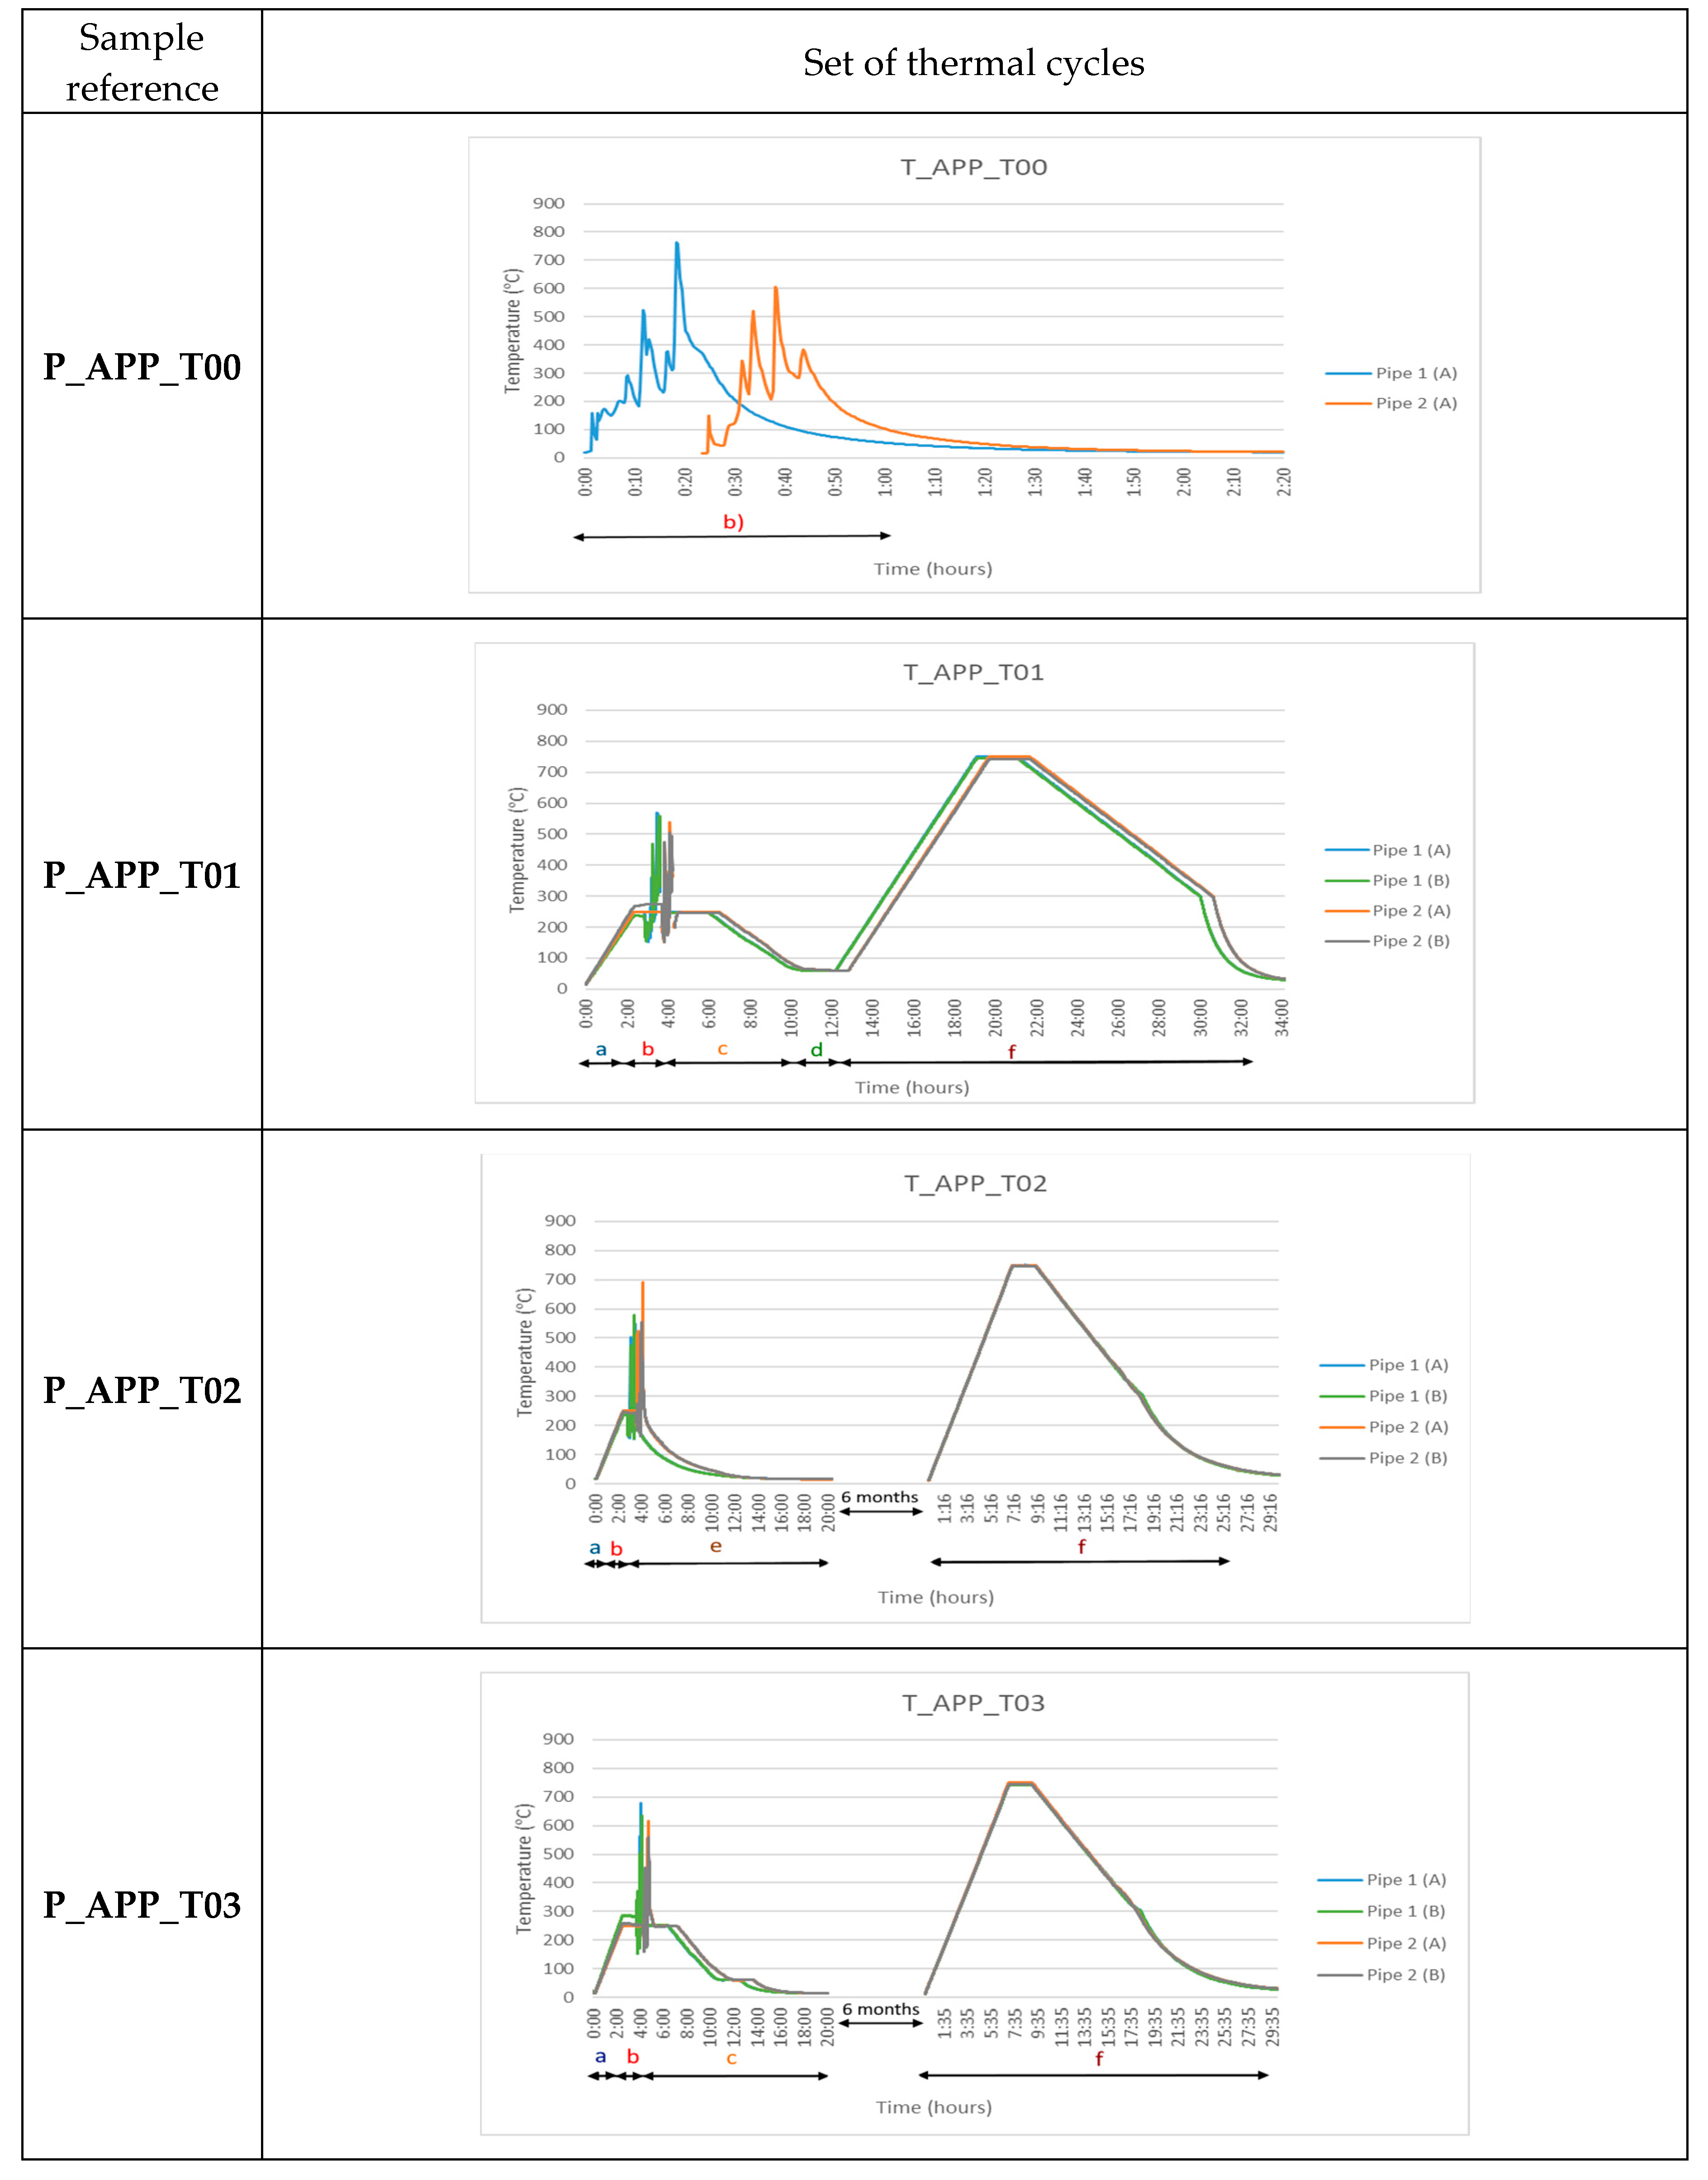
Table 6 as well. The letter B included in the label of samples P_APP_T02 and P_APP_T03 in Figure 5 represents the values obtained before the PWHT was carried out six months after the welding and corresponding heat treatments performed in the first stage of the samples’ preparation. As expected, the hardness values before PWHT are higher in the HAZ and MZ, because the martensite is not tempered yet, being extremely hard in that state. After PWHT, the values achieved are within the expected range. Since the sample P_APP_T00 was not subjected to heat treatments, its hardness is extremely high in the MZ, as well as in the HAZ. Thus, sample P_APP_T00 does not fulfill the properties required by the usual applications of this kind of material, and the procedure used in this sample can be considered inadequate. It is worth noticing that the remaining samples show hardness values within the usual range for this material; thus, at this stage, excluding the P_APP_T00 sample, the other samples can be considered for the next tests. Performing this test only lets us validate in a first moment, in the shop floor, the ability of the work pieces to advance to the next stages, because the accurateness of the hardness measuring equipment is ±40 HV. Thus, in order to evaluate the surface hardness of the samples with adequate accuracy, microhardness tests were performed using the microhardness measuring equipment previously described. The microhardness profile can be seen in 
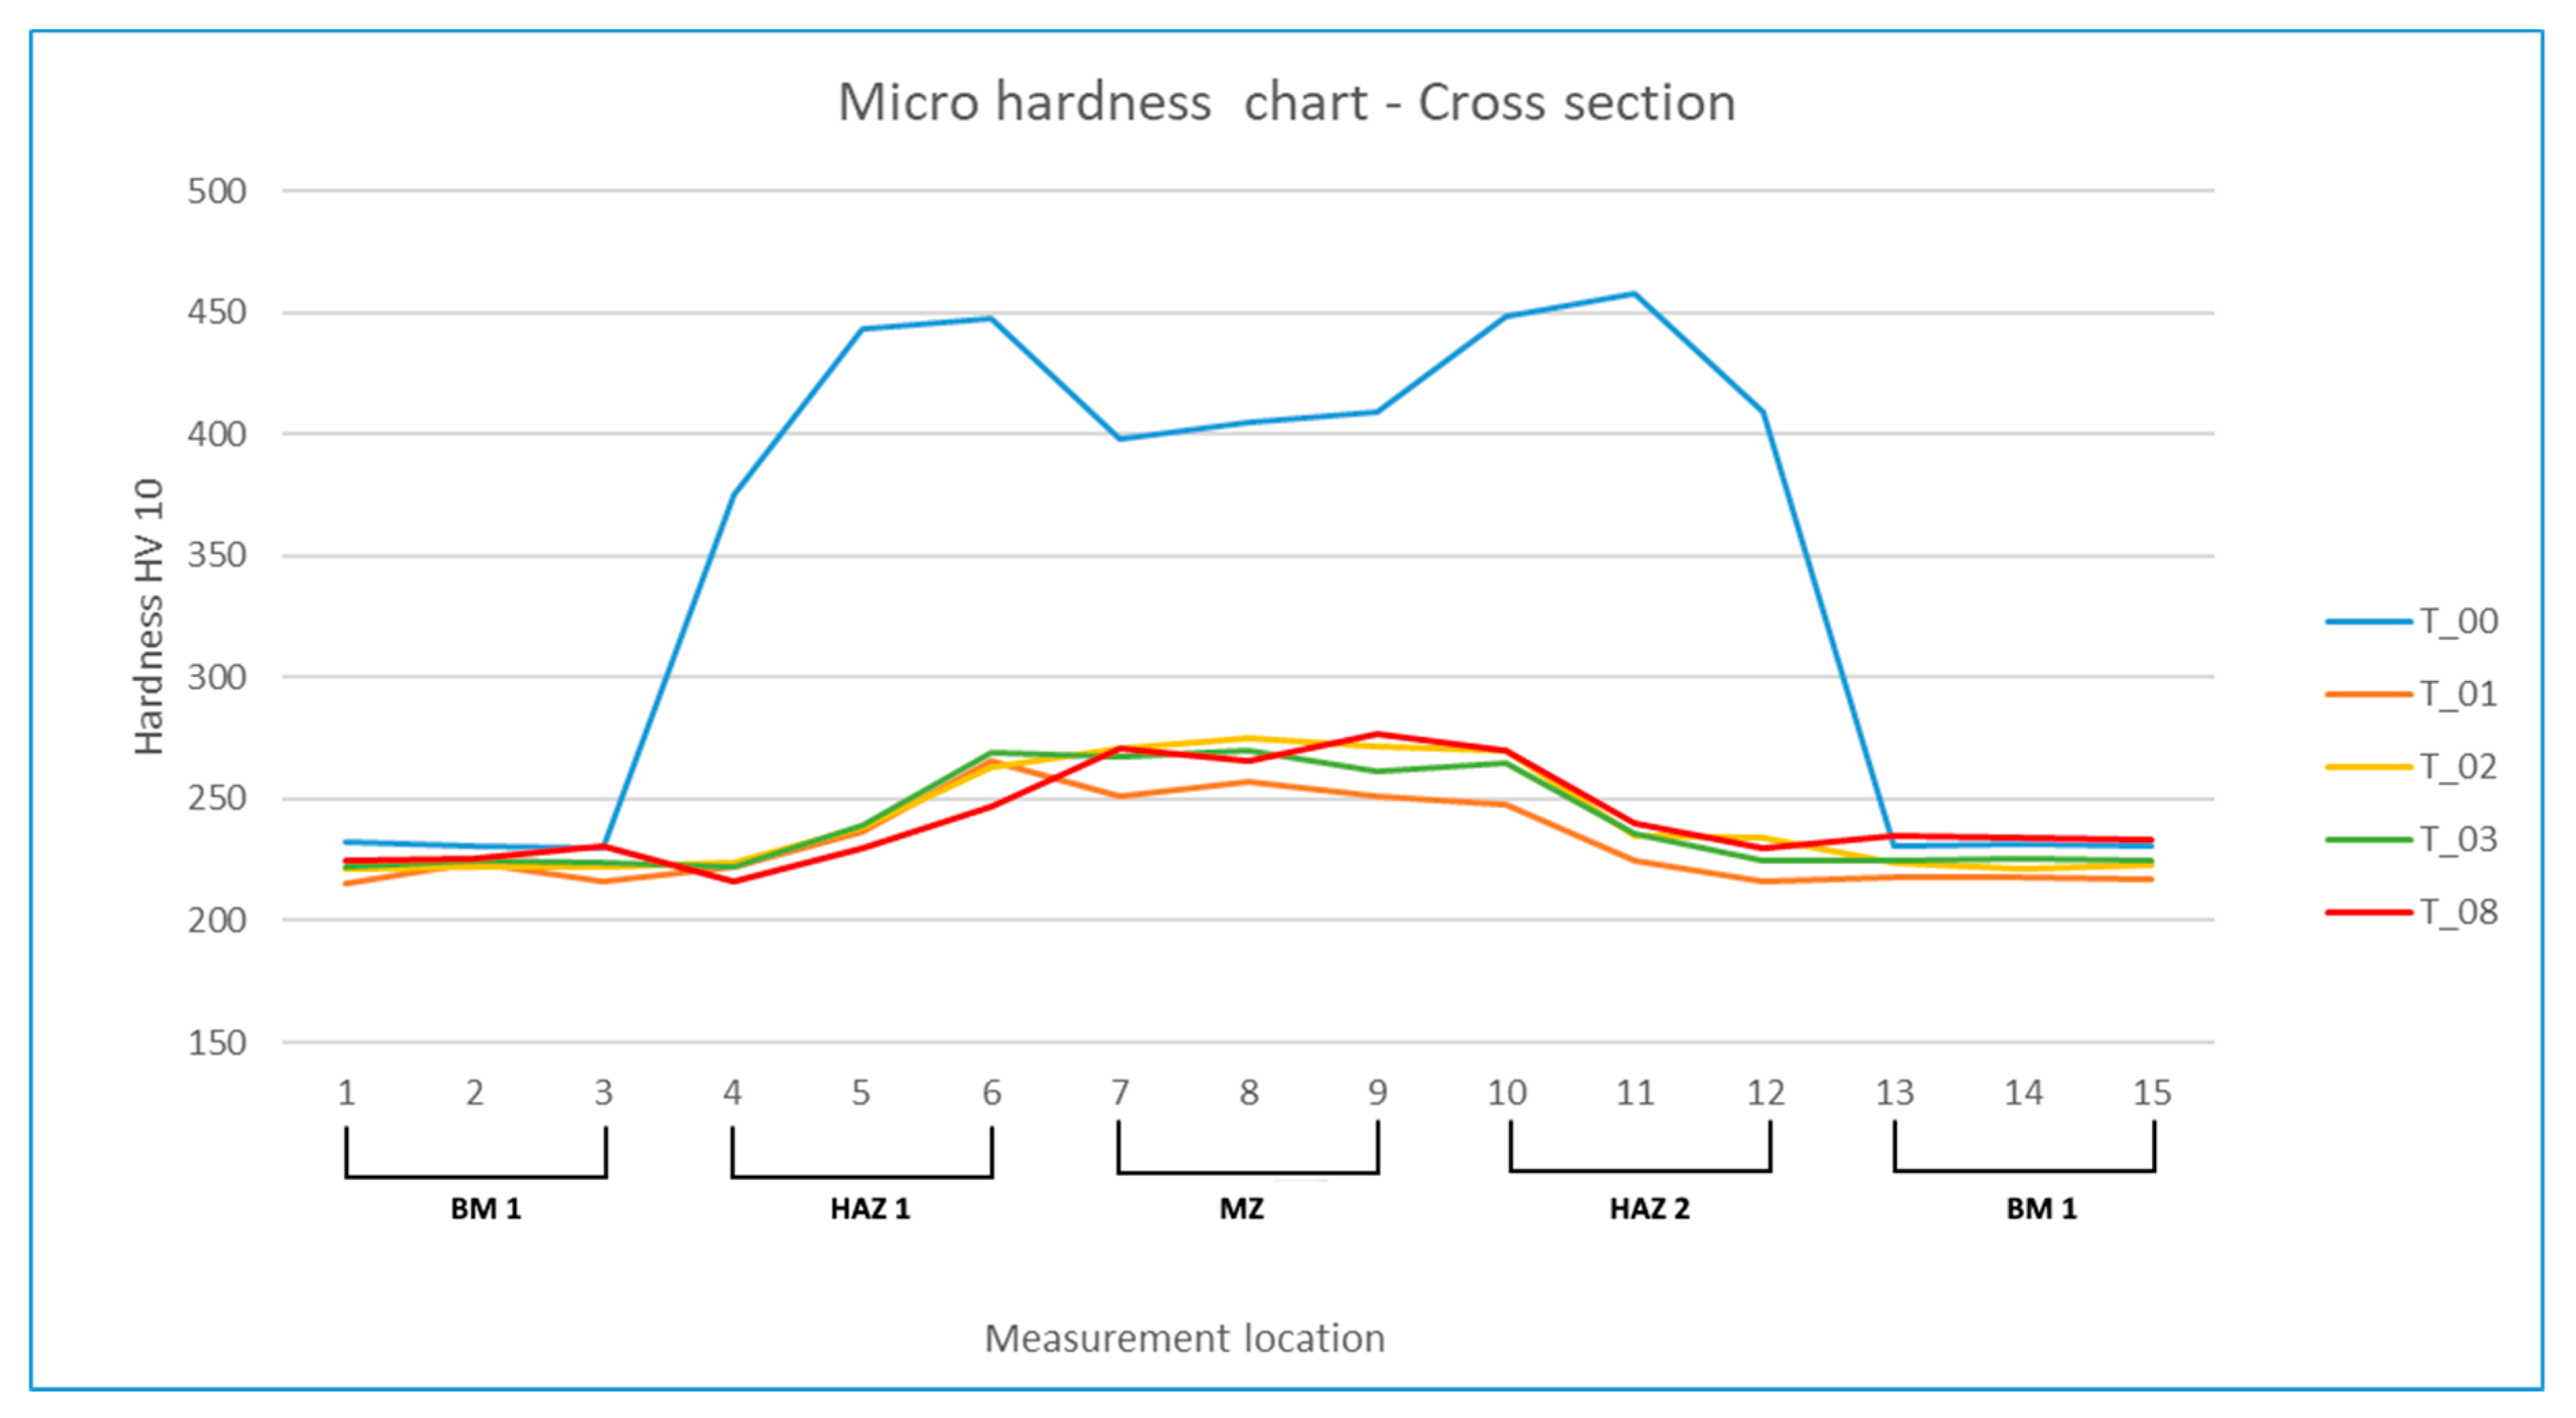
Figure 6, showing clearly that sample P-APP_T00 presents a different hardness behavior resulting from the lack of heat treatments. In this case, the microhardness measurements were performed only after the PWHT treatment; thus, there are no curves corresponding to this situation, as shown in Figure 5. The values reported in the curves can be considered common for this kind of material and joint. The increased hardness reported in the MZ and HAZ is typical (250–280 HV10) as well in these conditions, and the values registered are within the range of acceptable values (200–275 HV10, but they can reach 300 HV10 without special concerns). Excluding the sample P_APP_T00, which presents a singular behavior due to the absence of heat treatments before the PWHT applied to this sample, the samples were mainly constituted of non-tempered martensite, which was hard and brittle. The pattern followed by the remaining samples is very similar among them, with microhardness values of around 230 HV10 in the base metal and slighting increasing across the HAZ, reaching steady values between 250 and 280 HV10 in the MZ. Obviously, sample P_APP_T00 is not acceptable, reaching microhardness values out of the range of acceptable values. This corroborates the unconditional need for applying heat treatments to this base material when welding is included in the manufacturing processes. According to ISO 18265 (Metallic materials—Conversion of hardness values), it is possible to estimate the ultimate strength through hardness values [34]. This is because both hardness and ultimate strength are indicators of the mechanical resistance of a metal to plastic deformation, and they are approximately proportional. However, this proportionality is not valid for all metals. For this case, it may be pointed out that the breaking stress in MPa is 3.13 times higher than the hardness in HV.
The microhardness tests were also performed having as the main goal identifying soft spots in the cross-section, i.e., very small areas where the hardness is lower than in the base metal or in the fine grain region of the HAZ, which is also known as the intercritical region. The summary of the results by the crossed region can be seen in Table 7. The intercritical region is located in the connection zone of the HAZ, which is very close to the base material. This is where the so-called Type IV crack usually appears, which often occurs both at the manufacturing stage and during the life of the component.
Regarding the soft spot analysis, no special attention was paid to the P_APP_T00 samples, due to its non-heat-treated condition. Taking into attention the P_APP_T01 samples, lower microhardness values were identified in the range of 7.5 to 10 mm from the center line of the weld. Indeed, this is the most critical area in the weld cross-section because this is a HAZ that is close to the base material, which is an area that is well known as the region where the grain size is finer and the hardness can drop about 20 HV of the substrate’s usual level. Regarding the samples P_APP_T01, some microhardness measurements provided values under 200 HV (187 HV, while the base material presents 220–230 HV) in the intercritical area, indicating that there are soft spots that can induce Type IV cracks. The samples P_APP_T02 and P_APP_T03 did not present values under 200 HV. Indeed, the lowest value obtained in both samples was 204 HV, showing that these samples do not present soft spots and are not prone to develop Type IV cracks in the intercritical area. The sample P_APP_T08 presented just one (one in 14) value below 200 HV (170 HV), which was located into the HAZ and close to the surface. Since all the other results were close to 220 HV in this sample, the result was not valued also because in the root and middle indentations rows, the same effect was not felt. Thus, it was considered that sample P_APP_T08 presents good conditions to avoid the development of Type IV cracks, presenting less concerns than sample P_APP_T01.

3.3. Welds Chemical Analysis

In order to check the final composition of the weld, optical spectroscopy was used to obtain the weld composition. However, as the chemical composition of the base material and filler metal are very similar, it would be expected that the weld follows a chemical composition very similar to the base material and filler metal. The results can be seen in Table 8, where the compositions related to Pipe 1, Pipe 2, and the filler metal have been taken from the information provided by the suppliers and the composition related to the weld face and root face were taken from analyses performed by optical spectroscopy. As can be observed, the chemical composition of the weld, both in the face and in the root, are very similar to the compositions provided by the suppliers to the base materials and filler metal. Thus, the dilution in the welding process will not significantly affect the weld composition.

3.4. Microstructure Analysis

The microstructure analysis gives relevant information about the behavior of the different zones of the welds’ cross-section. Thus, each sample was carefully analyzed, allowing a deep understanding of the phenomena produced by the different thermal cycles applied to the samples. A vast number of micrographs were collected, sorted, and analyzed, and the selection of the most representative micrographs regarding each sample and area of analysis are presented in Figure 7.
All the micrographs present microstructures consisting of tempered martensite, which gives the joint very good properties, excluding the P_APP_T00 sample. This presents a microstructure with martensite, but it is not tempered, because the PWHT was not performed. Samples P_APP_T01, P_APP_T02, and P_APP_T03 present very similar microstructures with identical grain sizes. Precipitates are found along the grain boundaries. The typical grain size in the HAZ is about 20–30 μm, and in the MZ it appears larger, with grains of 60–70 μm. In sample P_APP_T01, the grains appear more defined, and the martensite areas appear tempered as well. The sample P_APP_T08 presents a regular HAZ; however, the MZ presents an atypical structure relative to the other samples used in this work. This reveals that the creep behavior can limit the application of this kind of joint in classic applications of this kind of material, but this expectation needs to be confirmed.

3.5. Tensile Tests at Room and High Temperature

The ASME IX: 2013–QW 150 [41] code refers to 585 MPa as the minimum yield strength to be achieved in welds of this kind of material; this is the value that is also required as a minimum for the base material. Regarding yield strength and elongation, the code does not specify any minimum value. ASME code B31.3—Process Piping [37] refers to minimum yield stress 413 MPa and ultimate tensile strength 586 MPa. Analyzing the rupture results, it was found that it always occurred in the base material at a considerable distance from the welding area, as can be seen in Figure 8. Moreover, all ruptures presented a ductile look, even when the elongation was relatively low. The values obtained in the tensile tests can be observed in Table 9, namely the yield strength, ultimate tensile strength, and elongation at room and high temperature. The results can be observed in Figure 9 and Figure 10. The highest values are presented by sample P_APP_T00, because they were not subjected to heat treatments and PWHT. Thus, the yield strength and ultimate strength are the highest values, but the elongation presents the lowest values, although these were not significantly different from samples P_APP_T02, P_APP_T03, and P_APP_T08. Sample P_APP_T03 presents the lowest ultimate strength value at room temperature, and P_APP_T02 presents the lowest ultimate strength value at high temperature.
Regarding the results obtained at elevated temperature, ASME B31.3—Process Piping code refers to the minimum yield strength of 71 MPa at a temperature of 600 °C [37]. In some codes, this value may be higher, requiring a minimum of 215 MPa. In any case, the results presented are above these minimum values for both codes cited. As in the tests carried out at room temperature, the samples also presented a ductile rupture clearly out of the MZ or HAZ.
Regarding Table 9, and excluding the sample P_APP_T00 which presents high risks of cracking in service due to its structure in the HAZ, and considering the sample P_APP_T01 as the model usually recommended by the main steel manufacturers and construction codes, the sample that presents the closest yield and ultimate strength both at room and elevated temperatures is sample P_APP_T08. The main drawback presented by this sample is the low elongation which, being higher than that in the samples P_APP_T02 and P_APP_T03, is relatively lower than sample P_APP_T01. Indeed, P_APP_T01 is the sample that presents a better relation between mechanical strength and ductility, mainly at room temperature. However, at elevated temperature, the elongation decreases substantially and reaches similar values to the other samples. Sample P_APP_T03 is the one that presents the best elongation at elevated temperature, but its mechanical resistance decreases more than that of the P_APP_T01 and P_APP_T08 samples. At this stage, samples P_APP_T02 and P_APP_T03 can be discarded, because they present a considerable drop in the mechanical resistance relative to the P_APP_T01 sample.

3.6. Bending Tests

After the bending tests have been completed, the samples were initially observed with the naked eye and subsequently subjected to penetrant liquid tests (Figure 11) to identify the possible existence of microcracks. In fact, no cracks or microcracks were found in any of the samples in either MZ, HAZ, or BM. Penetrant testing is not usual in industrial terms to verify this kind of joint, as cracks usually develop quite rapidly and are perfectly noticable to the naked eye. However, the penetrant liquid technique was used to confirm the absence of any kind of cracking in this work. All specimens described a perfect curvature, except for the sample P_APP_T00. These samples showed an atypical curvature, where it can be seen that the MZ offered such high bending resistance that the curvature took place in the BM. This effect is clearly depicted in Figure 12. Anyway, this sample does not present any crack or discontinuity. Given that the P_APP_T00 sample presented high mechanical strength and low elongation, and that its microstructure consisted essentially of non-tempered martensite, it would be expected that this samples would exhibit cracks when subjected to more intense deformation stresses. However, this was not the case. Thus, as a summary of these tests, it can be stated that all the samples are approved, but the P_APP_T00 sample shows greater resistance to deformation in the weld bead zone, transfering the deformation to an adjacent zone (HAZ and BM).

3.7. Discussion about the Results and Corresponding Thermal Cycles

After collecting all the results and analyzing them individually, it is now necessary to gather this information and relate it to the thermal cycles initially performed.
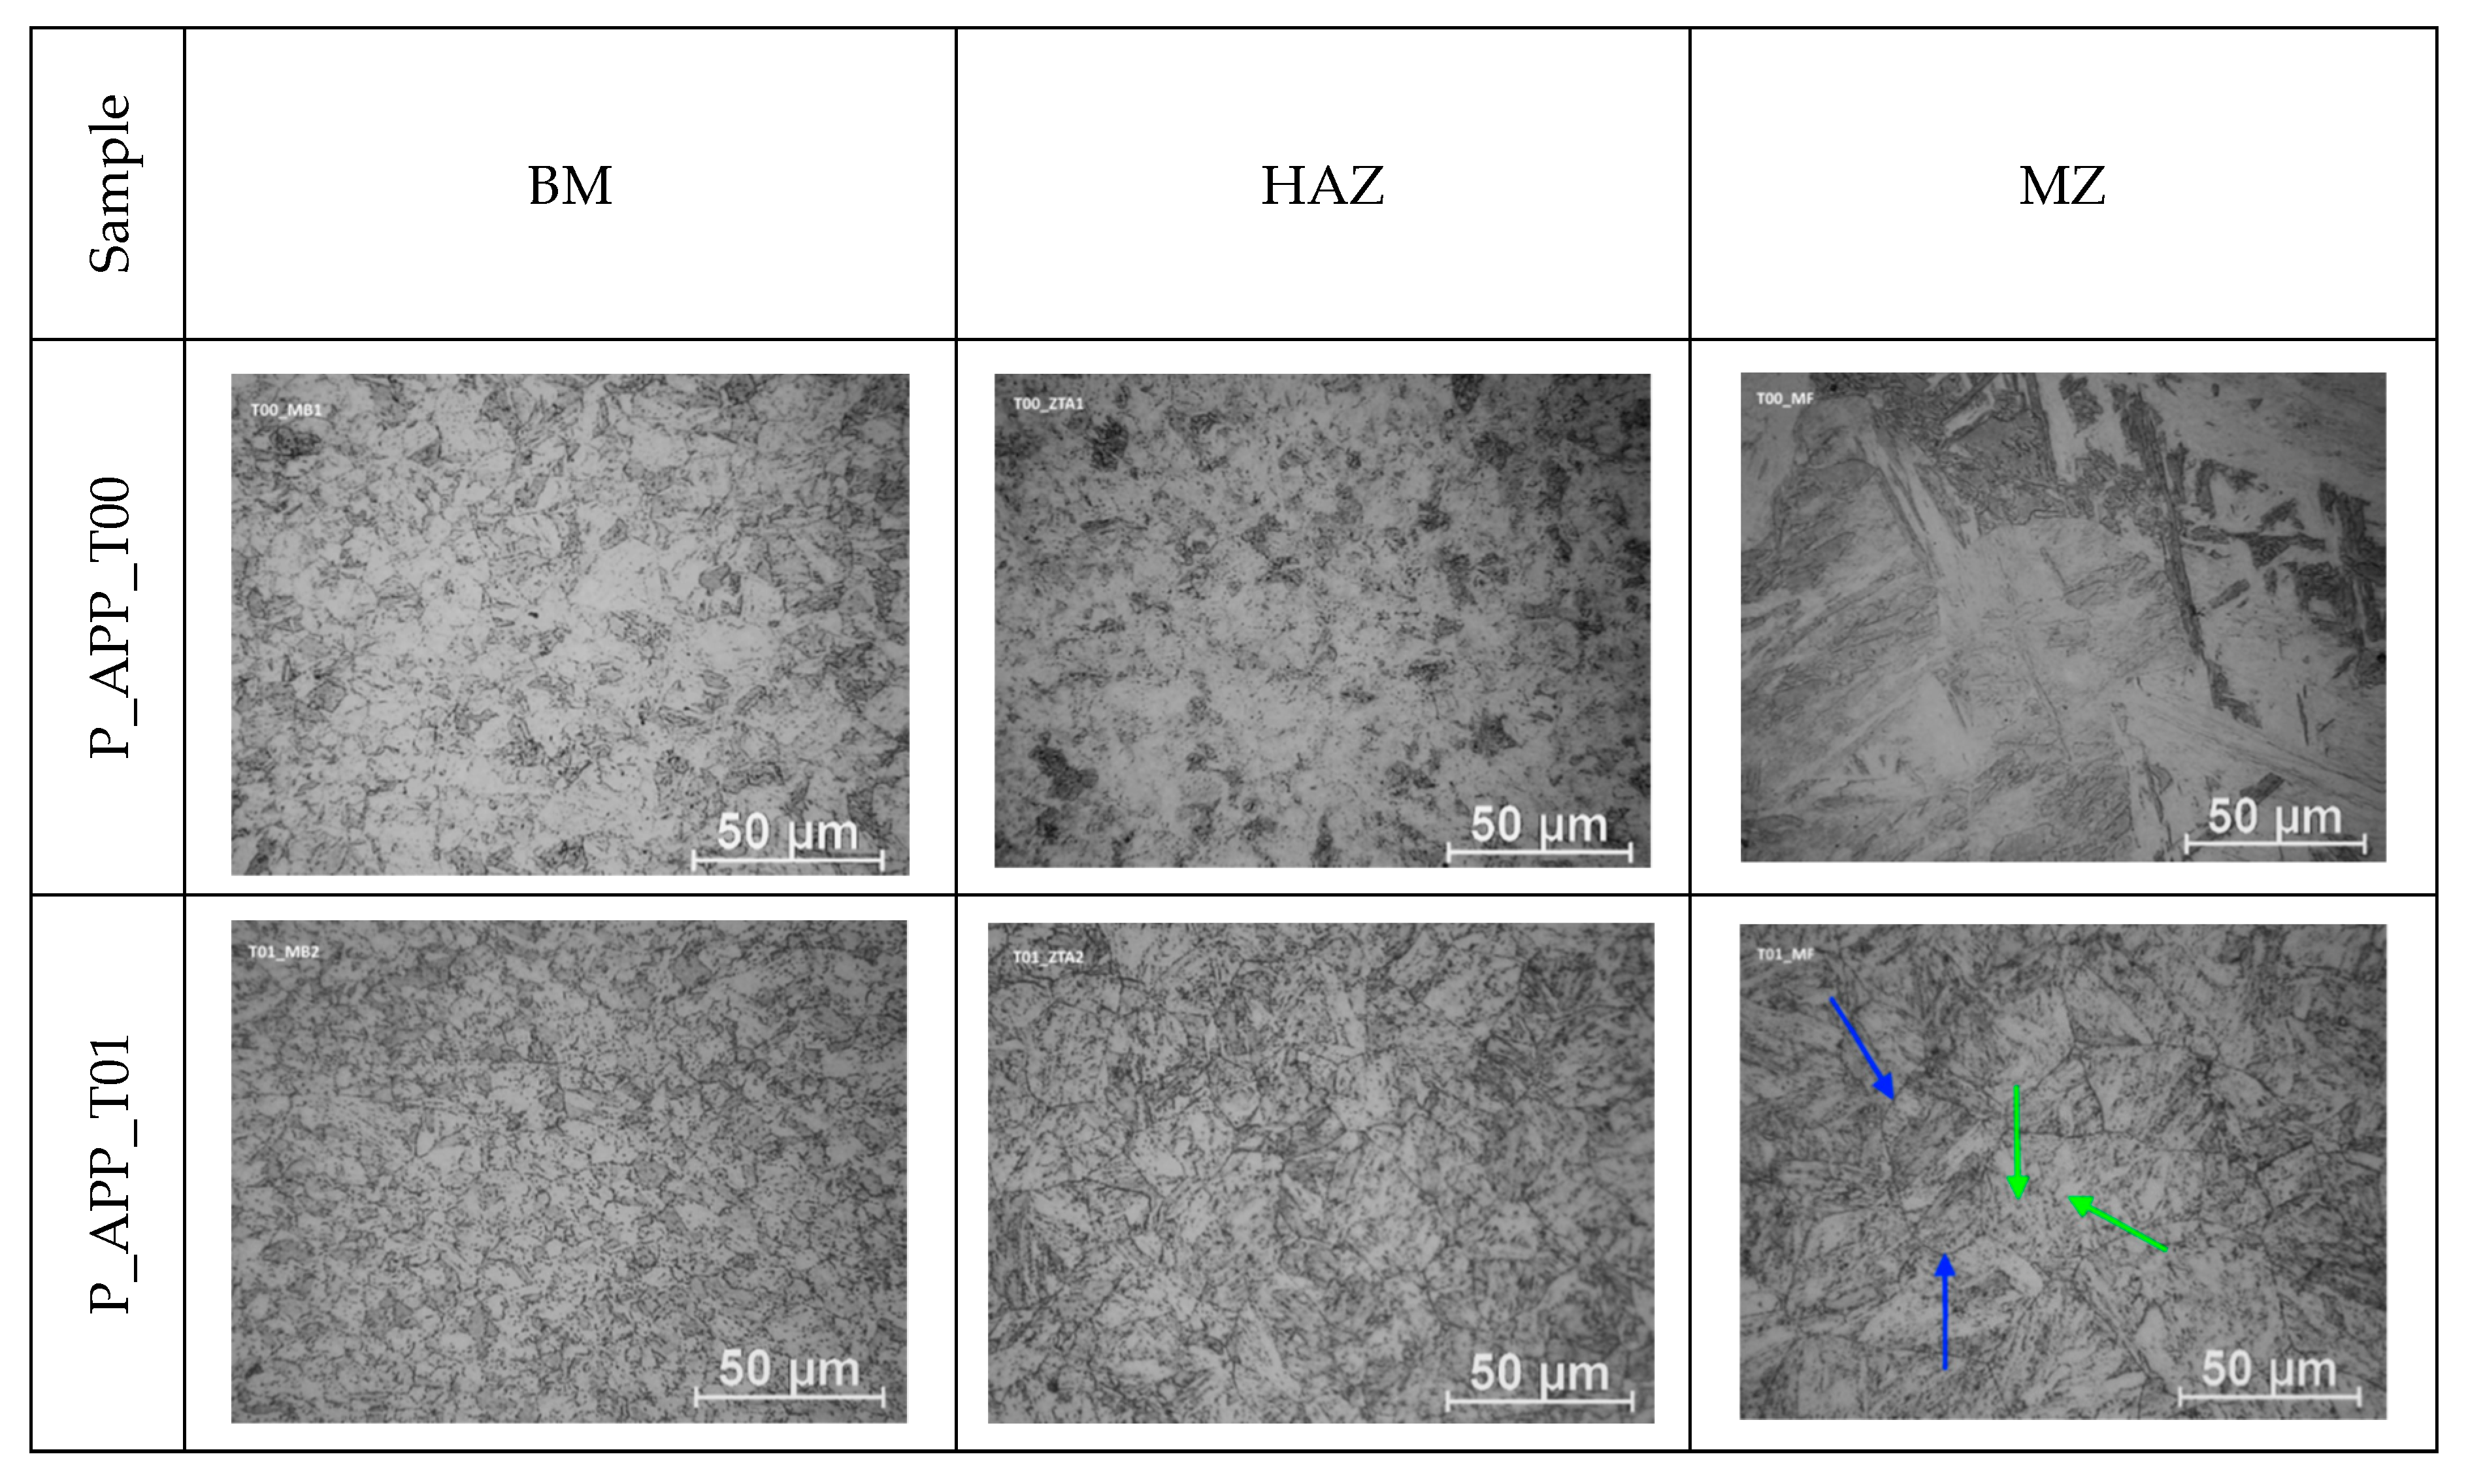
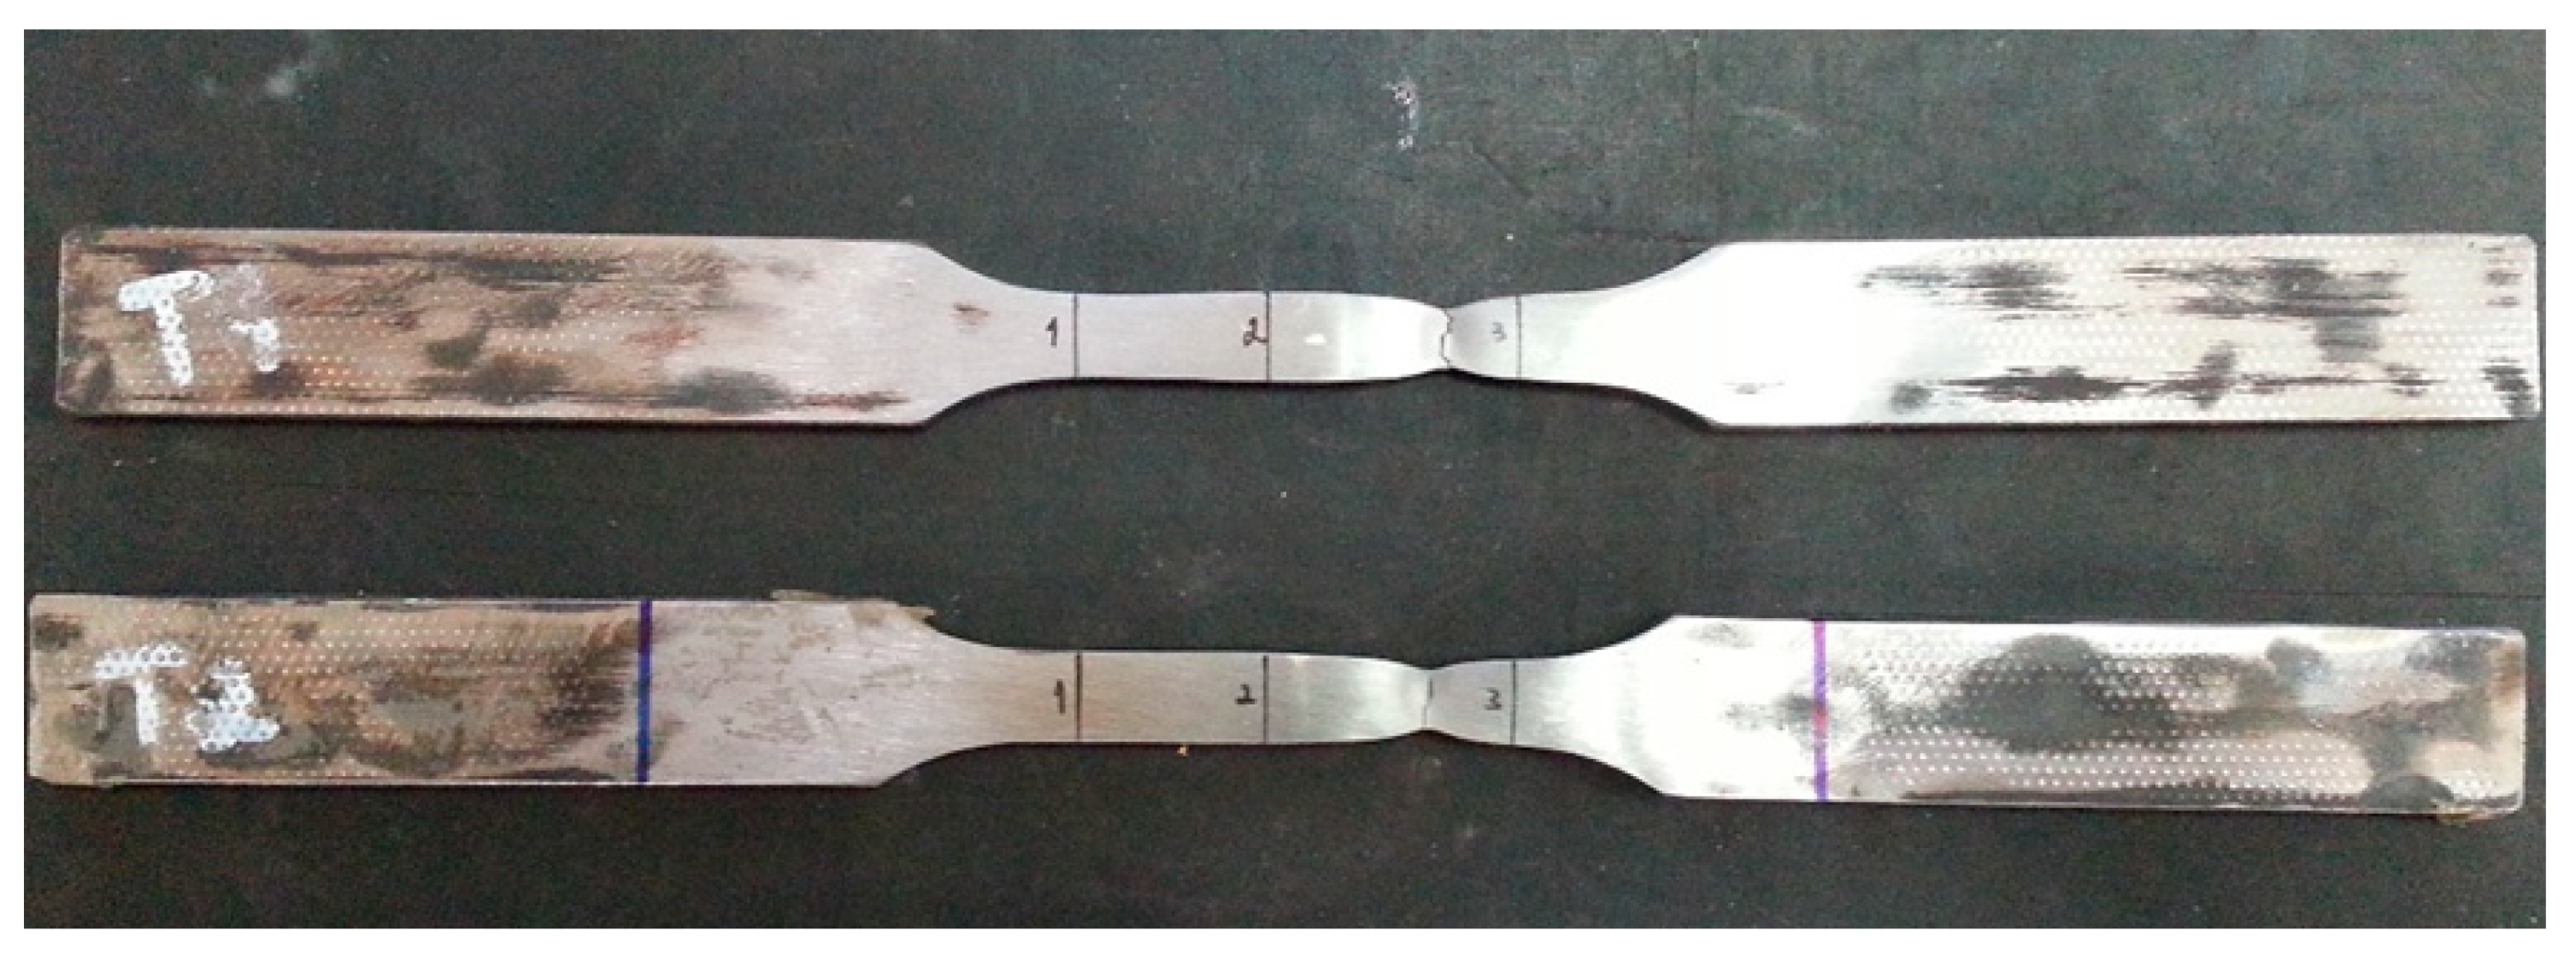
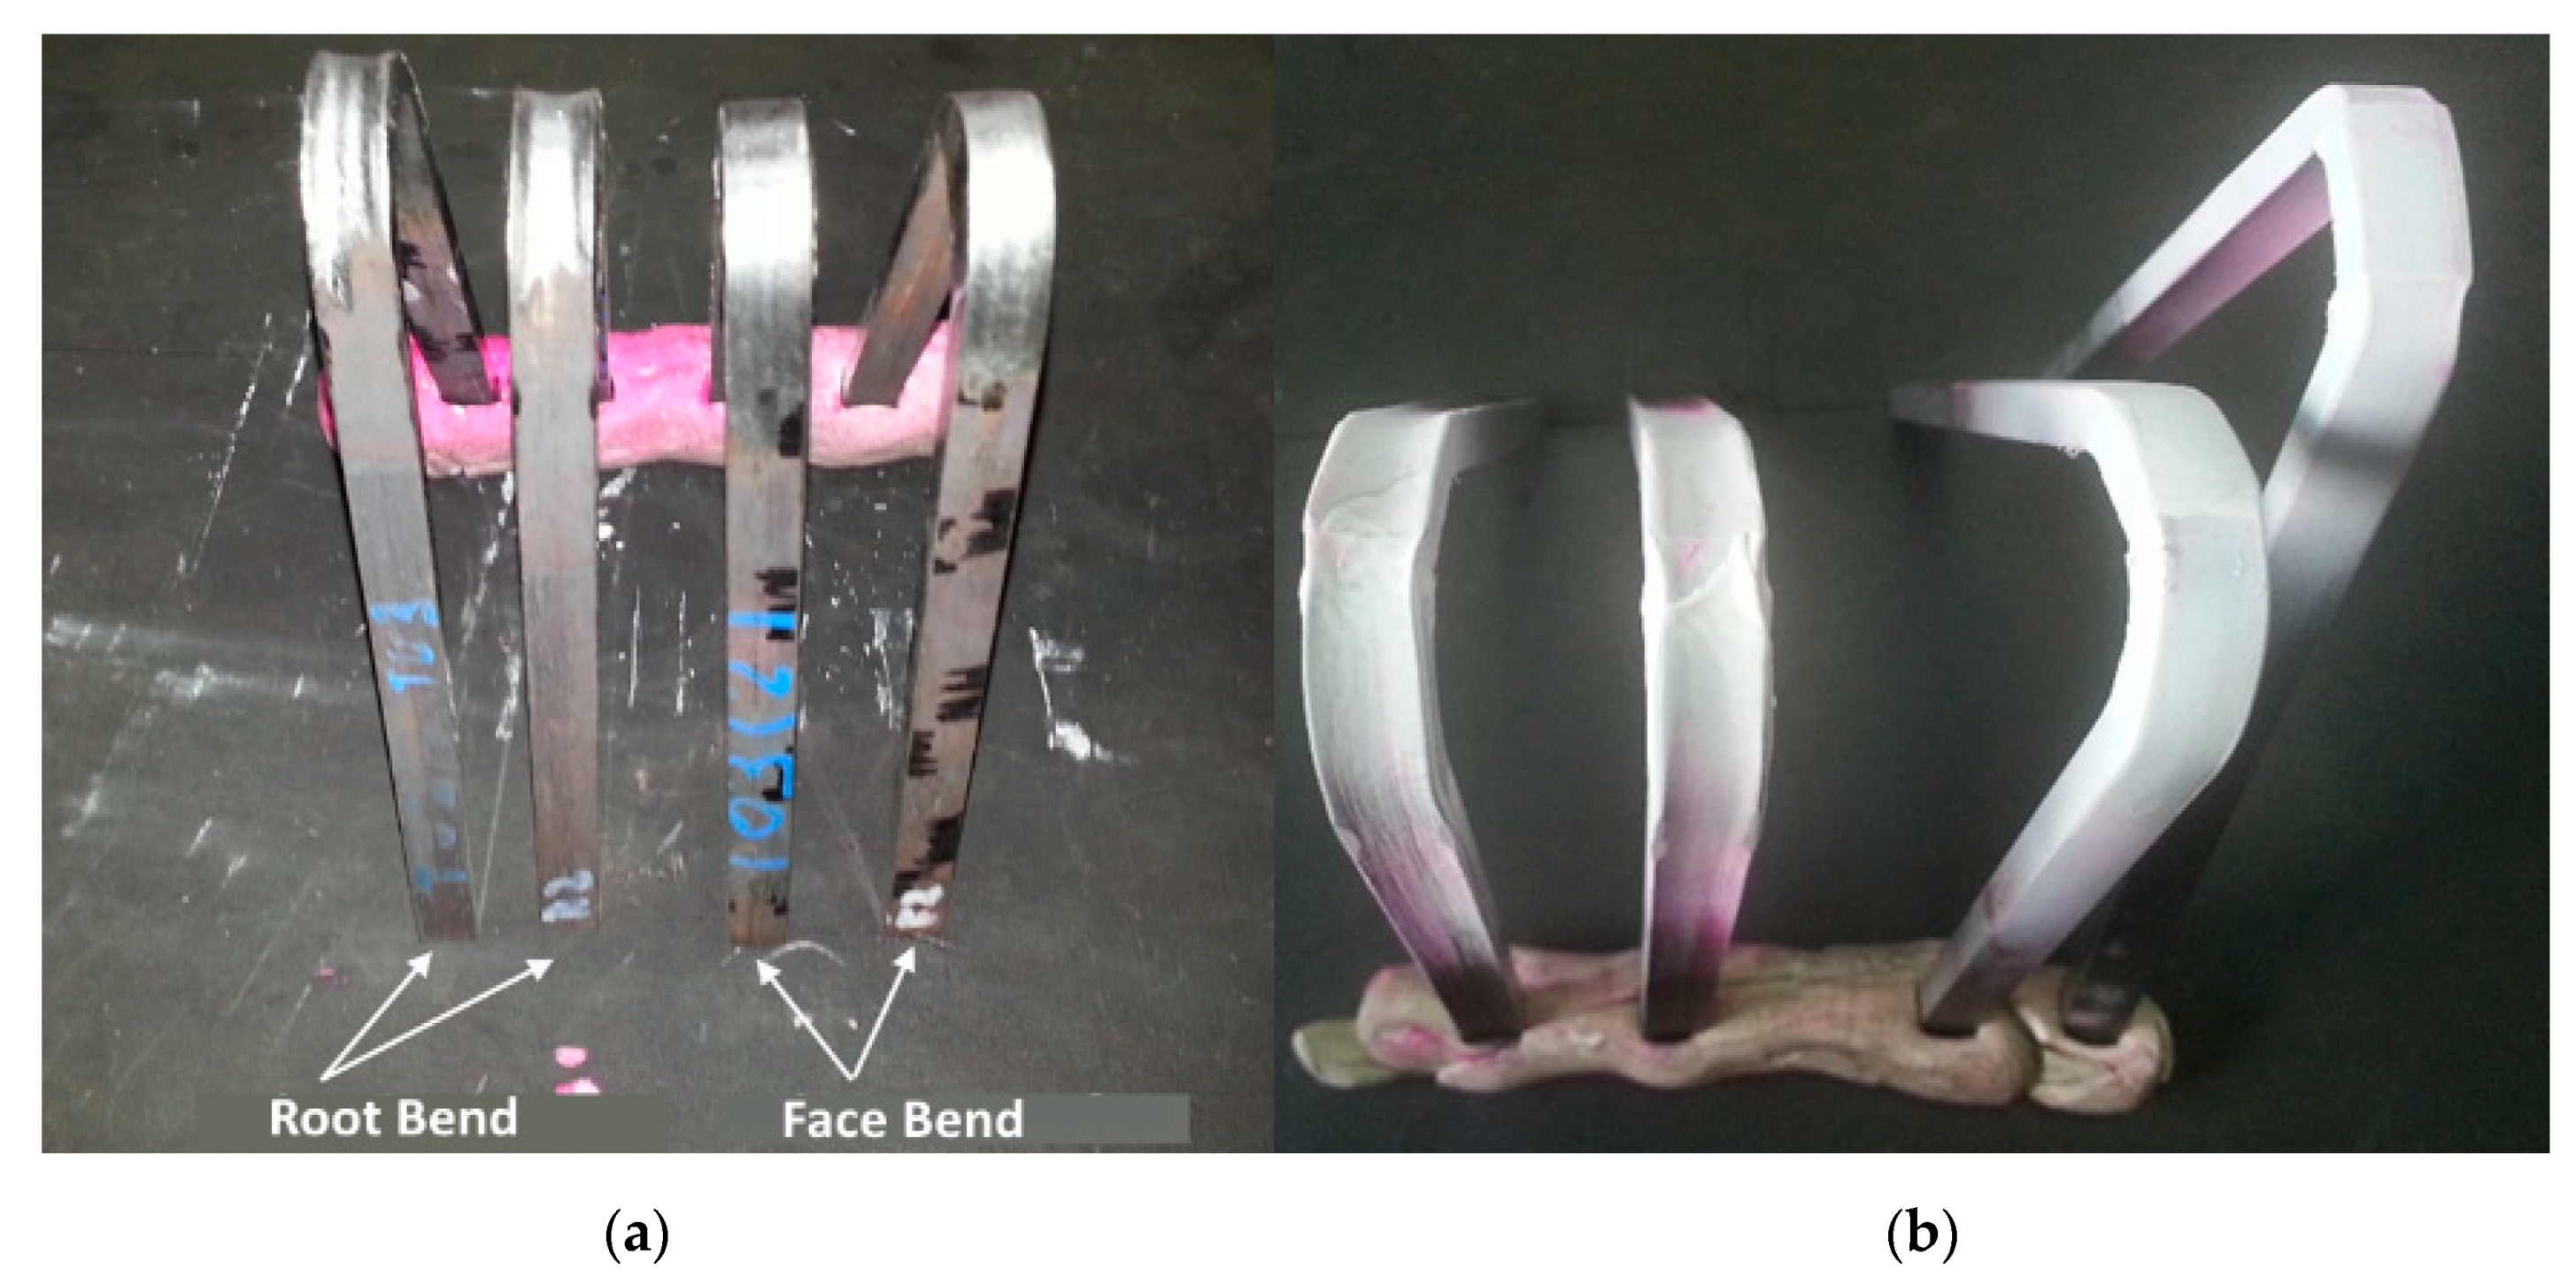
It remains clear that the welding process generates martensite in the weld and HAZ, increasing the mechanical resistance, but limiting the ductility, as can be seen in the tensile tests and optical microscopic analysis carried out on sample P_APP_T00. This is valid for both room temperature and elevated temperature, which creates limitations regarding the use of this kind of joint in their traditional applications, heat exchangers, due to creep phenomenon. The microhardness measured clearly confirms these results, showing an increase in hardness in the MZ and HAZ of these samples. However, regarding the bending tests, no cracks have been reported, but the high hardness presented in the weld moves the bending center from the weld to the base material. Thus, it is clear that martensite needs to be tempered after welding, and some heat treatments can help to decrease the stress accumulated in and close to the weld, improving the overall mechanical behavior of the joints.
Sample P_APP_T01 was prepared following the codes’ recommendations, including preheating, post-heating, and PWHT. The procedure is time consuming and costly, but the results are excellent. The mechanical resistance remains within the range of values taken as acceptable for this kind of joint, and the ductility is not severely compromised, remaining as well in an acceptable value, although it is more affected at elevated temperatures than at room temperature. The microstructure shows the presence of tempered martensite, and the hardness values are lower than in the case of the P_APP_T00 samples. As expected, no cracks have been developed during or after the bending tests. Thus, the main disadvantage of this procedure is the time spent to perform it and the energy consumed, making this process less friendly to the environment.
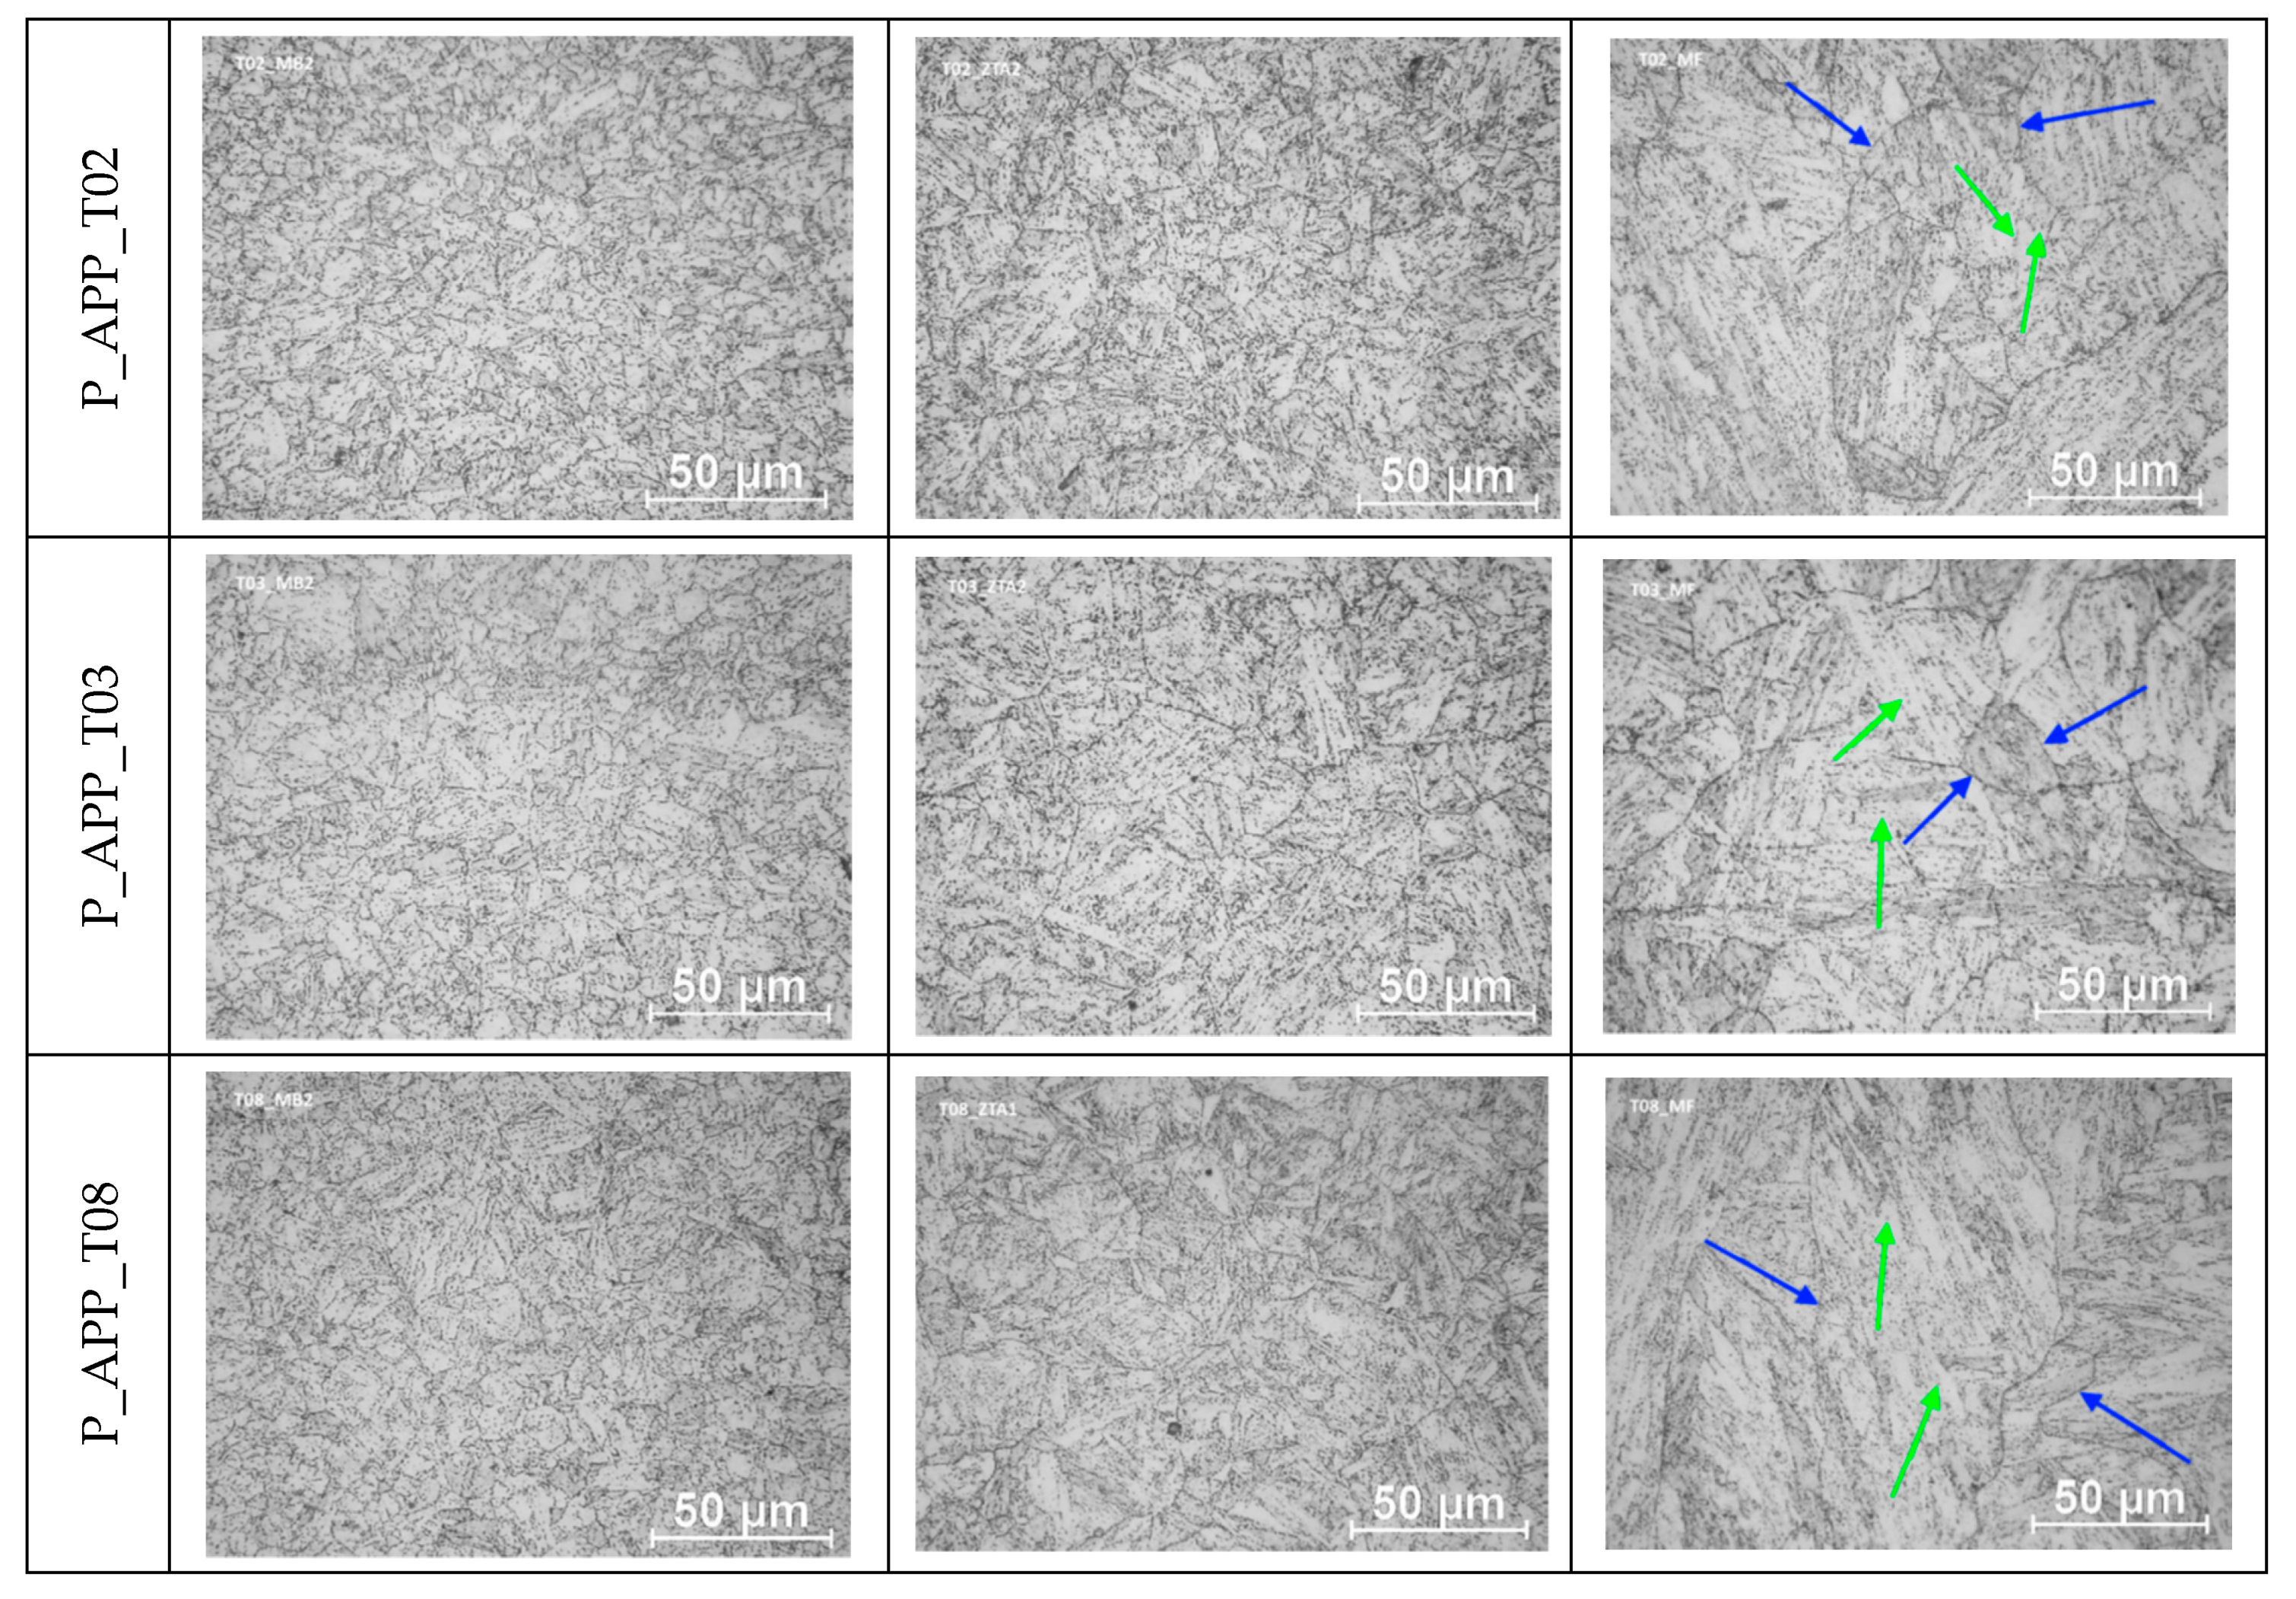
Sample P_APP_T02 was prepared saving the post-heating treatment and keeping the pre-heating and PWHT. The phases’ transformation time included in the P_APP_T01 sample was suppressed in this and the following thermal cycles. This thermal cycle gave interesting mechanical resistance values at room temperature, but it did harm the ductility a little. However, analyzing the mechanical resistance at elevated temperature, a severe decrease in the yield strength and ultimate strength can be observed, presenting as well the lowest elongation value. Thus, suppressing the post-heat-treatment, the properties at elevated temperature are severely affected. The grain seems to not be significantly affected by the thermal cycles in the HAZ, and regarding the MZ, it seems to be less affected than the other samples. Therefore, the absence of post-heat-treatment affects the properties at elevated temperature, which is drastic for this kind of material regarding the typical applications referred above. It is worth noting that no cold cracking effect was felt in the samples due to the waiting time imposed between the welding process and PWHT.
The P_APP_T03 sample followed the same principles of the P_APP_T02 sample, but in this case, a post-heat-treatment was included after the welding process and before the six-month waiting time. These samples presented the lowest ultimate strength values at room temperature, although the values relative to tensile at elevated temperature were improved relative to the similar P_APP_T02 sample. This is the main concern of these samples. It is also worth noting that these samples present a very good ductility behavior at room temperature and the best ductility at elevated temperature. At this point, it needs to be referred that the only difference between the procedure applied to these samples and the procedure used for sample P_APP_T01 is the inclusion of the six-month waiting time after the post-heat-treatment and before the PWHT. However, the inclusion of this waiting time was detrimental to the mechanical properties at room temperature, although other properties were improved, such as the ductility.
Regarding the P_APP_T08 sample, the thermal cycles used are very similar to the thermal cycles applied to P_APP_T01, having as the only difference suppression of the phases’ transformation time. This suppression is important in terms of productivity and energy saving. The results obtained based on these samples allow concluding that there is a good balance between the mechanical resistance obtained and the ductility presented by these samples; both for room temperature and elevated temperature, the grain is a little more acicular than in the other samples, which is not translated in terms of hardness, which presents values extremely close to the average results obtained for samples P_APP_T01, P_APP_T02, and P_APP_T03. Moreover, regarding the bending tests, no cracking or its initiation has been detected. Thus, although these samples show a slight decrease in mechanical resistance and ductility, this is a good alternative to the thermal cycle P_APP_T01.
In summary, Table 10 gives a brief overview of the thermal cycles applied to each set of samples and the corresponding qualitative results, following the criteria pointed out at the bottom of Table 11. It is worth noting that samples P_APP_T08 and P_APP_T01 present slight differences in the procedure, as well as in the final results, not compromising the behavior of welds produced in this material in its main applications.
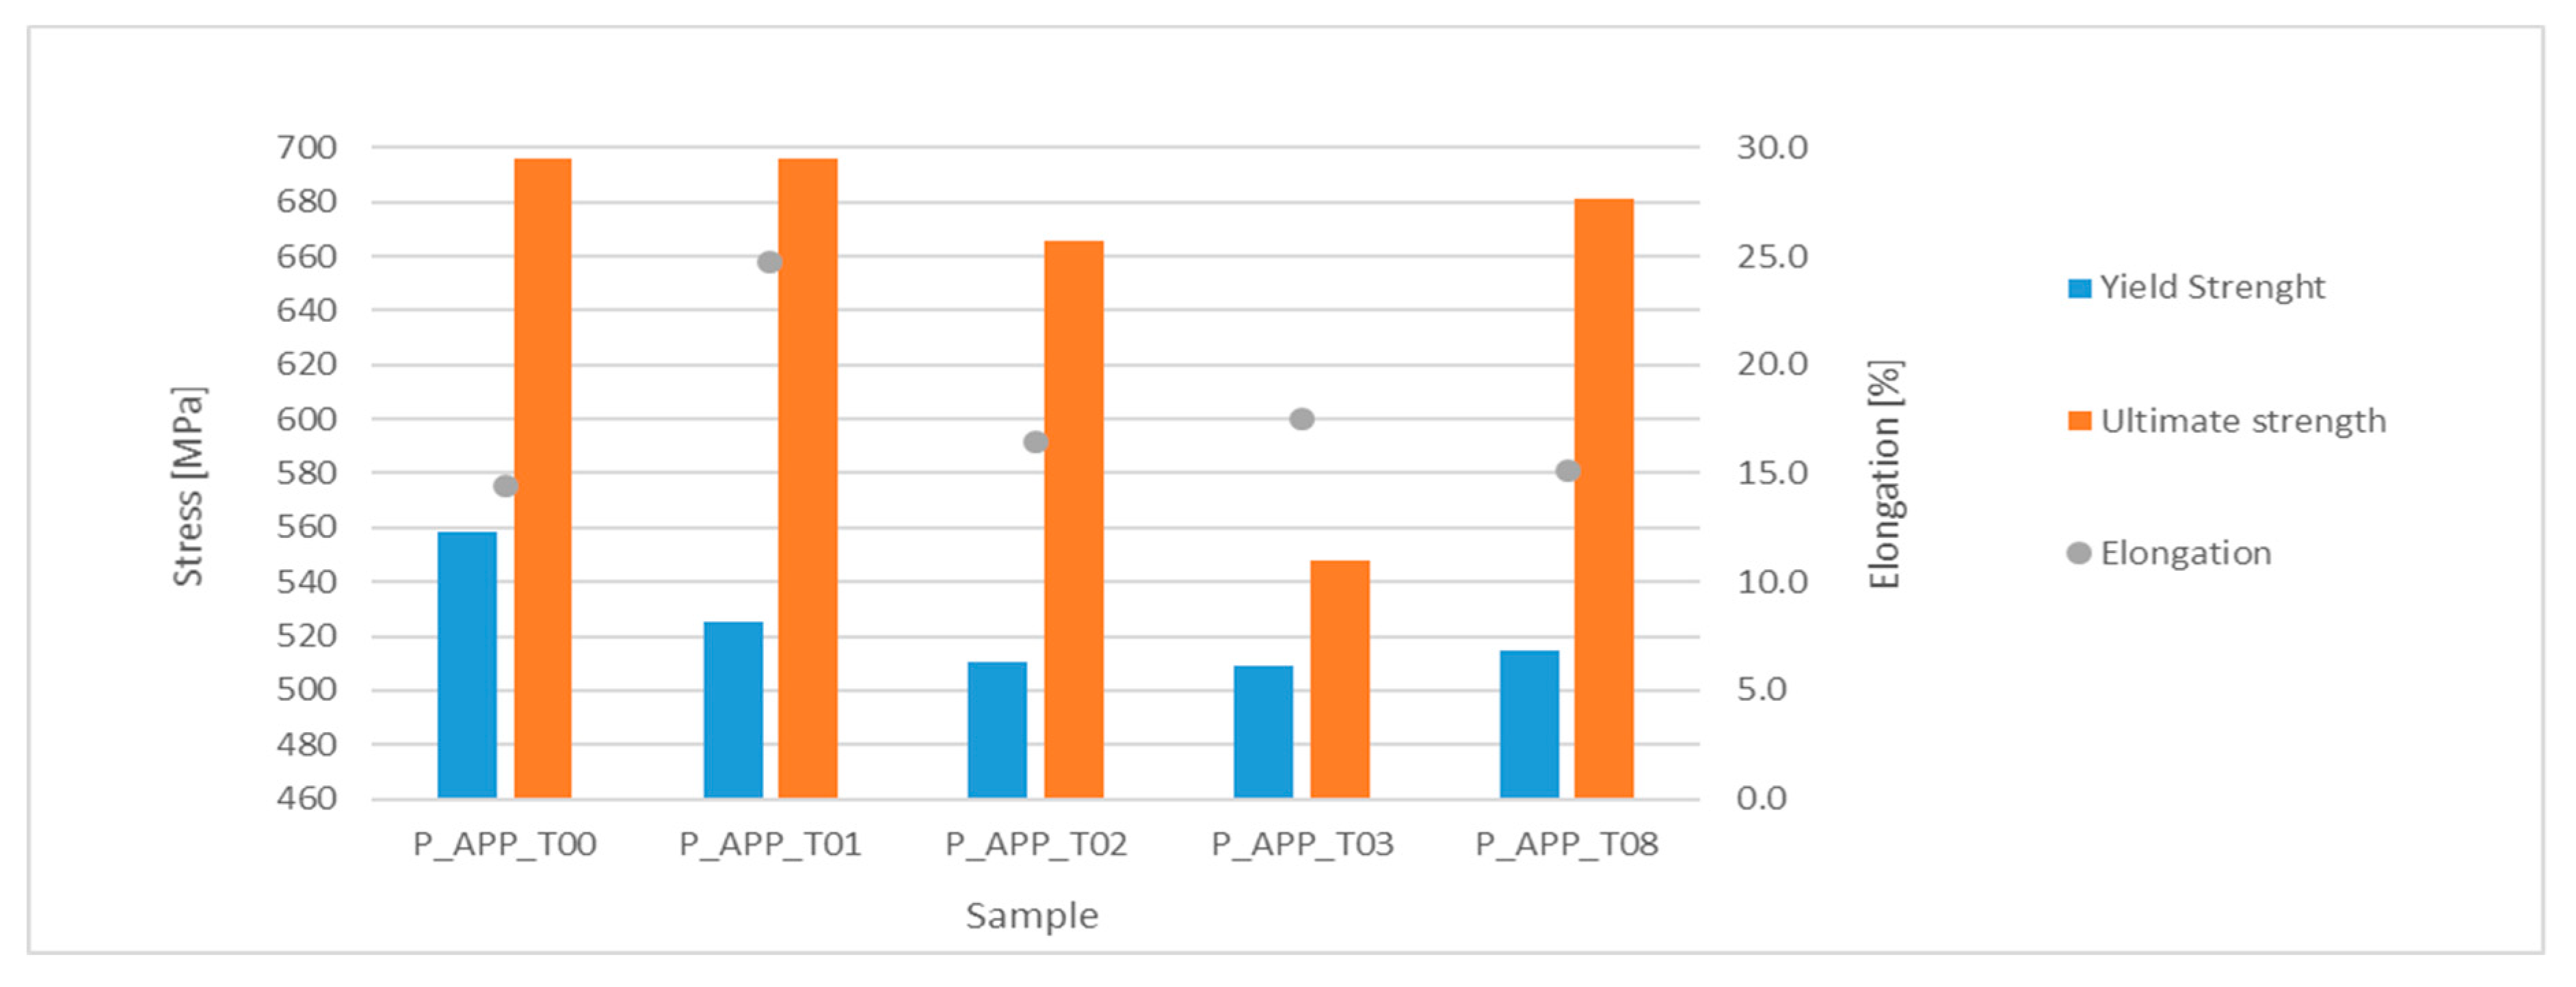
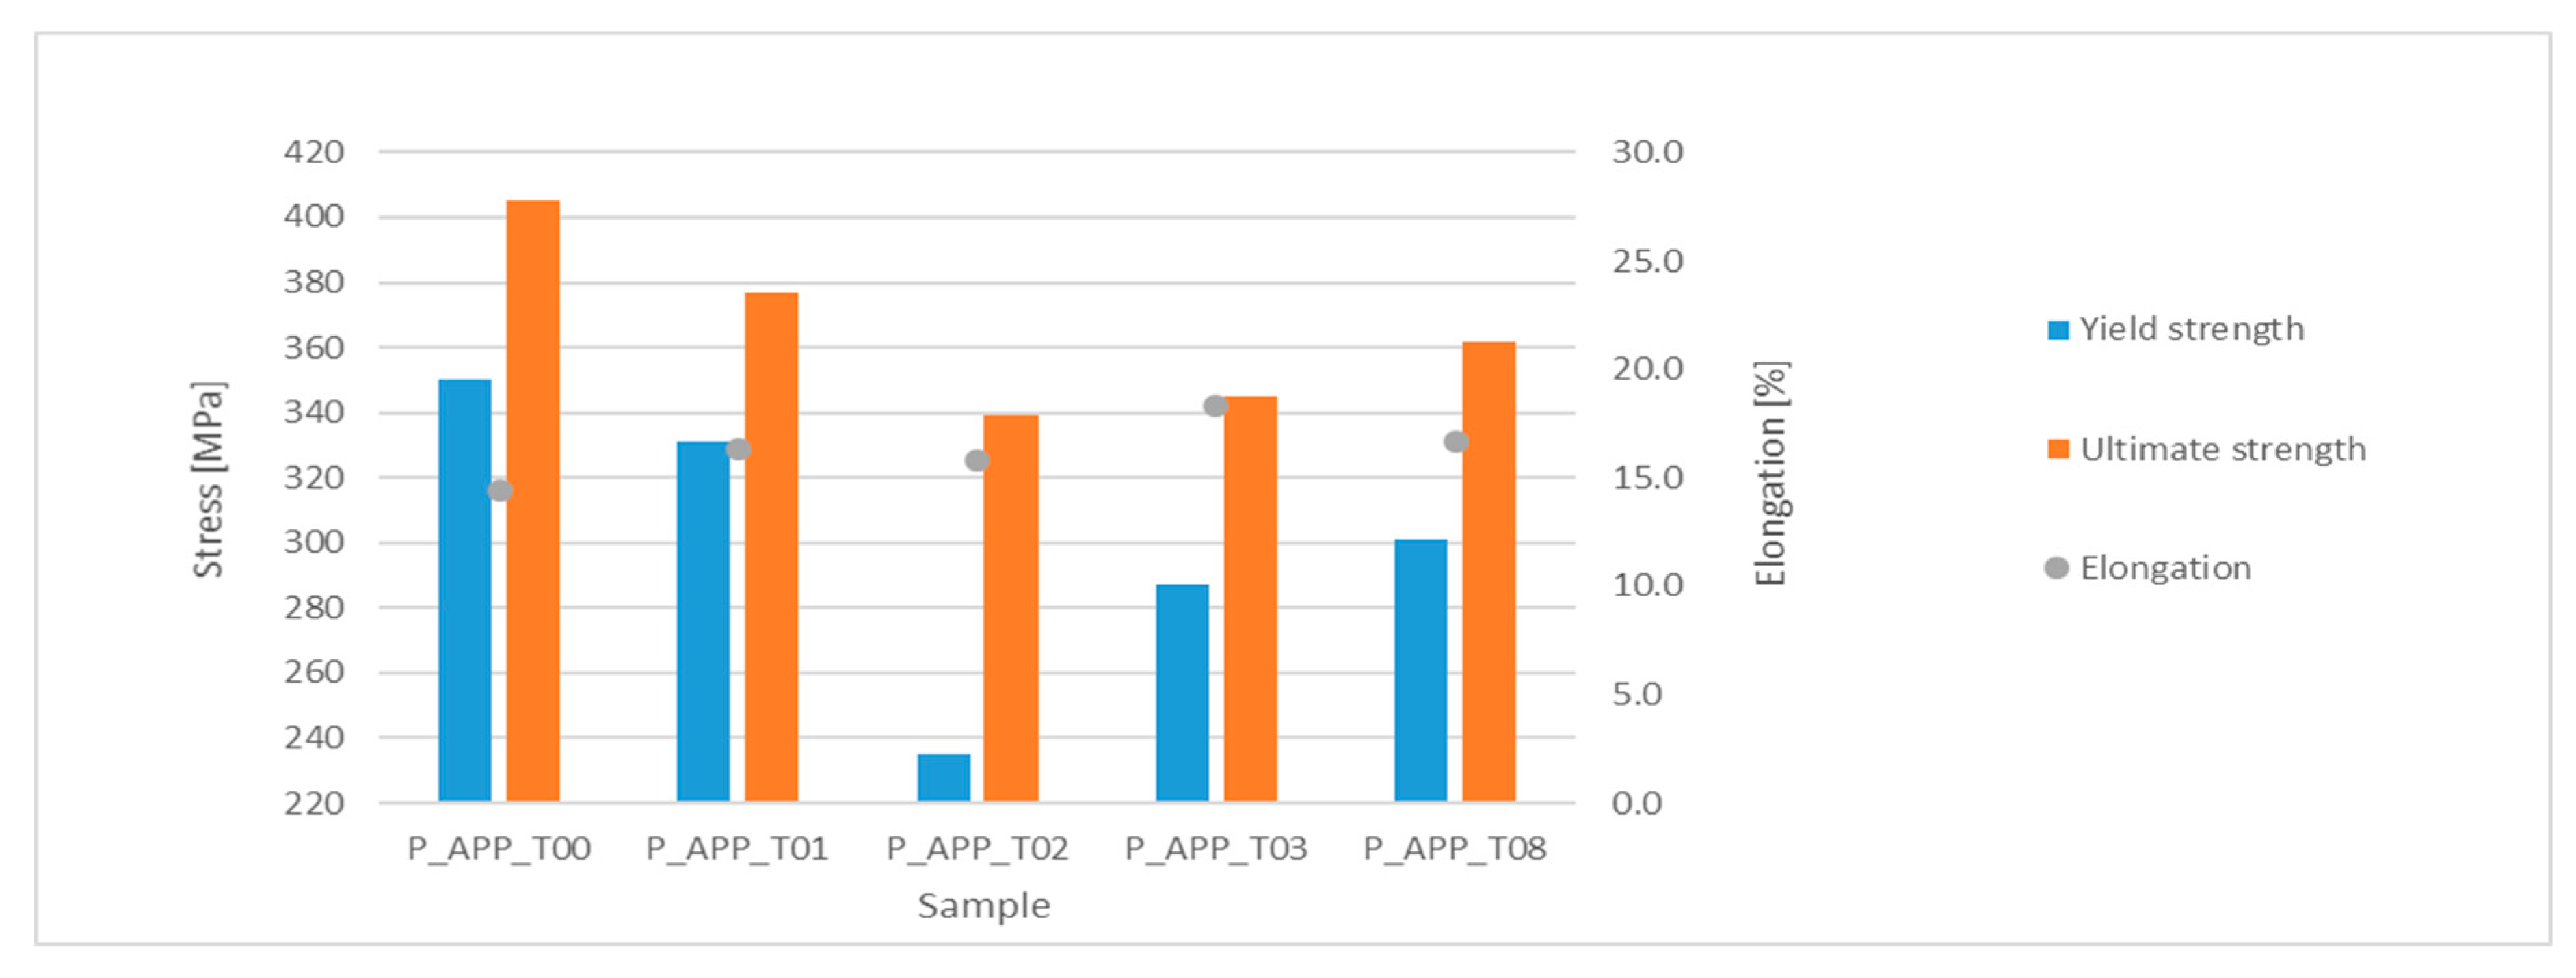
Regarding the main parameters provided by tensile tests, and in order to make a decision regarding the selection of the best strategy based on quantitative data, Table 11 was elaborated classifying from 1 to 4 (1 = worst value and 4 = best value) the different quantitative data obtained from that test. As can be seen in Table 11, after the recommended procedure corresponding to the P_APP_T01 sample, the best alternative is the P_APP_T08 strategy, with a sum of 6.1 points. This confirms the analysis previously performed.

4. Conclusions

Grade 91 steel is usually applied in situations where the temperature and pressure are very demanding. The weldability of these steels presents well-known challenges, which are usually overcome using complex thermal cycles before and after the welding process. This work intended to test other thermal cycles with a view to shorten the treatment time, making the process more productive and more environmentally friendly. Thus, five different thermal cycles were drawn and tested: (a) welding without any pretreatment, post-treatment, or PWHT; (b) using the thermal cycle recommended by the construction codes and steel manufacturers; (c) using a pretreatment and the PWHT, using as well a six-month waiting period between welding and PWHT without phases’ transformation time, in order to study the possible development of cold cracking; (d) using the previous strategy but including the post-welding treatment and; finally, (e) using the same strategy as that in (b) but excluding the phases’ transformation time.
The hardness and microstructure assessed in P_APP_T00 indicate that this strategy cannot be used, because if the mechanical strength is even higher than that in the P_APP_T01 case, the risks of further cracking are higher, making this option not safe. The non-tempered martensite in the MZ and HAZ induces a clear hardness increase, which can be capable of inducing further cracks in service. Thus, this option was discarded due to these facts.
The last strategy (P_APP_T08) for thermal cycles around the welding process produced closer results in terms of mechanical properties at both room and elevated temperatures, comparing with the reference: P_APP_T01. A slight reduction in yield strength (2% at room temperature and 3.9% at elevated temperature) and ultimate strength is reported (2% at room temperature and 9% at elevated temperature), as well as a reduction of about 39% in the elongation at room temperature. However, at elevated temperature, the elongation is even a little bit higher than in P_APP_T01 conditions. Since this steel is usually used in high-temperature applications, this strategy seems to be the best among the other strategies tested in this work.
Thus, the main contribution brought by this work can be stated as the development of a new heat-treatment strategy to be applied in welding of grade 91 steels that is less time consuming and more environmentally friendly, providing very close results compared to the solution currently recommended by construction codes and steel manufacturers.

Author Contributions

Conceptualization, A.P.P. and F.J.G.S.; methodology, A.P.P. and F.J.G.S.; validation, F.J.G.S., O.C.P. and A.B.P.; formal analysis, A.P.P.; investigation, A.P.P.; resources, A.P.P.; data curation, A.P.P. and F.J.G.S.; writing—original draft preparation, F.J.G.S.; writing—review and editing, A.P.P., O.C.P. and A.B.P.; supervision, F.J.G.S., O.C.P. and A.B.P. All authors have read and agreed to the published version of the manuscript.

Funding

This research received no external funding.

Acknowledgments

The authors would like to thanks to ARSOPI company, which provided the best conditions to carry out this work.

Conflicts of Interest

The authors declare no conflict of interest.

References

  1. Pandey, C.; Mahapatra, M.M.; Kumar, P.; Saini, N. Some studies on P91steel and their weldments. J. Alloys Compd. 2018, 743, 332–364. [Google Scholar] [CrossRef]
  2. Standard, B. Seamless Steel Tubes for Pressure Purposes. Technical Delivery Conditions. Non-Alloy and Alloy Steel Tubes with Specified Elevated Temperature Properties; BS EN 10216-2:2013; British Standards Institution: London, UK, 2013. [Google Scholar]
  3. Marzocca, A.L.; Luppo, M.I.; Zalazar, M. Identification of Precipitates in Weldments Performed in an ASTM A335 Gr P91 Steel by the FCAW Process. Procedia Mater. Sci. 2015, 8, 894–903. [Google Scholar] [CrossRef] [Green Version]
  4. Vidyarthy, R.S.; Dwivedi, D.K. Microstructural and mechanical properties assessment of the P91A-TIG weld joints. J. Manuf. Process. 2018, 31, 523–535. [Google Scholar] [CrossRef]
  5. Dhandha, K.H.; Badheka, V.J. Effect of activating fluxes on weld bead morphology of P91 steel bead-on-plate welds by flux assisted tungsten inert gas welding process. J. Manuf. Process. 2015, 17, 48–57. [Google Scholar] [CrossRef]
  6. Krishnan, S.; Dulkarni, D.V.; De, A. Pulsed current gas metal arc welding of P91 steels using metal cored wires. J. Mater. Process. Technol. 2016, 229, 826–833. [Google Scholar] [CrossRef]
  7. Kapal, P.; Surjya, K.P. Effect of pulse parameters on weld quality in pulsedgas metal arc welding: A review. J. Mater. Eng. Perform. 2011, 20, 918–931. [Google Scholar]
  8. Krishnan, S.; Dulkarni, D.V.; De, A. Multipass pulsed current gas metal arc welding of P91 steel. Sci. Technol. Weld. Join. 2016, 21, 171–177. [Google Scholar] [CrossRef]
  9. Sireesha, M.; Albert, S.K.; Sundaresan, S. Importance of filler materialchemistry for optimising weld metal mechanical properties in modified 9Cr–1Mo steel. Sci. Technol. Weld. Join. 2001, 6, 247–254. [Google Scholar] [CrossRef]
  10. Arivazhagan, B.; Sundaresan, S.; Kamaraj, M. A study on influence ofshielding gas composition on toughness of flux-cored arc weld of modified9Cr–1Mo (P91) steel. J. Mater. Process. Technol. 2009, 209, 5245–5253. [Google Scholar] [CrossRef]
  11. Arivazhagan, B.; Kamaraj, M. Metal-cored arc welding process for joining of modified 9Cr-1Mo (P91) steel. J. Manuf. Process. 2013, 15, 542–548. [Google Scholar] [CrossRef]
  12. Shanmugarajan, B.; Padmanabham, G.; Kumar, H.; Albert, S.K.; Bhaduri, A.K. Autogenous laser welding investigations on modified 9Cr–1Mo (P91) steel. Sci. Technol. Weld. Join. 2011, 16, 528–534. [Google Scholar] [CrossRef]
  13. Kundu, A.; Bouchard, P.J.; Kumar, S.; Venkata, K.A.; Francis, J.A.; Paradowska, A.; Dey, G.K.; Truman, C.E. Residual stresses in P91 steel electron beam welds. Sci. Technol. Weld. Join. 2013, 18, 70–75. [Google Scholar] [CrossRef]
  14. Pai, A.; Sogaladc, I.; Albert, S.K.; Kumar, P.; Mitra, T.K.; Basavarajappa, S. Comparison of microstructure & properties of modified 9Cr-1Mo welds produced by narrow gap hot wire & cold wire gas tungsten arc welding processes. Procedia Mater. Sci. 2014, 5, 1482–1491. [Google Scholar]
  15. El-Dosoky, O.E.; Abd El-Azim, M.E.; ElKossy, M.R. Analysis of creep behavior of welded joints of P91 steel at 600 °C. Int. J. Press. Vessel. Pip. 2019, 171, 145–152. [Google Scholar] [CrossRef]
  16. Hyde, T.H.; Saber, M.; Suna, W. Creep crack growth data and prediction for a P91 weld at 650 °C. Int. J. Press. Vessel. Pip. 2010, 87, 721–729. [Google Scholar] [CrossRef]
  17. Standard, A.S. Standard test method for measurement of creep crack growth rates in metals. In Annual Book of ASTM Standards; ASTM: Philadelphia, PA, USA, 2001; Volume 3. [Google Scholar]
  18. Kumar, Y.; Venugopal, S.; Sasikala, G.; Albert, S.K.; Bhaduri, A.K. Studyofcreepcrackgrowthinamodified 9Cr–1Mo steelweldmetal and heataffectedzone. Mater. Sci. Eng. A 2016, 655, 300–309. [Google Scholar] [CrossRef]
  19. Venugopal, S.; Sasikala, G.; Kumar, Y. Creep Crack Growth Behavior of a P91 Steel Weld. Procedia Eng. 2014, 86, 662–668. [Google Scholar] [CrossRef] [Green Version]
  20. Baral, J.; Swaminathan, J.; Chakrabarti, D.; Ghosh, R.N. Effect of welding on creep damage evolution in P91B steel. J. Nucl. Mater. 2017, 490, 333–343. [Google Scholar] [CrossRef]
  21. Divya, M.; Das, C.R.; Albert, S.K.; Goyal, S.; Ganesh, P.; Kaul, R.; Swaminathan, J.; Murty, B.S.; Kukreja, L.M.; Bhaduri, A.K. Influence of welding process on Type IV cracking behavior of P91 steel. Mater. Sci. Eng. A 2014, 613, 148–158. [Google Scholar] [CrossRef]
  22. Wang, Y.; Li, L.; Kannan, R. Transition from Type IV to Type I Cracking in Heat-Treated Grade 91 Steel Weldments. Mater. Sci. Eng. A 2018, 714, 1–13. [Google Scholar] [CrossRef]
  23. Sharma, A.; Verma, D.K.; Kumaran, S. Effect of post weld heat treatment on microstructure and mechanical properties of Hot Wire GTA welded joints of SA213 T91 steel. Mater. Today Proc. 2018, 5, 8049–8056. [Google Scholar] [CrossRef]
  24. Venkata, K.A.; Kumar, S.; Dey, H.C.; Smith, D.J.; Bouchard, P.J.; Truman, C.E. Study on the Effect of Post Weld Heat Treatment Parameters on the Relaxation of Welding Residual Stresses in Electron Beam Welded P91 Steel Plates. Procedia Eng. 2014, 86, 223–233. [Google Scholar] [CrossRef] [Green Version]
  25. Paddea, S.; Francis, J.A.; Paradowskac, A.M.; Boucharda, P.J.; Shibli, I.A. Residual stress distributions in a P91 steel-pipe girth weld before and after post weld heat treatment. Mater. Sci. Eng. A 2012, 534, 663–672. [Google Scholar] [CrossRef]
  26. Pandey, C.; Mahapatra, M.M.; Kumar, P.; Kumar, S. Effect of post weld heat treatments on microstructure evolution and type IV cracking behavior of the P91 steel welds joint. J. Mater. Process. Technol. 2019, 166, 140–154. [Google Scholar] [CrossRef]
  27. Pandey, C.; Mahapatra, M.M.; Kumar, P.; Sirohi, S. Fracture behaviour of crept P91 welded sample for different post weld heat treatments condition. Eng. Fail. Anal. 2019, 95, 18–29. [Google Scholar] [CrossRef]
  28. Pandey, C.; Mahapatra, M.M.; Kumar, P.; Saini, N.; Srivastava, A. Microstructure and mechanical property relationship for differentheat treatment and hydrogen level in multi-pass welded P91 steeljoint. J. Manuf. Process. 2017, 28, 220–234. [Google Scholar] [CrossRef]
  29. Pandey, C.; Mahapatra, M.M.; Kumar, P.; Saini, N.; Thakre, J.G.; Vidyarthy, R.S.; Narang, H.K. A brief study on d-ferrite evolution in dissimilar P91 and P92 steel weld joint and their effect on mechanical properties. Arch. Civ. Mech. Eng. 2018, 18, 713–722. [Google Scholar] [CrossRef]
  30. Widak, V.; Dafferner, B.; Heger, S.; Rieth, M. Investigations of dissimilar welds of the high temperature steels P91and PM2000. Fusion Eng. Des. 2013, 88, 2539–2542. [Google Scholar] [CrossRef]
  31. Akram, J.; Kalvala, P.R.; Misra, M.; Charit, I. Creep behavior of dissimilar metal weld joints between P91 and AISI 304. Mater. Sci. Eng. A 2017, 688, 396–406. [Google Scholar] [CrossRef] [Green Version]
  32. Vidyarthy, R.S.; Kulkarni, A.; Dwivedi, D.K. Study of microstructure and mechanical property relationships of A-TIG welded P91-316L dissimilar steel joint. Mater. Sci. Eng. A 2017, 695, 249–257. [Google Scholar] [CrossRef]
  33. Welding—Fusion-Welded Joints in Steel, Nickel, Titanium and Their Alloys (Beam Welding Excluded)—Quality Levels for Imperfections; ISO 5817; International Organization for Standardization: Geneva, Switzerland, 2014.
  34. Metallic Materials—Conversion of Hardness Values; ISO 18265; International Organization for Standardization: Geneva, Switzerland, 2013.
  35. Non-Destructive Testing of Welds—Visual Testing of Fusion-Welded Joints; ISO 17637; International Organization for Standardization: Geneva, Switzerland, 2003.
  36. Non-Destructive Testing—Penetrant Testing—Part 1: General Principles; ISO 3452-1; International Organization for Standardization: Geneva, Switzerland, 2013.
  37. Process Piping; ASME B31.3; The American Society of Mechanical Engineers: New York, NY, USA, 2010.
  38. Newell, W.F. Guideline for Welding P(T) 91; Euroweld, Ltd.: Mooresville, NC, USA, 2001; Available online: http://cfs9.blog.daum.net/upload_control/download.blog?fhandle=MEZMejdAZnM5LmJsb2cuZGF1bS5uZXQ6L0lNQUdFLzAvMjQuUERG&filename=24.PDF&filename=Guideline+for+Welding+P91.PDF (accessed on 16 December 2019).
  39. Metallic Materials—Vickers Hardness Test—Part. 1: Test. Method; ISO 6507-1; International Organization for Standardization: Geneva, Switzerland, 2018.
  40. Destructive Test on Welds in Metallic Materials—Macroscopic and Microscopic Examination of Welds; BS EN 1321; British Standards Institution: London, UK, 1997.
  41. ASME. ASME Boiler and Pressure Vessel Code An International Code—Qualification Standard for Welding, Brazing, and Fusing Procedures; Welders; Brazers; and Welding, Brazing, and Fusing Operators; IX: 2015, QW 150; The American Society of Mechanical Engineers: New York, NY, USA, 2015. [Google Scholar]
  42. Metallic Materials—Tensile Testing—Part 2: Method of Test at Elevated Temperature; ISO 6892-2; International Organization for Standardization: Geneva, Switzerland, 2018.
  43. ASME. Boiler and Pressure Vessel Code An. International Code—Qualification Standard for Welding, Brazing, and Fusing Procedures; Welders; Brazers; and Welding, Brazing, and Fusing Operators; IX: 2015, QW 163; The American Society of Mechanical Engineers: New York, NY, USA, 2015. [Google Scholar]
Figure 1. Different sets of thermal cycles used for each set of samples utilized in this work. Legend: (a) Pre-heating; (b) Welding; (c) Post-heating; (d) Transformation time; (e) Controlled cooling; (f) Post-welding heat-treatment (PWHT).
Metals 10 00099 g001aMetals 10 00099 g001b
Figure 2. (a) Pipes preheating setup and (b) Pipe welding.
Metals 10 00099 g002
Figure 3. Different non-destructive test stages regarding the samples approval: (a) Liquid penetrant before welding; (b) Dimensional control; (c) Liquid penetrant after welding and cutting; (d) X-ray analysis.
Metals 10 00099 g003
Figure 4. Example on how the microhardness indentations were produced across the cross-section.
Metals 10 00099 g004
Figure 5. Hardness profile of the different samples across the welded and neighboring areas. The label B in some graphs represents the values obtained before the PWHT was carried out 6 months after the welding.
Metals 10 00099 g005
Figure 6. Microhardness profile of the different samples across the welded and neighboring areas.
Metals 10 00099 g006
Figure 7. Micrographs of the different cross-section areas for samples subjected to different thermal cycles. Blue arrows highlight grain boundaries and green arrows highlight precipitates.
Metals 10 00099 g007aMetals 10 00099 g007b
Figure 8. Aspect of the samples used in tensile tests after rupture. Line 2 indicates the welding zone.
Metals 10 00099 g008
Figure 9. Results of the tensile tests performed at room temperature.
Metals 10 00099 g009
Figure 10. Results of the tensile tests performed at elevated temperature (600 °C).
Metals 10 00099 g010
Figure 11. Samples subjected to bending tests: (a) samples bent in face and root surfaces, and (b) liquid penetrant technique applied to bent samples.
Metals 10 00099 g011
Figure 12. Bending tests corresponding to samples (a) P_APP_T08 and (b) P_APP_T00.
Metals 10 00099 g012
Table 1. Chemical composition of the parent metal SA 355 P91.
CSiMnPSAlCrNiMoVCuWNbN
0.1000.2900.5000.0170.0010.0098.6000.1700.9800.2300.1200.0300.0800.052
Table 2. Main mechanical properties of the parent metal SA 355 P91 (Data from Vallourec company).
Rp0.2 (20 °C)Rm (20 °C)Elong. (20 °C)Rp0.2 (600 °C)Rm (600 °C)Hardness
521 MPa693 MPa25.2%320 MPa365 MPa221 HV30
Table 3. Chemical composition of the filler metal ER90S-B9.
CSiMnPSCrNiMoVCu
0.0950.2350.5450.0070.0038.9800.5450.9100.2100.125
Table 4. Main parameters used in the welding process.
ParameterValueParameterValue
ProcessGTAWCurrent/PolarityDC (Direct polarity)
Shielding gas100% Ar+Current intensity95 A
Gas flow14 L/minVoltage14 V
Welding position2GTraveling speed42 mm/min
Chamfer typeVThermal input1.33 kJ/mm
Chamfer angle60°Filler metal diameter2 mm
Root opening3 mmTungsten electrodeØ2.4 mm (EWCE-2)
Root face1 mmNumber of passes2
Table 5. Different thermal cycles applied to the P91 samples.
Sample CodePre-Heating and Global PWHTLocalized PWHT
HeatingTemperatureTime AfterCoolingTemperatureTimeHeatingTemperatureTime AfterCoolingTemperature
RateWeldingRateRateWeldingRate
(°C/h)(°C)(min)(°C/h)(°C)(min)(°C/h)(°C)(min)(°C/h)(°C)
P_APP_T00As-receivedAs-welded
P_APP_T01100250120506012010075012050300
P_APP_T02100250Protected until reach room temperature10075012050300
P_APP_T03100250120506012010075012050300
P_APP_T081002501205020--10075012050300
Table 6. Surface microhardness of the different samples (HV10). HAZ: heat-affected zone, MZ: melted zone.
Samples Ref.BM1HAZ1MZHAZ2BM2
HV10
P_APP_T00207 ± 5271 ± 12356 ± 16292 ± 8211 ± 12
P_APP_T01199 ± 17198 ± 20245 ± 12208 ± 16196 ± 14
P_APP_T02212 ± 11268 ± 14327 ± 9278 ± 13214 ± 9
P_APP_T03204 ± 8287 ± 12310 ± 11288 ± 8206 ± 10
P_APP_T08195 ± 6195 ± 7212 ± 9191 ± 5193 ± 3
Table 7. Cross-section microhardness of the different samples (HV1).
Samples Ref.BM (Left)HAZ (Left)MZHAZ (Right)BM (Right)
HV10
P_APP_T00231 ± 2422 ± 45404 ± 12439 ± 23231 ± 4
P_APP_T01219 ± 6242 ± 19253 ± 6230 ± 15218 ± 2
P_APP_T02222 ± 2242 ± 19272 ± 6247 ± 17223 ± 2
P_APP_T03224 ± 2243 ± 21266 ± 5242 ± 18225 ± 2
P_APP_T08227 ± 3231 ± 13271 ± 6247 ± 18234 ± 2
Table 8. Chemical analysis of the materials used in the welding and the weld composition (wt %).
MaterialReferenceCSiMnPSAlCrNiMoV
Pipe 1SA 213 T910.0910.350.520.0160.00110.0068.710.280.950.21
Pipe 2SA 213 T910.1020.290.500.0170.00120.0098.600.170.980.23
Filler metalER 90S B90.0920.220.540.0080.0020-8.900.460.900.22
Weld face-0.0950.290.550.0070.00060.0058.880.480.890.22
Weld root-0.0910.300.530.0100.00080.0058.900.420.890.22
Table 9. Yield strength, ultimate tensile strength, and elongation at room and high temperature.
SamplesRoom Temperature (20 °C)High Temperature (600 °C)
Rp0.2RmElong.Rp0.2RmElong.
MPaMPa%MPaMPa%
P_APP_T00559 ± 16696 ± 1514.5 ± 0.4350 ± 12405 ± 914.4 ± 0.3
P_APP_T01526 ± 7696 ± 324.8 ± 0.9331 ± 6377 ± 816.3 ± 0.8
P_APP_T02511 ± 2666 ± 116.5 ± 1.2235 ± 3239 ± 315.8 ± 0.9
P_APP_T03509 ± 2548 ± 117.6 ± 0.3287 ± 2345 ± 318.3 ± 0.4
P_APP_T08515 ± 5682 ± 815.1 ± 0.9301 ± 5362 ± 616.7 ± 0.8
Table 10. Summary of the thermal cycles applied and corresponding results by test type.
SamplesThermal CyclesPerformed Tests
PreheatingPost-HeatingTime Transf.PWHTHardnessMacroMicroTensile RTTensile HTBend
T00NoNoNoNoNot AcceptableAcceptableNot AcceptableGoodGoodGood
T01YesYesYesYesVery GoodVery GoodVery GoodVery GoodGoodVery Good
T02YesNo (1)NoYes (2)GoodVery GoodGoodAcceptableNot AcceptableVery Good
T03YesYesNoYes (2)GoodVery GoodGoodNot AcceptableGoodVery Good
T08YesYesNoYesGoodAcceptableAcceptableGoodGoodVery Good
(1) Protected cooling until reaching room temperature; (2) PWHT performed 6 months after welding; Rating Scale: Not Acceptable–Acceptable–Good–Very Good.
Table 11. Summary of the thermal cycles applied and corresponding results by test type.
SamplesRoom Temperature (20 °C)High Temperature (600 °C)Pts Total (Room + High)
Rp0.2 (MPa)Rm (MPa)A (%)Pts TotalRp0.2 (MPa)Rm (MPa)A (%)Pts Total
ValuePtsValuePtsValuePtsValuePtsValuePtsValuePts
P_APP_T015264696424.844.003313377416.333.607.60
P_APP_T025112666216.522.002351339115.821.153.15
P_APP_T035091548117.631.302872345214.611.853.15
P_APP_T085153682315.112.703014362316.743.406.10

