Article

Children’s Online Safety: Predictive Factors of Cyberbullying and Online Grooming Involvement

1
Institute for Research on Population and Social Policies, National Research Council of Italy, 00185 Rome, Italy
2
Department of Statistical Sciences, Sapienza University of Rome, 00185 Rome, Italy
*
Author to whom correspondence should be addressed.
Societies 2023, 13(2), 47; https://doi.org/10.3390/soc13020047
Submission received: 13 January 2023 / Revised: 14 February 2023 / Accepted: 14 February 2023 / Published: 17 February 2023
(This article belongs to the Topic Education and Digital Societies for a Sustainable World)

Abstract

:
The increase in the use of the Internet, strongly boosted by the spread of COVID-19, has amplified the risk of involvement in cyberbullying and online grooming among minors. To date, most research on these phenomena has focused on middle and high school students, with fewer studies on younger children. The present study aims to fill this knowledge gap by measuring the spread of cyberbullying and online grooming in a sample of 410 primary school students in the city of Rome and by identifying the main individual and environmental predictors associated with the involvement of children in these phenomena using factor analysis. Results indicate that both cyberbullying and online grooming are widespread among respondents, showing common traits within the four latent dimensions identified. Screen time is among the main predictors of children’s involvement, together with parental supervision, phubbing behaviours, prosocial tendencies and family socio-economic background. These findings highlight the need for further studies on representative samples of this age group, as well as for a greater cooperative effort among schools, parents and caregivers to keep children safe in the virtual world.

1. Introduction

The shift from the offline world to the virtual sphere has faced an unpredictable acceleration over the last few years. The physical distancing experienced by most of the worldwide population to limit the spread of COVID-19, together with the increasing availability of digital devices, has made the Internet even more pervasive in everyone’s lives, especially for the youngest population. During the closure of most schools and with distance teaching, the Internet has played a crucial role in children’s lives as it was the only possible way to keep on studying and to maintain any kind of extra domestic relationship. In Italy, according to the Italian National Institute of Statistics (ISTAT), between 2019 and 2021, the percentage of children aged between 6 and 10 using the Internet has increased from 62.5% to 89.1%, with significant growth of almost 30% of Internet daily users [1]. This unprecedented use of digital devices among children, often without sufficient parental supervision, has magnified the risks arising from exposure to cyberspace [2,3]. Even though nowadays children become familiar with digital devices at a very early age, they often lack the skills and the cognitive abilities to recognise dangerous content and non-authoritative sources. According to the finding of a study coordinated by the Joint Research Centre of the European Commission, with data from eleven European countries collected between June and August 2020, Italy was among the highest ranked in terms of increase in cyberbullying victimisation rates and in the exposure of children to gory or violent content during the COVID-19 spring lockdown [4]. For this reason, in recent years, research interest in cyberbullying is growing and studies attempting to measure its spread [3,5], to identify the main risk and protective factors [6,7,8] and to study its psychophysical consequences compared to those of traditional bullying [9,10] have proliferated. However, the different definitions adopted by researchers and, consequently, the variety of measurement tools and research methodologies employed have often led to inconsistent results.
The scientific debate on the definition of cyberbullying is still open between those who consider it the virtual version of traditional bullying [11] and those who instead look at it as a completely distinct phenomenon, due to the peculiar characteristics of the virtual world [12]. Starting from the definition of traditional bullying that includes “aggressive, intentional acts carried out by a group or an individual repeatedly and overtime against a victim who cannot easily defend him or herself” [13], we can identify its main elements as follows: the intent to harm, the repetition, and the imbalance of power between the victim and the perpetrator [14]. However, these characteristics do not apply to cyberbullying in the same way, as the virtual sphere has different potentialities. To date, a widely accepted definition of cyberbullying is the one that describes it as “using information and communication technologies (ICT) to repeatedly and intentionally harm, harass, hurt and/or embarrass a target” [15]. First of all, the characteristic that distinguishes cyberbullying from bullying is the concept of repetition, which, in the virtual world, depends not only on the length of time during which texts, images or videos remain online but also on how many users they reach. In fact, web content can become viral if shared on social media platforms by popular profiles and its deletion can be very difficult. Secondly, the imbalance of power may exist in the availability of technologies, but it is minimised by the possibility of anonymity. This latter element encourages those perpetrators who would not adopt the same abusive behaviours in offline interactions, together with a lower perception of potential repercussions and punishment, and leads to the so-called online disinhibition effect [16,17]. For this reason, cyberspace offers more chances for overlapping between the roles of victims and actors than in the face-to-face sphere, as the Internet can be the perfect channel to take revenge for any abuse suffered offline. Thus, a focus on the bully–victim role is crucial in the analysis of the cyberbullying phenomenon. Indeed, children and adolescents belonging to this dual category are the most at risk of vulnerability since they are the most rejected by peers, suffering double negative consequences [18,19,20]. Finally, according to a large body of literature about the cyberbullying impacts, the potentially infinite audience and the anonymity of the virtual sphere make this phenomenon more harmful than traditional bullying in terms of consequences, including higher levels of depression, stress, anxiety, suicidal ideas and attempts, self-harm and worse physical health [21,22,23,24,25,26,27].
To better understand the complexity of the phenomena under observation, the adoption of a socio-ecological approach [28] is needed because it allows us to consider all the relevant factors related to both the individual sphere (such as sex, age, time spent in front of a screen, prosociality and perceived emotions) and the social context (socio-economic context, school climate, parental education and parental employment status) [29]. Concerning the gender differences in cyberbullying involvement, the results of the scientific literature are quite inconsistent: some studies have found that the prevalence rates of cyber victimisation are higher among girls than among boys [30,31,32], others suggest that boys have a higher probability of being perpetrators [33,34,35,36,37], while most of the studies have not found any significant correlation between gender and the prevalence rates of cyberbullying [38,39]. In a similar way, the relationship between the involvement in cyberbullying and sport practice, which has been investigated only by a few studies, shows inconclusive results. Although some studies have found that physical activity has a protective role in both cyber victimization and perpetration due to its positive effects on psychological well-being and self-esteem [40], others have not found any significant relationship between the phenomena [41,42,43]. In this regard, other studies reveal that in the absence of a specific teaching approach, sport practice does not protect young people from social conditioning or exclusion [44]. Moreover, exposure to violent video games has also been taken into account in several studies with ambivalent results. Many of these studies have found positive significant associations between prolonged exposure to video games with violent content and cyberbullying involvement [45,46,47], while others have not found meaningful correlations [48].
According to recent literature reviews, the main predictors associated with cyber victimisation are as follows: high levels of time spent online, scarce empathy and prosociality, low self-esteem, high levels of anxiety and loneliness, traditional bullying victimisation, low socio-economic status, scarce parental supervision on children’s online activities and negative school climate [49]. On the other hand, the main predictive factors of cyber perpetration are high levels of time spent online, low self-esteem, scarce empathy and prosociality, tendency to aggressive behaviours, high levels of anger, traditional bullying victimisation, peer rejection, scarce parental supervision on children’s online activities and negative school climate [7,8]. Thus, as the literature review shows, predictors of cyberbullying victimization and perpetration often overlap in identifying highly vulnerable groups, which should be the primary target of the intervention programs supporting youth well-being.
Along with the increase in cyberbullying, another dangerous consequence of the rise in the use of the Internet among children is the increasing risk of online grooming perpetrated by adult strangers. In Italy, this phenomenon has reached its highest levels during the last two years, particularly involving children under the age of 13 [50]. The considerable boost in complaints of child pornography and grooming that has been recorded is probably linked to the efficacy of the numerous awareness and information campaigns implemented regarding these issues, even if the real prevalence of this phenomenon is still unknown. The term “online grooming”, used for the first time by Salter [51], refers to a manipulative process in which the groomer, using online platforms, builds up a trusting and emotional relationship with a minor with the purpose of sexual abuse or exploitation. In recent years, due to the unprecedented rise in Internet use among children and adolescents mentioned above, this phenomenon has become a growing problem and studies on the main risk factors are proliferating [52,53,54]. As is widely reported by the literature, family support, especially in terms of parental monitoring of minors’ online activities, is a strong deterrent to involvement in this dangerous process, while time spent on the Internet increases the risk of victimisation [55,56,57].
Although most studies on cyberbullying and online grooming have been conducted on middle and high school students [8,54,58], the age of people involved in these phenomena is progressively decreasing [4]. For this reason, research on the spread of cyberbullying and online grooming among primary school children has become ever more urgent, considering also that involvement in these phenomena at an early age represents a serious risk of victimisation during adolescence and adulthood [59,60]. Furthermore, a deeper understanding of these phenomena through the collection of reliable data can allow policymakers to design and implement effective prevention programs for children’s online safety.
The present study, which is based on a survey carried out in Rome on primary school children, fits into this framework with the main purposes of assessing the spread of cyberbullying and online grooming among primary school students and identifying the main individual and environmental predictors associated with the involvement of children in these phenomena. Detecting the main predictive factors of children’s involvement in cyberbullying and online grooming allows us to confirm or reject the findings of the scientific literature mainly based on a sample of adolescents and pre-adolescents representing a crucial point for the implementation of preventive intervention programs.
Starting from the main findings of the scientific literature reviewed above, we formulate the following hypothesises:
H1. 
The involvement of children in cyberbullying increases as their age increases.
H2. 
Children most at risk of involvement in both cyberbullying perpetration and victimisation are those with high levels of screen time, low socio-economic family backgrounds, living in more disadvantaged social contexts, with scarce parental supervision on their online activities, along with those who prefer videogames with violent content, and children with scarce relational competencies and high levels of emotional discomfort.
H3. 
Children more at risk of involvement in online grooming victimisation are those with the highest level of screen time, high levels of emotional discomfort, low parental monitoring of their online activities, and those who belong to the most vulnerable categories from a socio-economic point of view.
H4. 
Sport practice is not a significant variable for the involvement in these phenomena.

2. Materials and Methods

2.1. Data Collection and Sample

This study shows the results of a survey carried out in Rome during the Spring of 2021, between April and May, on 410 children attending the last three years of primary school, aged 8–11. Eight primary schools, four located in the 6th district and the other four in the 8th districts 1, were involved in the study. The choice of these two territories, which differ in their socio-economic characteristics, allows the formulation of hypotheses that can be extended to other similar contexts and to verify the influence of the socioeconomic context on online behaviours. In particular, the 6th district of Rome, which is the most populated and the youngest in terms of demographic structure, is characterised by high levels of poverty from a socio-economic point of view, while the 8th district is less populated, the oldest of the city, and with better socio-economic conditions [61]. For each selected school, 3 classes—third, fourth and fifth grade—were randomly selected with cluster sampling to obtain a two-stage stratified sample with stratification of the first-stage units (schools) and random selection of the second-stage units (classes of students). Therefore, the sample is probabilistic and representative of the two involved districts, while it cannot be considered representative of the national territory. Interviews were conducted using a structured paper questionnaire with the assistance of two researchers in order to collect data as reliable as possible. In fact, the physical presence of researchers within the classrooms and their constant assistance to the participants ensured a better understanding of the questions among respondents, but it also minimised the interference of teachers and the school environment. Furthermore, due to the young age of the respondents, special attention was paid to the formulation of the questions and also to the type and the size of the font in designing the paper questionnaire. The main obstacle to the implementation of the survey was the physical access to the schools since the administration phase was carried out during the spread of the COVID-19 pandemic. However, it was overcome thanks to the awareness of the school administrations that recognised the importance and the urgency of the research.
In total, 410 children were interviewed. Of these, 46.3% (190) were females and 53.7% (220) were males, 35.4% (145) were attending the 3rd grade, 31.7% (130) the 4th grade and 32.9% (135) the 5th grade. Among the respondents, 86.1% (342) have parents with Italian citizenship, while 13.9% (55) have at least a parent with foreign citizenship (8.3% (33) have both foreign parents). Furthermore, 47.6% (195) attended a school located in the 6th district, while 52.4% (215) were in the 8th district. The questionnaire consists of 42 questions covering the following main topics: cyberbullying perpetration and victimisation, online grooming victimisation, time spent in front of a screen (screen time), quantity and quality of social interaction among peers, adherence to gender roles, emotional well-being and prosociality. Attached to the request for the consent, a short questionnaire on socio-demographic information about the respondents’ families was administered to each parent. In this way, we collected data about the number of family members, the number of cohabiting and non-cohabiting brothers and sisters of respondents, and also the citizenship, marital status, educational qualification, and employment status of their parents. These socio-demographic forms were associated with the children’s questionnaires through a numeric code, in order to guarantee the anonymity of the collected data.

2.2. Materials

To study cyberbullying victimisation, we included in the questionnaire a multiple-response question about actions suffered online during the year prior to the survey. It comprised the following list of actions: being insulted or mocked, being threatened, being excluded, being incited to injure themselves, and being a victim of the sharing of personal photos or videos without consent. In a similar way, to examine online grooming victimisation, respondents were asked if they had suffered at least one of the following online actions performed by adult strangers: receiving compliments, gifts offer, photos or videos, questions about their clothing, requests for personal photos or videos and requests for face-to-face meetings. Finally, to investigate cyberbullying perpetration, the same technique has been used and the multiple-response question included the following list of actions carried out online during the year prior to the survey: venting anger online, insulting someone, teasing someone, stimulating online quarrels, threatening someone, excluding someone from a group, sharing photos or videos of other people without their consent, inciting someone to injure him/herself. To assess the prevalence rates of these phenomena, we defined victims or actors of cyberbullying as those children who had suffered or carried out at least one of the proposed actions. In the same way, children who had suffered at least one of the proposed online grooming actions were defined as victims of online grooming.
To better understand the complex and multidimensional phenomena of cyberbullying and online grooming among children, other specific variables concerning the socio-economic family background in terms of parental educational level and employment status were also taken into account. The parental educational level indicator was built starting from the parents’ educational qualification collected through the family consent form filled out by the parents. Considering, simultaneously, the answers of both parents, these were synthesised in the indicator, identifying 2 levels of parental education: medium–low and medium–high. In the same way, the parental employment status indicator was built through a question about current employment situations. The outcome of the recording process was a 2-level employment status indicator: medium–low and medium–high.
To measure the time spent in front of a screen, two indicators were built starting from the time spent playing video games and that spent using social media and applications. The frequency of exposure was detected in days per week and hours per day. The outcomes of the recording process were the two screen-time indicators, one on videogames and one on social media and applications, which identify four levels of screen time: absent, low, medium and high. Respondents with high levels of screen time, or children spending at least two hours per day on videogames, social media and applications, were considered hyper-connected children.
With the aim to collect data about parental awareness of children’s online activities, respondents were asked if their parents knew the videogames, social media and applications that they commonly use. The results of the recording process are two indicators, one on the parental awareness about videogames and one on the parental awareness about social media and applications used by respondents, which identify the presence or absence of parental monitoring of children’s online activities.
Another indicator related to Internet addiction concerns the discomfort associated with the impossibility of using digital devices for a week; respondents were asked to indicate their potential reaction among the following list: anxiety, sadness, boredom, calm, isolation, and indifference. The collected answers were dichotomised between the presence and absence of discomfort.
To study the phenomenon of phubbing, which is literally the act of snubbing someone in a social environment by concentrating on one’s phone instead of talking to the person directly [62], children were asked to indicate how often they prefer to use their devices instead of enjoying the presence of other people on 4-point scales from “never” to “always”. The collected answers were dichotomised during the recording process between never/sometimes and often/always.
Finally, the present study also considered the prosociality of children, which is the tendency to adopt helping behaviours towards others without external rewards [63]. In this case, a specific indicator was built starting from the results of three questions about the utility of understanding the other’s feelings, the way to compliment a friend, and the way to understand how a friend feels. For each of these questions, respondents had four possible answers linked to the presence of prosocial tendencies, a neutral behaviour, a self-centred tendency, and indifference. Synthetising the scores, a single indicator was built with 3 levels of the tendency to adopt prosocial behaviours: low, medium, and high.
To study the emotional well-being of the respondents, a question about the frequency of the perception of specific negative primary emotions was included in the questionnaire. The emotions proposed were anger, sadness, loneliness, fear and anxiety. Respondents were asked to indicate the frequency in the perception of all the above emotions on a 4-point scale from “never” to “always”. The collected answers were dichotomised during the recording process between never/sometimes and often/always.

2.3. Data Analysis

The data analysis was carried out following two steps: a bivariate analysis and a factor analysis. The process started from a bivariate statistical analysis carried out using SPSS software (version 26 server) (IBM, Chicago, IL, USA) [64] to measure the prevalence rates of cyberbullying victimisation and perpetration and the online grooming victimisation among children, and also to explore the relationships between these phenomena and screen time. A second step concerned the implementation of the factor analysis technique using R software [65], with the aim of studying the latent dimensions of the phenomena covered by the survey and investigating the relationships between them and other individual and environmental variables to identify the main predictive factors associated with the involvement of children in cyberbullying and online grooming.

Factor Analysis

The factor analysis technique was implemented by using R software with the aim of studying cyberbullying and online grooming among children and identifying the latent dimensions of the data collected. The resulting factors can be considered as a set of indicators that allows us to explore the relationships between the phenomena and other individual and environmental variables starting from the main findings of the scientific literature reviewed above. This phase of data analysis started with the imputation of the missing values. In particular, Multivariate Imputation by Chained Equations [66,67,68] was used; the choice was made mainly due to two important reasons. On the one hand, mice imputation creates multiple imputations for multivariate missing data: in this way, it is possible to take into account the uncertainty due to missingness; in our analysis, for each missing value, we let the number of imputations be equal to 5 and then, in order to build the final imputed dataset, we kept the value that was the most frequent among those 5 imputed. On the other hand, mice imputation allows us to take into account most of the available information: indeed, it imputes every missing value in each specific column by using a separate model, which includes all the other variables in the dataset as covariates.
To carry out the factor analysis, we, firstly, selected the variables of interest: variables related to cyberbullying victimisation and perpetration, those related to online grooming victimisation perpetrated by adult strangers, and also the two indicators concerning the screen time on videogames and the screen time on social media and applications. Then, since those variables are either binary or categorical, we computed the polychoric correlation between each pair of variables using the hetcor function in the polychor R package [69,70], which allows us to compute correlations for these kinds of data.
By using the Kaiser–Meyer–Olkin and Bartlett’s tests (functions KMO and cortest.bartlett in the psych R package [71,72], we realized that factor analysis is well suited for our data. Indeed, the Kaiser–Meyer–Olkin tests returned an overall value of Measure of Sampling Adequacy (MSA) above 0.7, meaning that the variables are adequate for factor analysis [73]; moreover, Bartlett’s test result was significant, meaning that the correlation matrix has significant correlations among at least some of the variables in a dataset, a prerequisite for factor analysis to work. Given that factor analysis is well suited for our data, we implemented factor analysis (function factanal in the stats R package) [74], by letting the number of factors range in [2,10]. In this way, by using the scree plot (number of factors vs. resulting eigenvalue) and the elbow method, we realized that the optimal number of factors is seven; although, a better interpretation of the results is reached by using only four factors, which still achieve good performance in terms of explained variance. As Figure 1 shows, the elbow is observed when the number of factors is 7. However, by analysing the factor loadings, we observed that the results obtained by choosing 4 factors provide a deeper and better interpretation. In this way, the small loss in explained variance (from 86% to 76%) is fully compensated by the gain in statistical and sociological interpretability.
Once the factor analysis has been implemented, factor scores were studied in order to fully identify the four latent dimensions. To better understand what the four factors describe, we, firstly, considered the factor loadings to study to what extent each variable contributes to defining each factor. Moreover, we also considered additional individual and environmental variables, which will be listed in Section 3.2. By using these variables, we implemented two different analyses driven by two different motivations: on the one hand, to study how the distribution of factors’ scores changes according to the variables, we carried out the analysis of the variance (ANOVA). The ANOVA allowed us to study how the factor scores are distributed with respect to the structural, individual, and environmental variables. Among the most significant results, we will recall only some of them for each of the factor’s distribution in Section 3. On the other hand, to compare differences in relevant statistics of central tendency, we computed the summary statistics (i.e., mean, median, min, max, range) of each factor. In the present study, we will show only the mean scores for an easier presentation of the results. We highlight that, in order to make a comparison among the factor scores and to obtain a measure easier to understand at the individual level, the range was converted on a scale between 0 and 100; the value calculated for each child represents the individual measure of the latent dimension. Therefore, the average value of each factor represents the average of the individual measures. In this way, it is possible to calculate the average value of each latent factor within subgroups, identifying the characteristics of the respondents with higher scores. A detailed description of the four obtained factors, which considers the factor loadings and the mean scores per subgroups of categorical variables, is given in Section 3.

3. Results

3.1. Bivariate Analysis

Figure 2 shows the prevalence rates of cyberbullying among respondents, identifying cyberbullying victims, cyberbullying perpetrators and online-grooming victims. About three out of ten children have been actors of at least one cyberbullying action during the year prior to the survey without significant differences between boys and girls, while two out of ten respondents have been victims of at least one of these actions, especially boys. The online grooming perpetrated by adult strangers affected more than one in ten children during the year prior to the survey, with no significant differences between girls and boys.
To investigate the relationship between the involvement in both cyberbullying and online grooming and the time spent in front of a screen, it is important to look at the sample distribution among the levels of the indicators of screen time playing videogames and using social media and applications. According to the indicator of screen time on videogames, only 6.6% of children do not use videogames (9.6% of girls and 4.1% of boys), 37.1% shows a low level of screen time (45.7% of girls and 29.7% of boys), 30.0% a medium level (30.3% of girls and 29.7% of boys) and the remaining 26.3% of the sample shows a high level of screen time on videogames with a significant prevalence of boys (36.5% and 14.4% of girls). Concerning the screen time indicator on social media and applications, 15.7% of respondents do not use these platforms (14.3% of girls and 17.0 of boys), while 35.1% shows a low level of screen time (37.6% of girls and 33.0% of boys), 29.7% a medium level (32.8% of girls and 27.1% of boys) and the remaining 19.4% shows a high level of screen time on social media and applications (15.3% of girls and 22.9% of boys). As mentioned before, respondents with a high level of screen time were considered hyper-connected. Among these hyper-connected children, results show the highest percentages of involvement in cyberbullying as victims (36.4% and 38.0%) and actors (38.3% and 43.0%), as well as in online grooming as victims (21.5% and 24.1%).

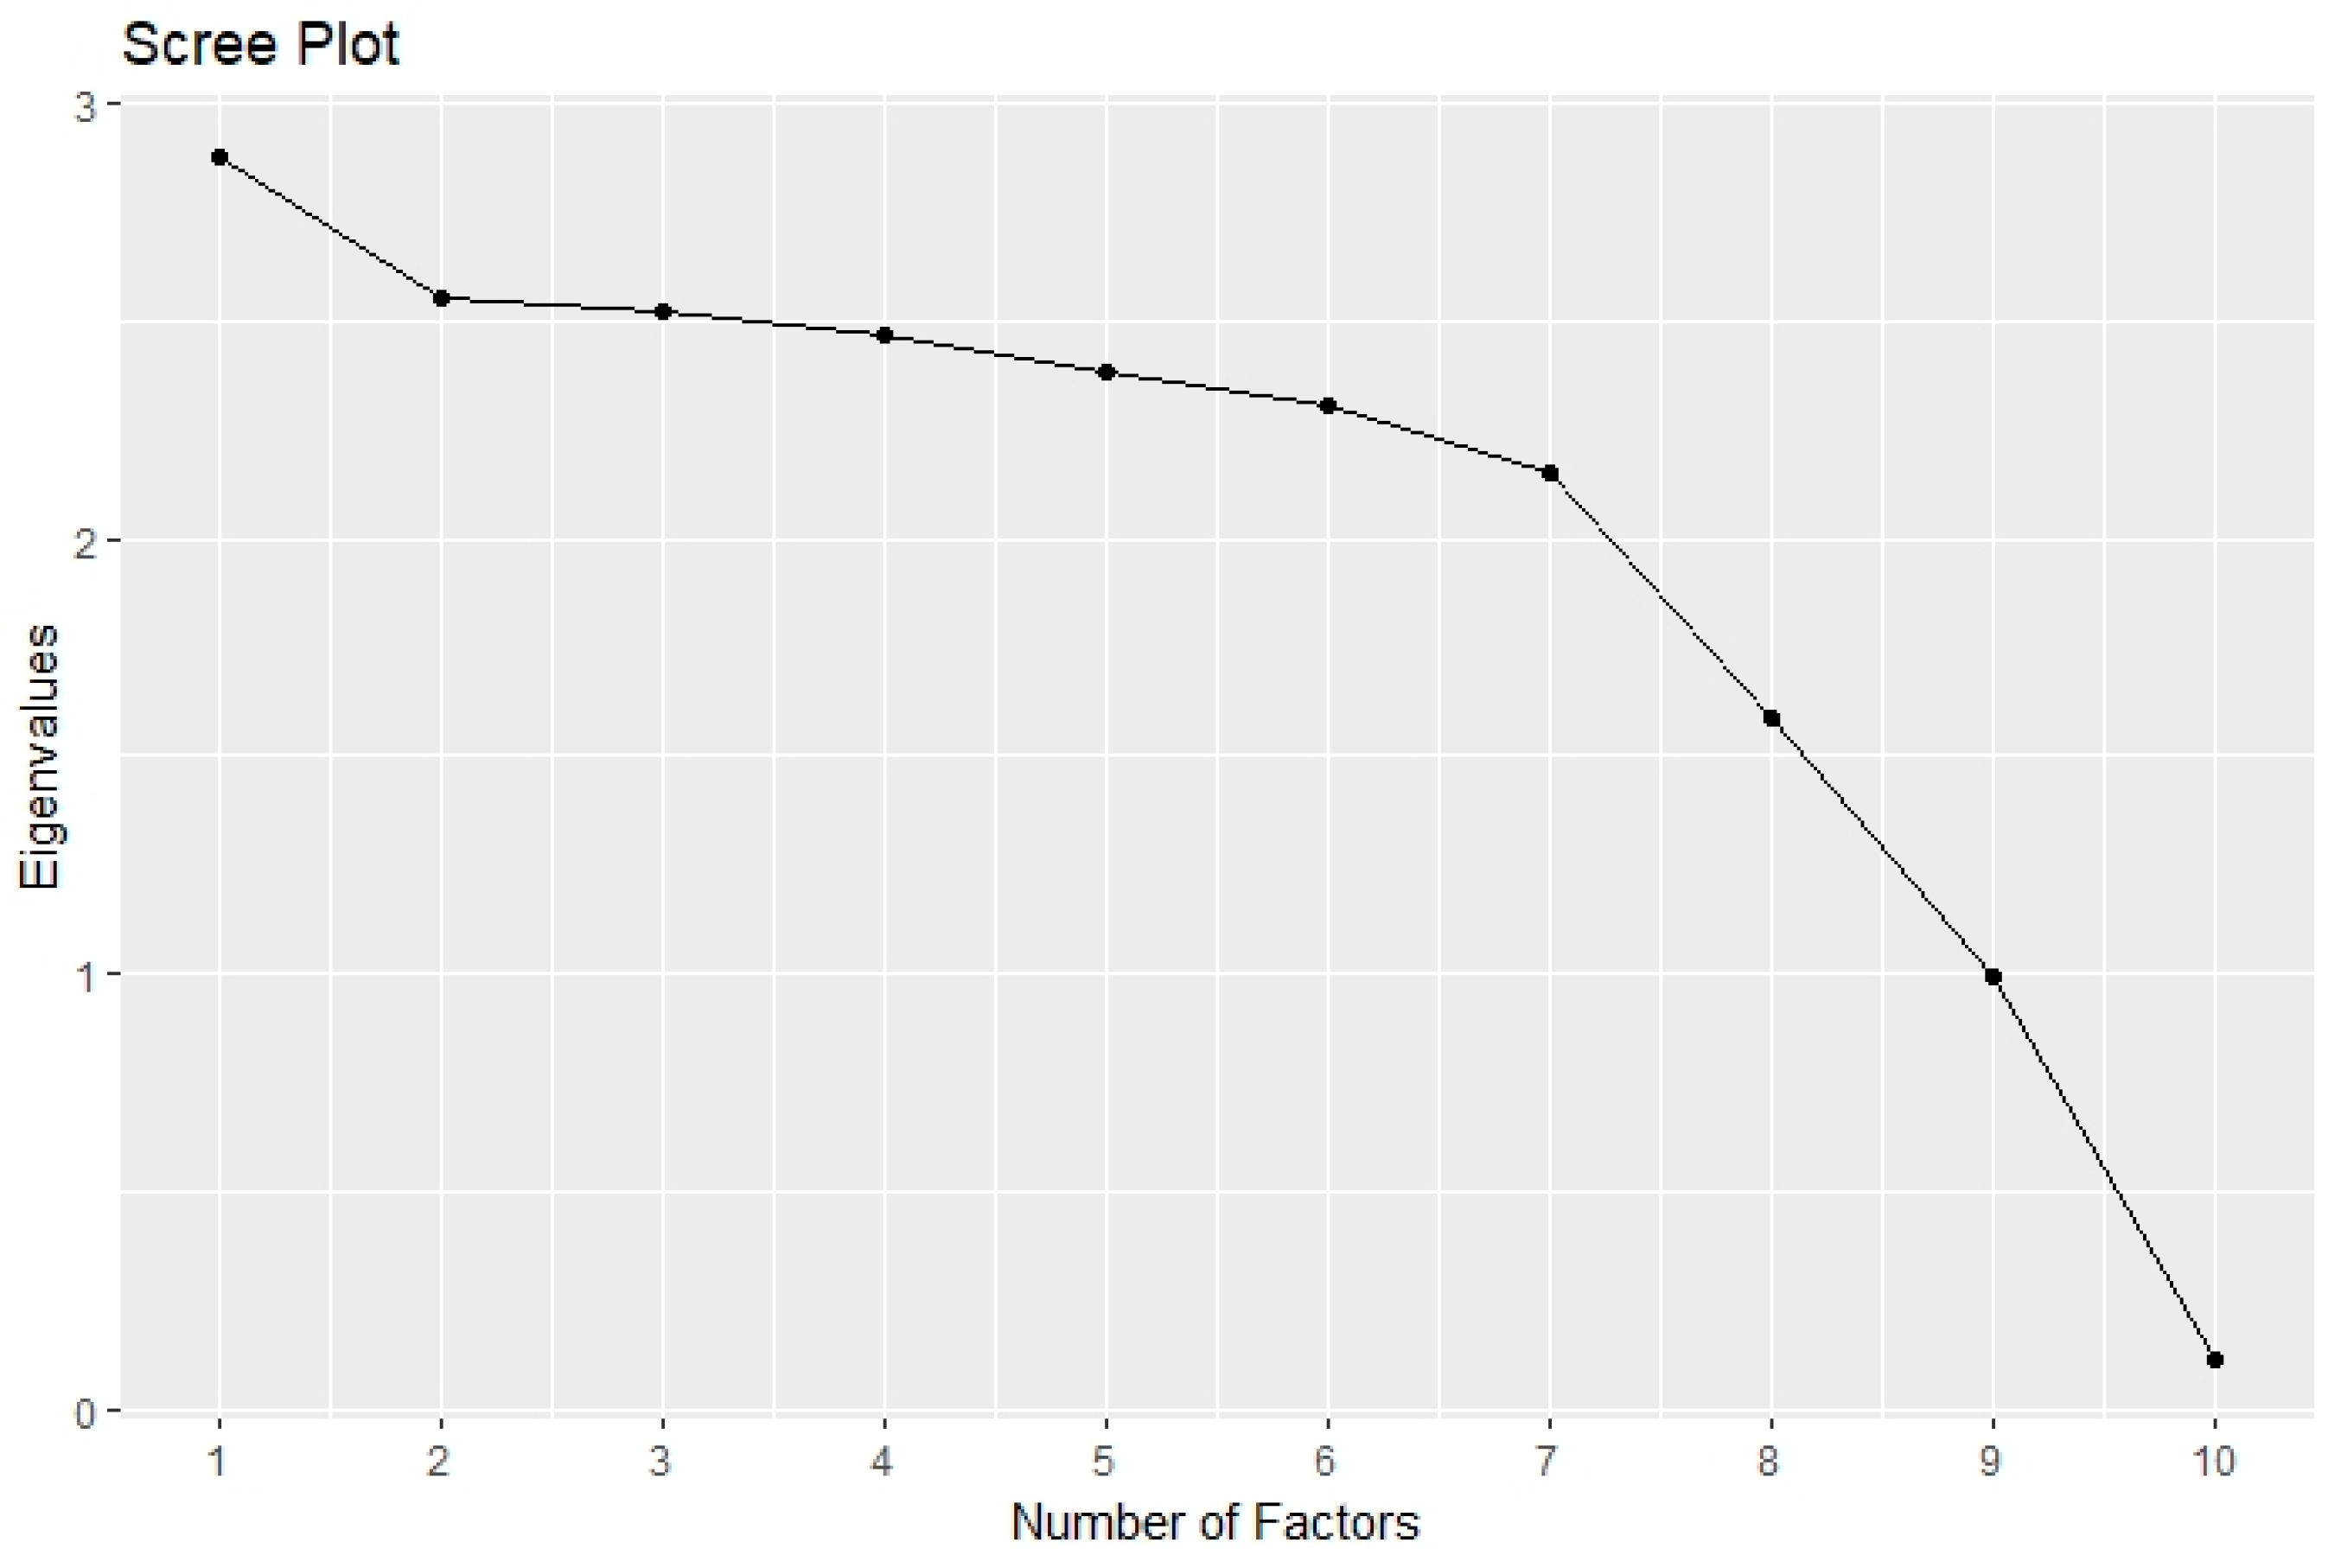
3.2. Factor Analysis

In this paragraph, the four factors obtained through the factor analysis will be described considering the contribution of each variable to each factor (Table 1). Furthermore, the mean scores of the factors will be analysed in relation to the following structural variables: sex, grade, district, parental education, parental employment status and parental citizenship. Lastly, the mean scores related to the following variables and indicators will also be analysed: parental supervision of videogames, parental supervision on social media and applications, phubbing behaviours, the enjoinment in attending school, peer interaction, discomfort associated with the impossibility of using digital devices, prosociality, violent videogames, sport practice and negative emotions.
Factor 1: Hyperconnection and online grooming victimisation. As mentioned in the methodology, to better understand to what extent each variable has contributed to the definition of this latent dimension, we have considered the factor loadings related to all the input variables (Table 1). In this case, those related to screen time on videogames and on social media and applications showed the highest scores, as well as the loadings related to the following three variables regarding online grooming victimisation: receiving photos or videos from adult strangers, sending photos or videos to adult strangers, and receiving a request for a face-to-face meeting from adult strangers. As Table 2 shows, the mean score of this first factor is 50.29 and higher scores were recorded among boys compared to girls and in older children. Looking at the other structural variables, the data show slightly higher scores among children with Italian parents, with a medium–low parental educational level and a medium–low parental employment status. Furthermore, the analysis of other relevant variables and indicators shows that the children most involved in this phenomenon are those with scarce parental supervision on their online activities, especially on those related to social media and applications; those who prefer violent videogames; those with a higher tendency to adopt phubbing behaviours and to argue with friends; those who do not enjoy attending school; those who would feel discomfort without the possibility of using digital devices for a week; those with low and medium levels of prosociality; and those with higher frequency in the perception of anger and sadness (Table 3). These results are in line with the analysis carried out by using the ANOVA model. For example, we realized that there is a statistically significant difference in average factor scores (p < 0.01) according to gender. In particular, on average, the factor score for males is 0.18 higher than the one for females. Moreover, a statistically significance difference in the average factor scores is due to the children’s ages. Indeed, on average, the factor score of the children in the 5th grade is 0.18 higher than the one for those in the 3rd grade (p < 0.05), and the factor score of children in the 4th grade is 0.13 higher than the one for younger children (p < 0.1).
Factor 2: Direct cyberbullying perpetration and victimisation and online grooming victimisation. Looking at the factor loadings of each input variable, we can highlight that those related to the cyberbullying direct actions of sharing photos or videos without consent, excluding someone from a group and insulting or teasing someone, are the highest, as well as the loadings related to the variable “being insulted or mocked” and “receiving gifts offers by adult strangers”. As Table 2 shows, the mean score of this second factor is 51.65 and higher scores were recorded among boys compared to girls. Looking at the other structural variables, the data show slightly higher scores among children with Italian parents, attending schools located in the 8th district, with a medium–low parental educational level and medium–low parental employment status. Furthermore, the analysis of the other relevant variables and indicators shows that children most involved in this phenomenon are those with no parental supervision on their online activities, especially on those related to social media and applications; those who prefer violent videogames; those with a higher tendency to adopt phubbing behaviours and to argue with friends; those who do not enjoy attending school; those who would feel discomfort if prevented from the use of digital devices for a week; and those with a low level of prosociality; and those with higher frequency in the perception of anger and anxiety (Table 3). These results are in line with the analysis carried out by using the ANOVA model. For example, there exist statistically significant differences according to gender and to the attitude of playing violent videogames. Notably, a statistically significant difference in the average factor scores (p < 0.05) according to gender is observed. In particular, on average, the factor score for males is 0.1 higher than the one for females. Moreover, the child who does not prefer violent videogames has on average a factor score 0.17 lower than the one for the children who prefer violent videogames (p < 0.01).
Factor 3: Indirect cyberbullying victimisation and perpetration and online grooming victimisation. In this case, the highest factor loadings are those related to the cyberbullying indirect action of social exclusion (both suffered and carried out), to the action of venting anger online, and also the one related to the online grooming variable of receiving compliments from adult strangers (Table 1). As Table 2 shows, the mean score of this third factor is 56.92 and higher scores are observed among boys compared to girls and among older respondents. Looking at the other structural variables, in this case, the data also show slightly higher scores among children attending schools located in the 8th district, with a medium–low parental educational level and a medium–low parental employment status, with no difference in relation to parental citizenship. Furthermore, the analysis of the other relevant variables and indicators shows that children most involved in this phenomenon are those with no parental supervision on their online activities, both in relation to videogames and to social media and applications; those who prefer violent videogames; those with a higher tendency to adopt phubbing behaviours and to argue with friends; those who do not enjoy attending school; those who would feel discomfort without the possibility of using digital devices for a week; those with a low level of prosociality; those who practice sport; and those with higher frequency in the perception of anger and loneliness (Table 3). These results are in line with the analysis carried out by using the ANOVA model. For example, a significant difference in the factor distribution is observed. Indeed, on average, children who always or often feel angry have a factor score 0.37 higher than those who do not or rarely feel angry (p < 0.01).
Factor 4: Cyberbullying perpetration. According to the factor loadings of each variable, this latent dimension mainly describes cyberbullying perpetration. Indeed, the highest scores are those related to the cyberbullying actions of insulting, teasing and threatening someone (Table 1). As Table 2 shows, the mean score of this fourth factor is 35.87 with little differences related to sex, age, parental citizenship and school district. Looking at the other structural variables, in this case, the data show slightly higher scores among children with a medium–low parental educational level and a medium–low parental employment status. Furthermore, the analysis of the other relevant variables and indicators shows that children most involved in this phenomenon are those with lower parental supervision on their online activities, both in relation to videogames and to social media and applications; those who prefer violent videogames; those with a higher tendency to adopt phubbing behaviours and to argue with friends; those with high levels of prosociality; those who do not enjoy attending school; those who would feel discomfort without the possibility of using digital devices for a week; and those who practice sport. In relation to the perception of negative emotions, higher scores were found with higher frequency in the perception of anger, and with lower frequency in the perception of fear and loneliness (Table 3). These results are in line with the analysis carried out by using the ANOVA model. For example, the factor score is on average 0.09 higher in children who often or always feel angry than in those who do not or rarely do (p < 0.05), while it is on average 0.14 lower in children who often or always feel alone than in those who do not (p < 0.01).

4. Discussion

The results of the bivariate analysis on cyberbullying revealed that both perpetration and victimisation are widespread among the respondents, involving, respectively, three and two out of ten children. However, this finding cannot be easily compared with official statistics, since, as we mentioned in the introduction paragraph, most of the quantitative studies assessing the prevalence rates of cyberbullying perpetration and victimisation have been carried out on middle and high school students. Furthermore, according to a recent review of studies with a representative population sample, due to the different measurement tools used, the prevalence of cyberbullying victimization and perpetration in the European Union ranged between 2.8 and 31.5% and between 3.0 and 30.6%, respectively [75]. Concerning online grooming, whose prevalence rate ranges between 9% and 19% [76], more than one out of ten children were involved in these episodes during the year prior to the survey without any significant difference between boys and girls. Indeed, if among adolescents the risk of involvement in this phenomenon is higher for girls [77,78], among children under the age of 13 this gender difference is less significant [50].
Regarding gender differences in cyberbullying involvement, the hypotheses were set due to the inconsistencies in the scientific literature about its influence on the phenomenon. As the results show, in cyberbullying perpetration, there are no relevant differences between girls and boys, while the prevalence rate of cyberbullying victimisation is higher among boys than among girls. In this regard, we hypothesise that boys were more likely to be victims since they were more exposed to the Internet, showing higher levels of screen time than girls, both on social media and applications and on videogames. In fact, looking at the results of the bivariate analysis, among hyperconnected children, the share of actors and victims of cyberbullying and of online grooming victims is considerably higher than among children with lower levels of screen time. This result is in line with the findings of several studies and our hypothesis (H2 and H3), which include the high level of technology exposure among the main risk factors for the involvement in cyberbullying and online grooming [7,8].
For this reason, we chose to use the screen time indicators, alongside the variables on cyberbullying and online grooming episodes, to carry out the factor analysis and detect the latent dimensions of these phenomena. The four factors obtained identify, respectively, four different dimensions, as follows: the dimension of hyperconnection and online grooming victimisation, the dimension of direct forms of cyberbullying (both suffered and perpetrated) and of online grooming victimisation, the dimension of indirect forms of cyberbullying (both suffered and perpetrated) and of online grooming victimisation, and the dimension of cyberbullying perpetration.
The analysis of the factor scores by subgroups shows that most of the hypotheses, which were formulated starting from the findings in the scientific literature, have been validated (H1, H2 and H3). Indeed, there are recurrent characteristics that are transversal to the four factors, suggesting that cyberbullying victimisation and perpetration and online grooming victimisation have common traits. Thus, higher scores were recorded among older children (H1) with low levels of parental education and low parental employment status, as well as among respondents with scarce parental supervision of their online activities. Furthermore, the risk of involvement increases among children with a higher tendency to adopt phubbing behaviours and to argue with friends, among respondents who do not enjoy attending school and who would feel discomfort with the impossibility of using digital devices for a week, and among children with low levels of prosociality (except for the fourth factor where children involved showed a high level of prosociality).
Moreover, as was hypothesised (H4), sport practice is not a predictor of children’s involvement in these phenomena. This result confirms the findings of other studies that we have carried out in recent years, which shows that the idea that playing sport is always a protective factor for youth behaviours is a stereotype.
However, the hypothesis that a disadvantaged socio-economic context was a predictor for greater involvement in both cyberbullying and online grooming, which was part of the H2 and H3 hypotheses, has been falsified. In fact, the results show that the differences between the 8th and 6th districts, which are, respectively, an urban and a suburban area of Rome, are quite inconsistent. In this regard, there are some studies on the relationships between bullying and cyberbullying prevalence and the kind of geographical areas reporting higher rates of cyberbullying in urban areas and higher rates of bullying in suburban areas [79,80,81,82]. These different trends are usually attributed to the greater availability of digital devices and Internet access in urban areas. However, in our study, we did not find significant variations among children of the two districts in terms of screen time and availability of digital devices. To better understand these trends, further studies carried out on representative samples are needed.
Finally, as we hypothesised (H2 and H3), the emotional discomfort of children was also a predictor of involvement in these phenomena. Furthermore, the negative emotion perceived turned out to be the discriminating characteristic among the different dimensions identified with the factor analysis. In fact, the high frequency of anger was a common trait among all the factors; however, the dimension of cyberbullying perpetration, detected by the fourth factor, was characterised by low levels of loneliness and fear, in contrast with the other factors that identify simultaneously the dimensions of perpetration and victimisation. In this sense, it can be hypothesised that these children could have a leading role within their group of peers associated with aggressive behaviours that reinforce their need for control and domain.

5. Conclusions

The main contribution of the present study to the scientific literature is inherent to its quantitative and statistically representative nature—at a local level. Attitudes and behaviours of children are often analysed through qualitative tools and among small groups. Indeed, research using representative samples of this age group can give rise not only to high levels of complexity due to the young age of the respondents but also to the sensitivity of the topics of cyberbullying and online grooming, which is of utmost importance today. In our case, the methodologies and materials adopted, as well as the operationalisation phase, were crucial elements for the success of the study.
The complex research design involved an intense scouting activity with the primary schools, which was aimed at raising awareness about the importance of the research objectives. Although the research was carried out during the pandemic, facing strong restrictions to face-to-face contacts, the effectiveness of the scouting phase allowed the survey to be conducted within the classrooms and in the presence of two researchers, including the project coordinator, in order to guarantee the highest reliability of the collected data.
The need to measure and monitor the behaviour of primary school children through the quantitative method can no longer be postponed. The phenomenon of relational deviance concerns children more and more at a young age, and is amplified during growth. This is especially true looking at the problems that feed on the Internet, whose consumption, as demonstrated, increases with age. Furthermore, the physical distancing that occurred because of the spread of COVID-19 increased screen time, and therefore hyperconnection, intensifying the spread of the phenomena analysed by this study. The sudden growth in Internet use has also found both educators and families unprepared, especially in terms of knowledge of the control tools that can protect kids online.
The results of this study show a great prevalence of cyberbullying among children, especially among respondents with a high level of screen time. For this reason, it is important to monitor the trend towards social isolation and the use of cyberspace as the only means to interact with other people.
Furthermore, it is important to mention one of the distinctive elements of cyberbullying, which is the dual category of actor–victim. As the results of the factor analysis show, the dimensions of perpetration and victimisation often coexist in the same subjects, representing a further element of complexity in the recognition of the phenomenon by educators and parents.
Concerning online grooming victimisation, the relationship with the virtual world is highly dangerous, especially for children who do not have parental supervision on their online activities. In this case, the time spent in front of a screen, both on videogames and social media and applications, is the main predictor for the involvement of kids in online grooming.
These results confirm the need for further studies on this age group, and also for shared research tools and reliable indicators. This could be crucial to overcome the information gap on childhood behaviours, as well as to allow the standardisation of epistemological and methodological approaches. Only in this way will it be possible to clarify many of the current scientific controversies on the topics investigated and to produce reliable information based on representative samples. Although this study does not allow statistical inferences at a national level, due to the territoriality nature of the research on which it is based, the results are very helpful to deepen the knowledge of the phenomena’s trends, encouraging new research with wider samples. In this regard, to validate the results of the present study and to find other predictive factors, it will be important to investigate the following dimensions: the tendency to social isolation and the increasing transposition of social interaction to the virtual world, the effects of the exposure to violent video games and multimedia contents, the frequency and intensity of negative primary emotions, and the influence of the social context on the youth behaviours. The outcome of this study, however, suggests that it is necessary to devote the utmost attention to the problem of cyberbullying and online grooming spread, reinforcing the cooperation among schools, parents and caregivers in encouraging children to use digital devices in a safer way.

Author Contributions

L.C., G.C. and A.T. conceived and designed the study, consulted literature, collected data and wrote and edit the paper. L.C., I.B. and D.D.R. did the statistical data analysis. L.C. and is the last author, i.e., the group leader in this research, G.C. and A.T. did the sociological interpretation, A.T. is also the first author in this paper, I.B. and D.D.R. contributed to the methodological paragraphs and results. All authors have read and agreed to the published version of the manuscript.

Funding

This research received no external funding.

Institutional Review Board Statement

The study was approved by the Research Ethics and Integrity Committee of the Italian National Research Council (approval date: 22 July 2021).

Informed Consent Statement

Informed consent was obtained from all subjects involved in the survey.

Data Availability Statement

Data of this study are not available because of the co-property with the Italian Presidency of the Council of Ministers.

Conflicts of Interest

The authors declare no conflict of interest.

Note

1
The city of Rome is divided into fifteen districts, which are called municipi. Each of these districts has different territorial extensions and population densities. The two selected areas represent, respectively, 9% and 5% of the resident population of Rome. The 6th and 8th districts are characterised by similar population densities (between 2000 and 3000 inhabitants per km2) and heterogenous demographic and economic profiles. Together they have almost 400,000 inhabitants, which is equivalent to the population of a large city.

References

  1. Istituto Nazionale di Statistica. Rapporto BES 2021, Il Benessere Equo e Sostenibile in Italia; Istat: Rome, Italy, 2022.
  2. OECD. Combatting COVID-19’s Effect on Children, OECD Policy Responses to Coronavirus (COVID-19); OECD Publishing: Paris, France, 2020. [Google Scholar] [CrossRef]
  3. Barlett, C.P.; Simmers, M.M.; Roth, B.; Gentile, D. Comparing cyberbullying prevalence and process before and during the COVID-19 pandemic. J. Soc. Psychol. 2021, 161, 408–418. [Google Scholar] [CrossRef] [PubMed]
  4. Lobe, B.; Velicu, A.; Staksrud, E.; Chaudron, S.; Di Gioia, R. How Children (10–18) Experienced Online Risks during the COVID-19 Lockdown—Spring 2020; EUR 30584 EN; Publications Office of the European Union: Luxembourg, 2021; ISBN 978-92-76-29763-5/978-92-76-29762-8. [Google Scholar] [CrossRef]
  5. Mkhize, S.; Gopal, N. Cyberbullying perpetration: Children and youth at risk of victimization during Covid-19 lockdown. Int. J. Criminol. Sociol. 2021, 10, 525–537. [Google Scholar] [CrossRef]
  6. Tintori, A.; Ciancimino, G.; Giovanelli, G.; Cerbara, L. Bullying and Cyberbullying among Italian Adolescents: The Influence of Psychosocial Factors on Violent Behaviours. Int. J. Environ. Res. Public Health 2021, 18, 1558. [Google Scholar] [CrossRef] [PubMed]
  7. Ansary, N.S. Cyberbullying: Concepts, theories, and correlates informing evidence-based best practices for prevention. Aggress. Violent Behav. 2020, 50, 101343. [Google Scholar] [CrossRef]
  8. Kowalski, R.M.; Limber, S.P.; McCord, A. A developmental approach to cyberbullying: Prevalence and protective factors. Aggress. Violent Behav. 2019, 45, 20–32. [Google Scholar] [CrossRef]
  9. Yang, B.; Wang, B.; Sun, N.; Xu, F.; Wang, L.; Chen, J.; Sun, C. The consequences of cyberbullying and traditional bullying victimization among adolescents: Gender differences in psychological symptoms, self-harm and suicidality. Psychiatry Res. 2021, 306, 114219. [Google Scholar] [CrossRef] [PubMed]
  10. Perwitasari, D.R.; Wuryaningsih, E.W. Why did You do that to Me?: A Systematic Review of Cyberbullying Impact on Mental Health and Suicide Among Adolescents. NurseLine J. 2022, 7, 35–47. [Google Scholar] [CrossRef]
  11. Olweus, D.; Limber, S. Some problems with cyberbullying research. Curr. Opin. Psychol. 2018, 19, 139–143. [Google Scholar] [CrossRef] [PubMed]
  12. Vaillancourt, T.; Faris, R.; Mishna, F. Cyberbullying in children and youth: Implications for health and clinical practice. Canadian J. Psychiatry 2017, 62, 368–373. [Google Scholar] [CrossRef] [PubMed]
  13. Olweus, D. Bullying at School: What We Know and What We Can Do; Blackwell: Oxford, UK, 1993; p. 48. [Google Scholar]
  14. Salmivalli, C.; Lagerspetz, K.; Björkqvist, K.; Österman, K.; Kaukiainen, A. Bullying as a group process: Participant roles and their relations to social status within the group. Aggress. Behav. 1996, 22, 1–15. [Google Scholar] [CrossRef]
  15. Peter, I.-K.; Petermann, F. Cyberbullying: A concept analysis of defining attributes and additional influencing factors. Comput. Hum. Behav. 2018, 86, 350–366. [Google Scholar] [CrossRef]
  16. Wong, R.Y.; Cheung, C.M.; Xiao, B. Does gender matter in cyberbullying perpetration? An empirical investigation. Comput. Hum. Behav. 2018, 79, 247–257. [Google Scholar] [CrossRef]
  17. Pereira Neto, A.; Barbosa, L. Bullying and Cyberbullying: Conceptual Controversy in Brazil. In The Internet and Health in Brazil; Springer: Berlin, Germany, 2019; pp. 225–249. [Google Scholar]
  18. Estévez, E.; Cañas, E.; Estévez, J.F.; Povedano, A. Continuity and Overlap of Roles in Victims and Aggressors of Bullying and Cyberbullying in Adolescence: A Systematic Review. Int. J. Environ. Res. Public Health 2020, 17, 7452. [Google Scholar] [CrossRef]
  19. Mishna, F.; Khoury-Kassabri, M.; Gadalla, T.; Daciuk, J. Risk factors for involvement in cyber bullying: Victims, bullies and bully–victims. Child. Youth Serv. Rev. 2012, 34, 63–70. [Google Scholar] [CrossRef]
  20. Bayraktar, F.; Machackova, H.; Dedkova, L.; Cerna, A.; Ševčíková, A. Cyberbullying: The Discriminant Factors Among Cyberbullies, Cybervictims, and Cyberbully-Victims in a Czech Adolescent Sample. J. Interpers. Violence 2015, 30, 3192–3216. [Google Scholar] [CrossRef] [PubMed]
  21. UNICEF. Safer Internet Day: Un Adolescente su tre Vittima Di Cyberbullismo; UNICEF: New York, NY, USA, 2020. [Google Scholar]
  22. Liu, C.; Liu, Z.; Yuan, G. The longitudinal influence of cyberbullying victimization on depression and posttraumatic stress symptoms: The mediation role of rumination. Arch. Psychiatr. Nurs. 2020, 34, 206–210. [Google Scholar] [CrossRef]
  23. González-Cabrera, J.; León-Mejía, A.; Beranuy, M.; Gutiérrez-Ortega, M.; Álvarez-Bardón, A.; Machimbarrena, J.M. Relationship between cyberbullying and health-related quality of life in a sample of children and adolescents. Qual. Life Res. 2018, 27, 2609–2618. [Google Scholar] [CrossRef] [PubMed]
  24. Hinduja, S.; Patchin, J.W. Bullying, cyberbullying, and suicide. Arch. Suicide Res. 2010, 14, 206–221. [Google Scholar] [CrossRef] [PubMed]
  25. Kowalski, R.M.; Limber, S.P. Psychological, physical, and academic correlates of cyberbullying and traditional bullying. J. Adolesc. Health 2013, 53, S13–S20. [Google Scholar] [CrossRef] [Green Version]
  26. Van Geel, M.; Vedder, P.; Tanilon, J. Relationship between peer victimization, cyberbullying, and suicide in children and adolescents: A meta-analysis. JAMA Pediatr. 2014, 168, 435–442. [Google Scholar] [CrossRef] [Green Version]
  27. Bonanno, R.A.; Hymel, S. Cyber bullying and internalizing difficulties: Above and beyond the impact of traditional forms of bullying. J. Youth Adolesc. 2013, 42, 685–697. [Google Scholar] [CrossRef] [PubMed]
  28. Bronfenbrenner, U. Ecology of Human Development: Experiments by Nature and Design; Harvard University Press: Cambridge, MA, USA, 1979. [Google Scholar]
  29. Swearer, S.M.; Hymel, S. Understanding the psychology of bullying: Moving toward a social-ecological diathesis-stress model. Am. Psychol. 2015, 70, 344–353. [Google Scholar] [CrossRef] [Green Version]
  30. Nixon, C.L. Current perspectives: The impact of cyberbullying on adolescent health. Adolesc. Health Med. Ther. 2014, 5, 143. [Google Scholar] [CrossRef] [PubMed] [Green Version]
  31. Uusitalo-Malmivaara, L.; Lehto, J.E. Happiness and depression in the traditionally bullied and cyberbullied 12-year-old. Open Rev. Educ. Res. 2016, 3, 35–51. [Google Scholar] [CrossRef]
  32. Devine, P.; Lloyd, K. Internet use and psychological well-being among 10-year-old and 11-year-old children. Child Care Pract. 2012, 18, 5–22. [Google Scholar] [CrossRef]
  33. Ruiz, R.O.; del Rey Alamillo, R.; Bolaños, J.A.C.; Almanzor, C.V.; Ortiz, O.G.; Alcaide, F.C.; Zych, I.; Fernández, C.M.G.; González, R.L. Bullying, Cyberbullying y Dating Violence. Estudio de la Gestión de la Vida Social Estudiantes de Primaria y Secundaria en Andalucía; Colección Actualidad, 75; Centro de Estudios Andaluces: Sevilla, Spain, 2017. [Google Scholar]
  34. Fanti, K.A.; Demetriou, A.G.; Hawa, V.V. A longitudinal study of cyberbullying: Examining risk and protective factors. Eur. J. Dev. Psychol. 2012, 9, 168–181. [Google Scholar] [CrossRef]
  35. Wong, D.S.W.; Chan, H.C.O.; Cheng, C.H.K. Cyberbullying perpetration and victimization among adolescents in Hong Kong. Child. Youth Serv. Rev. 2014, 36, 133–140. [Google Scholar] [CrossRef]
  36. Carvalho, M.; Branquinho, C.; de Matos, M.G. Cyberbullying and Bullying: Impact on Psychological Symptoms and Well-Being. Child Indic. Res. 2021, 14, 435–452. [Google Scholar] [CrossRef]
  37. Sun, S.; Fan, X.; Du, J. Cyberbullying perpetration: A meta-analysis of gender differences. Int. J. Internet Sci. 2016, 11, 61–81. [Google Scholar]
  38. Wong, R.Y.M.; Cheung, C.; Xiao, B.S.; Chan, T.K. The instigating, impelling, and inhibiting forces in cyberbullying perpetration across gender. In Proceedings of the PACIS, Singapore, 5–7 July 2015. [Google Scholar]
  39. Navarro, R. Gender Issues and Cyberbullying in Children and Adolescents: From Gender Differences to Gender Identity Measures. In Cyberbullying across the Globe; Navarro, R., Yubero, S., Larrañaga, E., Eds.; Springer: Cham, Switzerland, 2016. [Google Scholar]
  40. Merrill, R.M.; Hanson, C.L. Risk and protective factors associated with being bullied on school property compared with cyberbullied. BMC Public Health 2016, 16, 145. [Google Scholar] [CrossRef] [Green Version]
  41. Benítez-Sillero, J.d.D.; Armada Crespo, J.M.; Ruiz Córdoba, E.; Raya-González, J. Relationship between Amount, Type, Enjoyment of Physical Activity and Physical Education Performance with Cyberbullying in Adolescents. Int. J. Environ. Res. Public Health 2021, 18, 2038. [Google Scholar] [CrossRef] [PubMed]
  42. Medina, J.A.; Reverte, M.J. Incidence of the practice of physical and sporting activities as a regulator of school violence. Retos 2019, 35, 54–60. [Google Scholar]
  43. Corral-Pernía, J.A.; Chacón-Borrego, F.; Fernández Gavira, J.; Del Rey, R. Bullying and cyberbullying according to moderate vigorous physical activity (MVPA) in Secondary School’s Students. Rev. Psicol. Deporte 2018, 27, 70–75. [Google Scholar]
  44. Tintori, A.; Ciancimino, G.; Vismara, A.; Cerbara, L. Sports as education: Is this a stereotype too? A national research on the relationship between sports practice, bullying, racism and stereotypes among Italian students. Cogent Educ. 2021, 8, 1. [Google Scholar] [CrossRef]
  45. Teng, Z.; Nie, Q.; Zhu, Z.; Guo, C. Violent video game exposure and (Cyber) bullying perpetration among Chinese youth: The moderating role of trait aggression and moral identity. Comput. Hum. Behav. 2020, 104, 106193. [Google Scholar] [CrossRef]
  46. Lam, L.T.; Cheng, Z.; Liu, X. Violent online games exposure and cyberbullying/victimization among adolescents. Cyberpsychol. Behav. Soc. Netw. 2013, 16, 159–165. [Google Scholar] [CrossRef] [PubMed]
  47. Dittrick, C.J.; Beran, T.N.; Mishna, F.; Hetherington, R.; Shariff, S. Do Children Who Bully Their Peers Also Play Violent Video Games? A Canadian National Study. J. Sch. Violence 2013, 12, 297–318. [Google Scholar] [CrossRef]
  48. Ferguson, C.J.; Colwell, J. A meaner, more callous digital world for youth? The relationship between violent digital games, motivation, bullying, and civic behavior among children. Psychol. Pop. Media Cult. 2018, 7, 202–215. [Google Scholar] [CrossRef]
  49. Zych, I.; Farrington, D.P.; Ttofi, M.M. Protective factors against bullying and cyberbullying: A systematic review of meta-analyses. Aggress. Violent Behav. 2019, 45, 4–19. [Google Scholar] [CrossRef]
  50. C.N.C.P.O. L’abuso sessuale online a danno dei minori, Servizio Polizia Postale e delle Comunicazioni & Save the Children—Il Dossier; C.N.C.P.O.: San Martino Valle Caudina, Italy, 2022. [Google Scholar]
  51. Salter, A. Trasforming Trauma; SAGE Publications: Thousand Oaks, CA, USA, 1995; pp. 74–80. [Google Scholar]
  52. Calvete, E.; Cortazar, N.; Fernández-González, L.; Echezarraga, A.; Beranuy, M.; León, A.; González-Cabrera, J.; Orue, I. Effects of a brief preventive intervention in cyberbullying and grooming in adolescents. Psychosoc. Interv. 2021, 30, 75–84. [Google Scholar] [CrossRef]
  53. Berliner, L. The concept of grooming and how it can help victims. J. Interpers. Violence 2018, 33, 24–27. [Google Scholar] [CrossRef]
  54. Pasca, P.; Signore, F.; Tralci, C.; Del Gottardo, D.; Longo, M.; Preite, G.; Ciavolino, E. Detecting online grooming at its earliest stages: Development and validation of the Online Grooming Risk Scale. Mediterr. J. Clin. Psychol. 2022, 10, 24. [Google Scholar]
  55. Schoeps, K.; Peris Hernández, M.; Garaigordobil, M.; Montoya Castilla, I. Risk factors for being avictim of online grooming in adolescents. Psicothema 2020, 4, 454–464. [Google Scholar]
  56. Livingstone, S.; Helsper, E.J. Parental mediation of children’s Internet use. J. Broadcast. Electron. Media 2008, 52, 581–599. [Google Scholar] [CrossRef] [Green Version]
  57. Valcke, M.; Bonte, S.; De Wever, B.; Rots, I. Internet parenting styles and the impact on Internetuse of primary school children. Comput. Educ. 2010, 55, 454–464. [Google Scholar] [CrossRef]
  58. Machimbarrena, J.M.; Garaigordobil, M. Prevalence of Bullying and Cyberbullying in the Last Stage of Primary Education in the Basque Country. Span. J. Psychol. 2018, 21, E48. [Google Scholar] [CrossRef] [Green Version]
  59. Calvete, E.; Fernández-González, L.; Cabrera, J.M.G.; Gámez-Guadix, M. Continued Bullying Victimization in Adolescents: Maladaptive Schemas as a Mediational Mechanism. J. Youth Adolesc. 2018, 47, 650–660. [Google Scholar] [CrossRef]
  60. Ladd, G.W.; Ettekal, I.; Kochenderfer-Ladd, B. Peer victimization trajectories from kindergarten through high school: Differential pathways for children’s school engagement and achievement? J. Educ. Psychol. 2017, 109, 826–841. [Google Scholar] [CrossRef]
  61. Celata, F.; Lucciarini, S. Atlante Delle Disuguaglianze a ROMA; Camera di Commercio Industria Artigianato e Agricoltura di Roma: Roma, Italy, 2016. [Google Scholar] [CrossRef]
  62. Chotpitayasunondh, V.; Douglas, K.M. How “phubbing” becomes the norm: The antecedents and consequences of snubbing via smartphone. Comput. Hum. Behav. 2016, 63, 9–18. [Google Scholar] [CrossRef] [Green Version]
  63. Caprara, G.V.; Pastorelli, C. Early emotional instability, prosocial behaviour, and aggression: Some methodological aspects. Eur. J. Personal. 1993, 7, 19–36. [Google Scholar] [CrossRef]
  64. IBM SPSS Statistics. Available online: https://www.ibm.com/it-it/products/spss-statistics (accessed on 12 October 2022).
  65. The R Project for Statistical Computing. Available online: https://www.r-project.org/ (accessed on 12 October 2022).
  66. RDocumentation Mice: Multivariate Imputation by Chained Equations. Available online: https://www.rdocumentation.org/packages/mice/versions/3.14.0/topics/mice (accessed on 12 October 2022).
  67. Van Buuren, S.; Groothuis-Oudshoorn, K. mice: Multivariate Imputation by Chained Equations in R. J. Stat. Softw. 2011, 45, 1–67. [Google Scholar] [CrossRef] [Green Version]
  68. Mera-Gaona, M.; Neumann, U.; Vargas-Canas, R.; López, D.M. Evaluating the impact of multivariate imputation by MICE in feature selection. PLoS ONE 2021, 16, e0254720. [Google Scholar] [CrossRef] [PubMed]
  69. RDocumentation hetcor: Heterogeneous Correlation Matrix. Available online: https://www.rdocumentation.org/packages/polycor/versions/0.8-1/topics/hetcor (accessed on 14 October 2022).
  70. Drasgow, F. Polychoric and polyserial correlations. In The Encyclopedia of Statistics; John Wiley & Sons: New York, NY, USA, 1986; Volume 7, pp. 68–74. [Google Scholar]
  71. RDocumentation KMO: Find the Kaiser, Meyer, Olkin Measure of Sampling Adequacy. Available online: https://www.rdocumentation.org/packages/psych/versions/2.1.6/topics/KMO (accessed on 21 October 2022).
  72. RDocumentation Cortest. bartlett: Bartlett’s Test That a Correlation Matrix is an Identity Matrix. Available online: https://www.rdocumentation.org/packages/psych/versions/2.2.5/topics/cortest.bartlett (accessed on 27 October 2022).
  73. Kaiser, H.F. An index of factorial simplicity. Psychometrika 1974, 39, 31–36. [Google Scholar] [CrossRef]
  74. RDocumentation Factanal: Factor Analysis. Available online: https://www.rdocumentation.org/packages/stats/versions/3.6.2/topics/factanal (accessed on 28 October 2022).
  75. Henares-Montiel, J.; Benítez-Hidalgo, V.; Ruiz-Pérez, I.; Pastor-Moreno, G.; Rodríguez-Barranco, M. Cyberbullying and Associated Factors in Member Countries of the European Union: A Systematic Review and Meta-Analysis of Studies with Representative Population Samples. Int. J. Environ. Res. Public Health 2022, 19, 7364. [Google Scholar] [CrossRef]
  76. Gandolfi, C.E.; Mosillo, M.; Del Castillo, G.; Forni, G.; Pietronigro, A.; Tiwana, N.; Pellai, A. Online grooming: An analysis of the phenomenon. J. Prev. Med. Hyg. 2019, 60, E220. [Google Scholar] [CrossRef]
  77. Whittle, H.; Hamilton-Giachritsis, C.; Beech, A.; Collings, G. A review of young people’s vulnerabilities to online grooming. Aggress. Violent Behav. 2013, 18, 135–146. [Google Scholar] [CrossRef] [Green Version]
  78. Machimbarrena, J.M.; Calvete, E.; Fernández-González, L.; Álvarez-Bardón, A.; Álvarez-Fernández, L.; González-Cabrera, J. Internet Risks: An Overview of Victimization in Cyberbullying, Cyber Dating Abuse, Sexting, Online Grooming and Problematic Internet Use. Int. J. Environ. Res. Public Health 2018, 15, 2471. [Google Scholar] [CrossRef] [Green Version]
  79. Zhu, C.; Huang, S.; Evans, R.; Zhang, W. Cyberbullying Among Adolescents and Children: A Comprehensive Review of the Global Situation, Risk Factors, and Preventive Measures. Front. Public Health 2021, 9, 634909. [Google Scholar] [CrossRef]
  80. McQuillan, B.E. Ecological Factors Associated with Middle School Students’ Experiences of Cyberbullying. Ph.D. Dissertation, University of Rochester, Rochester, NY, USA, 2016. Available online: https://search.proquest.com/pqdtglobal/docview/1794167537/abstract/9D85437600564444PQ/4 (accessed on 12 December 2022).
  81. Bernik, I.; Prislan, K.; Mihelič, A. Country Life in the Digital Era: Comparison of Technology Use and Cybercrime Victimization between Residents of Rural and Urban Environments in Slovenia. Sustainability 2022, 14, 14487. [Google Scholar] [CrossRef]
  82. Tippett, N.; Wolke, D. Socioeconomic status and bullying: A meta-analysis. Am. J. Public Health 2014, 104, e48–e59. [Google Scholar] [CrossRef]
Figure 1. Scree plot.
Societies 13 00047 g001
Figure 2. Prevalence rates of cyberbullying perpetration and victimisation and online grooming victimisation by sex.
Societies 13 00047 g002
Table 1. Factor loadings for input variables.
Factor 1Factor 2Factor 3Factor 4
Venting anger online−0.061−0.0610.8620.163
Excluding someone from a group0.1930.5480.6710.12
Teasing someone0.4040.4760.3160.568
Insulting someone−0.0630.3590.3240.83
Sharing photos or videos of other people without their consent0.290.770.1550.05
Threatening someone−0.3760.5170.4480.534
Inciting someone to injure him/herself−0.160.0250.077−0.099
Receiving gifts offered by adult strangers−0.5340.5060.3490.173
Receiving compliments from adult strangers0.2910.0380.6640.24
Receiving requests for face-to-face meetings from adult strangers0.8870.1030.0420.434
Sending photos or videos to adult strangers0.8670.150.208−0.278
Receiving questions about your clothing from adult strangers−0.169−0.9440.1410.101
Receiving photos or videos from adult strangers0.810.146−0.2210.046
Being incited to injure yourselves−0.160.0250.077−0.099
Being insulted or mocked0.3310.5890.342−0.062
Being threatened−0.0110.3190.28−0.885
Being excluded from a group0.2770.0060.487−0.153
Being victim of the sharing of personal photos or videos without consent−0.1270.039−0.199−0.524
Screen time on videogames0.4940.0390.150.038
Screen time on social media and applications0.6570.2880.1260.088
Table 2. Factors’ mean scores for structural variables.
Factor 1Factor 2Factor 3Factor 4
Mean50.2951.6556.9235.87
SexMale51.1952.2157.5635.88
Female49.2551.0256.1735.85
GradeIII49.2350.6756.3735.42
IV50.6652.2256.9235.82
V51.0752.1857.5036.40
District6th 50.1851.3556.4336.06
8th50.3851.9357.3535.70
Parental educationMedium–low51.1252.3557.4536.45
Medium–high49.0450.6755.7635.06
Parental employment statusMedium–low51.0852.2557.0836.53
Medium–high49.3150.9456.3134.85
Parental citizenshipItalian50.3751.7056.7035.79
Foreign49.5251.2556.9936.32
Table 3. Factors’ mean scores for individual and environmental variables.
Factor 1Factor 2Factor 3Factor 4
Mean50.2951.6556.9235.87
Parental supervision on videogamesYes50.2951.4956.7035.57
Not51.4352.5358.1936.87
Parental supervision on social and appsYes50.7351.7557.0336.05
Not53.0253.8459.8937.03
Phubbing behavioursLow frequency49.1951.1356.2535.38
High frequency52.4852.6658.2536.52
Enjoinment in attending schoolPositive49.5550.9656.2435.43
Negative53.1854.4059.4237.48
Peer interactionPositive50.0451.2856.5935.48
Negative52.1654.0059.1438.20
Discomfort caused by the absence of digital devicesYes52.0352.7558.2937.01
Not48.9150.6355.6934.70
ProsocialityLow50.9053.8658.4935.30
Medium50.8551.6257.0335.73
High49.5850.9056.2536.20
Violent videogamesYes52.9453.4259.1937.13
Not49.6351.2256.3535.56
Sport practiceYes50.3251.7557.2036.17
Not50.6351.5256.0334.85
AngerLow frequency49.5551.0356.1735.45
High frequency53.9054.6160.3637.73
SadnessLow frequency49.9551.5956.8335.70
High frequency51.7852.1157.4136.36
LonelinessLow frequency50.2351.5856.7936.38
High frequency51.0452.1457.8232.92
FearLow frequency50.4251.6456.9836.08
High frequency50.1251.8956.8234.49
AnxietyLow frequency50.3351.4156.7635.91
High frequency50.3452.4157.4335.98
Disclaimer/Publisher’s Note: The statements, opinions and data contained in all publications are solely those of the individual author(s) and contributor(s) and not of MDPI and/or the editor(s). MDPI and/or the editor(s) disclaim responsibility for any injury to people or property resulting from any ideas, methods, instructions or products referred to in the content.

