
Determination of a CrossFit® Benchmark Performance Profile


Abstract
:1. Introduction
2. Materials and Methods
2.1. Participants
2.2. Measures
2.3. Procedure
2.4. Statistical Analysis
3. Results
4. Discussion
5. Conclusions
Author Contributions
Funding
Institutional Review Board Statement
Informed Consent Statement
Conflicts of Interest
References
- CrossFit. Finding the Fittest on Earth. In CrossFit Games; CrossFit: Santa Cruz, CA, USA, 2020. [Google Scholar]
- Mangine, G.T.; Tankersley, J.E.; McDougle, J.M.; Velazquez, N.; Roberts, M.D.; Esmat, T.A.; VanDusseldorp, T.A.; Feito, Y. Predictors of CrossFit Open Performance. Sports 2020, 8, 102. [Google Scholar] [CrossRef]
- Martínez-Gómez, R.; Valenzuela, P.L.; Alejo, L.B.; Gil-Cabrera, J.; Montalvo-Pérez, A.; Talavera, E.; Lucia, A.; Moral-González, S.; Barranco-Gil, D. Physiological Predictors of Competition Performance in CrossFit Athletes. Int. J. Environ. Res. Public Health 2020, 17, 3699. [Google Scholar] [CrossRef] [PubMed]
- Glassman, G. What is CrossFit? Crossfit J. 2004, 19, 1–7. [Google Scholar]
- Schlegel, P. CrossFit® Training Strategies from the Perspective of Concurrent Training: A Systematic Review. J. Sports Sci. Med. 2020, 19, 670–680. [Google Scholar] [PubMed]
- Petrik, M. CrossFit Powerworkouts: Intensivtraining für Kraft & Ausdauer; BLV Buchverlag: Munich, Germany, 2014. [Google Scholar]
- Claudino, J.G.; Gabbett, T.J.; Bourgeois, F.; Souza, H.D.S.; Miranda, R.C.; Mezêncio, B.; Soncin, R.; Filho, C.A.C.; Bottaro, M.; Hernandez, A.J.; et al. CrossFit Overview: Systematic Review and Meta-analysis. Sports Med. Open 2018, 4, 1–14. [Google Scholar] [CrossRef] [PubMed]
- Glassman, G. Benchmark Workouts. CrossFit J. 2003, 15, 1–5. [Google Scholar]
- Barbieri, J.F.; Correia, R.F.; Castaño, L.A.A.; Brasil, D.V.C.; Ribeiro, A.N. Comparative and correlational analysis of the performance from 2016 crossfit games high-level athletes. Man. Ther. Posturology Rehabil. J. 2017, 15, 1–4. [Google Scholar] [CrossRef] [Green Version]
- Bellovary, B.; Drum, S.N. A Performance Profile Related to Building Elite Fitness in Male Competitors. Med. Sci. Sports Exerc. 2014, 46, 51–52. [Google Scholar] [CrossRef]
- Zeitz, E.K.; Cook, L.F.; Dexheimer, J.D.; Lemez, S.; Leyva, W.D.; Terbio, I.Y.; Tran, J.R.; Jo, E. The Relationship between CrossFit® Performance and Laboratory-Based Measurements of Fitness. Sports 2020, 8, 112. [Google Scholar] [CrossRef]
- CrossFit. Welcome to the 2019 CrossFit Games Season. In CrossFit Games; CrossFit: Santa Cruz, CA, USA, 2019. [Google Scholar]
- Bellar, D.; Hatchett, A.; Judge, L.; Breaux, M.; Marcus, L. The relationship of aerobic capacity, anaerobic peak power and experience to performance in HIT exercise. Biol. Sport 2015, 32, 315–320. [Google Scholar] [CrossRef]
- Butcher, S.; Neyedly, T.; Horvey, K.; Benko, C. Do physiological measures predict selected CrossFit® benchmark performance? Open Access J. Sports Med. 2015, 6, 241–247. [Google Scholar] [CrossRef] [Green Version]
- Dexheimer, J.D.; Schroeder, E.T.; Sawyer, B.J.; Pettitt, R.W.; Aguinaldo, A.L.; Torrence, W.A. Physiological Performance Measures as Indicators of CrossFit® Performance. Sports 2019, 7, 93. [Google Scholar] [CrossRef] [Green Version]
- Martínez-Gómez, R.; Valenzuela, P.L.; Barranco-Gil, D.; Moral-González, S.; García-González, A.; Lucia, A. Full-Squat as a Determinant of Performance in CrossFit. Int. J. Sports Med. 2019, 40, 592–596. [Google Scholar] [CrossRef] [Green Version]
- Carreker, J.D.; Grosicki, G.J. Physiological Predictors of Performance on the CrossFit “Murph” Challenge. Sports 2020, 8, 92. [Google Scholar] [CrossRef]
- Hopkins, W.G.; Marshall, S.W.; Batterham, A.M.; Hanin, J. Progressive Statistics for Studies in Sports Medicine and Exercise Science. Med. Sci. Sports Exerc. 2009, 41, 3–12. [Google Scholar] [CrossRef] [Green Version]
- Mangine, G.T.; Cebulla, B.; Feito, Y. Normative Values for Self-Reported Benchmark Workout Scores in CrossFit® Practitioners. Sports Med. Open 2018, 4, 1–8. [Google Scholar] [CrossRef] [PubMed]
- Whiteman-Sandland, J.; Hawkins, J.; Clayton, D. The role of social capital and community belongingness for exercise adherence: An exploratory study of the CrossFit gym model. J. Health Psychol. 2018, 23, 1545–1556. [Google Scholar] [CrossRef] [PubMed]
- Brouwers, J.; Sotiriadou, P.; De Bosscher, V. Sport-specific policies and factors that influence international success: The case of tennis. Sport Manag. Rev. 2015, 18, 343–358. [Google Scholar] [CrossRef] [Green Version]
- Leitão, L.; Dias, M.; Campos, Y.; Vieira, J.; Sant’Ana, L.; Telles, L.; Tavares, C.; Mazini, M.; Novaes, J.; Vianna, J. Physical and Physiological Predictors of FRAN CrossFit® WOD Athlete’s Performance. Int. J. Environ. Res. Public Health 2021, 18, 4070. [Google Scholar] [CrossRef] [PubMed]
- Stone, M.H.; A Sands, W.; Pierce, K.C.; Carlock, J.; Cardinale, M.; Newton, R.U. Relationship of maximum strength to weightlifting performance. Med. Sci. Sports Exerc. 2005, 37, 1037–1043. [Google Scholar]
- Peña, J.; Moreno-Doutres, D.; Peña, I.; Chulvi-Medrano, I.; Ortegón, A.; Aguilera-Castells, J.; Buscà, B. Predicting the Unknown and the Unknowable. Are Anthropometric Measures and Fitness Profile Associated with the Outcome of a Simulated CrossFit® Competition? Int. J. Environ. Res. Public Health 2021, 18, 3692. [Google Scholar] [CrossRef]


| All | Males | Females | American | German | |
|---|---|---|---|---|---|
| n | 162 | 66 | 96 | 82 | 80 |
| Age (years) | 32.6 ± 8.2 | 33.9 ± 9.0 | 31.7 ± 7.5 | 33.9 ± 8.5 | 31.2 ± 7.7 |
| Height (cm) | 172.4 ± 10.1 | 179.7 ± 7.5 | 167.4 ± 8.5 | 169.2 ± 8.8 | 175.7 ± 10.3 |
| Weight (kg) | 75.3 ±12.9 | 84.9 ± 10.1 | 68.7 ± 10.3 | 73.4 ± 12.7 | 77.3 ± 13.0 |
| Training scope per week (h) | 6.6 ± 3.5 | 6.9 ± 3.9 | 6.4 ± 3.3 | 6.3 ± 3.0 | 6.9 ± 4.0 |
| CrossFit® experience (years) | 3.4 ± 1.9 | 3.3 ± 1.9 | 3.5 ± 1.9 | 3.5 ± 2.1 | 3.1 ± 1.8 |
| Males | All | Range | American | Range | German | Range |
|---|---|---|---|---|---|---|
| n | 66 | 24 | 42 | |||
| 1-RM DL (kg) | 172.1 ± 37.4 | 70–261 | 184.2 ± 31.6 | 136–261 | 165.1 ± 38.9 | 70–260 |
| 1-RM BP (kg) | 106.3 ± 21.9 | 53–160 | 111.4 ± 18.4 | 80–159 | 103.4 ± 23.4 | 53–160 |
| 1-RM BS (kg) | 140.8 ± 35.6 | 30–240 | 152.3 ± 26.5 | 93–193 | 134.1 ± 38.6 | 30–240 |
| 1-RM SP (kg) | 70.2 ± 15.7 | 40–130 | 76.0 ± 17.2 | 57–130 | 66.9 ± 13.9 | 40–105 |
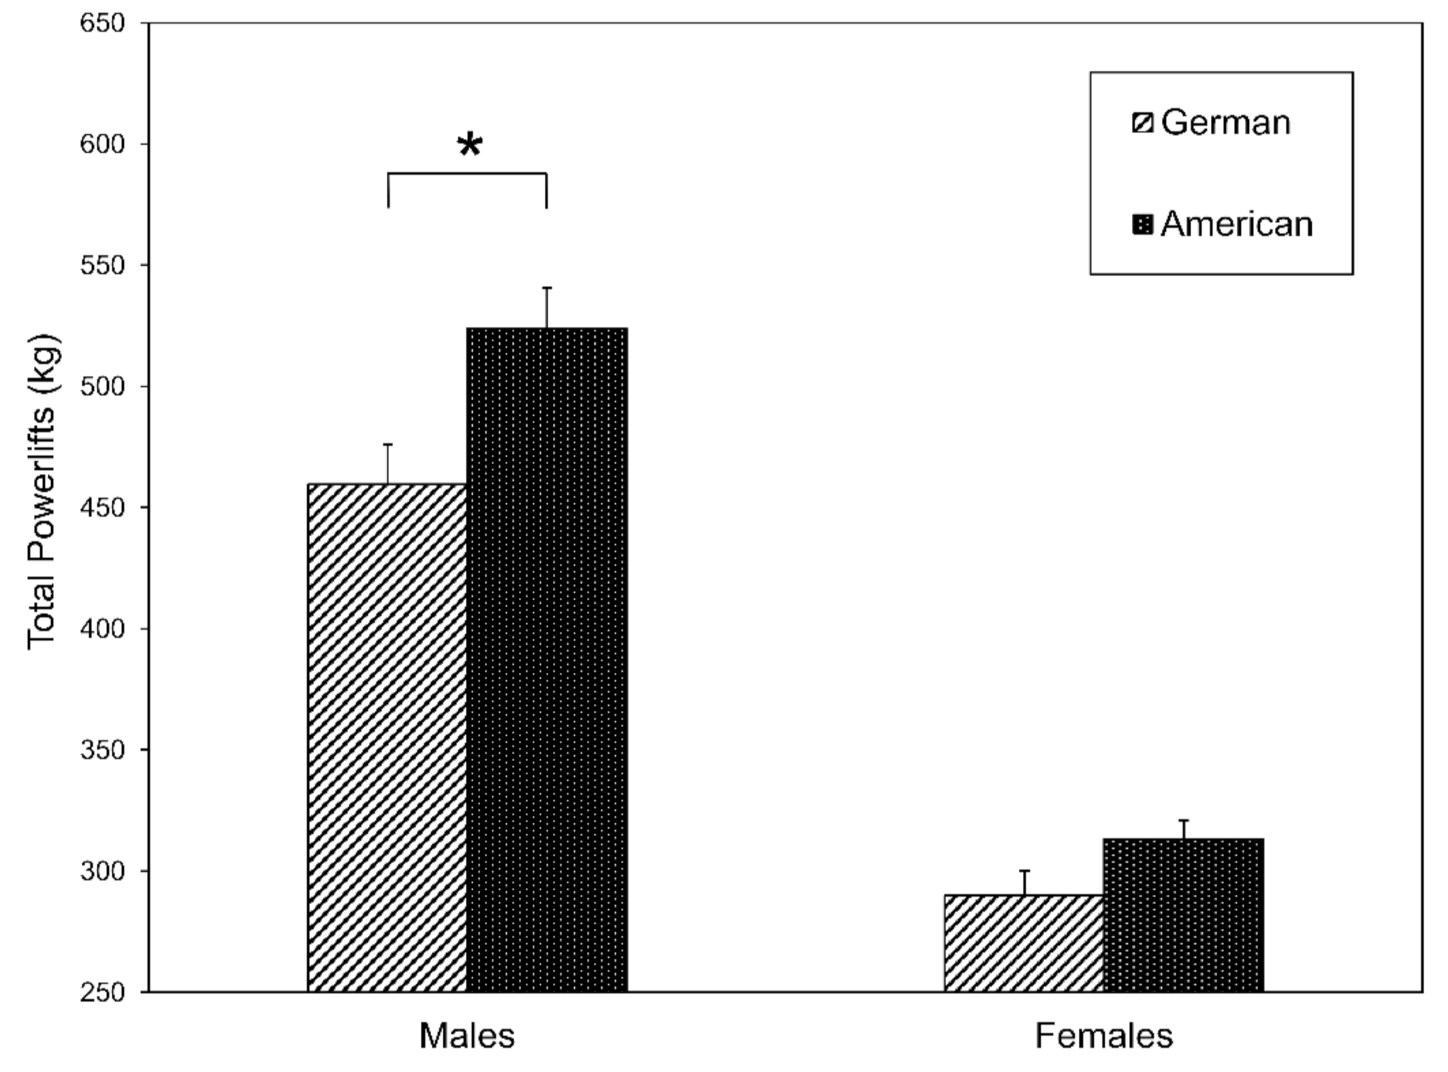
| Total power lifts (kg) | 489.3 ± 100.7 | 250–765 | 523.9 ± 82.0 | 393–715 | 469.5 ± 105.8 | 250–765 |
| 1-RM SN (kg) | 74.2 ± 20.8 | 30–125 | 79.8 ± 19.0 | 52–125 | 71.0 ± 21.3 | 30–125 |
| 1-RM CJ (kg) | 95.8 ± 25.8 | 40–160 | 100.4 ± 21.3 | 52–135 | 93.2 ± 27.9 | 40–160 |
| Total Olympic lifts (kg) | 170.0 ± 45.3 | 70–285 | 180.2 ± 38.7 | 104–260 | 164.2 ± 48.1 | 70–285 |
| FR (s | 310.4 ± 134.3 | 142–720 | 283.1 ± 116.1 | 142–480 | 325.0 ± 143.2 | 177–720 |
| GR (s) | 233.3 ± 101.2 | 115–430 | 257.0 ± 112.0 | 117–430 | 214.1 ± 92.6 | 115–390 |
| HE (s) | 611.2 ± 127.1 | 393–902 | 589.9 ± 150.8 | 393–902 | 625.8 ± 110.8 | 509–900 |
| 400 m (s) | 76.3 ± 19.6 | 49–150 | 78.3 ± 24.1 | 51–150 | 75.1 ± 16.8 | 49–106 |
| 1 mile (s) | 402.1 ± 80.7 | 234–570 | 401.0 ± 82.3 | 251–540 | 402.7 ± 81.2 | 234–570 |
| Females | ||||||
| n | 96 | 38 | 58 | |||
| 1-RM DL (kg) | 114.4 ± 22.5 | 62–170 | 116.6 ± 22.1 | 62–170 | 111.1 ± 23.0 | 70–170 |
| 1-RM BP (kg) | 54.3 ± 13.0 | 27–90 | 56.1 ± 12.3 | 27–84 | 51–7 ± 13.9 | 27–90 |
| 1-RM BS (kg) | 92.6 ± 20.2 | 56–136 | 96.8 ± 19.4 | 56–136 | 86.1 ± 19.9 | 57–130 |
| 1-RM SP (kg) | 42.8 ± 10.8 | 25–90 | 43.9 ± 11.1 | 25–90 | 41.0 ± 10.4 | 25–80 |
| Total Powerlifts (kg) | 304.1 ± 60.2 | 180–460 | 313.4 ± 57.2 | 180–424 | 289.9 ± 62.6 | 192–460 |
| 1-RM SN (kg) | 48.2 ± 12.1 | 25–80 | 50.1 ± 11.6 | 29–77 | 45.3 ± 12.6 | 25–80 |
| 1-RM CJ (kg) | 62.8 ± 14.8 | 25–102 | 64.4 ± 14.7 | 25–102 | 60.4 ± 14.8 | 35–95 |
| Total Olympic lifts (kg) | 111.0 ± 26.2 | 55–179 | 114.5 ± 25.4 | 55–179 | 105.7 ± 26.8 | 60–175 |
| FR (s) | 361.8 ± 112.7 | 142–641 | 346.3 ±109.8 | 142–640 | 390.3 ± 115.3 | 238–641 |
| GR (s) | 250.6 ± 171.2 | 100–1200 | 254.3 ± 187.8 | 116–1200 | 267.7 ± 107.0 | 100–482 |
| HE (s) | 698.8 ± 186.1 | 510–1621 | 673.5 ± 101.3 | 510–888 | 754.5 ± 318.0 | 532–1621 |
| 400 m (s) | 93.8 ± 20.9 | 45–188 | 94.1 ± 16.5 | 59–123 | 93.0 ± 30.4 | 45–188 |
| 1 mile (s) | 474.1 ± 85.1 | 242–800 | 472.4 ± 64.8 | 358–720 | 479.2 ± 129.0 | 242–800 |
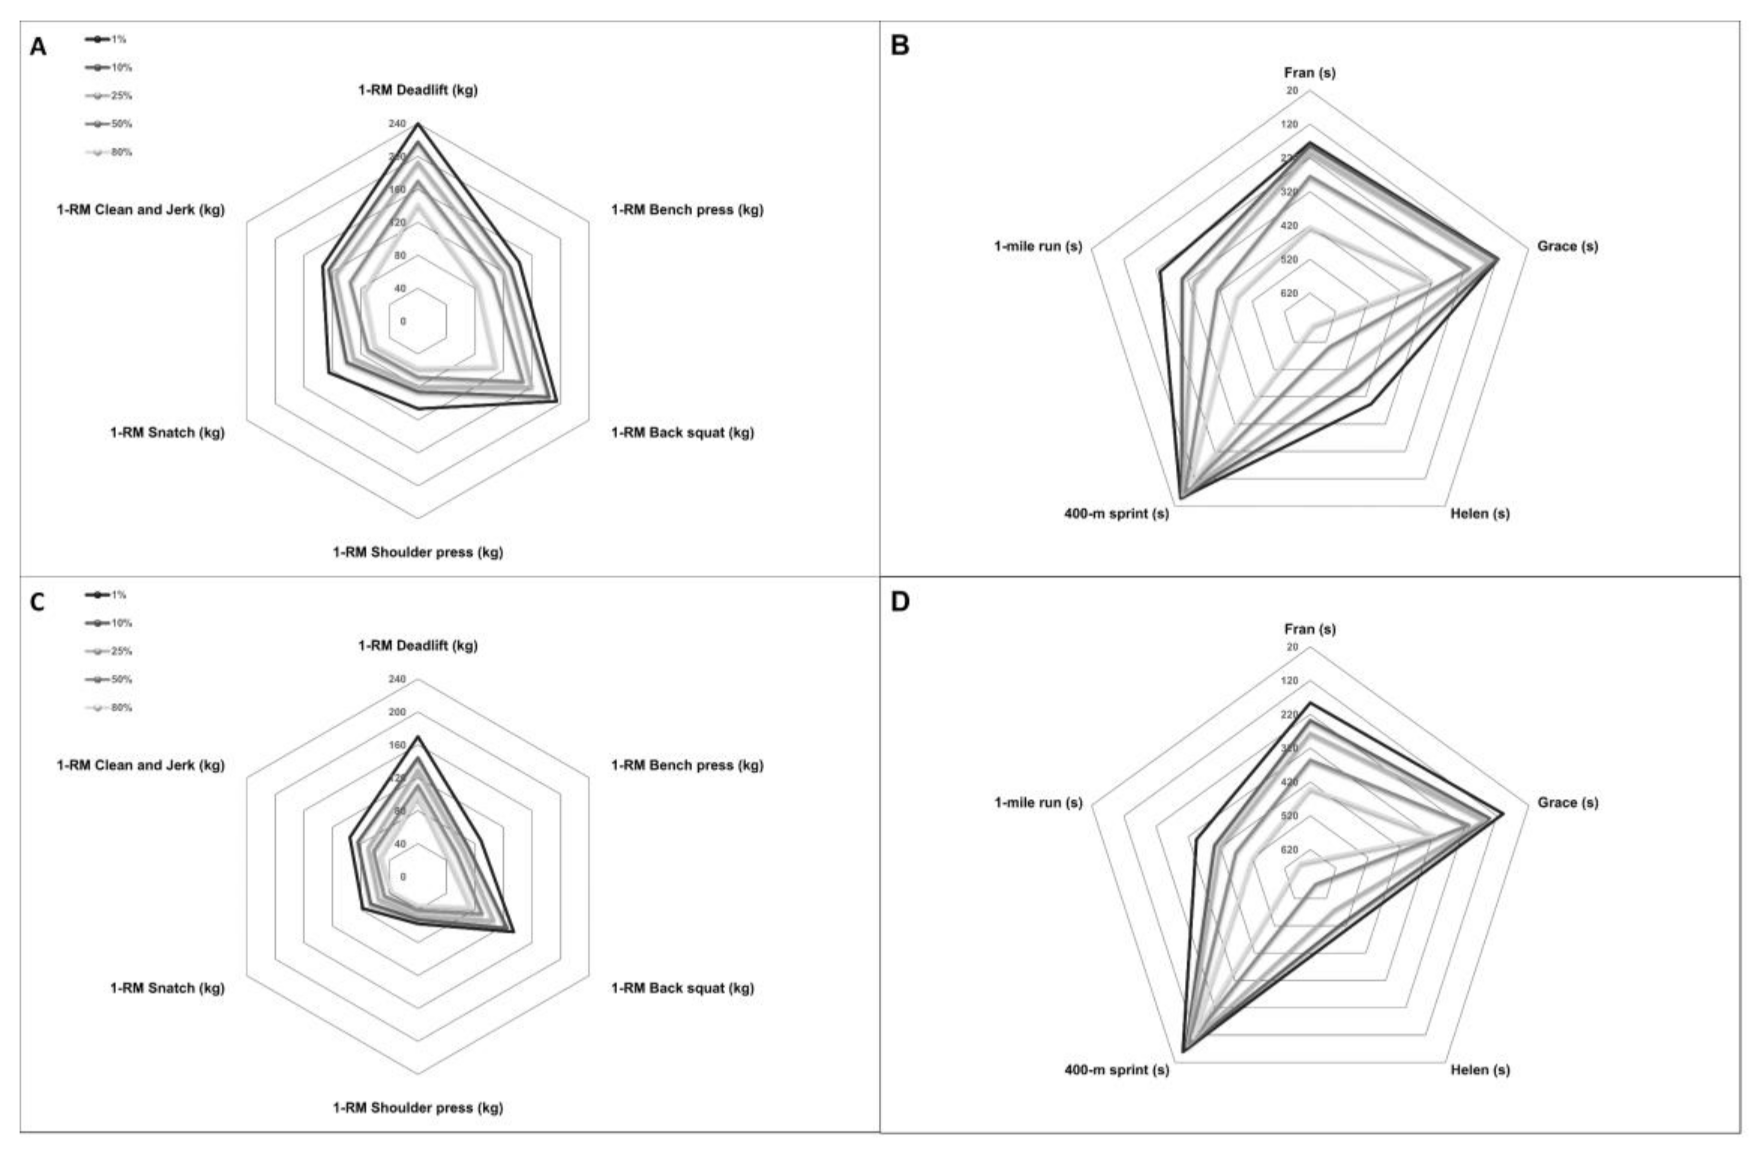
| Males | 1% | 10% | 25% | 50% | 80% |
|---|---|---|---|---|---|
| 1-RM DL (kg) | 240 (248) | 218 (210) | 193 (190) | 170 (166) | 143 (140) |
| 1-RM BP (kg) | 142 (161) | 130 (134) | 120 (120) | 105 (102) | 85 (84) |
| 1-RM BS (kg) | 194 (211) | 184 (175) | 160 (156) | 148 (135) | 110 (110) |
| 1-RM SP (kg) | 106 (102) | 86 (84) | 79 (75) | 68 (66) | 57 (57) |
| 1-RM SN (kg) | 125 (120) | 100 (98) | 90 (84) | 70 (70) | 60 (57) |
| 1-RM CJ (kg) | 134 (145) | 125 (120) | 115 (107) | 95 (93) | 75 (77) |
| FR (s) | 175 (139) | 184 (187) | 204 (247) | 274 (337) | 424 (479) |
| GR (s) | 115 (95) | 119 (131) | 142 (163) | 203 (214) | 322 (313) |
| HE (s) | 393 (442) | 455 (507) | 515 (556) | 602 (630) | 682 (753) |
| 400 m (s) | 49 (54) | 55 (62) | 60 (68) | 72 (76) | 92 (90) |
| 1 mile (s) | 234 (312) | 303 (351) | 340 (378) | 413 (416) | 472 (482) |
| Females | |||||
| 1-RM DL (kg) | 170 (160) | 145 (134) | 130 (116) | 111 (102) | 98 (84) |
| 1-RM BP (kg) | 88 (84) | 71 (66) | 64 (59) | 55 (50) | 44 (41) |
| 1-RM BS (kg) | 134 (136) | 125 (108) | 107 (95) | 90 (80) | 75 (64) |
| 1-RM SP (kg) | 57 (57) | 52 (48) | 48 (43) | 41 (38) | 35 (32) |
| 1-RM SN (kg) | 77 (75) | 66 (59) | 55 (50) | 47 (41) | 37 (32) |
| 1-RM CJ (kg) | 95 (93) | 84 (75) | 70 (66) | 62 (55) | 52 (45) |
| FR (s) | 186 (162) | 238 (245) | 276 (311) | 355 (400) | 439 (536) |
| GR (s) | 100 (107) | 143 (150) | 155 (187) | 206 (245) | 309 (345) |
| HE (s) | 510 (490) | 532 (574) | 578 (633) | 672 (714) | 750 (825) |
| 400 m (s) | 59 (65) | 75 (77) | 82 (84) | 90 (95) | 109 (116) |
| 1 mile (s) | 346 (361) | 402 (408) | 420 (445) | 469 (497) | 521 (584) |
| 1-RM BP (kg) | 1-RM BS (kg) | 1-RM SP (kg) | Total PL (kg) | 1-RM SN (kg) | 1-RM CJ (kg) | Total OL (kg) | FR (s) | GR (s) | HE (s) | 400-m (s) | 1 mile (s) | |
|---|---|---|---|---|---|---|---|---|---|---|---|---|
| 1-RM DL (kg) | 0.86 ** | 0.93 ** | 0.84 ** | 0.97 ** | 0.83 ** | 0.88 ** | 0.87 ** | −0.47 ** | −0.30 ** | −0.39 ** | −0.50 ** | −0.48 ** |
| 1-RM BP (kg) | 1 | 0.84 ** | 0.89 ** | 0.94 ** | 0.79 ** | 0.82 ** | 0.82 ** | −0.44 ** | −0.21 | −0.31 * | −0.44 ** | −0.38 ** |
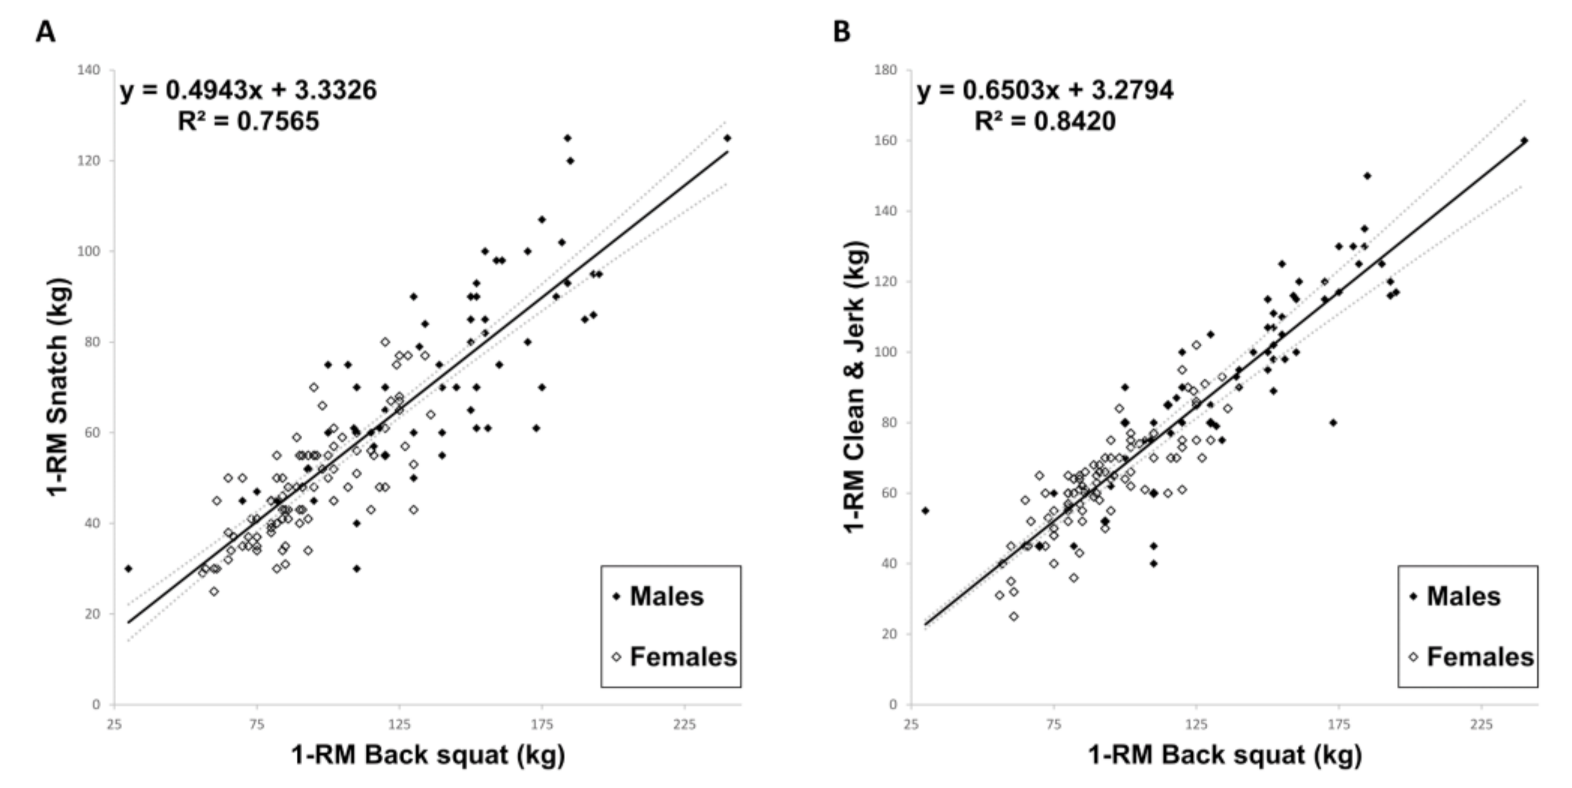
| 1-RM BS (kg) | 1 | 0.84 ** | 0.96 ** | 0.87 ** | 0.92 ** | 0.91 ** | −0.54 ** | −0.29 * | −0.40 ** | −0.47 ** | −0.43 ** | |
| 1-RM SP (kg) | 1 | 0.92 ** | 0.80 ** | 0.81 ** | 0.82 ** | −0.43 ** | −0.12 | −0.37 ** | −0.45 ** | −0.41 ** | ||
| Total PL (kg) | 1 | 0.87 ** | 0.91 ** | 0.91 ** | −0.50 ** | −0.26 * | −0.40 ** | −0.50 ** | −0.46 ** | |||
| 1-RM SN (kg) | 1 | 0.93 ** | 0.98 ** | −0.54 ** | −0.24 * | −0.39 ** | −0.46 ** | −0.41 ** | ||||
| 1-RM CJ (kg) | 1 | 0.99 ** | −0.59 ** | −0.31 ** | −0.45 ** | −0.51 ** | −0.46 ** | |||||
| Total OL (kg) | 1 | −0.57 ** | −0.28 * | −0.43 ** | −0.50 ** | −0.44 ** | ||||||
| FR (s) | 1 | 0.58 ** | 0.37 ** | 0.45 ** | 0.37 ** | |||||||
| GR (s) | 1 | 0.37 ** | 0.33 ** | 0.33 ** | ||||||||
| HE (s) | 1 | 0.59 ** | 0.58 ** | |||||||||
| 400-m (s) | 1 | 0.81 ** | ||||||||||
| 1 mile (s) | 1 |
Publisher’s Note: MDPI stays neutral with regard to jurisdictional claims in published maps and institutional affiliations. |
© 2021 by the authors. Licensee MDPI, Basel, Switzerland. This article is an open access article distributed under the terms and conditions of the Creative Commons Attribution (CC BY) license (https://creativecommons.org/licenses/by/4.0/).
Share and Cite
Meier, N.; Rabel, S.; Schmidt, A. Determination of a CrossFit® Benchmark Performance Profile. Sports 2021, 9, 80. https://doi.org/10.3390/sports9060080
Meier N, Rabel S, Schmidt A. Determination of a CrossFit® Benchmark Performance Profile. Sports. 2021; 9(6):80. https://doi.org/10.3390/sports9060080
Chicago/Turabian StyleMeier, Nicole, Stefan Rabel, and Annette Schmidt. 2021. "Determination of a CrossFit® Benchmark Performance Profile" Sports 9, no. 6: 80. https://doi.org/10.3390/sports9060080