

ISAK-Based Anthropometric Standards for Elite Male and Female Soccer Players

 ,
,  ,
,
Abstract
:1. Introduction
2. Materials and Methods
2.1. Participants and Study Design
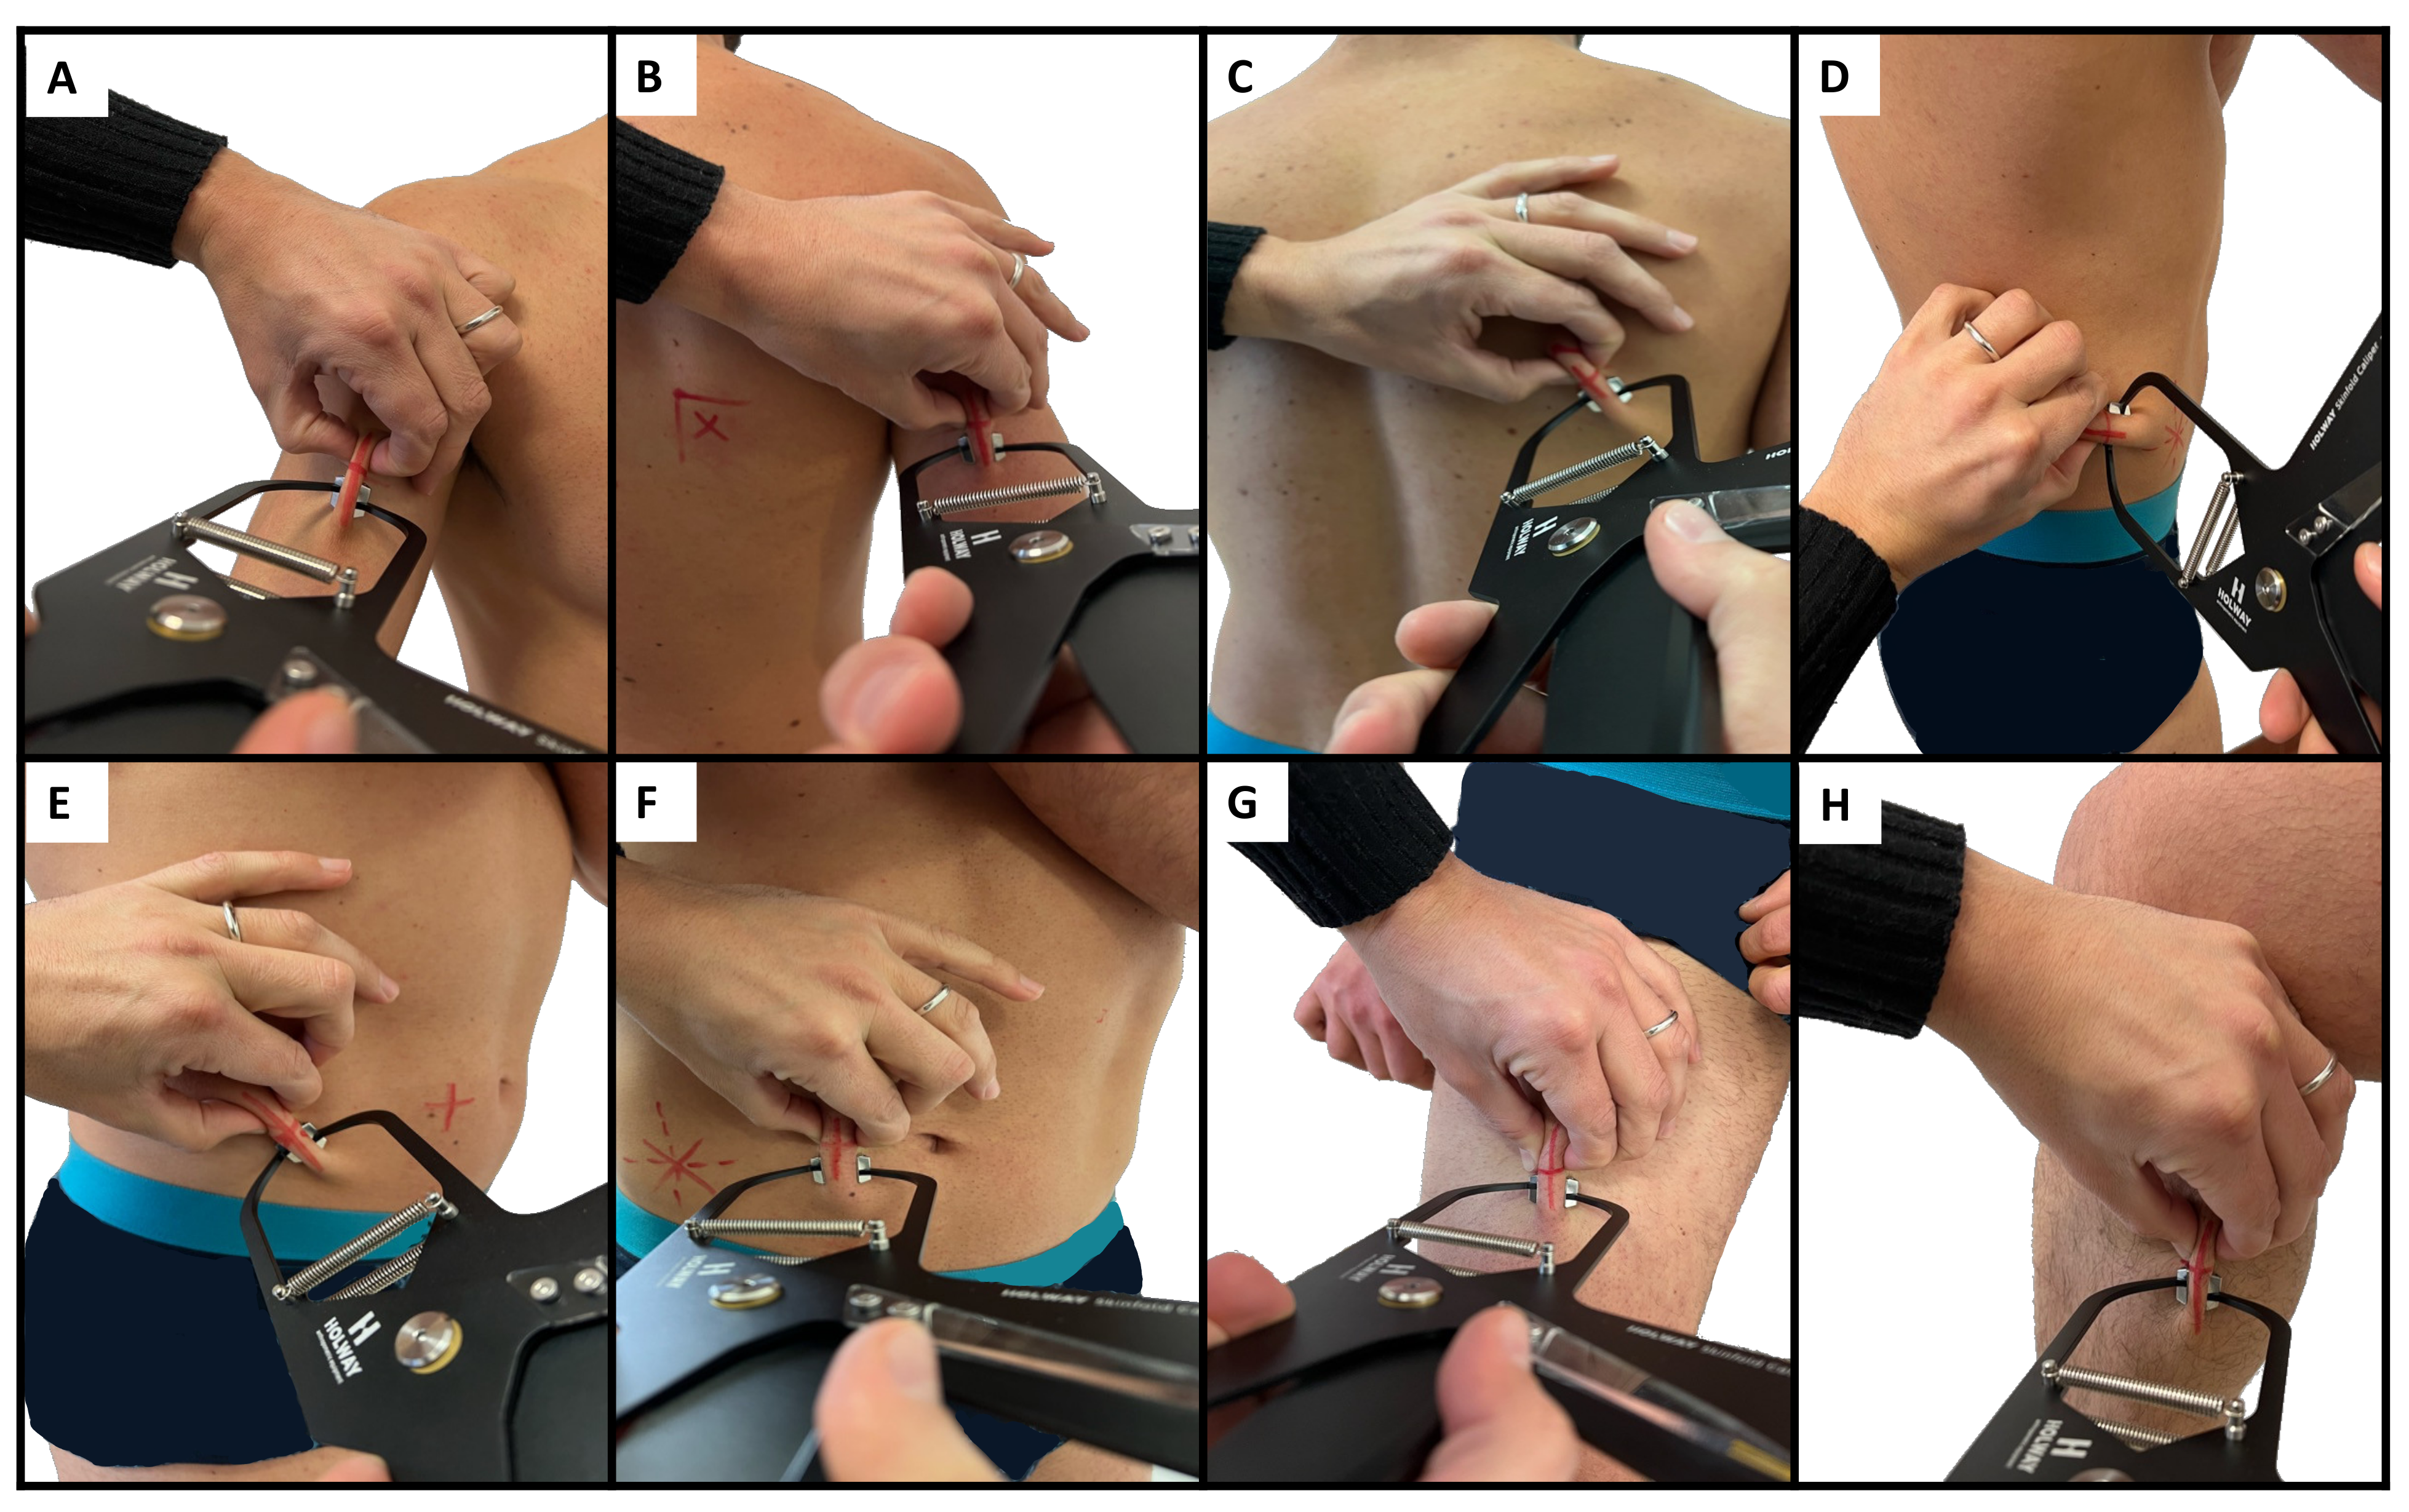
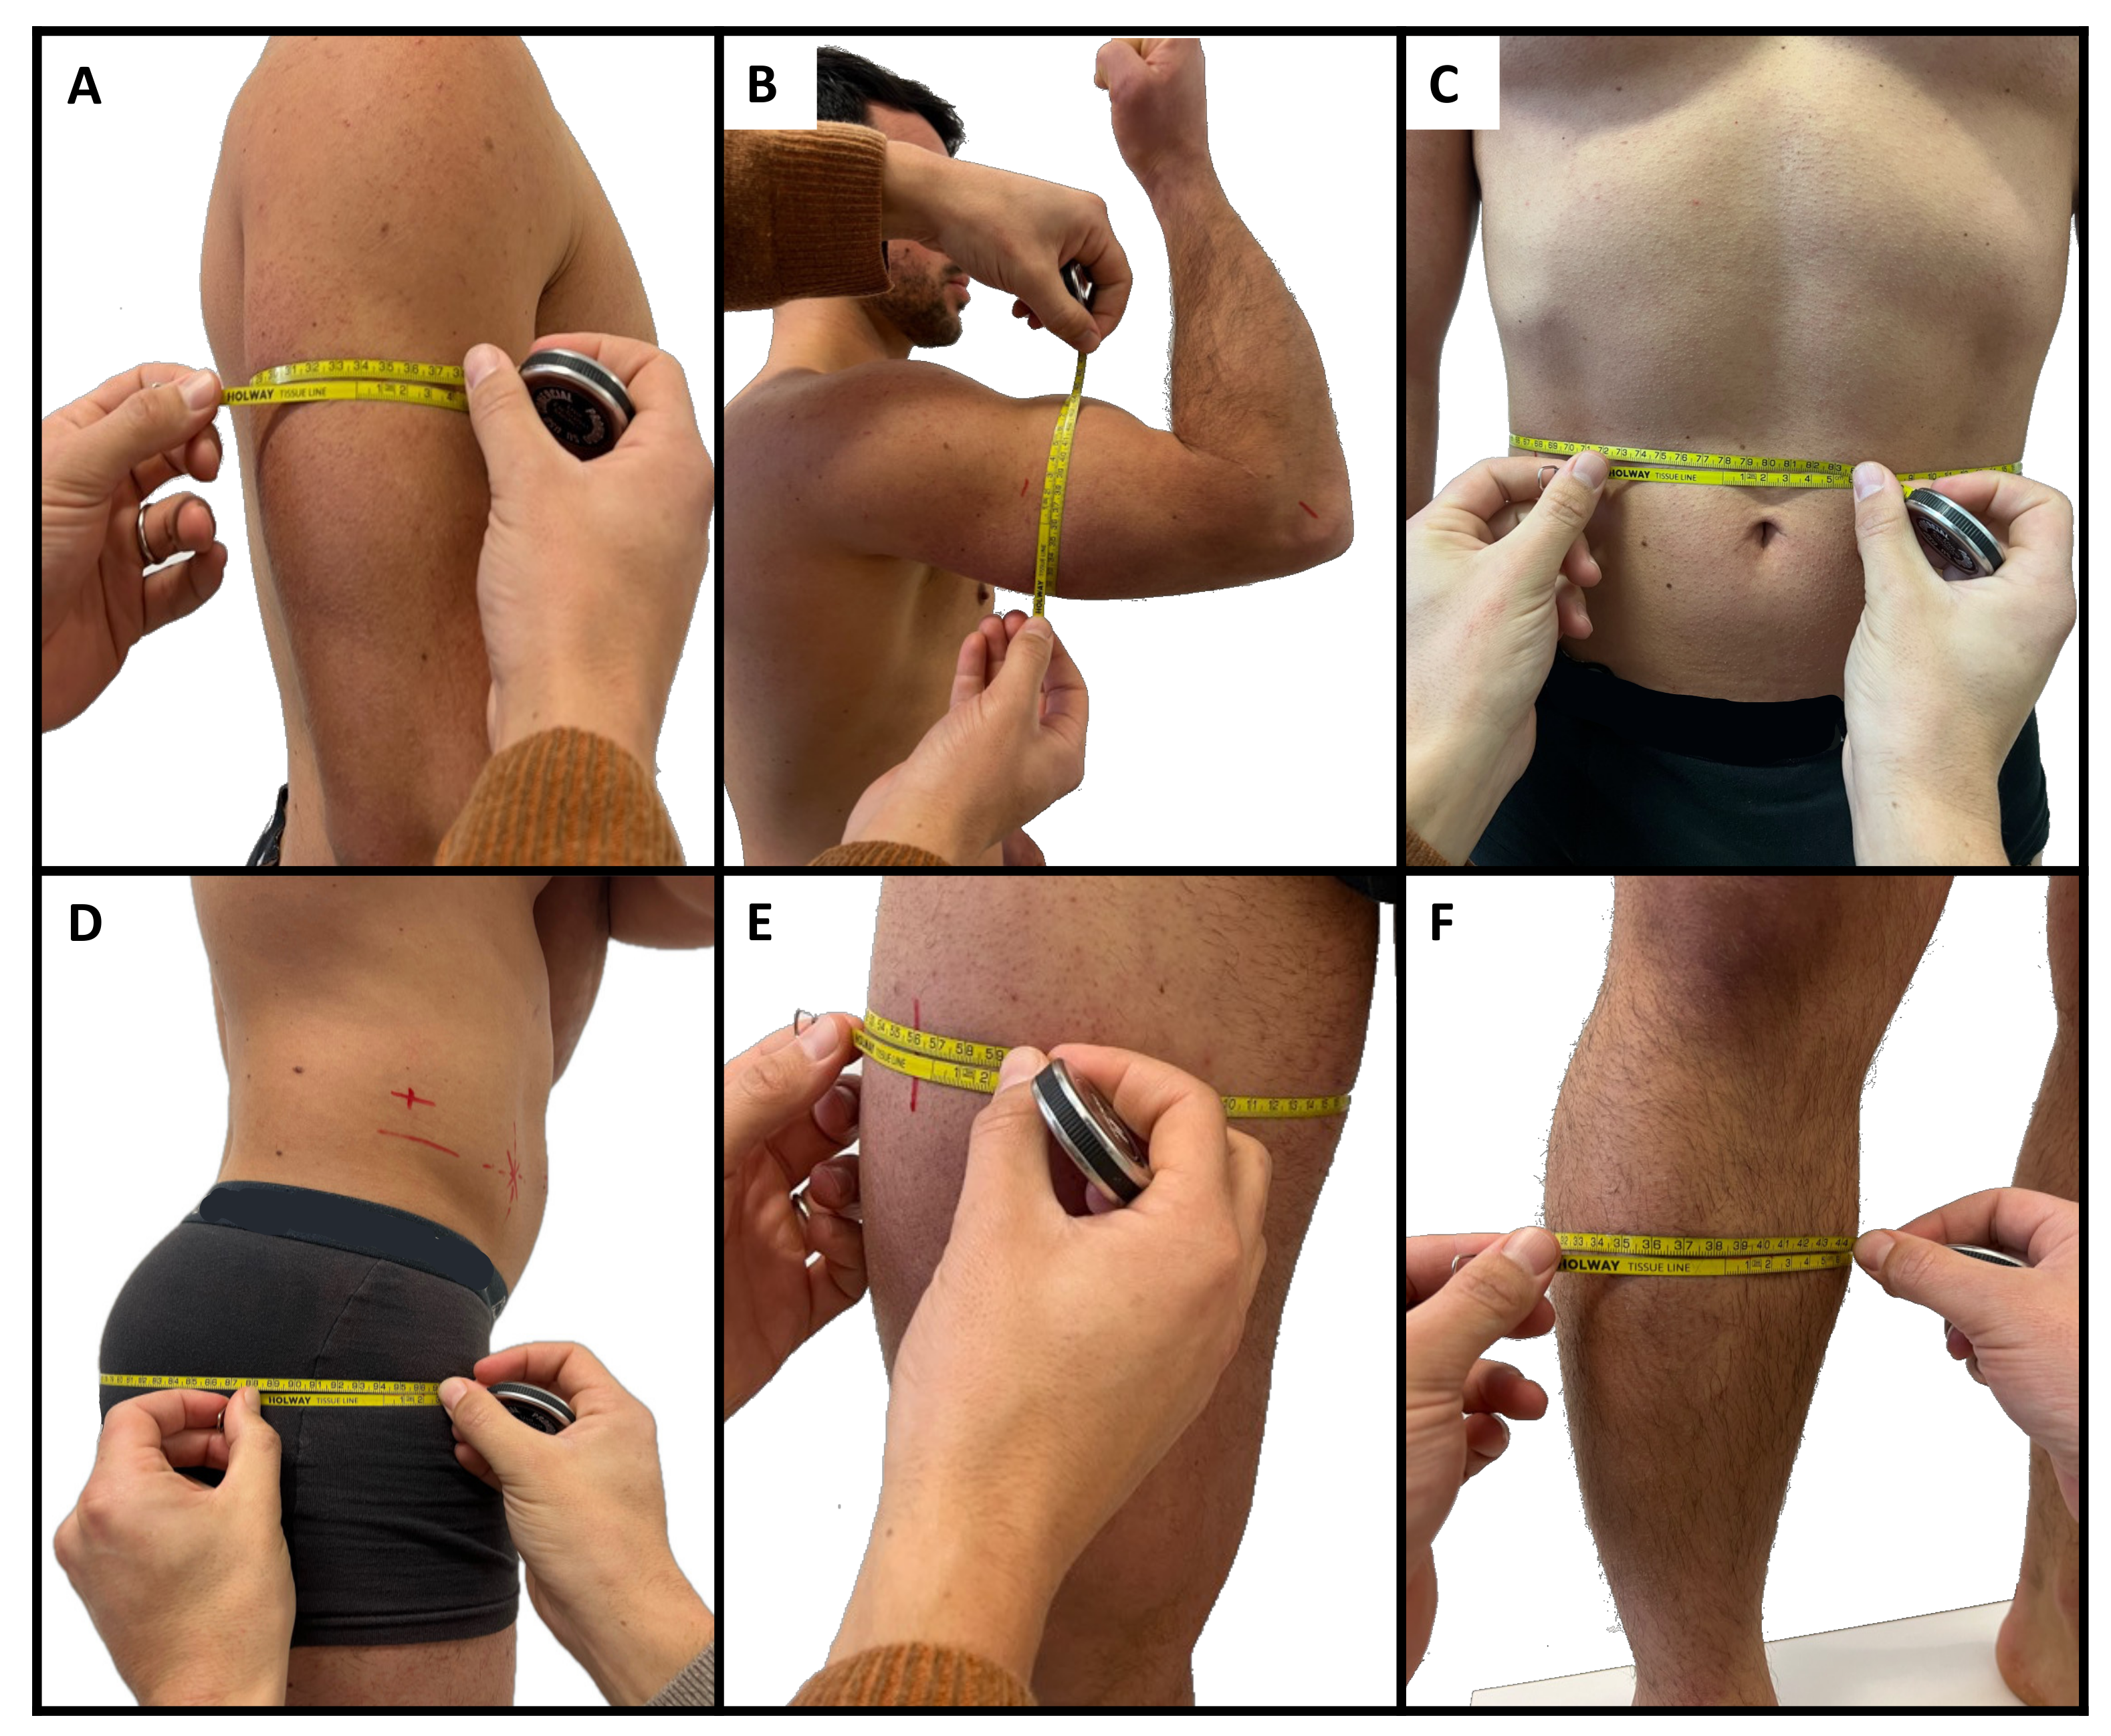
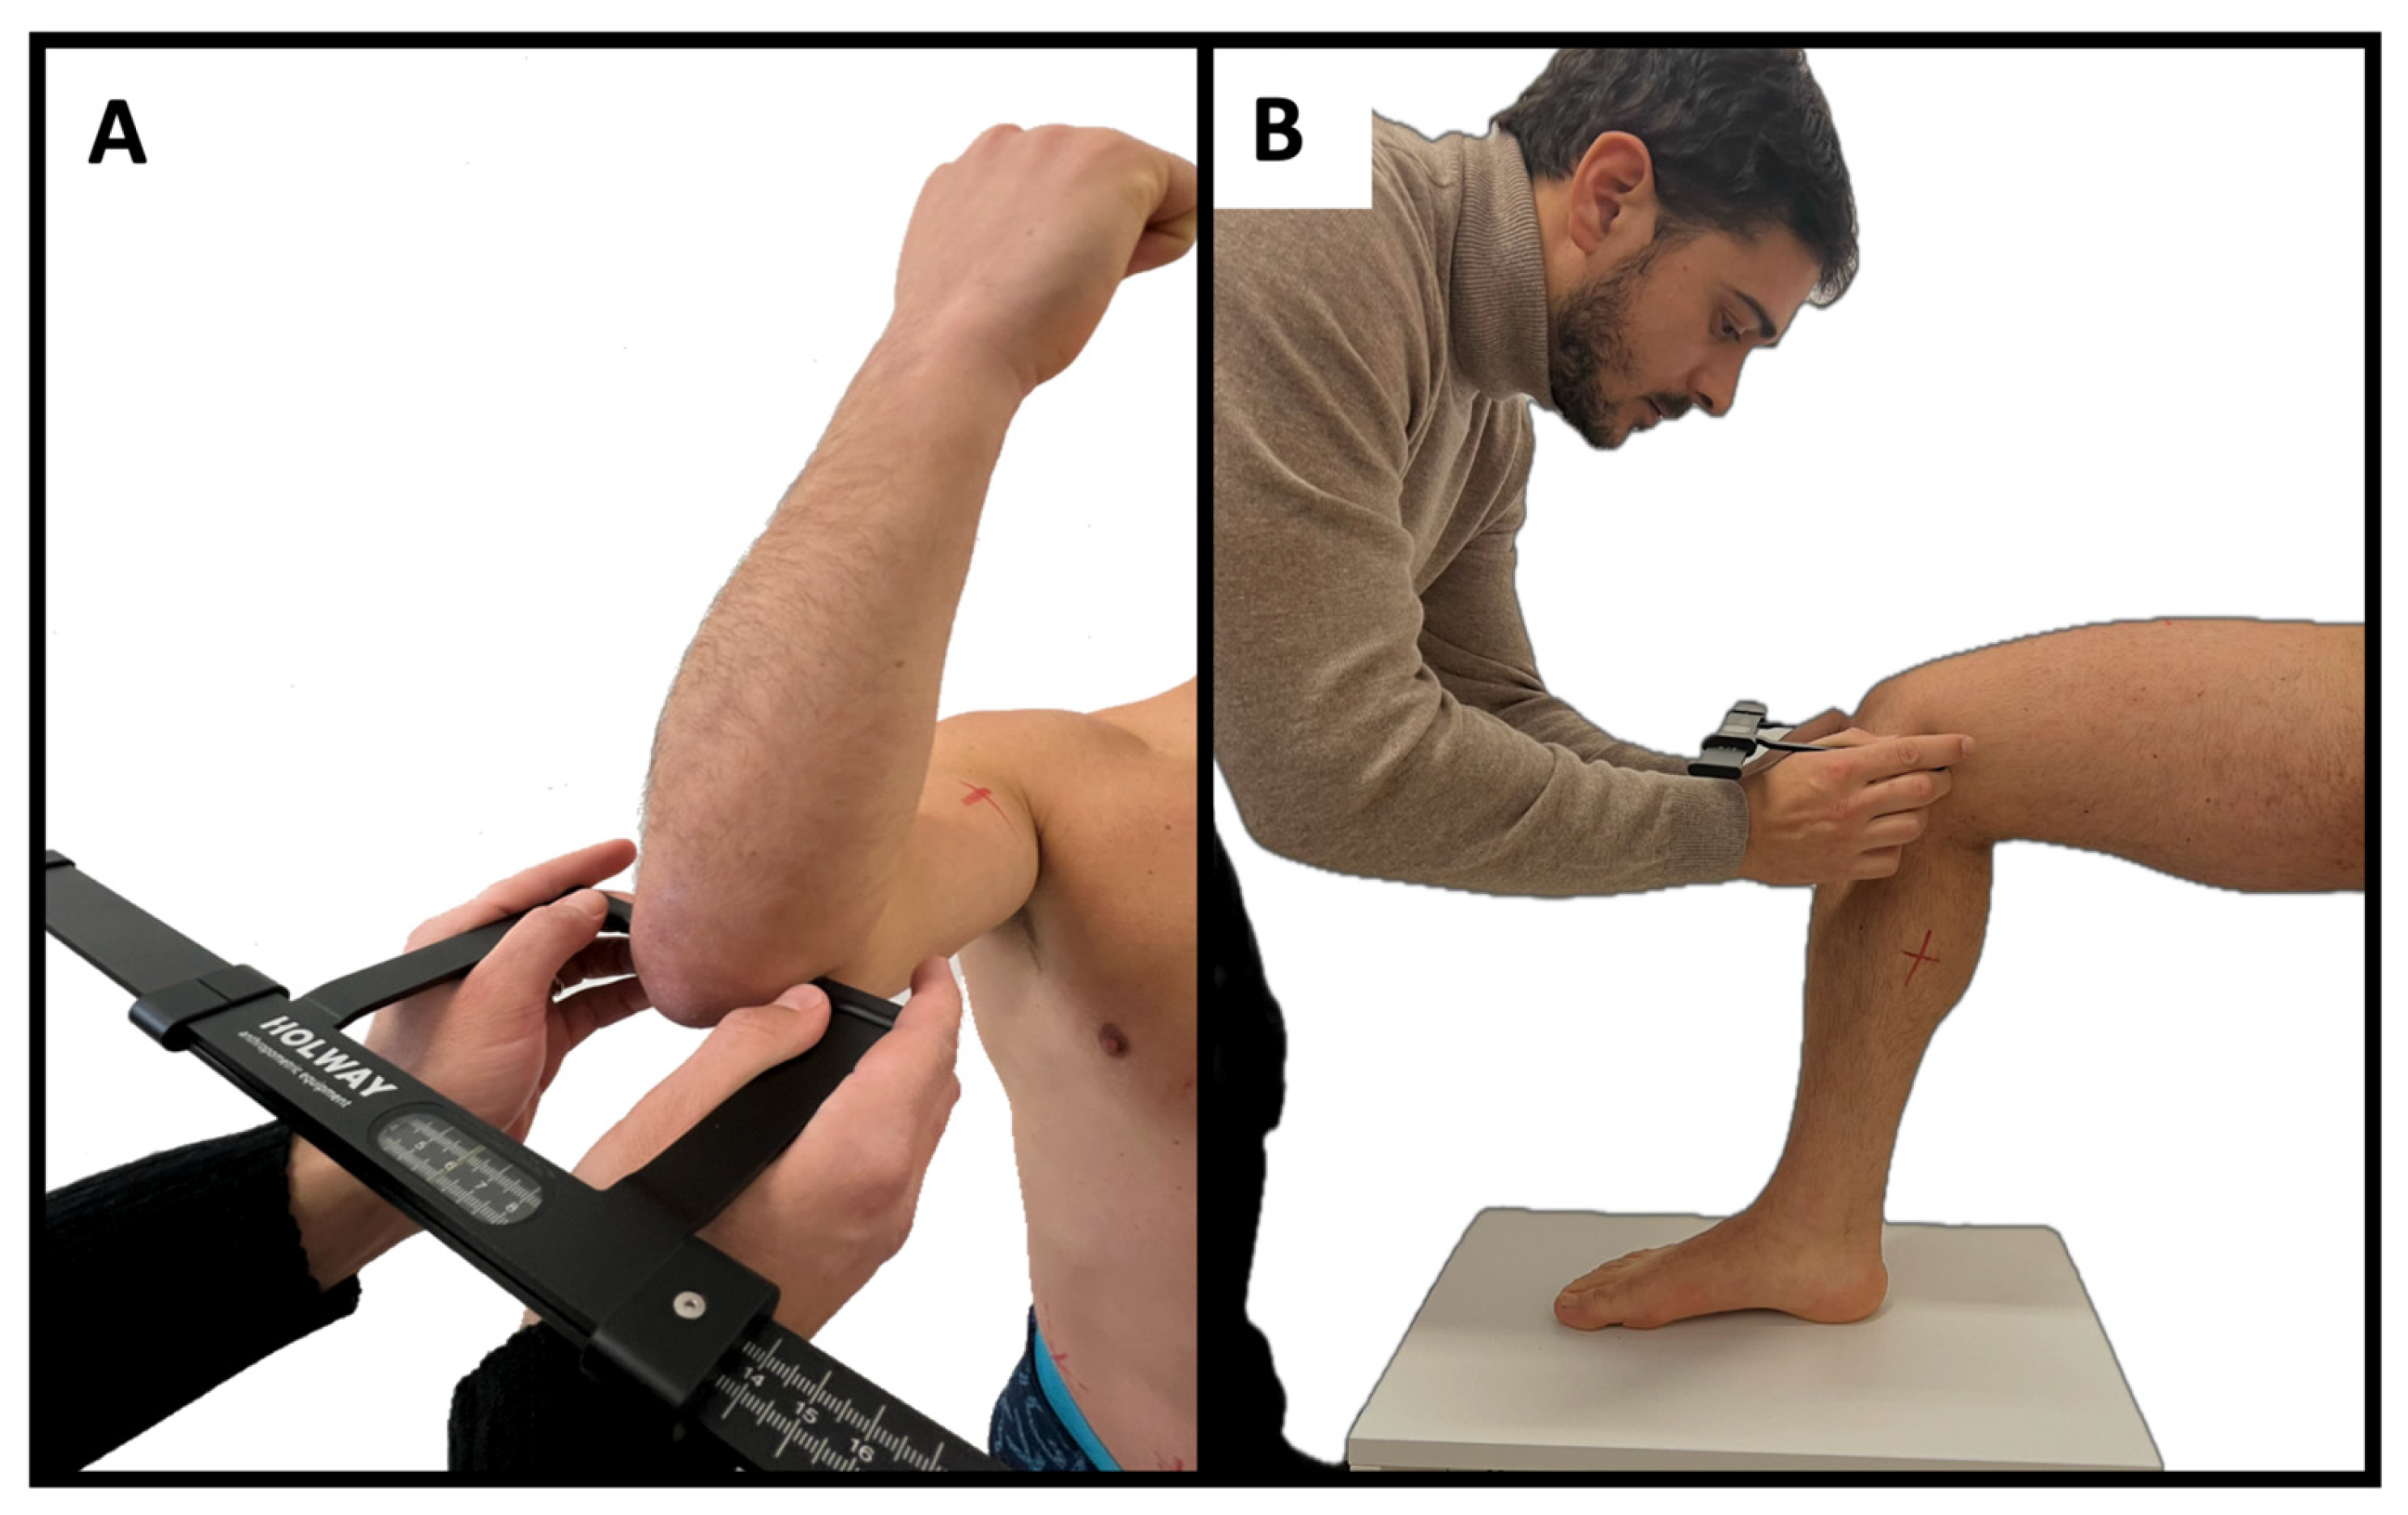
2.2. Procedures
2.3. Statistical Analysis
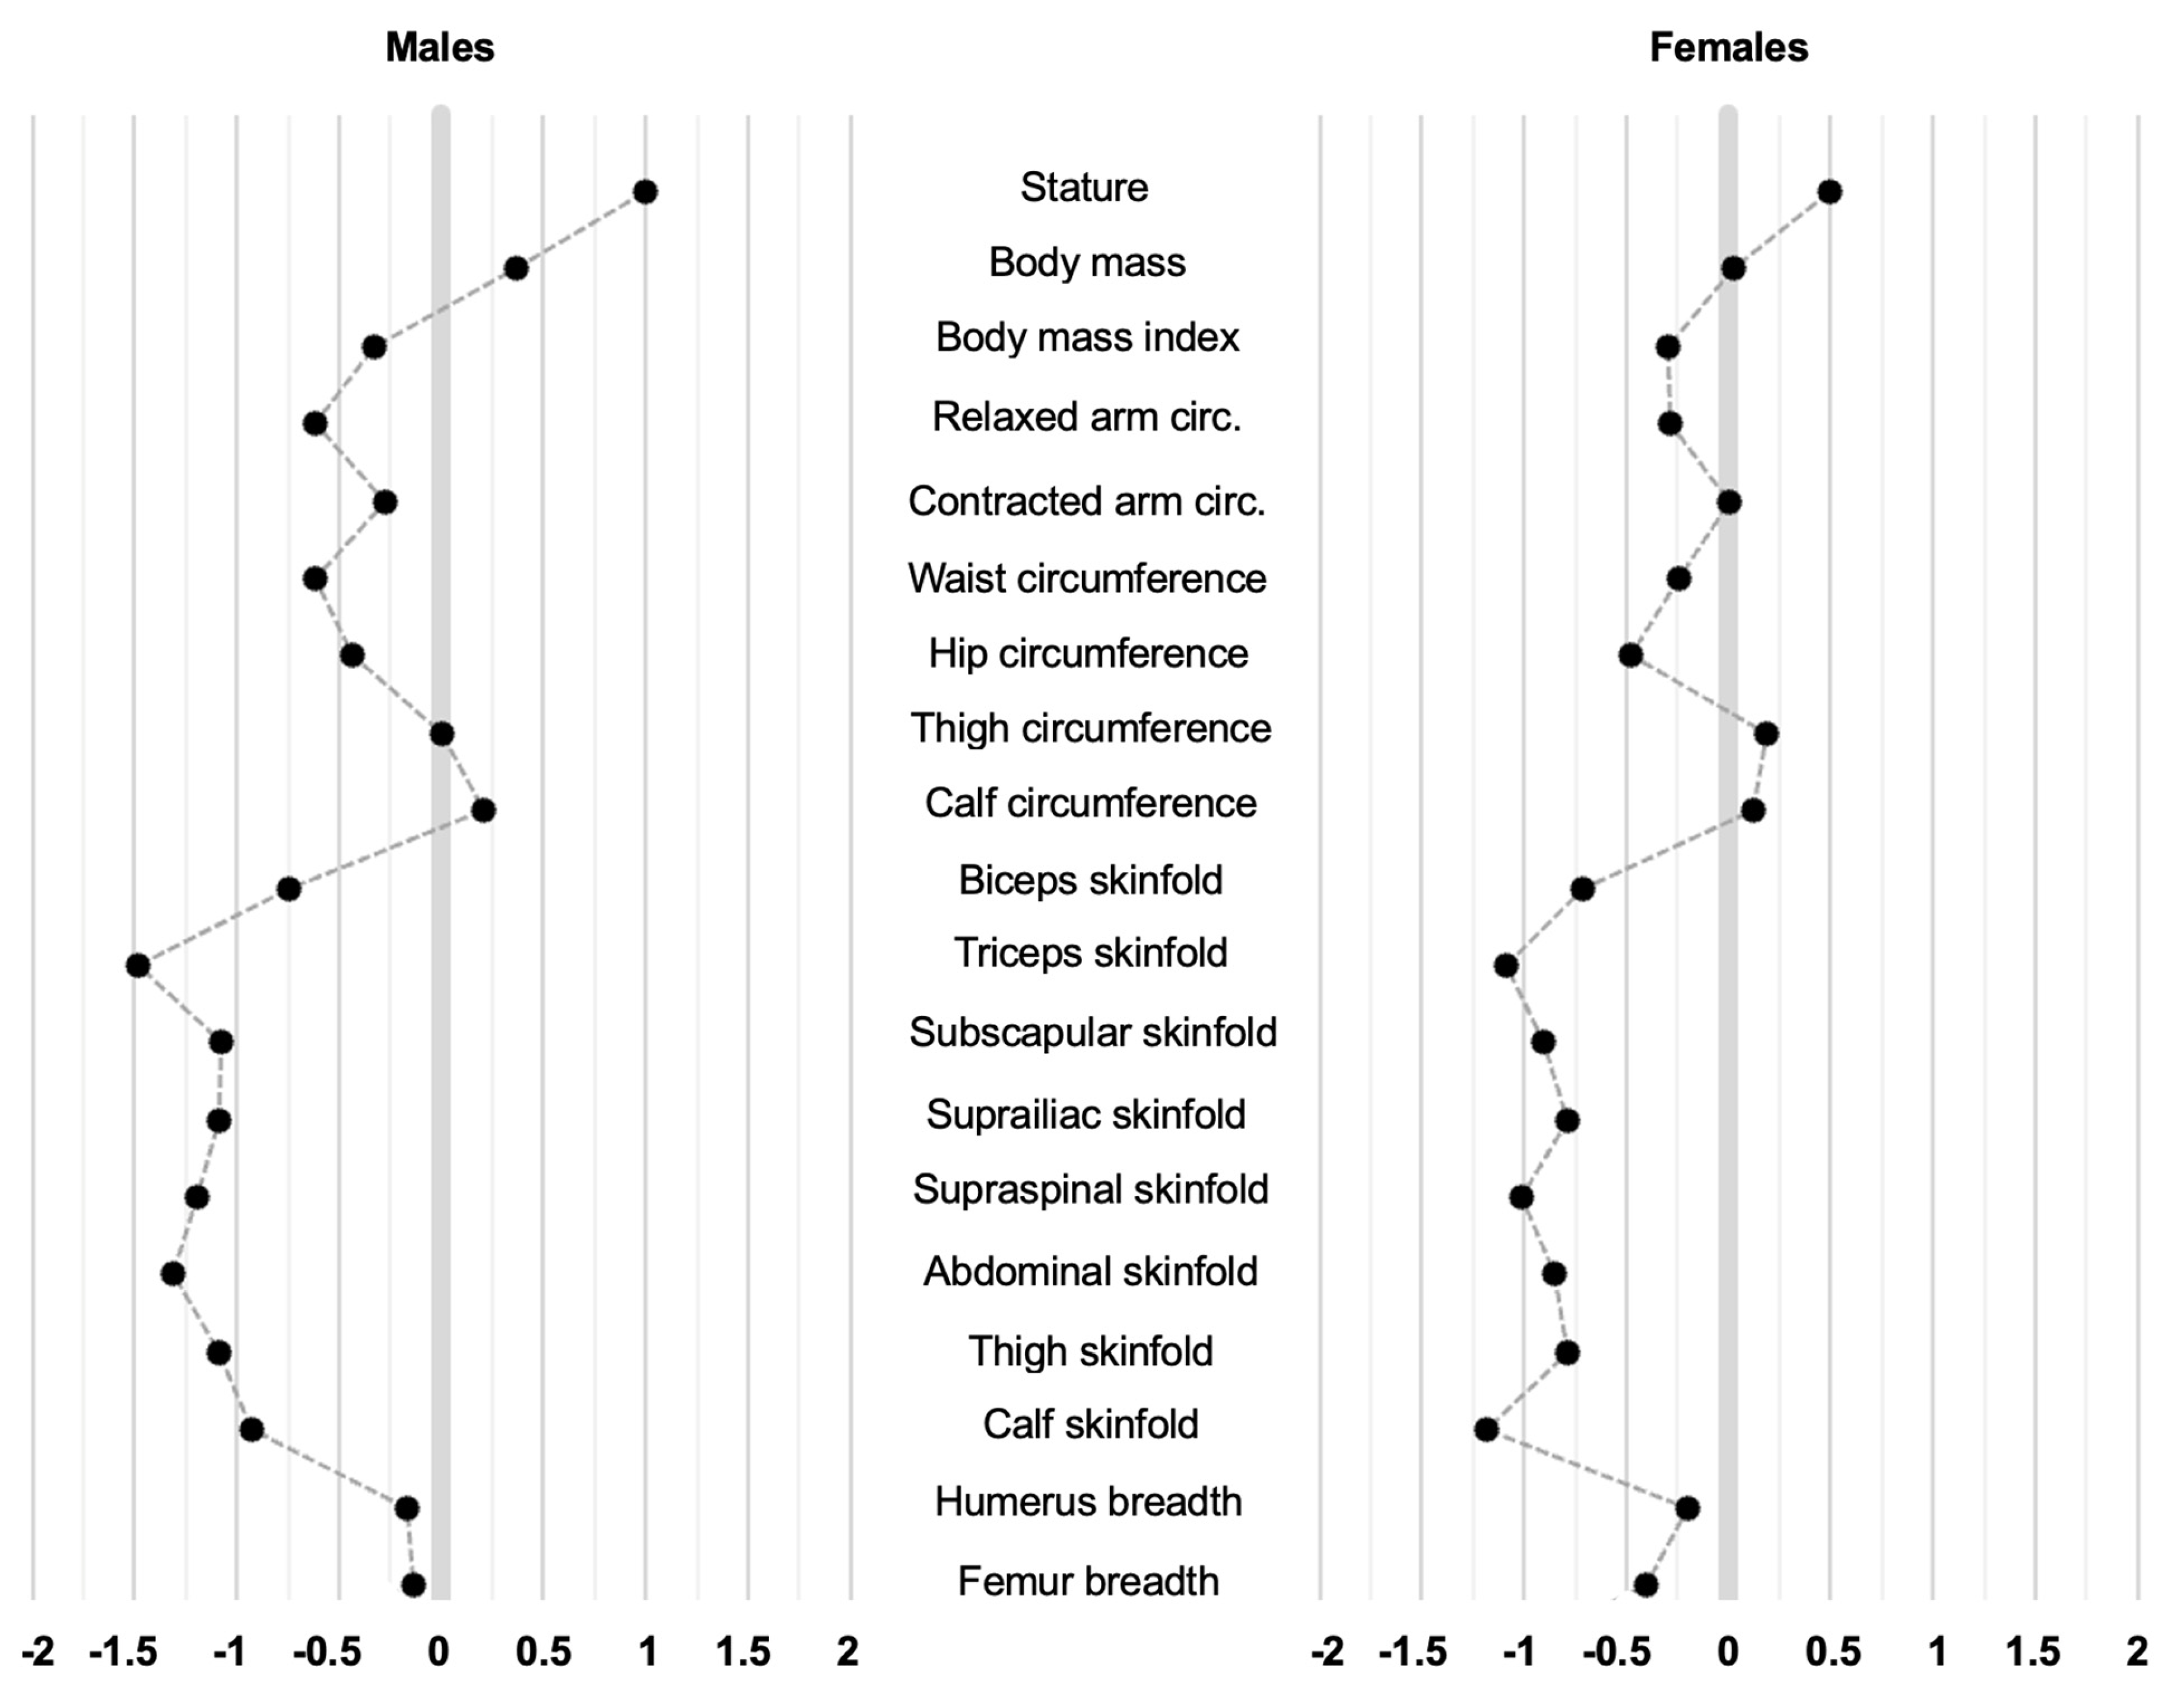
3. Results
4. Discussion
Future Perspectives
5. Conclusions
Author Contributions
Funding
Institutional Review Board Statement
Informed Consent Statement
Data Availability Statement
Acknowledgments
Conflicts of Interest
References
- Collins, J.; Maughan, R.J.; Gleeson, M.; Bilsborough, J.; Jeukendrup, A.; Morton, J.P.; Phillips, S.M.; Armstrong, L.; Burke, L.M.; Close, G.L.; et al. UEFA expert group statement on nutrition in elite football. Current evidence to inform practical recommendations and guide future research. Br. J. Sports Med. 2021, 55, 416. [Google Scholar] [CrossRef] [PubMed]
- Owen, A.L.; Lago-Peñas, C.; Dunlop, G.; Mehdi, R.; Chtara, M.; Dellal, A. Seasonal Body Composition Variation Amongst Elite European Professional Soccer Players: An Approach of Talent Identification. J. Hum. Kinet. 2018, 62, 177–184. [Google Scholar] [CrossRef] [PubMed]
- Dellal, A.; Owen, A.; Wong, D.P.; Krustrup, P.; van Exsel, M.; Mallo, J. Technical and physical demands of small vs. large sided games in relation to playing position in elite soccer. Hum. Mov. Sci. 2012, 31, 957–969. [Google Scholar] [CrossRef] [PubMed]
- Carling, C.; Orhant, E. Variation in body composition in professional soccer players: Interseasonal and intraseasonal changes and the effects of exposure time and player position. J. Strength Cond. Res. 2010, 24, 1332–1339. [Google Scholar] [CrossRef] [PubMed]
- Paoli, A.; Mancin, L.; Caprio, M.; Monti, E.; Narici, M.V.; Cenci, L.; Piccini, F.; Pincella, M.; Grigoletto, D.; Marcolin, G. Effects of 30 days of ketogenic diet on body composition, muscle strength, muscle area, metabolism, and performance in semi-professional soccer players. J. Int. Soc. Sports Nutr. 2021, 18, 62. [Google Scholar] [CrossRef] [PubMed]
- International Society for Advancement of Kinanthropometry. International Standards for Anthropometric Assessment; International Society for the Advancement of Kinanthropometry: Potchefstroom, South Africa, 2001; ISBN 9780868037127. [Google Scholar]
- Campa, F.; Piras, A.; Raffi, M.; Toselli, S. Functional Movement Patterns and Body Composition of High-Level Volleyball, Soccer, and Rugby Players. J. Sport Rehabil. 2019, 28, 740–745. [Google Scholar] [CrossRef] [PubMed]
- Fitton Davies, K.; Sacko, R.S.; Lyons, M.A.; Duncan, M.J. Association between Functional Movement Screen Scores and Athletic Performance in Adolescents: A Systematic Review. Sports 2022, 10, 28. [Google Scholar] [CrossRef]
- Campa, F.; Silva, A.M.; Talluri, J.; Matias, C.N.; Badicu, G.; Toselli, S. Somatotype and Bioimpedance Vector Analysis: A New Target Zone for Male Athletes. Sustainability 2020, 12, 4365. [Google Scholar] [CrossRef]
- Santos, D.A.; Dawson, J.A.; Matias, C.N.; Rocha, P.M.; Minderico, C.S.; Allison, D.B.; Sardinha, L.B.; Silva, A.M. Reference values for body composition and anthropometric measurements in athletes. PLoS ONE 2014, 9, e0097846. [Google Scholar] [CrossRef]
- Adão, T.; Lameira, G.; dos Santos, J.; Palha, F. Technical error of measurement in anthropometry. Rev. Bras. Med. Esporte 2005, 11, 81–85. [Google Scholar] [CrossRef]
- Carter, J.E.L. The Heath-Carter Anthropometric Somatotype; San Diego State University: San Diego, CA, USA, 2002. [Google Scholar]
- Ross, W.D.; Marfell-Jones, M.J. Kinanthropometry; Macdougal, J., Wenger, H., Green, H.J., Eds.; Human Kinetics, Inc.: Champaign, IL, USA, 1991. [Google Scholar]
- Peterson, M.J.; Czerwinski, S.A.; Siervogel, R.M. Development and validation of skinfold-thickness prediction equations with a 4-compartment model. Am. J. Clin. Nutr. 2003, 77, 1186–1191. [Google Scholar] [CrossRef] [PubMed]
- Heymsfield, S.B.; Waki, M.; Kehayias, J.; Lichtman, S.; Dilmanian, F.A.; Kamen, Y.; Wang, J.; Pierson, R.N. Chemical and elemental analysis of humans in vivo using improved body composition models. Am. J. Physiol. 1991, 261, E190–E198. [Google Scholar] [CrossRef] [PubMed]
- Lee, R.C.; Wang, Z.; Heo, M.; Ross, R.; Janssen, I.; Heymsfield, S.B. Total-body skeletal muscle mass: Development and cross-validation of anthropometric prediction models. Am. J. Clin. Nutr. 2000, 72, 796–803. [Google Scholar] [CrossRef] [PubMed]
- Bongiovanni, T.; Trecroci, A.; Cavaggioni, L.; Rossi, A.; Perri, E.; Pasta, G.; Iaia, F.M.; Alberti, G. Importance of anthropometric features to predict physical performance in elite youth soccer: A machine learning approach. Res. Sports Med. 2021, 29, 213–224. [Google Scholar] [CrossRef] [PubMed]
- Slimani, M.; Nikolaidis, P.T. Anthropometric and physiological characteristics of male soccer players according to their competitive level, playing position and age group: A systematic review. J. Sports Med. Phys. Fitness 2019, 59, 141–163. [Google Scholar] [CrossRef] [PubMed]
- Toselli, S.; Campa, F. Anthropometry and Functional Movement Patterns in Elite Male Volleyball Players of Different Competitive Levels. J. Strength Cond. Res. 2018, 32, 2601–2611. [Google Scholar] [CrossRef] [PubMed]
- Hartmann Nunes, R.F.; de Souza Bezerra, E.; Orssatto, L.B.; Moreno, Y.M.; Loturco, I.; Duffield, R.; Silva, D.A.; Guglielmo, L.G. Assessing body composition in rugby players: Agreement between different methods and association with physical performance. J. Sports Med. Phys. Fitness 2020, 60, 733–742. [Google Scholar] [CrossRef]
- Leao, C.; Camoes, M.; Clemente, F.M.; Nikolaidis, P.T.; Lima, R.; Bezerra, P.; Rosemann, T.; Knechtle, B. Anthropometric Profile of Soccer Players as a Determinant of Position Specificity and Methodological Issues of Body Composition Estimation. Int. J. Environ. Res. Public Health 2019, 16, 2386. [Google Scholar] [CrossRef]
- Campa, F.; Levi Micheli, M.; Pompignoli, M.; Cannataro, R.; Gulisano, M.; Toselli, S.; Greco, G.; Coratella, G. The Influence of Menstrual Cycle on Bioimpedance Vector Patterns, Performance, and Flexibility in Elite Soccer Players. Int. J. Sports Physiol. Perform. 2021, 17, 58–66. [Google Scholar] [CrossRef]
- Oliveira, R.; Francisco, R.; Fernandes, R.; Martins, A.; Nobari, H.; Clemente, F.M.; Brito, J.P. In-Season Body Composition Effects in Professional Women Soccer Players. Int. J. Environ. Res. Public Health 2021, 18, 12023. [Google Scholar] [CrossRef]
- Clemente, F.M.; Ramirez-Campillo, R.; Sarmento, H. Detrimental Effects of the Off-Season in Soccer Players: A Systematic Review and Meta-analysis. Sports Med. 2021, 51, 795–814. [Google Scholar] [CrossRef] [PubMed]
- Campa, F.; Bongiovanni, T.; Trecroci, A.; Rossi, A.; Greco, G.; Pasta, G.; Coratella, G. Effects of the COVID-19 Lockdown on Body Composition and Bioelectrical Phase Angle in Serie A Soccer Players: A Comparison of Two Consecutive Seasons. Biology 2021, 10, 1175. [Google Scholar] [CrossRef] [PubMed]
- Silva, J.R.; Brito, J.; Akenhead, R.; Nassis, G.P. The Transition Period in Soccer: A Window of Opportunity. Sports Med. 2016, 46, 305–313. [Google Scholar] [CrossRef] [PubMed]
- Campa, F.; Bongiovanni, T.; Rossi, A.; Cerullo, G.; Casolo, A.; Martera, G.; Trecroci, A.; Moro, T.; Paoli, A. Athletic bioimpedance-based equations underestimate fat free mass components in male elite soccer players: Development and validation of new soccer-specific predictive models. J. Transl. Med. 2023, 21, 912. [Google Scholar] [CrossRef] [PubMed]
- Sebastiá-Rico, J.; Soriano, J.M.; González-Gálvez, N.; Martínez-Sanz, J.M. Body Composition of Male Professional Soccer Players Using Different Measurement Methods: A Systematic Review and Meta-Analysis. Nutrients 2023, 15, 1160. [Google Scholar] [CrossRef] [PubMed]
- Campa, F.; Matias, C.N.; Moro, T.; Cerullo, G.; Casolo, A.; Teixeira, F.J.; Paoli, A. Methods over Materials: The Need for Sport-Specific Equations to Accurately Predict Fat Mass Using Bioimpedance Analysis or Anthropometry. Nutrients 2023, 15, 278. [Google Scholar] [CrossRef] [PubMed]
- Micheli, M.L.; Pagani, L.; Marella, M.; Gulisano, M.; Piccoli, A.; Angelini, F.; Burtscher, M.; Gatterer, H. Bioimpedance and impedance vector patterns as predictors of league level in male soccer players. Int. J. Sports Physiol. Perform. 2014, 9, 532–539. [Google Scholar] [CrossRef]
- Giorgi, A.; Vicini, M.; Pollastri, L.; Lombardi, E.; Magni, E.; Andreazzoli, A.; Orsini, M.; Bonifazi, M.; Lukaski, H.; Gatterer, H. Bioimpedance patterns and bioelectrical impedance vector analysis (BIVA) of road cyclists. J. Sports Sci. 2018, 36, 2608–2613. [Google Scholar] [CrossRef]
- Mauro, M.; Toselli, S.; De Giorgi, S.; Heinrich, K.M.; Di Gioia, G.; Moretti, B.; Greco, G.; Cataldi, S.; Moretti, L.; Fischetti, F. New regression models to predict fat mass in intermediate-level male padel players. Heliyon 2023, 9, e18719. [Google Scholar] [CrossRef]
- Slimani, M.; Znazen, H.; Hammami, A.; Bragazzi, N.L. Comparison of body fat percentage of male soccer players of different competitive levels, playing positions and age groups: A meta-analysis. J. Sports Med. Phys. Fitness 2018, 58, 857–866. [Google Scholar] [CrossRef]
- Mascherini, G.; Gatterer, H.; Lukaski, H.; Burtscher, M.; Galanti, G. Changes in hydration, body-cell mass and endurance performance of professional soccer players through a competitive season. J. Sports Med. Phys. Fitness 2015, 55, 749–755. [Google Scholar]
- Wik, E.H. Growth, maturation and injuries in high-level youth football (soccer): A mini review. Front. Sports Act. Living 2022, 4, 975900. [Google Scholar] [CrossRef]
- Radnor, J.M.; Staines, J.; Bevan, J.; Cumming, S.P.; Kelly, A.L.; Lloyd, R.S.; Oliver, J.L. Maturity Has a Greater Association than Relative Age with Physical Performance in English Male Academy Soccer Players. Sports 2021, 9, 171. [Google Scholar] [CrossRef]
- Abarghoueinejad, M.; Baxter-Jones, A.D.G.; Gomes, T.N.; Barreira, D.; Maia, J. Motor Performance in Male Youth Soccer Players: A Systematic Review of Longitudinal Studies. Sports 2021, 9, 53. [Google Scholar] [CrossRef]


| Soccer Players | General Population | One-Way ANOVA | |||
|---|---|---|---|---|---|
| Variable | Males (N = 184) | Females (N = 173) | Males (N = 188) | Females (N = 175) | F, p-Value |
| Age (y) | 24.3 ± 4.3 | 25.2 ± 5.1 | 24.2 ± 4.8 | 25.0 ± 5.1 | 1.7, p = 0.16 |
| Stature (m) | 183.9 ± 6.2 #,§,^ | 169.2 ± 6.1 *,§,^ | 177.4 ± 6.5 *,#,^ | 165.8 ± 6.8 *,#,§ | 282.9, p < 0.01 |
| Body mass (kg) | 79.2 ± 12.1 #,§,^ | 62.4 ± 6.6 *,§ | 75.9 ± 8.9 *,#,^ | 62.2 ± 8.6 *,§ | 222.1, p < 0.01 |
| Body mass index (kg/m2) | 23.3 ± 1.3 #,§,^ | 21.8 ± 1.7 *,§,^ | 24.0 ± 2.1 *,#,^ | 22.5 ± 2.3 *,#,§ | 51.4, p < 0.01 |
| Circumferences | |||||
| Relaxed arm (cm) | 29.0 ± 1.8 #,§,^ | 26.4 ± 1.8 *,§,^ | 30.8 ± 2.9 *,#,^ | 27.1 ± 2.4 *,#,§ | 137.3, p < 0.01 |
| Contracted arm (cm) | 32.5 ± 1.8 #,§,^ | 28.0 ± 2.0 *,§ | 33.3 ± 3.0 *,#,^ | 28.0 ± 3.3 *,§ | 212.6, p < 0.01 |
| Waist (cm) | 75.9 ± 6.4 #,§,^ | 69.2 ± 3.8 *,§ | 79.7 ± 6.1 *,#,^ | 70.6 ± 5.9 *,§ | 172.2, p < 0.01 |
| Hip (cm) | 93.4 ± 7.9 §,^ | 94.0 ± 4.8 §,^ | 95.8 ± 5.6 *,# | 97.3 ± 6.9 *,# | 14.7, p < 0.01 |
| Thigh (cm) | 54.8 ± 2.8 #,^ | 53.6 ± 3.6 *,§ | 54.8 ± 4.2 #,^ | 52.9 ± 3.8 *,§ | 156.8, p < 0.01 |
| Calf (cm) | 37.5 ± 2.0 #,^ | 35.9 ± 2.2 *,§ | 37.0 ± 2.3 #,^ | 35.6 ± 2.6 *,§ | 20.68, p < 0.01 |
| Skinfolds (SKF) | |||||
| Biceps (mm) | 2.9 ± 0.5 #,§,^ | 4.4 ± 1.7 *,^ | 4.3 ± 1.9 *,#,^ | 6.9 ± 3.5 *,#,§ | 102.0, p < 0.01 |
| Triceps (mm) | 6.5 ± 2.1 #,§,^ | 12.6 ± 3.5 *,§,^ | 10.9 ± 2.9 *,#,^ | 19.6 ± 6.4 *,#,§ | 319.8, p < 0.01 |
| Subscapular (mm) | 7.5 ± 1.3 #,§,^ | 9.4 ± 2.8 *,§,^ | 12.7 ± 4.8 *,#,^ | 14.7 ± 5.8 *,#,§ | 114.1, p < 0.01 |
| Suprailiac (mm) | 6.6 ± 2.3 #,§,^ | 9.8 ± 4.7 *,§,^ | 13.9 ± 6.7 *,# | 15.4 ± 7.1 *,# | 92.8, p < 0.01 |
| Supraspinal (mm) | 6.2 ± 2.1 #,§,^ | 8.3 ± 3.2 *,§,^ | 13.6 ± 6.2 *,#,^ | 15.5 ± 7.1 *,#,§ | 123.6, p < 0.01 |
| Abdominal (mm) | 8.7 ± 2.8 #,§,^ | 13.6 ± 5.3 *,§,^ | 20.9 ± 9.3 *,# | 20.2 ± 7.8 *,# | 132.5, p < 0.01 |
| Thigh (mm) | 8.6 ± 2.9 #,§,^ | 19.4 ± 5.0 *,§,^ | 15.5 ± 6.3 *,#,^ | 26.1 ± 8.4 *,#,§ | 263.7, p < 0.01 |
| Calf (mm) | 4.1 ± 1.4 #,§,^ | 7.8 ± 4.9 *,^ | 8.4 ± 4.6 *,^ | 16.3 ± 7.2 *,#,§ | 186.0, p < 0.01 |
| Sum of the 8 SKF (mm) | 51.3 ± 9.4 #,§,^ | 81.8 ± 19.7 *,§,^ | 100.4 ± 31.7 *,#,^ | 133.4 ± 43.7 *,#,§ | 239.8, p < 0.01 |
| Breadths | |||||
| Humerus (cm) | 6.7 ± 0.6 #,§,^ | 6.1 ± 0.5 *,§ | 6.8 ± 0.6 *,#,^ | 6.2 ± 0.5 *,§ | 74.5, p < 0.01 |
| Femur (cm) | 9.8 ± 1.0 # | 9.3 ± 0.8 *,§,^ | 9.9 ± 0.7 # | 9.7 ± 1.0 # | 15.3, p < 0.01 |
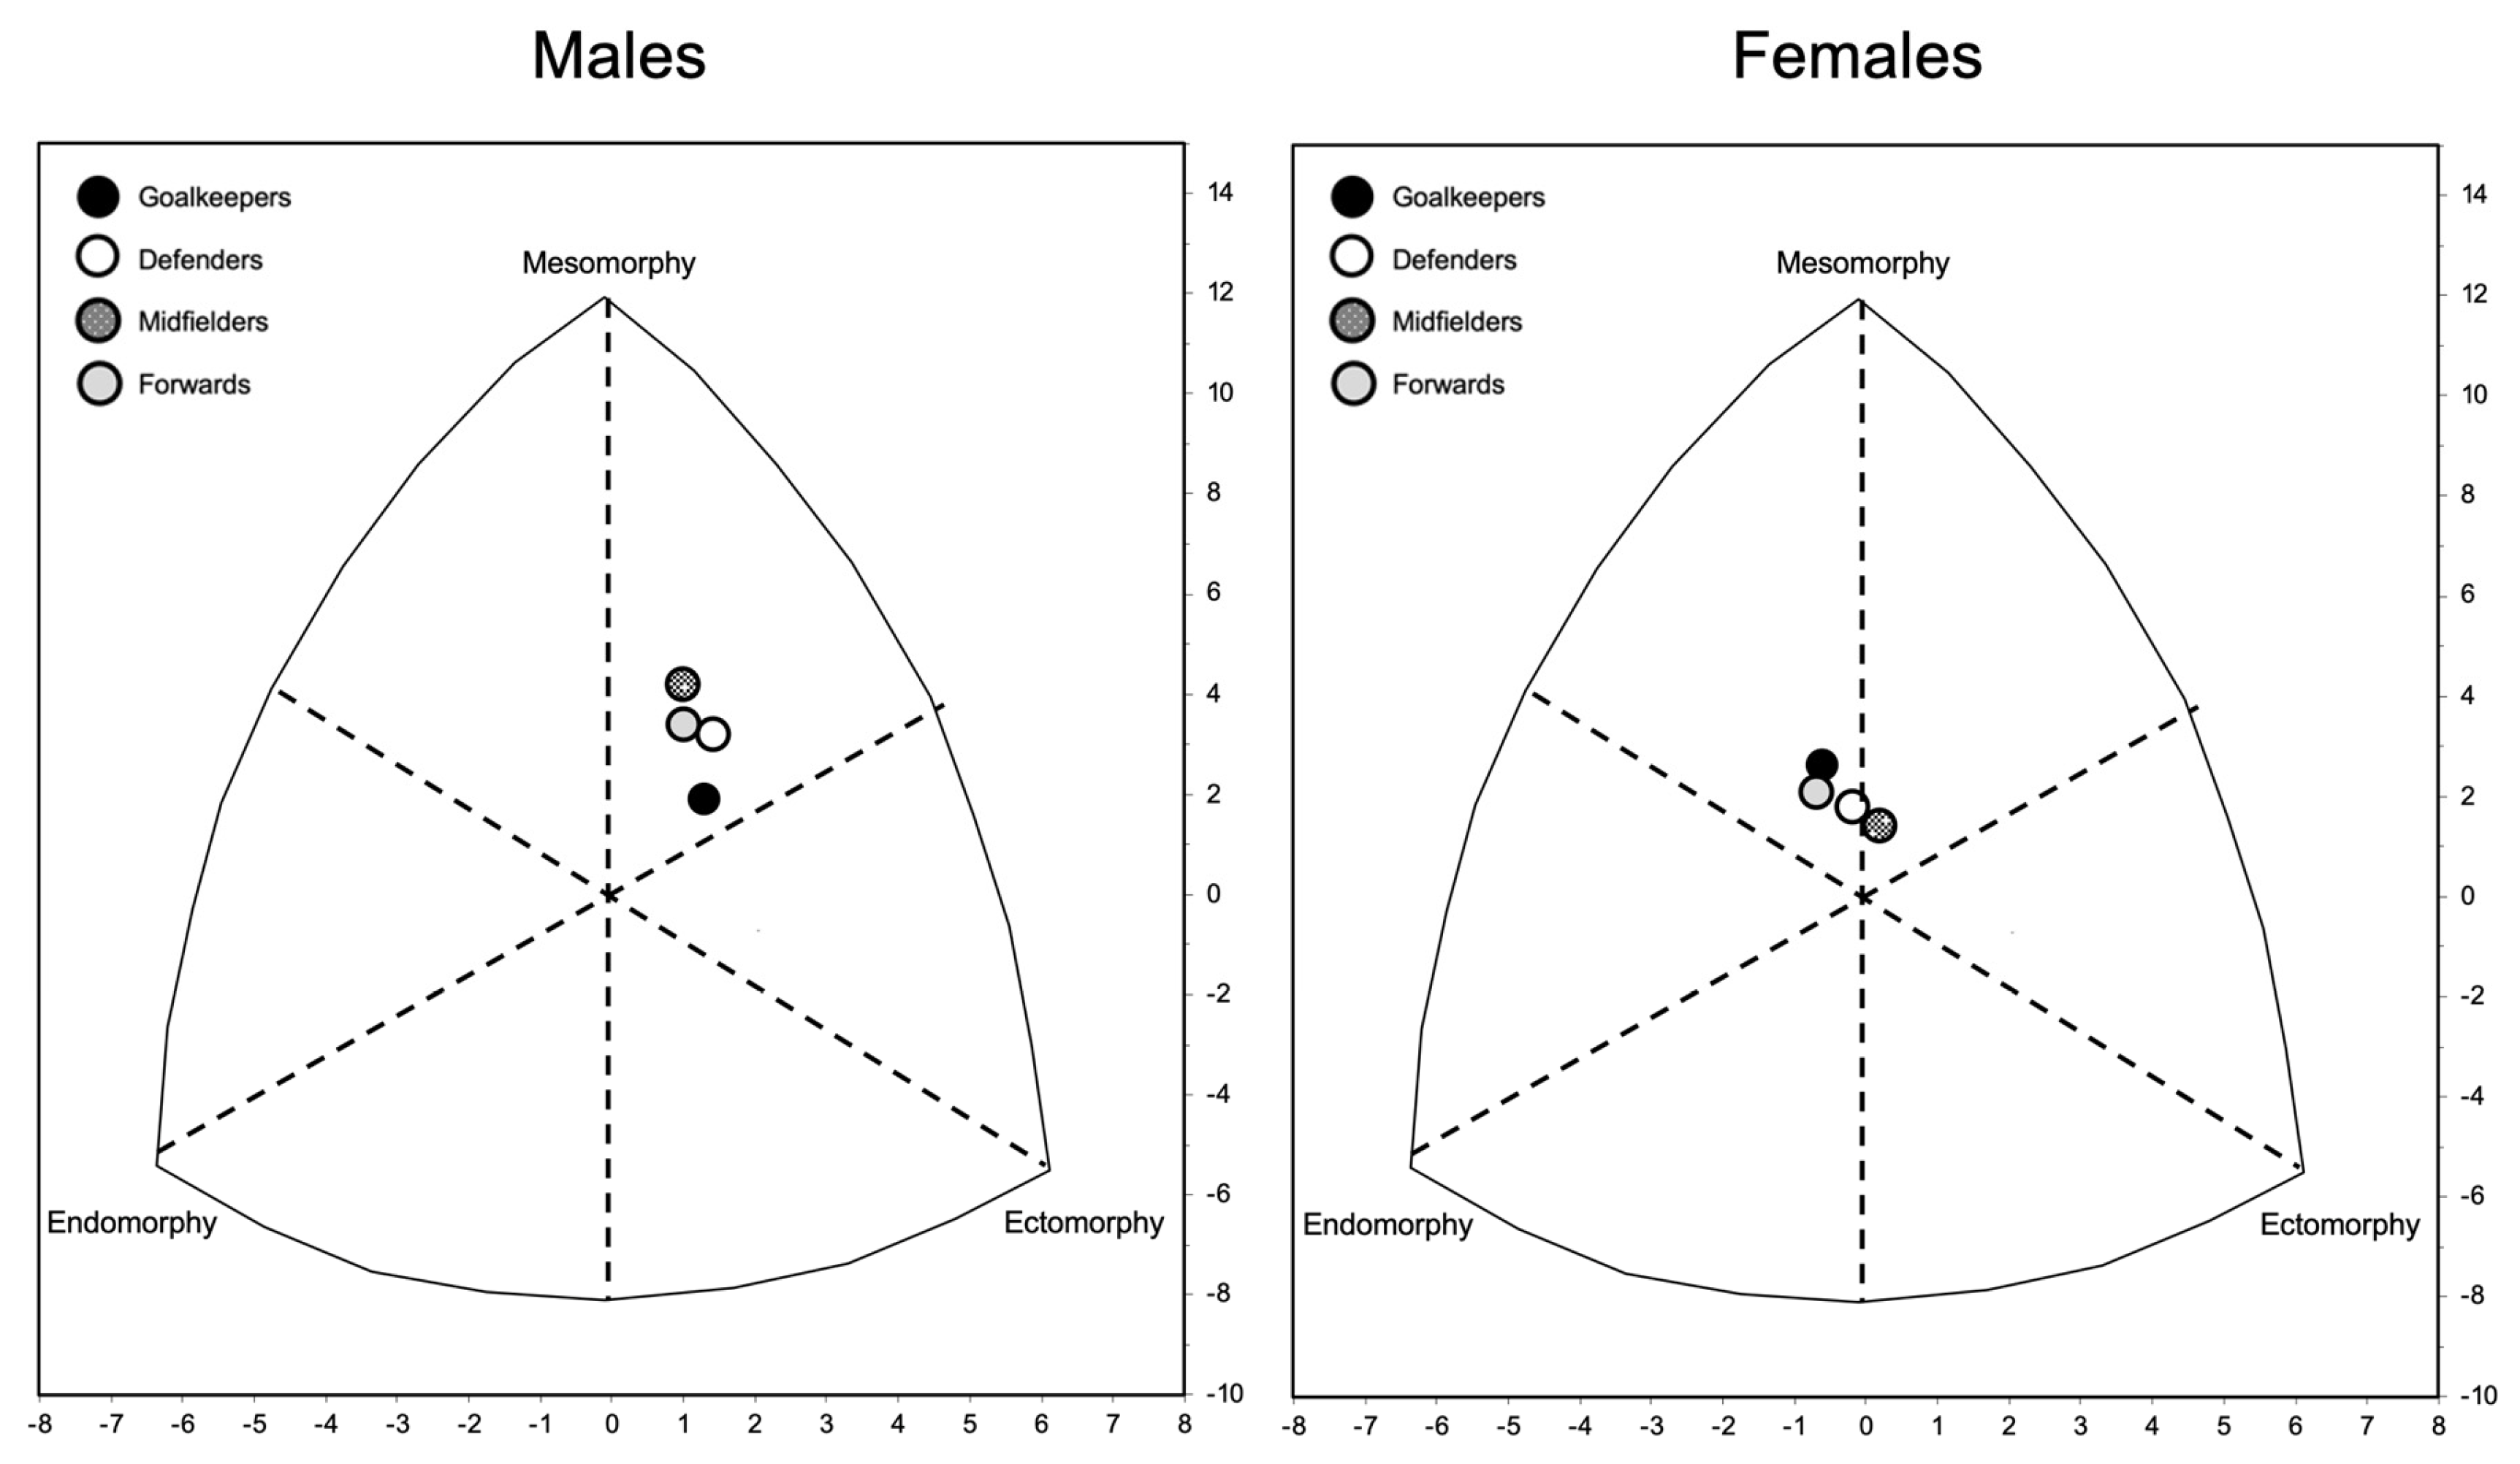
| Somatotype | |||||
| Endomorphy | 1.8 ± 0.5 #,§,^ | 3.2 ± 0.9 *,§,^ | 3.6 ± 1.7 *,#,^ | 4.9 ± 1.5 *,#,§ | 154.6, p < 0.01 |
| Mesomorphy | 3.8 ± 1.5 § | 3.3 ± 2.6 §,^ | 4.9 ± 1.2 *,# | 4.3 ± 1.3 # | 26.6, p < 0.01 |
| Ectomorphy | 2.8 ± 0.8 §,^ | 2.7 ± 0.9 §,^ | 2.2 ± 1.0 *,# | 2.1 ± 1.0 *,# | 16.0, p < 0.01 |
| Males (N = 24) | Females (N = 22) | |||||
|---|---|---|---|---|---|---|
| Variable | 15th (95% CI) | 50th (95% CI) | 85th (95% CI) | 15th (95% CI) | 50th (95% CI) | 85th (95% CI) |
| Stature (cm) | 188.4 (188.0–191.4) | 193.0 (190.0–194.0) | 194.8 (193.0–195.0) | 165.0 (159.0–168.0) | 168.5 (167.0–172.0) | 176.3 (169.8–180.0) |
| Body mass (kg) | 79.5 (79.2–85.9) | 85.9 (80.6–87.6) | 91.8 (85.9–92.8) | 56.6 (51.8–59.1) | 61.3 (57.6–72.1) | 72.5 (66.8–72.7) |
| Circumferences | ||||||
| Relaxed arm (cm) | 28.0 (28.0–30.0) | 30.0 (28.0–33.0) | 33.0 (31.6–33.0) | 24.3 (24.0–26.3) | 27.0 (26.0–28.8) | 29.0 (28.4–29.5) |
| Contracted arm (cm) | 30.7 (30.5–33.2) | 33.2 (31.4–35.9) | 36.2 (34.9–36.3) | 26.3 (26.0–28.3) | 28.8 (27.5–30.3) | 30.6 (30.0–31.5) |
| Waist (cm) | 75.0 (75.0–76.6) | 79.0 (75.0–79.0) | 80.6 (78.4–81.0) | 65.0 (63.0–66.5) | 67.5 (65.0–70.0) | 73.1 (69.6–76.0) |
| Hip (cm) | 92.2 (92.0–93.0) | 93.0 (93.0–98.0) | 99.6 (94.6–100.0) | 90.0 (85.0–92.7) | 94.5 (91.0–96.5) | 100.7 (95.8–102.1) |
| Thigh (cm) | 48.4 (48.0–55.0) | 55.0 (50.0–58.0) | 59.6 (55.8–60.0) | 50.0 (49.0–52.5) | 54.0 (51.0–68.9) | 57.2 (55.8–58.0) |
| Calf (cm) | 34.2 (34.0–36.2) | 37.0 (35.0–39.0) | 39.0 (38.4–39.0) | 33.3 (31.0–35.0) | 35.0 (34.6–38.0) | 39.5 (37.5–40.5) |
| Skinfolds (SKF) | ||||||
| Biceps (mm) | 2.2 (2.2–2.6) | 2.6 (2.4–3.0) | 3.3 (2.9–3.4) | 3.0 (3.0–3.3) | 3.7 (3.2–4.6) | 5.0 (4.3–5.0) |
| Triceps (mm) | 4.8 (4.8–5.8) | 9.0 (4.8–12.0) | 12.8 (9.0–13.0) | 9.3 (7.8–10.6) | 12.8 (10.0–13.4) | 13.9 (13.0–17.0) |
| Subscapular (mm) | 6.4 (6.4–7.1) | 7.4 (6.4–10.4) | 11.2 (9.5–11.4) | 6.3 (5.0–8.0) | 8.2 (8.0–9.0) | 11.3 (9.0–13.0) |
| Suprailiac (mm) | 3.9 (3.6–5.4) | 5.4 (5.0–8.2) | 8.8 (7.3–9.0) | 6.0 (4.6–6.3) | 7.0 (6.0–9.5) | 10.8 (8.7–13.0) |
| Supraspinal (mm) | 5.4 (5.2–6.5) | 7.0 (6.0–8.0) | 12.6 (7.0–13.8) | 5.0 (4.6–6.0) | 6.5 (5.5–8.5) | 11.3 (7.8–13.0) |
| Abdominal (mm) | 6.9 (6.6–8.4) | 9.0 (8.0–11.0) | 14.2 (9.8–15.0) | 6.9 (5.4–8.7) | 10.5 (8.1–13.0) | 16.3 (12.0–20.0) |
| Thigh (mm) | 6.2 (5.6–11.0) | 11.0 (8.6–13.0) | 13.8 (12.6–14.0) | 11.8 (10.0–16.0) | 17.0 (16.0–19.0) | 24.8 (17.8–25.0) |
| Calf (mm) | 0.8 (0.3–3.0) | 3.0 (2.6–5.0) | 6.3 (4.6–6.6) | 3.1 (3.0–3.8) | 4.0 (3.2–5.0) | 5.2 (4.8–12.0) |
| Sum of the 8 SKF (mm) | 39.9 (37.6–53.3) | 59.0 (49.2–69.7) | 69.9 (65.7–70.0) | 58.2 (53.0–64.1) | 68.8 (62.4–82.2) | 92.8 (78.8–97.5) |
| Breadths | ||||||
| Humerus (cm) | 6.0 (5.9–7.0) | 7.0 (6.4–7.5) | 7.9 (7.2–8.0) | 5.4 (5.3–5.6) | 5.9 (5.6–6.2) | 6.5 (6.0–7.0) |
| Femur (cm) | 8.9 (8.8–9.6) | 10.0 (9.2–10.4) | 10.4 (10.1–10.5) | 8.8 (7.0–9.0) | 9.4 (9.0–9.8) | 10.4 (9.8–10.6) |
| Somatotype | ||||||
| Endomorphy | 1.1 (1.0–1.5) | 2.1 (1.3–2.6) | 2.8 (2.3–2.9) | 2.1 (1.9–2.6) | 2.9 (2.5–3.1) | 3.6 (3.0–4.3) |
| Mesomorphy | 1.3 (0.9–3.2) | 3.7 (2.9–4.2) | 4.3 (3.9–4.3) | 1.9 (1.6–3.6) | 3.9 (3.3–4.9) | 5.3 (4.4–5.5) |
| Ectomorphy | 2.8 (2.8–3.4) | 3.4 (2.9–3.6) | 3.7 (3.4–3.8) | 1.8 (0.9–2.3) | 2.6 (2.2–3.2) | 3.6 (3.0–3.8) |
| Males (N = 52) | Females (N = 50) | |||||
|---|---|---|---|---|---|---|
| Variable | 15th (95% CI) | 50th (95% CI) | 85th (95% CI) | 15th (95% CI) | 50th (95% CI) | 85th (95% CI) |
| Stature (cm) | 179.0 (170.4–181.0) | 186.0 (182.0–188.0) | 192.5 (188.0–195.0) | 163.1 (161.0–165.0) | 168.0 (167.0–171.4) | 175.0 (174.0–177.2) |
| Body mass (kg) | 74.2 (69.7–76.6) | 79.8 (77.6–83.7) | 87.1 (83.8–89.0) | 55.6 (54.1–56.5) | 61.5 (59.3–63.2) | 68.7 (65.9–70.3) |
| Circumferences | ||||||
| Relaxed arm (cm) | 28.0 (27.0–28.0) | 29.0 (28.0–29.0) | 31.0 (30.0–33.0) | 24.0 (23.0–25.0) | 26.0 (25.0–26.0) | 27.0 (26.2–28.0) |
| Contracted arm (cm) | 30.7 (30.2–31.2) | 31.7 (31.2–32.2) | 33.8 (32.7–35.7) | 25.4 (24.9–26.5) | 27.2 (26.8–27.8) | 28.9 (28.1–30.0) |
| Waist (cm) | 74.0 (72.0–75.3) | 77.0 (76.0–77.4) | 78.5 (78.0–80.0) | 65.0 (64.0–66.0) | 68.0 (67.0–69.0) | 71.4 (71.0–75.2) |
| Hip (cm) | 91.5 (89.0–92.5) | 94.0 (93.0–95.0) | 96.5 (95.0–98.0) | 89.0 (88.6–91.0) | 94.0 (92.5–96.0) | 98.0 (97.0–100.0) |
| Thigh (cm) | 52.0 (51.0–54.0) | 54.0 (54.0–55.0) | 57.0 (55.5–58.0) | 50.0 (49.4–51.0) | 53.5 (52.0–55.0) | 56.0 (55.2–58.0) |
| Calf (cm) | 35.5 (34.0–36.0) | 38.0 (36.0–38.0) | 39.5 (38.5–40.0) | 33.9 (33.0–34.2) | 36.0 (35.0–37.0) | 38.2 (37.5–39.0) |
| Skinfolds (SKF) | ||||||
| Biceps (mm) | 2.6 (2.6–2.8) | 3.0 (2.8–3.0) | 3.1 (3.0–3.4) | 2.8 (2.4–3.0) | 3.4 (3.0–3.8) | 5.0 (4.3–6.0) |
| Triceps (mm) | 4.7 (4.0–5.0) | 5.4 (5.0–6.0) | 6.4 (6.1–8.6) | 8.6 (7.8–11.0) | 12.0 (11.8–13.0) | 15.0 (13.4–16.0) |
| Subscapular (mm) | 6.0 (5.6–6.5) | 7.0 (6.6–7.8) | 8.1 (7.8–9.6) | 7.1 (6.4–7.8) | 9.0 (8.2–9.2) | 11.0 (10.0–12.0) |
| Suprailiac (mm) | 4.4 (4.0–5.0) | 5.6 (5.0–6.6) | 8.2 (6.6–11.0) | 5.2 (4.8–6.0) | 8.0 (7.0–8.2) | 10.1 (9.2–14.0) |
| Supraspinal (mm) | 4.8 (4.4–5.4) | 6.0 (5.8–7.0) | 10.0 (7.0–12.6) | 5.5 (5.4–6.5) | 8.0 (7.0–9.0) | 10.4 (9.8–13.2) |
| Abdominal (mm) | 6.4 (4.0–7.2) | 8.0 (7.2–9.6) | 10.5 (9.6–15.0) | 9.0 (7.5–10.0) | 12.0 (12.0–14.2) | 18.0 (15.2–19.0) |
| Thigh (mm) | 6.0 (4.4–7.0) | 8.0 (7.6–10.0) | 11.0 (10.3–13.0) | 14.0 (13.2–15.8) | 18.0 (17.0–21.0) | 24.2 (22.0–28.0) |
| Calf (mm) | 3.1 (3.0–3.3) | 3.6 (3.4–3.8) | 4.4 (3.9–4.4) | 3.0 (3.0–3.2) | 5.0 (3.6–5.6) | 13.6 (11.0–16.0) |
| Sum of the 8 SKF (mm) | 41.8 (40.4–44.1) | 49.0 (44.2–52.4) | 57.7 (52.6–61.2) | 62.8 (59.4–68.8) | 78.2 (72.6–84.2) | 98.4 (88.8–103.4) |
| Breadths | ||||||
| Humerus (cm) | 6.0 (5.5–6.4) | 7.0 (6.5–7.2) | 7.4 (7.3–7.5) | 5.5 (5.3–5.6) | 6.0 (6.0–6.2) | 6.8 (6.3–7.0) |
| Femur (cm) | 8.9 (6.5–9.0) | 9.5 (9.0–10.0) | 10.5 (10.0–11.0) | 8.6 (8.5–8.9) | 9.2 (9.0–9.5) | 10.1 (10.0–10.5) |
| Somatotype | ||||||
| Endomorphy | 1.3 (1.2–1.4) | 1.6 (1.4–1.7) | 1.9 (1.8–2.4) | 2.3 (2.0–2.5) | 2.9 (2.8–3.2) | 3.5 (3.3–3.8) |
| Mesomorphy | 2.4 (1.0–3.3) | 3.9 (3.7–4.3) | 5.3 (4.6–5.8) | 2.3 (1.6–3.1) | 3.9 (3.4–4.4) | 5.0 (4.5–5.5) |
| Ectomorphy | 2.1 (1.2–2.4) | 3.0 (2.6–3.3) | 3.6 (3.3–3.6) | 1.8 (1.6–2.3) | 2.8 (2.6–2.9) | 3.8 (3.2–3.9) |
| Males (N = 53) | Females (N = 43) | |||||
|---|---|---|---|---|---|---|
| Variable | 15th (95% CI) | 50th (95% CI) | 85th (95% CI) | 15th (95% CI) | 50th (95% CI) | 85th (95% CI) |
| Stature (cm) | 172.9 (170.5–177.7) | 179.0 (178.0–184.0) | 187.0 (184.1–190.7) | 164.7 (158.9–167.2) | 171.5 (167.0–173.0) | 175.0 (172.7–176.7) |
| Body mass (kg) | 67.8 (63.3–71.9) | 74.8 (72.0–78.5) | 83.4 (78.6–86.3) | 56.7 (55.4–58.7) | 60.8 (58.6–62.5) | 66.4 (62.1–73.7) |
| Circumferences | ||||||
| Relaxed arm (cm) | 27.0 (26.9–29.0) | 30.0 (29.0–30.0) | 31.0 (30.0–32.1) | 25.0 (24.0–25.7) | 26.0 (25.2–26.0) | 26.9 (26.0–29.6) |
| Contracted arm (cm) | 30.2 (29.7–31.8) | 32.6 (31.8–32.9) | 33.6 (32.9–34.9) | 26.0 (25.5–26.5) | 27.2 (26.5–27.9) | 28.5 (27.8–31.0) |
| Waist (cm) | 70.0 (69.0–75.0) | 77.0 (75.0–78.0) | 79.0 (78.0–80.4) | 65.2 (61.6–67.3) | 70.0 (67.0–71.2) | 73.4 (71.1–79.3) |
| Hip (cm) | 89.9 (85.9–91.9) | 93.0 (92.0–94.0) | 95.1 (94.0–101.1) | 88.5 (87.5–91.0) | 93.0 (90.4–94.3) | 97.9 (94.3–102.1) |
| Thigh (cm) | 49.9 (48.0–53.0) | 56.0 (53.0–57.0) | 58.0 (57.0–58.2) | 49.2 (34.9–50.7) | 52.0 (50.0–53.0) | 55.5 (52.5–59.1) |
| Calf (cm) | 34.0 (33.9–36.0) | 38.0 (36.0–39.0) | 39.0 (39.0–40.0) | 33.9 (32.0–34.3) | 35.2 (34.3–36.0) | 37.7 (36.0–39.5) |
| Skinfolds (SKF) | ||||||
| Biceps (mm) | 2.8 (2.8–3.0) | 3.0 (3.0–3.4) | 3.6 (3.4–3.7) | 3.0 (3.0–3.4) | 4.0 (3.2–4.4) | 5.0 (4.4–6.4) |
| Triceps (mm) | 4.9 (4.7–6.4) | 7.0 (6.4–7.6) | 9.0 (7.6–11.0) | 9.4 (7.3–10.4) | 11.0 (7.0–8.5) | 14.1 (12.3–19.2) |
| Subscapular (mm) | 5.9 (5.6–6.6) | 7.4 (6.6–8.0) | 8.3 (8.2–9.4) | 6.7 (5.6–7.3) | 8.0 (7.0–8.5) | 12.1 (8.5–18.8) |
| Suprailiac (mm) | 4.9 (4.2–5.0) | 5.6 (5.0–6.4) | 7.0 (6.4–12.3) | 5.8 (4.8–6.9) | 8.2 (6.8–9.0) | 15.0 (9.0–25.4) |
| Supraspinal (mm) | 5.0 (4.7–5.9) | 7.0 (5.4–8.0) | 9.7 (8.1–12.1) | 5.2 (4.2–6.0) | 7.0 (6.0–8.2) | 9.7 (8.2–20.6) |
| Abdominal (mm) | 6.2 (5.1–7.0) | 9.2 (8.0–11.0) | 12.0 (11.1–13.0) | 7.3 (5.9–10.0) | 11.0 (10.0–12.0) | 19.4 (12.0–32.4) |
| Thigh (mm) | 6.2 (5.1–7.0) | 8.6 (7.0–11.0) | 12.2 (11.0–14.1) | 13.6 (13.0–15.3) | 18.5 (15.0–20.0) | 22.7 (20.0–26.3) |
| Calf (mm) | 3.2 (3.0–3.6) | 3.6 (3.6–4.4) | 5.6 (4.3–5.8) | 3.7 (3.0–4.4) | 6.0 (4.4–9.0) | 10.7 (8.7–17.1) |
| Sum of the 8 SKF (mm) | 44.7 (40.9–49.3) | 54.6 (49.4–59.0) | 62.8 (59.0–68.1) | 64.7 (50.3–71.1) | 72.0 (71.0–81.7) | 97.5 (78.5–150.2) |
| Breadths | ||||||
| Humerus (cm) | 6.0 (5.5–6.5) | 6.9 (6.5–7.0) | 7.2 (7.0–7.3) | 5.6 (5.4–6.0) | 6.1 (6.0–6.2) | 6.5 (6.2–6.6) |
| Femur (cm) | 7.5 (6.9–9.0) | 9.3 (9.0–10.0) | 10.6 (10.0–11.1) | 8.7 (7.9–9.0) | 9.1 (8.9–9.6) | 10.2 (9.6–10.4) |
| Somatotype | ||||||
| Endomorphy | 1.4 (1.3–1.6) | 1.7 (1.6–2.0) | 2.2 (2.0–2.7) | 2.2 (1.7–2.7) | 2.9 (2.7–3.0) | 4.2 (3.0–5.9) |
| Mesomorphy | 2.3 (1.4–3.4) | 4.3 (3.4–4.9) | 5.9 (4.9–5.9) | 2.4 (2.0–3.1) | 3.5 (3.1–3.9) | 4.9 (3.9–5.2) |
| Ectomorphy | 1.8 (1.8–1.8) | 2.7 (2.5–2.9) | 3.9 (2.9–4.1) | 1.7 (1.4–2.7) | 3.1 (2.6–3.2) | 3.9 (3.2–4.1) |
| Males (N = 55) | Females (N = 48) | |||||
|---|---|---|---|---|---|---|
| Variable | 15th (95% CI) | 50th (95% CI) | 85th (95% CI) | 15th (95% CI) | 50th (95% CI) | 85th (95% CI) |
| Stature (cm) | 177.2 (172.0–183.0) | 185.5 (181.5–187.0) | 190.4 (186.0–192.0) | 163.9 (154.0–166.9) | 169.8 (167.5–172.8) | 177.2 (173.5–183.0) |
| Body mass (kg) | 75.1 (59.2–76.5) | 82.3 (76.5–86.4) | 91.4 (84.3–93.6) | 55.5 (51.1–61.7) | 65.3 (62.3–68.1) | 73.9 (68.4–80.2) |
| Circumferences | ||||||
| Relaxed arm (cm) | 28.0 (25.0–29.6) | 30.0 (29.0–32.0) | 33.3 (31.0–35.0) | 25.0 (24.0–26.0) | 27.3 (26.0–28.3) | 29.0 (28.5–30.0) |
| Contracted arm (cm) | 30.9 (27.4–32.5) | 33.0 (32.0–34.7) | 35.9 (34.1–37.8) | 26.9 (26.0–27.7) | 29.4 (27.8–30.0) | 30.8 (30.0–32.3) |
| Waist (cm) | 72.0 (71.0–76.6) | 79.0 (75.0–80.0) | 81.5 (79.3–84.5) | 66.0 (65.0–68.0) | 70.0 (69.0–71.8) | 74.0 (72.1–76.0) |
| Hip (cm) | 92.0 (87.0–93.5) | 95.6 (93.0–98.0) | 99.0 (97.2–101.8) | 88.7 (8705–91.0) | 96.0 (94.0–98.0) | 101.6 (99.1–106.4) |
| Thigh (cm) | 54.0 (51.0–54.6) | 56.5 (54.0–58.0) | 60.5 (57.0–63.5) | 49.7 (48.0–52.1) | 55.0 (53.0–56.0) | 58.0 (56.1–60.1) |
| Calf (cm) | 36.0 (34.0–36.) | 38.0 (36.0–39.0) | 39.4 (38.5–44.0) | 34.0 (32.0–35.0) | 36.3 (35.0–37.0) | 39.0 (37.1–39.0) |
| Skinfolds (SKF) | ||||||
| Biceps (mm) | 2.9 (2.4–3.0) | 3.0 (3.0–3.1) | 3.4 (3.0–4.4) | 3.0 (2.6–3.0) | 3.4 (3.0–3.8) | 4.5 (4.0–8.0) |
| Triceps (mm) | 5.1 (4.4–5.6) | 6.0 (5.4–6.6) | 8.8 (6.5–10.0) | 8.0 (7.0–10.8) | 14.0 (11.0–15.5) | 18.1 (16.0–20.0) |
| Subscapular (mm) | 5.8 (5.0–6.8) | 7.4 (6.4–8.1) | 9.5 (7.8–11.0) | 6.6 (6.4–7.8) | 10.1 (8.0–12.7) | 14.2 (13.0–15.0) |
| Suprailiac (mm) | 4.2 (3.6–6.0) | 6.9 (5.6–8.2) | 9.8 (7.5–11.0) | 4.9 (4.6–6.6) | 8.0 (6.8–9.2) | 13.2 (10.0–24.0) |
| Supraspinal (mm) | 4.7 (4.4–5.9) | 6.7 (5.4–8.6) | 9.2 (8.2–10.0) | 5.4 (4.8–6.4) | 8.5 (7.2–10.0) | 12.1 (10.1–17.0) |
| Abdominal (mm) | 6.1 (5.5–9.0) | 10.0 (8.0–11.2) | 12.7 (11.0–13.0) | 7.2 (5.8–10.9) | 13.0 (11.0–15.5) | 20.1 (16.0–23.5) |
| Thigh (mm) | 6.2 (5.1–7.0) | 8.4 (6.2–9.0) | 13.5 (9.0–15.6) | 13.9 (9.8–17.0) | 20.0 (18.1–22.0) | 25.1 (23.0–28.0) |
| Calf (mm) | 5.3 (4.2–6.6) | 3.4 (3.2–4.0) | 5.1 (3.8–7.0) | 3.0 (3.0–4.6) | 4.1 (3.8–6.6) | 13.5 (7.8–16.0) |
| Sum of the 8 SKF (mm) | 43.2 (38.9–46.5) | 51.0 (44.8–60.2) | 66.8 (58.2–71.6) | 63.8 (49.4–72.4) | 86.1 (79.8–95.4) | 108.3 (96.1–131.0) |
| Breadths | ||||||
| Humerus (cm) | 6.2 (6.0–6.7) | 7.0 (6.5–7.0) | 7.2 (7.0–7.5) | 5.5 (5.4–5.8) | 6.0 (5.9–6.4) | 6.5 (6.4–6.8) |
| Femur (cm) | 8.3 (6.7–9.2) | 9.7 (9.0–10.4) | 10.7 (10.2–11.2) | 8.5 (8.0–9.0) | 9.6 (9.1–10.0) | 10.4 (10.0–10.8) |
| Somatotype | ||||||
| Endomorphy | 1.3 (1.0–1.6) | 1.9 (1.6–2.1) | 2.4 (2.0–2.6) | 2.1 (1.7–2.7) | 3.3 (2.7–3.9) | 4.7 (3.9–5.1) |
| Mesomorphy | 2.0 (1.1–3.3) | 4.1 (2.9–5.2) | 5.9 (4.9–7.2) | 2.9 (2.6–3.6) | 4.1 (3.7–2.3) | 4.9 (4.5–5.6) |
| Ectomorphy | 1.5 (1.1–2.1) | 2.9 (1.9–3.4) | 3.7 (3.3–3.9) | 1.4 (1.2–1.9) | 2.4 (2.0–2.7) | 3.3 (2.7–3.8) |
Disclaimer/Publisher’s Note: The statements, opinions and data contained in all publications are solely those of the individual author(s) and contributor(s) and not of MDPI and/or the editor(s). MDPI and/or the editor(s) disclaim responsibility for any injury to people or property resulting from any ideas, methods, instructions or products referred to in the content. |
© 2024 by the authors. Licensee MDPI, Basel, Switzerland. This article is an open access article distributed under the terms and conditions of the Creative Commons Attribution (CC BY) license (https://creativecommons.org/licenses/by/4.0/).
Share and Cite
Petri, C.; Campa, F.; Holway, F.; Pengue, L.; Arrones, L.S. ISAK-Based Anthropometric Standards for Elite Male and Female Soccer Players. Sports 2024, 12, 69. https://doi.org/10.3390/sports12030069
Petri C, Campa F, Holway F, Pengue L, Arrones LS. ISAK-Based Anthropometric Standards for Elite Male and Female Soccer Players. Sports. 2024; 12(3):69. https://doi.org/10.3390/sports12030069
Chicago/Turabian StylePetri, Cristian, Francesco Campa, Francis Holway, Luca Pengue, and Luis Suarez Arrones. 2024. "ISAK-Based Anthropometric Standards for Elite Male and Female Soccer Players" Sports 12, no. 3: 69. https://doi.org/10.3390/sports12030069