
Acute Effect of the “Zero Point” Method on Muscle Thickness and Muscle Damage in Trained Men

 , ,
, ,
Abstract
:1. Introduction
2. Methods
2.1. Participants
2.2. Procedures
2.2.1. Resistance Exercise Protocols
2.2.2. One Repetition Maximum Test
2.2.3. Muscle Thickness and Echo Intensity
2.2.4. Myoglobin and Blood Lactate Concentration
2.2.5. Muscle Pain
2.3. Statistical Analysis
3. Results
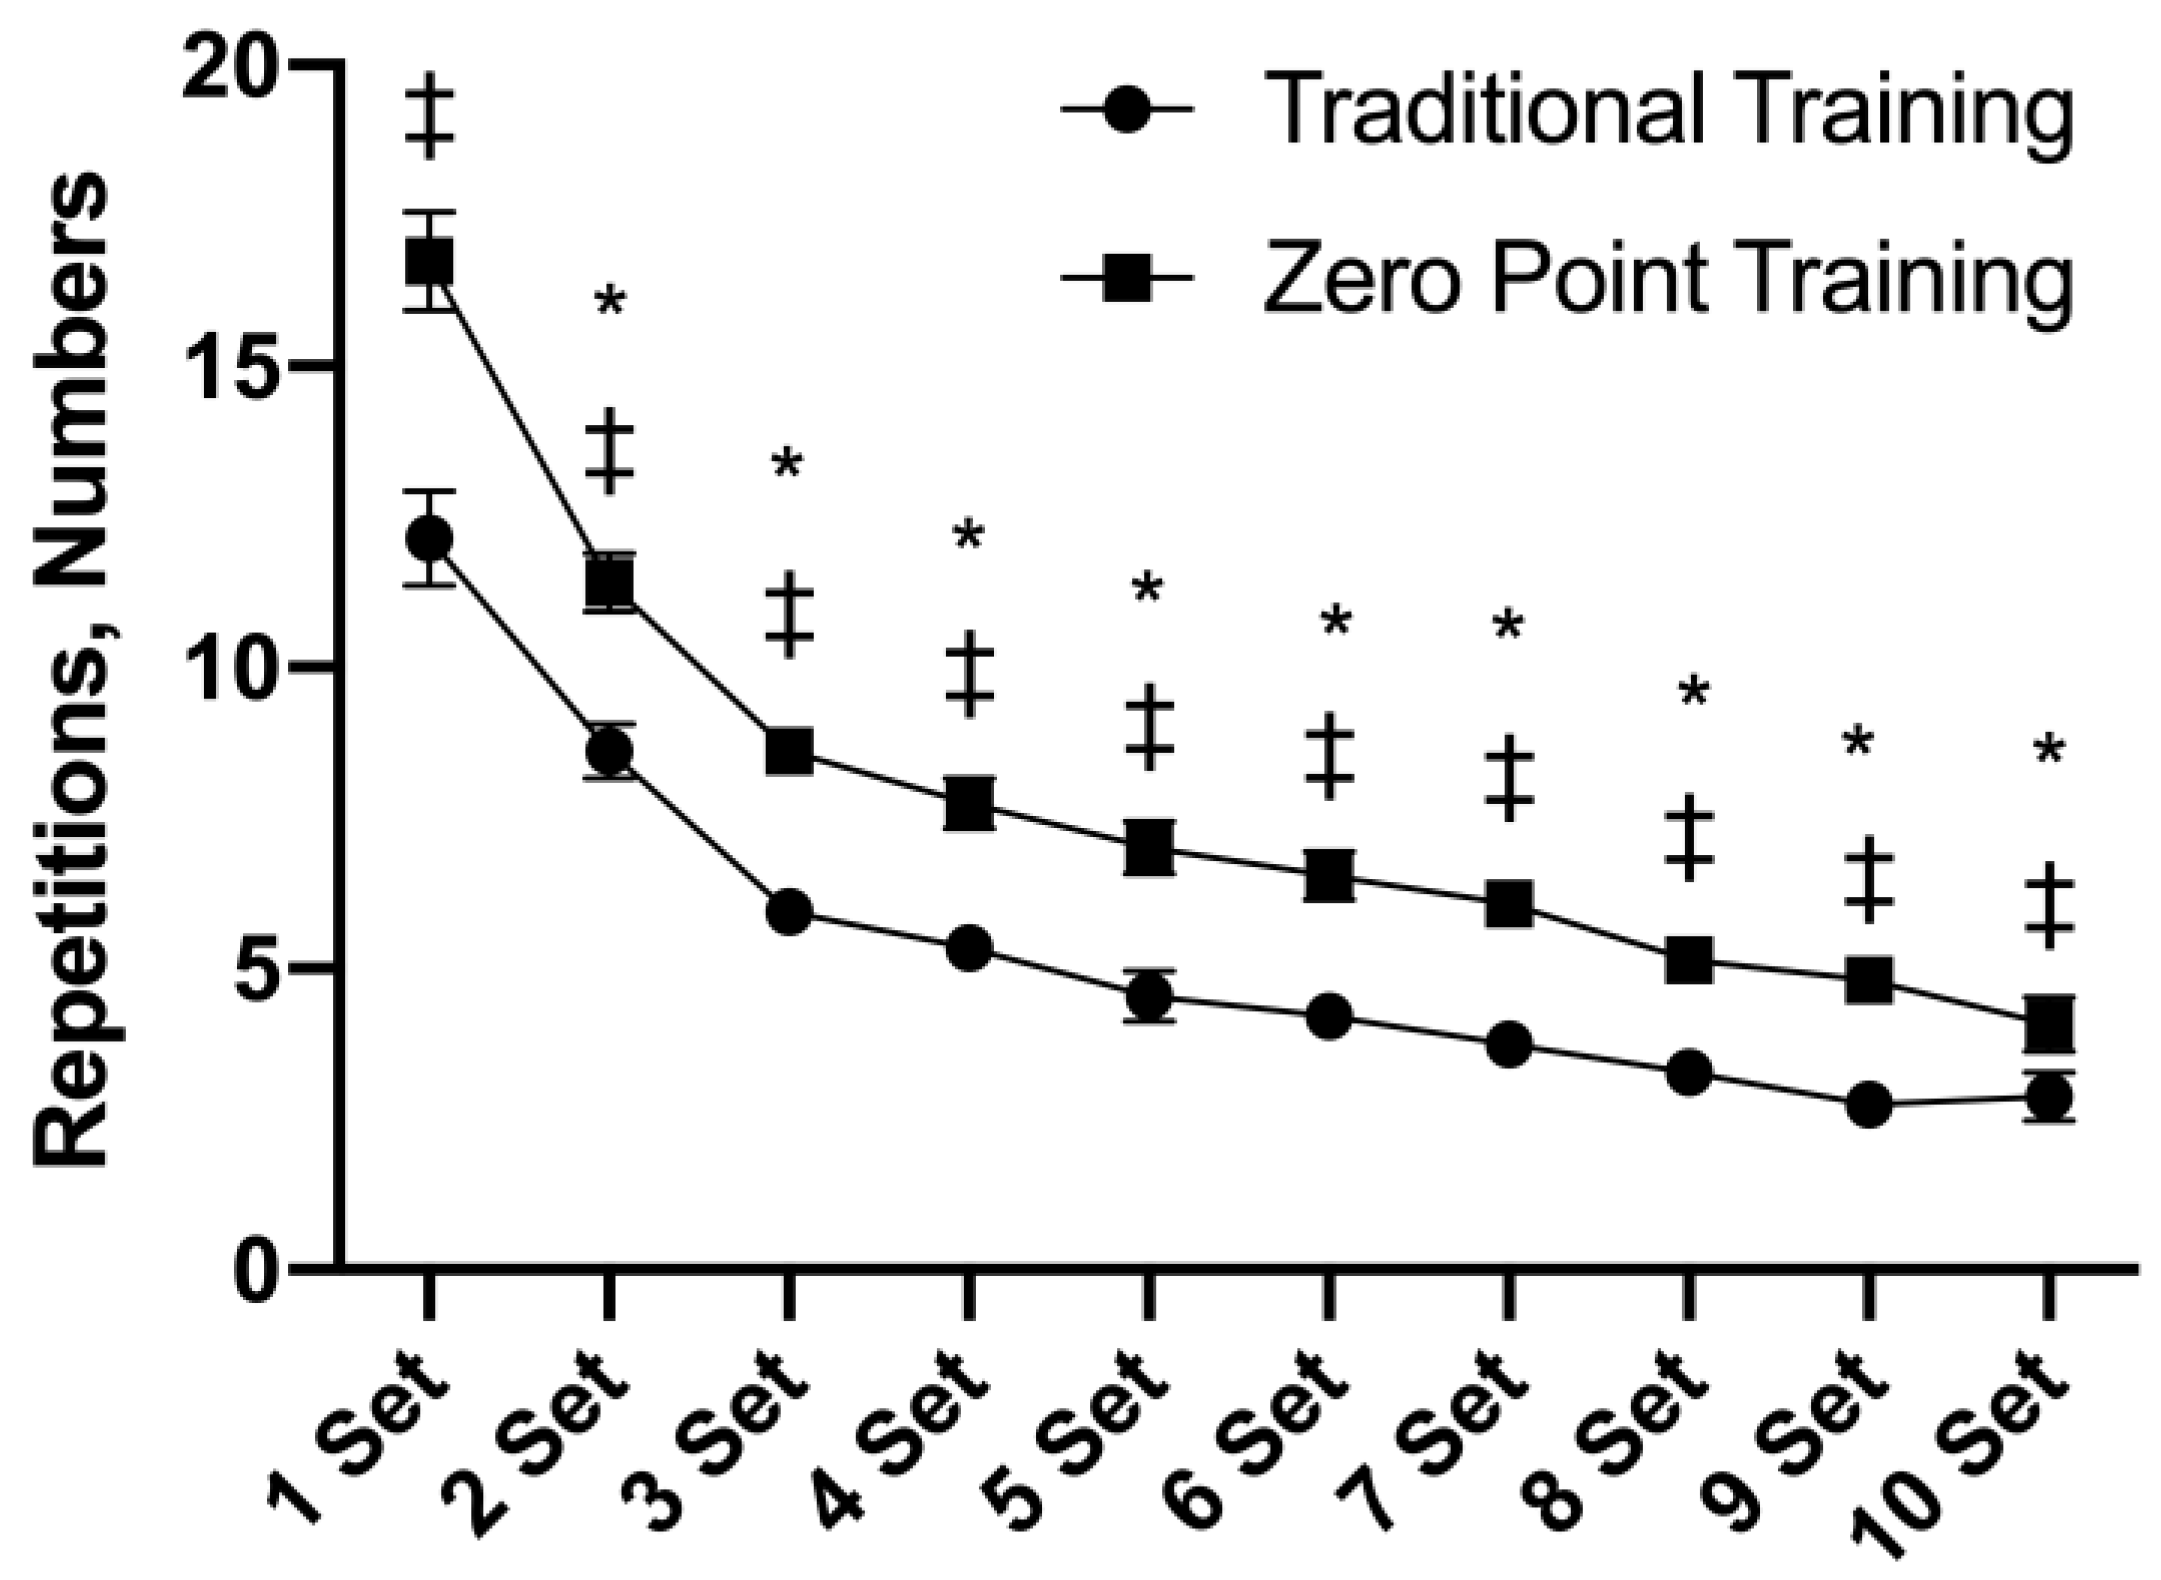
3.1. Repetitions
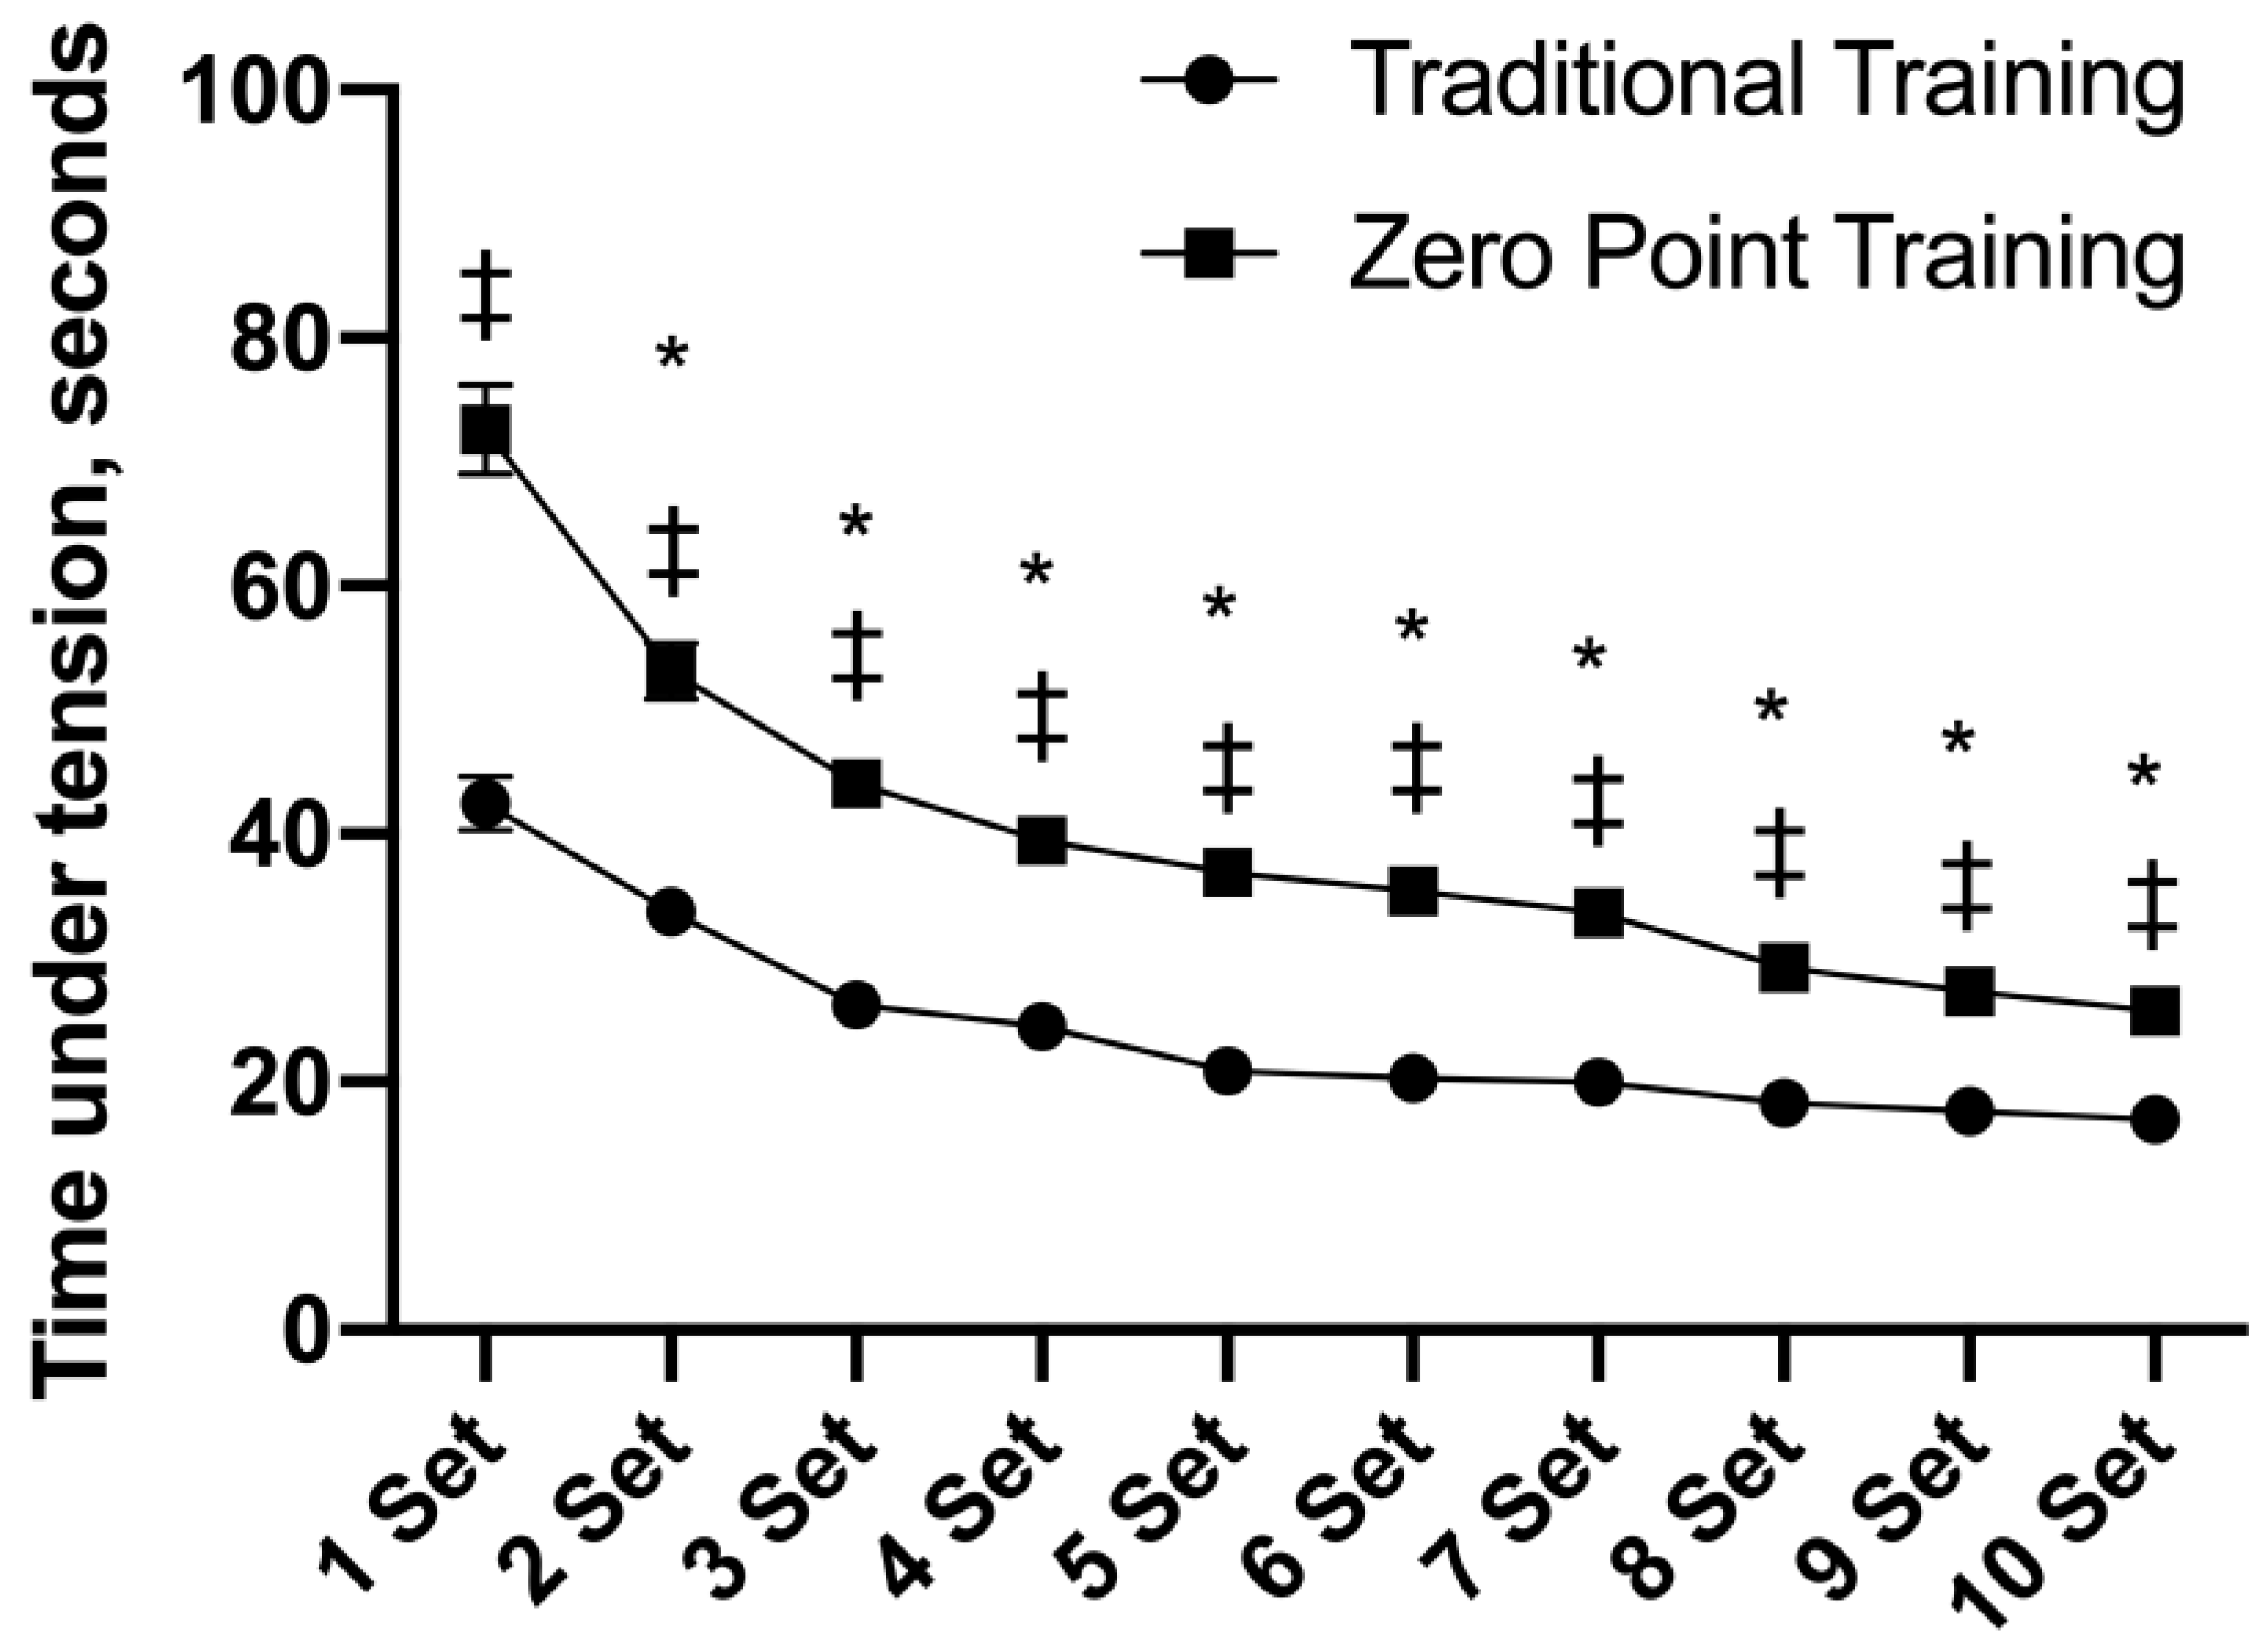
3.2. Time under Tension (TUT)
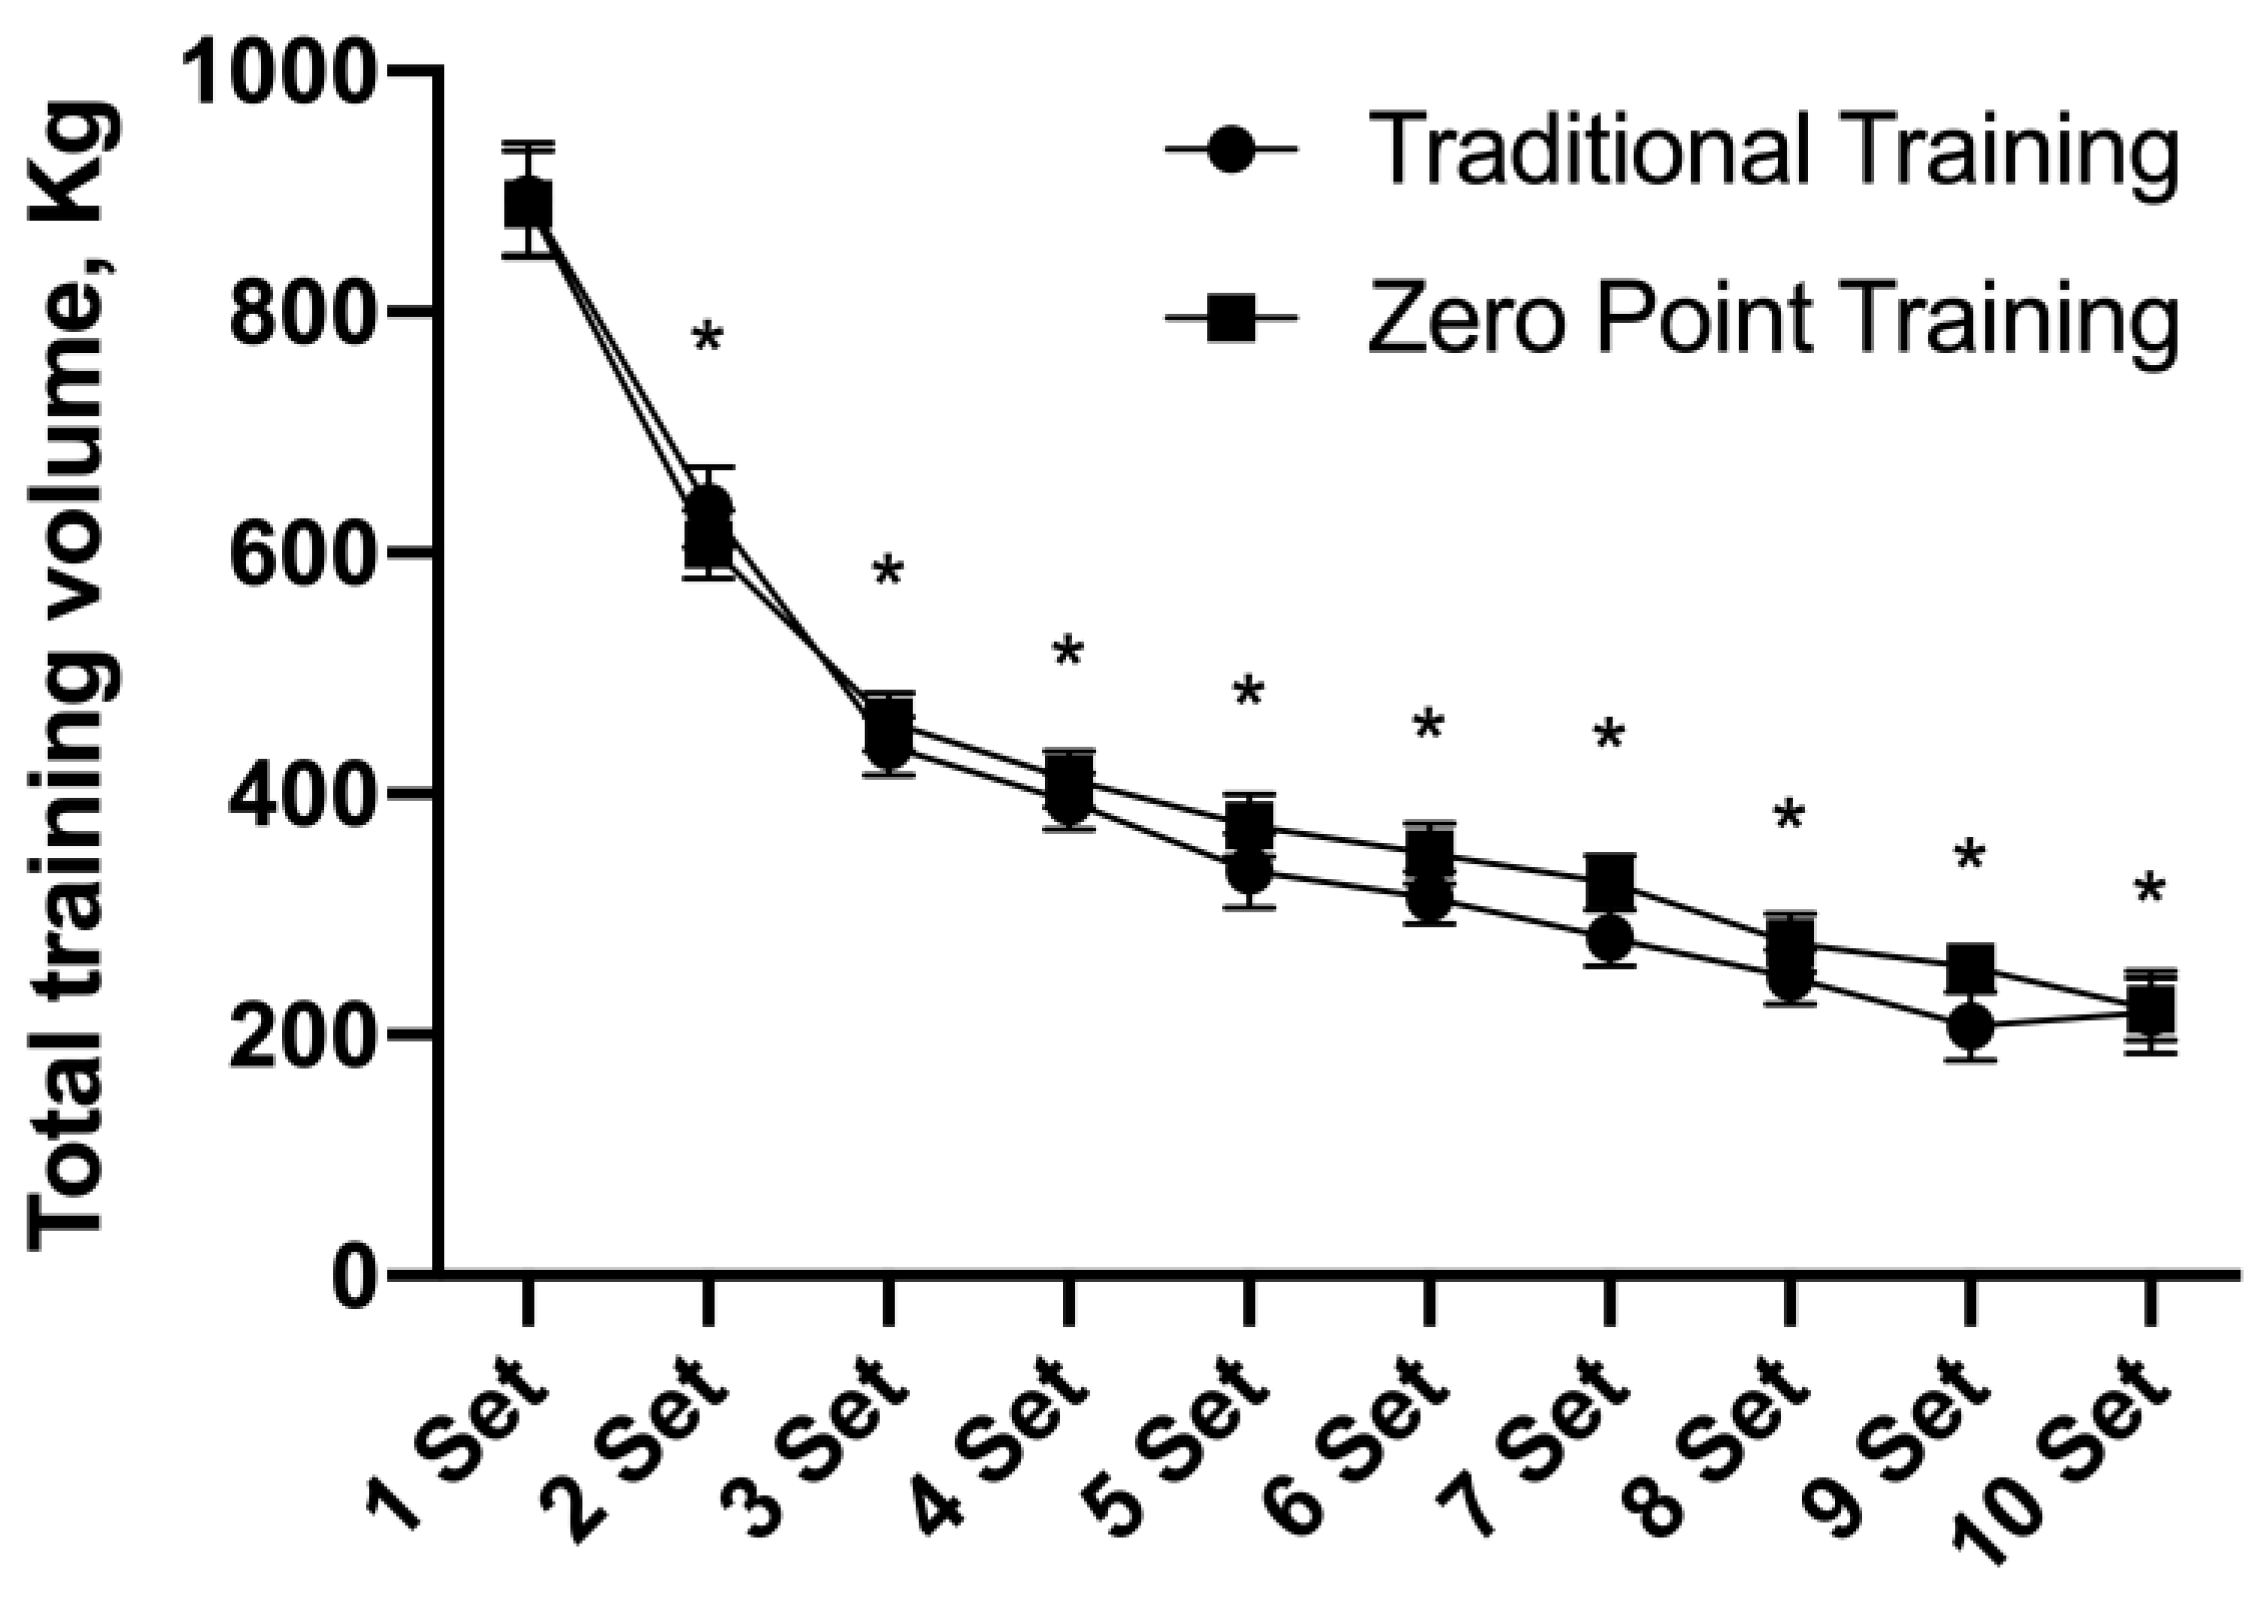
3.3. Total Training Volume (TTV)
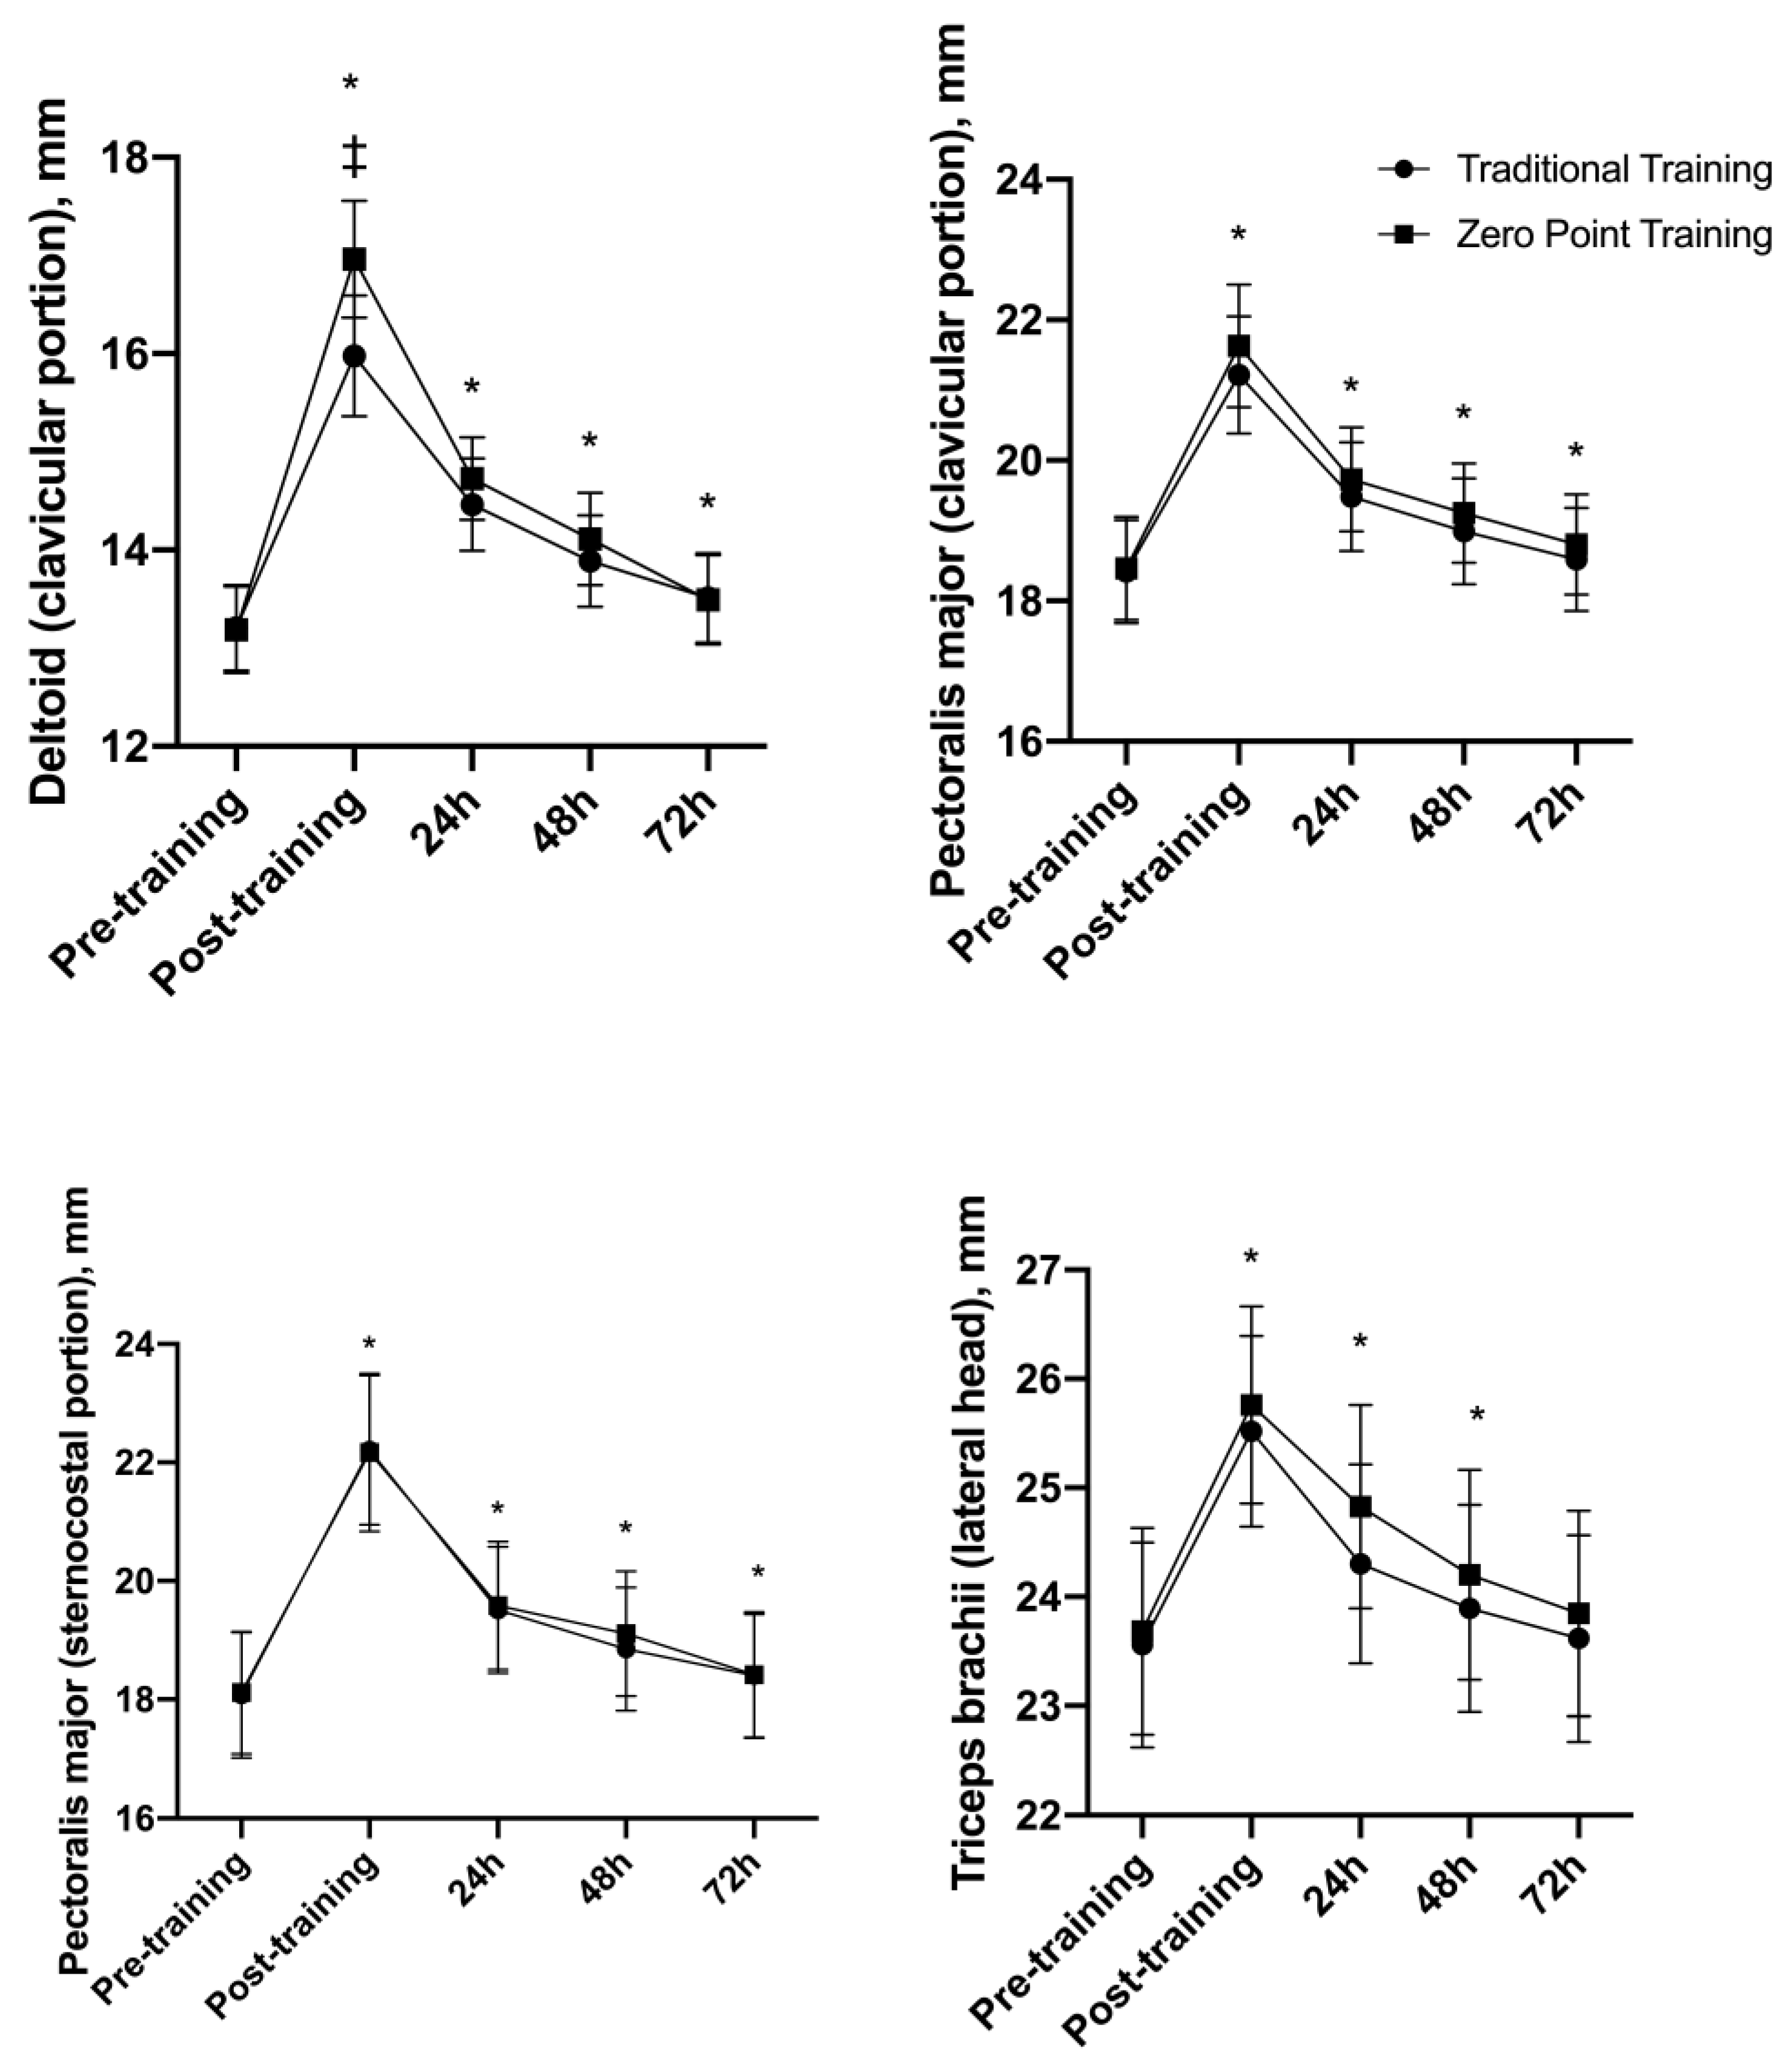
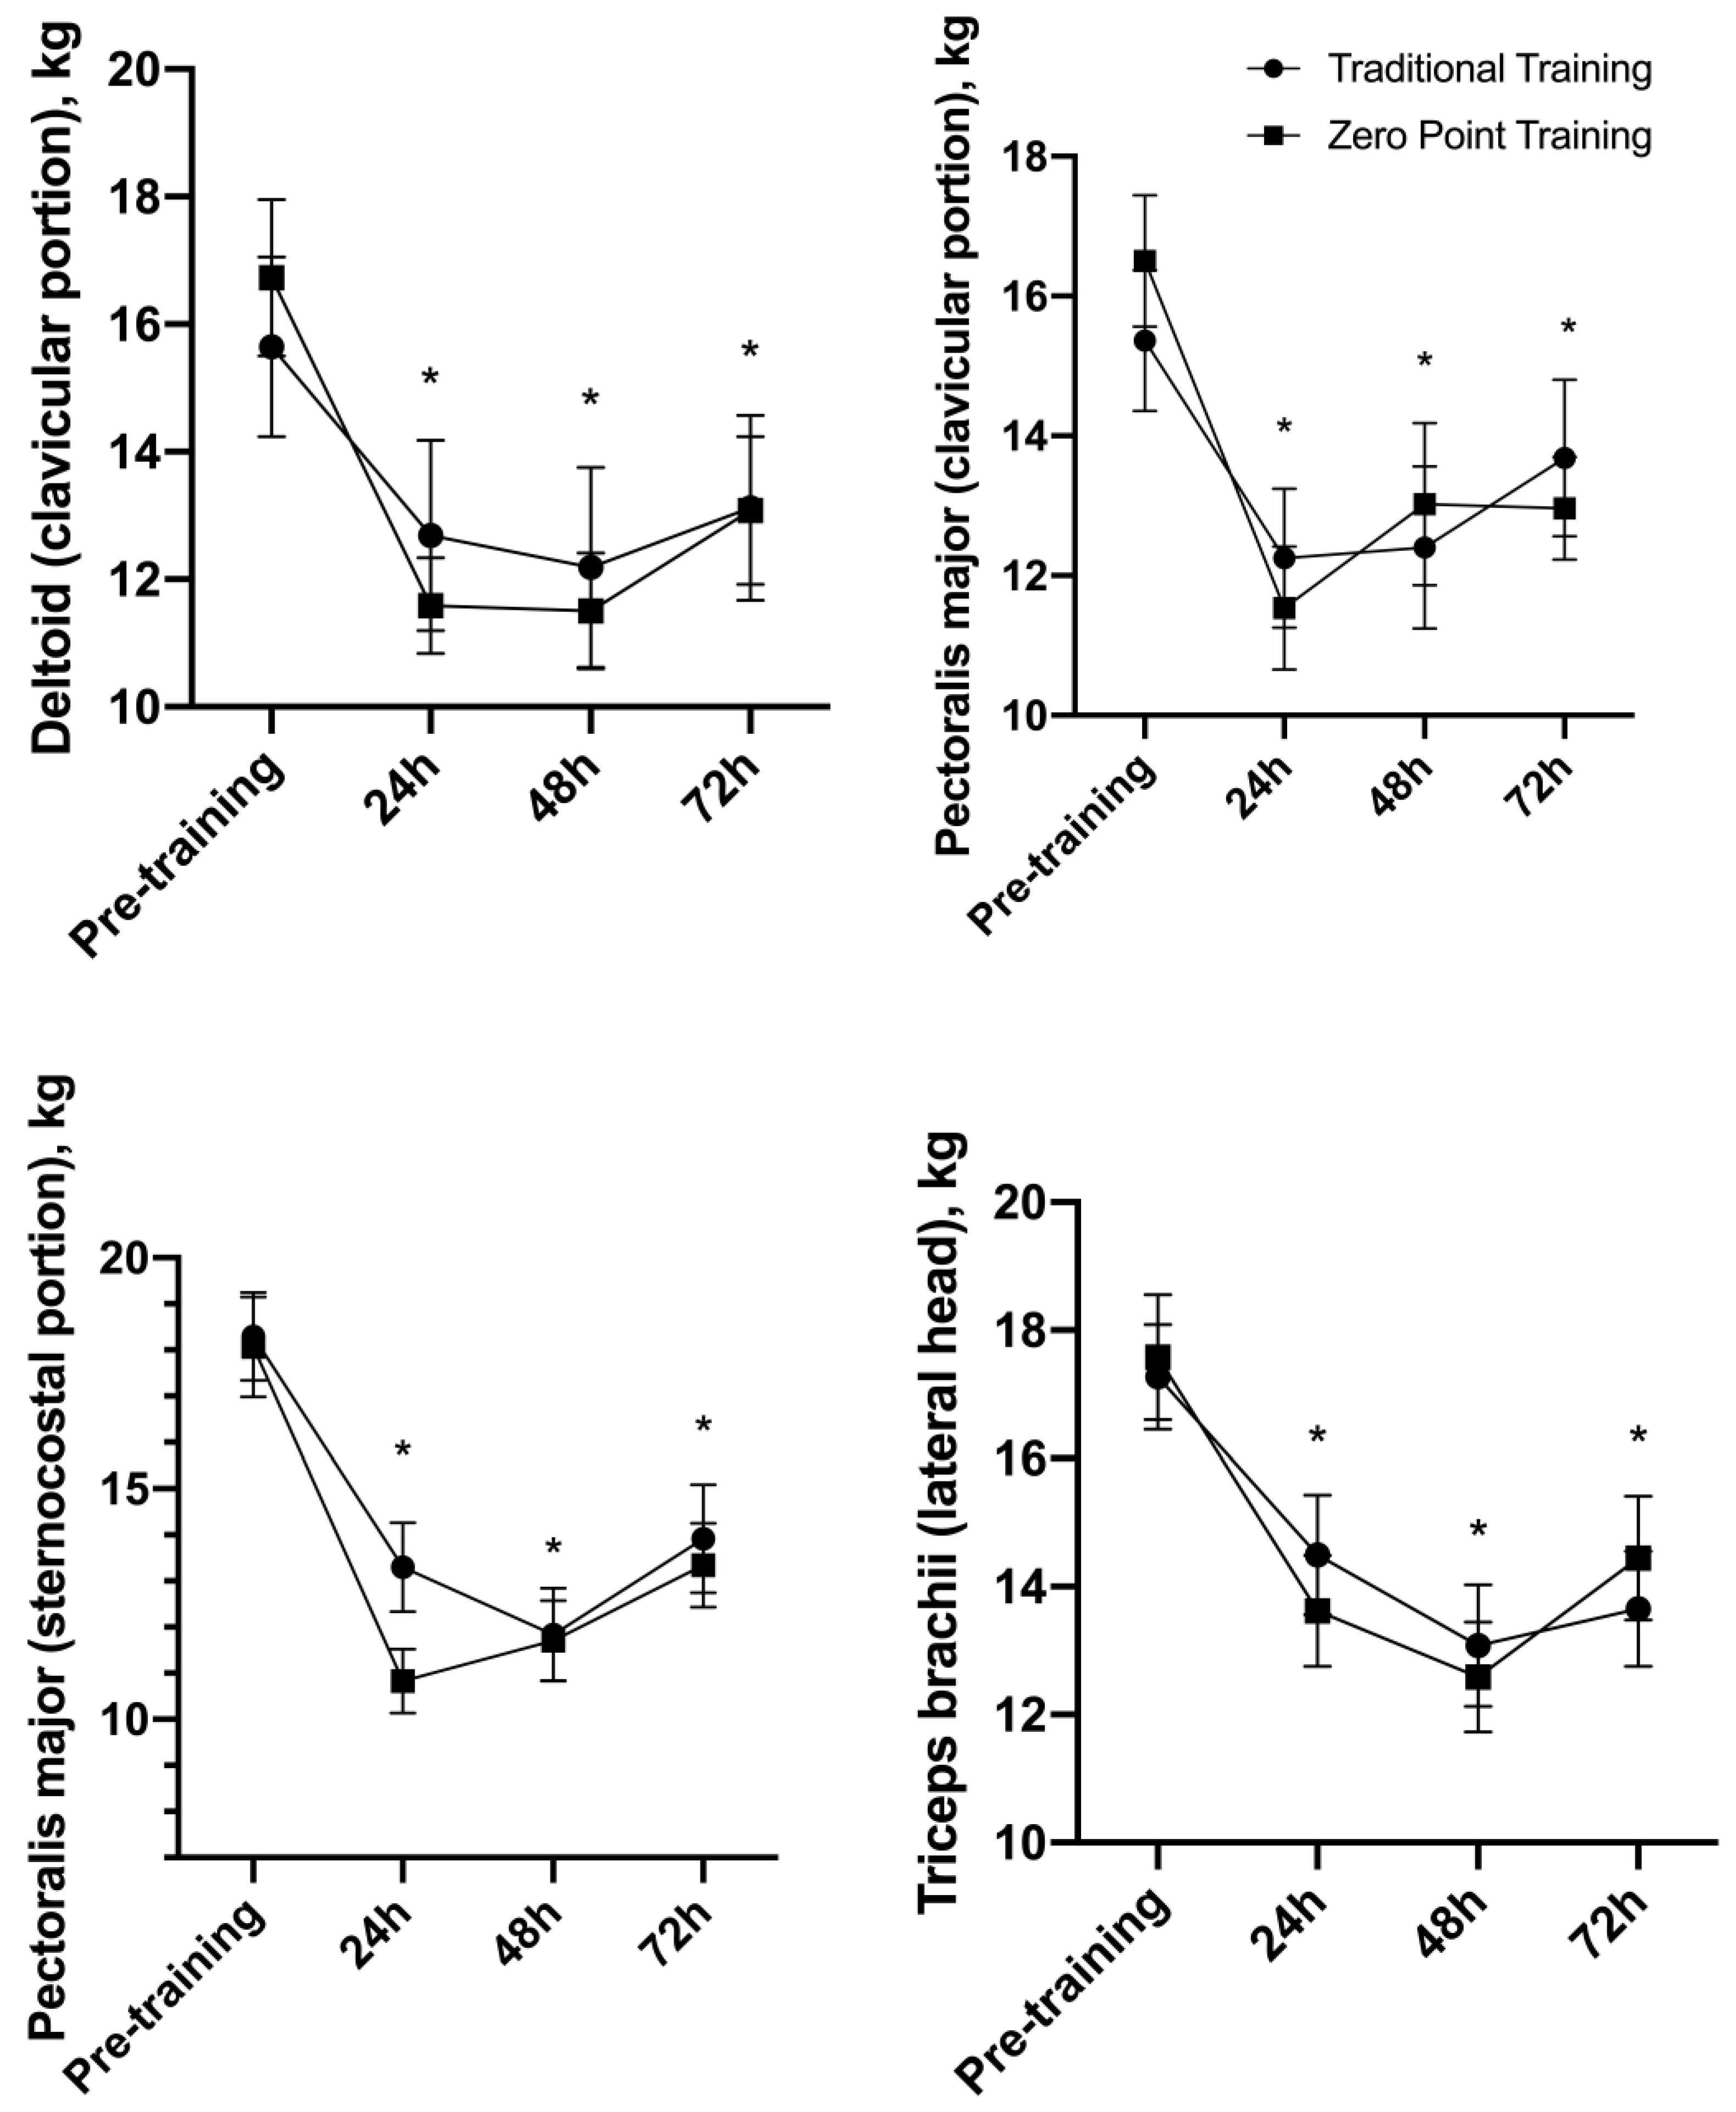
3.4. Muscle Thickness (MT)
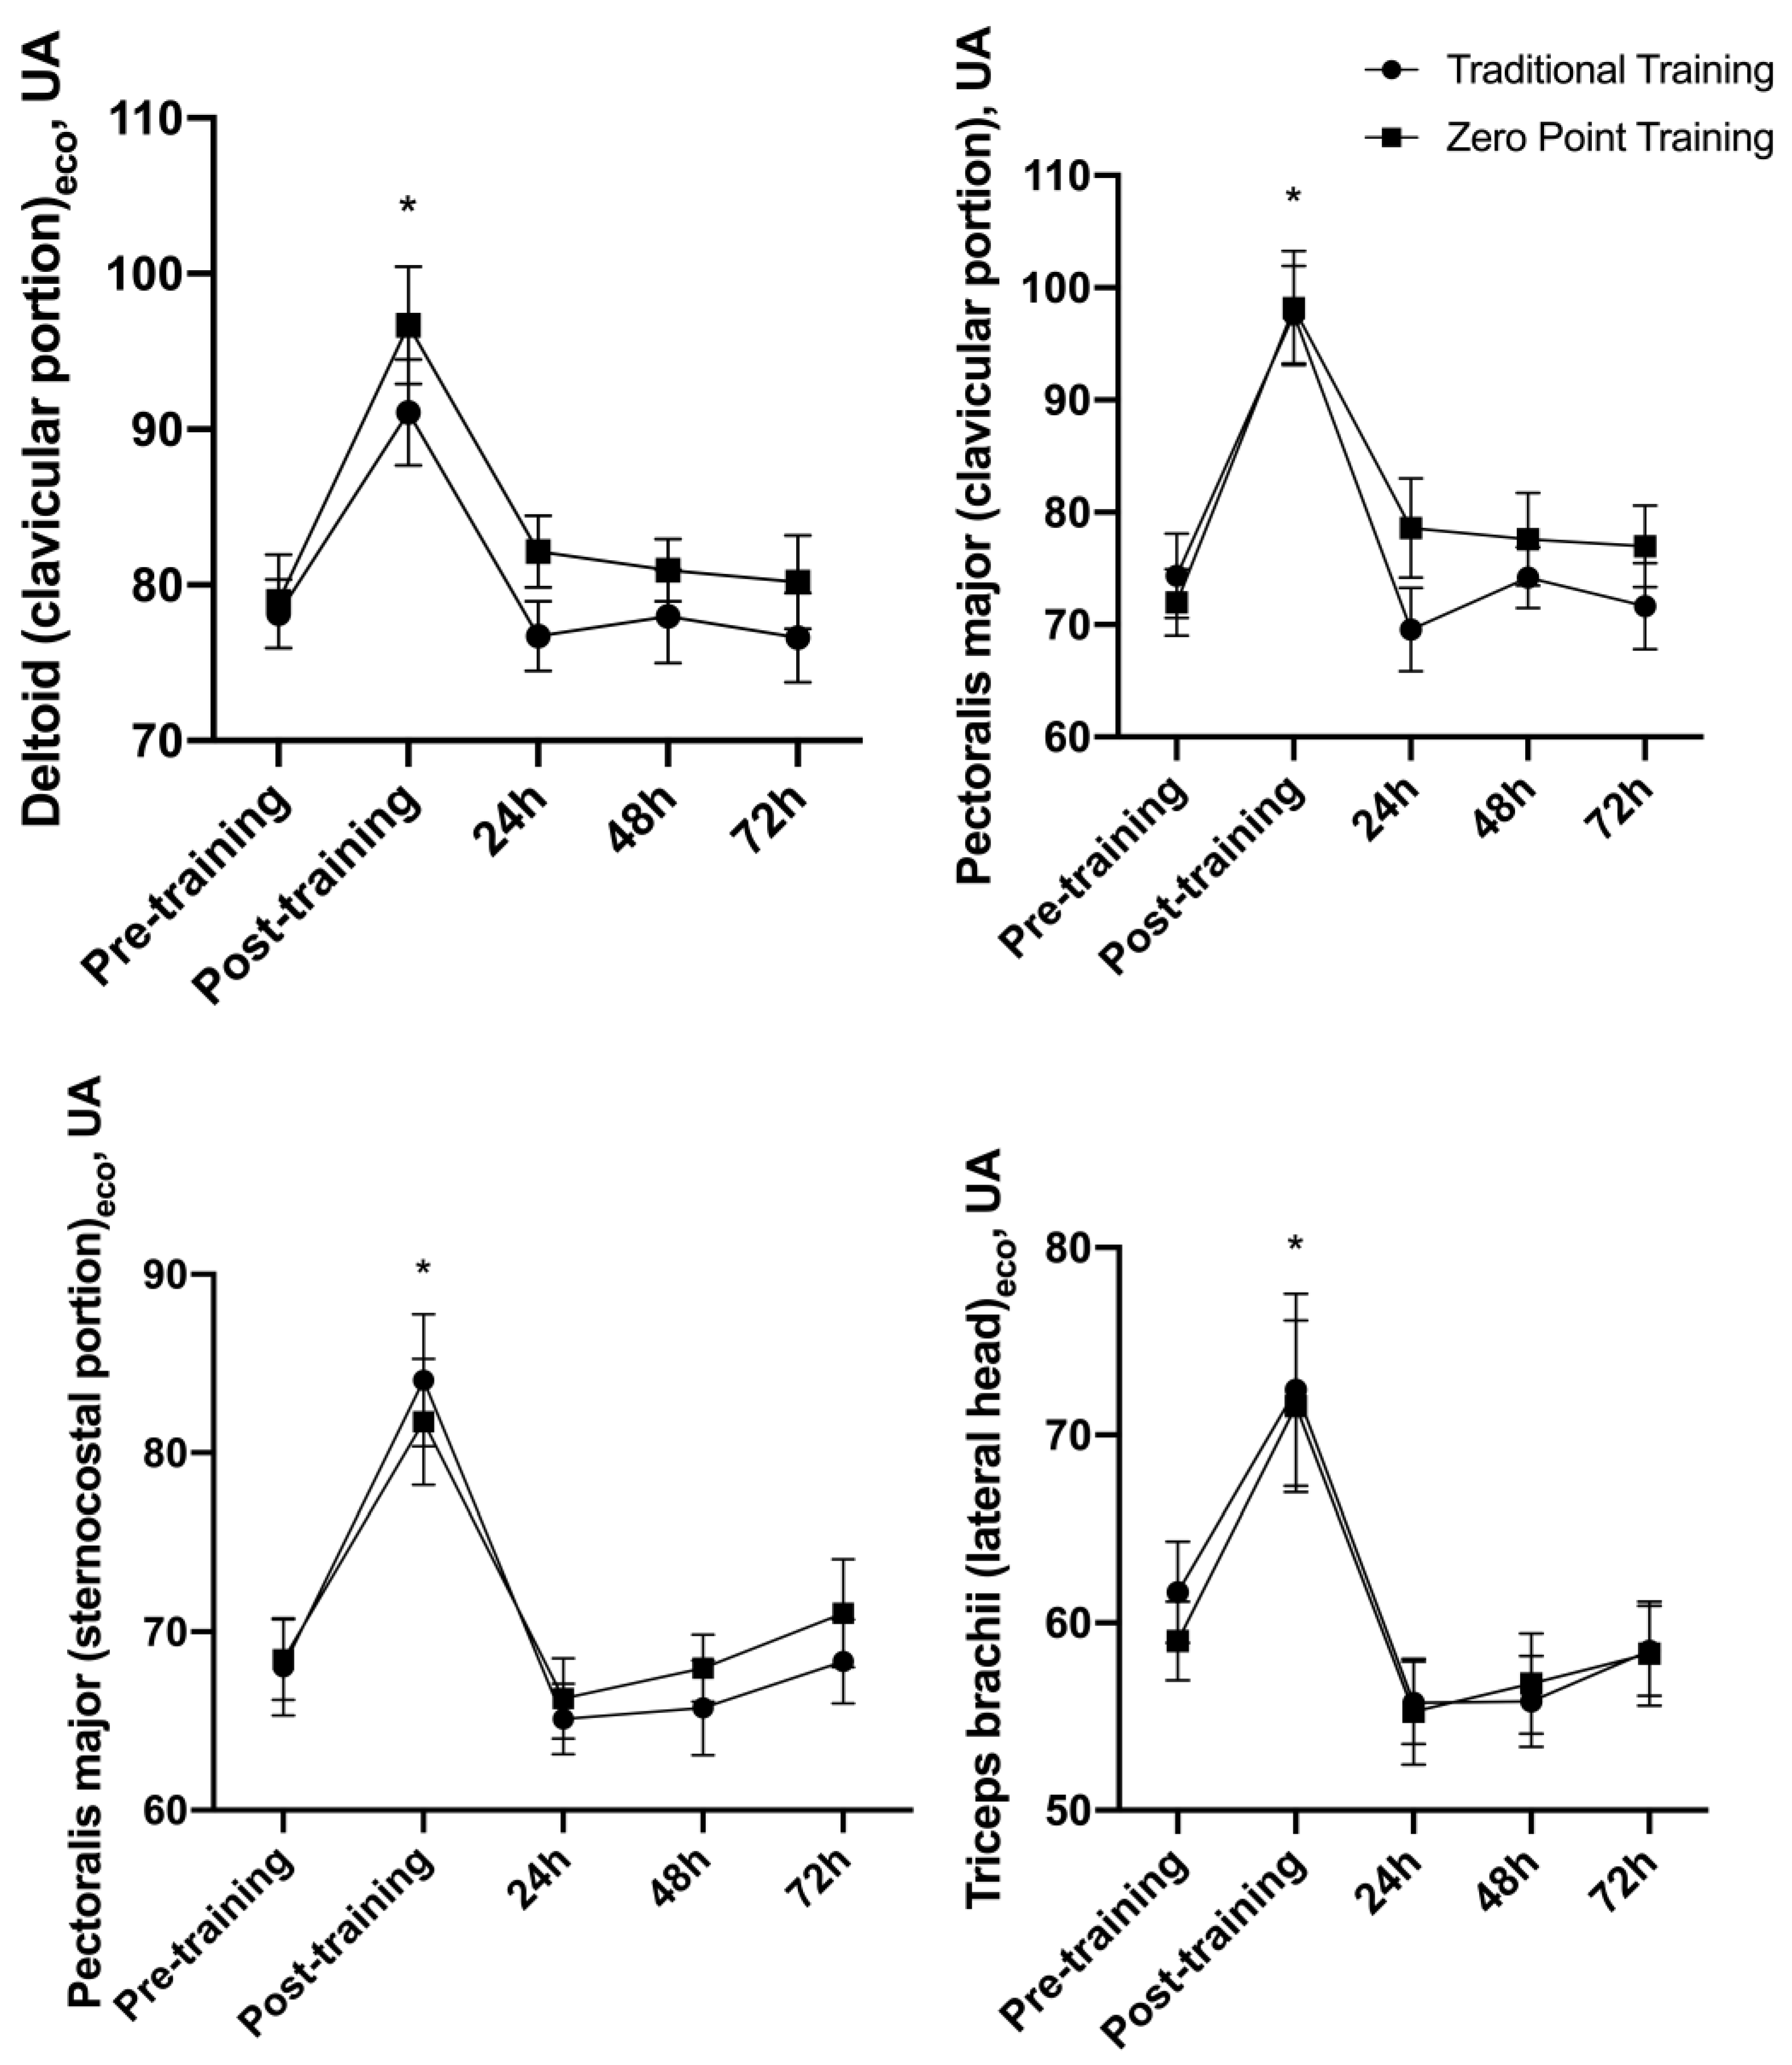
3.5. Echo Intensity (EI)
3.6. Algometry
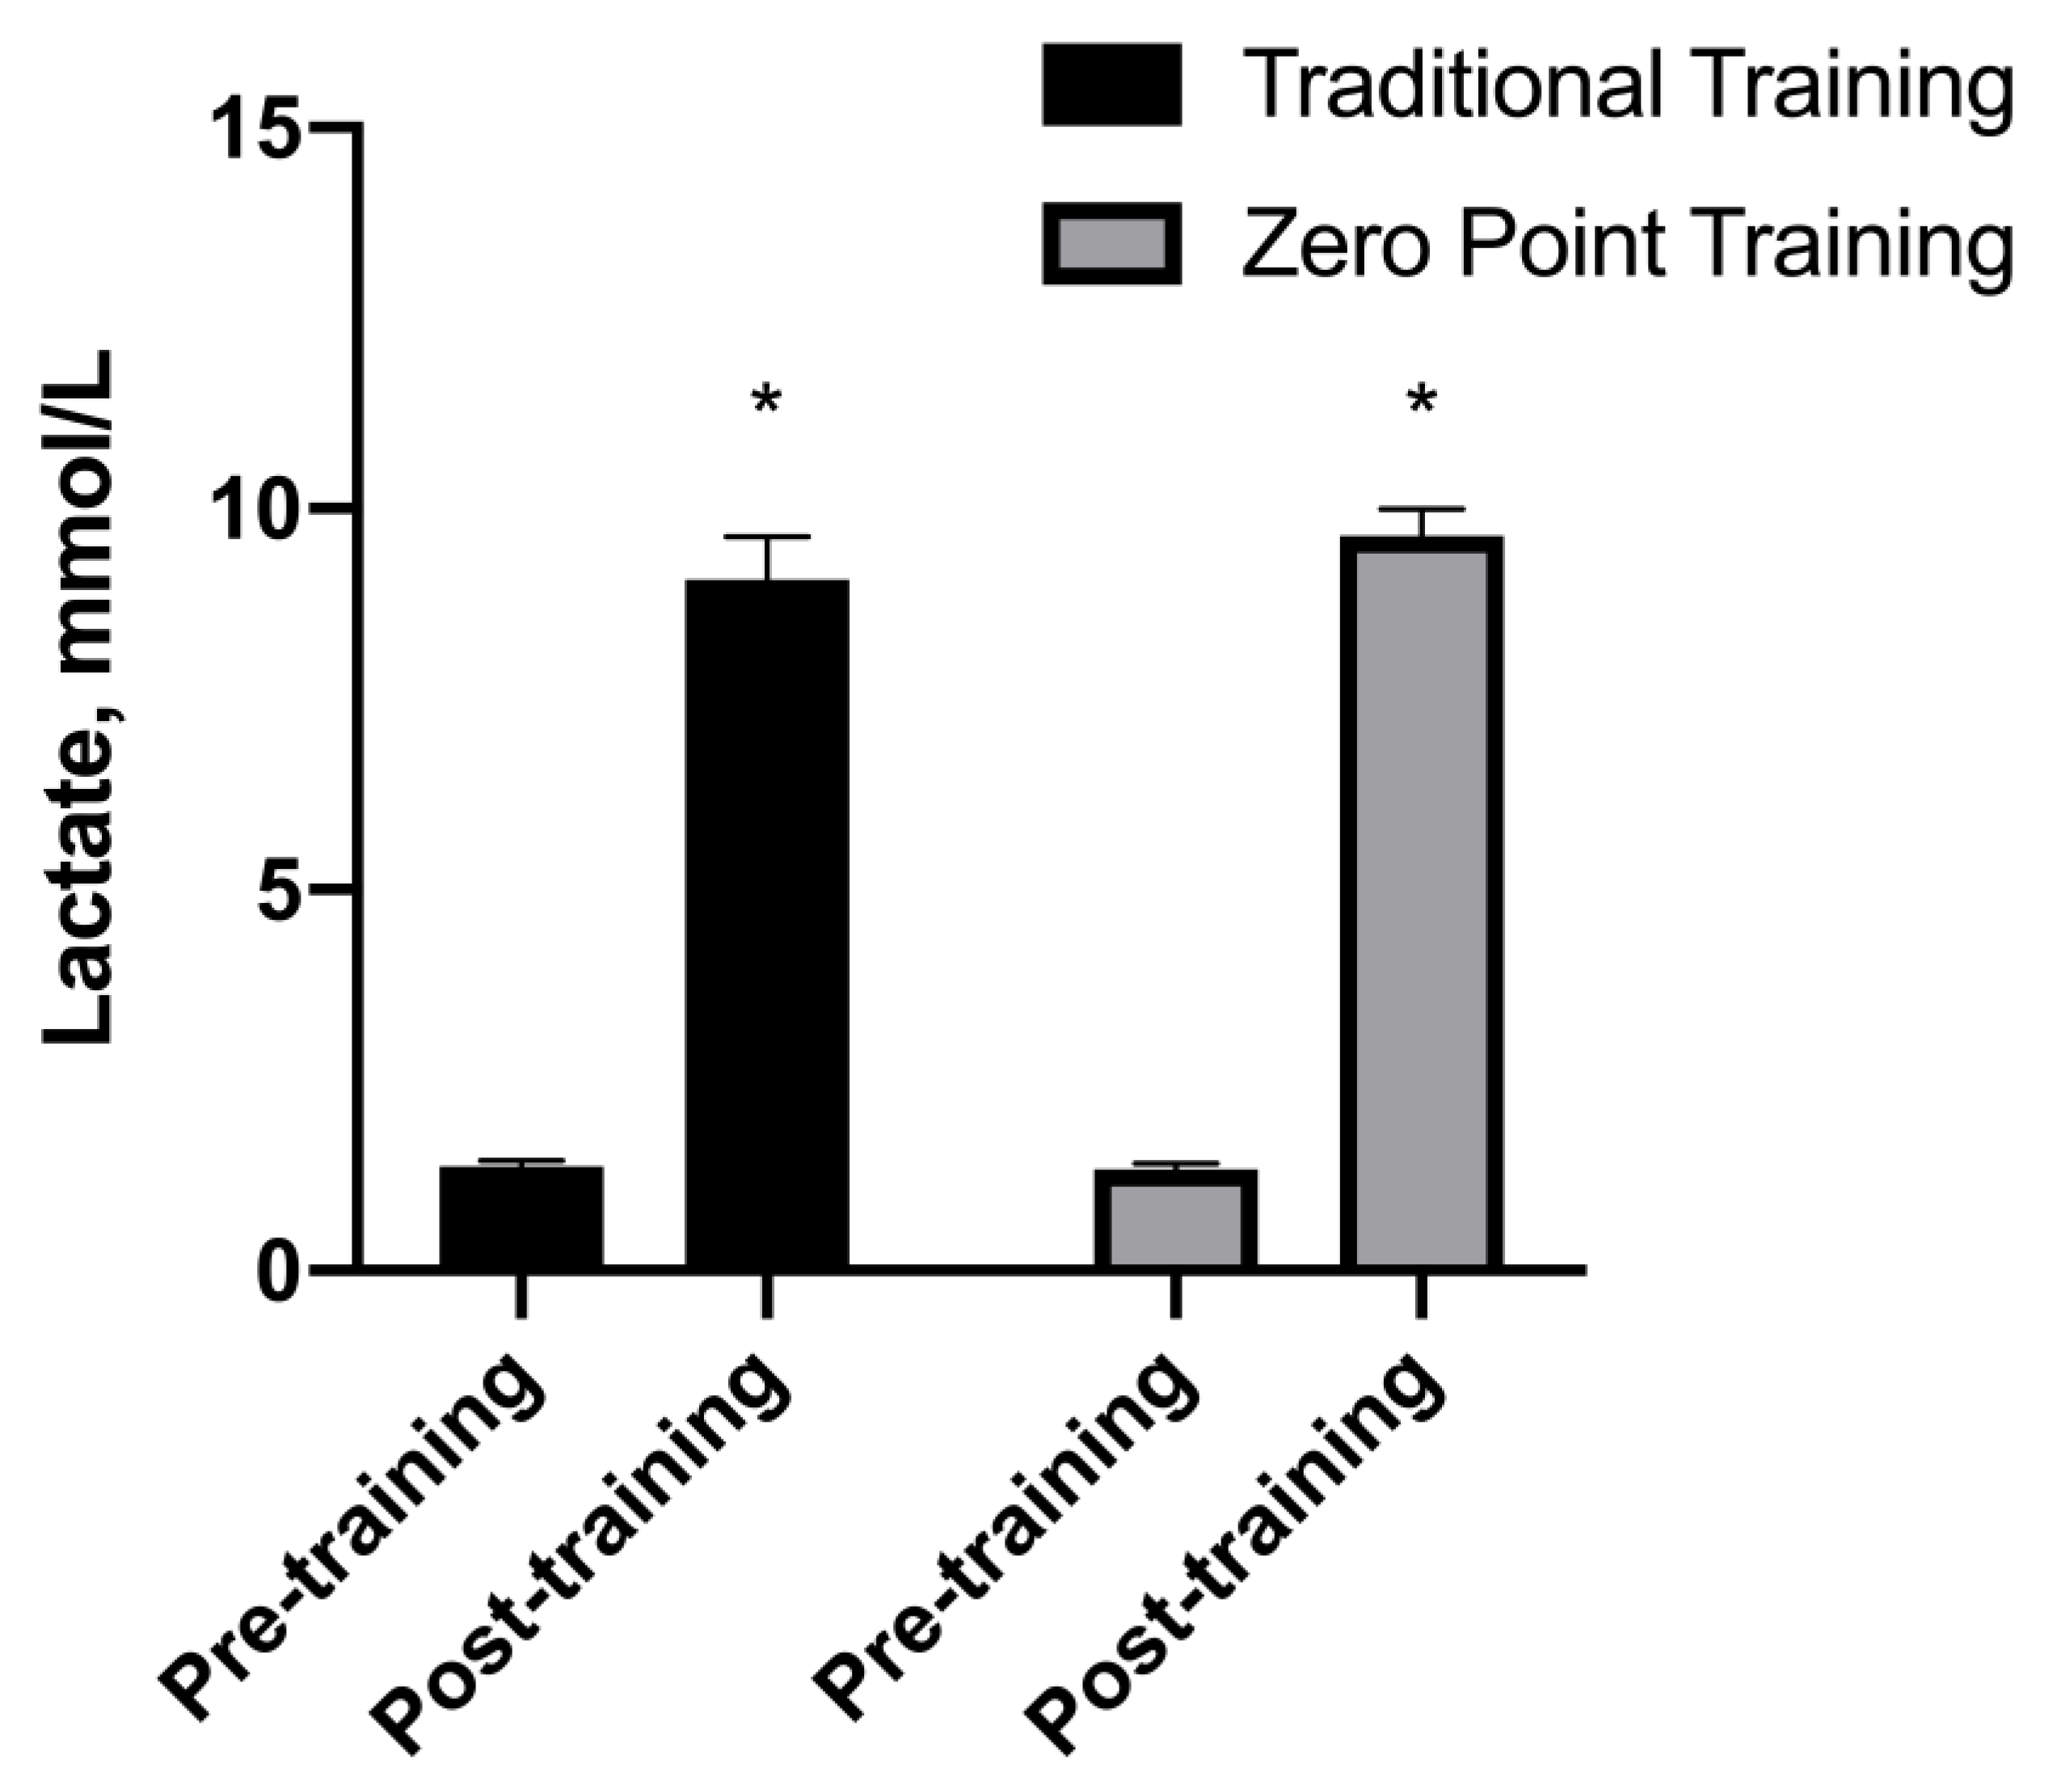
3.7. Lactate
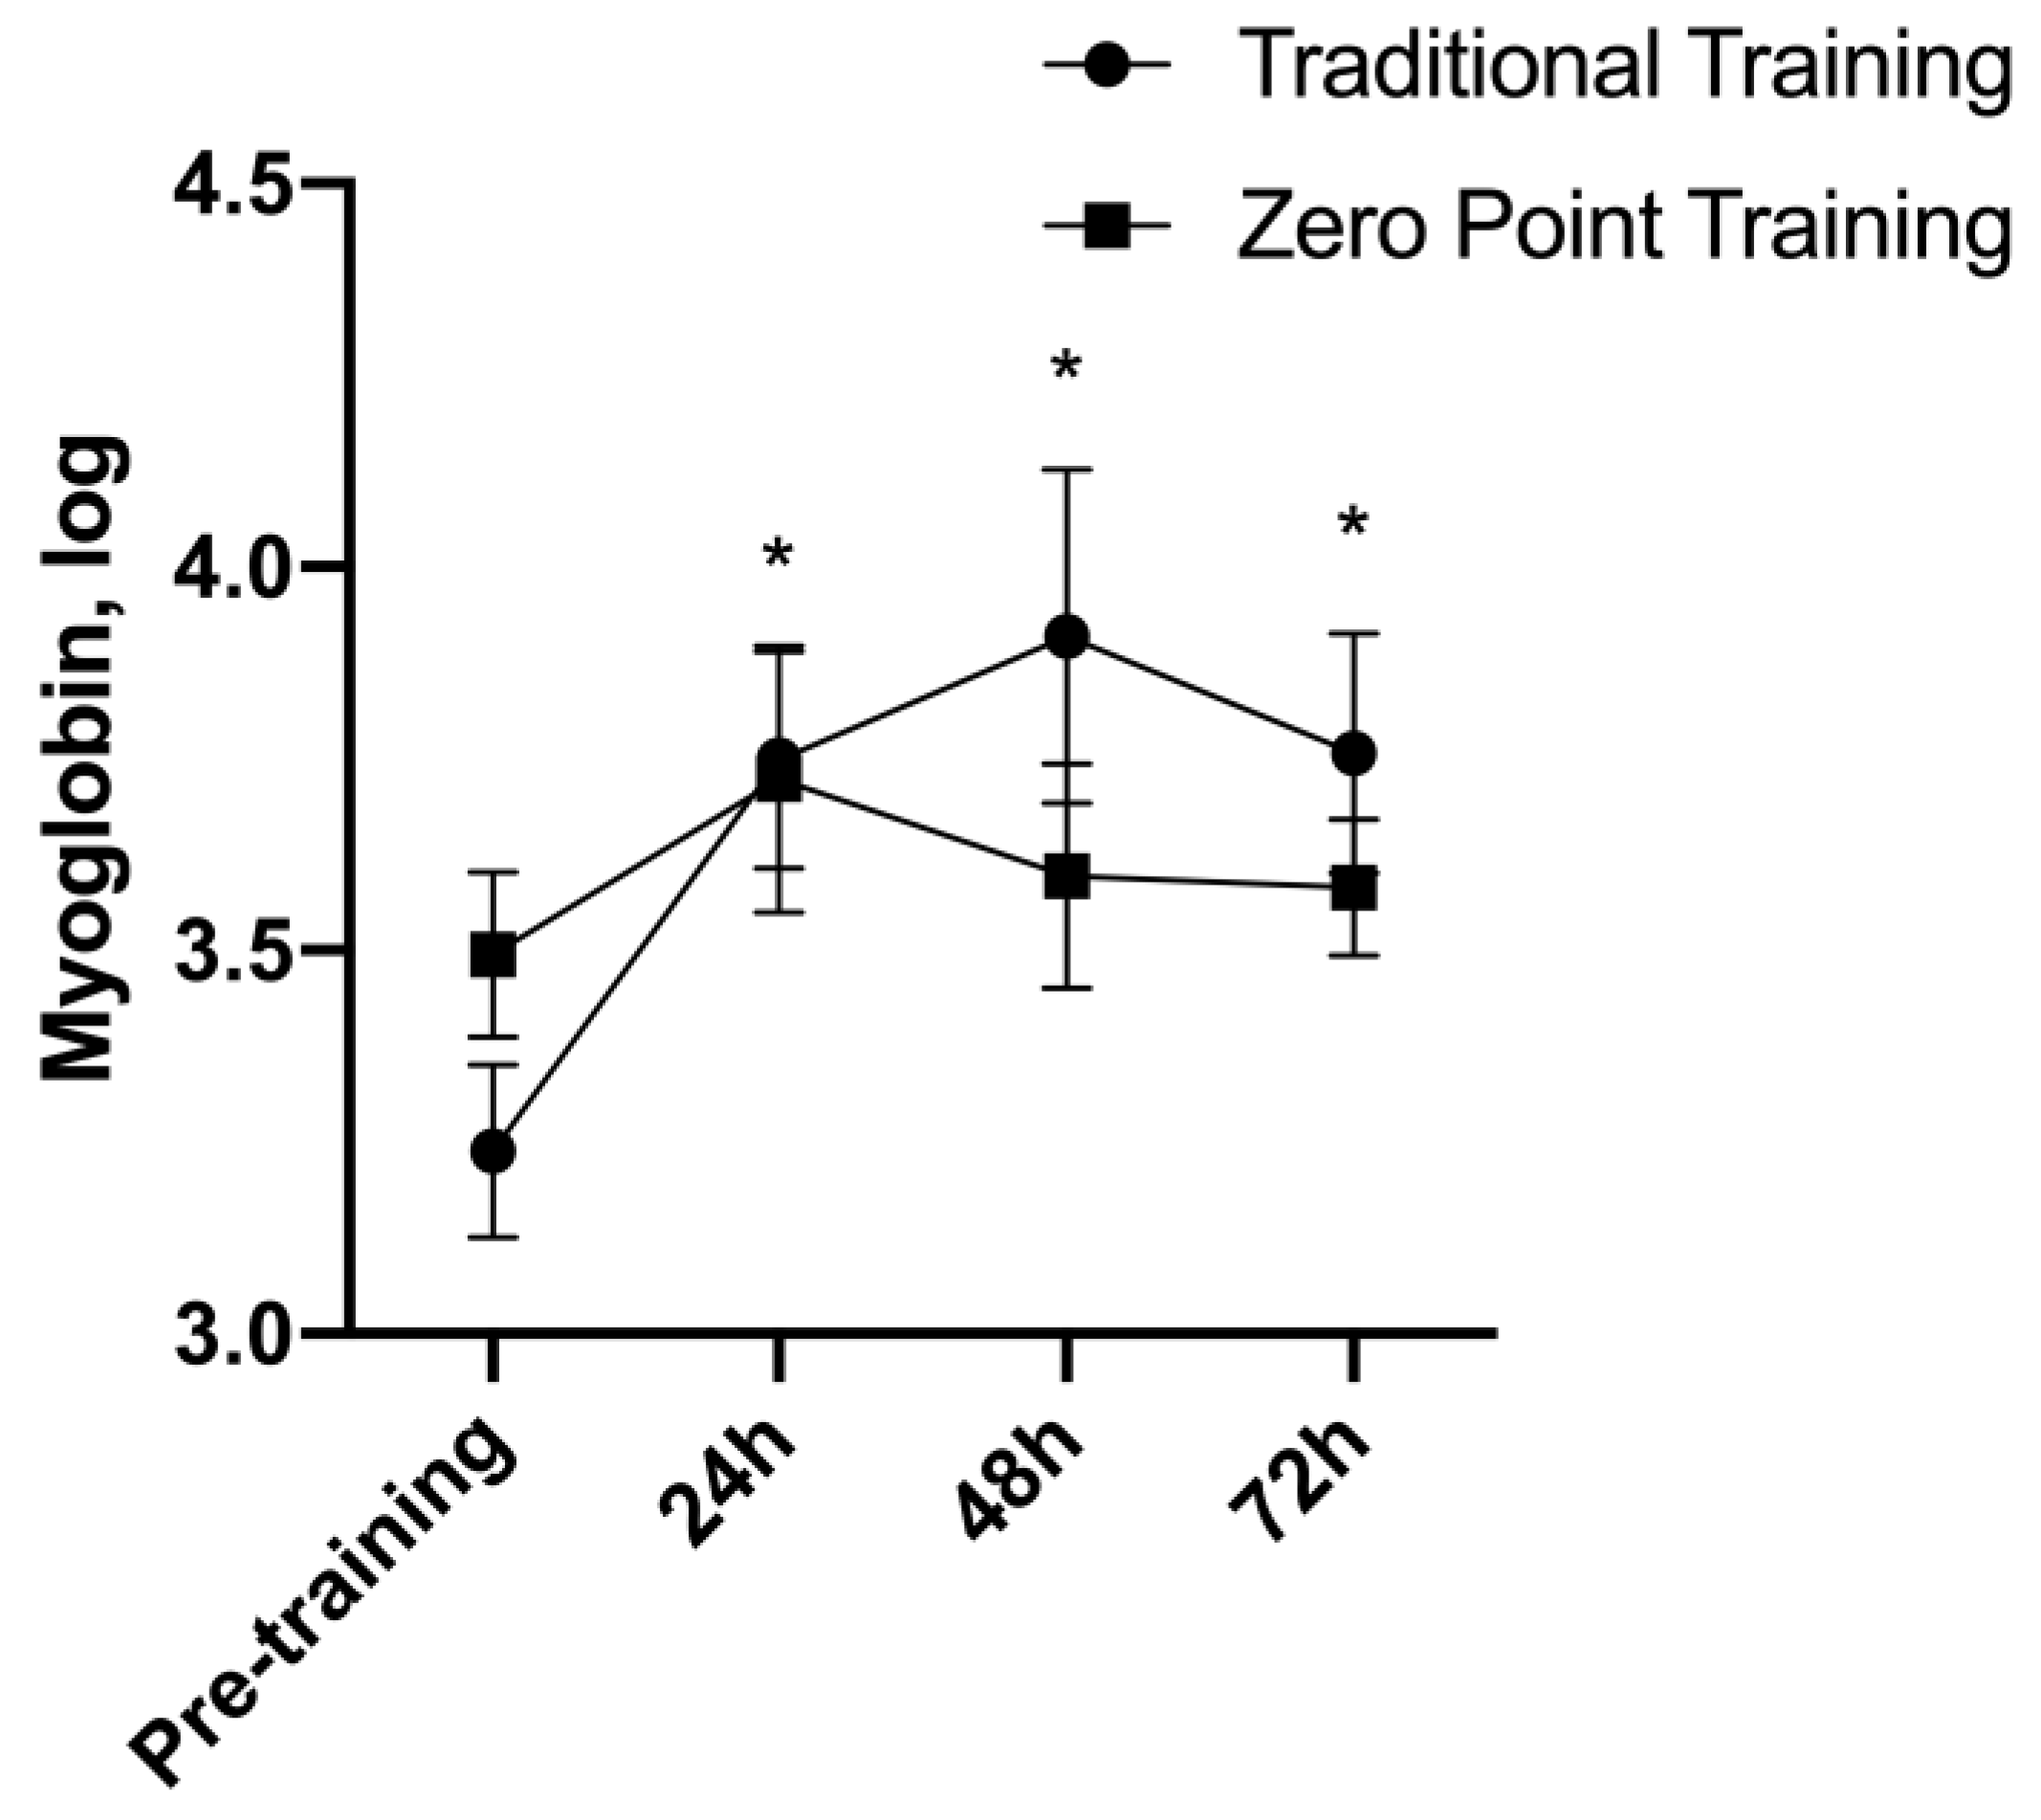
3.8. Myoglobin
4. Discussion
5. Conclusions
Author Contributions
Funding
Institutional Review Board Statement
Informed Consent Statement
Data Availability Statement
Acknowledgments
Conflicts of Interest
References
- ACSM American College of Sports Medicine Position Stand. Progression models in resistance training for healthy adults. Med. Sci. Sports Exerc. 2009, 41, 687–708. [Google Scholar] [CrossRef] [PubMed]
- Kraemer, W.J.; Ratamess, N.A. Fundamentals of resistance training: Progression and exercise prescription. Med. Sci. Sports Exerc. 2004, 36, 674–688. [Google Scholar] [CrossRef] [PubMed]
- Morton, R.W.; Colenso-Semple, L.; Phillips, S.M. Training for strength and hypertrophy: An evidence-based approach. Curr. Opin. Physiol. 2019, 10, 90–95. [Google Scholar] [CrossRef]
- Angleri, V.; Ugrinowitsch, C.; Libardi, C.A. Are resistance training systems necessary to avoid a stagnation and maximize the gains muscle strength and hypertrophy? Sci. Sports 2020, 35, 65.e1–65.e16. [Google Scholar] [CrossRef]
- Krzysztofik, M.; Wilk, M.; Wojdała, G.; Gołaś, A. Maximizing muscle hypertrophy: A systematic review of advanced resistance training techniques and methods. Int. J. Environ. Res. Public Health 2019, 16, 4897. [Google Scholar] [CrossRef] [PubMed]
- Hackett, D.A.; Johnson, N.A.; Chow, C.-M. Training practices and ergogenic aids used by male bodybuilders. J. Strength Cond. Res. 2013, 27, 1609–1617. [Google Scholar] [CrossRef] [PubMed]
- Alves, R.C.; Prestes, J.; Enes, A.; de Moraes, W.M.A.; Trindade, T.B.; de Salles, B.F.; Aragon, A.A.; Souza-Junior, T.P. Training programs designed for muscle hypertrophy in bodybuilders: A narrative review. Sports 2020, 8, 149. [Google Scholar] [CrossRef] [PubMed]
- Schoenfeld, B. The Use of Specialized Training Techniques to Maximize Muscle Hypertrophy. Strength Cond. J. 2011, 33, 60–65. [Google Scholar] [CrossRef]
- de Almeida, F.N.; Lopes, C.R.; da Conceição, R.M.; Oenning, L.; Crisp, A.H.; de Sousa, N.M.F.; Trindade, T.B.; Willardson, J.M.; Prestes, J. Acute Effects of the New Method Sarcoplasma Stimulating Training versus Traditional Resistance Training on Total Training Volume, Lactate and Muscle Thickness. Front. Physiol. 2019, 10, 579. [Google Scholar] [CrossRef]
- Marshall, P.W.M.; Robbins, D.A.; Wrightson, A.W.; Siegler, J.C. Acute neuromuscular and fatigue responses to the rest-pause method. J. Sci. Med. Sport 2012, 15, 153–158. [Google Scholar] [CrossRef]
- De Camargo, J.B.B.; Zaroni, R.S.; Júnior, A.C.T.; De Oliveira, T.P.; Trindade, T.B.; Lopes, C.R.; Brigatto, F.A. Tri-Set Training System Induces a High Muscle Swelling with Short Time Commitment in Resistance-Trained Subjects: A Cross-Over Study. Int. J. Exerc. Sci. 2022, 15, 561. [Google Scholar] [PubMed]
- Herzog, W. The role of titin in eccentric muscle contraction. J. Exp. Biol. 2014, 217, 2825–2833. [Google Scholar] [CrossRef] [PubMed]
- Goubel, F. Series elasticity behavior during the stretch-shortening cycle. J. Appl. Biomech. 1997, 13, 439–443. [Google Scholar] [CrossRef]
- Kubo, K.; Kawakami, Y.; Fukunaga, T. Influence of elastic properties of tendon structures on jump performance in humans. J. Appl. Physiol. 1999, 87, 2090–2096. [Google Scholar] [CrossRef] [PubMed]
- Akima, H.; Saito, A.; Watanabe, K.; Kouzaki, M. Alternate muscle activity patterns among synergists of the quadriceps femoris including the vastus intermedius during low-level sustained contraction in men. Muscle Nerve 2012, 46, 86–95. [Google Scholar] [CrossRef] [PubMed]
- Akima, H.; Foley, J.M.; Prior, B.M.; Dudley, G.A.; Meyer, R.A. Vastus lateralis fatigue alters recruitment of musculus quadriceps femoris in humans. J. Appl. Physiol. 2002, 92, 679–684. [Google Scholar] [CrossRef] [PubMed]
- Bouillard, K.; Jubeau, M.; Nordez, A.; Hug, F. Effect of vastus lateralis fatigue on load sharing between quadriceps femoris muscles during isometric knee extensions. J. Neurophysiol. 2014, 111, 768–776. [Google Scholar] [CrossRef] [PubMed]
- Joyner, M.J.; Casey, D.P. Regulation of increased blood flow (hyperemia) to muscles during exercise: A hierarchy of competing physiological needs. Physiol. Rev. 2015, 95, 549–601. [Google Scholar] [CrossRef]
- dos Santos Albarello, J.C.; Cabral, H.V.; Leitão, B.F.M.; Halmenschlager, G.H.; Lulic-Kuryllo, T.; da Matta, T.T. Non-uniform excitation of pectoralis major induced by changes in bench press inclination leads to uneven variations in the cross-sectional area measured by panoramic ultrasonography. J. Electromyogr. Kinesiol. 2022, 67, 102722. [Google Scholar] [CrossRef]
- Hirono, T.; Ikezoe, T.; Taniguchi, M.; Tanaka, H.; Saeki, J.; Yagi, M.; Umehara, J.; Ichihashi, N. Relationship Between Muscle Swelling and Hypertrophy Induced by Resistance Training. J. Strength Cond. Res. 2020, 36, 359–364. [Google Scholar] [CrossRef]
- Damas, F.; Phillips, S.M.; Lixandrão, M.E.; Vechin, F.C.; Libardi, C.A.; Roschel, H.; Tricoli, V.; Ugrinowitsch, C. Early resistance training-induced increases in muscle cross-sectional area are concomitant with edema-induced muscle swelling. Eur. J. Appl. Physiol. 2016, 116, 49–56. [Google Scholar] [CrossRef] [PubMed]
- Santos Junior, E.R.T.; de Salles, B.F.; Dias, I.; Ribeiro, A.S.; Simão, R.; Willardson, J.M. Classification and determination model of resistance training status. Strength Cond. J. 2021, 43, 77–86. [Google Scholar] [CrossRef]
- Genner, K.M.; Weston, M. A comparison of workload quantification methods in relation to physiological responses to resistance exercise. J. Strength Cond. Res. 2014, 28, 2621–2627. [Google Scholar] [CrossRef] [PubMed]
- Baechle, T.; Earle, R.; Wathen, D. Resistance Training. Essent. Strength Cond. 2008, 26, 382–412. [Google Scholar]
- Brown, L.E.; Weir, J.P. ASEP procedures recommendation I: Accurate assessment of muscular strength and power. J. Exerc. Physiol. Online 2001, 4, 1–21. [Google Scholar]
- Abe, T.; DeHoyos, D.V.; Pollock, M.L.; Garzarella, L. Time course for strength and muscle thickness changes following upper and lower body resistance training in men and women. Eur. J. Appl. Physiol. Occup. Physiol. 2000, 81, 174–180. [Google Scholar] [CrossRef] [PubMed]
- Chen, H.-L.; Nosaka, K.; Pearce, A.J.; Chen, T.C. Two maximal isometric contractions attenuate the magnitude of eccentric exercise-induced muscle damage. Appl. Physiol. Nutr. Metab. 2012, 37, 680–689. [Google Scholar] [CrossRef] [PubMed]
- Laerd Statistics. Two-Way Repeated Measures ANOVA Using SPSS Statistics. Stat. Tutorials Software. Guidance. 2015. Available online: https://statistics.laerd.com/spss-tutorials/two-way-repeated-measures-anova-using-spss-statistics.php (accessed on 20 October 2022).
- Serdar, C.C.; Cihan, M.; Yücel, D.; Serdar, M.A. Sample size, power and effect size revisited: Simplified and practical approaches in pre-clinical, clinical and laboratory studies. Biochem. Med. 2021, 31, 27–53. [Google Scholar] [CrossRef]
- Swinton, P.A.; Hemingway, B.S.; Saunders, B.; Gualano, B.; Dolan, E. A statistical framework to interpret individual response to intervention: Paving the way for personalized nutrition and exercise prescription. Front. Nutr. 2018, 5, 41. [Google Scholar] [CrossRef]
- Samsa, G.; Edelman, D.; Rothman, M.L.; Williams, G.R.; Lipscomb, J.; Matchar, D. Determining clinically important differences in health status measures. Pharmacoeconomics 1999, 15, 141–155. [Google Scholar] [CrossRef]
- Copay, A.G.; Subach, B.R.; Glassman, S.D.; Polly, D.W., Jr.; Schuler, T.C. Understanding the minimum clinically important difference: A review of concepts and methods. Spine J. 2007, 7, 541–546. [Google Scholar] [CrossRef] [PubMed]
- Faul, F.; Erdfelder, E.; Lang, A.-G.; Buchner, A. G* Power 3: A flexible statistical power analysis program for the social, behavioral, and biomedical sciences. Behav. Res. Methods 2007, 39, 175–191. [Google Scholar] [CrossRef] [PubMed]
- Gandevia, S.C. Spinal and supraspinal factors in human muscle fatigue. Physiol. Rev. 2001, 81, 1725–1789. [Google Scholar] [CrossRef] [PubMed]
- Chen, T.C.; Lin, K.-Y.; Chen, H.-L.; Lin, M.-J.; Nosaka, K. Comparison in eccentric exercise-induced muscle damage among four limb muscles. Eur. J. Appl. Physiol. 2011, 111, 211–223. [Google Scholar] [CrossRef] [PubMed]
- Nosaka, K.; Sakamoto, K.E.I. Effect of elbow joint angle on the magnitude of muscle damage to the elbow flexors. Med. Sci. Sports Exerc. 2001, 33, 22–29. [Google Scholar] [CrossRef] [PubMed]
- McHugh, M.P.; Connolly, D.A.J.; Eston, R.G.; Gleim, G.W. Exercise-induced muscle damage and potential mechanisms for the repeated bout effect. Sports Med. 1999, 27, 157–170. [Google Scholar] [CrossRef] [PubMed]
- Markus, I.; Constantini, K.; Hoffman, J.R.; Bartolomei, S.; Gepner, Y. Exercise-induced muscle damage: Mechanism, assessment and nutritional factors to accelerate recovery. Eur. J. Appl. Physiol. 2021, 121, 969–992. [Google Scholar] [CrossRef] [PubMed]
- Allen, T.J.; Jones, T.; Tsay, A.; Morgan, D.L.; Proske, U. Muscle damage produced by isometric contractions in human elbow flexors. J. Appl. Physiol. 2018, 124, 388–399. [Google Scholar] [CrossRef]
- Lieber, R.L.; Friden, J. Muscle damage is not a function of muscle force but active muscle strain. J. Appl. Physiol. 1993, 74, 520–526. [Google Scholar] [CrossRef]


| Mean ± Standard Deviation | |
|---|---|
| Age (years) | 27.7 ± 6.4 |
| Body mass (kg) | 78.4 ± 11.4 |
| Height (cm) | 174.8 ± 4.9 |
| BMI (kg/m2) | 25.6 ± 2.8 |
| 1 RM (kg) | 107.6 ± 16.8 |
| 1 RM relative (kg/kg) | 1.38 ± 0.17 |
| Training experience (years) | 5.86 ± 4.7 |
| Sets/week—bench press | 8.4 ± 3.6 |
| Sets/week—pectoralis major | 25.8 ± 3.6 |
Disclaimer/Publisher’s Note: The statements, opinions and data contained in all publications are solely those of the individual author(s) and contributor(s) and not of MDPI and/or the editor(s). MDPI and/or the editor(s) disclaim responsibility for any injury to people or property resulting from any ideas, methods, instructions or products referred to in the content. |
© 2023 by the authors. Licensee MDPI, Basel, Switzerland. This article is an open access article distributed under the terms and conditions of the Creative Commons Attribution (CC BY) license (https://creativecommons.org/licenses/by/4.0/).
Share and Cite
Trindade, T.B.; Alves, R.C.; Sousa, N.M.F.d.; Lopes, C.; Castro, B.M.d.; Rosa, T.S.; Prestes, J. Acute Effect of the “Zero Point” Method on Muscle Thickness and Muscle Damage in Trained Men. Sports 2024, 12, 6. https://doi.org/10.3390/sports12010006
Trindade TB, Alves RC, Sousa NMFd, Lopes C, Castro BMd, Rosa TS, Prestes J. Acute Effect of the “Zero Point” Method on Muscle Thickness and Muscle Damage in Trained Men. Sports. 2024; 12(1):6. https://doi.org/10.3390/sports12010006
Chicago/Turabian StyleTrindade, Thiago B., Ragami C. Alves, Nuno Manuel Frade de Sousa, Charles Lopes, Bruno Magalhães de Castro, Thiago S. Rosa, and Jonato Prestes. 2024. "Acute Effect of the “Zero Point” Method on Muscle Thickness and Muscle Damage in Trained Men" Sports 12, no. 1: 6. https://doi.org/10.3390/sports12010006