
The Positive Effect of Four-Week Combined Aerobic–Resistance Training on Body Composition and Adipokine Levels in Obese Females
 ,
,  , and
, and
Abstract
:1. Introduction
2. Materials and Methods
2.1. Research Study Design
2.2. Aerobic, Resistance, and Combined Aerobic–Resistance Training Intervention
2.3. Blood Sample Collection and Adipokine Level Analysis
2.4. Statistical Analysis
3. Results
4. Discussion
5. Conclusions
Author Contributions
Funding
Institutional Review Board Statement
Informed Consent Statement
Data Availability Statement
Acknowledgments
Conflicts of Interest
References
- González-Muniesa, P.; Mártinez-González, M.A.; Hu, F.B.; Després, J.P.; Matsuzawa, Y.; Loos, R.J.F.; Moreno, L.A.; Bray, G.A.; Martinez, J.A. Obesity. Nat. Rev. Dis. Prim. 2017, 3, 17034. [Google Scholar] [CrossRef] [PubMed]
- Blüher, M. Obesity: Global epidemiology and pathogenesis. Nat. Rev. Endocrinol. 2019, 15, 288–298. [Google Scholar] [CrossRef] [PubMed]
- NCD Risk Factor Collaboration (NCD-RisC). Worldwide trends in body-mass index, underweight, overweight, and obesity from 1975 to 2016: A pooled analysis of 2416 population-based measurement studies in 128·9 million children, adolescents, and adults. Lancet 2017, 390, 2627–2642. [Google Scholar] [CrossRef] [PubMed]
- Pi-Sunyer, X. The medical risks of obesity. Postgrad. Med. 2009, 121, 21–33. [Google Scholar] [CrossRef] [PubMed]
- McArdle, M.A.; Finucane, O.M.; Connaughton, R.M.; McMorrow, A.M.; Roche, H.M. Mechanisms of obesity-induced inflammation and insulin resistance: Insights into the emerging role of nutritional strategies. Front. Endocrinol. 2013, 4, 52. [Google Scholar] [CrossRef]
- Makki, K.; Froguel, P.; Wolowczuk, I. Adipose tissue in obesity-related inflammation and insulin resistance: Cells, cytokines, and chemokines. ISRN Inflamm. 2013, 2013, 139239. [Google Scholar] [CrossRef]
- Kern, L.; Mittenbühler, M.J.; Vesting, A.J.; Ostermann, A.L.; Wunderlich, C.M.; Wunderlich, F.T. Obesity-Induced TNFα and IL-6 Signaling: The Missing Link between Obesity and Inflammation-Driven Liver and Colorectal Cancers. Cancers 2018, 11, 24. [Google Scholar] [CrossRef]
- Carbone, F.; La Rocca, C.; Matarese, G. Immunological functions of leptin and adiponectin. Biochimie 2012, 94, 2082–2088. [Google Scholar] [CrossRef]
- Yadav, A.; Kataria, M.A.; Saini, V.; Yadav, A. Role of leptin and adiponectin in insulin resistance. Clin. Chim. Acta 2013, 417, 80–84. [Google Scholar] [CrossRef]
- Izquierdo, A.G.; Crujeiras, A.B.; Casanueva, F.F.; Carreira, M.C. Leptin, Obesity, and Leptin Resistance: Where Are We 25 Years Later? Nutrients 2019, 11, 2704. [Google Scholar] [CrossRef]
- Khoramipour, K.; Chamari, K.; Hekmatikar, A.A.; Ziyaiyan, A.; Taherkhani, S.; Elguindy, N.M.; Bragazzi, N.L. Adiponectin: Structure, Physiological Functions, Role in Diseases, and Effects of Nutrition. Nutrients 2021, 13, 1180. [Google Scholar] [CrossRef] [PubMed]
- Jung, U.J.; Choi, M.S. Obesity and its metabolic complications: The role of adipokines and the relationship between obesity, inflammation, insulin resistance, dyslipidemia and nonalcoholic fatty liver disease. Int. J. Mol. Sci. 2014, 15, 6184–6223. [Google Scholar] [CrossRef] [PubMed]
- Pranoto, A.; Rejeki, P.S.; Miftahussurur, M.; Setiawan, H.K.; Yosika, G.F.; Munir, M.; Maesaroh, S.; Purwoto, S.P.; Waritsu, C.; Yamaoka, Y. Single 30 min treadmill exercise session suppresses the production of pro-inflammatory cytokines and oxidative stress in obese female adolescents. J. Basic Clin. Physiol. Pharmacol. 2023, 34, 235–242. [Google Scholar] [CrossRef] [PubMed]
- Akbarpour, M. The effect of aerobic training on serum adiponectin and leptin levels and inflammatory markers of coronary heart disease in obese men. Biol. Sport 2013, 30, 21–27. [Google Scholar] [CrossRef]
- Bharath, L.P.; Choi, W.W.; Cho, J.M.; Skobodzinski, A.A.; Wong, A.; Sweeney, T.E.; Park, S.Y. Combined resistance and aerobic exercise training reduces insulin resistance and central adiposity in adolescent girls who are obese: Randomized clinical trial. Eur. J. Appl. Physiol. 2018, 118, 1653–1660. [Google Scholar] [CrossRef]
- Park, K.M.; Park, S.C.; Kang, S. Effects of resistance exercise on adipokine factors and body composition in pre- and postmenopausal women. J. Exerc. Rehabil. 2019, 15, 676–682. [Google Scholar] [CrossRef]
- Ataeinosrat, A.; Haghighi, M.M.; Abednatanzi, H.; Soltani, M.; Ghanbari-Niaki, A.; Nouri-Habashi, A.; Amani-Shalamzari, S.; Mossayebi, A.; Khademosharie, M.; Johnson, K.E.; et al. Effects of Three Different Modes of Resistance Training on Appetite Hormones in Males with Obesity. Front. Physiol. 2022, 13, 827335. [Google Scholar] [CrossRef]
- Out, L.I.; Out, A. Adiponectin and the Control of Metabolic Dysfunction: Is Exercise the Magic Bullet? Front. Physiol. 2021, 12, 651732. [Google Scholar]
- Ahmadizad, S.; Haghighi, A.H.; Hamedinia, M.R. Effects of resistance versus endurance training on serum adiponectin and insulin resistance index. Eur. J. Endocrinol. 2007, 157, 625–631. [Google Scholar] [CrossRef]
- Li, S.; Kim, J.Y.; Sim, Y.J. Effects of 10-week combined training on lipid metabolic regulatory hormones and metabolic syndrome index according to exercise dose in obese male college students. J. Exerc. Rehabil. 2020, 16, 101–107. [Google Scholar] [CrossRef]
- Higgins, J.K.; Kleimbaun, A.P. Design Methodology for Randomized Clinical Trials; Family Health International: Arlington, VA, USA, 1985; pp. 24–25. [Google Scholar]
- Ackel-D’Elia, C.; Carnier, J.; Bueno, C.R.; Campos, R.M., Jr.; Sanches, P.L.; Clemente, A.P.; Tufik, S.; de Mello, M.T.; Dâmaso, A.R. Effects of different physical exercises on leptin concentration in obese adolescents. Int. J. Sports Med. 2014, 35, 164–171. [Google Scholar] [CrossRef]
- Sugiharto, S.; Merawati, D.; Pranoto, A.; Rejeki, P.S.; Lupita, M.N.; Adji, B.S.; Susanto, H.; Taufiq, A. Acute Interval and Continuous Moderate-Intensity Exercise Enhanced Circadian Thermogenic Activity through Browning-related Genes in Obese Adolescent Female. Mal. J. Fund. Appl. Sci. 2021, 17, 566–581. [Google Scholar] [CrossRef]
- Rejeki, P.S.; Baskara, P.G.; Herawati, L.; Pranoto, A.; Setiawan, H.K.; Lesmana, R.; Halim, S. Moderate-intensity exercise decreases the circulating level of betatrophin and its correlation among markers of obesity in women. J. Basic Clin. Physiol. Pharmacol. 2022, 33, 769–777. [Google Scholar] [CrossRef]
- Daskalopoulou, S.S.; Cooke, A.B.; Gomez, Y.H.; Mutter, A.F.; Filippaios, A.; Mesfum, E.T.; Mantzoros, C.S. Plasma irisin levels progressively increase in response to increasing exercise workloads in young, healthy, active subjects. Eur. J. Endocrinol. 2014, 171, 343–352. [Google Scholar] [CrossRef] [PubMed]
- World Health Organization (WHO). Obesity and Overweight; WHO Press: Geneva, Switzerland, 2020. [Google Scholar]
- Karastergiou, K.; Smith, S.R.; Greenberg, A.S.; Fried, S.K. Sex differences in human adipose tissues-the biology of pear shape. Biol. Sex Differ. 2012, 3, 13. [Google Scholar] [CrossRef]
- Lim, J.U.; Lee, J.H.; Kim, J.S.; Hwang, Y.I.; Kim, T.H.; Lim, S.Y.; Yoo, K.H.; Jung, K.S.; Kim, Y.K.; Rhee, C.K. Comparison of World Health Organization and Asia-Pacific body mass index classifications in COPD patients. Int. J. Chron. Obstruct. Pulmon. Dis. 2017, 12, 2465–2475. [Google Scholar] [CrossRef]
- Gonzalez-Gil, A.M.; Elizondo-Montemayor, L. The Role of Exercise in the Interplay between Myokines, Hepatokines, Osteokines, Adipokines, and Modulation of Inflammation for Energy Substrate Redistribution and Fat Mass Loss: A Review. Nutrients 2020, 12, 1899. [Google Scholar] [CrossRef] [PubMed]
- Golbidi, S.; Laher, I. Exercise induced adipokine changes and the metabolic syndrome. J. Diabetes Res. 2014, 2014, 726861. [Google Scholar] [CrossRef]
- Thorogood, A.; Mottillo, S.; Shimony, A.; Filion, K.B.; Joseph, L.; Genest, J.; Pilote, L.; Poirier, P.; Schiffrin, E.L.; Eisenberg, M.J. Isolated aerobic exercise and weight loss: A systematic review and meta-analysis of randomized controlled trials. Am. J. Med. 2011, 124, 747–755. [Google Scholar] [CrossRef]
- Koh, J.H.; Pataky, M.W.; Dasari, S.; Klaus, K.A.; Vuckovic, I.; Ruegsegger, G.N.; Kumar, A.P.; Robinson, M.M.; Nair, K.S. Enhancement of anaerobic glycolysis-a role of PGC-1α4 in resistance exercise. Nat. Commun. 2022, 13, 2324. [Google Scholar] [CrossRef]
- Moradi, F. Changes of Serum Adiponectin and Testosterone Concentrations Following Twelve Weeks Resistance Training in Obese Young Men. Asian J. Sports Med. 2015, 6, e23808. [Google Scholar] [CrossRef] [PubMed]
- Dieli-Conwright, C.M.; Courneya, K.S.; Demark-Wahnefried, W.; Sami, N.; Lee, K.; Buchanan, T.A.; Spicer, D.V.; Tripathy, D.; Bernstein, L.; Mortimer, J.E. Effects of Aerobic and Resistance Exercise on Metabolic Syndrome, Sarcopenic Obesity, and Circulating Biomarkers in Overweight or Obese Survivors of Breast Cancer: A Randomized Controlled Trial. J. Clin. Oncol. 2018, 36, 875–883. [Google Scholar] [CrossRef]
- Brunelli, D.T.; Chacon-Mikahil, M.P.; Gáspari, A.F.; Lopes, W.A.; Bonganha, V.; Bonfante, I.L.; Bellotto, M.L.; Libardi, C.A.; Cavaglieri, C.R. Combined Training Reduces Subclinical Inflammation in Obese Middle-Age Men. Med. Sci. Sports Exerc. 2015, 47, 2207–2215. [Google Scholar] [CrossRef] [PubMed]
- Lopes, W.A.; Leite, N.; da Silva, L.R.; Brunelli, D.T.; Gáspari, A.F.; Radominski, R.B.; Chacon-Mikahil, M.P.; Cavaglieri, C.R. Effects of 12 weeks of combined training without caloric restriction on inflammatory markers in overweight girls. J. Sports Sci. 2016, 34, 1902–1912. [Google Scholar] [CrossRef] [PubMed]
- Muscella, A.; Stefàno, E.; Lunetti, P.; Capobianco, L.; Marsigliante, S. The Regulation of Fat Metabolism During Aerobic Exercise. Biomolecules 2020, 10, 1699. [Google Scholar] [CrossRef] [PubMed]
- Egan, B.; Zierath, J.R. Exercise metabolism and the molecular regulation of skeletal muscle adaptation. Cell. Metab. 2013, 17, 162–184. [Google Scholar] [CrossRef] [PubMed]
- Strasser, B.; Arvandi, M.; Siebert, U. Resistance training, visceral obesity and inflammatory response: A review of the evidence. Obes. Rev. 2012, 13, 578–591. [Google Scholar] [CrossRef]
- Pedersen, B.K. Muscles and their myokines. J. Exp. Biol. 2011, 214, 337–346. [Google Scholar] [CrossRef]
- Leal, L.G.; Lopes, M.A.; Batista, M.L., Jr. Physical Exercise-Induced Myokines and Muscle-Adipose Tissue Crosstalk: A Review of Current Knowledge and the Implications for Health and Metabolic Diseases. Front. Physiol. 2018, 9, 1307. [Google Scholar] [CrossRef]
- Yamauchi, T.; Kadowaki, T. Adiponectin receptor as a key player in healthy longevity and obesity-related diseases. Cell Metab. 2013, 17, 185–196. [Google Scholar] [CrossRef]
- Ye, R.; Scherer, P.E. Adiponectin, driver or passenger on the road to insulin sensitivity? Mol. Metab. 2013, 2, 133–141. [Google Scholar] [CrossRef] [PubMed]
- Liu, J.; Yang, X.; Yu, S.; Zheng, R. The Leptin Resistance. Adv. Exp. Med. Biol. 2018, 1090, 145–163. [Google Scholar] [PubMed]
- Obradovic, M.; Sudar-Milovanovic, E.; Soskic, S.; Essack, M.; Arya, S.; Stewart, A.J.; Gojobori, T.; Isenovic, E.R. Leptin and Obesity: Role and Clinical Implication. Front. Endocrinol. 2021, 12, 585887. [Google Scholar] [CrossRef] [PubMed]
- Peng, J.; Yin, L.; Wang, X. Central and peripheral leptin resistance in obesity and improvements of exercise. Horm. Behav. 2021, 133, 105006. [Google Scholar] [CrossRef] [PubMed]
- Gruzdeva, O.; Borodkina, D.; Uchasova, E.; Dyleva, Y.; Barbarash, O. Leptin resistance: Underlying mechanisms and diagnosis. Diabetes Metab. Syndr. Obes. 2019, 12, 191–198. [Google Scholar] [CrossRef]
- Sigal, R.J.; Alberga, A.S.; Goldfield, G.S.; Prud’homme, D.; Hadjiyannakis, S.; Gougeon, R.; Phillips, P.; Tulloch, H.; Malcolm, J.; Doucette, S.; et al. Effects of aerobic training, resistance training, or both on percentage body fat and cardiometabolic risk markers in obese adolescents: The healthy eating aerobic and resistance training in youth randomized clinical trial. JAMA Pediatr. 2014, 168, 1006–1014. [Google Scholar] [CrossRef]
- Xiao, T.; Fu, Y.F. Resistance training vs. aerobic training and role of other factors on the exercise effects on visceral fat. Eur. Rev. Med. Pharmacol. Sci. 2015, 19, 1779–1784. [Google Scholar]
- Yanai, H.; Yoshida, H. Beneficial Effects of Adiponectin on Glucose and Lipid Metabolism and Atherosclerotic Progression: Mechanisms and Perspectives. Int. J. Mol. Sci. 2019, 20, 1190. [Google Scholar] [CrossRef]


| Parameters | CTL (n = 10) | MAT (n = 10) | MRT (n = 10) | MCT (n = 10) | p-Value |
|---|---|---|---|---|---|
| Age (yrs) | 22.30 ± 1.57 | 21.60 ± 1.65 | 21.80 ± 1.23 | 22.00 ± 0.94 | 0.704 |
| BW (kg) | 75.97 ± 10.61 | 74.88 ± 7.45 | 75.28 ± 9.85 | 75.02 ± 11.65 | 0.995 |
| BH (m) | 1.57 ± 0.06 | 1.56 ± 0.07 | 1.56 ± 0.06 | 1.56 ± 0.05 | 0.960 |
| BMI (kg/m2) | 30.72 ± 3.75 | 30.82 ± 3.55 | 30.96 ± 3.88 | 30.76 ± 3.53 | 0.999 |
| FM (kg) | 34.18 ± 6.94 | 34.06 ± 4.99 | 33.96 ± 6.61 | 32.02 ± 6.73 | 0.854 |
| FM (%) | 39.73 ± 7.07 | 42.71 ± 3.71 | 44.51 ± 4.17 | 42.20 ± 3.54 | 0.194 |
| FMI (kg/m2) | 12.82 ± 2.71 | 12.97 ± 2.48 | 13.85 ± 2.96 | 13.07 ± 2.29 | 0.819 |
| FFM (kg) | 43.62 ± 5.07 | 41.92 ± 3.38 | 41.67 ± 4.51 | 43.40 ± 5.54 | 0.718 |
| FFMI (kg/m2) | 17.50 ± 1.59 | 17.15 ± 1.35 | 16.97 ± 1.06 | 17.77 ± 1.65 | 0.603 |
| SMM (kg) | 19.48 ± 2.76 | 18.69 ± 2.08 | 19.71 ± 4.48 | 20.02 ± 3.17 | 0.820 |
| WC (cm) | 0.92 ± 0.09 | 0.91 ± 0.10 | 0.90 ± 0.05 | 0.89 ± 0.05 | 0.843 |
| HC (cm) | 1.10 ± 0.09 | 1.11 ± 0.15 | 1.09 ± 0.05 | 1.12 ± 0.18 | 0.944 |
| WHR | 0.84 ± 0.05 | 0.83 ± 0.08 | 0.83 ± 0.05 | 0.80 ± 0.09 | 0.739 |
| SBP (mmHg) | 114.80 ± 8.11 | 110.00 ± 8.21 | 114.70 ± 10.20 | 114.40 ± 10.20 | 0.599 |
| DBP (mmHg) | 79.30 ± 8.29 | 79.10 ± 7.19 | 82.90 ± 8.31 | 81.30 ± 5.96 | 0.635 |
| RHR (bpm) | 77.10 ± 9.04 | 76.60 ± 6.19 | 82.10 ± 8.50 | 82.00 ± 6.48 | 0.219 |
| SpO2 (%) | 98.00 ± 0.94 | 96.80 ± 3.22 | 98.20 ± 1.03 | 97.80 ± 1.40 | 0.370 |
| BT (°C) | 36.19 ± 0.35 | 36.25 ± 0.21 | 36.25 ± 0.23 | 36.14 ± 0.17 | 0.711 |
| FBG (mg/dL) | 91.00 ± 6.16 | 92.00 ± 6.04 | 90.40 ± 6.28 | 93.40 ± 4.93 | 0.686 |
| Hb (g/dL) | 14.49 ± 2.69 | 15.69 ± 1.43 | 15.48 ± 1.29 | 15.87 ± 1.93 | 0.390 |
| Time | Group | p-Value | |||
|---|---|---|---|---|---|
| CTL (n = 10) | MAT (n = 10) | MRT (n = 10) | MCT (n = 10) | ||
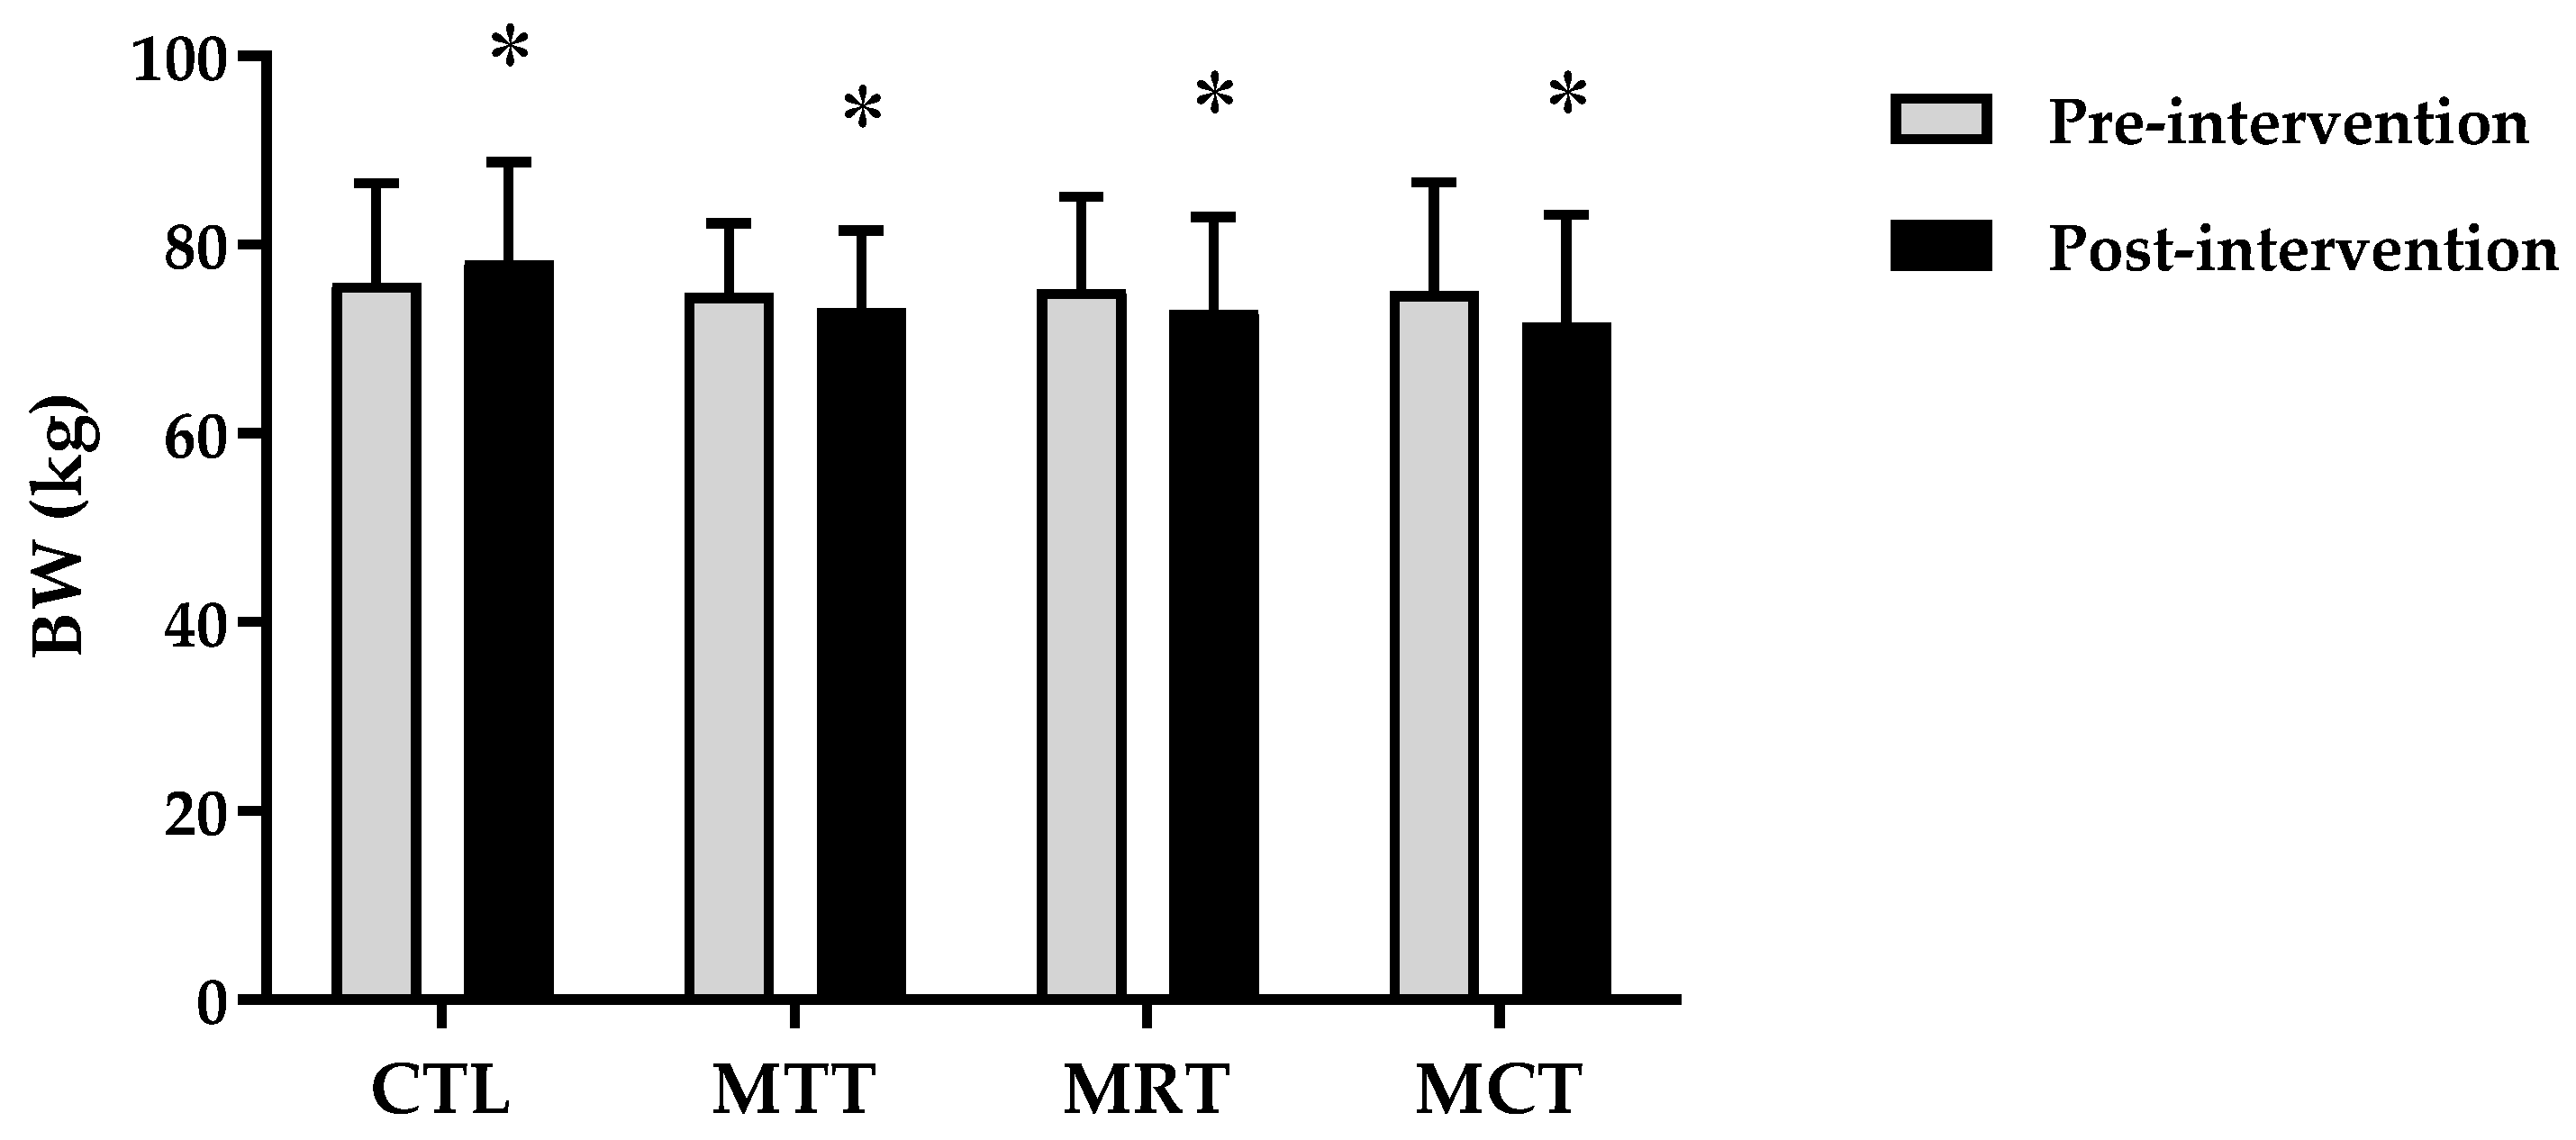
| BW (kg) | |||||
| Pre-intervention | 75.97 ± 10.61 | 74.88 ± 7.45 | 75.28 ± 9.85 | 75.02 ± 11.65 | 0.995 $ |
| Post-intervention | 78.42 ± 10.42 | 73.33 ± 8.25 | 73.14 ± 9.82 | 71.82 ± 11.39 | 0.482 $ |
| Δ Post–Pre | 2.45 ± 0.34 | −1.55 ± 1.32 ** | −2.14 ± 0.15 ** | −3.20 ± 0.48 **†# | 0.000 $ |
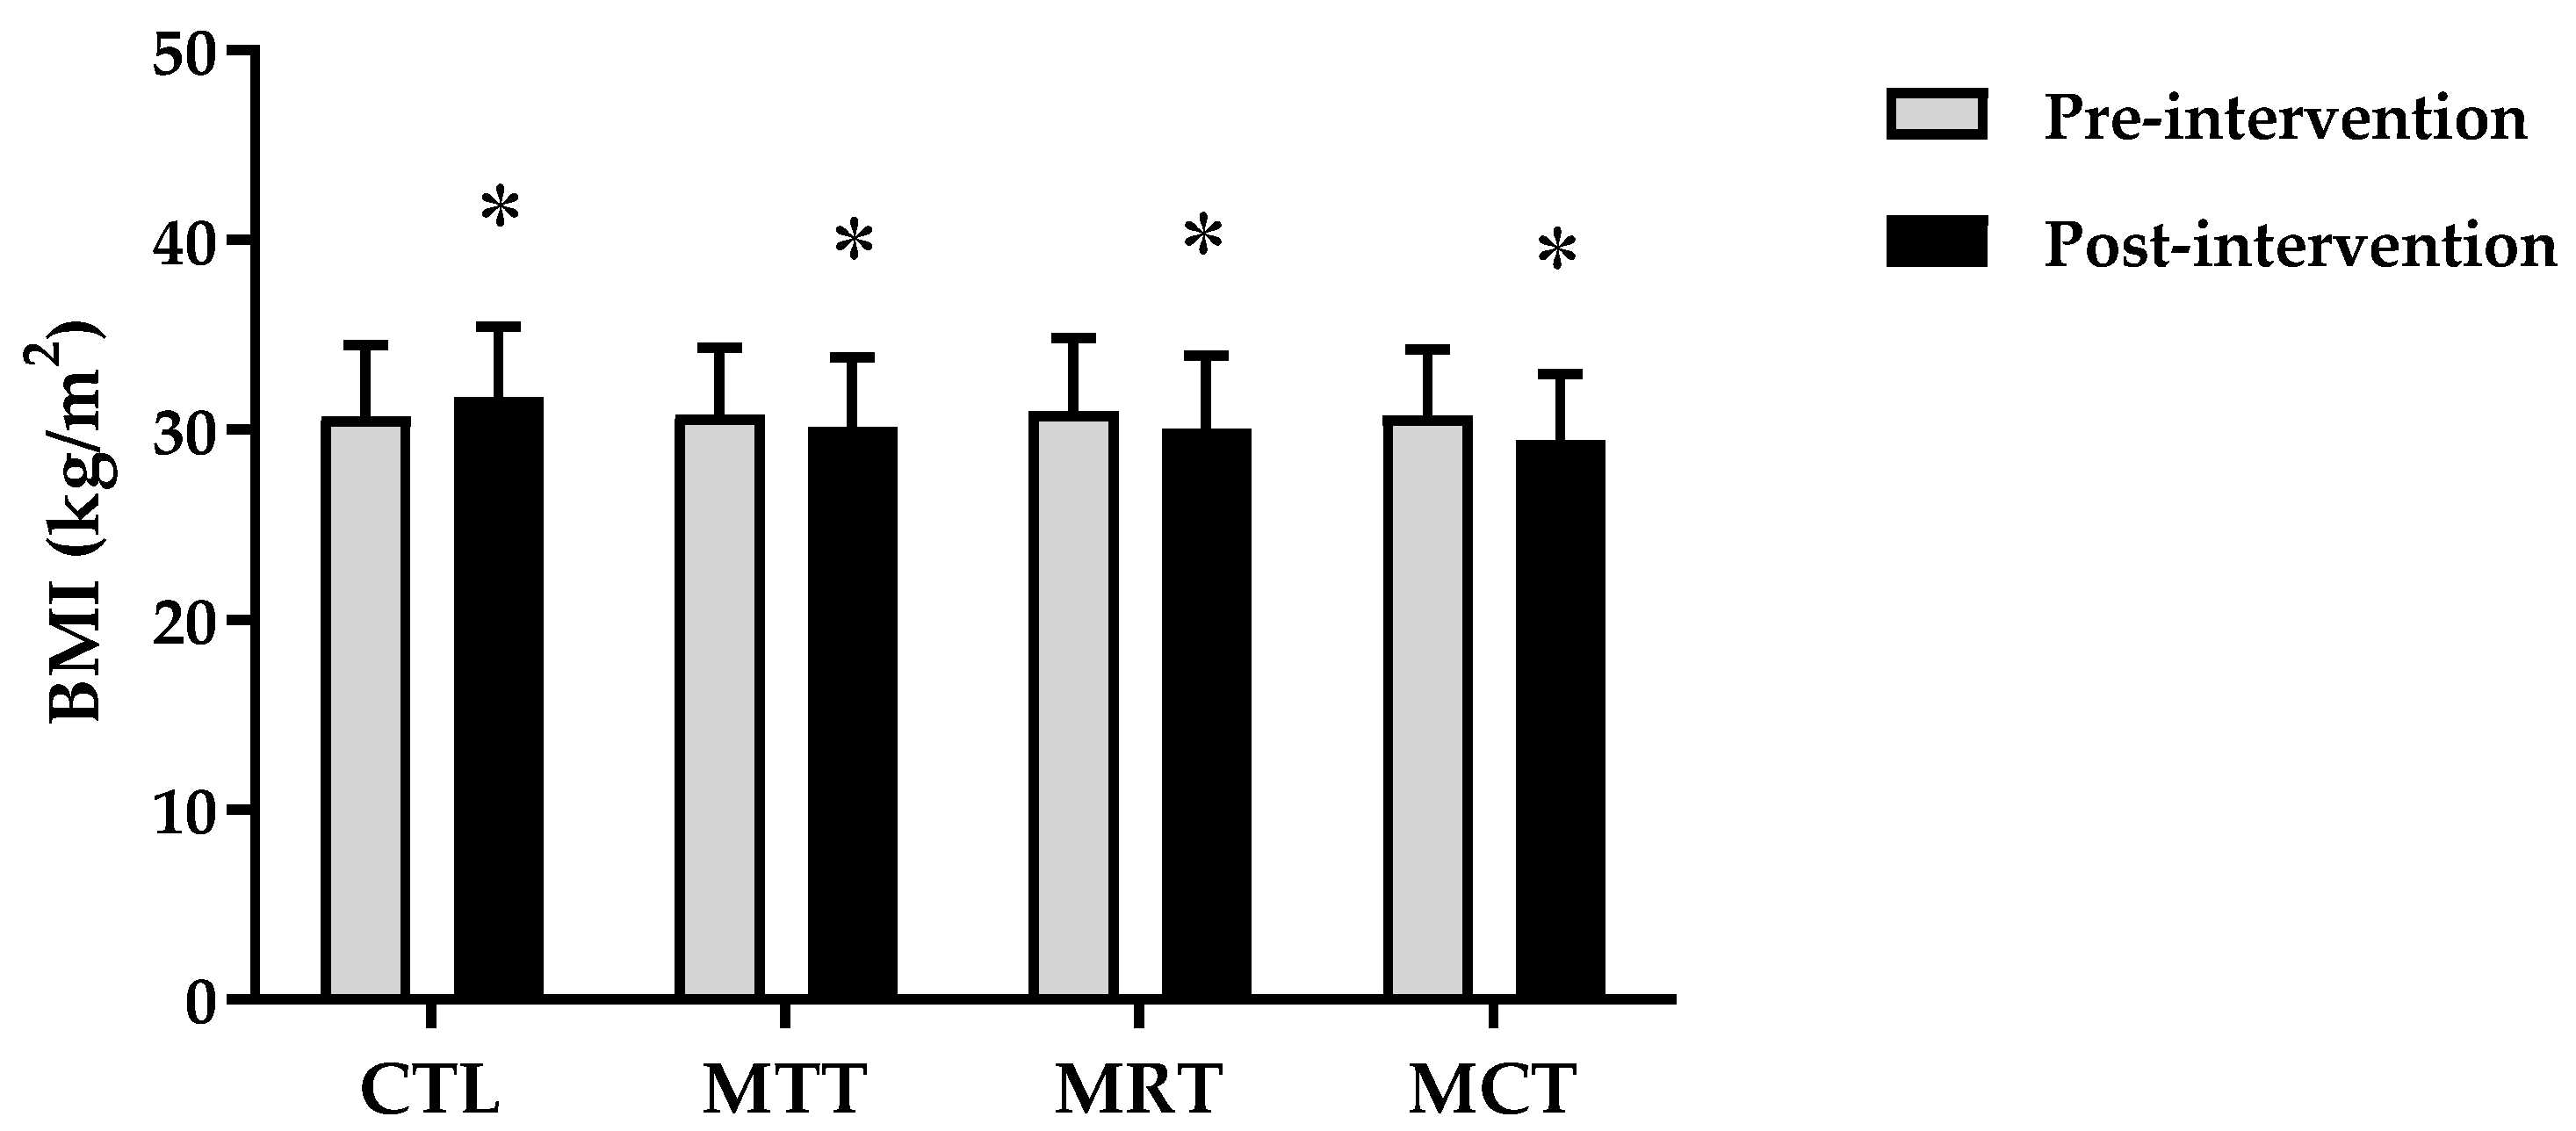
| BMI (kg/m2) | |||||
| Pre-intervention | 30.72 ± 3.75 | 30.82 ± 3.55 | 30.96 ± 3.88 | 30.76 ± 3.53 | 0.999 $ |
| Post-intervention | 31.72 ± 3.71 | 30.16 ± 3.65 | 30.08 ± 3.86 | 29.44 ± 3.50 | 0.563 $ |
| Δ Post–Pre | 0.99 ± 0.19 | −0.66 ± 0.64 ** | −0.88 ± 0.07 ** | −1.31 ± 0.16 **†# | 0.000 $ |
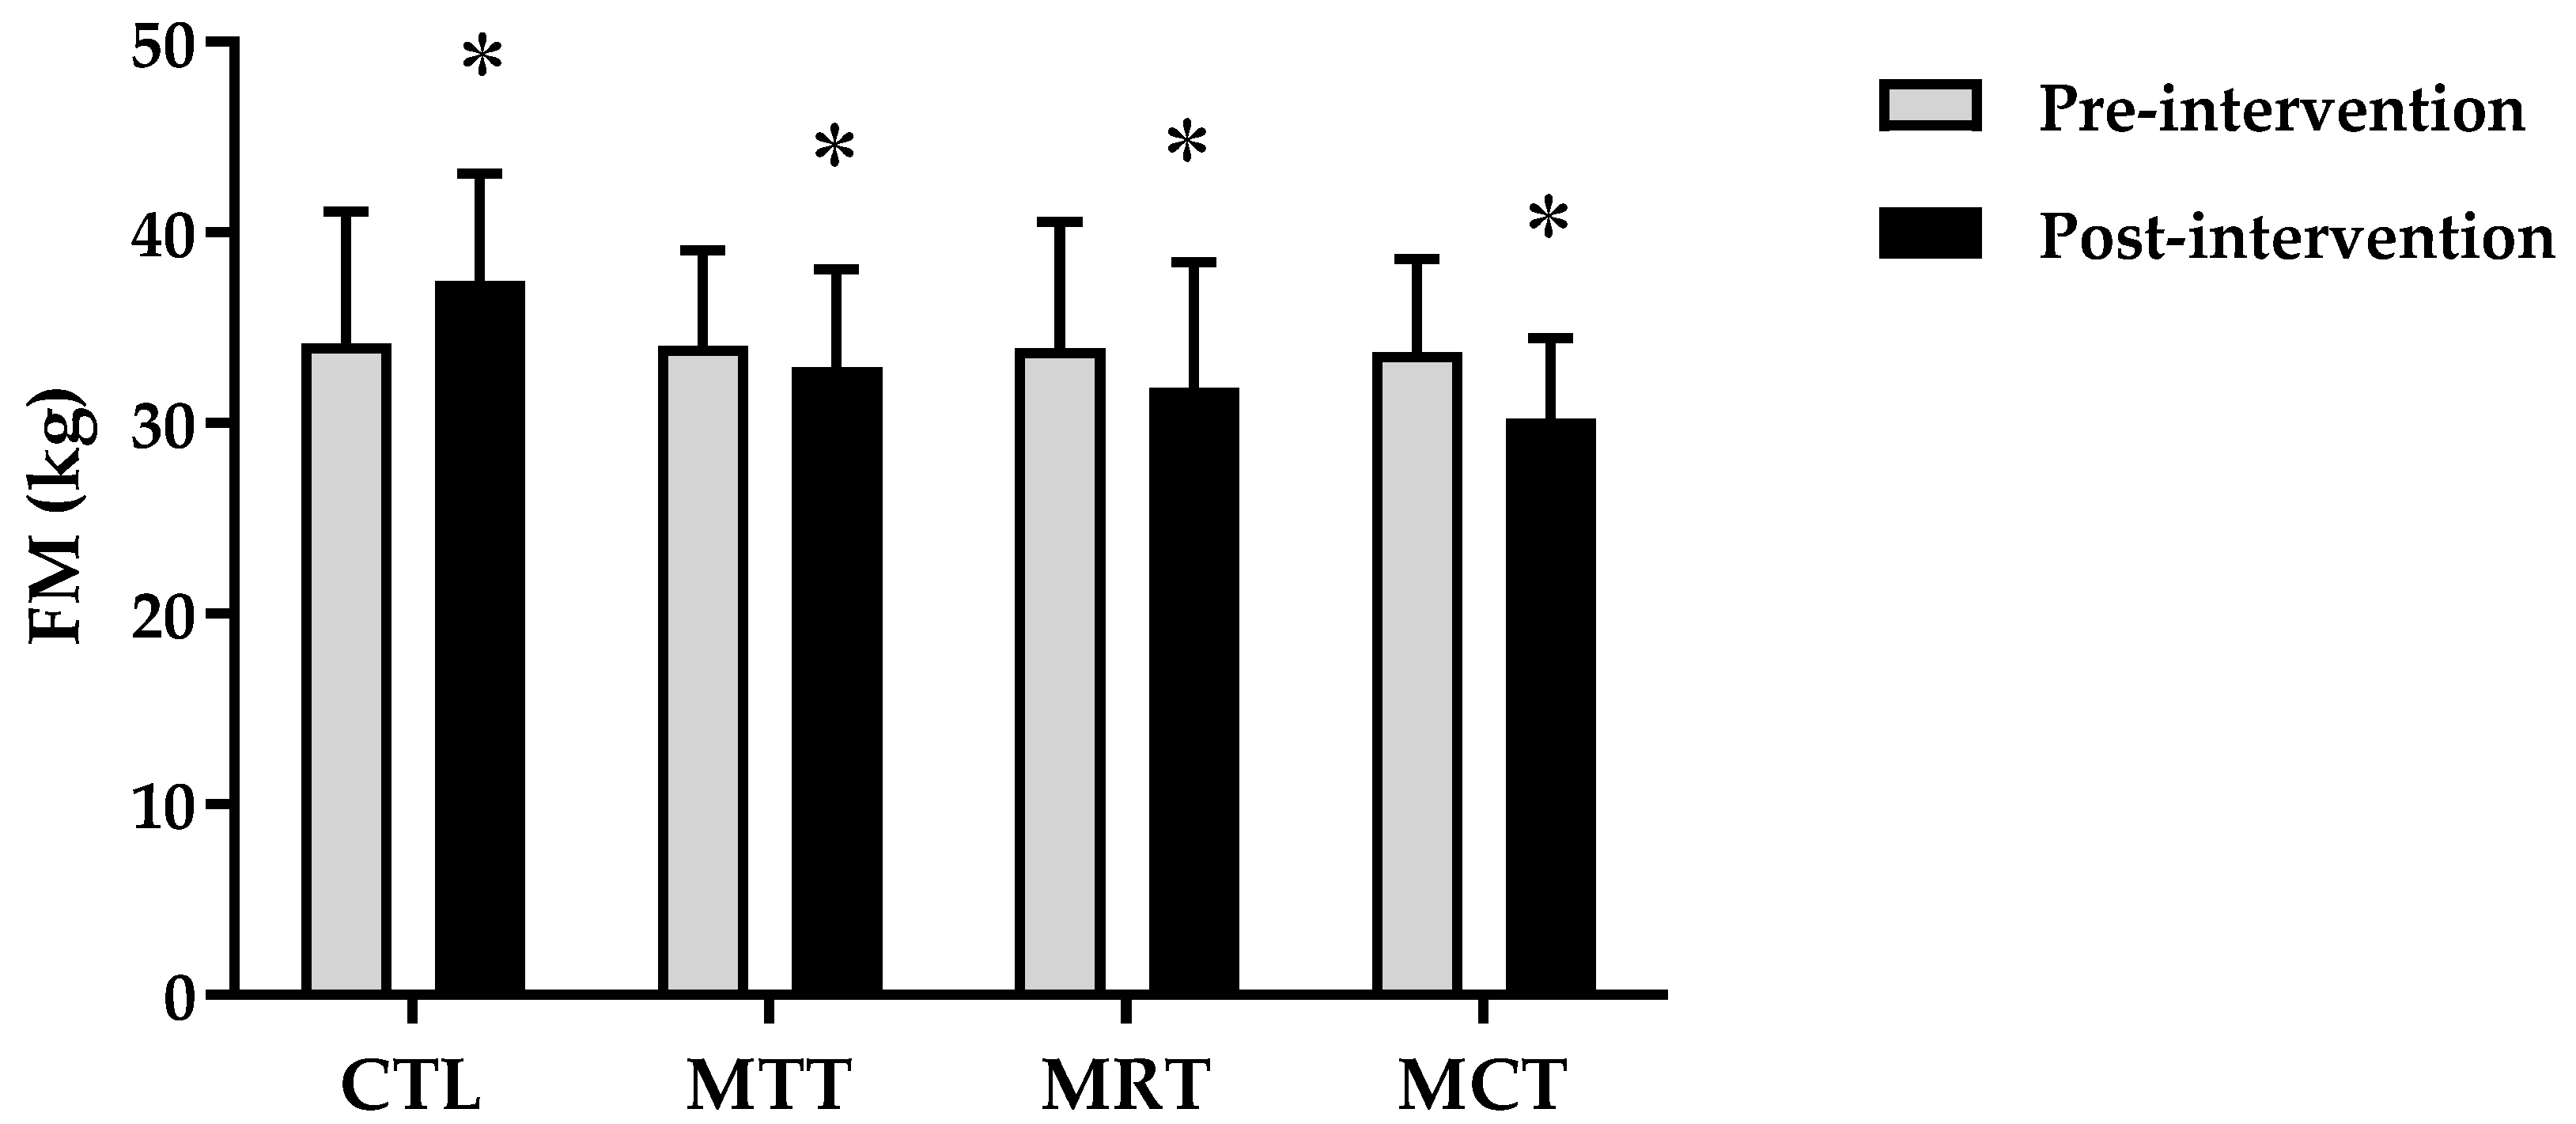
| FM (kg) | |||||
| Pre-intervention | 34.18 ± 6.94 | 34.06 ± 4.99 | 33.96 ± 6.61 | 33.72 ± 4.89 | 0.998 $ |
| Post-intervention | 37.43 ± 5.66 | 32.96 ± 5.12 | 31.87 ± 6.56 | 30.22 ± 4.20 * | 0.035 $ |
| Δ Post–Pre | 3.25 ± 1.42 | −1.11 ± 0.18 ** | −2.09 ± 0.17 ** | −3.50 ± 0.97 **†# | 0.000 $ |
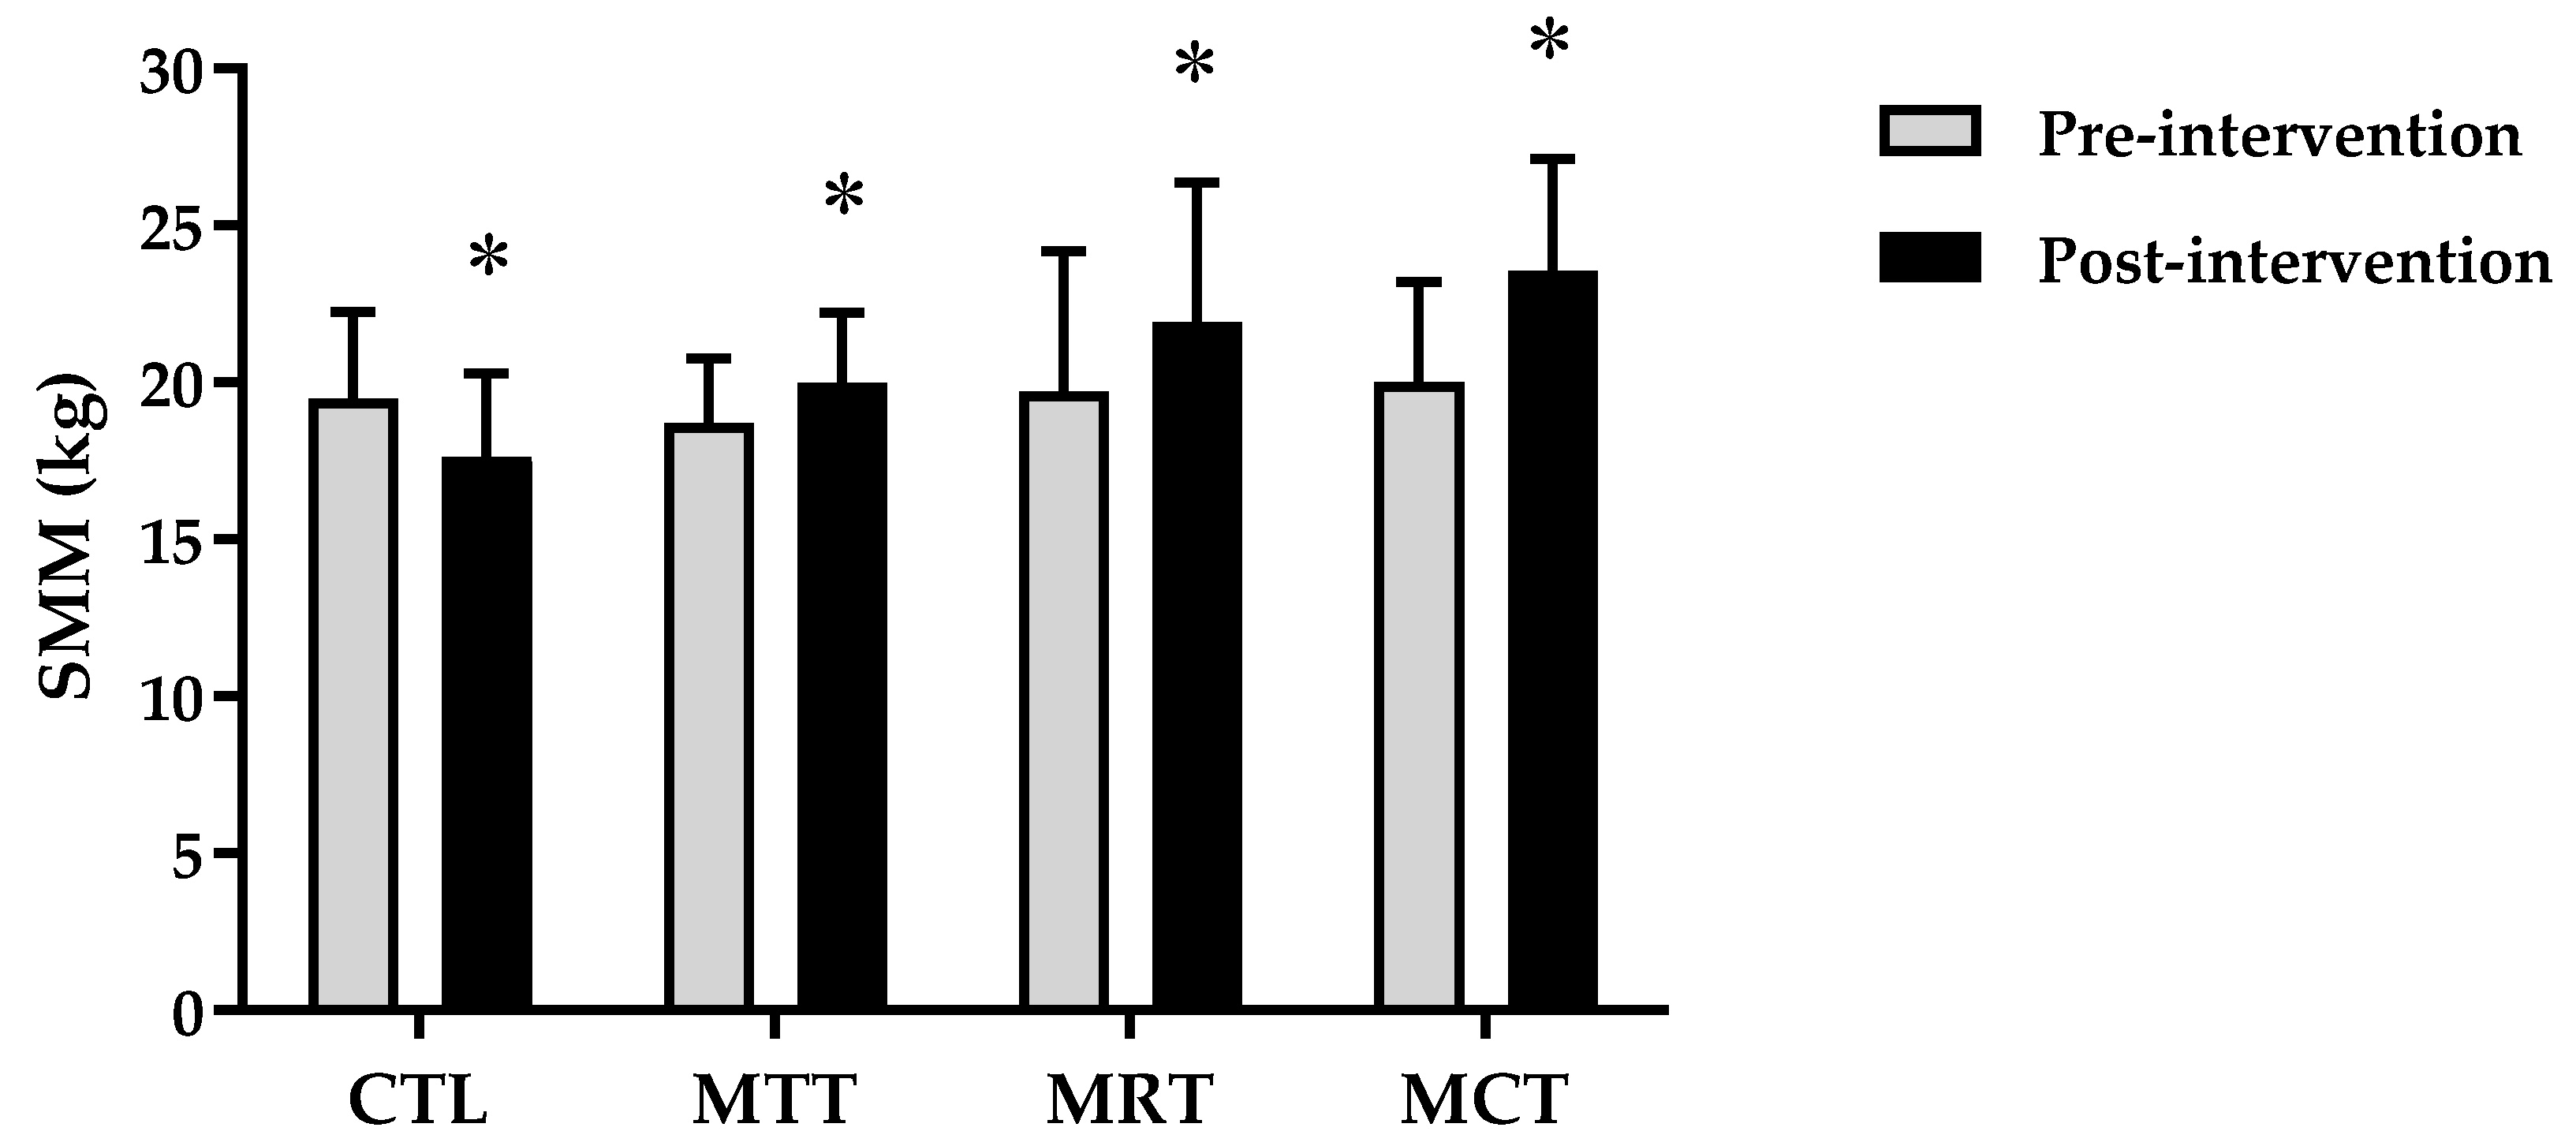
| SMM (kg) | |||||
| Pre-intervention | 19.48 ± 2.76 | 18.69 ± 2.08 | 19.71 ± 4.48 | 20.02 ± 3.17 | 0.820 $ |
| Post-intervention | 17.61 ± 2.67 | 19.99 ± 2.21 | 21.92 ± 4.45 * | 23.53 ± 3.58 * | 0.002 $ |
| Δ Post–Pre | −1.87 ± 0.67 | 1.31 ± 0.29 ** | 2.21 ± 0.21 ** | 3.51 ± 0.63 **†# | 0.000 $ |
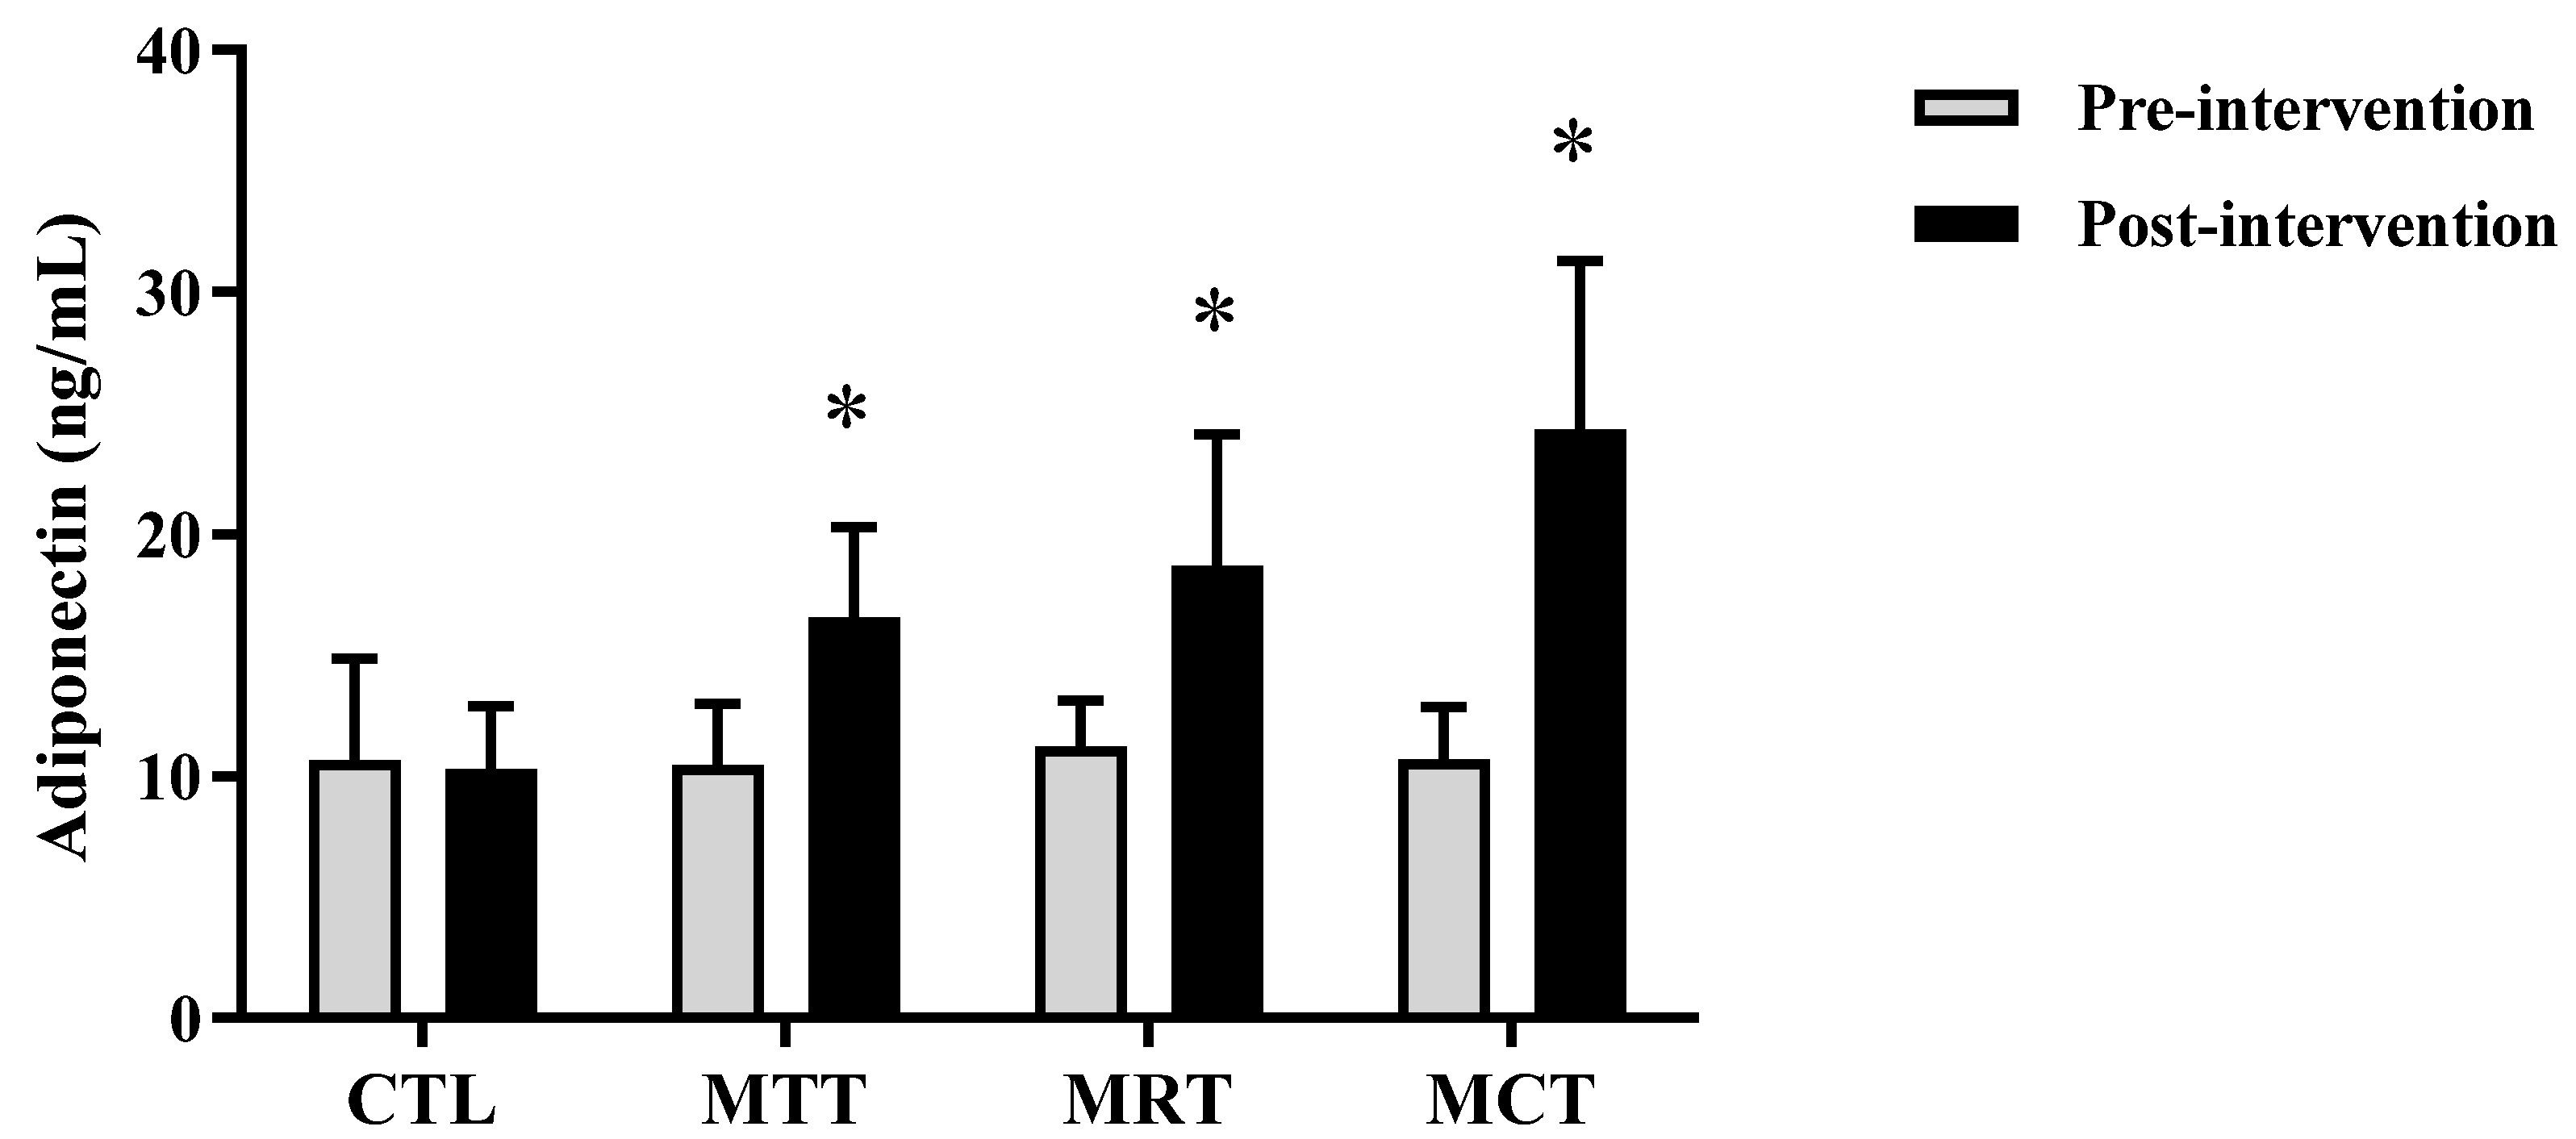
| Adiponectine (ng/mL) | |||||
| Pre-intervention | 10.69 ± 4.18 | 10.50 ± 2.52 | 10.79 ± 2.05 | 10.73 ± 2.16 | 0.996 $ |
| Post-intervention | 10.32 ± 2.59 | 16.59 ± 3.72 ** | 18.06 ± 5.73 ** | 24.35 ± 6.93 **††# | 0.000 ^ |
| Δ Post–Pre | −0.37 ± 3.00 | 6.09 ± 3.85 * | 7.28 ± 5.69 * | 13.61 ± 6.12 **††# | 0.000 $ |
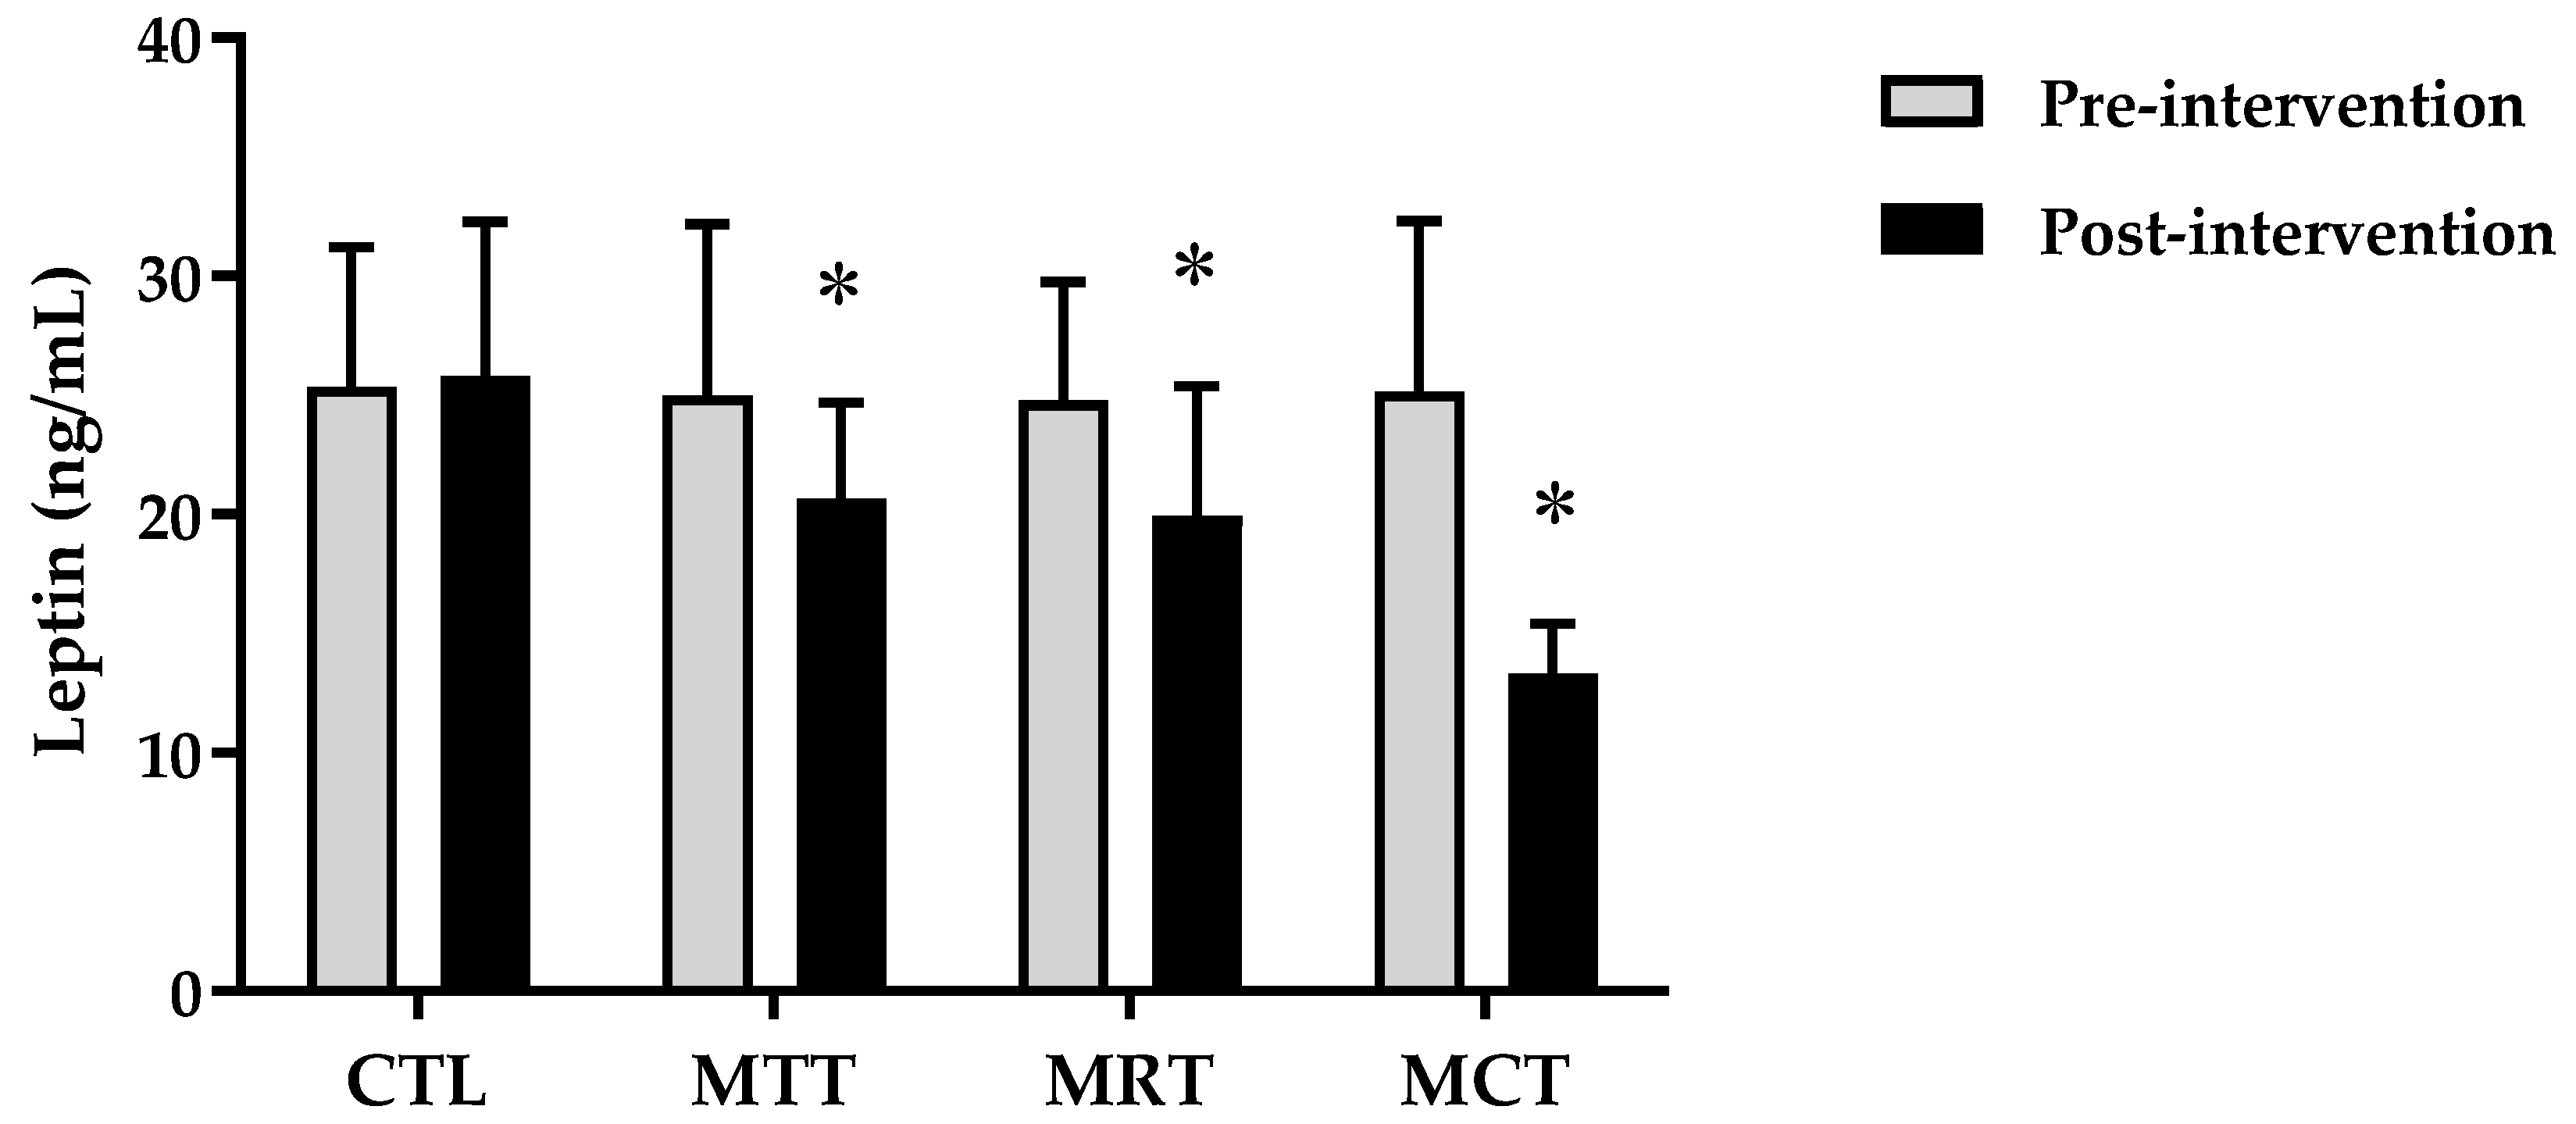
| Leptin (ng/mL) | |||||
| Pre-intervention | 25.34 ± 5.90 | 24.99 ± 7.18 | 24.80 ± 4.94 | 25.14 ± 7.19 | 0.998 $ |
| Post-intervention | 25.80 ± 6.49 | 20.64 ± 4.03 * | 19.92 ± 5.48 * | 13.32 ± 2.10 **††## | 0.000 ^ |
| Δ Post–Pre | 0.47 ± 1.48 | −4.35 ± 3.62 ** | −4.89 ± 1.74 ** | −11.81 ± 5.89 **††## | 0.000 ^ |
| Parameters | (Δ) Adipokine Levels | |||
|---|---|---|---|---|
| (Δ) Adiponectine (ng/mL) | (Δ) Leptin (ng/mL) | |||
| r | p-Values | r | p-Values | |
| Δ BW (kg) | −0.671 ** | p ≤ 0.001 | 0.744 ** | p ≤ 0.001 |
| Δ BMI (kg/m2) | −0.665 ** | p ≤ 0.001 | 0.744 ** | p ≤ 0.001 |
| Δ FM (kg) | −0.694 ** | p ≤ 0.001 | 0.718 ** | p ≤ 0.001 |
| Δ SMM (kg) | 0.693 ** | p ≤ 0.001 | −0.743 ** | p ≤ 0.001 |
| Δ Leptin (ng/mL) | −0.594 ** | p ≤ 0.001 | – | – |
| Δ Adiponectine (ng/mL) | – | – | −0.594 ** | p ≤ 0.001 |
Disclaimer/Publisher’s Note: The statements, opinions and data contained in all publications are solely those of the individual author(s) and contributor(s) and not of MDPI and/or the editor(s). MDPI and/or the editor(s) disclaim responsibility for any injury to people or property resulting from any ideas, methods, instructions or products referred to in the content. |
© 2023 by the authors. Licensee MDPI, Basel, Switzerland. This article is an open access article distributed under the terms and conditions of the Creative Commons Attribution (CC BY) license (https://creativecommons.org/licenses/by/4.0/).
Share and Cite
Rejeki, P.S.; Pranoto, A.; Rahmanto, I.; Izzatunnisa, N.; Yosika, G.F.; Hernaningsih, Y.; Wungu, C.D.K.; Halim, S. The Positive Effect of Four-Week Combined Aerobic–Resistance Training on Body Composition and Adipokine Levels in Obese Females. Sports 2023, 11, 90. https://doi.org/10.3390/sports11040090
Rejeki PS, Pranoto A, Rahmanto I, Izzatunnisa N, Yosika GF, Hernaningsih Y, Wungu CDK, Halim S. The Positive Effect of Four-Week Combined Aerobic–Resistance Training on Body Composition and Adipokine Levels in Obese Females. Sports. 2023; 11(4):90. https://doi.org/10.3390/sports11040090
Chicago/Turabian StyleRejeki, Purwo Sri, Adi Pranoto, Ilham Rahmanto, Nabilah Izzatunnisa, Ghana Firsta Yosika, Yetti Hernaningsih, Citrawati Dyah Kencono Wungu, and Shariff Halim. 2023. "The Positive Effect of Four-Week Combined Aerobic–Resistance Training on Body Composition and Adipokine Levels in Obese Females" Sports 11, no. 4: 90. https://doi.org/10.3390/sports11040090