


Evaluation of Athlete Monitoring Tools across 10 Weeks of Elite Youth Basketball Training: An Explorative Study

 , , ,
, , ,
Abstract
:1. Introduction
2. Materials and Methods
2.1. Study Design
2.2. Participants
2.3. Procedures
2.3.1. Demographic Profile and Familiarisation
2.3.2. Warm-Up and Rest Intervals
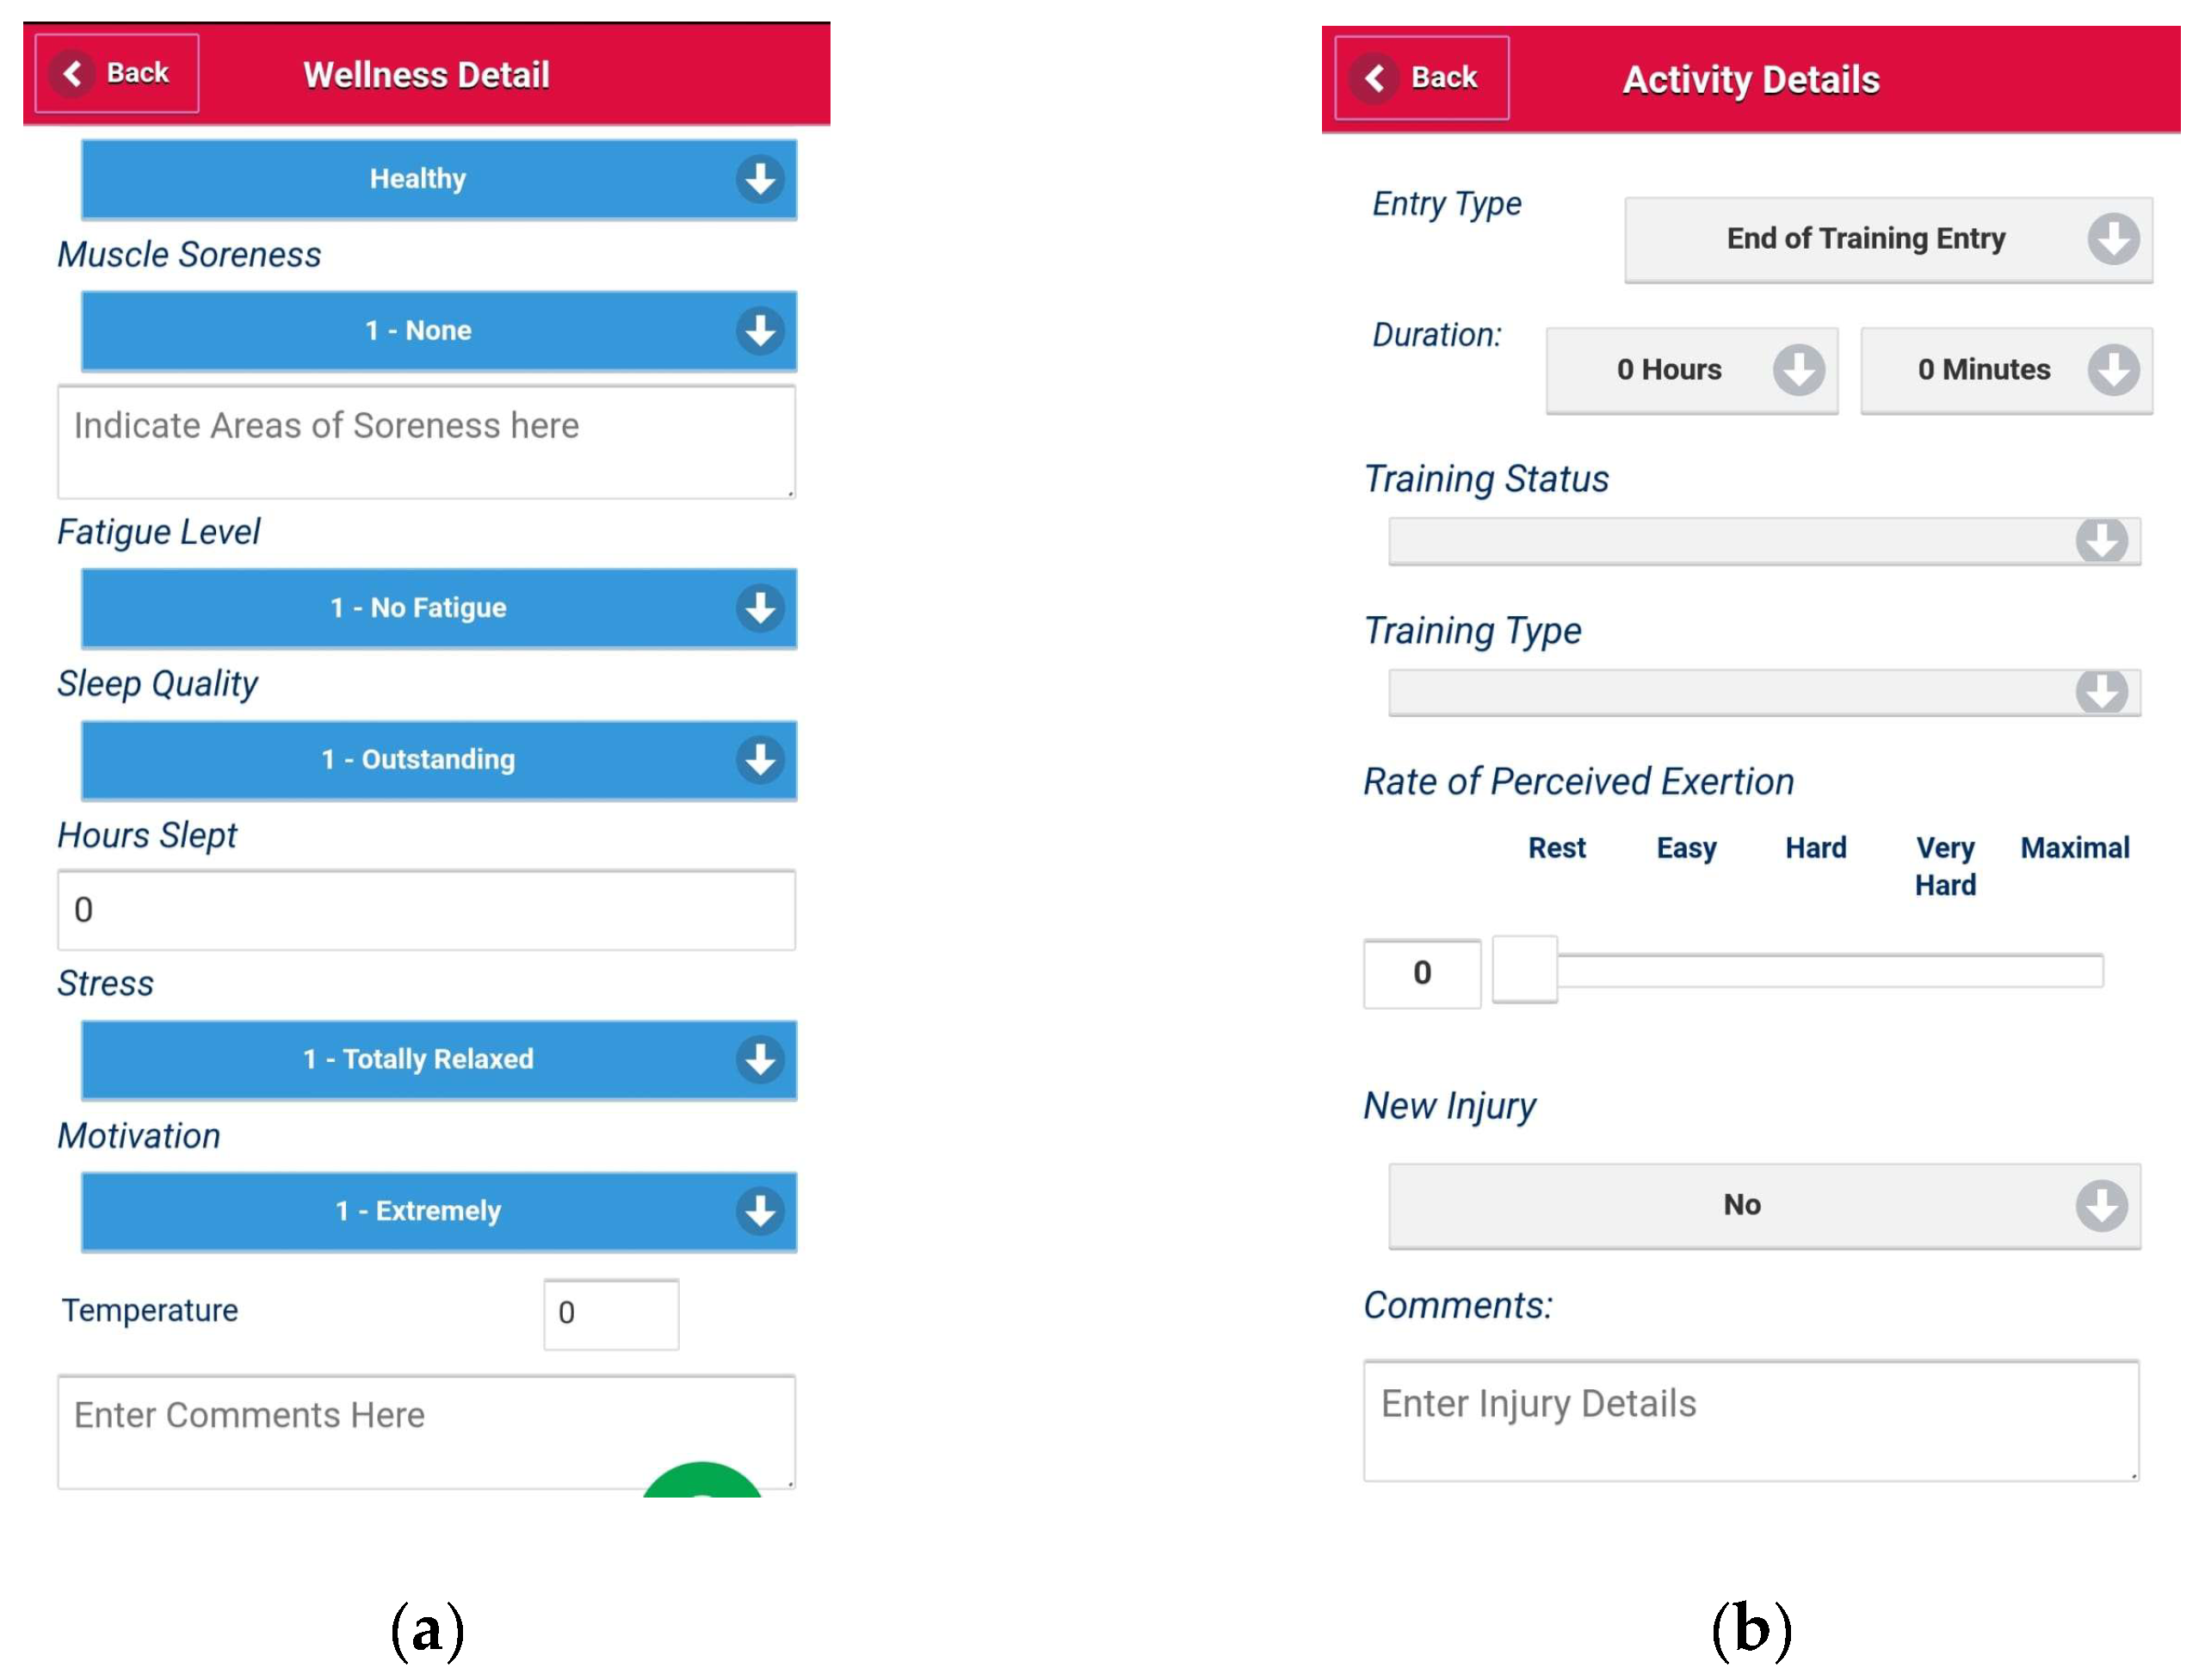
2.3.3. Subjective Load Monitoring
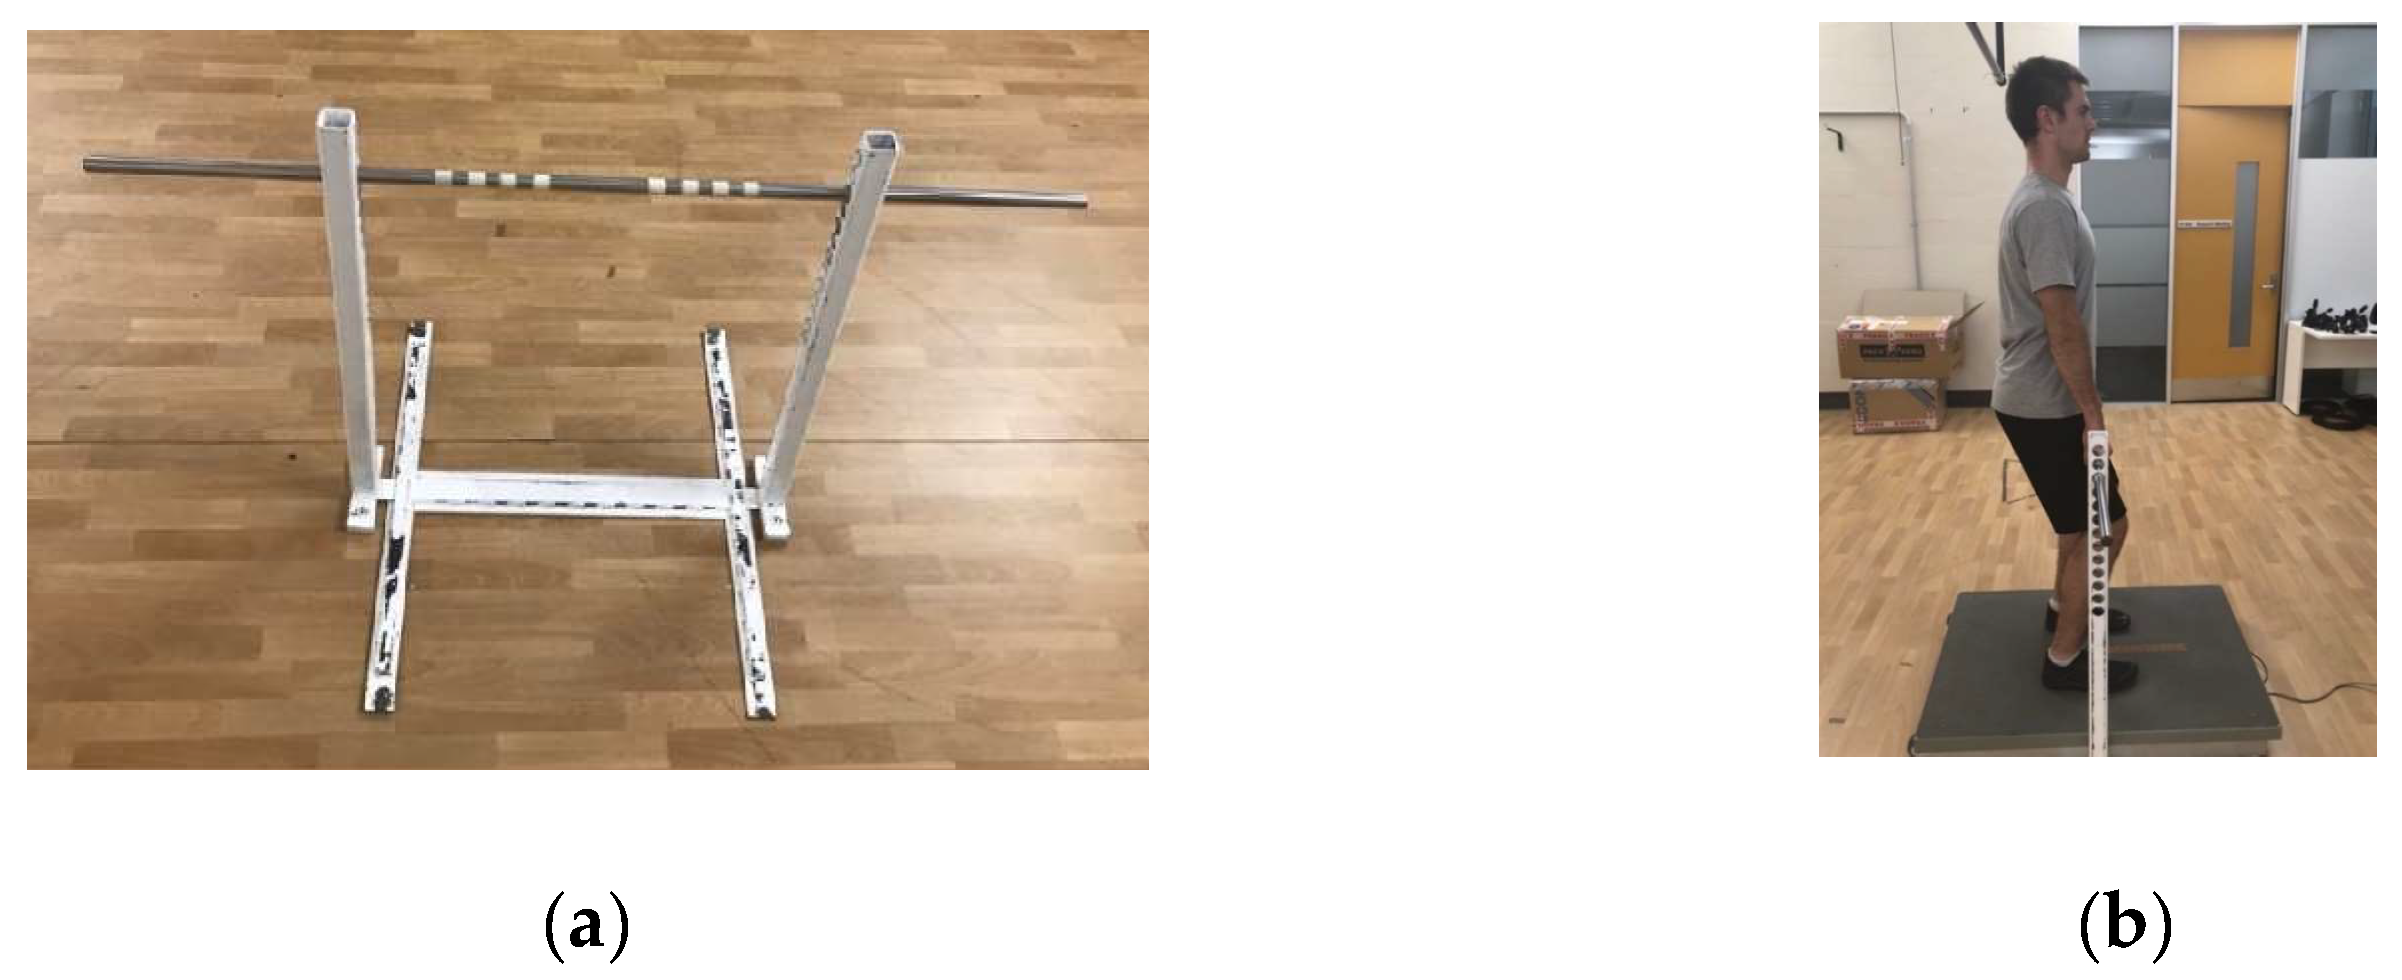
2.3.4. Objective Load Monitoring
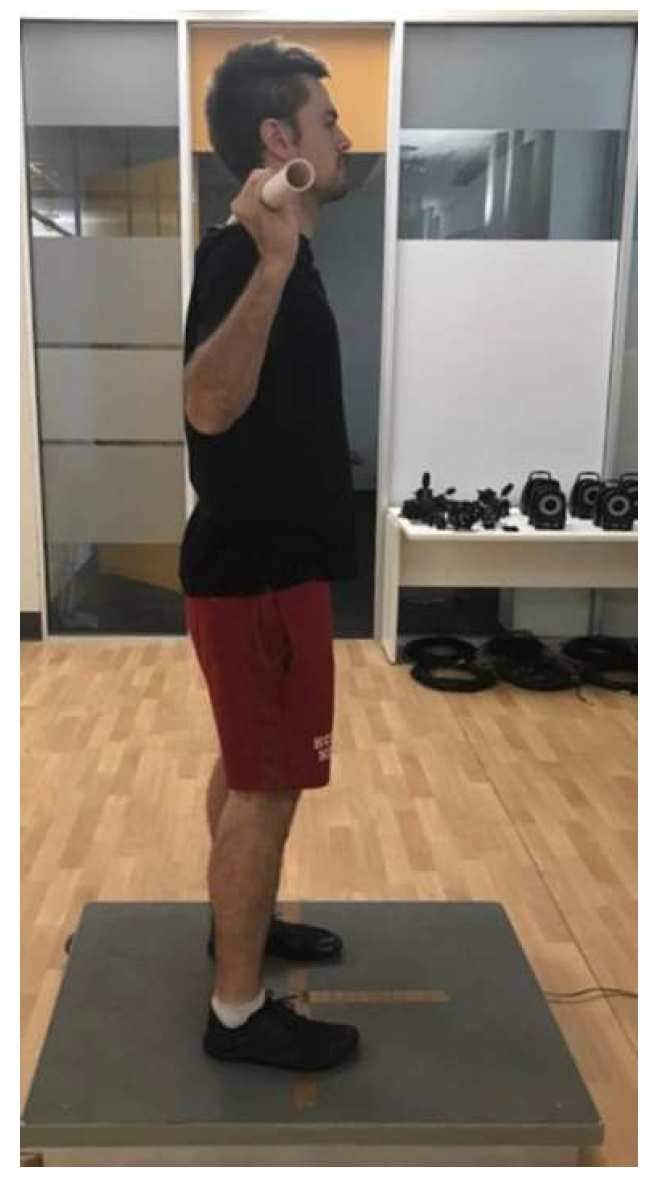
2.3.5. Performance Testing
2.3.6. Cool Down
2.4. Data Analysis
2.4.1. Demographic Profile
2.4.2. Subjective Load Monitoring
2.4.3. Objective Load Monitoring
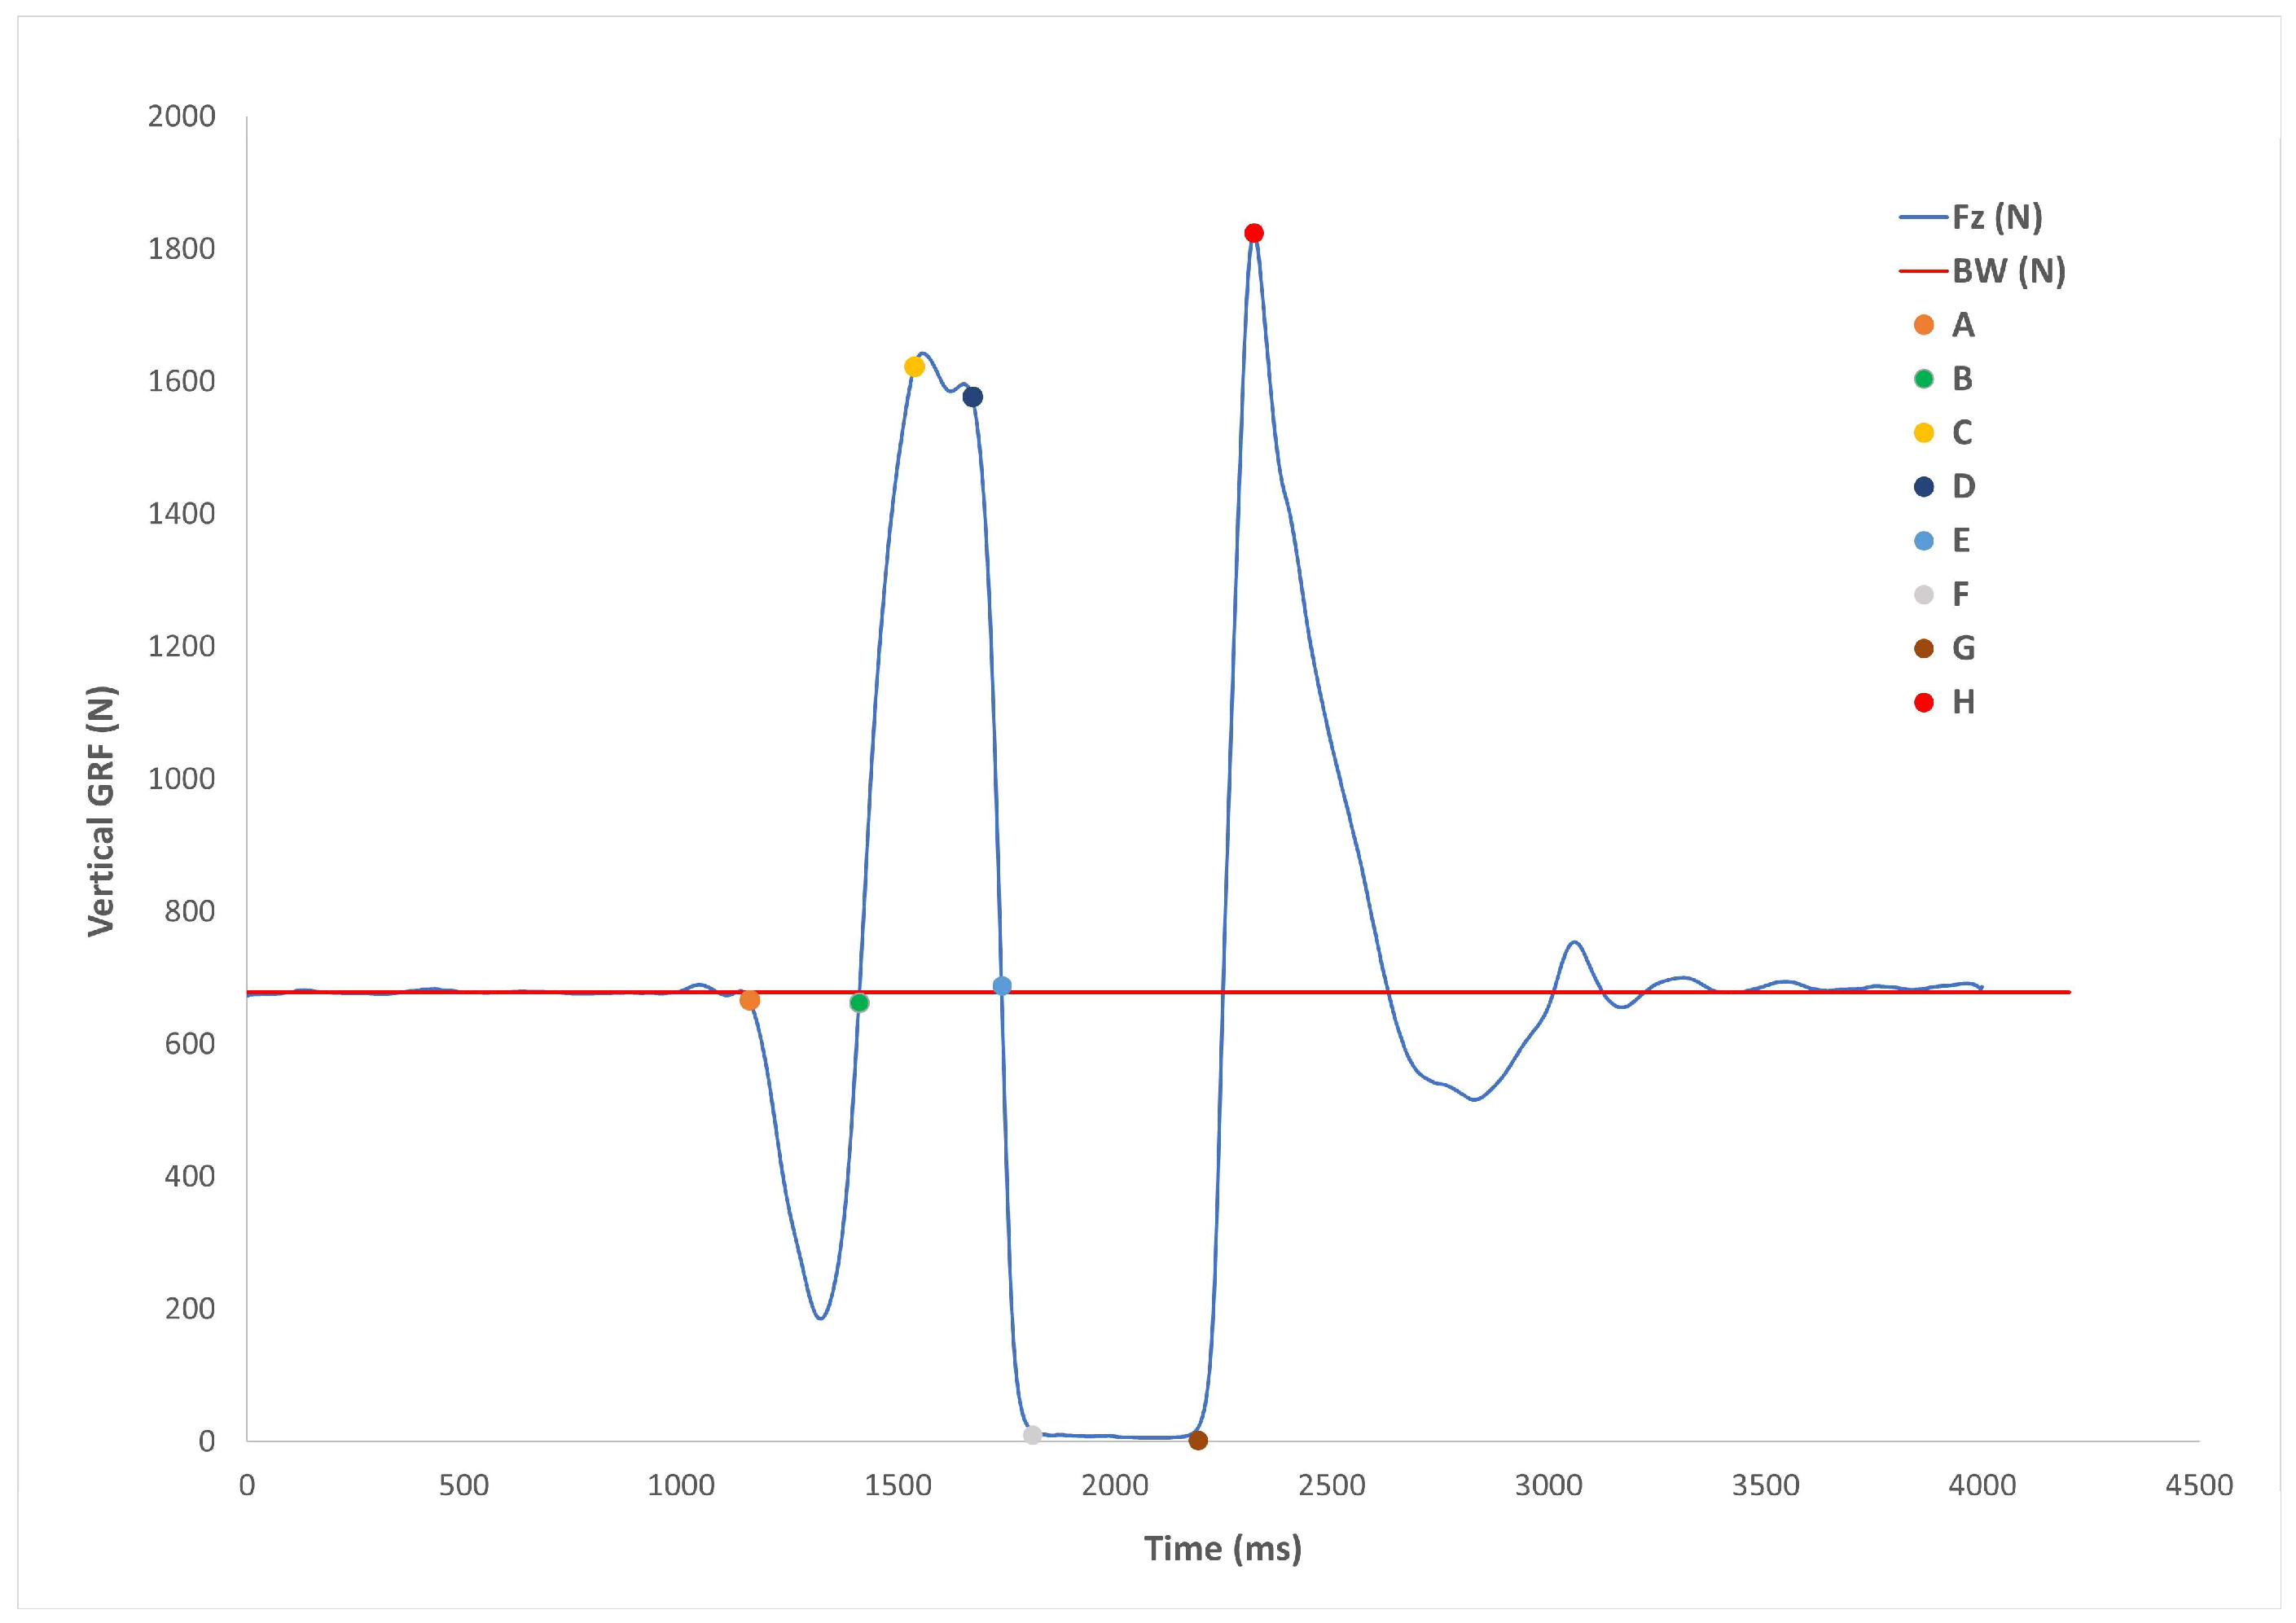
2.4.4. Performance Testing
2.5. Statistical Analysis
3. Results
3.1. Participant Demographics
3.2. Pre-Competition Sessions
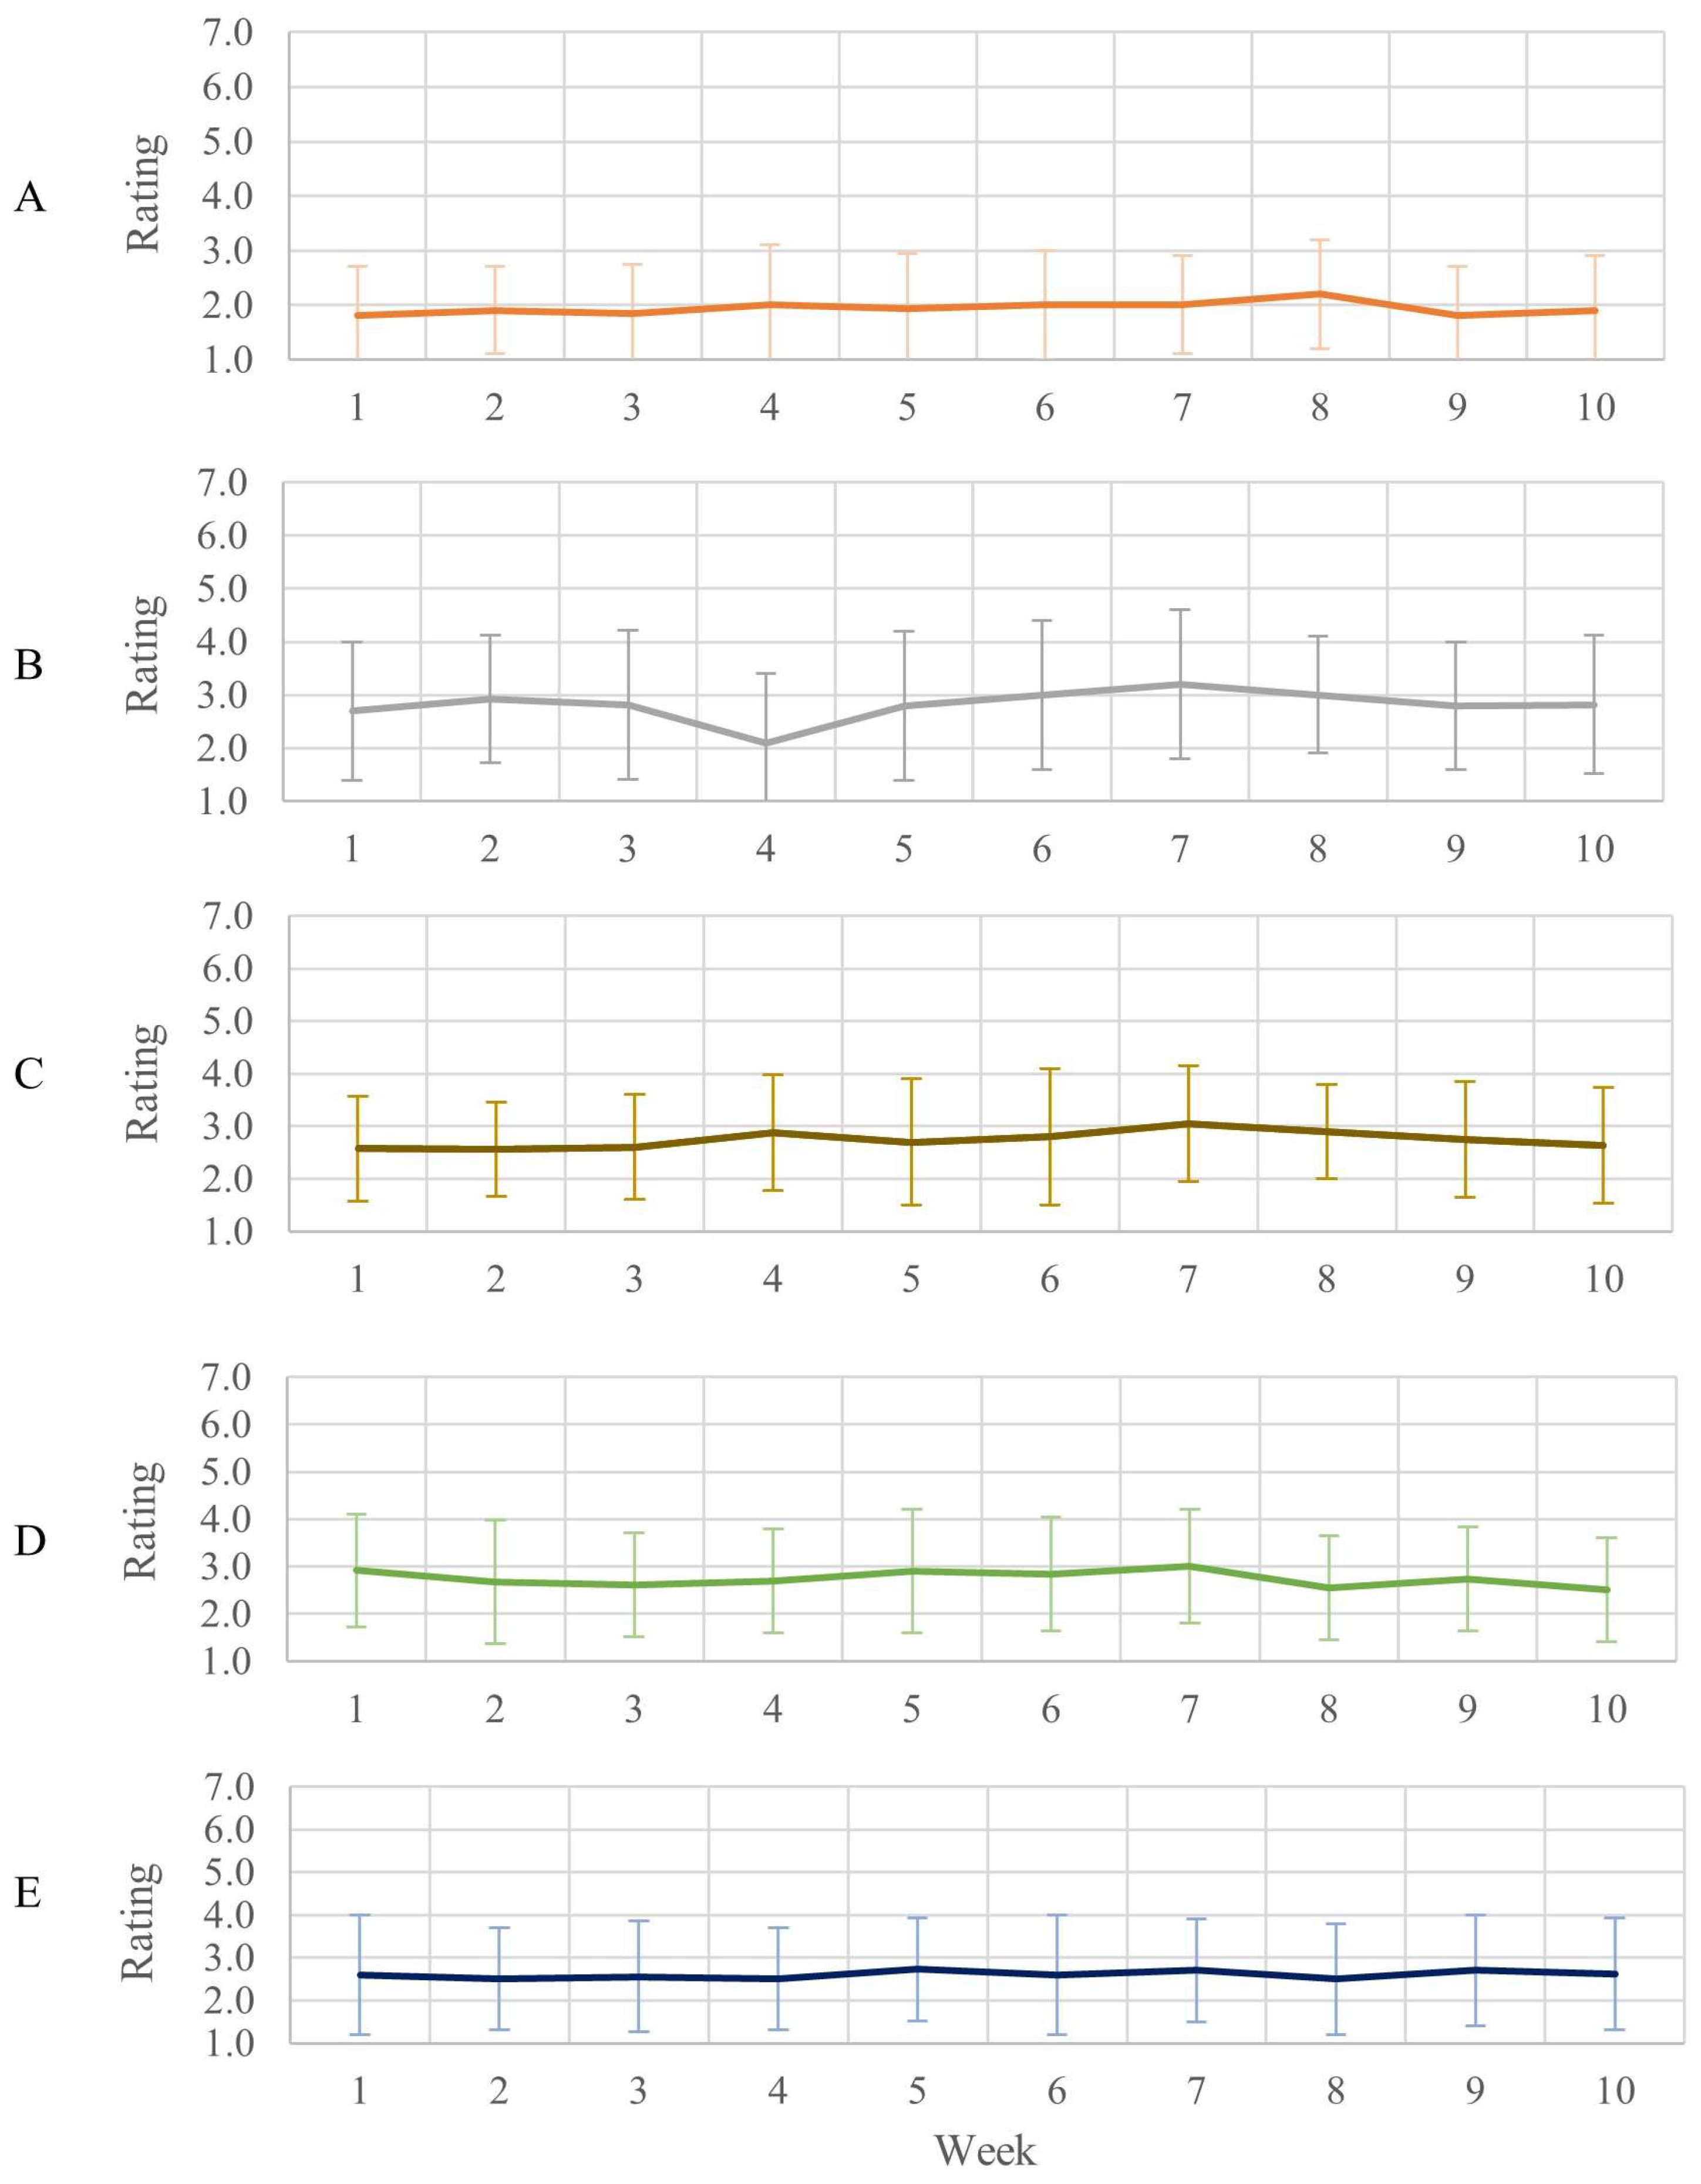
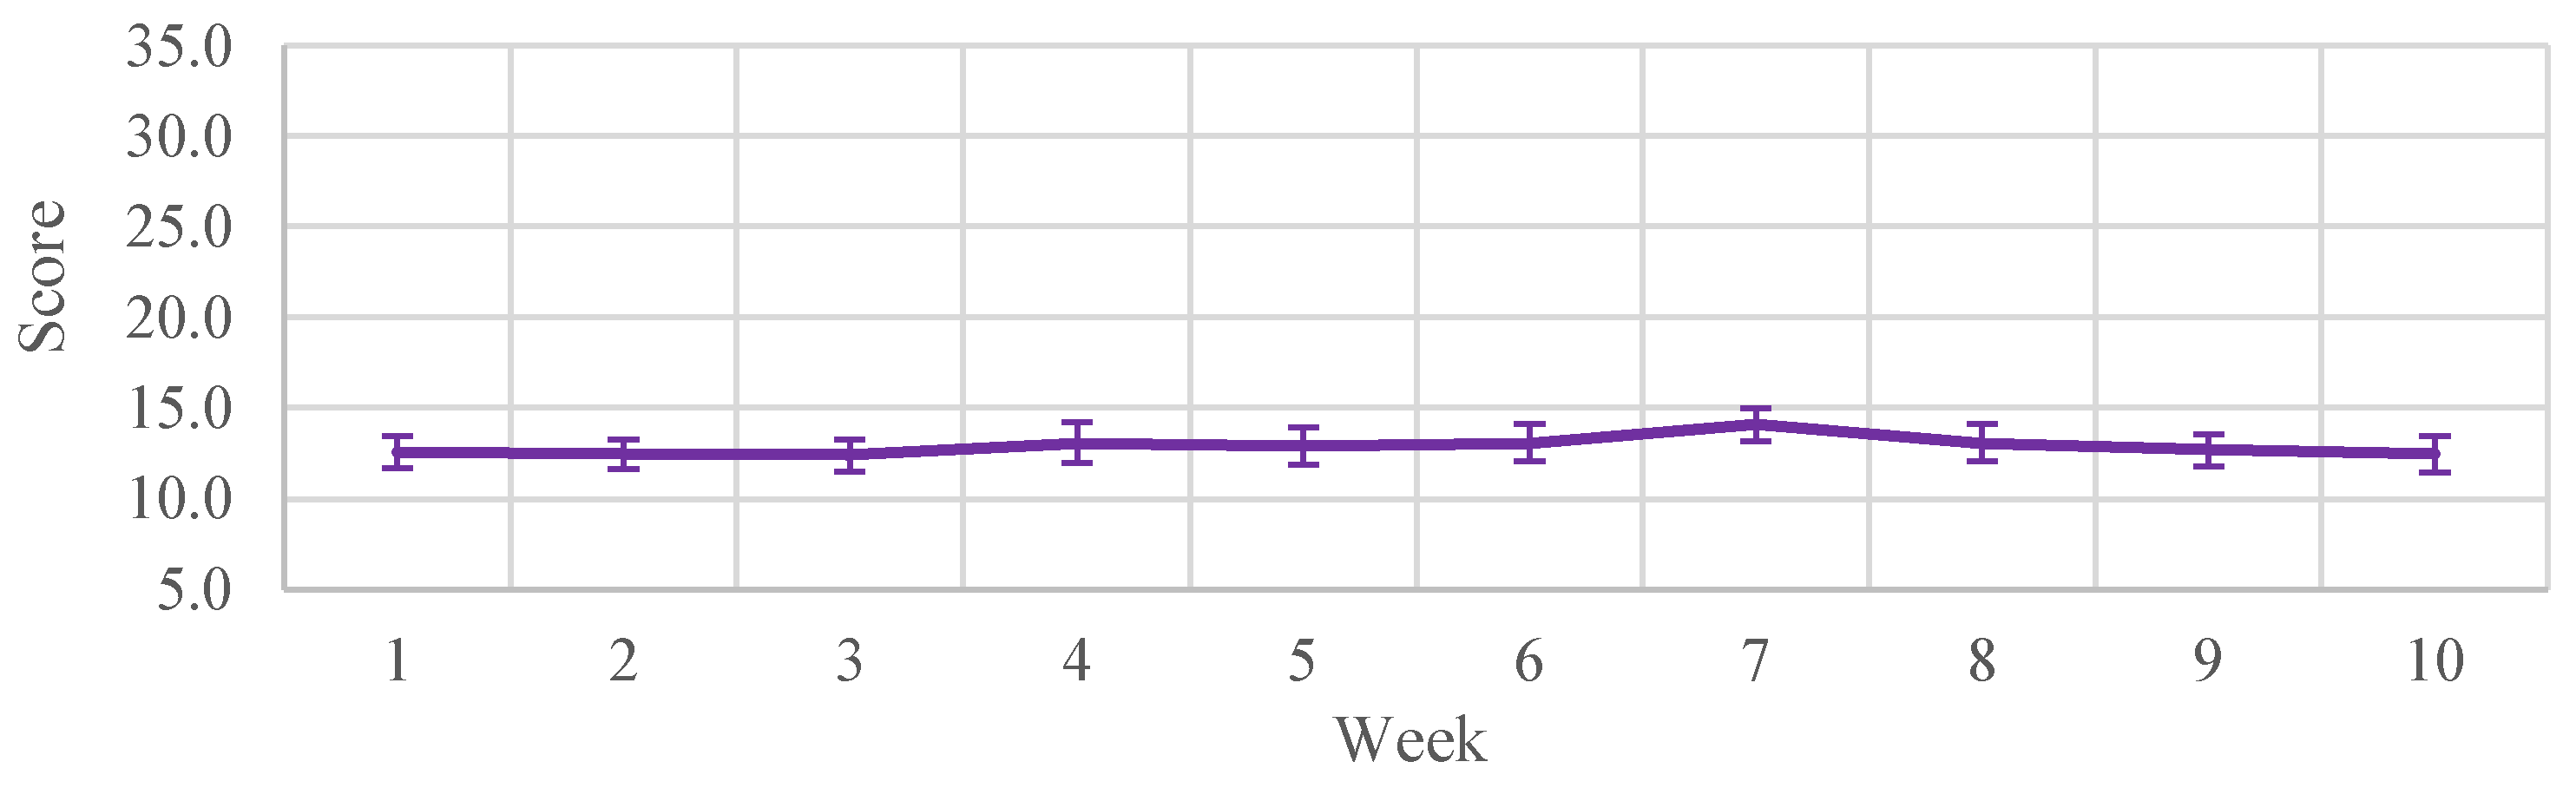
3.3. Subjective Load Monitoring
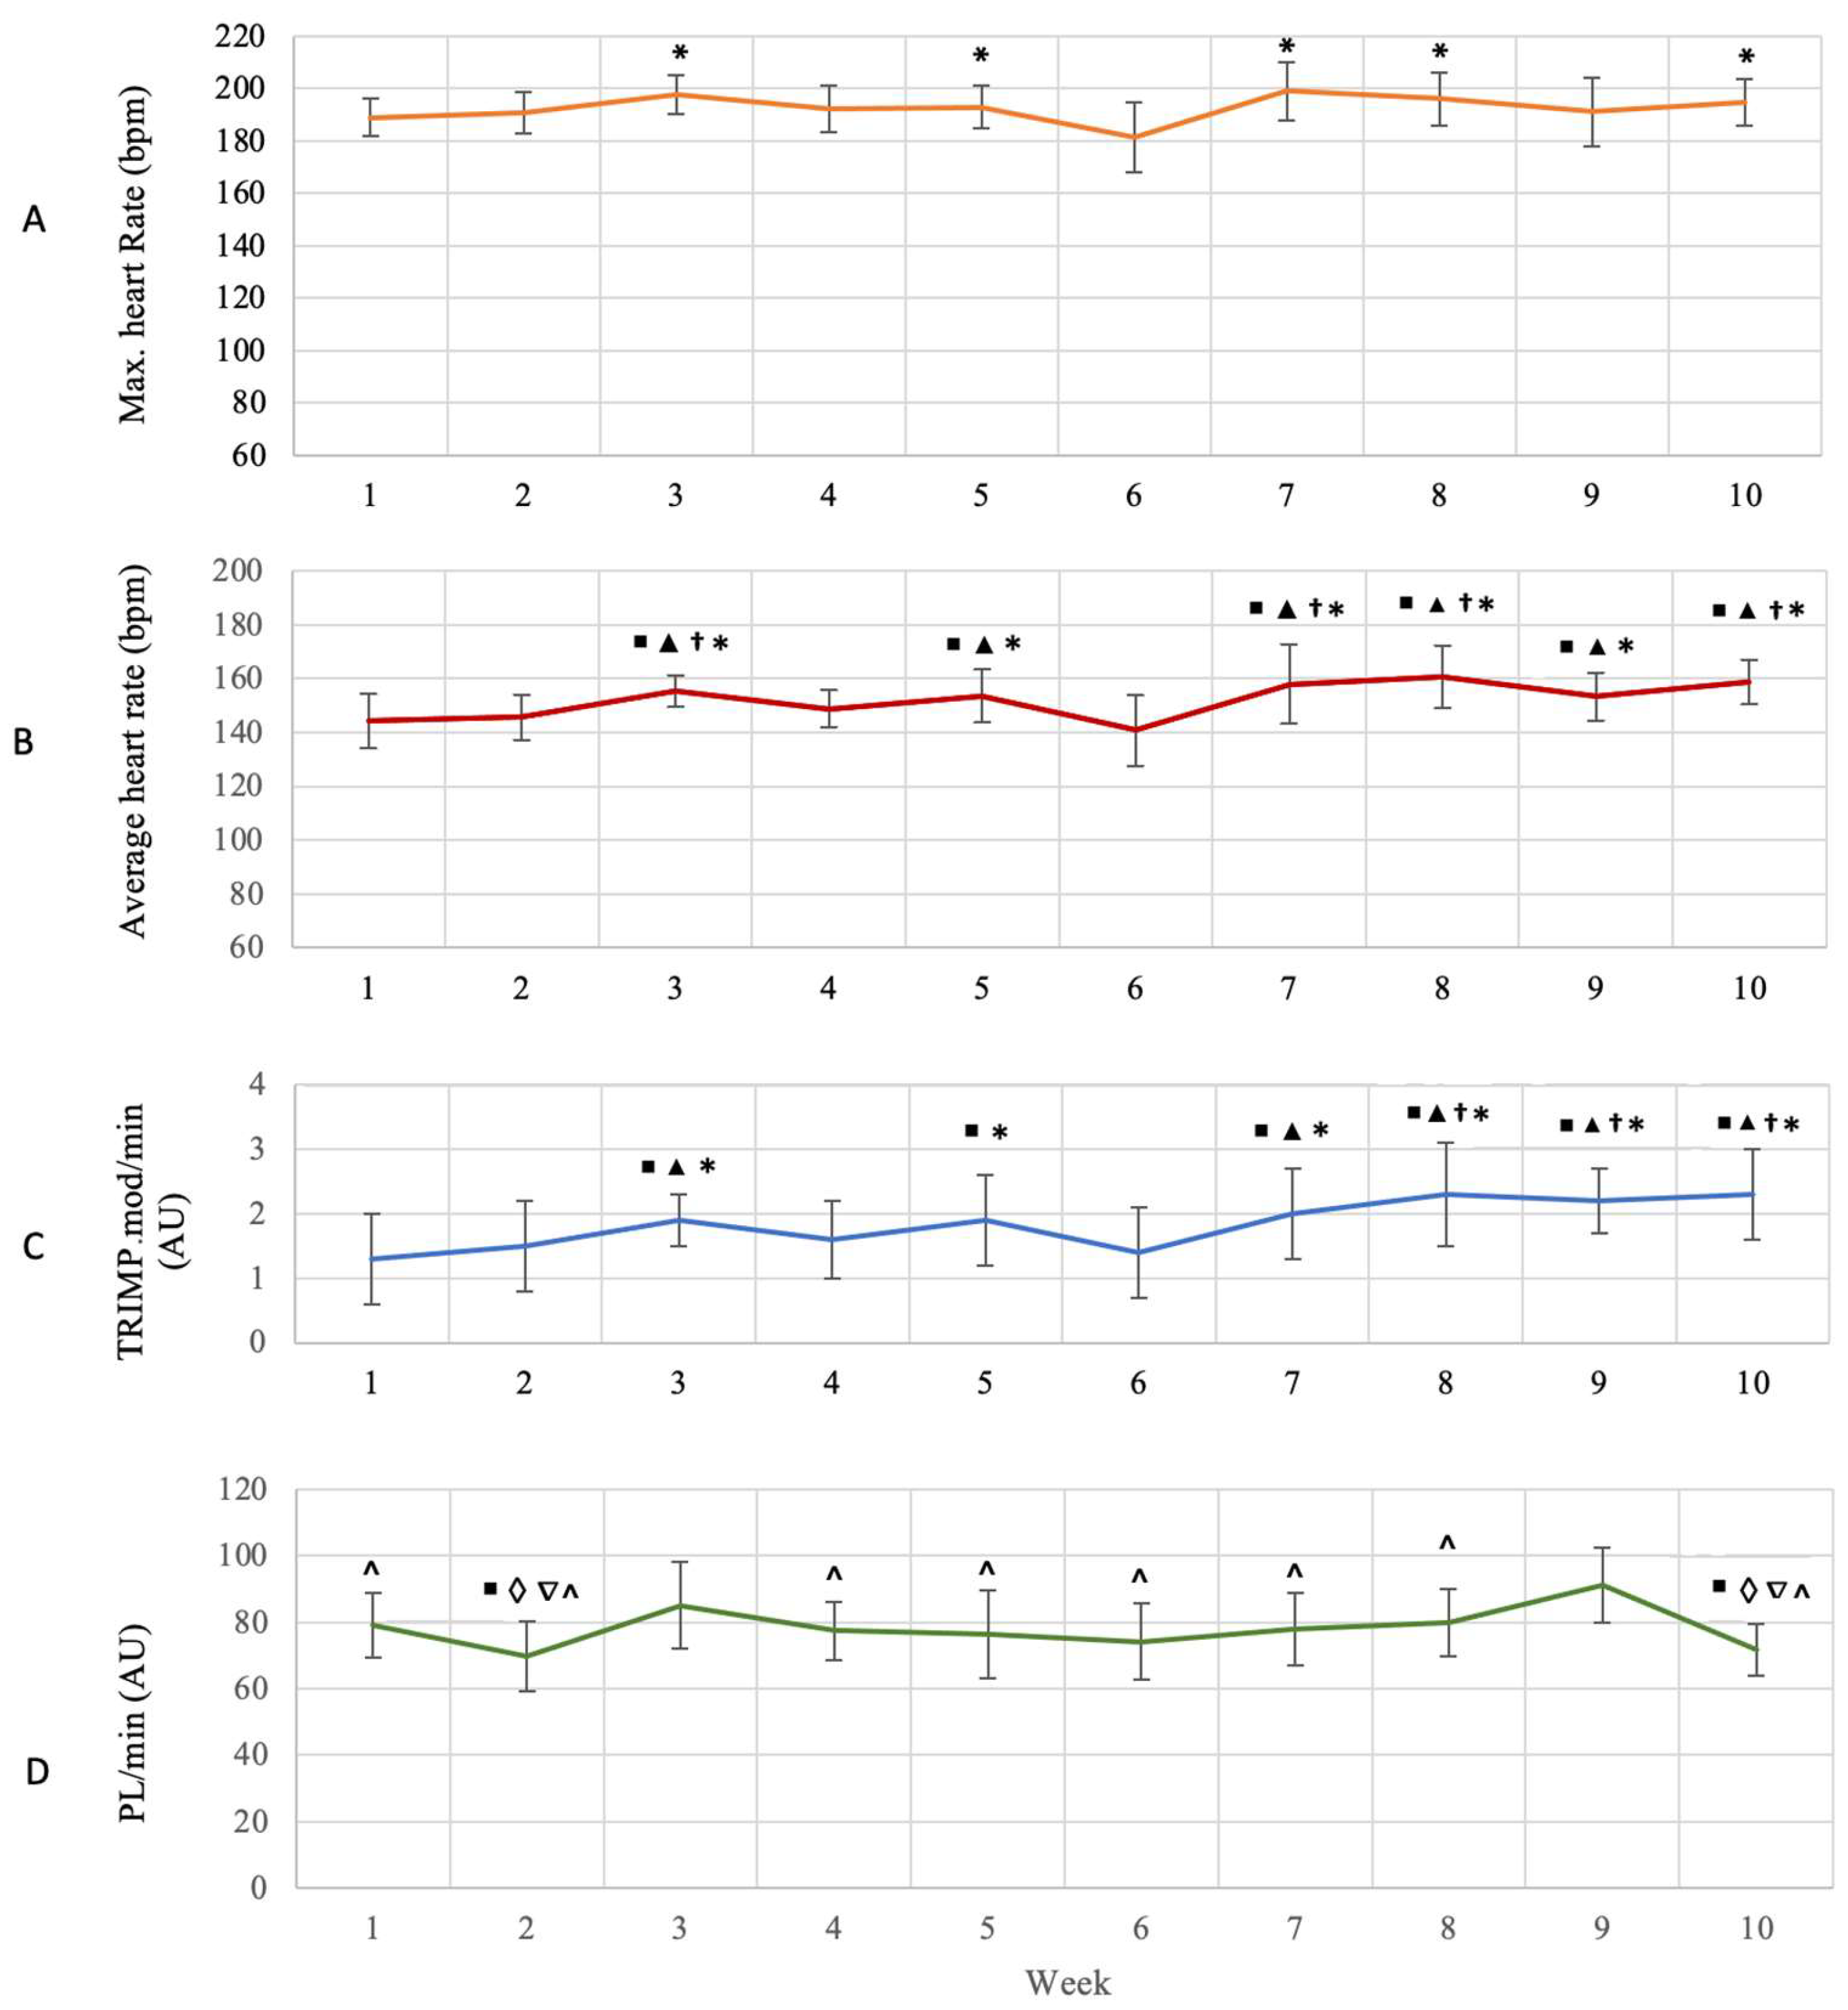
3.4. Objective Load Monitoring
3.5. Performance Testing
4. Discussion
5. Conclusions
Supplementary Materials
Author Contributions
Funding
Institutional Review Board Statement
Informed Consent Statement
Data Availability Statement
Acknowledgments
Conflicts of Interest
Appendix A


References
- Rearick, M.; Creasy, J.; Buriak, J. Avoid overtraining in young athletes. J. Phys. Educ. Recreat. Danc. 2011, 82, 25–36. [Google Scholar] [CrossRef]
- Scantlebury, S.; Till, K.; Sawczuk, T.; Phibbs, P.; Jones, B. Navigating the complex pathway of youth athletic development: Challenges and solutions to managing the training load of youth team sport athletes. Strength Cond. J. 2020, 42, 100–108. [Google Scholar] [CrossRef]
- Windt, J.; Gabbett, T. How do training and competition workloads relate to injury? The workload—Injury aetiology model. Br. J. Sport. Med. 2016, 51, 428–435. [Google Scholar] [CrossRef] [PubMed]
- Merkel, D.L. Youth sport: Positive and negative impact on young athletes. Open Access J. Sport. Med. 2013, 4, 151–160. [Google Scholar] [CrossRef] [Green Version]
- Fox, J.; Scanlan, A.T.; Stanton, R. A review of player monitoring approaches in basketball: Current trends and future directions. J. Strength Cond. Res. 2017, 31, 2021–2029. [Google Scholar] [CrossRef]
- Teixeira, J.E.; Forte, P.; Ferraz, R.; Leal, M.; Ribeiro, J.; Silva, A.J.; Barbosa, T.M.; Monteiro, A.M. Monitoring accumulated training and match load in football: A systematic review. Int. J. Environ. Res. Public Health 2021, 18, 3906. [Google Scholar] [CrossRef]
- Buchheit, M.; Simpson, B.M. Player-tracking technology: Half-full or half-empty glass? Int. J. Sport. Physiol. Perform. 2017, 12, 35–41. [Google Scholar] [CrossRef] [Green Version]
- Bourdon, P.; Cardinale, M.; Murray, A.; Gastin, P.; Kellmann, M.; Varley, M.; Gabbett, T.; Coutts, A.; Burgess, D.; Gregson, W.; et al. Monitoring athlete training loads: Consensus statement. Int. J. Sport. Physiol. Perform. 2017, 12, 161–170. [Google Scholar] [CrossRef]
- Vanrenterghem, J.; Nedergaard, N.; Robinson, M.; Drust, B. Training load monitoring in team sports: A novel framework separating physiological and iomechanical load-adaptation pathways. Sport. Med. 2017, 47, 2135–2142. [Google Scholar] [CrossRef]
- Gabbett, T. Workload monitoring and athlete management. In Advanced Strength and Conditioning, 1st ed.; Turner, A., Comfort, P., Eds.; Routledge: London, England, 2017; pp. 137–150. ISBN 978-131-554-234-8. [Google Scholar]
- Campbell, P.; Stewart, I.; Sirotic, A.; Drovandi, C.; Foy, B.; Minett, G. Analysing the predictive capacity and dose-response of wellness in load monitoring. J. Sport. Sci. 2021, 39, 1339–1347. [Google Scholar] [CrossRef]
- Moir, G.L.; Button, C.; Glaister, M.; Stone, M.H. Influence of familiarization on the reliability of vertical jump and acceleration sprinting performance in physically active men. J. Strength Cond. Res. 2004, 18, 276–280. [Google Scholar] [CrossRef]
- Sole, C. Analysis of Countermovement Vertical Jump Force-Time Curve Phase Characteristics in Athletes. Doctoral Dissertation, East Tennessee State University, Johnson City, TN, USA, 2015. [Google Scholar]
- Balyi, I.; Hamilton, A. Long-term athlete development: Trainability in childhood and adolescence. Olymp. Coach 2004, 16, 4–9. [Google Scholar]
- Markovic, G.; Dizdar, D.; Jukic, I.; Cardinale, M. Reliability and factorial validity of squat and countermovement jump tests. J. Strength Cond. Res. 2004, 18, 551–555. [Google Scholar] [CrossRef]
- Grgic, J.; Scapec, B.; Mikulic, P.; Pedisic, Z. Test-retest reliability of isometric mid-thigh pull maximum strength assessment: A systematic review. Biol. Sport 2021, 39, 407–414. [Google Scholar] [CrossRef]
- Cumming, S.P.; Lloyd, R.S.; Oliver, J.L.; Eisenmann, J.C.; Malina, R.M. Bio-banding in sport: Applications to competition, talent identification, and strength and conditioning of youth athletes. Strength Cond. J. 2017, 39, 34–47. [Google Scholar] [CrossRef] [Green Version]
- Russell, J.L.; Mclean, B.D.; Impellizzeri, F.M.; Strack, D.S.; Coutts, A.J. Measuring physical demands in basketball: An explorative systematic review of practices. Sport. Med. 2021, 51, 81–112. [Google Scholar] [CrossRef]
- Sarmento, H.; Marcelino, R.; Campanico, J.; Matos, N.; Leitão, J. Match analysis in football: A systematic review. J. Sport. Sci. 2014, 32, 1831–1843. [Google Scholar] [CrossRef] [Green Version]
- Torres-Ronda, L.; Beanland, E.; Whitehead, S.; Sweeting, A.; Clubb, J. Tracking systems in team sports: A narrative review of applications of the data and sport specific analysis. Sport. Med. Open 2022, 8, 15. [Google Scholar] [CrossRef]
- Conte, D.; Kolb, N.; Scanlan, A.T.; Santolamazza, F. Monitoring training load and wellbeing during the in-season phase in national collegiate athletic association division I men’s basketball. Int. J. Sport. Physiol. Perform. 2018, 13, 1067–1074. [Google Scholar] [CrossRef]
- Adult Pre-Exercise Screening System. Available online: https://www.essa.org.au/Public/ABOUT_ESSA/Pre-Exercise_Screening_Systems.aspx (accessed on 12 September 2020).
- Comfort, P.; Dos’santos, T.; Beckham, G.K.; Stone, M.H.; Guppy, S.N.; Haff, G.G. Standardization and methodological considerations for the isometric midthigh pull. Strength Cond. J. 2019, 41, 57–79. [Google Scholar] [CrossRef]
- Laffaye, G.; Wagner, P.P.; Tombleson, T.I.L. Countermovement jump height: Gender and sport-specific differences in the force-time variables. J. Strength Cond. Res. 2014, 28, 1096–1105. [Google Scholar] [CrossRef] [PubMed]
- Rago, V.; Brito, J.; Figueiredo, P.; Carvalho, T.; Fernandes, T.; Fonseca, P.; Rebelo, A. Countermovement jump analysis using different portable devices: Implications for field testing. Sports 2018, 6, 91. [Google Scholar] [CrossRef] [PubMed] [Green Version]
- Impellizzeri, F.M.; Rampinini, E.; Coutts, A.J.; Sassi, A.; Marcora, S.M. Use of RPE-based training load in soccer. Med. Sci. Sport. Exerc. 2004, 36, 1042–1047. [Google Scholar] [CrossRef] [PubMed]
- Sawczuk, T.; Jones, B.; Scantlebury, S.; Till, K. The influence of training load, exposure to match play and sleep duration on daily wellbeing measures in youth athletes. J. Sport. Sci. 2018, 36, 2431–2437. [Google Scholar] [CrossRef] [PubMed]
- Hooper, S.L.; Mackinnon, L.T.; Howard, A.L.F.; Gordon, R.D.; Bachmann, A.W. Markers for monitoring overtraining and recovery. Med. Sci. Sport. Exerc. 1995, 27, 106–112. [Google Scholar] [CrossRef]
- Anderson, L.; Triplett-Mcbride, T.; Foster, C.; Doberstein, S.; Brice, G. Impact of training patterns on incidence of illness and injury during a women’s collegiate basketball season. J. Strength Cond. Res. 2003, 17, 734–738. [Google Scholar] [CrossRef]
- Foster, C.; Florhaug, J.A.; Franklin, J.; Gottschall, L.; Hrovatin, L.A.; Parker, S.; Doleshal, P.; Dodge, C. A new approach to monitoring exercise training. J. Strength Cond. Res. 2001, 15, 109–115. [Google Scholar] [CrossRef]
- Montgomery, P.; Pyne, D.; Minahan, C. The physical and physiological demands of basketball training and competition. Int. J. Sport. Physiol. Perform. 2010, 5, 75–86. [Google Scholar] [CrossRef] [Green Version]
- Schmitz, B.; Pfeifer, C.; Kreitz, K.; Borowski, M.; Faldum, A.; Brand, S.M. The Yo-Yo Intermittent tests: A systematic review and structured compendium of test results. Front. Physiol. 2018, 9, 870. [Google Scholar] [CrossRef] [Green Version]
- McMahon, J.J.; Suchomel, T.J.; Lake, J.P.; Comfort, P. Understanding the key phases of the countermovement jump force-time curve. Strength Cond. J. 2018, 40, 96–106. [Google Scholar] [CrossRef] [Green Version]
- DeWeese, B.H.; Serrano, A.J.; Scruggs, S.K.; Burton, J.D. The midthigh pull: Proper application and progressions of a weightlifting movement derivative. Strength Cond. J. 2013, 35, 54–58. [Google Scholar] [CrossRef]
- Carlock, J.M.; Smith, S.L.; Hartman, M.J.; Morris, R.T.; Ciroslan, D.A.; Pierce, K.C.; Newton, R.U.; Harman, E.A.; Sands, W.A.; Stone, M.H. The relationship between vertical jump power estimates and weightlifting ability: A field-test approach. J. Strength Cond. Res. 2004, 18, 534–539. [Google Scholar] [CrossRef]
- Kraska, J.M.; Ramsey, M.W.; Haff, G.G.; Fethke, N.; Sands, W.A.; Stone, M.E.; Stone, M.H. Relationship between strength characteristics and unweighted and weighted vertical jump height. Int. J. Sport. Physiol. Perform. 2009, 4, 461–473. [Google Scholar] [CrossRef] [Green Version]
- de Keijzer, K.L.; Mcerlain-Naylor, S.A.; Iacono, A.D.; Beato, M. Effect of volume on eccentric overload-induced postactivation potentiation of jumps. Int. J. Sport. Physiol. Perform. 2020, 15, 976–981. [Google Scholar] [CrossRef] [Green Version]
- James, L.P.; Roberts, L.A.; Haff, G.G.; Kelly, V.G.; Beckman, E.M. Validity and reliability of a portable isometric mid-thigh clean pull. J. Strength Cond. Res. 2017, 31, 1378–1386. [Google Scholar] [CrossRef] [Green Version]
- Scanlan, A.T.; Wen, N.; Guy, J.H.; Elsworthy, N.; Lastella, M.; Pyne, D.B.; Conte, D.; Dalbo, V.J. The isometric midthigh pull in basketball: An effective predictor of sprint and jump performance in male, adolescent players. Int. J. Sport. Physiol. Perform. 2020, 15, 409–415. [Google Scholar] [CrossRef]
- Beckham, G.; Sato, K.; Santana, H.; Mizuguchi, S.; Haff, G.; Stone, M. Effect of body position on force production during the isometric mid-thigh pull. J. Strength Cond. Res. 2017, 32, 48–56. [Google Scholar] [CrossRef]
- Keogh, C.; Collins, D.J.; Warrington, G.; Comyns, T. Intra-trial reliability and usefulness of isometric mid-thigh pull testing on portable force plates. J. Hum. Kinet. 2020, 71, 33–45. [Google Scholar] [CrossRef] [Green Version]
- Thomas, C.; Comfort, P.; Dos’santos, T.; Jones, P.A. Determining bilateral strength imbalances in youth basketball athletes. Int. J. Sport. Med. 2017, 38, 683–690. [Google Scholar] [CrossRef]
- Mirwald, R.L.; Baxter-Jones, A.D.; Bailey, D.A.; Beunen, G.P. An assessment of maturity from anthropometric measurements. Med. Sci. Sport. Exerc. 2002, 34, 689–694. [Google Scholar] [CrossRef]
- Barrett, S.; Midgley, A.; Lovell, R. PlayerLoad (TM): Reliability, convergent validity, and influence of unit position during treadmill running. Int. J. Sport. Physiol. Perform. 2014, 9, 945–952. [Google Scholar] [CrossRef] [PubMed]
- Banister, E.W. Modeling elite athletic performance. In Physiological Testing of the High-Performance Athlete, 2nd ed.; MacDougall, D., Wenger, A., Green, H.J., Eds.; Human Kinetics: Champaign, IL, USA, 1991; pp. 403–424. ISBN 978-087-322-300-3. [Google Scholar]
- Chavda, S.; Bromley, T.; Jarvis, P.; Williams, S.; Bishop, C.; Turner, A.N.; Lake, J.P.; Mundy, P.D. Force-time characteristics of the countermovement jump: Analyzing the curve in excel. Strength Cond. J. 2018, 40, 67–77. [Google Scholar] [CrossRef] [Green Version]
- Sole, C.; Mizuguchi, S.; Sato, K.; Moir, G.L.; Stone, M.H. Phase characteristics of the countermovement jump force-time curve: A comparison of athletes by jumping ability. J. Strength Cond. Res. 2018, 32, 1155–1165. [Google Scholar] [CrossRef] [PubMed]
- Mizuguchi, S. Net Impulse and Net Impulse Characteristics in Vertical Jumping. Doctoral Dissertation, East Tennessee State University, Johnson City, TN, USA, 2012. [Google Scholar]
- Haff, G.G.; Ruben, R.; Lider, J.; Twine, C.; Cormie, P. A comparison of methods for determining the rate of force development during isometric mid-thigh clean pulls. J. Strength Cond. Res. 2014, 29, 386–395. [Google Scholar] [CrossRef] [PubMed]
- Hopkins, W.G. A Scale of Magnitudes for Effect Statistics. Available online: http://www.sportsci.org/resource/stats/effectmag.html (accessed on 14 October 2020).
- Halson, S.L. Monitoring training load to understand fatigue in athletes. Sport. Med. 2014, 44, 139–147. [Google Scholar] [CrossRef] [Green Version]
- Karvonen, J.; Vuorimaa, T. Heart rate and exercise intensity during sports activities. Practical application. Sport. Med. 1988, 5, 303–311. [Google Scholar] [CrossRef]
- Hopkins, W.G. Quantification of training in competitive sports. Sport. Med. 1991, 12, 161–183. [Google Scholar] [CrossRef]
- Bailey, C.; Sato, K.; Alexander, R.; Ting Chiang, C.-Y.; Stone, M.H. Isometric force production symmetry and jumping performance in collegiate athletes. J. Trainol. 2013, 2, 1–5. [Google Scholar] [CrossRef] [Green Version]
- Stone, M.H.; Sanborn, K.; O’Bryant, H.S.; Hartman, M.; Stone, M.E.; Proulx, C.; Ward, B.; Hruby, J. Maximum strength-power-performance relatinoships in collegiate throwers. J. Strength Cond. Res. 2003, 14, 739–745. [Google Scholar]
- Cortis, C.; Tessitore, A.; Lupo, C.; Pesce, C.; Fossile, E.; Figura, F.; Capranica, L. Interlimb coordination, strength, jump, and sprint performances following a youth men’s basketball game. J. Strength Cond. Res. 2011, 25, 135–142. [Google Scholar] [CrossRef]
- Haff, G.G. Sport science. Strength Cond. J. 2010, 32, 33–45. [Google Scholar] [CrossRef]


| Training Squad | Week 1 | Week 2 | Week 3 | Week 4 | Week 5 | Week 6 | Week 7 | Week 8 | Week 9 | Week 10 |
|---|---|---|---|---|---|---|---|---|---|---|
| Under 16 Girls | 2x SPP 1x NPP | 2x SPP 1x NPP | 2x SPP 1x NPP | 2x SPP 1x NPP | 1x SPP 1x NPP | 1x SPP 1x NPP | 2x SPP 1x NPP | 2x SPP 1x NPP | 1x NPP | 1x SPP |
| Under 16 Boys | ||||||||||
| Under 18 Girls | 1x G 1x NPP | 1x G 1x NPP | 1x G 1x NPP | 1x G 1x NPP | ||||||
| Under 18 Boys | ||||||||||
| On-Court Training Focus | Skills development, small-sided games, and scrimmages (full and half court) | Decreased full court running and player contact (i.e., more half court small-sided games and team scrimmages) | ||||||||
Disclaimer/Publisher’s Note: The statements, opinions and data contained in all publications are solely those of the individual author(s) and contributor(s) and not of MDPI and/or the editor(s). MDPI and/or the editor(s) disclaim responsibility for any injury to people or property resulting from any ideas, methods, instructions or products referred to in the content. |
© 2023 by the authors. Licensee MDPI, Basel, Switzerland. This article is an open access article distributed under the terms and conditions of the Creative Commons Attribution (CC BY) license (https://creativecommons.org/licenses/by/4.0/).
Share and Cite
Palmer, B.L.; van der Ploeg, G.E.; Bourdon, P.C.; Butler, S.R.; Crowther, R.G. Evaluation of Athlete Monitoring Tools across 10 Weeks of Elite Youth Basketball Training: An Explorative Study. Sports 2023, 11, 26. https://doi.org/10.3390/sports11020026
Palmer BL, van der Ploeg GE, Bourdon PC, Butler SR, Crowther RG. Evaluation of Athlete Monitoring Tools across 10 Weeks of Elite Youth Basketball Training: An Explorative Study. Sports. 2023; 11(2):26. https://doi.org/10.3390/sports11020026
Chicago/Turabian StylePalmer, Branson L., Grant E. van der Ploeg, Pitre C. Bourdon, Scott R. Butler, and Robert G. Crowther. 2023. "Evaluation of Athlete Monitoring Tools across 10 Weeks of Elite Youth Basketball Training: An Explorative Study" Sports 11, no. 2: 26. https://doi.org/10.3390/sports11020026