
Normative Scores for CrossFit® Open Workouts: 2011–2022


.jpg)
Abstract
:1. Introduction
2. Materials and Methods
2.1. Experimental Design
2.2. Participants
- At least one round (in AMRAP-style workouts);
- The first exercise couplet in workouts where couplets were repeated;
- All repetitions assigned for the first exercise in the list (TTC workouts) or when several rounds were not expected (in AMRAP-style workouts);
- Timed workouts within 60 min when no time limit was programmed (i.e., CFO 14.5, CFO 15.5, and CFO 16.5);
- A 1-RM with a load equal to or greater than the standard barbell used by men (45 lbs. (20.4 kg)) and women (35 lbs. (15.9 kg)).
2.3. Workout Descriptions
2.4. Statistical Analysis
3. Results
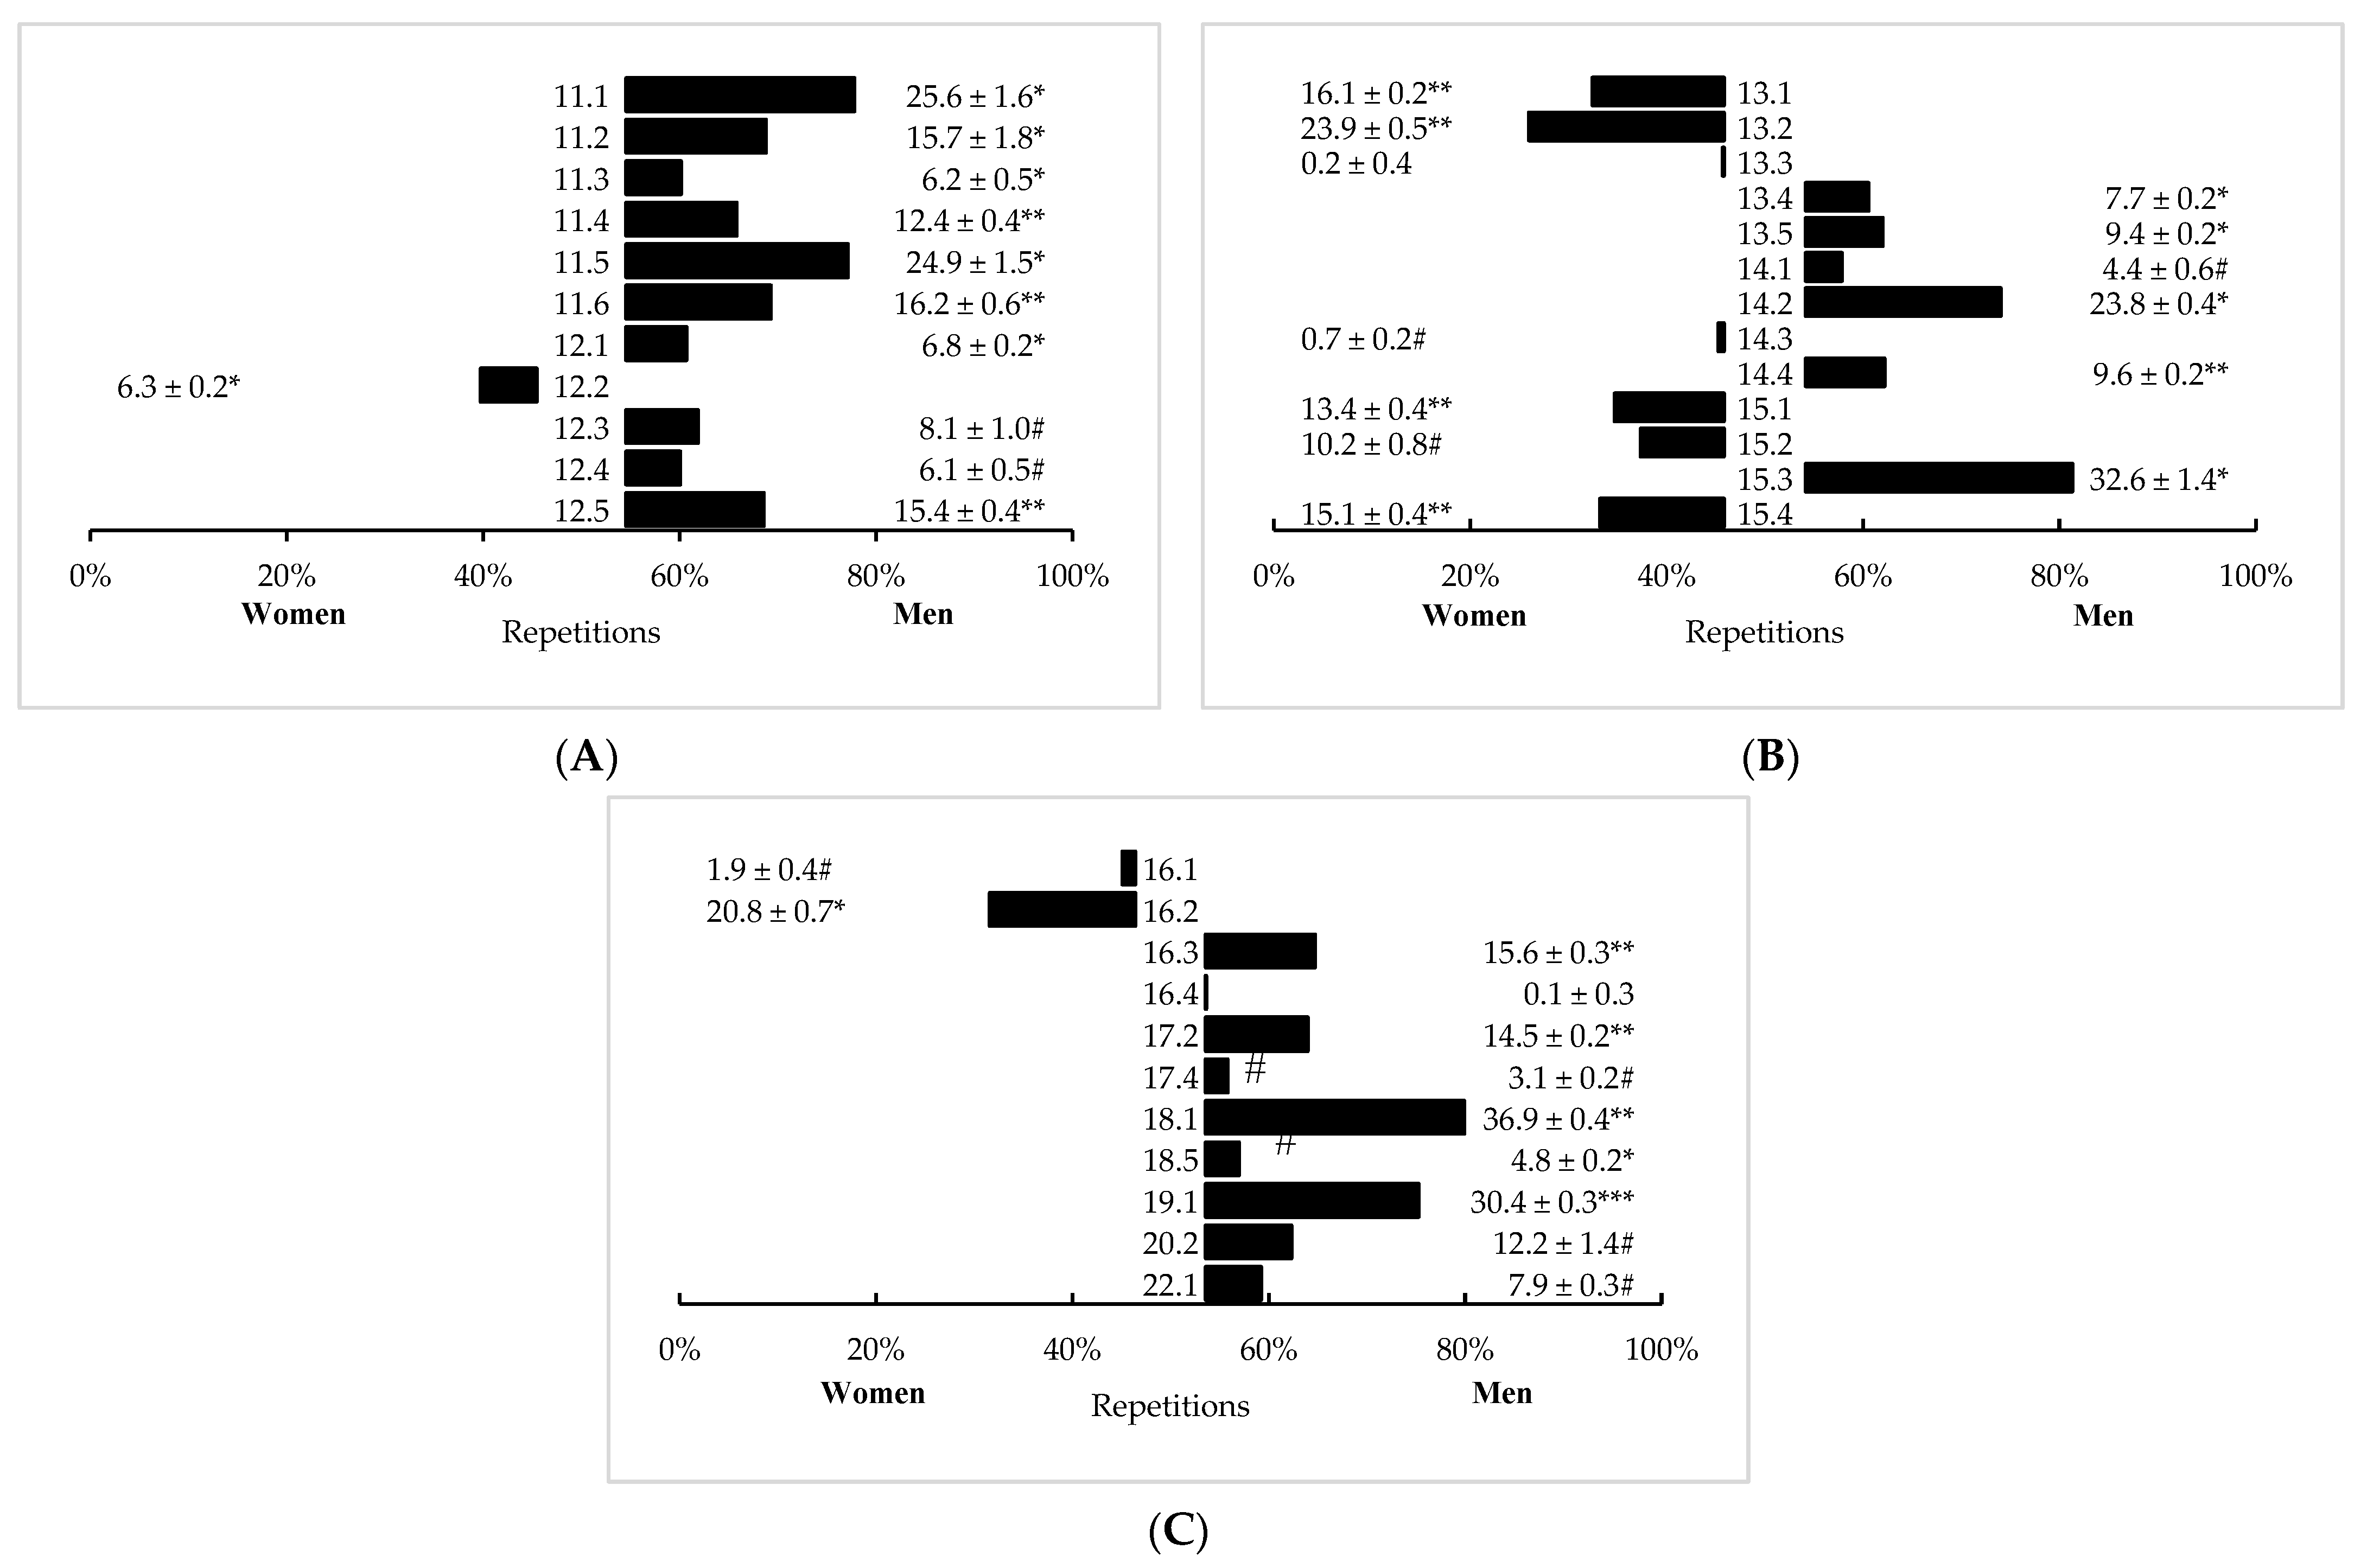
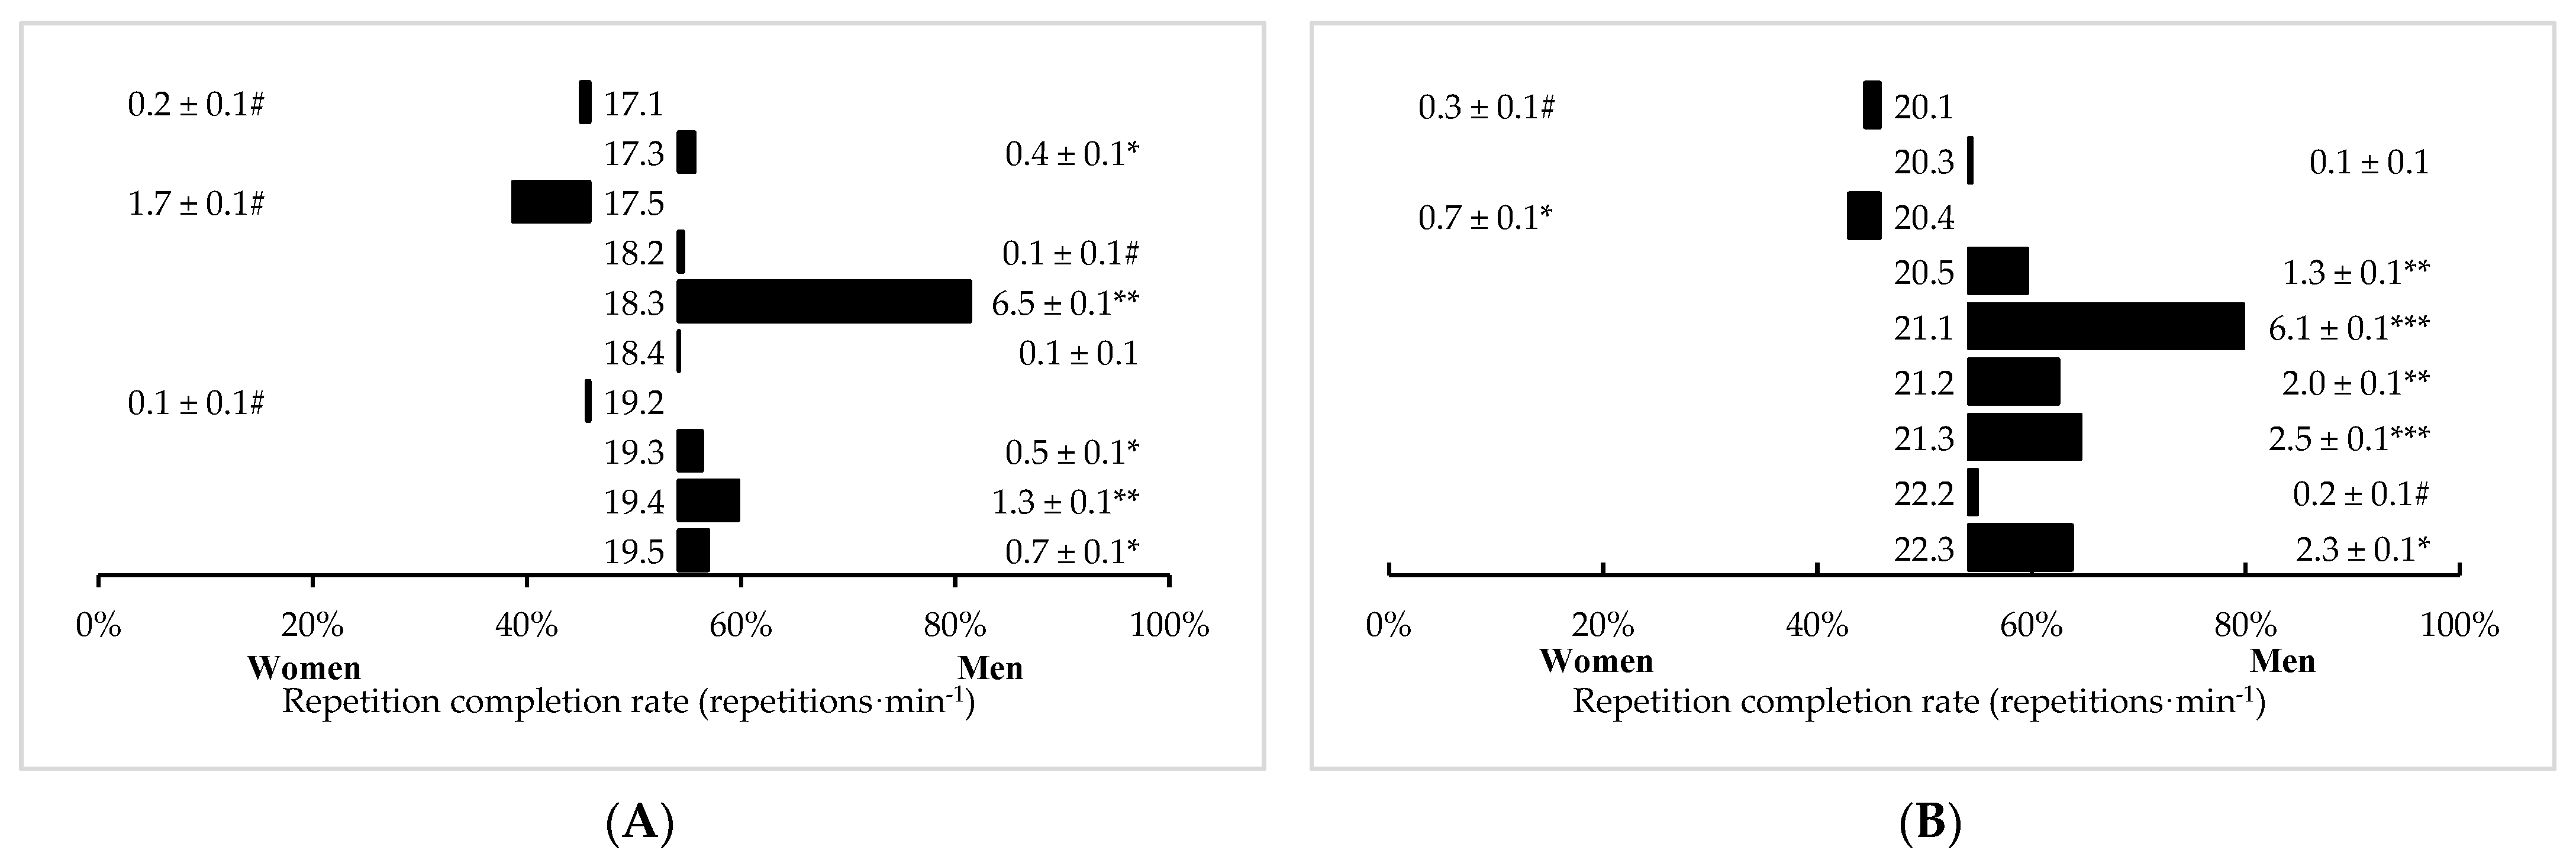
Sex Differences
4. Discussion
5. Conclusions
Author Contributions
Funding
Institutional Review Board Statement
Informed Consent Statement
Data Availability Statement
Conflicts of Interest
References
- CrossFit. Finding the Fittest on Earth. In CrossFit Games; CrossFit: Washington, DC, USA, 2021; Available online: https://games.crossfit.com/history-of-the-games (accessed on 1 November 2022).
- CrossFit. Open Workouts. In CrossFit Games; CrossFit: Washington, DC, USA, 2021. [Google Scholar]
- CrossFit. Games Competition Rulebook. CrossFit J. 2022. [Google Scholar]
- Glassman, G. CrossFit training guide level 1. CrossFit J. 2011. [Google Scholar]
- Carreker, J.D.D.; Grosicki, G.J. Physiological predictors of performance on the CrossFit® “Murph” challenge. Sports 2020, 8, 92. [Google Scholar] [CrossRef] [PubMed]
- Mangine, G.T.; Tankersley, J.E.; McDougle, J.M.; Velazquez, N.; Roberts, M.D.; Esmat, T.A.; VanDusseldorp, T.A.; Feito, Y. Predictors of CrossFit Open performance. Sports 2020, 8, 102. [Google Scholar] [CrossRef] [PubMed]
- Mangine, G.T.; Mcdougle, J.M.; Feito, Y. Relationships Between Body Composition and “Fran” Performance are Modulated by Competition Class and Skill. Front. Physiol. 2022, 13, 893771. [Google Scholar] [CrossRef]
- Butcher, S.J.; Neyedly, T.J.; Horvey, K.J.; Benko, C.R. Do physiological measures predict selected CrossFit® benchmark performance? Open Access J. Sport. Med. 2015, 6, 241. [Google Scholar] [CrossRef] [Green Version]
- Dexheimer, J.D.; Schroeder, E.T.; Sawyer, B.J.; Pettitt, R.W.; Aguinaldo, A.L.; Torrence, W.A. Physiological Performance Measures as Indicators of CrossFit® Performance. Sports 2019, 7, 93. [Google Scholar] [CrossRef] [Green Version]
- Zeitz, E.K.; Cook, L.F.; Dexheimer, J.D.; Lemez, S.; Leyva, W.D.; Terbio, I.Y.; Tran, J.R.; Jo, E. The relationship between Crossfit® performance and laboratory-based measurements of fitness. Sports 2020, 8, 112. [Google Scholar] [CrossRef]
- Bellar, D.; Hatchett, A.; Judge, L.; Breaux, M.; Marcus, L. The relationship of aerobic capacity, anaerobic peak power and experience to performance in CrossFit exercise. Biol. Sport 2015, 32, 315–320. [Google Scholar] [CrossRef]
- Feito, Y.; Giardina, M.J.; Butcher, S.; Mangine, G.T. Repeated anaerobic tests predict performance among a group of advanced CrossFit-trained athletes. Appl. Physiol. Nutr. Metab. 2018, 44, 727–735. [Google Scholar] [CrossRef]
- Hoffman, J.R. Norms for Fitness, Performance, and Health; Human Kinetics: Champaign, IL, USA, 2006. [Google Scholar]
- Mangine, G.T.; McDougle, J.M. CrossFit® open performance is affected by the nature of past competition experiences. BMC Sport. Sci. Med. Rehabil. 2022, 14, 46. [Google Scholar] [CrossRef] [PubMed]
- Serafini, P.R.; Feito, Y.; Mangine, G.T. Self-reported measures of strength and sport-specific skills distinguish ranking in an international online fitness competition. J. Strength Cond. Res. 2018, 32, 3474–3484. [Google Scholar] [CrossRef]
- Mangine, G.T. Sex differences and performance changes over time in a repeated fitness competition workout containing thrusters and chest-to-bar pull-ups. In Proceedings of the National Strength & Conditioning Association National Conference, New Orleans, LA, USA, 6–9 July 2022. [Google Scholar]
- Mangine, G.T.; Cebulla, B.; Feito, Y. Normative values for self-reported benchmark workout scores in CrossFit® practitioners. Sport. Med.-Open 2018, 4, 39. [Google Scholar] [CrossRef]
- CrossFit. Athlete Profile. Available online: https://athlete.crossfit.com/profile (accessed on 25 April 2022).
- Leaderboard. Leaderboard. Available online: http://games.crossfit.com/leaderboard (accessed on 31 August 2022).
- Weir, J.P.; Vincent, W.J. The Normal Curve. In Statistics in Kinesiology, 5th ed.; Human Kinetics: Champaign, IL, USA, 2021; pp. 55–65. [Google Scholar]
- Mangine, G.T.; Seay, T.R. Quantifying CrossFit®: Potential solutions for monitoring multimodal workloads and identifying training targets. Front. Sport. Act. Living 2022, 4, 949429. [Google Scholar] [CrossRef] [PubMed]
- Mangine, G.T.; Feito, Y.; Tankersley, J.E.; McDougle, J.M.; Kliszczewicz, B.M. Workout Pacing Predictors of Crossfit Open Performance: A Pilot Study. J. Hum. Kinet. 2021, 78, 89–100. [Google Scholar] [CrossRef]
- Cohen, J. Statistical Power Analysis for the Behavioral Sciences; Lawrence Erlbaum Associates, Publishers: Hillsdale, NJ, USA, 1988; pp. 284–288. [Google Scholar]
- Mangine, G.T.; Dexheimer, J.D.; Zeitz, E.K.; Tankersley, J.E.; Kliszczewicz, B.M. Pacing strategies for women in a 20 minute high intensity functional training competition workout containing muscle ups, rowing, and wall balls. In Proceedings of the National Conference, Orlando, FL, USA, 9–12 December 1984. [Google Scholar]
- Laxton, K. Closing the gender gap—Empowering women in sport. In CrossFit Journal; CrossFit Games: Washington, DC, USA, 2022. [Google Scholar]
- Sandbakk, Ø.; Solli, G.S.; Holmberg, H.-C. Sex differences in world-record performance: The influence of sport discipline and competition duration. Int. J. Sports Physiol. Perform. 2018, 13, 2–8. [Google Scholar] [CrossRef] [PubMed]
- Huebner, M.; Perperoglou, A. Sex differences and impact of body mass on performance from childhood to senior athletes in Olympic weightlifting. PLoS ONE 2020, 15, e0238369. [Google Scholar] [CrossRef] [PubMed]
- Hunter, S.K. The relevance of sex differences in performance fatigability. Med. Sci. Sports Exerc. 2016, 48, 2247. [Google Scholar] [CrossRef] [Green Version]
- Frontera, W.R.; Hughes, V.A.; Lutz, K.J.; Evans, W.J. A cross-sectional study of muscle strength and mass in 45-to 78-yr-old men and women. J. Appl. Physiol. 1991, 71, 644–650. [Google Scholar] [CrossRef]
- Doherty, T.J. The influence of aging and sex on skeletal muscle mass and strength. Curr. Opin. Clin. Nutr. Metab. Care 2001, 4, 503–508. [Google Scholar] [CrossRef]
- Bishop, P.; Cureton, K.; Collins, M. Sex difference in muscular strength in equally-trained men and women. Ergonomics 1987, 30, 675–687. [Google Scholar] [CrossRef] [PubMed]


| Women | Men | |||||||||
|---|---|---|---|---|---|---|---|---|---|---|
| Year | NTotal | NStudy | n | Age (y) | Rank (Range) | NTotal | NStudy | n | Age (y) | Rank (Range) |
| 2011 | 4506 | 3046 | 2084 | 30.3 ± 6.4 | 2039 ± 1242 (1–4491) | 8621 | 7046 | 4764 | 29.6 ± 6.3 | 4089 ± 2468 (1–8619) |
| 2012 | 14,217 | 8621 | 9715 | 30.8 ± 5.8 | 4574 ± 2869 (3–12,089) | 25,027 | 18,873 | 25,146 | 30.6 ± 5.8 | 9776 ± 5861 (1–21,861) |
| 2013 | 32,643 | 14,144 | 5864 | 31.3 ± 6.9 | 8008 ± 5389 (1–25,127) | 52,169 | 36,808 | 12,852 | 31.6 ± 7.1 | 19,177 ± 11,500 (1–45,181) |
| 2014 | 52,076 | 36,863 | 18,174 | 31.1 ± 7 | 14,668 ± 9520 (1–42,021) | 80,284 | 63,828 | 43,371 | 31.8 ± 7.2 | 32,570 ± 19,137 (1–70,402) |
| 2015 | 108,764 | 7787 | 5313 | 29.7 ± 6.1 | 5000 ± 3866 (3–22,769) | 153,272 | 45,615 | 31,006 | 30.7 ± 6.6 | 24,568 ± 15,552 (1–66,148) |
| 2016 | 130,154 | 16,372 | 11,135 | 30.4 ± 6.4 | 9875 ± 7042 (1–35,593) | 178,510 | 53,920 | 36,662 | 31.3 ± 6.7 | 28,396 ± 17,509 (1–76,110) |
| 2017 | 159,563 | 36,721 | 25,096 | 31.8 ± 7.1 | 20,299 ± 13,286 (1–63,069) | 214,519 | 84,669 | 57,311 | 32.6 ± 7.2 | 49,063 ± 32,387 (2–137,473) |
| 2018 | 171,976 | 31,007 | 21,130 | 31.8 ± 7 | 17,926 ± 12,513 (1–63,422) | 227,562 | 78,268 | 52,994 | 32.4 ± 7 | 44,822 ± 29,926 (2–138,037) |
| 2019 | 146,363 | 39,895 | 39,895 | 32.8 ± 7.4 | 22,606 ± 15,224 (1–72,134) | 195,562 | 87,197 | 87,197 | 33.9 ± 7.4 | 50,957 ± 33,750 (1–140,693) |
| 2020 | 94,157 | 20,965 | 14,219 | 32.9 ± 7.4 | 12,358 ± 8831 (2–46,161) | 133,874 | 51,394 | 34,932 | 33.7 ± 7.3 | 29,294 ± 19,543 (2–90,686) |
| 2021 | 108,641 | 42,799 | 28,961 | 33.5 ± 7.8 | 22,449 ± 13,553 (4–53,595) | 137,464 | 73,750 | 29,056 | 32.8 ± 7 | 21,715 ± 12,600 (1–43,847) |
| 2022 | 122,177 | 51,011 | 34,675 | 33.4 ± 7.7 | 27,175 ± 16,814 (2–67,891) | 154,815 | 89,792 | 61,055 | 34.5 ± 7.7 | 48,484 ± 30,324 (3–117,302) |
| Programming | Percentile Rank | |||||||||||||||
|---|---|---|---|---|---|---|---|---|---|---|---|---|---|---|---|---|
| Workout | Duration | Prescription | Sex | 99 | 95 | 90 | 80 | 70 | 60 | 50 | 40 | 30 | 20 | 10 | 5 | 1 |
| 11.1 repetitions | 10 min AMRAP | 30 × Double-unders | W | 355 | 315 | 304 | 270 | 261 | 244 | 224 | 214 | 196 | 175 | 148 | 131 | 94 |
| 15 × Power snatches (75 lbs/55 lbs) | M | 389 | 352 | 333 | 308 | 293 | 269 | 259 | 240 | 220 | 195 | 165 | 135 | 95 | ||
| 11.2 repetitions | 15 min AMRAP | 9 × Deadlifts (155 lbs/100 lbs) | W | 507 | 437 | 410 | 376 | 354 | 338 | 324 | 304 | 288 | 269 | 246 | 225 | 188 |
| 12 × Push-ups | M | 511 | 453 | 430 | 398 | 373 | 353 | 336 | 321 | 303 | 284 | 260 | 237 | 197 | ||
| 15 × Box jumps (24”/20”) | ||||||||||||||||
| 11.3 repetitions | 5 min AMRAP | 1 × Squat clean (165 lbs/110 lbs) | W | 71 | 59 | 52 | 44 | 38 | 33 | 29 | 24 | 19 | 12 | 5 | 1 | 1 |
| 1 × Jerk (165 lbs/110 lbs) | M | 73 | 63 | 58 | 50 | 45 | 40 | 36 | 31 | 26 | 20 | 12 | 5 | 1 | ||
| 11.4 repetitions | 10 min AMRAP | 60 × Bar-facing burpees | W | 109 | 95 | 91 | 90 | 90 | 84 | 78 | 73 | 69 | 65 | 61 | 60 | 60 |
| 30 × Overhead squats (120 lbs/90 lbs) | M | 143 | 127 | 118 | 102 | 96 | 93 | 90 | 89 | 81 | 74 | 66 | 62 | 60 | ||
| 10 × Ring muscle-ups | ||||||||||||||||
| 11.5 repetitions | 20 min AMRAP | 5 × Power cleans (145 lbs/100 lbs) | W | 360 | 318 | 304 | 278 | 260 | 246 | 233 | 216 | 205 | 185 | 157 | 132 | 90 |
| 10 × Toes-to-bar | M | 387 | 341 | 322 | 303 | 281 | 270 | 252 | 242 | 225 | 214 | 189 | 173 | 128 | ||
| 15 × Wall ball shots (20 lbs/14 lbs to 10′/9′ target) | ||||||||||||||||
| 11.6 repetitions | 7 min AMRAP | 3 × Thrusters (100 lbs/65 lbs) | W | 126 | 110 | 103 | 94 | 86 | 81 | 76 | 71 | 61 | 55 | 41 | 29 | 12 |
| 3 × Chest-to-bar pull-ups | M | 137 | 125 | 117 | 107 | 101 | 96 | 90 | 85 | 79 | 72 | 64 | 54 | 32 | ||
| * Add 3 repetitions after each set | ||||||||||||||||
| 12.1 repetitions | 7 min AMRAP | Burpees | W | 124 | 115 | 110 | 105 | 101 | 97 | 93 | 90 | 86 | 82 | 76 | 72 | 64 |
| M | 134 | 124 | 119 | 113 | 108 | 104 | 101 | 96 | 92 | 87 | 80 | 75 | 66 | |||
| 12.2 repetitions | 10 min AMRAP | 30 × Snatches (75 lbs/45 lbs) | W | 92 | 87 | 80 | 71 | 65 | 61 | 60 | 60 | 60 | 59 | 45 | 34 | 30 |
| 30 × Snatches (135 lbs/75 lbs) | M | 85 | 76 | 72 | 66 | 62 | 60 | 60 | 57 | 50 | 42 | 32 | 30 | 30 | ||
| 30 × Snatches (165 lbs/100 lbs) | ||||||||||||||||
| Max repetitions × Snatches (210 lbs/120 lbs) | ||||||||||||||||
| 12.3 repetitions | 18 min AMRAP | 15 × Box jumps (24”/20”) | W | 422 | 370 | 341 | 309 | 285 | 270 | 251 | 238 | 223 | 204 | 178 | 160 | 105 |
| 12 × Push press (115 lbs/75 lbs) | M | 421 | 375 | 349 | 315 | 294 | 275 | 260 | 243 | 231 | 211 | 193 | 168 | 129 | ||
| 9 × Toes-to-bar | ||||||||||||||||
| 12.4 repetitions | 12 min AMRAP | 150 × Wall ball shots (20 lbs/14 lbs to 10′/9′ target) | W | 255 | 247 | 243 | 240 | 240 | 240 | 240 | 225 | 202 | 182 | 164 | 155 | 150 |
| 90 × Double-unders | M | 265 | 257 | 253 | 248 | 245 | 242 | 240 | 240 | 213 | 187 | 166 | 156 | 150 | ||
| 30 × Muscle-ups | ||||||||||||||||
| 12.5 repetitions | 7 min AMRAP | 3 × Thrusters (100 lbs/65 lbs) | W | 126 | 111 | 104 | 91 | 85 | 80 | 75 | 68 | 58 | 52 | 34 | 28 | 13 |
| 3 × Chest-to-bar pull-ups | M | 137 | 123 | 115 | 104 | 99 | 93 | 87 | 82 | 76 | 70 | 61 | 54 | 31 | ||
| * Add 3 repetitions after each set | ||||||||||||||||
| Programming | Percentile Rank | |||||||||||||||
|---|---|---|---|---|---|---|---|---|---|---|---|---|---|---|---|---|
| Workout | Duration | Prescription | Sex | 99 | 95 | 90 | 80 | 70 | 60 | 50 | 40 | 30 | 20 | 10 | 5 | 1 |
| 13.1 repetitions | 17 min AMRAP | Alternate the following exercises: | W | 191 | 176 | 168 | 159 | 153 | 150 | 150 | 150 | 146 | 131 | 118 | 108 | 100 |
| 40 → 30 → 20 → 10 × Burpees | M | 174 | 163 | 158 | 151 | 150 | 141 | 128 | 122 | 115 | 108 | 101 | 100 | 100 | ||
| 30 × Snatches at (75 lbs/45 lbs) → (135 lbs/75 lbs) → (165 lbs/100 lbs) | ||||||||||||||||
| Then, max repetitions × Snatches (210 lbs/120 lbs) | ||||||||||||||||
| 13.2 repetitions | 10 min AMRAP | 5 × Shoulder-to-overheads (115 lbs/75 lbs) | W | 350 | 325 | 310 | 295 | 280 | 270 | 260 | 249 | 240 | 228 | 210 | 197 | 170 |
| 10 × Deadlifts (115 lbs/75 lbs) | M | 330 | 303 | 288 | 270 | 256 | 243 | 235 | 225.8 | 213 | 204 | 186 | 177 | 153 | ||
| 15 × Box jumps (24”/20”) | ||||||||||||||||
| 13.3 repetitions | 12 min AMRAP | 150 × Wall ball shots (20 lbs/14 lbs to 10′/9′ target) | W | 257 | 249 | 245 | 240 | 240 | 240 | 240 | 240 | 215 | 193 | 170 | 158 | 150 |
| 90 × Double-unders | M | 266 | 258 | 254 | 248 | 244 | 241 | 240 | 235 | 206 | 183 | 164 | 155 | 150 | ||
| 30 × Muscle-ups | ||||||||||||||||
| 13.4 repetitions | 7 min AMRAP | 3 × Clean and jerk (135 lbs/95 lbs) | W | 103 | 94 | 88 | 76 | 71 | 68 | 64 | 61 | 56 | 47 | 42 | 37 | 21 |
| 3 × Toes-to-bar | M | 108 | 100 | 95 | 87 | 79 | 73 | 70 | 67 | 63 | 60 | 48 | 43 | 35 | ||
| * Add 3 repetitions after each set | ||||||||||||||||
| 13.5 repetitions | ≥4 min AMRAP | 15 × Thrusters (100 lbs/65 lbs) | W | 144 | 84 | 78 | 70 | 61 | 57 | 54 | 51 | 49 | 46 | 42 | 38 | 30 |
| 15 × Chest-to-bar pull-ups | M | 152 | 130 | 87 | 78 | 72 | 68 | 64 | 60 | 55 | 51 | 46 | 42 | 35 | ||
| * Add 4 min each time 3 sets are completed within time limit | ||||||||||||||||
| 14.1 repetitions | 10 min AMRAP | 30 × Double-unders | W | 371 | 341 | 311 | 297 | 267 | 258 | 235 | 220 | 210 | 179 | 150 | 129 | 90 |
| 15 × Power snatches (75 lbs/55 lbs) | M | 381 | 348 | 316 | 303 | 273 | 262 | 249 | 224 | 211 | 179 | 142 | 121 | 90 | ||
| 14.2 repetitions | 3 min rounds (indefinite) | Complete 2 sets of: | W | 203 | 143 | 134 | 114 | 82 | 77 | 68 | 59 | 36 | 33 | 29 | 24 | 20 |
| 10 × Overhead squats (95 lbs/65 lbs) | M | 254 | 194 | 175 | 133 | 122 | 109 | 82 | 76 | 69 | 59 | 34 | 27 | 20 | ||
| 10 × Chest-to-bar pull-ups | ||||||||||||||||
| * Add 3 min and 2 repetitions after each set | ||||||||||||||||
| 14.3 repetitions | 8 min AMRAP | Alternate the following exercises: | W | 158 | 147 | 141 | 135 | 130 | 119 | 110 | 106 | 102 | 97 | 91 | 90 | 62 |
| Deadlifts: 10 × (135 lbs/95 lbs) → 15 × (185 lbs/135 lbs) → 20 × (225 lbs/155 lbs) → 25 × (275 lbs/185 lbs) → 30 × (315 lbs/205 lbs) → 35 × (365 lbs/225 lbs) | M | 152 | 143 | 138 | 132 | 130 | 117 | 110 | 106 | 102 | 98 | 93 | 90 | 69 | ||
| 15 × Box jumps (24”/20”) | ||||||||||||||||
| 14.4 repetitions | 14 min AMRAP | 60-calorie Rowing | W | 191 | 184 | 181 | 180 | 180 | 176 | 170 | 164 | 159 | 153 | 141 | 124 | 93 |
| 50 × Toes-to-bar | M | 213 | 194 | 190 | 185 | 182 | 180 | 180 | 177 | 171 | 164 | 156 | 146 | 102 | ||
| 40 × Wall ball shots (20 lbs/14 lbs to 10′/9′ target) | ||||||||||||||||
| 30 × Cleans (135 lbs/95 lbs) | ||||||||||||||||
| 20 × Ring muscle-ups | ||||||||||||||||
| 14.5 TTC | No time limit | 21 → 18 → 15 → 12 → 9 → 6 → 3 repetitions: | W | 10:39 | 11:01 | 12:51 | 14:01 | 15:01 | 16:01 | 16:01 | 17:01 | 19:01 | 20:01 | 22:01 | 25:21 | 30:01 |
| Thrusters (95 lbs/65 lbs) | M | 10:40 | 12:01 | 13:01 | 14:33 | 15:01 | 16:01 | 17:01 | 19:01 | 20:01 | 22:21 | 25:01 | 27:01 | 34:01 | ||
| Burpees | ||||||||||||||||
| Programming | Percentile Rank | |||||||||||||||
|---|---|---|---|---|---|---|---|---|---|---|---|---|---|---|---|---|
| Workout | Duration | Prescription | Sex | 99 | 95 | 90 | 80 | 70 | 60 | 50 | 40 | 30 | 20 | 10 | 5 | 1 |
| 15.1 repetitions | 9 min AMRAP | 15 × Toes-to-bar | W | 218 | 205 | 191 | 182 | 175 | 162 | 158 | 154 | 149 | 136 | 127 | 120 | 98 |
| 10 × Deadlifts (115 lbs/75 lbs) | M | 211 | 190 | 182 | 166 | 158 | 152 | 147 | 136 | 129 | 124 | 117 | 103 | 90 | ||
| 5 × Snatches (115 lbs/75 lbs) | ||||||||||||||||
| 6 min time limit | Immediately into: | W | 220 (99.8) | 202 (91.6) | 193 (87.5) | 181 (82.1) | 175 (79.4) | 165 (74.8) | 160 (72.6) | 155 (70.3) | 145 (65.8) | 140 (63.5) | 134 (60.8) | 125 (56.7) | 115 (52.2) | |
| 15.1 a lbs. (kg) | 1-RM Clean and jerk | M | 316 (143.5) | 290 (131.5) | 275 (124.7) | 255 (115.7) | 245 (111.1) | 235 (106.6) | 225 (102.1) | 215 (97.5) | 205 (93) | 198 (89.8) | 185 (83.9) | 176 (79.8) | 165 (74.8) | |
| 15.2 repetitions | 3 min rounds (indefinite) | Complete 2 sets: | W | 278 | 254 | 202 | 192 | 172 | 138 | 133 | 128 | 117 | 86 | 80 | 75 | 63 |
| 10 × Overhead squats (95 lbs/65 lbs) | M | 277 | 244 | 199 | 179 | 140 | 134 | 127 | 118 | 109 | 83 | 74 | 67 | 56 | ||
| 10 × Chest-to-bar pull-ups | ||||||||||||||||
| * Add 3 min and 2 repetitions after each set | ||||||||||||||||
| 15.3 repetitions | 14 min AMRAP | 7 × Ring muscle-ups | W | 478 | 447 | 371 | 332 | 318 | 315 | 279 | 211 | 171 | 161 | 158 | 157 | 157 |
| 50 × Wall ball shots (20 lbs/14 lbs to 10′/9′ target) | M | 504 | 474 | 436 | 362 | 340 | 320 | 316 | 301 | 236 | 190 | 160 | 158 | 157 | ||
| 100 × Double-unders | ||||||||||||||||
| 15.4 repetitions | 8 min AMRAP | 3 × Handstand push-ups | W | 143 | 124 | 111 | 98 | 89 | 80 | 73 | 66 | 57 | 50 | 37 | 30 | 16 |
| 3 × Cleans (185 lbs/125 lbs) | M | 128 | 106 | 95 | 80 | 71 | 64 | 56 | 51 | 45 | 36 | 28 | 20 | 10 | ||
| * Add 3 repetitions after each set | ||||||||||||||||
| 15.5 TTC | No time limit | 27 → 21 → 15 → 9 repetitions: | W | 7:18 | 7:59 | 8:28 | 9:40 | 9:38 | 10:56 | 10:36 | 11:50 | 11:40 | 12:28 | 13:39 | 14:46 | 17:27 |
| Rowing (calories) | M | 6:29 | 7:25 | 7:59 | 8:51 | 9:31 | 10:06 | 10:44 | 11:24 | 12:10 | 13:06 | 14:33 | 15:54 | 19:40 | ||
| Thrusters (95 lbs/65 lbs) | ||||||||||||||||
| 16.1 repetitions | 20 min AMRAP | 25 ft Overhead walking lunge (95 lbs/65 lbs) | W | 289 | 260 | 239 | 219 | 206 | 194 | 183 | 174 | 166 | 156 | 143 | 130 | 108 |
| 8 × Burpees | M | 291 | 260 | 240 | 219 | 206 | 193 | 182 | 171 | 163 | 153 | 136 | 124 | 104 | ||
| 25 ft Overhead walking lunge (95 lbs/65 lbs) | ||||||||||||||||
| 8 × Chest-to-bar pull-ups | ||||||||||||||||
| 16.2 repetitions | 4 min rounds (20 min time limit) | 25 × Toes-to-bar | W | 425 | 343 | 339 | 259 | 255 | 253 | 176 | 173 | 171 | 168 | 165 | 154 | 119 |
| 50 × Double-unders | M | 346 | 339 | 260 | 255 | 234 | 175 | 172 | 170 | 168 | 166 | 165 | 144 | 114 | ||
| Squat cleans: 15 × (135 lbs/85 lbs) → 13 × (185 lbs/115 lbs) → 11 × (225 lbs/145 lbs) → 9 × (275 lbs/175 lbs) 7 × (315 lbs/205 lbs) | ||||||||||||||||
| * Add 4 min for each completed set | ||||||||||||||||
| 16.3 repetitions | 7 min AMRAP | 10 × Power snatches (75 lbs/55 lbs) | W | 117 | 103 | 95 | 86 | 76 | 70 | 63 | 53 | 49 | 37 | 25 | 24 | 23 |
| 3 × Bar muscle-ups | M | 123 | 111 | 103 | 96 | 89 | 86 | 78 | 75 | 69 | 62 | 49 | 37 | 23 | ||
| 16.4 repetitions | 13 min AMRAP | 55 × Deadlifts (225 lbs/155 lbs) | W | 257 | 229 | 211 | 199 | 191 | 185 | 181 | 177 | 172 | 167 | 159 | 146 | 114 |
| 55 × Wall ball shots (20 lbs/14 lbs to 10′/9′) | M | 256 | 225 | 209 | 197 | 190 | 185 | 181 | 177 | 173 | 169 | 165 | 149 | 111 | ||
| 55-calorie Rowing | ||||||||||||||||
| 55 × Handstand push-ups | ||||||||||||||||
| 16.5 TTC | No time limit | 21 → 18 → 15 → 12 → 9 → 6 → 3 repetitions: | W | 9:16 | 10:22 | 11:06 | 12:30 | 12:49 | 13:30 | 14:09 | 14:47 | 15:34 | 16:34 | 18:30 | 19:17 | 22:20 |
| Thrusters (95 lbs/65 lbs) | M | 9:27 | 10:48 | 11:42 | 12:51 | 13:45 | 14:35 | 15:22 | 16:14 | 17:10 | 18:23 | 20:20 | 21:47 | 25:21 | ||
| Burpees | ||||||||||||||||
| Programming | Percentile Rank | |||||||||||||||
|---|---|---|---|---|---|---|---|---|---|---|---|---|---|---|---|---|
| Workout | Duration | Prescription | Sex | 99 | 95 | 90 | 80 | 70 | 60 | 50 | 40 | 30 | 20 | 10 | 5 | 1 |
| 17.1 TTC → repetitions | 20 min time limit | Alternate the following: | W | 12:15 | 13:54 | 14:59 | 16:23 | 17:25 | 18:22 | 19:11 | 19:53 | 215 | 203 | 183 | 170 | 149 |
| Dumbbell snatches (50 lbs/35 lbs): × 10 → 20 → 30 → 40 → 50 repetitions | M | 12:50 | 13:51 | 14:58 | 16:30 | 17:39 | 18:38 | 19:29 | 220 | 211 | 195 | 177 | 164 | 145 | ||
| 15 × Burpee box jump-overs (24”/20”) | ||||||||||||||||
| 17.2 repetitions | 12 min AMRAP | Complete 2 sets: | W | 182 | 141 | 122 | 113 | 91 | 85 | 80 | 78 | 78 | 78 | 78 | 78 | 73 |
| 50 ft Walking dumbbell lunges (50 lbs/35 lbs) | M | 194 | 163 | 146 | 125 | 118 | 114 | 106 | 90 | 85 | 80 | 78 | 78 | 76 | ||
| 16 × Toes-to-bar | ||||||||||||||||
| 8 × Dumbbell power cleans (50 lbs/35 lbs) | ||||||||||||||||
| Then, complete 2 sets: | ||||||||||||||||
| 50 ft Walking dumbbell lunges (50 lbs/35 lbs) | ||||||||||||||||
| 16 × Bar muscle-ups | ||||||||||||||||
| 8 × Dumbbell power cleans (50 lbs/35 lbs) | ||||||||||||||||
| 17.3 TTC → repetitions | 8 min AMRAP (24 min time limit) | Prior to 8 min, complete 3 sets: | W | 154 | 105 | 92 | 80 | 68 | 59 | 55 | 47 | 44 | 43 | 43 | 41 | 36 |
| 6 × Chest-to-bar pull-ups | M | 167 | 119 | 105 | 92 | 80 | 71 | 65 | 57 | 52 | 45 | 43 | 43 | 38 | ||
| 6 × Squat snatches (95 lbs/65 lbs) | ||||||||||||||||
| Then, complete 3 sets: | ||||||||||||||||
| 7 × Chest-to-bar pull-ups | ||||||||||||||||
| 5 × Squat snatches (135 lbs/95 lbs) | ||||||||||||||||
| * Add 4 min after completing 3 sets: | ||||||||||||||||
| 8 → 9 → 10 → 11 × Chest-to-bar pull-ups | ||||||||||||||||
| Squat snatches: 4 × (185 lbs/135 lbs) → 3 × (225 lbs/155 lbs) → 2 × (245 lbs/175 lbs) → 1 × (265 lbs/185 lbs) | ||||||||||||||||
| 17.4 repetitions | 13 min AMRAP | 55 × Deadlifts (225 lbs/155 lbs) | W | 256 | 218 | 203 | 190 | 183 | 177 | 173 | 169 | 165 | 165 | 149 | 134 | 98 |
| 55 × Wall ball shots (20 lbs/14 lbs to 10′/9′ target) | M | 260 | 226 | 208 | 195 | 187 | 181 | 177 | 173 | 168 | 165 | 149 | 131 | 95 | ||
| 55-calorie Rowing | ||||||||||||||||
| 55 × Handstand push-ups | ||||||||||||||||
| 17.5 TTC → repetitions | 40 min time limit | Complete 10 sets of: | W | 8:06 | 9:33 | 10:34 | 12:50 | 13:20 | 14:31 | 15:46 | 17:10 | 18:53 | 21:30 | 26:25 | 32:24 | 323 |
| 9 × Thrusters (95 lbs/65 lbs) | M | 8:20 | 9:40 | 10:48 | 12:31 | 13:58 | 15:25 | 16:56 | 18:38 | 20:46 | 24:40 | 30:33 | 38:47 | 265 | ||
| 35 × Double-unders | ||||||||||||||||
| 18.1 repetitions | 20 min AMRAP | 8 × Toes-to-bar | W | 379 | 348 | 329 | 307 | 291 | 278 | 268 | 257 | 245 | 232 | 215 | 200 | 175 |
| 10 × Dumbbell hang clean and jerks (50 lbs/35 lbs) | M | 425 | 391 | 370 | 347 | 330 | 320 | 305 | 292 | 279 | 264 | 245 | 232 | 203 | ||
| 14-calorie Rowing | ||||||||||||||||
| 18.2 TTC → repetitions | 12 min time limit | Complete 1 → 2 → 3 → 4 → 5 → 6 → 7 → 8 → 9 → 10 repetitions: | W | 4:46 | 5:31 | 5:58 | 6:34 | 6:58 | 7:22 | 7:43 | 8:50 | 8:31 | 9:00 | 9:47 | 10:21 | 11:15 |
| Dumbbell squats (50 lbs/35 lbs) | M | 4:35 | 5:22 | 5:49 | 6:25 | 6:53 | 7:18 | 7:43 | 8:08 | 8:36 | 9:10 | 9:56 | 10:32 | 11:25 | ||
| Bar-facing burpees | ||||||||||||||||
| 18.2 a lbs. (kg) | Then: | W | 225 (102.1) | 205 (93) | 192 (87.1) | 178 (80.7) | 170 (77.1) | 161 (73) | 155 (70.3) | 147 (66.7) | 142 (64.4) | 135 (61.2) | 125 (56.7) | 115 (52.2) | 100 (45.4) | |
| 1-RM Clean | M | 335 (152) | 305 (138.3) | 287 (130.2) | 267 (121.1) | 255 (115.7) | 243 (110.2) | 232 (105.2) | 225 (102.1) | 212 (96.2) | 200 (90.7) | 185 (83.9) | 175 (79.4) | 154 (69.9) | ||
| 18.3 TTC → repetitions | 14 min time limit | Complete 2 sets: | W | 689 | 578 | 486 | 432 | 230 | 224 | 220 | 220 | 220 | 220 | 220 | 220 | 162 |
| 100 × Double-unders | M | 722 | 675 | 584 | 536 | 462 | 453 | 380 | 302 | 227 | 222 | 220 | 220 | 152 | ||
| 20 × Overhead squats (115 lbs/80 lbs) | ||||||||||||||||
| 100 × Double-unders | ||||||||||||||||
| 12 × Ring muscle-ups | ||||||||||||||||
| 100 × Double-unders | ||||||||||||||||
| 20 × Dumbbell snatches (50 lbs/35 lbs) | ||||||||||||||||
| 100 × Double-unders | ||||||||||||||||
| 12 × Bar muscle-ups | ||||||||||||||||
| 18.4 TTC → repetitions | 9 min time limit | Complete 21-15-9 repetitions: | W | 164 | 136 | 119 | 111 | 103 | 96 | 89 | 83 | 70 | 65 | 60 | 58 | 48 |
| Deadlifts (225 lbs/155 lbs) | M | 155 | 131 | 118 | 109 | 101 | 96 | 90 | 85 | 72 | 66 | 61 | 59 | 50 | ||
| Handstand push-ups | ||||||||||||||||
| Then, complete 21-15-9 repetitions: | ||||||||||||||||
| Deadlifts (315 lbs/205 lbs) | ||||||||||||||||
| Handstand walk (50′) | ||||||||||||||||
| 18.5 repetitions | 7 min AMRAP | 3 × Thrusters (100 lbs/65 lbs) | W | 160 | 137 | 123 | 111 | 104 | 97 | 90 | 85 | 81 | 77 | 67 | 56 | 33 |
| 3 × Chest-to-bar pull-ups | M | 157 | 137 | 126 | 114 | 106 | 101 | 96 | 90 | 86 | 81 | 74 | 69 | 60 | ||
| *Add 3 repetitions after each set | ||||||||||||||||
| Programming | Percentile Rank | |||||||||||||||
|---|---|---|---|---|---|---|---|---|---|---|---|---|---|---|---|---|
| Workout | Duration | Prescription | Sex | 99 | 95 | 90 | 80 | 70 | 60 | 50 | 40 | 30 | 20 | 10 | 5 | 1 |
| 19.1 repetitions | 15 min AMRAP | 19 × Wall ball shots (20 lbs/14 lbs to 10′/9′ target) | W | 309 | 287 | 273 | 258 | 248 | 239 | 229 | 222 | 213 | 204 | 190 | 177 | 154 |
| 19-calorie Rowing | M | 354 | 327 | 313 | 295 | 284 | 270 | 261 | 249 | 240 | 228 | 210 | 198 | 171 | ||
| 19.2 TTC → repetitions | 4 min rounds (20 min time limit) | 25 × Toes-to-bar | W | 424 | 339 | 259 | 253 | 175 | 171 | 167 | 165 | 137 | 111 | 101 | 93 | 82 |
| 50 × Double-unders | M | 345 | 263 | 258 | 253 | 174 | 171 | 168 | 166 | 156 | 115 | 101 | 90 | 81 | ||
| Squat cleans: 15 × (135 lbs/85 lbs) → 13 × (185 lbs/115 lbs) → 11 × (225 lbs/145 lbs) → 9 × (275 lbs/175 lbs) 7 × (315 lbs/205 lbs) | ||||||||||||||||
| * Add 4 min for each set | ||||||||||||||||
| 19.3 TTC → repetitions | 10 min time limit | 200 ft Dumbbell overhead lunge (50 lbs/35 lbs) | W | 159 | 134 | 120 | 107 | 98 | 93 | 90 | 90 | 90 | 90 | 90 | 87 | 59 |
| 50 × Dumbbell box step-ups (50 lbs/35 lbs onto 24”/20” box) | M | 161 | 140 | 129 | 118 | 111 | 105 | 100 | 96 | 92 | 90 | 86 | 72 | 52 | ||
| 50 × Strict handstand push-ups | ||||||||||||||||
| 200 ft Handstand walking | ||||||||||||||||
| 19.4 TTC → repetitions | 12 min time limit | Complete 3 sets: | W | 11:26 | 115 | 110 | 93 | 88 | 72 | 67 | 66 | 66 | 66 | 66 | 66 | 66 |
| 10 × Snatches (95 lbs/65 lbs) | M | 10:24 | 11:44 | 121 | 113 | 110 | 97 | 93 | 90 | 76 | 70 | 66 | 66 | 66 | ||
| 12 × Bar-facing burpees | ||||||||||||||||
| Then, rest 3 min before completing 3 sets: | ||||||||||||||||
| 10 × Bar muscle-ups | ||||||||||||||||
| 12 × Bar-facing burpees | ||||||||||||||||
| 19.5 TTC → repetitions | 20 min time limit | Complete 33 → 27 → 21 → 15 → 9 repetitions: | W | 11:28 | 15:09 | 17:14 | 19:46 | 190 | 179 | 163 | 152 | 143 | 126 | 107 | 98 | 83 |
| Thrusters (95 lbs/65 lbs) | M | 11:07 | 14:12 | 16:14 | 18:47 | 203 | 187 | 177 | 165 | 153 | 142 | 127 | 113 | 89 | ||
| Chest-to-bar pull-ups | ||||||||||||||||
| 20.1 TTC → repetitions | 15 min time limit | Complete 10 sets: | W | 10:16 | 11:50 | 12:44 | 13:49 | 14:33 | 178 | 168 | 162 | 154 | 147 | 136 | 128 | 113 |
| 8 × Ground-to-overheads (95 lbs/65 lbs) | M | 10:27 | 12:09 | 13:06 | 14:11 | 14:50 | 170 | 164 | 157 | 149 | 144 | 131 | 126 | 109 | ||
| 10 × Bar-facing burpees | ||||||||||||||||
| 20.2 repetitions | 20 min AMRAP | 4 × Dumbbell thrusters (50 lbs/35 lbs) | W | 851 | 740 | 684 | 616 | 577 | 538 | 510 | 476 | 442 | 393 | 340 | 280 | 194 |
| 6 × Toes-to-bar | M | 855 | 751 | 691 | 636 | 586 | 549 | 515 | 481 | 446 | 408 | 341 | 281 | 198 | ||
| 24 × Double-unders | ||||||||||||||||
| 20.3 TTC → repetitions | 9 min time limit | Complete 21-15-9 repetitions: | W | 8:39 | 139 | 124 | 112 | 105 | 97 | 90 | 84 | 70 | 65 | 60 | 57 | 47 |
| Deadlifts (225 lbs/155 lbs) | M | 163 | 134 | 122 | 111 | 103 | 97 | 92 | 87 | 80 | 67 | 61 | 58 | 50 | ||
| Handstand push-ups | ||||||||||||||||
| Then, complete 21-15-9 repetitions: | ||||||||||||||||
| Deadlifts (315 lbs/205 lbs) | ||||||||||||||||
| Handstand walk (50′) | ||||||||||||||||
| 20.4 TTC → repetitions | 20 min time limit | Alternate the following: | W | 17:55 | 235 | 235 | 201 | 200 | 200 | 169 | 163 | 160 | 160 | 160 | 130 | 120 |
| 30 × Box jumps (24”/20”) | M | 237 | 215 | 201 | 200 | 177 | 166 | 162 | 160 | 160 | 151 | 127 | 121 | 120 | ||
| Clean and jerks: 15 × (95 lbs/65 lbs) → 15 × (135 lbs/85 lbs) → 10 × (185 lbs/115 lbs.) | ||||||||||||||||
| Then, alternate the following: | ||||||||||||||||
| 30 × Single-leg squats | ||||||||||||||||
| Clean and jerks: 10 × (225 lbs/145 lbs) → 5 × (275 lbs/175 lbs) → 5 × (315 lbs/205 lbs.) | ||||||||||||||||
| 20.5 TTC → repetitions | 20 min time limit | Partition in any way: | W | 15:16 | 19:50 | 230 | 217 | 209 | 178 | 168 | 162 | 154 | 147 | 136 | 128 | 113 |
| 40 × Ring muscle-ups | M | 12:27 | 14:09 | 16:06 | 18:11 | 237 | 170 | 164 | 157 | 149 | 144 | 131 | 126 | 109 | ||
| 80-calorie Rowing | ||||||||||||||||
| 120 × Wall ball shots (20 lbs/14 lbs to 10′/9′ target) | ||||||||||||||||
| Programming | Percentile Rank | |||||||||||||||
|---|---|---|---|---|---|---|---|---|---|---|---|---|---|---|---|---|
| Workout | Duration | Prescription | Sex | 99 | 95 | 90 | 80 | 70 | 60 | 50 | 40 | 30 | 20 | 10 | 5 | 1 |
| 21.1 TTC → repetitions | 15 min time limit | Alternate the following: | W | 588 | 395 | 387 | 379 | 355 | 283 | 222 | 217 | 213 | 182 | 115 | 110 | 44 |
| Wall walks × 1 → 3 → 6 → 9 → 15 → 21 repetitions | M | 14:16 | 505 | 415 | 389 | 384 | 381 | 378 | 374 | 332 | 277 | 221 | 217 | 210 | ||
| Double-unders × 10 → 30 → 60 → 90 → 150 → 210 repetitions | ||||||||||||||||
| 21.2 TTC → repetitions | 20 min time limit | Alternate the following: | W | 11:14 | 12:51 | 13:52 | 15:15 | 16:26 | 17:32 | 18:35 | 19:36 | 217 | 201 | 177 | 160 | 131 |
| Dumbbell snatches (50 lbs/35 lbs): × 10 → 20 → 30 → 40 → 50 repetitions | M | 10:47 | 11:57 | 12:44 | 13:47 | 14:35 | 15:18 | 15:59 | 16:41 | 17:26 | 18:18 | 19:21 | 19:59 | 205 | ||
| 15 × Burpee box jump-overs (24”/20”) | ||||||||||||||||
| 21.3 TTC → repetitions | 15 min time limit | 15 × Front squats (95 lbs/65 lbs) | W | 11:14 | 12:51 | 158 | 146 | 139 | 135 | 135 | 135 | 120 | 95 | 77 | 75 | 75 |
| 30 × Toes-to-bar | M | 10:47 | 11:57 | 12:44 | 13:47 | 166 | 159 | 155 | 151 | 147 | 143 | 139 | 136 | 135 | ||
| 15 × Thrusters (95 lbs/65 lbs) | ||||||||||||||||
| Rest 1 min, then: | ||||||||||||||||
| 15 × Front squats (95 lbs/65 lbs) | ||||||||||||||||
| 30 × Chest-to-bar pull-ups | ||||||||||||||||
| 15 × Thrusters (95 lbs/65 lbs) | ||||||||||||||||
| Rest 1 min, then: | ||||||||||||||||
| 15 × Front squats (95 lbs/65 lbs) | ||||||||||||||||
| 30 × Bar muscle-ups | ||||||||||||||||
| 15 × Thrusters (95 lbs/65 lbs) | ||||||||||||||||
| 21.4 lbs (kg) | 7 min time limit | After 15 min time limit: | W | 197 (89.4) | 176 (79.8) | 165 (74.8) | 154 (69.9) | 145 (65.8) | 135 (61.2) | 130 (59) | 125 (56.7) | 117 (53.1) | 110 (49.9) | 101 (45.8) | 95 (43.1) | 85 (38.6) |
| 1-RM Complex of Deadlift → Clean → Hang clean → Jerk | M | 292 (132.4) | 267 (121.1) | 255 (115.7) | 238 (108) | 227 (103) | 220 (99.8) | 211 (95.7) | 205 (93) | 198 (89.8) | 187 (84.8) | 177 (80.3) | 167 (75.7) | 154 (69.9) | ||
| 22.1 repetitions | 15 min AMRAP | 3 × Wall walks | W | 317 | 283 | 270 | 242 | 228 | 212 | 202 | 184 | 179 | 154 | 138 | 121 | 80 |
| 12 × Dumbbell snatches (50 lbs/35 lbs) | M | 316 | 289 | 272 | 248 | 240 | 219 | 211 | 196 | 182 | 167 | 150 | 125 | 92 | ||
| 15 × Box jump-overs (24”/20”) | ||||||||||||||||
| 22.2 TTC → repetitions | 10 min time limit | 1 → 2 → 3 → 4 → 5 → 6 → 7 → 8 → 9 → 10 → 9 → 8 → 7 → 6 → 5 → 4 → 3 → 2 → 1 repetitions of: | W | 9:10 | 180 | 169 | 157 | 147 | 139 | 132 | 125 | 117 | 110 | 95 | 83 | 57 |
| Deadlifts (225 lbs/155 lbs) | M | 9:36 | 183 | 171 | 158 | 149 | 141 | 133 | 126 | 117 | 111 | 96 | 89 | 62 | ||
| Bar-facing burpees | ||||||||||||||||
| 22.3 TTC → repetitions | 12 min time limit | 21 × Pull-ups | W | 6:10 | 9:34 | 11.2 | 169 | 161 | 156 | 156 | 156 | 154 | 132 | 89 | 84 | 84 |
| 42 × Double-unders | M | 6:36 | 8:23 | 9:39 | 11.55 | 208 | 183 | 165 | 160 | 156 | 156 | 142 | 113 | 86 | ||
| 21 × Thrusters (95 lbs/65 lbs) | ||||||||||||||||
| 18 × Chest-to-bar pull-ups | ||||||||||||||||
| 36 × Double-unders | ||||||||||||||||
| 18 × Thrusters (115 lbs/75 lbs) | ||||||||||||||||
| 15 × Bar muscle-ups | ||||||||||||||||
| 30 × Double-unders | ||||||||||||||||
| 15 × Thrusters (135 lbs/85 lbs) | ||||||||||||||||
Disclaimer/Publisher’s Note: The statements, opinions and data contained in all publications are solely those of the individual author(s) and contributor(s) and not of MDPI and/or the editor(s). MDPI and/or the editor(s) disclaim responsibility for any injury to people or property resulting from any ideas, methods, instructions or products referred to in the content. |
© 2023 by the authors. Licensee MDPI, Basel, Switzerland. This article is an open access article distributed under the terms and conditions of the Creative Commons Attribution (CC BY) license (https://creativecommons.org/licenses/by/4.0/).
Share and Cite
Mangine, G.T.; Grundlingh, N.; Feito, Y. Normative Scores for CrossFit® Open Workouts: 2011–2022. Sports 2023, 11, 24. https://doi.org/10.3390/sports11020024
Mangine GT, Grundlingh N, Feito Y. Normative Scores for CrossFit® Open Workouts: 2011–2022. Sports. 2023; 11(2):24. https://doi.org/10.3390/sports11020024
Chicago/Turabian StyleMangine, Gerald T., Nina Grundlingh, and Yuri Feito. 2023. "Normative Scores for CrossFit® Open Workouts: 2011–2022" Sports 11, no. 2: 24. https://doi.org/10.3390/sports11020024