
Quadriceps Muscle Morphology Is an Important Determinant of Maximal Isometric and Crank Torques of Cyclists

 ,
,  , and
, and
Abstract
:1. Introduction
2. Materials and Methods
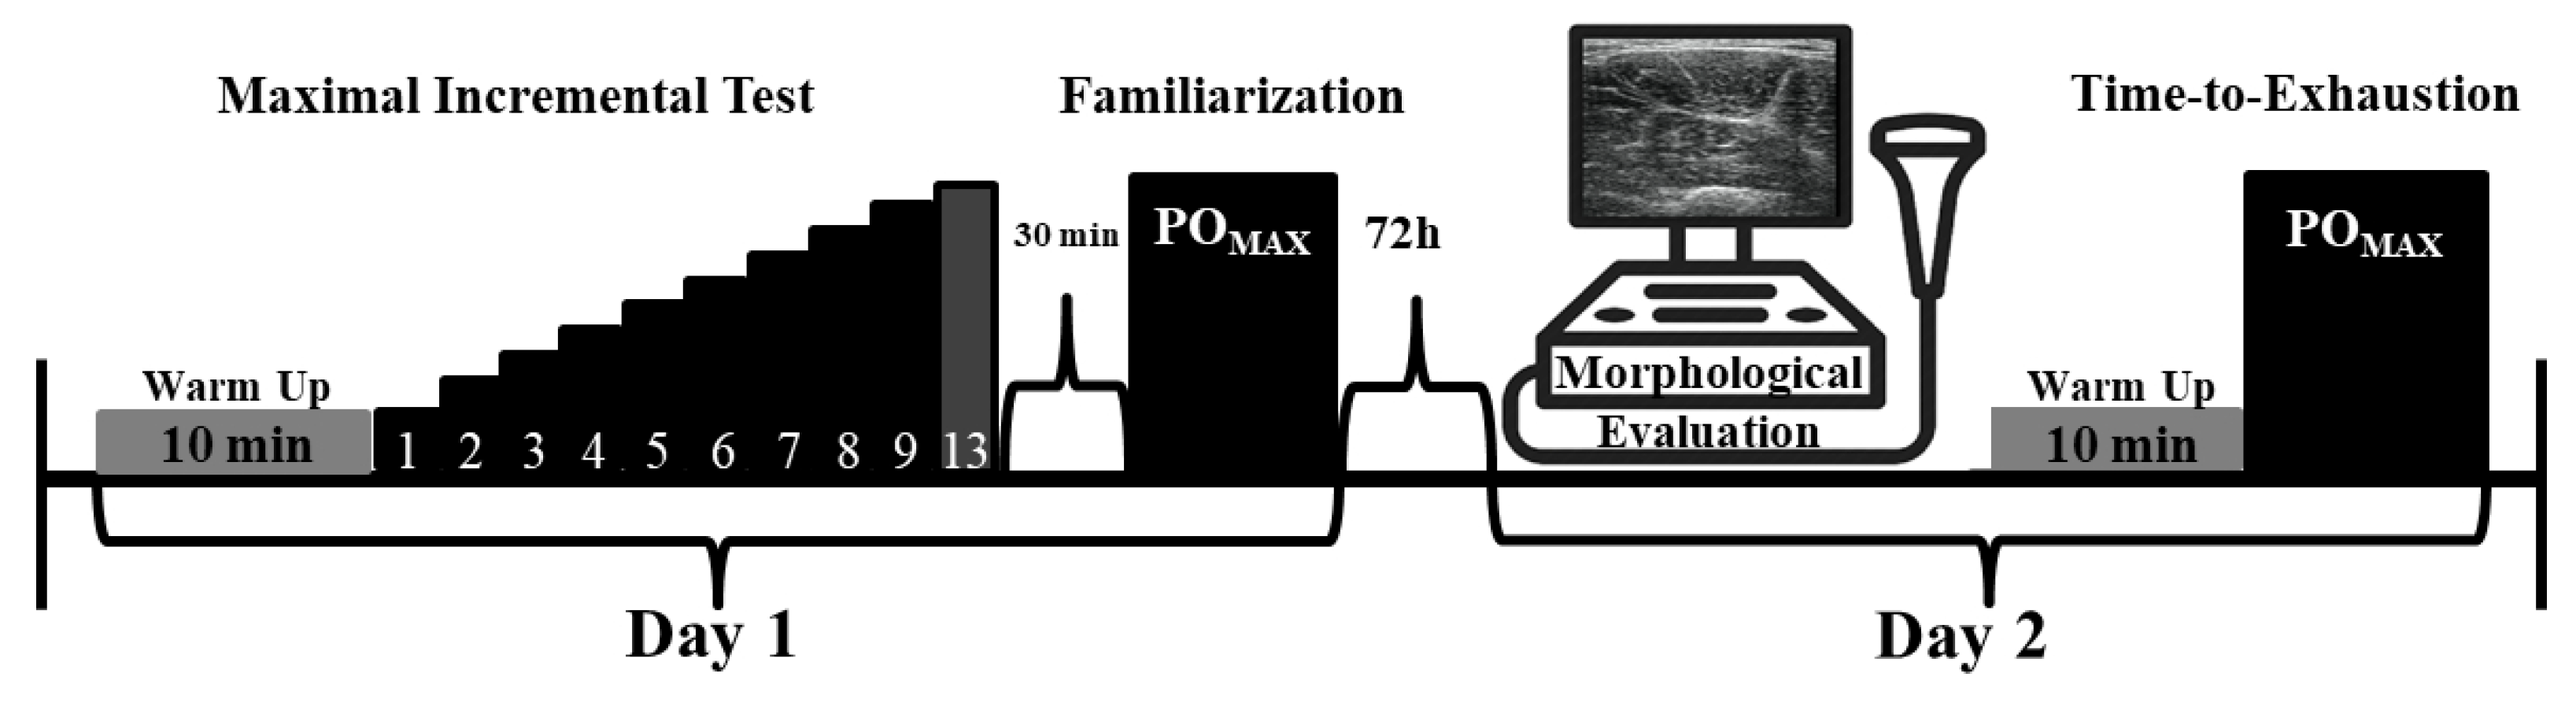
2.1. Experimental Approach
2.2. Participants
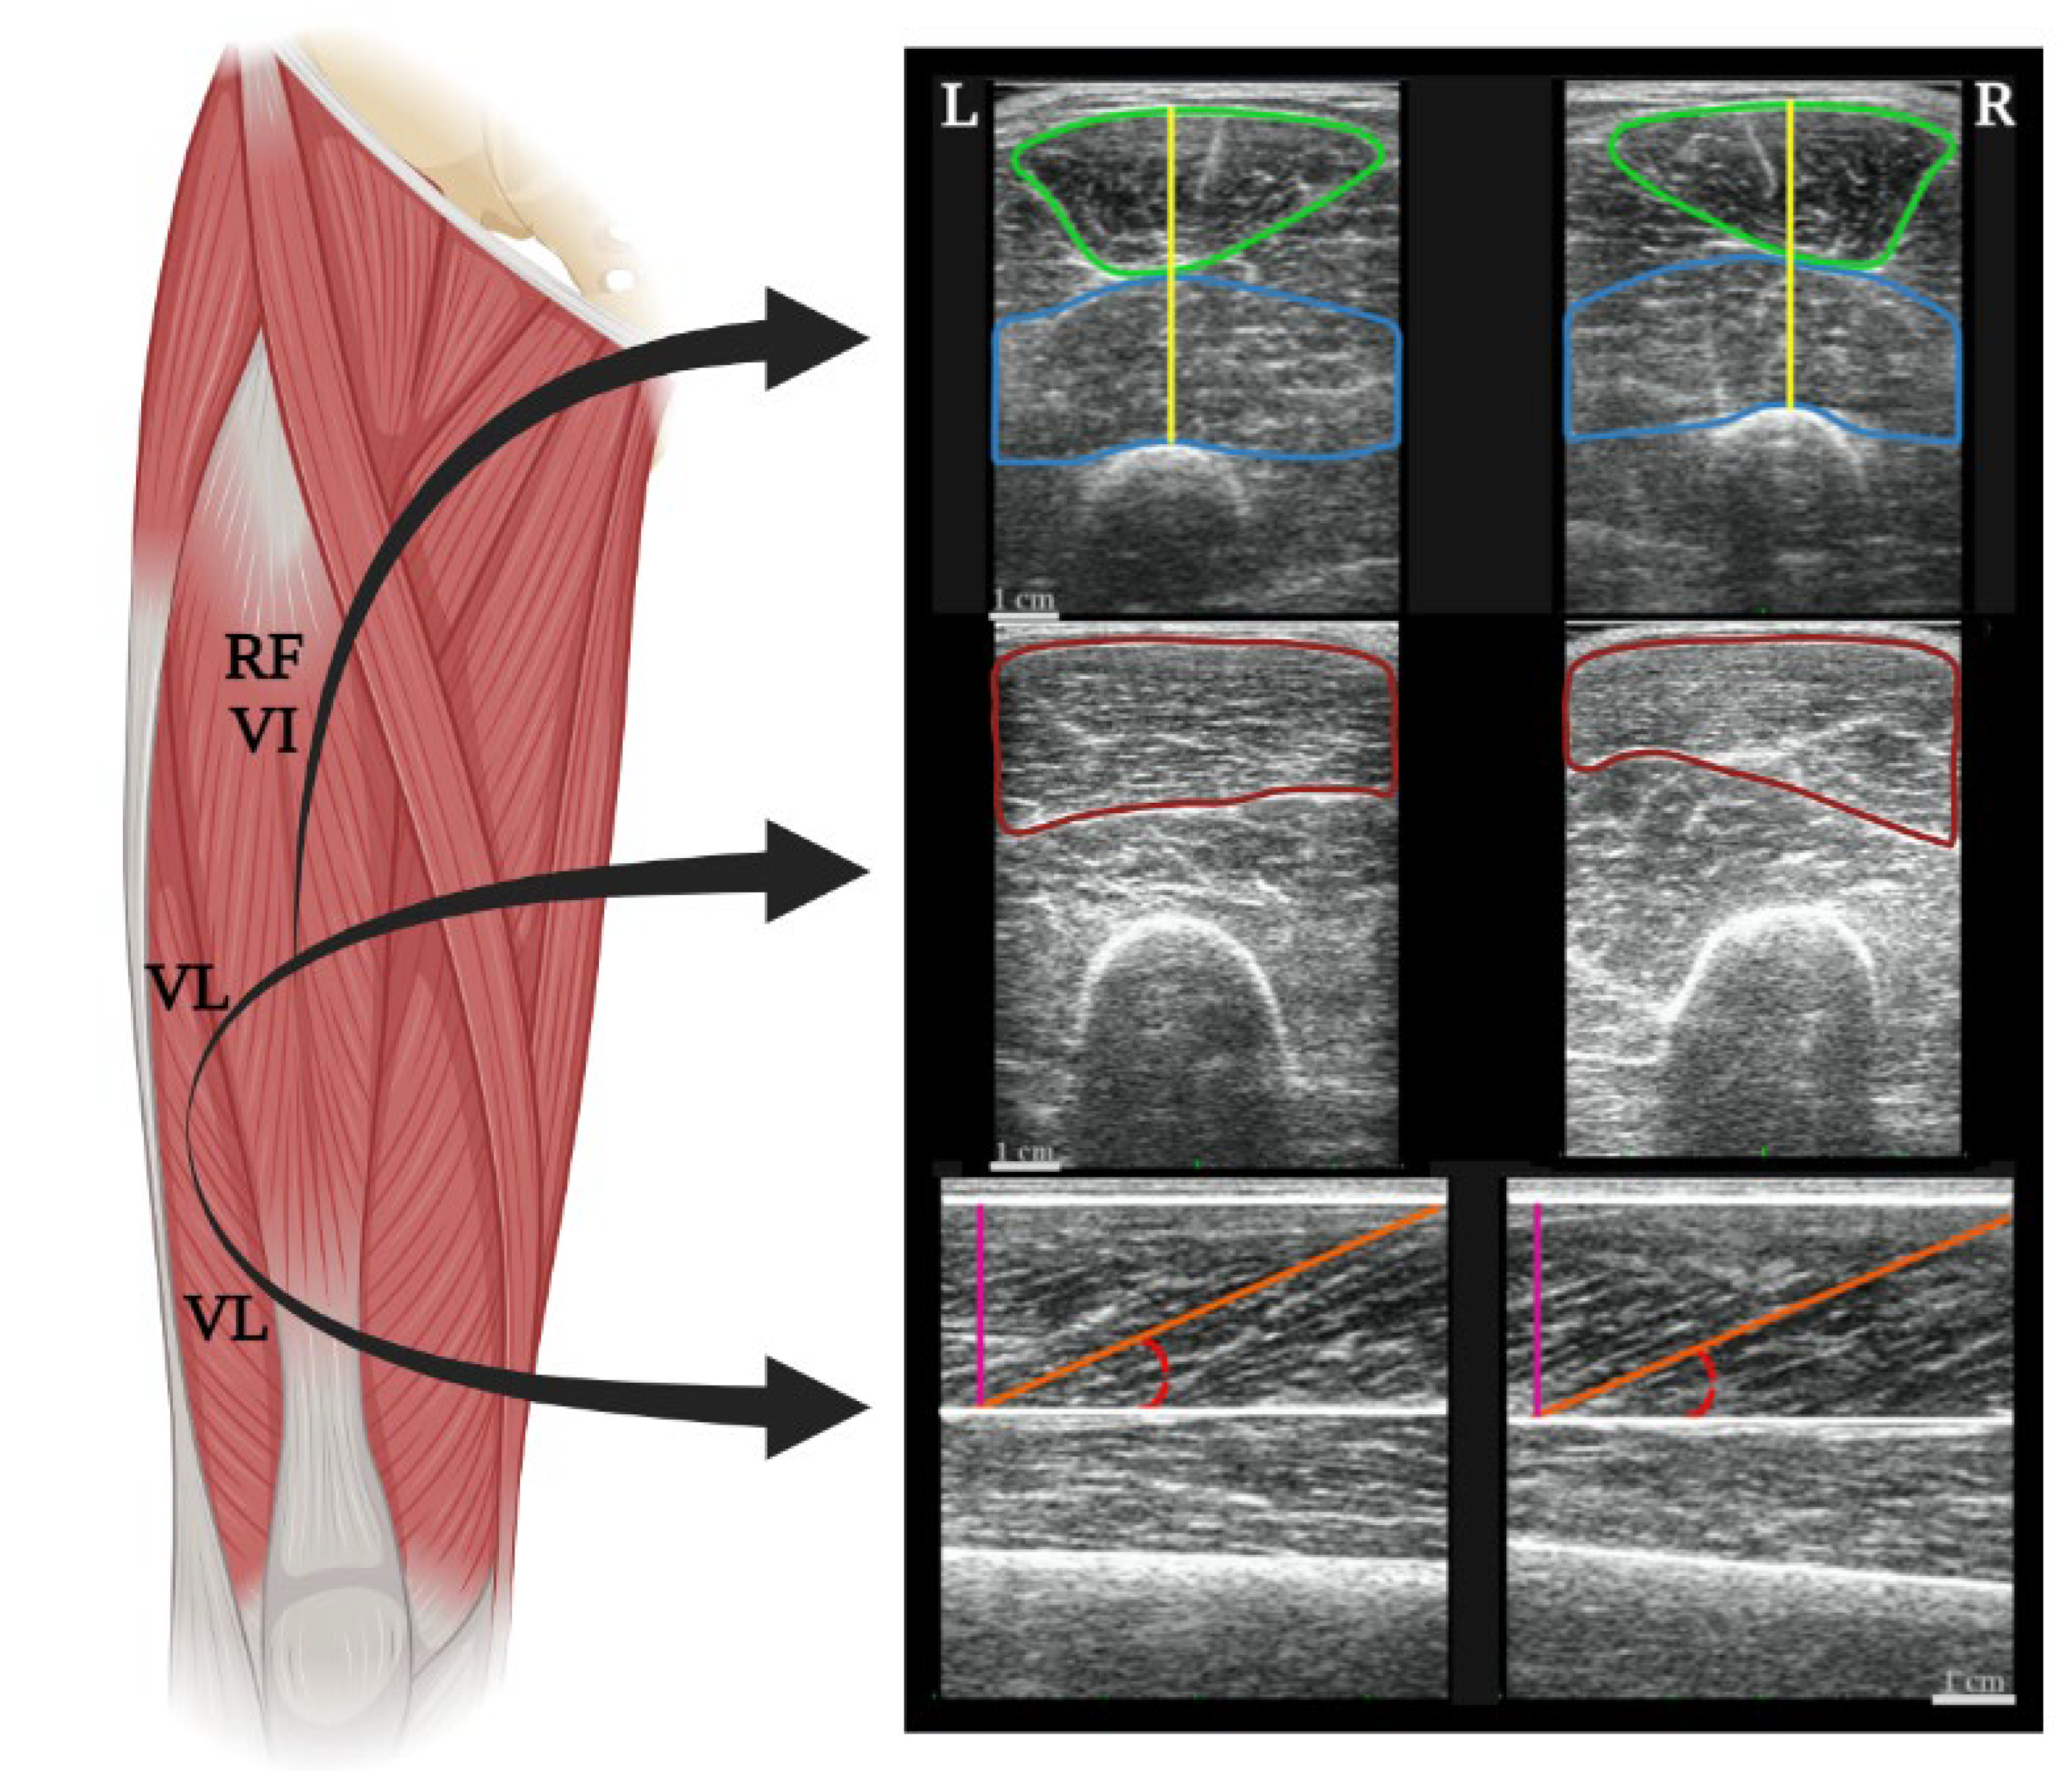
2.3. Procedures
2.4. Statistical Analysis
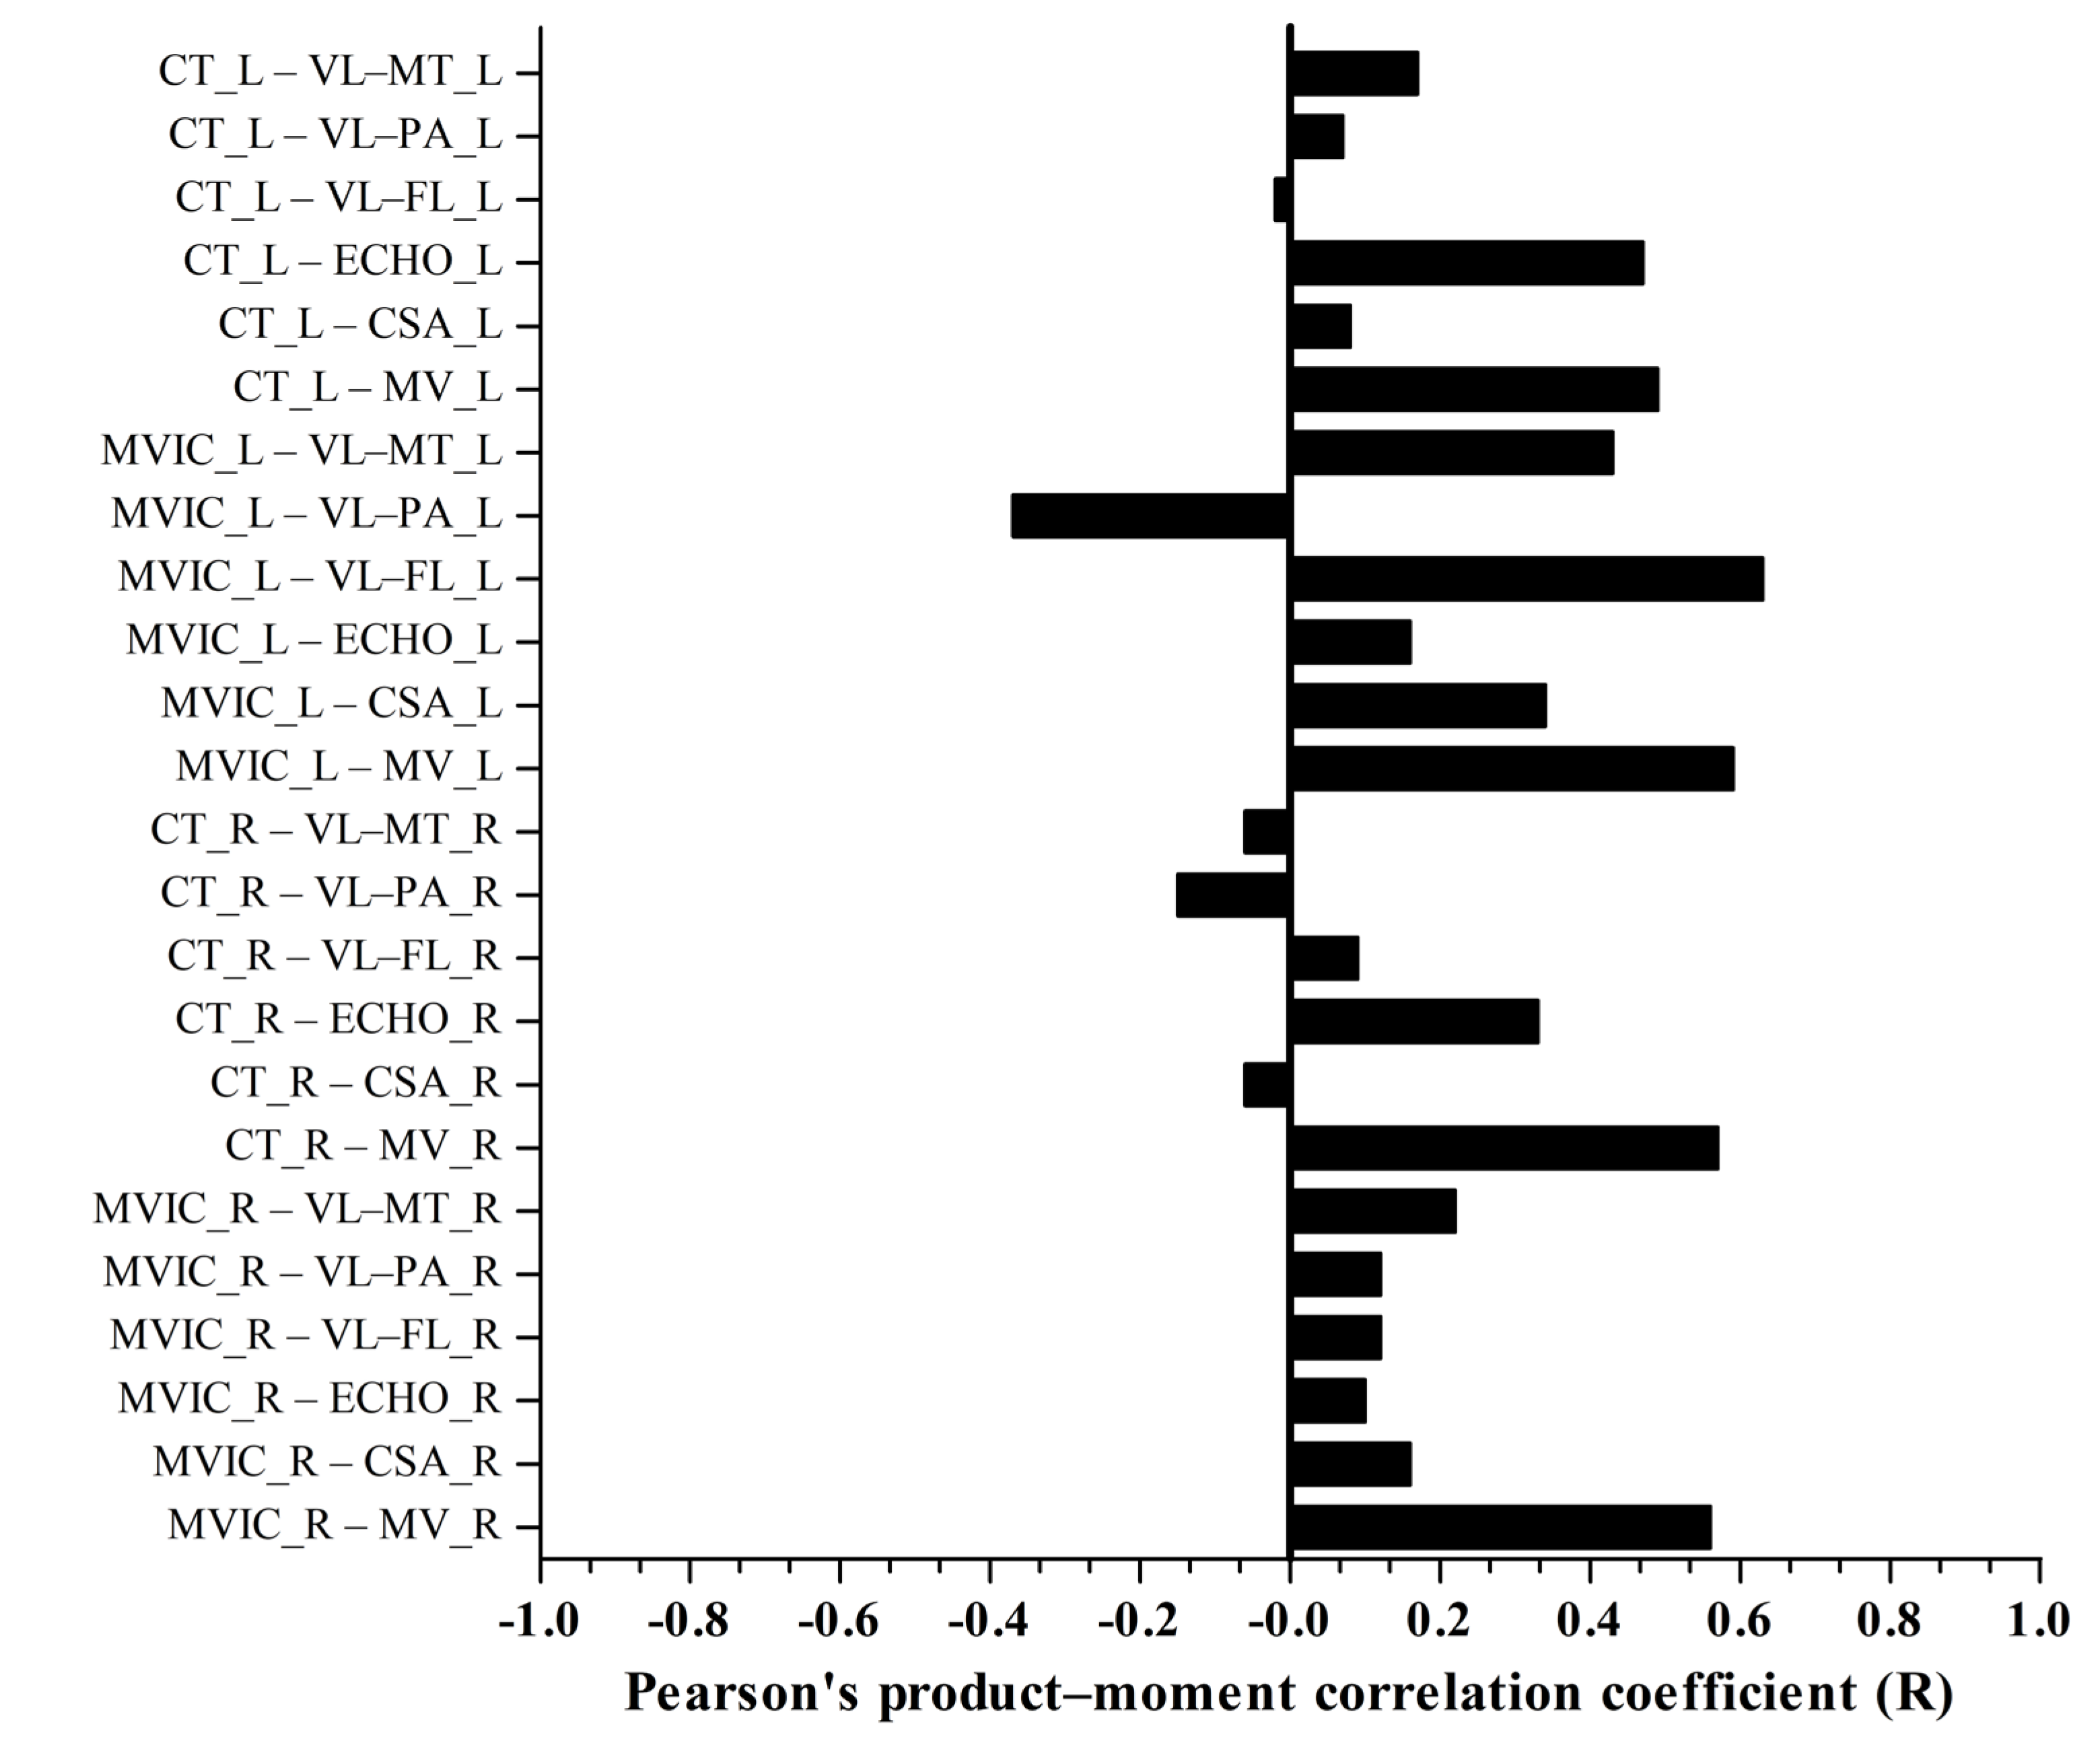
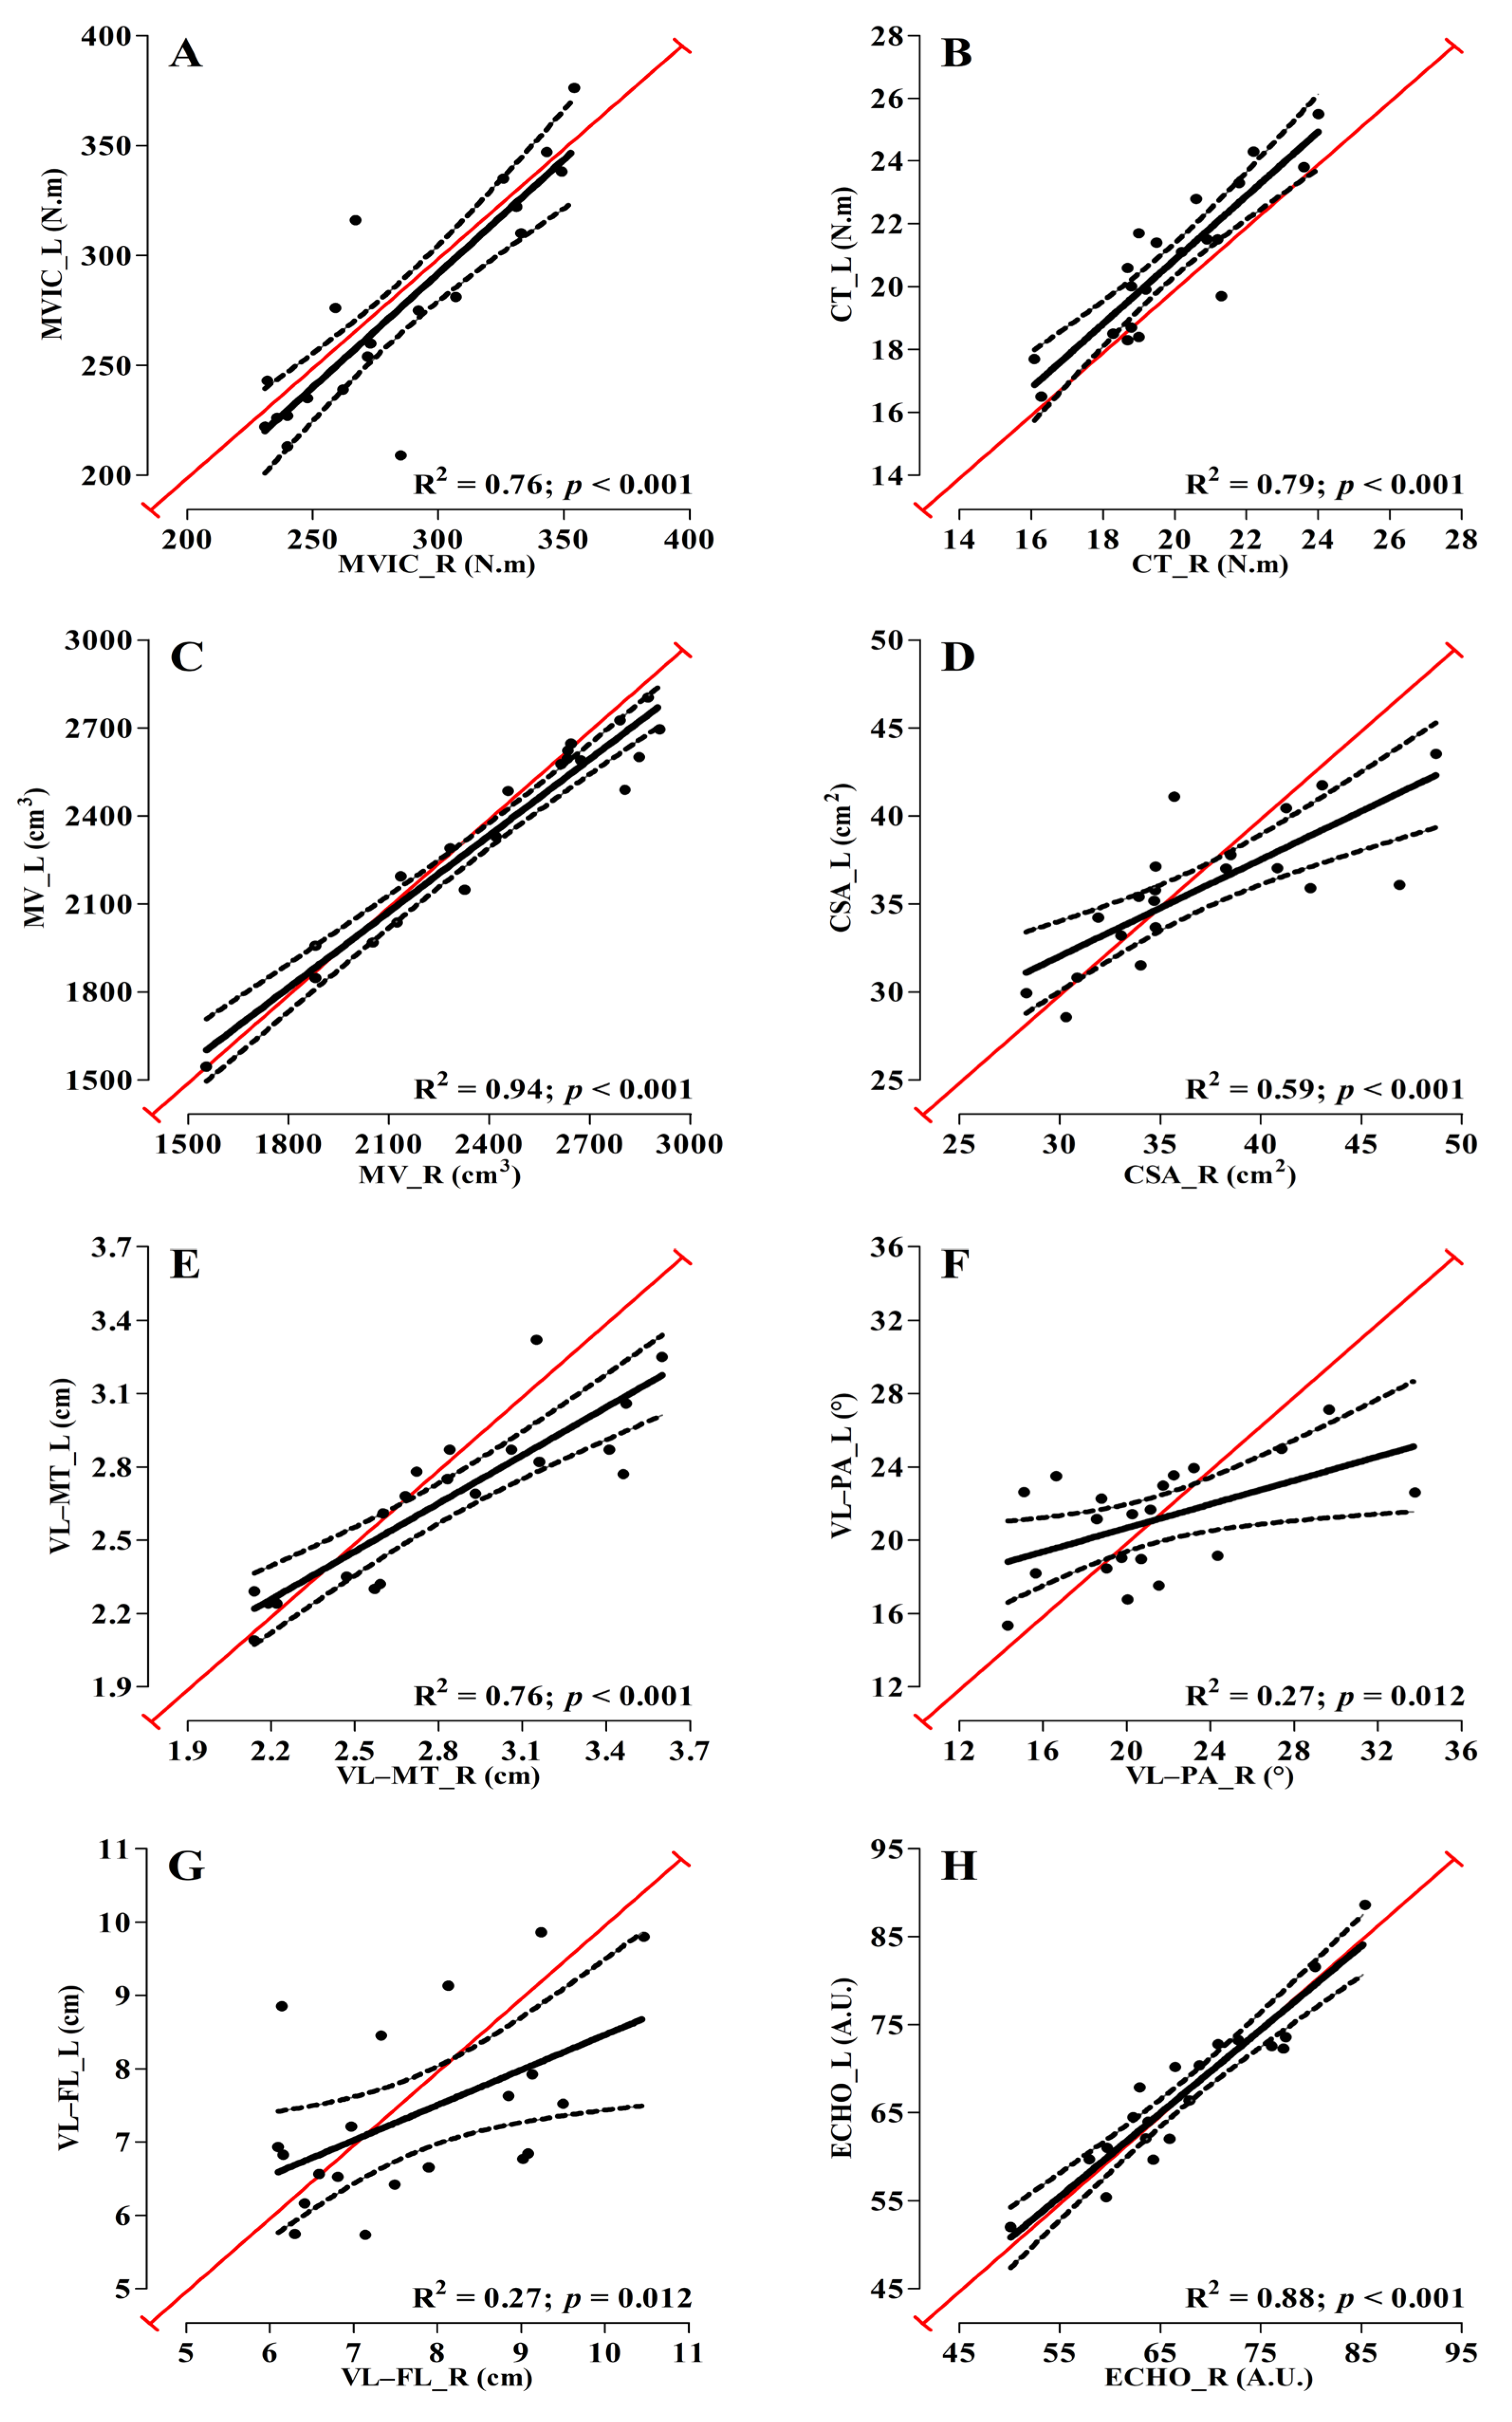
3. Results
4. Discussion
Practical Application
5. Conclusions
Supplementary Materials
Author Contributions
Funding
Institutional Review Board Statement
Informed Consent Statement
Data Availability Statement
Acknowledgments
Conflicts of Interest
References
- Joyner, M.J.; Coyle, E.F. Endurance exercise performance: The physiology of champions. J. Physiol. 2008, 586, 35–44. [Google Scholar] [CrossRef] [PubMed]
- van der Zwaard, S.; Brocherie, F.; Jaspers, R.T. Under the Hood: Skeletal Muscle Determinants of Endurance Performance. Front. Sport. Act. Living 2021, 3, 719434. [Google Scholar] [CrossRef] [PubMed]
- Jacobs, R.A.; Rasmussen, P.; Siebenmann, C.; Díaz, V.; Gassmann, M.; Pesta, D.; Gnaiger, E.; Nordsborg, N.B.; Robach, P.; Lundby, C. Determinants of time trial performance and maximal incremental exercise in highly trained endurance athletes. J. Appl. Physiol. 2011, 111, 1422–1430. [Google Scholar] [CrossRef] [Green Version]
- Bassett, D.R., Jr.; Howley, E.T. Limiting factors for maximum oxygen uptake and determinants of endurance performance. Med. Sci. Sport. Exerc. 2000, 32, 70–84. [Google Scholar] [CrossRef] [PubMed]
- Bossi, A.H.; Lima, P.; Lima, J.P.; Hopker, J. Laboratory predictors of uphill cycling performance in trained cyclists. J. Sport. Sci. 2017, 35, 1364–1371. [Google Scholar] [CrossRef] [PubMed]
- Garcia-Garcia, O.; Cuba-Dorado, A.; Fernandez-Redondo, D.; Lopez-Chicharro, J. Neuromuscular Parameters Predict the Performance in an Incremental Cycling Test. Int. J. Sport. Med. 2018, 39, 909–915. [Google Scholar] [CrossRef]
- Miller, F.R.; Manfredi, T.G. Physiological and Anthropometrical Predictors of 15-Kilometer Time Trial Cycling Performance Time. Res. Q. Exerc. Sport. 1987, 58, 250–254. [Google Scholar] [CrossRef]
- van der Zwaard, S.; van der Laarse, W.J.; Weide, G.; Bloemers, F.W.; Hofmijster, M.J.; Levels, K.; Noordhof, D.A.; de Koning, J.J.; de Ruiter, C.J.; Jaspers, R.T. Critical determinants of combined sprint and endurance performance: An integrative analysis from muscle fiber to the human body. FASEB J. 2018, 32, 2110–2123. [Google Scholar] [CrossRef] [Green Version]
- Batterson, P.M.; Norton, M.R.; Hetz, S.E.; Rohilla, S.; Lindsay, K.G.; Subudhi, A.W.; Jacobs, R.A. Improving biologic predictors of cycling endurance performance with near-infrared spectroscopy derived measures of skeletal muscle respiration: E pluribus unum. Physiol. Rep. 2020, 8, e14342. [Google Scholar] [CrossRef]
- Lanferdini, F.J.; Bini, R.R.; Santos-Cunha, G.; Lopes, A.L.; Castro, F.A.S.; Reischak-Oliveira, A.; Vaz, M.A. Relationship between physiological and biomechanical variables with aerobic power output in cycling. J. Sci. Cycl. 2014, 3, 9–15. [Google Scholar]
- Coyle, E.F.; Feltner, M.E.; Kautz, S.A.; Hamilton, M.T.; Montain, S.J.; Baylor, A.M.; Abraham, L.D.; Petrek, G.W. Physiological and biomechanical factors associated with elite endurance cycling performance. Med. Sci. Sport. Exerc. 1991, 23, 93–107. [Google Scholar] [CrossRef]
- Borszcz, F.K.; Tramontin, A.F.; de Souza, K.M.; Carminatti, L.J.; Costa, V.P. Physiological Correlations with Short, Medium, and Long Cycling Time-Trial Performance. Res. Q. Exerc. Sport. 2018, 89, 120–125. [Google Scholar] [CrossRef]
- Sorensen, A.; Aune, T.K.; Rangul, V.; Dalen, T. The Validity of Functional Threshold Power and Maximal Oxygen Uptake for Cycling Performance in Moderately Trained Cyclists. Sports 2019, 7, 217. [Google Scholar] [CrossRef] [PubMed] [Green Version]
- Bini, R.R.; Carpes, F.P.; Diefenthaeler, F.; Mota, C.B.; Guimaraes, A.C.S. Physiological and electromyographic responses during 40-km cycling time trial: Relationship to muscle coordination and performance. J. Sci. Med. Sport. 2008, 11, 363–370. [Google Scholar] [CrossRef] [PubMed]
- Kordi, M.; Folland, J.; Goodall, S.; Haralabidis, N.; Maden-Wilkinson, T.; Sarika Patel, T.; Leeder, J.; Barratt, P.; Howatson, G. Mechanical and morphological determinants of peak power output in elite cyclists. Scan. J. Med. Sci. Sport. 2020, 30, 227–237. [Google Scholar]
- Blazevich, A.J.; Coleman, D.R.; Horne, S.; Cannavan, D. Anatomical predictors of maximum isometric and concentric knee extensor moment. Eur. J. Appl. Physiol. 2009, 105, 869–878. [Google Scholar] [CrossRef]
- O’Brien, T.D.; Reeves, N.D.; Baltzopoulos, V.; Jones, D.A.; Maganaris, C.N. Strong relationships exist between muscle volume, joint power and whole-body external mechanical power in adults and children. Exp. Physiol. 2009, 94, 731–738. [Google Scholar] [CrossRef]
- Cadore, E.L.; Izquierdo, M.; Conceição, M.; Radaelli, R.; Pinto, R.S.; Baroni, B.M.; Vaz, M.A.; Alberton, C.L.; Pinto, S.S.; Cunha, G.; et al. Echo intensity is associated with skeletal muscle power and cardiovascular performance in elderly men. Exp. Gerontol. 2012, 47, 473–478. [Google Scholar] [CrossRef]
- Akagi, R.; Suzuki, M.; Kawaguchi, E.; Miyamoto, N.; Yamada, Y.; Ema, R. Muscle size-strength relationship including ultrasonographic echo intensity and voluntary activation level of a muscle group. Arch. Gerontol. Geriatr. 2018, 75, 185–190. [Google Scholar] [CrossRef]
- Song, J.S.; Abe, T.; Bell, Z.W.; Wong, V.; Spitz, R.W.; Yamada, Y.; Loenneke, J.P. The relationship between muscle size and strength does not depend on echo intensity in healthy young adults. J. Clin. Densitom. 2021, 24, 406–413. [Google Scholar] [CrossRef]
- Cooper, A.N.; McDermott, W.J.; Martin, J.C.; Dulaney, S.O.; Carrier, D.R. Great power comes at a high (locomotor) cost: The role of muscle fascicle length in the power versus economy performance trade-off. J. Exp. Biol. 2021, 224, jeb236679. [Google Scholar] [CrossRef] [PubMed]
- De Pauw, K.; Roelands, B.; Cheung, S.S.; de Geus, B.; Rietjens, G.; Meeusen, R. Guidelines to classify subject groups in sport-science research. Int. J. Sport. Physiol. Perform. 2013, 8, 111–122. [Google Scholar] [CrossRef] [PubMed]
- Marfell-Jones, M.J.; Stewart, A.D.; de Ridder, J.H. International Standards for Anthropometric Assessment; ISAK: Wellington, New Zealand, 2012. [Google Scholar]
- Davison, R.C.R.; Corbett, J.; Ansley, L. Influence of temperature and protocol on the calibration of the Computrainer electromagnetically-braked cycling ergometer. Int. Sport. Med. J. 2009, 10, 66–76. [Google Scholar]
- Miyatani, M.; Kanehisa, H.; Ito, M.; Kawakami, Y.; Fukunaga, T. The accuracy of volume estimates using ultrasound muscle thickness measurements in different muscle groups. Eur. J. Appl. Physiol. 2004, 91, 264–272. [Google Scholar] [PubMed]
- Caresio, C.; Molinari, F.; Emanuel, G.; Minetto, M.A. Muscle echo intensity: Reliability and conditioning factors. Clin. Physiol. Funct. Imaging 2015, 35, 393–403. [Google Scholar] [CrossRef] [PubMed]
- Lanferdini, F.J.; Manganelli, B.F.; Lopez, P.; Klein, K.D.; Cadore, E.L.; Vaz, M.A. Echo intensity reliability for the analysis of different muscle areas in athletes. J. Strength Cond. Res. 2019, 33, 3353–3360. [Google Scholar] [CrossRef]
- Finni, T.; Komi, P.V. Two methods to estimate tendinous tissue elongation during human movement. J. Appl. Biomech. 2002, 18, 180–188. [Google Scholar] [CrossRef]
- Noorkoiv, M.; Stavnsbo, A.; Aagaard, P.; Blazevich, A.J. In vivo assessment of muscle fascicle length by extended field-of-view ultrasonography. J. Appl. Physiol. 2010, 109, 1974–1979. [Google Scholar] [CrossRef] [Green Version]
- Dormann, C.F.; Elith, J.; Bacher, S.; Buchmann, C.; Carl, G.; Carré, G.C.G.; Marquéz, J.R.G.; Gruber, B.; Lafourcade, B.; Leitão, P.J.; et al. Collinearity: A review of methods to deal with it and a simulation study evaluating their performance. Ecography 2013, 36, 27–46. [Google Scholar] [CrossRef]
- Cohen, J.; Cohen, P.; Wes, S.G.; Aiken, L.S. Applied Multiple Regression/Correlation Analysis for the Behavioral Sciences, 3rd ed.; Lawrence Earlbaum Associates: Mahwah, NJ, USA, 2002. [Google Scholar]
- Faul, F.; Erdfelder, E.; Buchner, A.; Lang, A.G. Statistical power analyses using G*Power 3.1: Tests for correlation and regression analyses. Behav. Res. Methods 2009, 41, 1149–1160. [Google Scholar] [CrossRef] [Green Version]
- Hopkins, W.G.; Marshall, S.W.; Batterham, A.M.; Hanin, J. Progressive statistics for studies in sports medicine and exercise science. Med. Sci. Sport. Exerc. 2009, 41, 3–13. [Google Scholar] [CrossRef] [PubMed] [Green Version]
- Carpes, F.P.; Mota, C.B.; Faria, I.E. On the bilateral asymmetry during running and cycling—A review considering leg preference. Phys. Ther. Sport. 2010, 11, 136–142. [Google Scholar] [CrossRef] [PubMed]
- Herzog, W.; Guimaraes, A.C.S.; Anton, M.G.; Carter-Erdman, K.A. Moment-length relations of rectus femoris muscles of speed skaters/cyclists and runners. Med. Sci. Sport. Exerc. 1991, 23, 1289–1296. [Google Scholar] [CrossRef]
- Savelberg, H.H.; Meijer, K. Contribution of mono- and biarticular muscles to extending knee joint moments in runners and cyclists. J. Appl. Physiol. 2003, 94, 2241–2248. [Google Scholar] [CrossRef] [Green Version]
- Bobbert, M.F.; Casius, L.J.R.; van der Zwaard, S.; Jaspers, R.T. Effect of vasti morphology on peak sprint cycling power of a human musculoskeletal simulation model. J. Appl. Physiol. 2020, 128, 445–455. [Google Scholar] [CrossRef]
- Elmer, S.J.; Barratt, P.R.; Korff, T.; Martin, J.C. Joint-specific power production during submaximal and maximal cycling. Med. Sci. Sport. Exerc. 2011, 43, 1940–1947. [Google Scholar] [CrossRef] [Green Version]
- Mujika, I.; Ronnestad, B.R.; Martin, D.T. Effects of Increased Muscle Strength and Muscle Mass on Endurance-Cycling Performance. Int. J. Sport. Physiol. Perform. 2016, 11, 283–289. [Google Scholar] [CrossRef]
- Grgic, J.; Schoenfeld, B.J.; Mikulic, P. Effects of plyometric vs. resistance training on skeletal muscle hypertrophy: A review. J. Sport. Health Sci. 2021, 10, 530–536. [Google Scholar] [CrossRef]
- Eng, C.M.; Azizi, E.; Roberts, T.J. Structural Determinants of Muscle Gearing during Dynamic Contractions. Integr. Comp. Biol. 2018, 58, 207–218. [Google Scholar] [CrossRef]
- Narici, M.V.; Hoppeler, H.; Kayser, B.; Landoni, L.; Claassen, H.; Gavardi, C.; Conti, M.; Cerretelli, P. Human quadriceps cross-sectional area, torque and neural activation during 6 months strength training. Acta Physiol. Scand. 1996, 157, 175–186. [Google Scholar] [CrossRef]
- Roberts, T.J.; Eng, C.M.; Sleboda, D.A.; Holt, N.C.; Brainerd, E.L.; Stover, K.K.; Marsh, R.L.; Azizi, E. The Multi-Scale, Three-Dimensional Nature of Skeletal Muscle Contraction. Physiology 2019, 34, 402–408. [Google Scholar] [CrossRef] [PubMed]
- Azizi, E.; Brainerd, E.L.; Roberts, T.J. Variable gearing in pennate muscles. Proc. Natl. Acad. Sci. USA 2008, 105, 1745–1750. [Google Scholar] [CrossRef] [PubMed] [Green Version]
- Wakeling, J.M.; Blake, O.M.; Wong, I.; Rana, M.; Lee, S.S. Movement mechanics as a determinate of muscle structure, recruitment and coordination. Philos. Trans. R. Soc. Lond. B Biol. Sci. 2011, 366, 1554–1564. [Google Scholar] [CrossRef] [PubMed]
- Lieber, R.L.; Friden, J. Functional and clinical significance of skeletal muscle architecture. Muscle Nerve 2000, 23, 1647–1666. [Google Scholar] [CrossRef] [PubMed]
- Monte, A.; Bertucco, M.; Magris, R.; Zamparo, P. Muscle Belly Gearing Positively Affects the Force-Velocity and Power-Velocity Relationships during Explosive Dynamic Contractions. Front. Physiol. 2021, 12, 683931. [Google Scholar] [CrossRef] [PubMed]
- Weide, G.; van der Zwaard, S.; Huijing, P.A.; Jaspers, R.T.; Harlaar, J. 3D Ultrasound Imaging: Fast and Cost-effective Morphometry of Musculoskeletal Tissue. J. Vis. Exp. 2017, 129, 55943. [Google Scholar]
- van der Zwaard, S.; Weide, G.; Levels, K.; Eikelboom, M.R.I.; Noordhof, D.A.; Hofmijster, M.J.; van der Laarse, W.J.; de Koning, J.J.; de Ruiter, C.J.; Jaspers, R.T. Muscle morphology of the vastus lateralis is strongly related to ergometer performance, sprint capacity and endurance capacity in Olympic rowers. J. Sport. Sci. 2018, 36, 2111–2120. [Google Scholar] [CrossRef] [Green Version]
- Coffey, V.G.; Hawley, J.A. Concurrent exercise training: Do opposites distract? J. Physiol. 2017, 595, 2883–2896. [Google Scholar] [CrossRef]


| Dependent Variable | R2 | Indicator | Standardized Coefficients (β) | p-Value | Effect Size | Observed Power |
|---|---|---|---|---|---|---|
| MVIC right | 0.310 | MV right | 0.557 | 0.011 | 0.45 | 0.81 |
| MVIC left | 0.642 | MV left VL-FL left | 0.502 0.553 | 0.003 0.002 | 1.79 | 0.84 |
| CT right | 0.326 | MV right | 0.571 | 0.009 | 0.48 | 0.82 |
| CT left | 0.235 | MV left | 0.485 | 0.030 | 0.31 | 0.81 |
| Variables | Left | Right | Differences (%) | t-test | p-Value |
|---|---|---|---|---|---|
| CSA (cm2) | 35.8 ± 4.0 | 36.9 ± 5.5 | 2.9 ± 9.7 | 1.341 | 0.196 |
| ECHO (A.U.) | 67.5 ± 8.7 | 67.7 ± 8.6 | 0.4 ± 4.7 | 0.304 | 0.765 |
| MV (cm3) | 2357 ± 345 | 2427 ± 385 | 2.8 ± 4.2 | 3.095 | 0.006 |
| VL-MT (cm) | 2.7 ± 0.3 | 2.8 ± 0.5 | 5.5 ± 8.3 | 2.942 | 0.008 |
| VL-PA (°) | 21.0 ± 3.0 | 21.0 ± 4.8 | 1.2 ± 19.2 | 0.161 | 0.874 |
| VL-FL (cm) | 7.4 ± 1.3 | 7.7 ± 1.3 | 6.2 ± 17.1 | 1.267 | 0.220 |
| MVIC (N·m) | 275.2 ± 50.5 | 284.0 ± 42.4 | 4.2 ± 10.1 | 1.594 | 0.127 |
| CT (N·m) | 20.8 ± 2.4 | 19.9 ± 2.1 | −3.8 ± 5.2 | −3.472 | 0.003 |
Disclaimer/Publisher’s Note: The statements, opinions and data contained in all publications are solely those of the individual author(s) and contributor(s) and not of MDPI and/or the editor(s). MDPI and/or the editor(s) disclaim responsibility for any injury to people or property resulting from any ideas, methods, instructions or products referred to in the content. |
© 2023 by the authors. Licensee MDPI, Basel, Switzerland. This article is an open access article distributed under the terms and conditions of the Creative Commons Attribution (CC BY) license (https://creativecommons.org/licenses/by/4.0/).
Share and Cite
Lanferdini, F.J.; Diefenthaeler, F.; Ávila, A.G.; Moro, A.R.P.; van der Zwaard, S.; Vaz, M.A. Quadriceps Muscle Morphology Is an Important Determinant of Maximal Isometric and Crank Torques of Cyclists. Sports 2023, 11, 22. https://doi.org/10.3390/sports11020022
Lanferdini FJ, Diefenthaeler F, Ávila AG, Moro ARP, van der Zwaard S, Vaz MA. Quadriceps Muscle Morphology Is an Important Determinant of Maximal Isometric and Crank Torques of Cyclists. Sports. 2023; 11(2):22. https://doi.org/10.3390/sports11020022
Chicago/Turabian StyleLanferdini, Fábio Juner, Fernando Diefenthaeler, Andressa Germann Ávila, Antônio Renato Pereira Moro, Stephan van der Zwaard, and Marco Aurélio Vaz. 2023. "Quadriceps Muscle Morphology Is an Important Determinant of Maximal Isometric and Crank Torques of Cyclists" Sports 11, no. 2: 22. https://doi.org/10.3390/sports11020022