
Changes in Intra-to-Extra-Cellular Water Ratio and Bioelectrical Parameters from Day-Before to Day-Of Competition in Bodybuilders: A Pilot Study

 ,
, 
 ,
,  ,
,  and
and 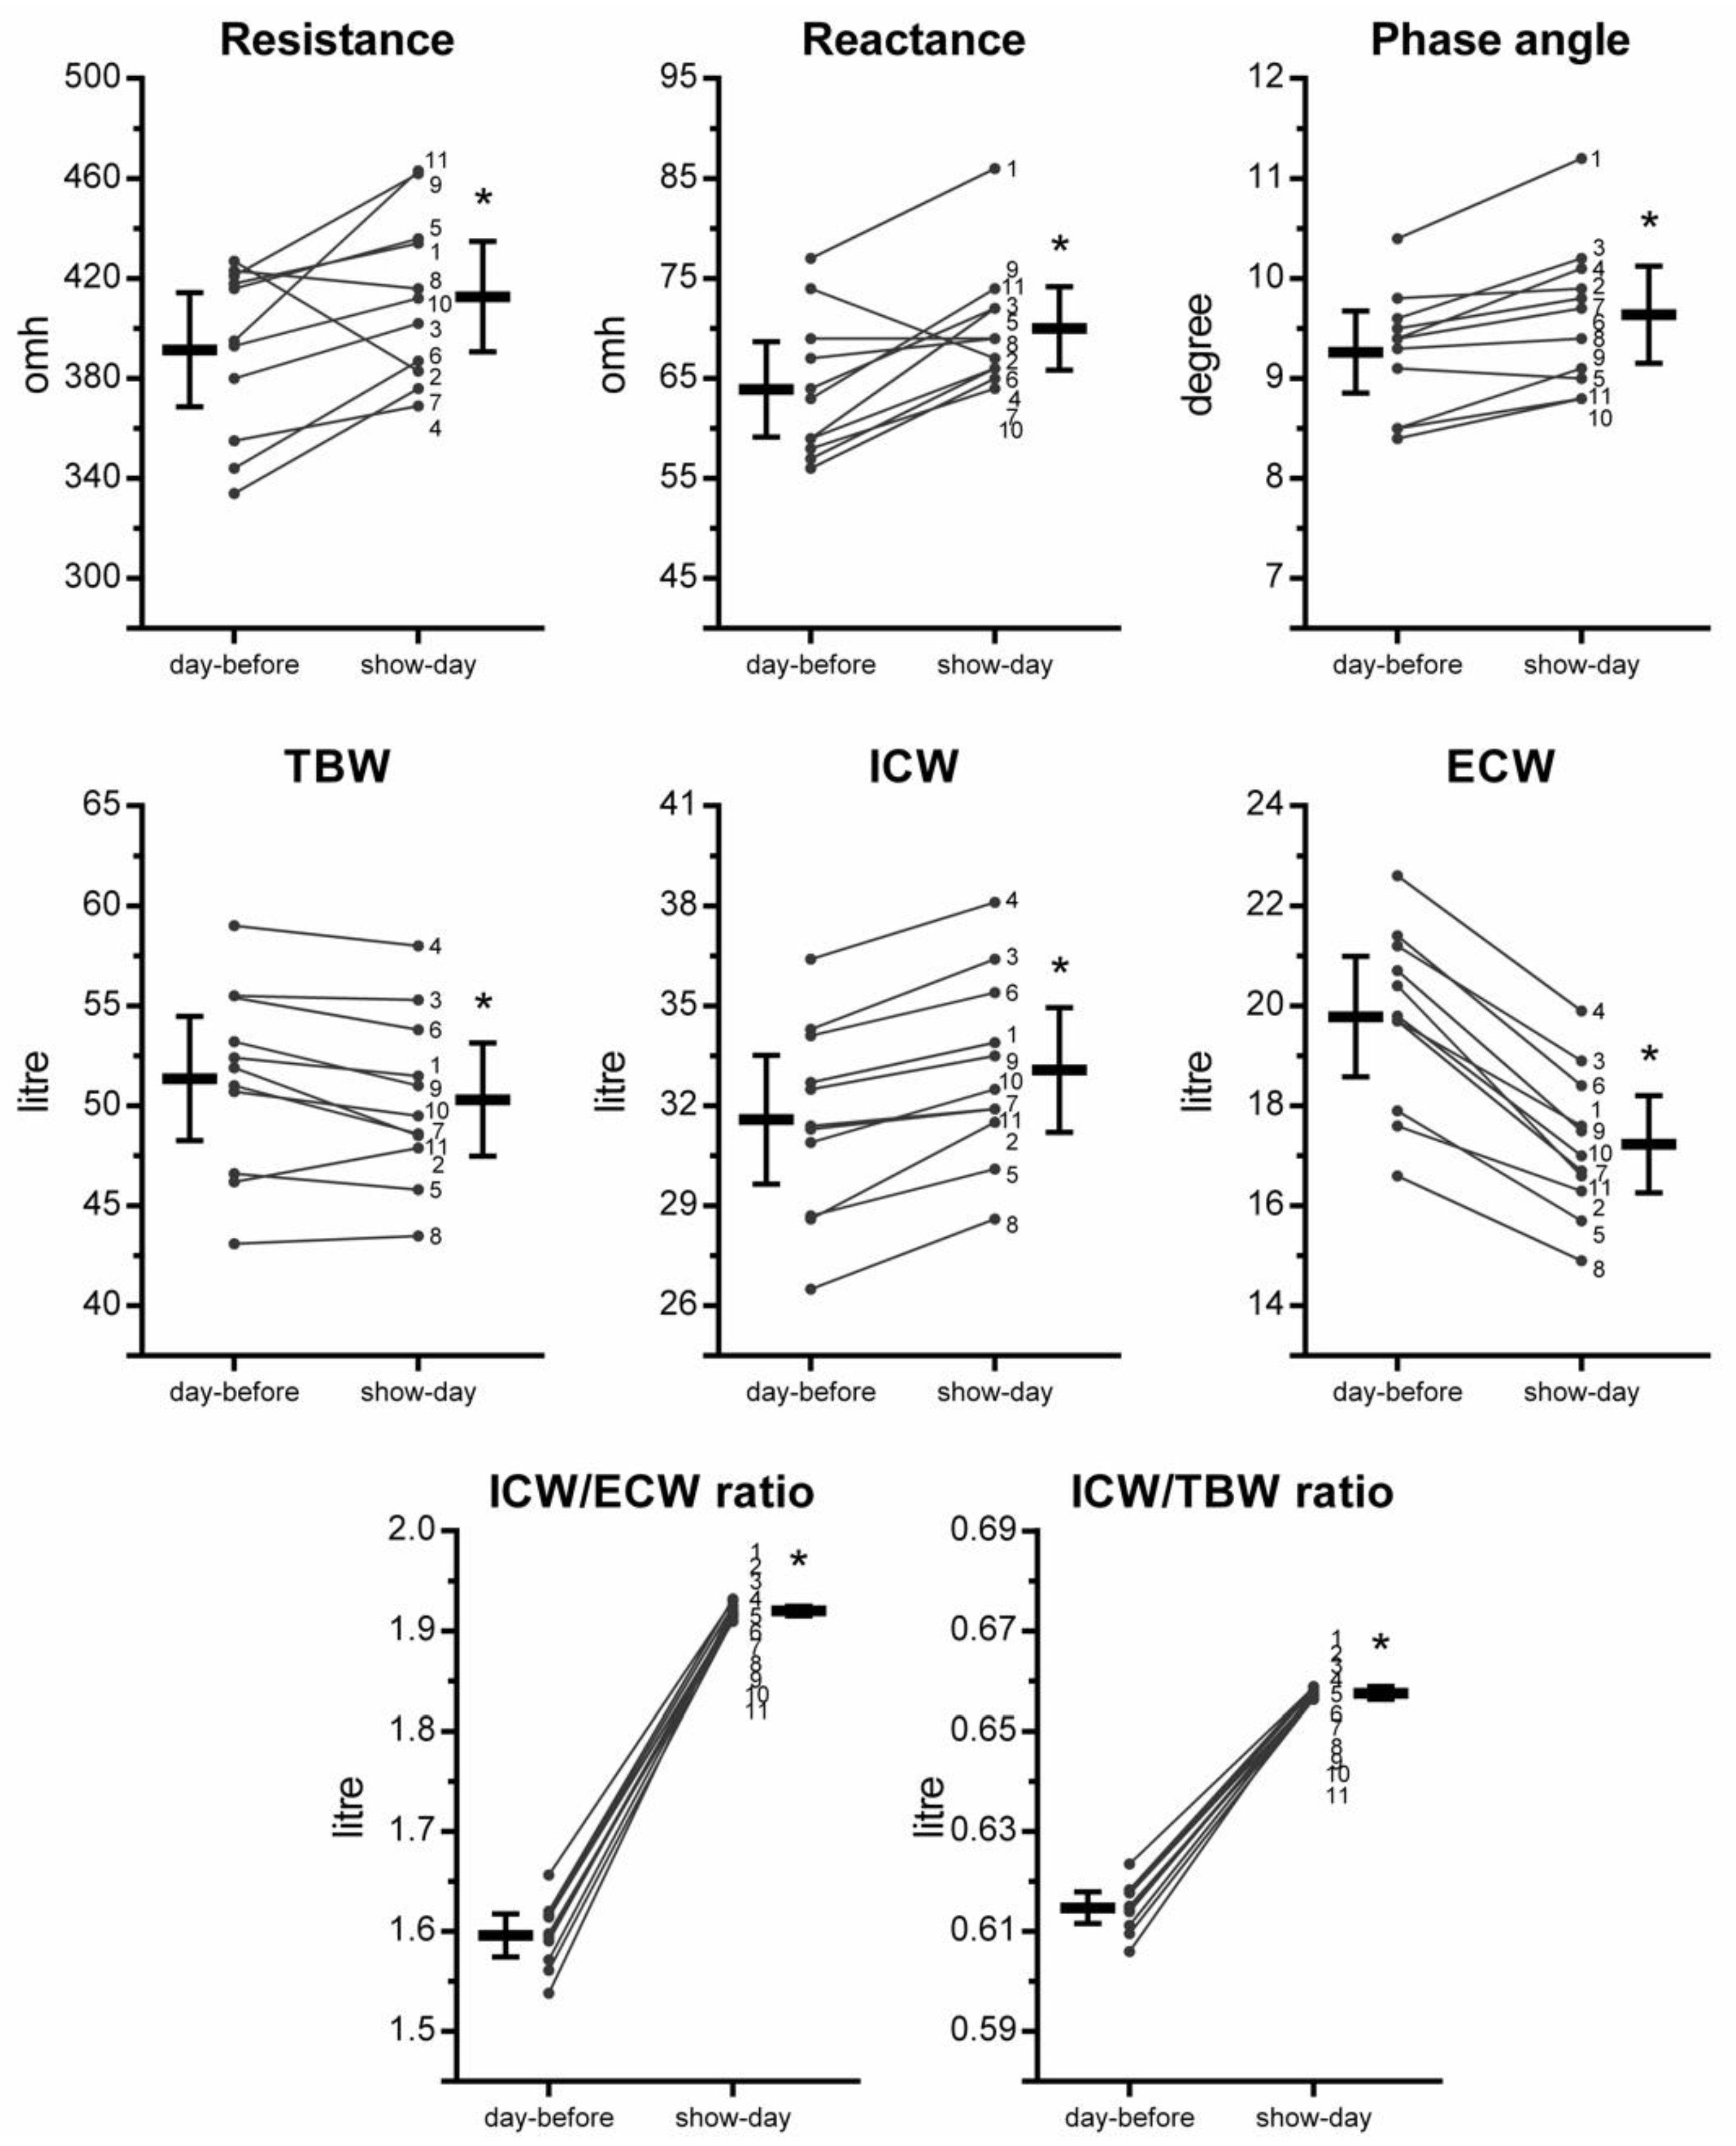
Abstract
:1. Introduction
2. Materials and Methods
2.1. Experimental Design
2.2. Subjects
2.3. Body Composition
- TBW = (0.286) + (0.195 × (S2/R)) + (0.385 × Wt) + (5.086 × Sex).
- ECW = (1.579) + (0.055 × (S2/R)) + (0.127 × Wt) + (0.006 × (S2/Xc)) + (0.932 × Sex).
- ICW = TBW − ECW.
2.4. Statistical Analyses
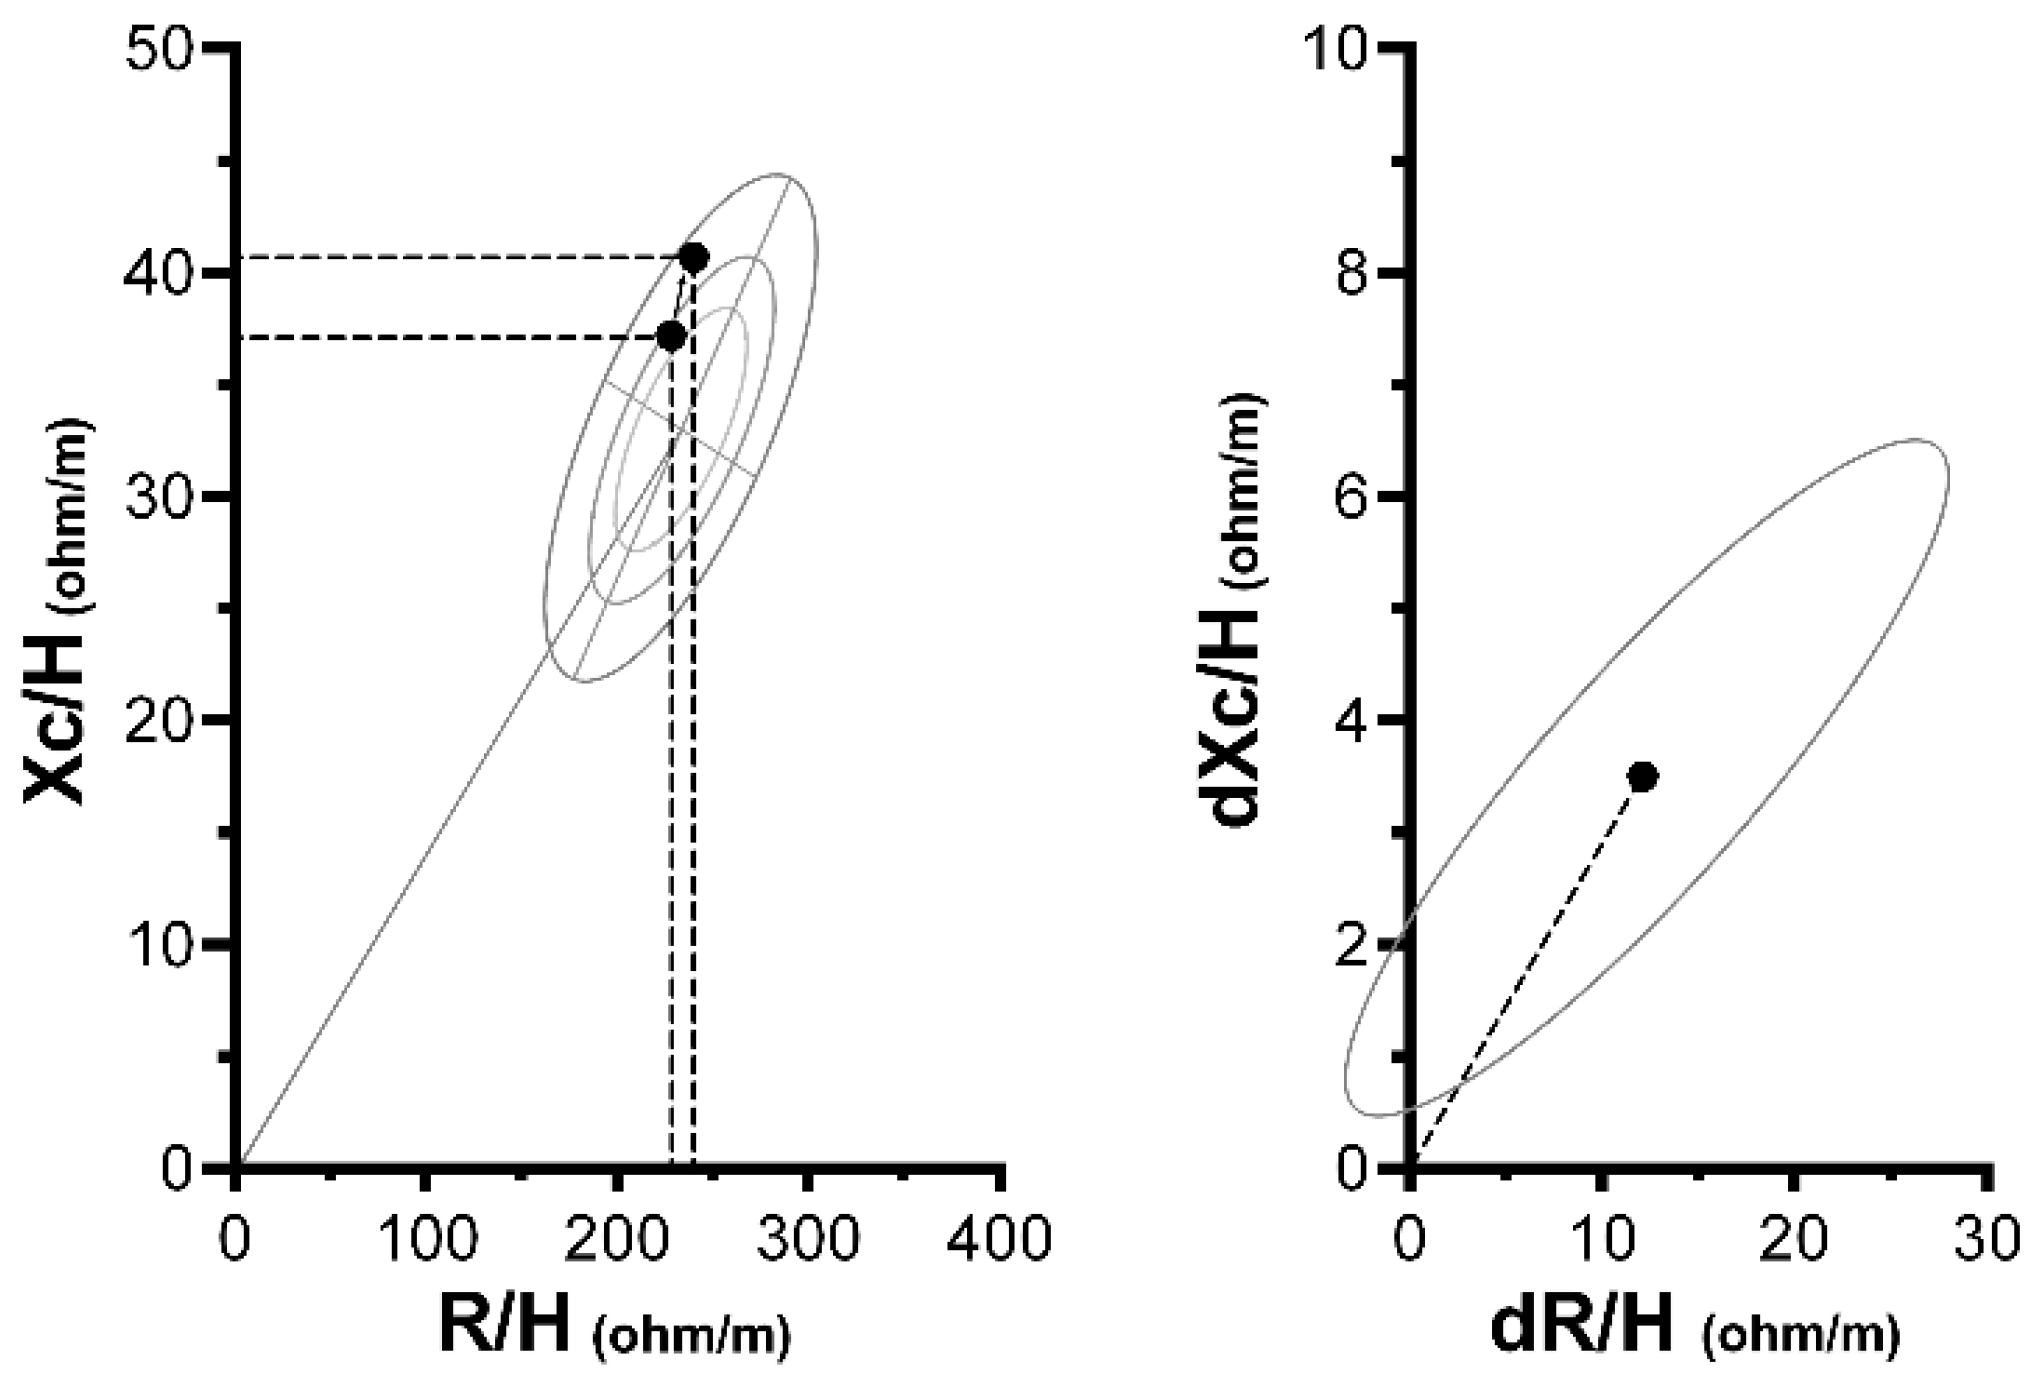
3. Results
4. Discussion
Limitations, Gaps, and Directions
5. Conclusions
Practical Applications
Supplementary Materials
Author Contributions
Funding
Institutional Review Board Statement
Informed Consent Statement
Data Availability Statement
Acknowledgments
Conflicts of Interest
References
- Cyrino, E.S.; Santarém Sobrinho, J.M.; Maestá, N.; Nardo, N.; Reis, D.A.; Morelli, M.Y.G.; Burini, R.C. Morphological profile of elite Brazilian bodybuilders in competitive season. Braz. J. Sport. Med. 2008, 14, 460–465. [Google Scholar]
- Escalante, G.; Stevenson, S.W.; Barakat, C.; Aragon, A.A.; Schoenfeld, B.J. Peak week recommendations for bodybuilders: An evidence based approach. BMC Sports Sci. Med. Rehabil. 2021, 13, 68. [Google Scholar] [CrossRef] [PubMed]
- Ribeiro, A.S.; Nunes, J.P.; Schoenfeld, B.J. Should competitive bodybuilders ingest more protein than current evidence-based recommendations? Sports Med. 2019, 49, 1481–1485. [Google Scholar] [CrossRef]
- Ribeiro, A.S.; Nunes, J.P.; Schoenfeld, B.J.; Aguiar, A.F.; Cyrino, E.S. Effects of different dietary energy intake following resistance training on muscle mass and body fat in bodybuilders: A pilot study. J. Hum. Kinet. 2019, 70, 125–134. [Google Scholar] [CrossRef] [PubMed] [Green Version]
- Hackett, D.A. Training, supplementation, and pharmacological practices of competitive male bodybuilders across training phases. J. Strength Cond. Res. 2021. [Google Scholar] [CrossRef] [PubMed]
- de Moraes, W.M.A.; de Almeida, F.N.; dos Santos, L.E.A.; Cavalcante, K.D.G.; Santos, H.O.; Navalta, J.W.; Prestes, J. Carbohydrate loading practice in bodybuilders: Effects on muscle thickness, photo silhouette scores, mood states and gastrointestinal symptoms. J. Sport. Sci. Med. 2019, 18, 772–779. [Google Scholar]
- Chappell, A.J.; Simper, T.N. Nutritional peak week and competition day strategies of competitive natural bodybuilders. Sports 2018, 6, 126. [Google Scholar] [CrossRef] [PubMed] [Green Version]
- Mitchell, L.; Hackett, D.; Gifford, J.; Estermann, F.; O’Connor, H. Do bodybuilders use evidence-based nutrition strategies to manipulate physique? Sports 2017, 5, 76. [Google Scholar] [CrossRef]
- Olsson, K.E.; Saltin, B. Variation in total body water with muscle glycogen changes in man. Acta Physiol. Scand. 1970, 80, 11–18. [Google Scholar] [CrossRef]
- Shiose, K.; Yamada, Y.; Motonaga, K.; Sagayama, H.; Higaki, Y.; Tanaka, H.; Takahashi, H. Segmental extracellular and intracellular water distribution and muscle glycogen after 72-h carbohydrate loading using spectroscopic techniques. J. Appl. Physiol. 2016, 121, 205–211. [Google Scholar] [CrossRef] [Green Version]
- King, R.F.G.J.; Jones, B.; O’Hara, J.P. The availability of water associated with glycogen during dehydration: A reservoir or raindrop? Eur. J. Appl. Physiol. 2018, 118, 283–290. [Google Scholar] [CrossRef] [Green Version]
- Helms, E.R.; Aragon, A.A.; Fitschen, P.J. Evidence-based recommendations for natural bodybuilding contest preparation: Nutrition and supplementation. J. Int. Soc. Sport. Nutr. 2014, 11, 1–20. [Google Scholar] [CrossRef] [PubMed] [Green Version]
- Schoenfeld, B.J.; Alto, A.; Grgic, J.; Tinsley, G.; Haun, C.T.; Campbell, B.I.; Escalante, G.; Sonmez, G.T.; Cote, G.; Francis, A.; et al. Alterations in body composition, resting metabolic rate, muscular strength, and eating behavior in response to natural bodybuilding competition preparation: A case study. J. Strength Cond. Res. 2020, 34, 3124–3138. [Google Scholar] [CrossRef] [PubMed]
- Bamman, M.M.; Hunter, G.R.; Newton, L.E.; Roney, R.K.; Khaled, M.A. Changes in body composition, diet, and strength of bodybuilders during the 12 weeks prior to competition. J. Sports Med. Phys. Fit. 1993, 33, 383–391. [Google Scholar]
- Campa, F.; Toselli, S.; Mazzilli, M.; Gobbo, L.A.; Coratella, G. Assessment of body composition in athletes: A narrative review of available methods with special reference to quantitative and qualitative bioimpedance analysis. Nutrients 2021, 13, 1620. [Google Scholar] [CrossRef]
- Campa, F.; Gobbo, A.L.; Stagi, S.; Cyrino, L.T.; Toselli, S.; Marini, E.; Coratella, G. Bioelectrical impedance analysis versus reference methods in the assessment of body composition in athletes. Eur. J. Appl. Physiol. 2022, 1–29. [Google Scholar] [CrossRef]
- Sardinha, L.B. Physiology of exercise and phase angle: Another look at BIA. Eur. J. Clin. Nutr. 2018, 72, 1323–1327. [Google Scholar] [CrossRef]
- Lukaski, H.; Raymond-Pope, C.J. New frontiers of body composition in sport. Int. J. Sports Med. 2021, 42, 588–601. [Google Scholar] [CrossRef]
- Campa, F.; Matias, C.N.; Marini, E.; Heymsfield, S.B.; Toselli, S.; Sardinha, L.B.; Silva, A.M. Identifying athlete body fluid changes during a competitive season with bioelectrical impedance vector analysis. Int. J. Sports Physiol. Perform. 2019, 15, 361–367. [Google Scholar] [CrossRef]
- Nunes, J.P.; Ribeiro, A.S.; Silva, A.M.; Schoenfeld, B.J.; dos Santos, L.; Cunha, P.M.; Nascimento, M.A.; Tomeleri, C.M.; Nabuco, H.C.G.; Antunes, M.; et al. Improvements in phase angle are related with muscle quality index after resistance training in older women. J. Aging Phys. Act. 2019, 27, 515–520. [Google Scholar] [CrossRef]
- Piccoli, A.; Pastori, G. BIVA Software. 2002. Available online: http://www.renalgate.it/formule_calcolatori/BIVAguide.pdf (accessed on 26 November 2020).
- Piccoli, A.; Rossi, B.; Pillon, L.; Bucciante, G. A new method for monitoring body fluid variation by bioimpedance analysis: The RXc graph. Kidney Int. 1994, 46, 534–539. [Google Scholar] [CrossRef] [PubMed] [Green Version]
- Di Vincenzo, O.; Marra, M.; Scalfi, L. Bioelectrical impedance phase angle in sport: A systematic review. J. Int. Soc. Sports Nutr. 2019, 16, 49. [Google Scholar] [CrossRef] [PubMed] [Green Version]
- World Medical Association World Medical Association Declaration of Helsinki: Ethical principles for medical research involving human subjects. JAMA 2013, 310, 2191–2194. [CrossRef] [PubMed] [Green Version]
- IPGDx-LCC; Singer, M.G. BIA/Vitality AnalyzerTM User Manual. 2012. Available online: https://manualzz.com/doc/o/9thm4/-user-manual--chapter-four--bcaandtrade%3B-custom-spreadsheet-application (accessed on 16 October 2021).
- Matias, C.N.; Santos, D.; Júdice, P.B.; Magalhães, J.P.; Minderico, C.S.; Fields, D.A.; Lukaski, H.C.; Sardinha, L.B.; Silva, A.M. Estimation of total body water and extracellular water with bioimpedance in athletes: A need for athlete-specific prediction models. Clin. Nutr. 2016, 35, 468–474. [Google Scholar] [CrossRef] [PubMed]
- Cohen, J. A power primer. Psychol. Bull. 1992, 112, 155–159. [Google Scholar] [CrossRef]
- Lakens, D. Calculating and reporting effect sizes to facilitate cumulative science: A practical primer for t-tests and ANOVAs. Front. Psychol. 2013, 4, 863. [Google Scholar] [CrossRef] [Green Version]
- Campa, F.; Matias, C.; Gatterer, H.; Toselli, S.; Koury, J.C.; Andreoli, A.; Melchiorri, G.; Sardinha, L.B.; Silva, A.M. Classic bioelectrical impedance vector reference values for assessing body composition in male and female athletes. Int. J. Environ. Res. Public Health 2019, 16, 5066. [Google Scholar] [CrossRef] [Green Version]
- Bergström, J.; Hermansen, L.; Hultman, E.; Saltin, B. Diet, muscle glycogen. Acta Physiol. Scandanavia 1967, 71, 140–150. [Google Scholar] [CrossRef]
- Kiens, B. Diet and training in the week before competition. Can. J. Appl. Physiol. 2001, 26, S56–S63. [Google Scholar] [CrossRef]
- Goforth, H.W., Jr.; Arnall, D.A.; Bennett, B.L.; Law, P.G. Persistence of supercompensated muscle glycogen in trained subjects after carbohydrate loading. J. Appl. Physiol. 1997, 82, 342–347. [Google Scholar] [CrossRef] [Green Version]
- Piccoli, A.; Pastori, G.; Codognotto, M.; Paoli, A. Equivalence of information from single frequency v. bioimpedance spectroscopy in bodybuilders. Br. J. Nutr. 2007, 97, 182–192. [Google Scholar] [CrossRef] [PubMed] [Green Version]
- Lichtenbelt, W.D.V.M.; Hartgens, F.; Vollaard, N.B.J.; Ebbing, S.; Kuipers, H. Bodybuilders’ body composition: Effect of nandrolone decanoate. Med. Sci. Sports Exerc. 2004, 36, 484–489. [Google Scholar]
- Mitchell, L.; Slater, G.; Hackett, D.; Johnson, N.; Connor, O. Physiological implications of preparing for a natural male bodybuilding competition competition. Eur. J. Sport Sci. 2018, 18, 619–629. [Google Scholar] [CrossRef] [PubMed]
- Nescolarde, L.; Yanguas, J.; Lukaski, H.; Alomar, X.; Rosell-Ferrer, J.; Rodas, G. Effects of muscle injury severity on localized bioimpedance measurements. Physiol. Meas. 2015, 36, 27–42. [Google Scholar] [CrossRef]
- Campa, F.; Silva, A.M.; Matias, C.N.; Monteiro, C.P.; Paoli, A.; Nunes, J.P.; Talluri, J.; Lukaski, H.; Toselli, S. Body water content and morphological characteristics modify bioimpedance vector patterns in volleyball, soccer, and rugby players. Int. J. Environ. Res. Public Health 2020, 17, 6604. [Google Scholar] [CrossRef] [PubMed]
- Di Vincenzo, O.; Marra, M.; Di Gregorio, A.; Pasanisi, F.; Scalfi, L. Bioelectrical impedance analysis (BIA)-derived phase angle in sarcopenia: A systematic review. Clin. Nutr. 2021, 40, 3052–3061. [Google Scholar] [CrossRef] [PubMed]
- Bosy-Westphal, A.; Danielzik, S.; Dörhöfer, R.-P.; Later, W.; Wiese, S.; Müller, M.J. Phase angle from bioelectrical impedance analysis: Population reference values by age, sex, and body mass index. J. Parenter. Enter. Nutr. 2006, 30, 309–316. [Google Scholar] [CrossRef]
- Martins, P.C.; Lima, T.R.; Silva, A.M.; Silva, D.A.S. Association of phase angle with muscle strength and aerobic fitness in different populations: A systematic review. Nutrition 2021, 93, 111489. [Google Scholar] [CrossRef]
- Norman, K.; Stobäus, N.; Pirlich, M.; Bosy-Westphal, A. Bioelectrical phase angle and impedance vector analysis—Clinical relevance and applicability of impedance parameters. Clin. Nutr. 2012, 31, 854–861. [Google Scholar] [CrossRef]
- Mattiello, R.; Amaral, M.A.; Mundstock, E.; Ziegelmann, P.K. Reference values for the phase angle of the electrical bioimpedance: Systematic review and meta-analysis involving more than 250,000 subjects. Clin. Nutr. 2020, 39, 1411–1417. [Google Scholar] [CrossRef]


Publisher’s Note: MDPI stays neutral with regard to jurisdictional claims in published maps and institutional affiliations. |
© 2022 by the authors. Licensee MDPI, Basel, Switzerland. This article is an open access article distributed under the terms and conditions of the Creative Commons Attribution (CC BY) license (https://creativecommons.org/licenses/by/4.0/).
Share and Cite
Nunes, J.P.; Araújo, J.P.M.; Ribeiro, A.S.; Campa, F.; Schoenfeld, B.J.; Cyrino, E.S.; Trindade, M.C.C. Changes in Intra-to-Extra-Cellular Water Ratio and Bioelectrical Parameters from Day-Before to Day-Of Competition in Bodybuilders: A Pilot Study. Sports 2022, 10, 23. https://doi.org/10.3390/sports10020023
Nunes JP, Araújo JPM, Ribeiro AS, Campa F, Schoenfeld BJ, Cyrino ES, Trindade MCC. Changes in Intra-to-Extra-Cellular Water Ratio and Bioelectrical Parameters from Day-Before to Day-Of Competition in Bodybuilders: A Pilot Study. Sports. 2022; 10(2):23. https://doi.org/10.3390/sports10020023
Chicago/Turabian StyleNunes, João Pedro, João P. M. Araújo, Alex S. Ribeiro, Francesco Campa, Brad J. Schoenfeld, Edilson S. Cyrino, and Michele C. C. Trindade. 2022. "Changes in Intra-to-Extra-Cellular Water Ratio and Bioelectrical Parameters from Day-Before to Day-Of Competition in Bodybuilders: A Pilot Study" Sports 10, no. 2: 23. https://doi.org/10.3390/sports10020023