
A Narrative Review for a Machine Learning Application in Sports: An Example Based on Injury Forecasting in Soccer


Abstract
:1. Introduction
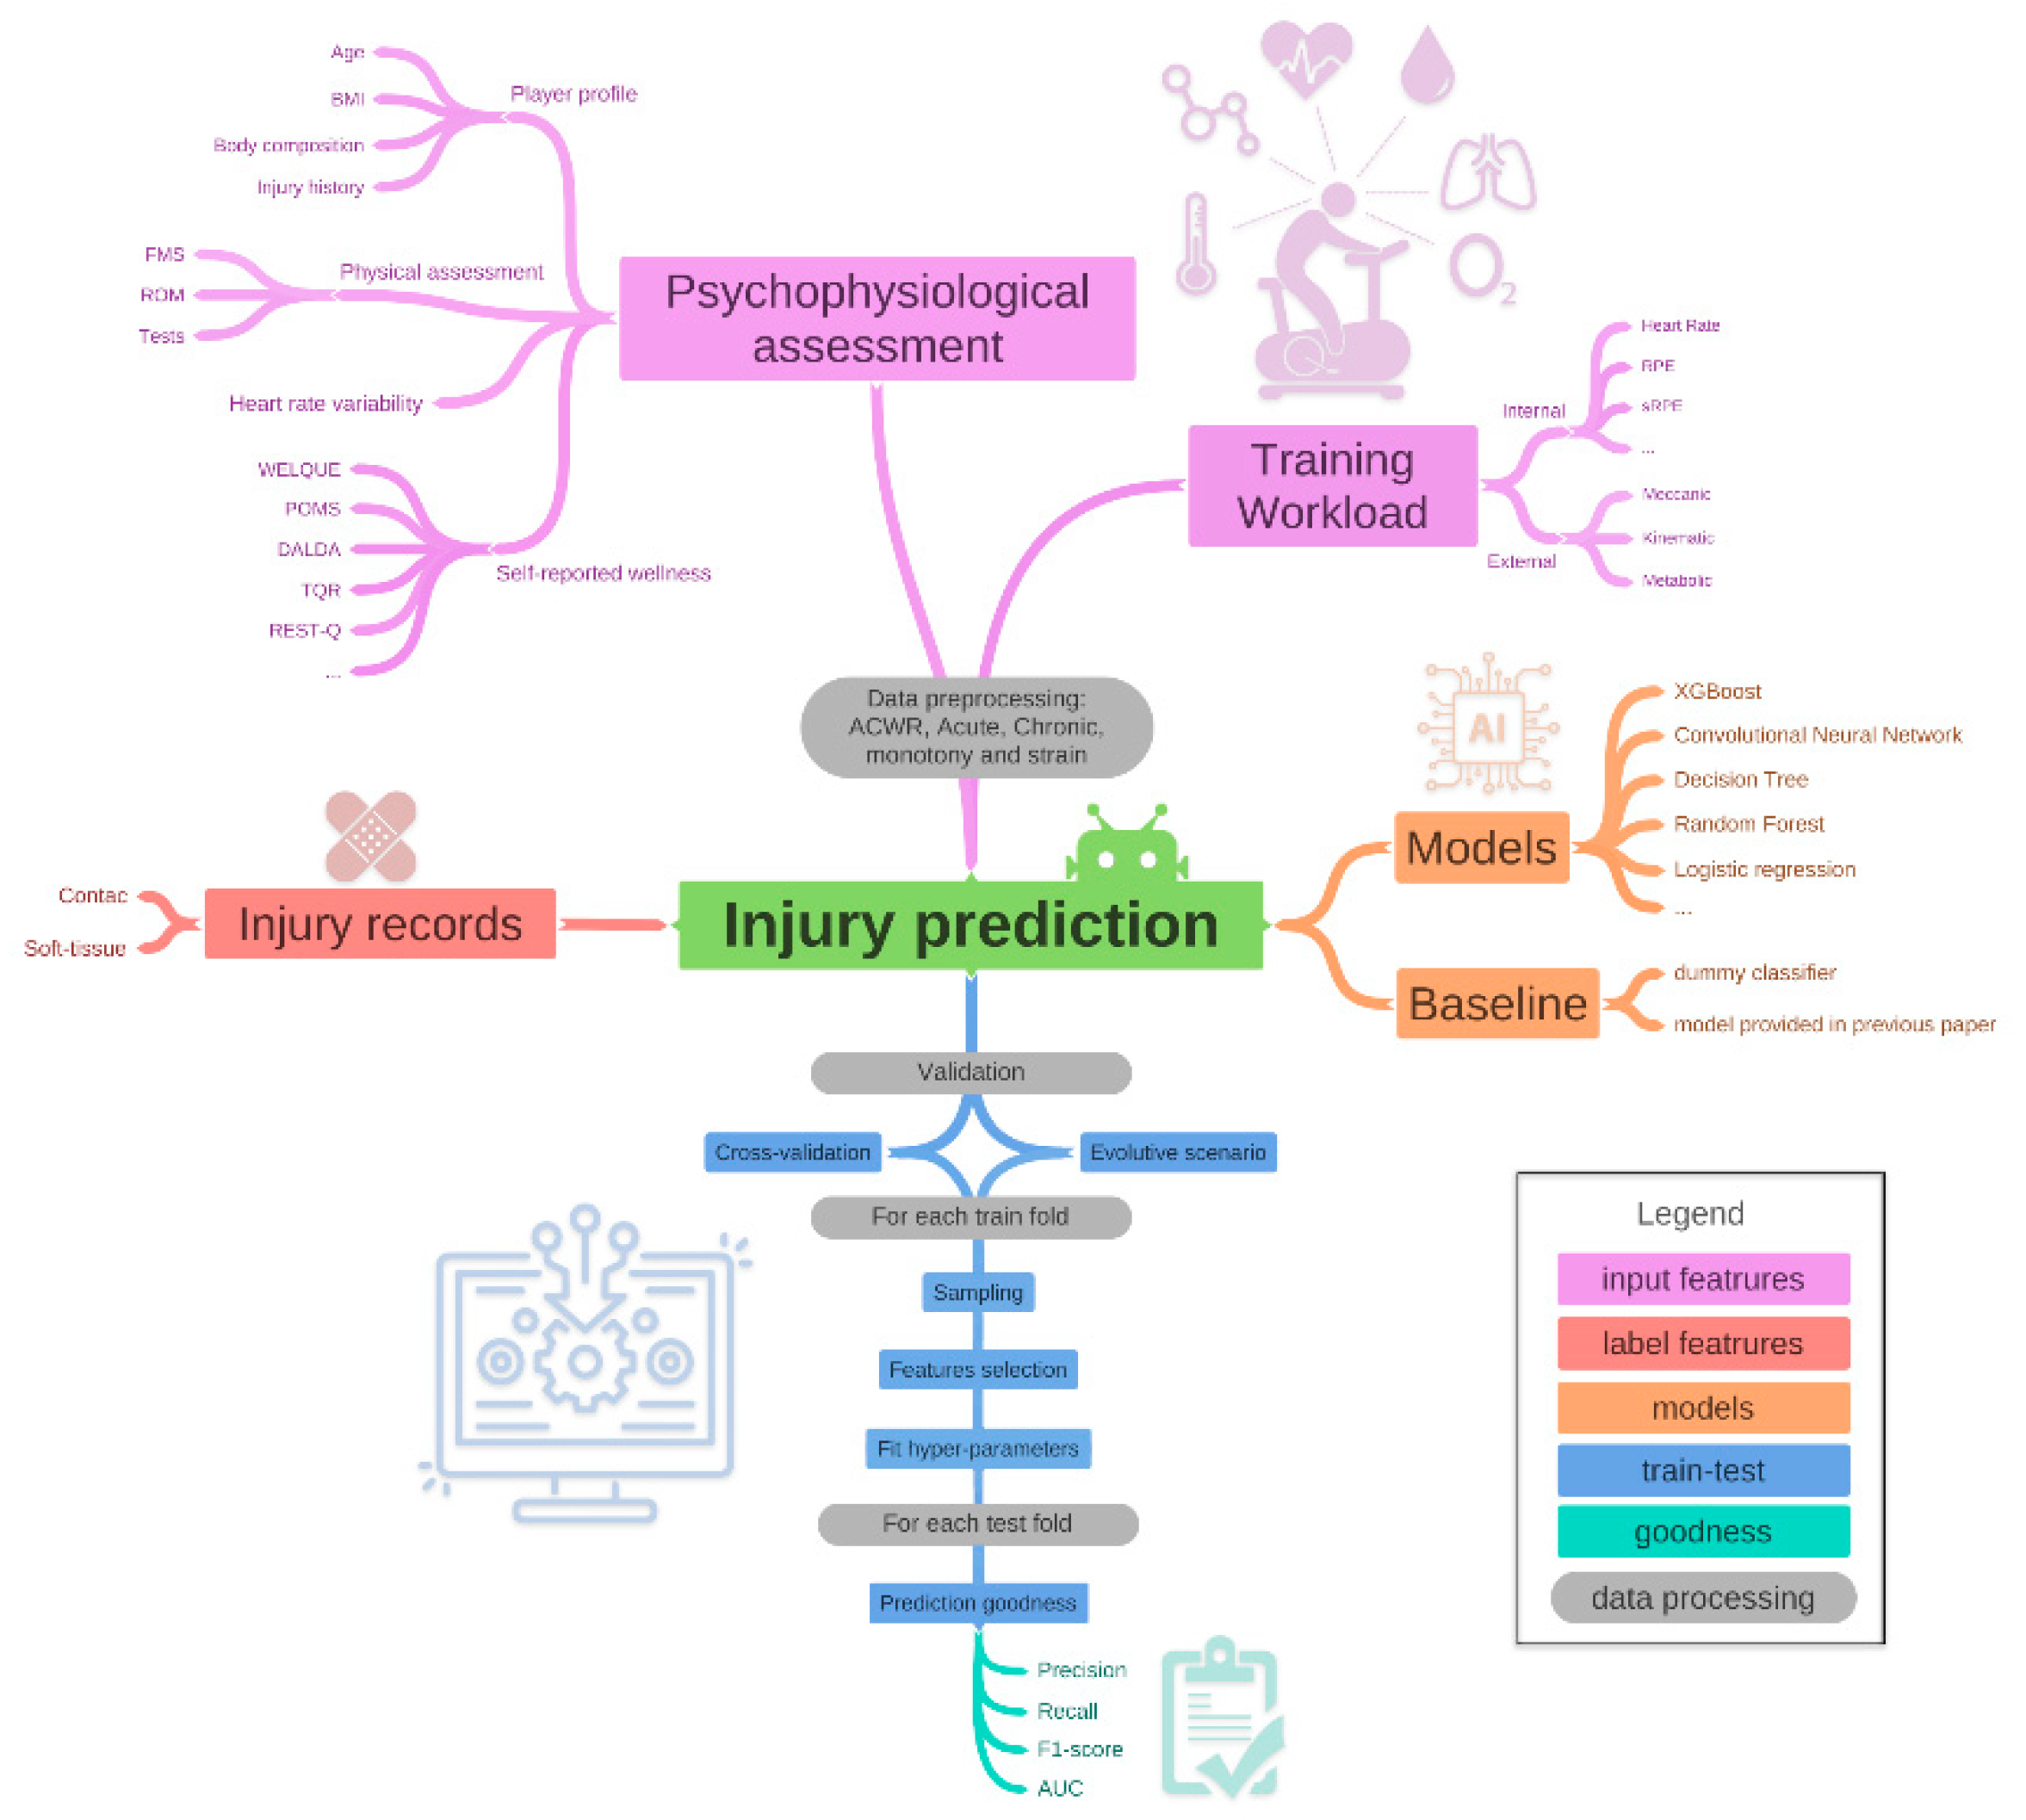
2. Data Description
2.1. Input Features
2.1.1. Training Workloads
External Workload
- kinematic: player’s overall movement during a training session, e.g., total distance and high-speed running distance (Distance in meters covered above 5.5 m/s);
- metabolic: energy expenditure of a player’s overall movement during a training session, e.g., high metabolic load distance (distance in meters covered by a player with a Metabolic Power is above 25.5 W/Kg);
- mechanical: player’s overall muscular-scheletrical load during a training session, e.g., explosive distance (Distance in meters covered above 25.5 W/Kg and below 19.8 Km/h), and the number of accelerations and decelerations above 2 and 3 m/s2.
Internal Workload
2.1.2. Psycho-Physiological Assessment
Player Profile, Body Composition and Physical Assessment
Injury History
Self-Reported Wellness
- Profile of Mood States (POMS) [61]: the primary psychological tool for monitoring training stress and over-training syndrome. The original questionnaire is composed of 65 items, but a short version with a subset of questions (i.e., tension-anxiety, depression-dejection, anger-hostility, fatigue-inertia, vigour-activity, and confusion-bewilderment) are widely used for assessing mood states among athletes [62]. For this inventory, the athletes report a 5-points Likert scale to rate how strongly they agreed with a statement.
- Daily Analyses of Life Demands for Athletes (DALDA) [63]: a self-reported questionnaire used to assess life-stress and symptoms of stress in athlete’s response to training. DALDA is divided into two sections: (i) self-assessment concerning the general stress sources that occur in the everyday life of an athlete, and (ii) determine what stress-reaction symptoms physically exist in the athlete.
- Total Quality Recovery (TQR) [64]: a self-reported scale ranged between 6 and 20 in order to evaluate the self-reported recovery status from a previous effort. Values of about 6 refer to no recovery at all, while 20 means that the athlete fully recover.
- Recovery-Stress Questionnaire for Athletes (RESTQ) [65]: this measures the frequency of current stress symptoms along with the frequency of recovery-associated activities. seven stress scales and five recovery scales characterized the RESTQ version for athletes.
Wearable Devices
2.1.3. Data Preprocessing
- acute values reflect the mean value of the last week (from five to seven days);
- chronic values reflect the mean value of the past month (from 28 to 30 days);
- acute chronic workload ratio (ACWR) is the ratio between the acute and chronic values. ACWR values higher than 1 indicates that the acute values are higher than the chronic one, while vice versa for ACWR values lower than 1;
- monotony is the ratio between the mean value and the standard deviation of the training load during the past seven days;
- strain is the sum of the training loads for all training sessions during the past seven days multiplied by the monotony index.
2.2. Target Feature
3. Models
3.1. Machine Learning Models
3.2. Baseline
- stratified: generates predictions by respecting the training set’s class distribution;
- most frequent: always predicts the most frequent label in the training set;
- prior: always predicts the class that maximizes the class prior (like most frequent strategy);
- uniform: generates ns uniformly at random;
- constant: always predicts a constant label that is provided by the user. This is useful for metrics that evaluate a non-majority class.
4. Train and Test
4.1. Validation
4.2. Data Processing for Each Training Fold
4.2.1. Sampling
4.2.2. Feature Selection
4.3. Hyper-Parameters Fit on Validation Set
5. Model Interpretation
6. Prediction Goodness
- Precision (Sensitivity) is the ratio between the true positive (TP) and all the positive results, i.e., the sum of the true positive and the false positive (FP): TP/(TP + FP). The positive class in this example is the injury one. Precision indicates the fraction of examples that the classifier correctly classifies in a given class over the number of all examples the classifier assigns to that class.
- Recall (Specificity) is the ratio between TP and the number of all samples that should have been identified as positive, i.e., the sum of TP and False Negative (FN): TP/(TP + FN). The recall an index that indicates the number of examples that a classifier correctly classified in a given class.
- F1-score = 2(precision × recall)/(precision + recall). This is the harmonic mean of Sensitivity (precision) and Specificity (recall).
- Area Under the Curve (AUC) is an aggregate measure of performance across all possible classification thresholds. In particular, it is the probability that a model ranks a random positive instance is higher than a randomly negative one. The AUC score is ranged between 0.5 and 1. The higher the AUC, the higher the accuracy of the model.
7. Conclusions
Author Contributions
Funding
Acknowledgments
Conflicts of Interest
References
- Fernández-Cuevas, I.; Gomez-Carmona, P.; Sillero-Quintana, M.; Noya-Solces, J.; Arnaiz-Lastras, J. Economic costs estimation of soccer injuries in first and second Spanish division professional teams. In Proceedings of the 15th Annual Congress of the European College of Sport Sciences, Antalya, Turkey, 2010. [Google Scholar]
- Kaplan, K.; Goodwillie, A.; Strauss, E.; Rosen, J. Rugby injuries: A review of concepts and current literature. Bull. NYU Hosp. Jt. Dis. 2008, 66, 86–93. [Google Scholar]
- West, S.; Williams, S.; Cazzola, D.; Kemp, S.; Cross, M.; Stokes, K. Training Load and Injury Risk in Elite Rugby Union: The Largest Investigation to Date. Int. J. Sports Med. 2020, 42, 731–739. [Google Scholar] [CrossRef] [PubMed]
- Williams, S.; Trewartha, G.; Kemp, S.; Stokes, K. A meta-analysis of injuries in senior men′s professional Rugby Union. Sports Med. 2013, 43, 1043–1055. [Google Scholar] [CrossRef] [PubMed] [Green Version]
- Isorna-Folgar, M.; Leirós-Rodríguez, R.; Paz-Dobarro, R.; García-Soidán, J. Injuries Associated with the Practice of Calm Water Kayaking in the Canoeing Modality. J. Clin. Med. 2021, 10, 902. [Google Scholar] [CrossRef]
- Gabbet, T. The development and application of an injury prediction model for noncontact, soft-tissue injuries in elite collision sport athletes. J. Strength Cond. Res. 2010, 24, 2593–2603. [Google Scholar] [CrossRef] [PubMed] [Green Version]
- Hulin, B.; Gabbet, T.; Blank, P.; Chapman, P.; Bailey, D.; Orchard, J. Spikes in acute workload are associated with increased injury risk in elite cricket fast bowlers. Br. J. Sports Med. 2014, 48, 708–712. [Google Scholar] [CrossRef]
- Hulin, B.; Gabbet, T.; Lawson, D.; Caputi, P.; Sampson, J. The acute:chronic workload ratio predicts injury: High chronic workload may decrease injury risk in elite rugby league players. Br. J. Sports Med. 2016, 50, 231–236. [Google Scholar] [CrossRef] [Green Version]
- Gabbet, T.; Hulin, B.; Blanch, P.; Whiteley, R. High training workloads alone do not cause sports injuries: How you get there is the real issue. Br. J. Sports Med. 2016, 50, 444–445. [Google Scholar] [CrossRef]
- Gabbett, T. The training-injury prevention paradox: Should athletes be training smarter and harder? Br. J. Sports Med. 2016, 50, 273–280. [Google Scholar] [CrossRef] [Green Version]
- Murray, N.; Gabbet, T.; Townshen, A.; Blanch, P. Calculating acute:chronic workload ratios using exponentially weighted moving averages provides a more sensitive indicator of injury likelihood than rolling averages. Br. J. Sports Med. 2017, 51, 749–754. [Google Scholar] [CrossRef]
- Impellizzeri, F.; Matthew, S.; Kempton, T.; Novak, A.; Coutts, A. Acute: Chronic Workload Ratio: Conceptual Issues and Fundamental Pitfalls. Int. J. Sports Physiol. Perform. 2020, 15, 907–913. [Google Scholar] [CrossRef] [PubMed]
- Kalkhoven, J.; Watford, M.; Coutts, A.; Edwards, W.; Impellizzeri, F. Training Load and Injury: Causal Pathways and Future Directions. Sports Med. 2021, 51, 1137–1150. [Google Scholar] [CrossRef]
- MacMillan, G.; Batterham, A.; Chesterton, P.; Gregson, W.; Lolli, L.; Weston, M.; Atkinson, G. Variability in the Study Quality Appraisals Reported in Systematic Reviews on the Acute:Chronic Workload Ratio and Injury Risk. Sports Med. 2020, 50, 2065–2067. [Google Scholar] [CrossRef] [PubMed]
- Rossi, A.; Pappalardo, L.; Cintia, P.; Iaia, F.; Fernàndez, J.; Mediana, D. Effective injury forecasting in soccer with GPS training data and machine learning. PLoS ONE 2018, 13, e0201264. [Google Scholar] [CrossRef] [Green Version]
- Bittencourt, N.; Meeuwisse, W.; Mendonça, L.; Nettel-Aguirre, A.; Ocarino, J.; ST, F. Complex systems approach for sports injuries: Moving from risk factor identification to injury pattern recognition—Narrative review and new concept. Br. J. Sports Med. 2015, 50, 1309–1314. [Google Scholar] [CrossRef] [Green Version]
- Hulme, A.; Finch, C. From monocausality to systems thinking: A complementary and alternative conceptual approach for better understanding the development and prevention of sports injury. Inj. Epidemiol. 2015, 2, 31. [Google Scholar] [CrossRef] [PubMed]
- Quatman, C.; Quatman, C.; Hewett, T. Prediction and prevention of musculoskeletal injury: A paradigm shift in methodology. Br. J. Sports Med. 2015, 43, 1100–1107. [Google Scholar] [CrossRef]
- Seow, D.; Graham, I.; Massey, A. Prediction models for musculoskeletal injuries in professional sporting activities: A systematic review. Transl. Sports Med. 2020, 3, 505–517. [Google Scholar] [CrossRef]
- López-Valenciano, A.; Ayala, F.; Puerta, J.; De Ste Croix, M.; Vera-García, F.; Hernández-Sánchez, S.; Ruiz-Pérez, I.; Myer, G. A preventive model for muscle injuries: A novel approach based on learning algorithms. Med. Sci. Sports Exerc. 2018, 50, 915–927. [Google Scholar] [CrossRef]
- Ruddy, J.; Shield, A.; Maniar, N.; Williams, M.D.; Duhig, S.; Timmins, R.G.; Hickey, J.; Bourne, M.N.; Opar, D.A. Predictive modeling of hamstring strain injuries in elite Australian footballers. Med. Sci. Sports Exerc. 2018, 50, 906–914. [Google Scholar] [CrossRef] [Green Version]
- Carey, D.; Ong, K.; Whiteley, R.; Crossley, K.; Crow, J.; Morris, M. Predictive Modelling of Training Loads and Injury in Australian Football. Int. J. Comput. Sci. 2018, 17, 49–66. [Google Scholar] [CrossRef] [Green Version]
- Ayala, F.; López-Valenciano, A.; Gámez Martín, J.; De Ste Croix, M.; Vera-Garcia, F.J.; García-Vaquero, M.d.; Ruiz-Pérez, I.; Myer, G.D. A preventive model for hamstring injuries in professional soccer: Learning algorithms. Int. J. Sports Med. 2019, 40, 344–353. [Google Scholar] [CrossRef]
- Vallance, E.; Sutton-Charani, N.; Imoussaten, A.; Montmain, J.; Perrey, S. Combining internal- and external-training-loads to predict non-contact injuries in soccer. Appl. Sci. 2020, 10, 5261. [Google Scholar] [CrossRef]
- Talukder, H.; Vincent, T.; Foster, G.; Hu, G.; Huerta, J.; Kumar, A.; Malazarte, M.; Saldana, D.; Simpson, S. Preventing in-game injuries for NBA players. In Proceedings of the MIT Sloan Sports Analytics Conference, Boston, MA, USA, 2016. [Google Scholar]
- Matthew, C.; Varley, I.; Aughey, R. Validity and reliability of GPS for measuring instantaneous velocity during acceleration, deceleration, and constant motion. J. Sports Sci. 2010, 20, 121–127. [Google Scholar] [CrossRef]
- Scott, M.; Scott, T.; Kelly, V. The Validity and Reliability of Global Positioning Systems in Team Sport: A Brief Review. J. Strength Cond. Res. 2016, 30, 1470–1490. [Google Scholar] [CrossRef]
- Borg, G. Borg’s Perceived Exertion and Pain Scales; Springer: New York, NY, USA, 1993. [Google Scholar]
- Herman, L.; Foster, C.; Maher, M.; Mikat, R.; Porcari, J. Validity and reliability of the session RPE method for monitoring exercise training intensity. South Afr. J. Sports Med. 2006, 18, 14–17. [Google Scholar] [CrossRef] [Green Version]
- Rossi, A.; Perri, E.; Pappalardo, L.; Cintia, P.; Iaia, F. Relationship between External and Internal Workloads in Elite Soccer Players: Comparison between Rate of Perceived Exertion and Training Load. Appl. Sci. 2019, 9, 5174. [Google Scholar] [CrossRef] [Green Version]
- Alexandre, D.; da Silva, C.; Hill-Haas, S.; Wong, D.; Natali, A.; De Lima, J.; Filho, M.; Marins, J.; Garcia, E.; Karim, C. Heart Rate Monitoring in Soccer: Interest and Limits During Competitive Match Play and Training, Practical Application. J. Strength Cond. Res. 2012, 26, 2890–2906. [Google Scholar] [CrossRef] [PubMed] [Green Version]
- Colosio, A.; Pedrinolla, A.; Da Lozzo, G.; Pogliaghi, S. Heart Rate-Index Estimates Oxygen Uptake, Energy Expenditure and Aerobic Fitness in Rugby Players. J. Sports Med. 2018, 17, 633–639. [Google Scholar]
- Arnason, A.; Gudmundsson, A.; Dahl, H. Soccer injuries in Iceland. Scand. J. Med. Sci. Sports 1996, 6, 40–45. [Google Scholar] [CrossRef] [PubMed]
- Ostenberg, A.; Roos, H. Injury risk factors in female European football: A prospective study of 123 players during one season. Sports Med. 2000, 10, 279–285. [Google Scholar] [CrossRef]
- Dvorak, J.; Junge, A.; Chomiak, J. Risk factor analysis for injuries in football players: Possibilities for a prevention program. Am. J. Sports Med. 2000, 28, S69–S74. [Google Scholar] [CrossRef]
- Ekstrand, J.; Gillquist, J. Soccer injuries and their mechanisms: A prospective study. Med. Sci. Sports Exerc. 1983, 15, 267–270. [Google Scholar] [CrossRef]
- Ekstrand, J.; Gillquist, J. The avoidability of soccer injuries. Int. J. Sports Med. 1983, 4, 124–128. [Google Scholar] [CrossRef]
- Orchard, J. Is there a relationship between ground and climatic conditions and injuries in football? Sports Med. 2002, 32, 419–432. [Google Scholar] [CrossRef] [PubMed]
- Bongiovanni, T.; Trecroci, A.; Cavaggioni, L.; Rossi, A.; Perri, E.; Pasta, G.; Iaia, F.; Alberti, G. Importance of anthropometric features to predict physical performance in elite youth soccer: A machine learning approach. Res. Sports Med. 2020, 29, 213–224. [Google Scholar] [CrossRef] [PubMed]
- Tolfrey, K.; Barker, A.; Thom, J.; Morse, C.; Narici, M.; Batterham, A. Scaling of maximal oxygen uptake by lower leg muscle volume in boys and men. J. Appl. Physiol. 2006, 100, 1851–1856. [Google Scholar] [CrossRef] [Green Version]
- Mundstock, E.; Amaral, M.; Baptista, R.; Sarria, E.; Dos Santos, R.J.G.; Filho, A.; Rodrigues, C.; Forte, G.; Castro, L.; Padoin, A.; et al. Association between phase angle from bioelectrical impedance analysis and level of physical activity: Systematic review and meta-analysis. Clin. Nutr. 2019, 38, 1504–1510. [Google Scholar] [CrossRef]
- Sardinha, L.; Correia, I.; Magalhães, J.; Júdice, P.; Silva, A.; Hetherington-Rauth, M. Development and validation of BIA prediction equations of upper and lower limb lean soft tissue in athletes. Eur. J. Clin. Nutr. 2020, 74, 1646–1652. [Google Scholar] [CrossRef] [PubMed]
- Arnason, A.; Sigurdsson, S.; Gudmundsson, A.; Holme, I.; Engebretsen, L.; Bahr, R. Physical fitness, injuries, and team performance in soccer. Med. Sci. Sports Exerc. 2004, 36, 278–285. [Google Scholar] [CrossRef]
- Trecroci, A.; Rossi, A.; Dos’Santos, T.; Formenti, D.; Cavaggioni, L.; Longo, S.; Iaia, F.; Alberti, G. Change of direction asymmetry across different age categories in youth soccer. PeerJ 2020, 8, e9486. [Google Scholar] [CrossRef]
- Hammes, D.; aus der Fünten, K.; Bizzini, M.; Meyer, T. Injury prediction in veteran football players using the Functional Movement Screen. J. Sports Sci. 2016, 34, 1371–1379. [Google Scholar] [CrossRef]
- Karuc, J.; Mišigoj-Duraković, M.; Šarlija, M.; Marković, G.; Hadžić, V.; Trošt-Bobić, T.; Sorić, M. Can Injuries Be Predicted by Functional Movement Screen in Adolescents? The Application of Machine Learning. J. Strength Cond. Res. 2021, 35, 910–919, Online ahead of print. [Google Scholar] [CrossRef]
- Fernández-Cuevas, I.; Arnáiz Lastras, J.; Escamilla Galindo, V.; Gómez Carmona, P. Thermography for the Detection of Injury in Sports Medicine. In Application of Infrared Thermography in Sports Science; Priego Quesada, J., Ed.; Biological and Medical Physics Biomedical Engineering; Springer: New York, NY, USA, 2017. [Google Scholar]
- Gómez-Carmona, P.; Fernández-Cuevas, I.; Sillero-Quintana, M.; Arnaiz-Lastras, J.; Navandar, A. Infrared Thermography Protocol on Reducing the Incidence of Soccer Injuries. J. Sport Rehabil. 2019, 29, 1222–1227. [Google Scholar] [CrossRef] [PubMed]
- Khaitin, V.; Bezuglov, E.; Lazarev, A.; Matveev, S.; Ivanova, O.; Maffulli, N.; Achkasov, E. Markers of muscle damage and strength performance in professional football (soccer) players during the competitive period. Ann. Transl. Med. 2021, 9, 113. [Google Scholar] [CrossRef] [PubMed]
- Di Battista, A.; Rhind, S.; Richards, D.; Hutchison, M. An investigation of plasma interleukin-6 in sport-related concussion. PLoS ONE 2020, 15, e0232053. [Google Scholar] [CrossRef]
- Peake, J.; Nosaka, K.; Suzuki, K. Characterization of inflammatory responses to eccentric exercise in humans. Exerc. Immunol. Rev. 2005, 11, 64–85. [Google Scholar] [PubMed]
- Hägglund, M.; Waldén, M.; Ekstrand, J. Previous injury as a risk factor for injury in elite football: A prospective study over two consecutive seasons. Br. J. Sports Med. 2006, 40, 767–772. [Google Scholar] [CrossRef] [Green Version]
- Fulton, F.; Wright, K.; Kelly, M.; Zebrosky, B.; Zanis, M.; Drvol, C.; Butler, B. Injury risk is altered by previous injury: A systematic review of the literature and presentation of causative neuromuscular factors. Int. J. Sports Phys. Ther. 2014, 9, 583–595. [Google Scholar]
- Bahr, R.; Holme, I. Risk factors for sports injuries—a methodological approach. Br. J. Sports Med. 2003, 37, 384–392. [Google Scholar] [CrossRef]
- Perri, E.; Simonelli, C.; Rossi, A.; Trecroci, A.; Alberti, G.; Iaia, M. Relationship Between Wellness Index and Internal Training Load in Soccer: Application of a Machine Learning Model. Int. J. Sports Physiol. Perform. 2021, 16, 695–703. [Google Scholar] [CrossRef] [PubMed]
- Clemente, F.; Mendes, B.; Palao, J. Seasonal player wellness and its longitudinal association with internal training load: Study inelite volleyball. J. Sports Med. Phys. Fit. 2019, 59, 345–351. [Google Scholar] [CrossRef] [PubMed]
- Gastin, P.; Meyer, D.; Robinson, D. Perceptions of wellness to monitor adaptive responses to training and competition in elite Australian football. J. Strength Cond. Res. 2013, 27, 2518–2526. [Google Scholar] [CrossRef] [PubMed]
- Gallo, T.; Cormack, S.; Gabbett, T.; Lorenzen, C. Pre-training perceived wellness impacts training output in Australian football players. J. Sports Sci. 2016, 34, 1445–1451. [Google Scholar] [CrossRef]
- Hooper, S.; Mackinnon, L. Monitoring overtraining in athletes. Recommendations. Sports Med. 1995, 50, 321–327. [Google Scholar] [CrossRef]
- McLean, B.; Coutts, A.; Kelly, V.; McGuigan, M.; Cormack, S. Neuromuscular, endocrine, and perceptual fatigue responses duringb different length between-match microcycles in professional rugby league players. Int. J. Sports Physiol. Perform. 2010, 5, 367–383. [Google Scholar] [CrossRef] [Green Version]
- Raglin, J.; Morgan, W. Development of a scale for use in monitoring training-induced distress in athletes. Int. J. Sports Med. 1994, 15, 84–88. [Google Scholar] [CrossRef]
- Martin, D.; Andersen, M.; Gates, W. Using Profile of Mood States (POMS) to Monitor High-Intensity Training in Cyclists: Group versus Case Studies. Sport Psychol. 2000, 14, 138–156. [Google Scholar] [CrossRef]
- Rushall, B. A tool for measuring stress tolerance in elite athletes. J. Appl. Sport Physiol. 1990, 2, 51–66. [Google Scholar] [CrossRef]
- Kentta, G.; Hassmen, P. Overtraining and recovery. A conceptual model. Sport Med. 1998, 26, 1–16. [Google Scholar] [CrossRef]
- Coutts, A.; Reaburn, P. Monitoring changes in rugby league players’ perceived stress and recovery during intensified training. Percept. Mot. Ski. 2008, 106, 904–916. [Google Scholar] [CrossRef]
- Santos-Gago, J.; Ramos-Merino, M.; Vallarades-Rodriguez, S.; Álvarez Sabucedo, L.; Fernández-Iglesias, M.; García-Soidán, J. An investigation of plasma interleukin-6 in sport-related concussion. Electronics 2019, 8, 1257. [Google Scholar] [CrossRef] [Green Version]
- Rossi, A.; Pedreschi, D.; Clifton, D.; Morelli, D. Error Estimation of Ultra-Short Heart Rate Variability Parameters: Effect of Missing Data Caused by Motion Artifacts. Sensors 2020, 20, 7122. [Google Scholar] [CrossRef]
- Morelli, D.; Rossi, A.; Cairo, M.; Clifton, D. Analysis of the Impact of Interpolation Methods of Missing RR-Intervals Caused by Motion Artifacts on HRV Features Estimations. Sensors 2019, 19, 3163. [Google Scholar] [CrossRef] [PubMed] [Green Version]
- Morelli, D.; Bartoloni, L.; Rossi, A.; DA, C. A computationally efficient algorithm to obtain an accurate and interpretable model of the effect of circadian rhythm on resting heart rate. Pysiological Meas. 2019, 40, 095001. [Google Scholar] [CrossRef]
- Jo, E.; Lewis, K.; Directo, D.; Kim, M.; Dolezal, B. Validation of Biofeedback Wearables for Photoplethysmographic Heart Rate Tracking. J. Sport Med. 2016, 15, 540. [Google Scholar]
- Morelli, D.; Rossi, A.; Bartoloni, L.; Cairo, M.; Clifton, D. SDNN24 Estimation from Semi-Continuous HR Measures. Sensors 2021, 21, 1463. [Google Scholar] [CrossRef]
- Mayne, R.; Bleakley, C.; Matthews, M. Use of monitoring technology and injury incidence among recreational runners: A cross-sectional study. BMC Sports Sci. Med. Rehabil. 2021, 28, 116. [Google Scholar] [CrossRef]
- Colby, M.; Dawson, B.; Peeling, P. Improvement of prediction of noncontact injury in elite Australian footballers with repeated exposure to established high-risk workload scenarios. Int. J. Sports Physiol. Perform. 2018, 13, 1130–1135. [Google Scholar] [CrossRef]
- Van Eetvelde, H.; Mendonça, L.; Ley, C.; Seil, R.; Tischer, T. Machine learning methods in sport injury prediction and prevention: A systematic review. J. Exp. Orthop. 2021, 8, 27. [Google Scholar] [CrossRef] [PubMed]
- Pappalardo, L.; Guerrini, L.; Rossi, A.; Cintia, P. Explainable Injury Forecasting in Soccer via Multivariate Time Series and Convolutional Neural Networks. Barça Sports Anal. Summit 2019. [Google Scholar] [CrossRef]
- James, G.; Witten, D.; Hastie, T.; Tibshirani, R. An Introduction to Statistical Learning; Springer: New York, NY, USA, 2013. [Google Scholar]
- Pappalardo, L.; Cintia, P.; Ferragina, P.; Massucco, E.; Pedreschi, D.; Giannotti, F. PlayeRank: Data-driven performance evaluation and player ranking in soccer via a machine learning approach. BMC Sports Sci. Med. Rehabil. 2018, 10, 1–27. [Google Scholar] [CrossRef] [Green Version]
- Sałabun, W.; Shekhovtsov, A.; Pamučar, D.; Wątróbski, D.; Kizielewicz, B.; Więckowski, J.; Bozanić, D.; Urbaniak, K.; Nyczaj, B. A Fuzzy Inference System for Players Evaluation in Multi-Player Sports: The Football Study Case. Symmetry 2019, 12, 2029. [Google Scholar] [CrossRef]
- Więckowski, J.; Kołodziejczyk, J. Swimming progression evaluation by assessment model based on the COMET method. Procedia Comput. Sci. 2020, 176, 3514–3523. [Google Scholar] [CrossRef]
- Więckowski, J.; Dobryakova, L. A fuzzy assessment model for freestyle swimmers—A comparative analysis of the MCDA methods. Procedia Comput. Sci. 2021, 192, 4148–4157. [Google Scholar] [CrossRef]


| Actual Classes | |||
| Injury | No-Injury | ||
| Predicted classes | Injury | TP | FP |
| No-Injury | FN | TN | |
Publisher’s Note: MDPI stays neutral with regard to jurisdictional claims in published maps and institutional affiliations. |
© 2021 by the authors. Licensee MDPI, Basel, Switzerland. This article is an open access article distributed under the terms and conditions of the Creative Commons Attribution (CC BY) license (https://creativecommons.org/licenses/by/4.0/).
Share and Cite
Rossi, A.; Pappalardo, L.; Cintia, P. A Narrative Review for a Machine Learning Application in Sports: An Example Based on Injury Forecasting in Soccer. Sports 2022, 10, 5. https://doi.org/10.3390/sports10010005
Rossi A, Pappalardo L, Cintia P. A Narrative Review for a Machine Learning Application in Sports: An Example Based on Injury Forecasting in Soccer. Sports. 2022; 10(1):5. https://doi.org/10.3390/sports10010005
Chicago/Turabian StyleRossi, Alessio, Luca Pappalardo, and Paolo Cintia. 2022. "A Narrative Review for a Machine Learning Application in Sports: An Example Based on Injury Forecasting in Soccer" Sports 10, no. 1: 5. https://doi.org/10.3390/sports10010005