Article

Ikaros Regulates microRNA Networks in Acute Lymphoblastic Leukemia

1
Department of Biomedical and Health Sciences, University of Vermont, Burlington, VT 05405, USA
2
Department of Microbiology and Molecular Genetics, University of Vermont, Burlington, VT 05405, USA
3
Cellular Molecular Biomedical Sciences Program, University of Vermont, Burlington, VT 05405, USA
4
Department of Laboratory Medicine, University of California, San Francisco, CA 94143, USA
5
Helen Diller Family Comprehensive Cancer Center, University of California San Francisco, San Francisco, CA 94143, USA
6
The University of Vermont Cancer Center, Burlington, VT 05405, USA
*
Authors to whom correspondence should be addressed.
Epigenomes 2022, 6(4), 37; https://doi.org/10.3390/epigenomes6040037
Submission received: 16 September 2022 / Revised: 13 October 2022 / Accepted: 14 October 2022 / Published: 19 October 2022
(This article belongs to the Special Issue Epigenetics in Hematologic Malignancies)

Abstract

:
The hematopoietic transcription factor Ikaros (IKZF1) regulates normal B cell development and functions as a tumor suppressor in precursor B cell acute lymphoblastic leukemia (B-ALL). MicroRNAs (miRNAs) are small regulatory RNAs that through post-transcriptional gene regulation play critical roles in intracellular processes including cell growth in cancer. However, the role of Ikaros in the regulation of miRNA expression in developing B cells is unknown. In this study, we examined the Ikaros-regulated miRNA targets using human IKZF1-mutated Ph+ B-ALL cell lines. Inducible expression of wild-type Ikaros (the Ik1 isoform) caused B-ALL growth arrest and exit from the cell cycle. Global miRNA expression analysis revealed a total of 31 miRNAs regulated by IK1, and ChIP-seq analysis showed that Ikaros bound to several Ik1-responsive miRNA genes. Examination of the prognostic significance of miRNA expression in B-ALL indicate that the IK1-regulated miRNAs hsa-miR-26b, hsa-miR-130b and hsa-miR-4649 are significantly associated with outcome in B-ALL. Our findings establish a potential regulatory circuit between the tumor-suppressor Ikaros and the oncogenic miRNA networks in IKZF1-mutated B-ALL. These results indicate that Ikaros regulates the expression of a subset of miRNAs, of which several may contribute to B-ALL growth.

1. Introduction

Acute lymphoblastic leukemia (ALL) is a leading cause of childhood cancer-related mortality and is also a significant health challenge to adults [1]. The majority of childhood ALL cases are of the precursor B-cell subtype of acute leukemia (B-ALL) and can be characterized by recurrent genomic lesions. The Philadelphia chromosome (Ph+) results from the t(9;22)(q34;q11) translocation involving the BCR and ABL1 genes (referred to as Ph+ B-ALL) which leads to constitutive activation of the ABL1 kinase [2,3]. Significant improvements in the diagnosis and treatment for Ph+ B-ALL have been made in the past few decades and have resulted in a survival rate of >90% [4]. For example, the combination of chemotherapy with tyrosine kinase inhibitors (TKIs) have proven effective for the treatment of Ph+ B-ALL [3,5]. However, despite the improved outcomes observed in childhood B-ALL cases, up to 20% of patients still relapse [4,6]. In addition, patients older than 40 years old have not greatly benefited from current treatments and their 5-year overall survival remains lower than 45% [7,8]. Improved understanding of the disease mechanisms associated with poor outcome B-ALL subtypes will enable the identification of new biomarkers and molecular targets for drug development.
Genome sequencing analysis has identified cooperating gene mutations in B-ALL, many encoding for hematopoietic transcription factors (TFs) known to be critical regulators of B-cell development [9,10,11,12]. In Ph+ B-ALL patients, this includes mutations in IKZF1 (encoding Ikaros) (80%), PAX5 (51%), and EBF1 (13%) [13,14]. Of the genes mentioned, a role for the IKZF1 gene as a tumor suppressor has been established in both pediatric and adult leukemia, where a number of high-risk B-ALL subtypes harbor IKZF1 deletions or mutations [12,15,16]. Greater than 80% of Ph+ B-ALL cases exhibit mutations or deletions in the IKZF1 gene [14]. In addition, IKZF1 mutations are common in the high-risk B-ALL subtype termed “Ph-like”, which has a gene expression profile similar to Ph+ B-ALL [17]. In comparison to the full-length Ikaros molecule (termed the Ik1 isoform), intragenic deletions of the IKZF1 exons 4 to 7 encoding the DNA-binding zinc fingers are common in these cases and result in the expression of a dominant negative Ikaros isoform (termed Ik6) [14,18,19]. Inactivating mutations of IKZF1 are strongly associated with a poor prognosis in different subtypes of childhood B-ALL [12]. Despite an established tumor suppressor role for Ikaros, there is still a significant gap in our understanding of the molecular mechanisms of precursor B cell oncogenesis and the molecular targets of Ikaros in B-ALL.
MicroRNAs (miRNAs) are small endogenous RNAs that regulate development and hematopoiesis via post-transcriptional gene silencing [20]. miRNAs inhibit the translation or induce mRNA degradation of select target mRNAs to modulate diverse cellular processes, including cell growth, apoptosis, differentiation and proliferation [21,22]. Humans are known to express thousands of different miRNAs. Accumulating evidence indicates that miRNAs are implicated in the pathogenesis and progression of cancer. For example, different miRNAs can activate or suppress oncogenic phenotypes by inhibiting the expression of tumor suppressor genes or oncogenes, respectively [23,24]. Commonly, oncogenic miRNAs (oncomiRs) are overexpressed in cancers while tumor-suppressive miRNAs (tsmiRs) are lowly expressed. miRNAs have additionally been identified as candidates for diagnostic and prognostic biomarkers, as well as predictors of drug responses in cancer [25,26]. Importantly, miRNAs represent candidate clinical biomarkers that may act as indicators of relapse for B-ALL [26,27,28]. However, there have been limited number of such studies and new clinically relevant biomarkers are still needed.
Here, we investigated a role of Ikaros in the regulation of miRNA expression in B-ALL cells. We used IKZF1-mutated B-ALL cells with inducible expression of wild-type Ikaros to identify miRNAs that change expression with Ikaros-induced growth arrest. We determined the binding of Ikaros to the genomic regions of differentially regulated miRNA genes, as well as the prognostic significance of Ikaros-regulated miRNA expression in a patient cohort of B-ALL. Our results indicate that Ikaros regulates the expression of a subset of miRNAs, providing new insight into potential B-ALL growth mechanisms.

2. Results

2.1. Inducible Expression of IK1 Results in Growth Arrest in IKZF1-Mutated B-ALL Cells

Mutations in IKZF1 are charateristic of Ph+ ALL and are associated with poor prognosis [12,14]. MXP5 and PDX2 are human Ph+ B-ALL cell lines that harbor a heterozygous intragenic deletion in the IKZF1 gene resulting in the expression of the dominant negative Ik6 isoform of Ikaros [14,29]. Our prior studies in PDX2 cells had showed that ectopic expression of wild-type Ikaros (IK1) inhibited cell growth [29]. To determine the impact of IK1 expression on the growth in MXP5 cells, we generated stable transduced MXP5 cells that express doxycycline (DOX) inducible IK1-IRES-GFP (IK1) or an empty vector IRES-GFP control (CON) (Figure 1A). MXP5 cells expressing IK1 grew slower over a 12-day period compared to control cells (Figure 1B), and IK1 induction arrested MXP5 cells in the G1 phase of the cell cycle 48 h after induction (Figure 1C). Thus, similar to PDX2 cells, IK1-induction results in a growth arrest in IKZF1-mutated MXP5 cells and triggers exit from the cell cycle.

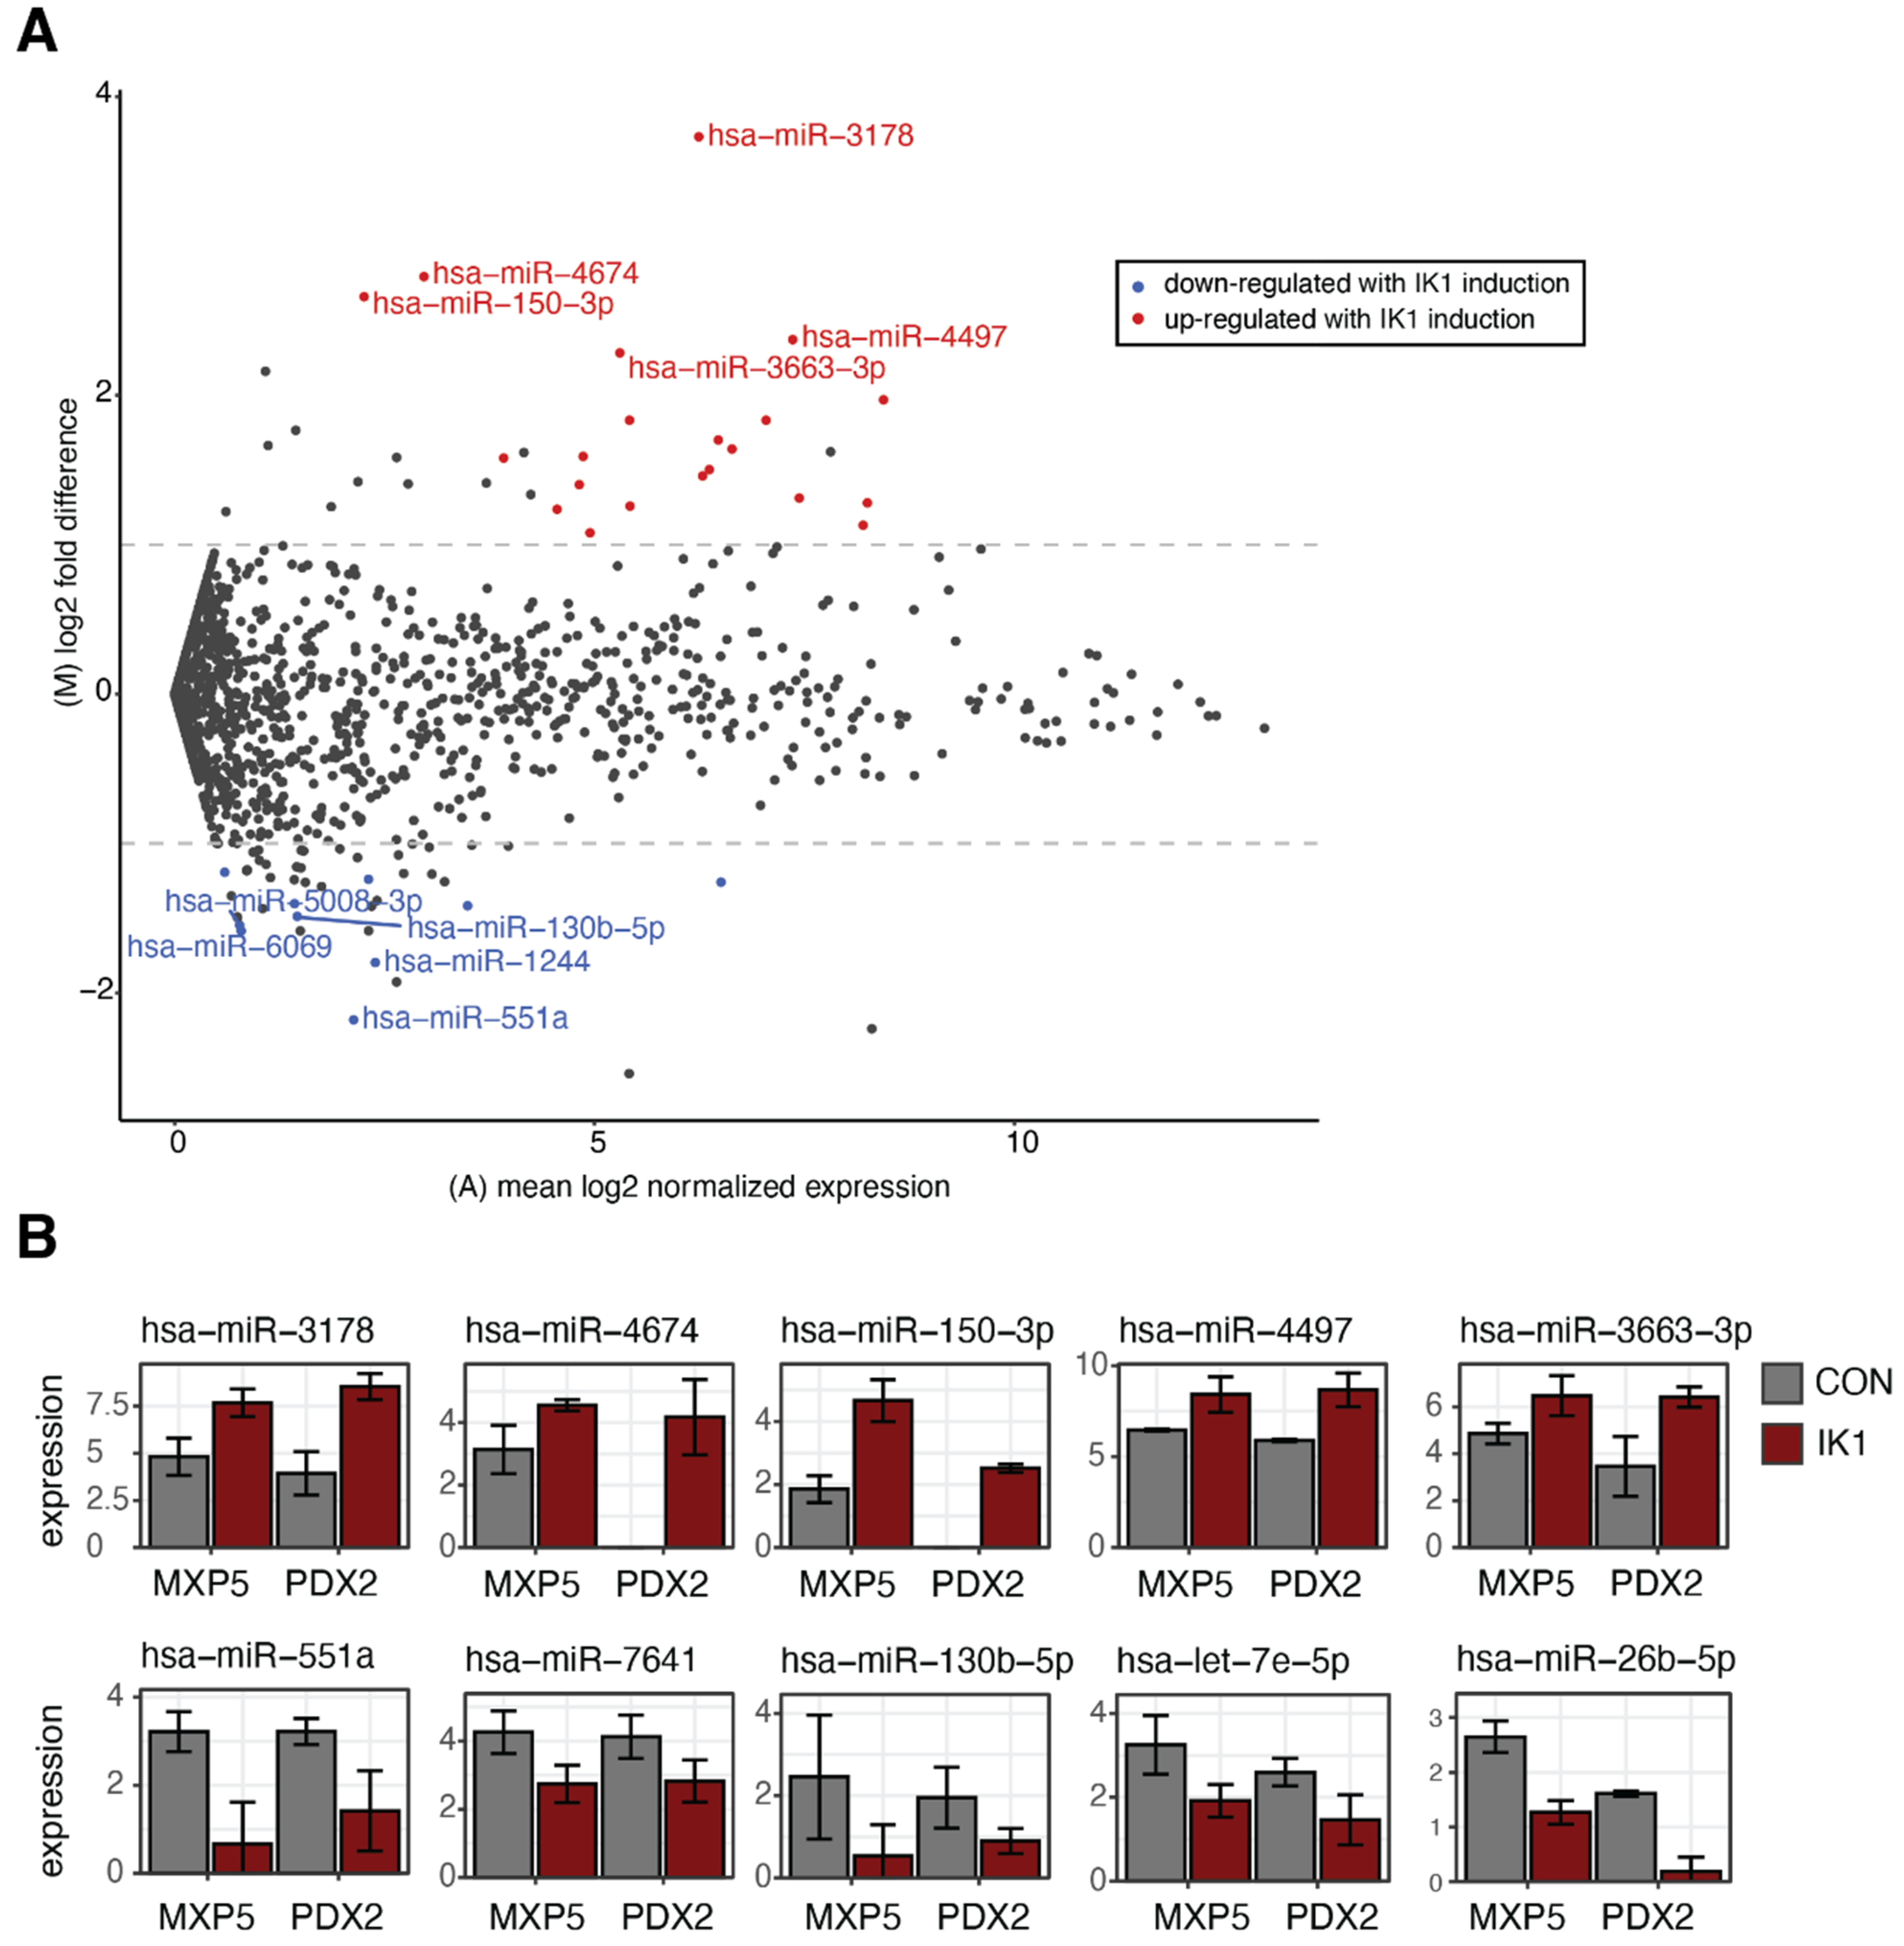
2.2. Identification of IK1-Regulated miRNAs

Because miRNAs are known to regulate cell growth in cancer, we investigated the changes in miRNA expression patterns associated with IK1-induced growth arrest in both MXP5 and PDX2 cells. We conducted miRNA expression profiling using microarrays that contain over 2500 human miRNAs, and found that 821 miRNAs were expressed above background in both B-ALL cell lines (Table S1). Differential expression analysis comparing 24 h of DOX induction in control and IK1-induced B-ALL cells identified a total of 31 differentially expressed miRNAs (DE miRNAs) (Figure 2A, Table S2). There were 21 upregulated and 10 downregulated DE miRNAs with IK1 expression compared to control. Among the identified IK1-regulated miRNAs, 5/31 unique miRNAs have been previously described as leukemia miRNAs based on their target genes disease assocations [30]. Interestingly, several IK1-upregulated DE miRNAs have been classified as ‘oncosuppressive’, including hsa-miR-150-3p [31,32], hsa-miR-3663 [33], and hsa-miR-4497 [34] (Figure 2B). We also found that many of the DE miRNAs that were downregulated with IK1 induction have known oncogenic roles or are known as “oncomiRs”, including hsa-let-7e [35,36,37], hsa-miR-551a [38], hsa-miR-7641 [39,40], and hsa-miR-130b [41,42]. These results indicate that IK1-induced growth suppression is coupled with changes in the expression of miRNAs with both oncogenic and tumor suppressive potential.

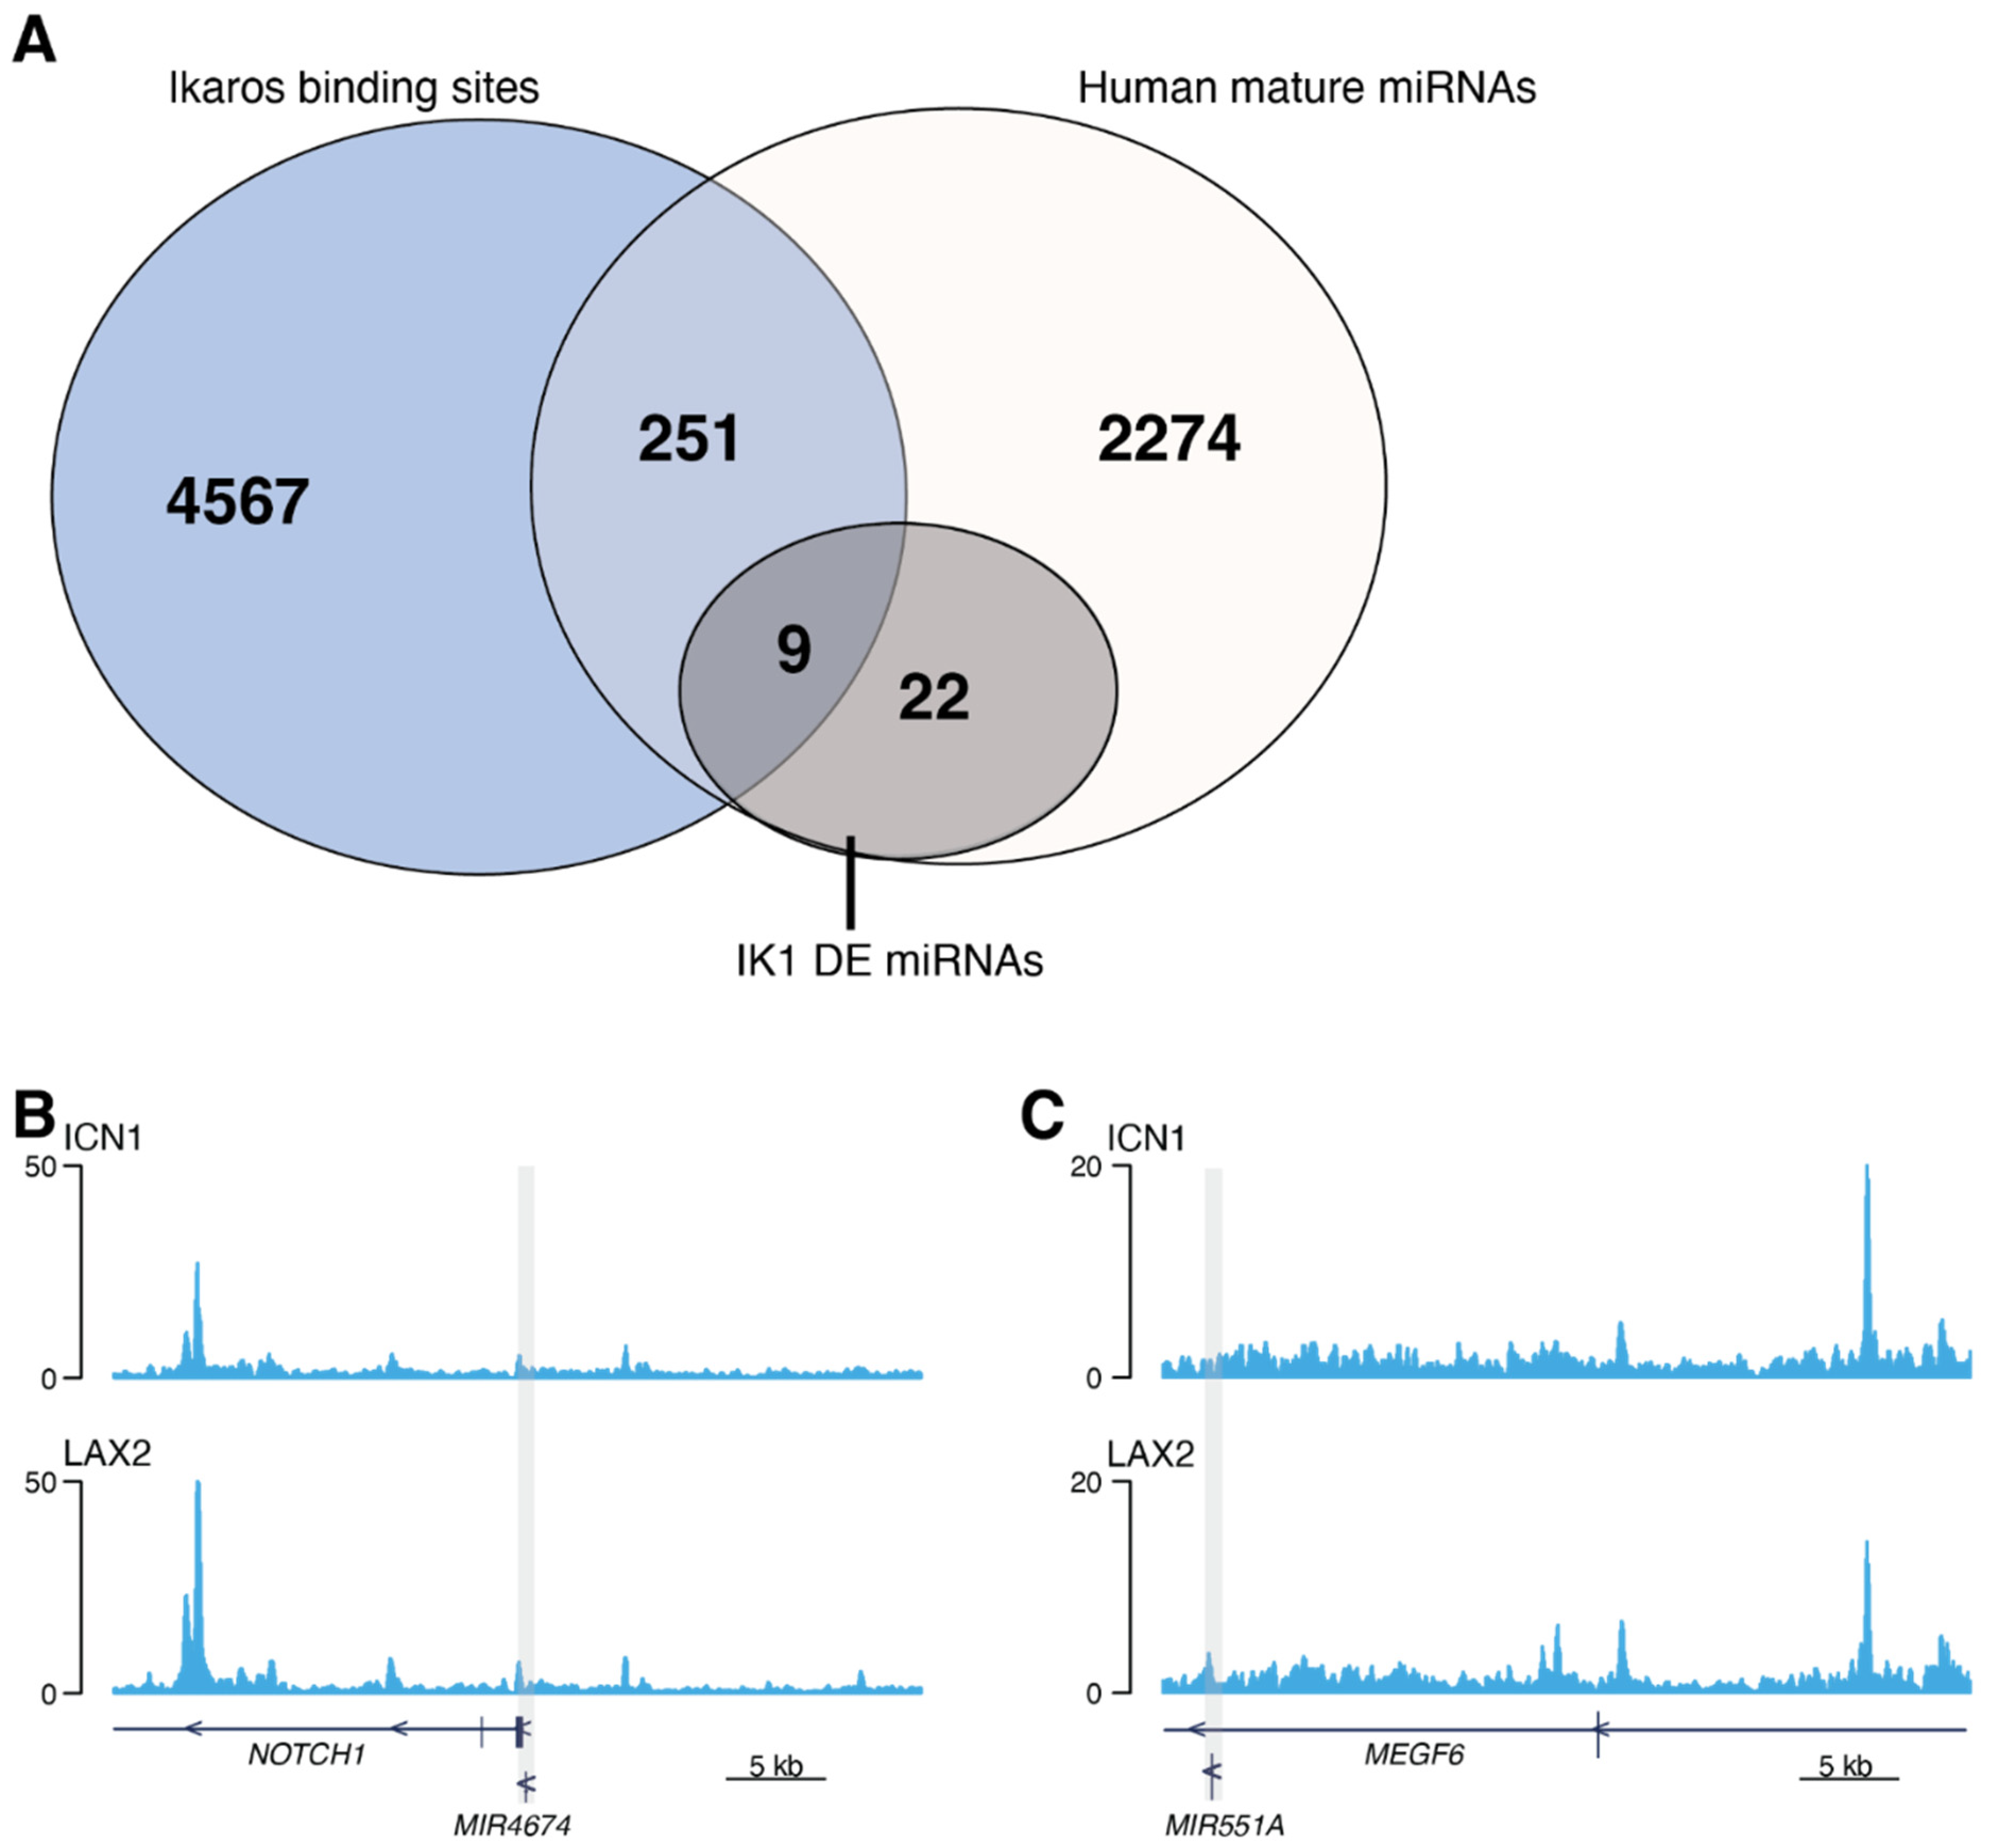
2.3. Ikaros Binds to miRNA Gene Regions in B-ALL

We next examined the occupancy of Ikaros at chromatin regions adjacent to the genes encoding primary miRNAs. We analyzed Ikaros ChIP-seq data from two independent human B-ALL cell lines with wild-type Ikaros expression [29], and annotated genes with transcription start sites (TSSs) within 50 kb of high-confidence Ikaros binding sites (4827 total sites). We found Ikaros binding within 50 kb of 260 unique genes encoding miRNAs (Figure 3A). Among the 31 miRNA that were differentially expressed with IK1 induction, nine were bound by Ikaros (29%) (Table S3). This included hsa-miR-4674 (encoded by MIR4674) upregulated by IK1, and hsa-miR-551a (encoded by MIR551A) down-regulated by IK1 (Figure 3B,C). Together, these results suggest that Ikaros has the potential to directly regulate the expression of a subset of miRNA genes in B-ALL cells.

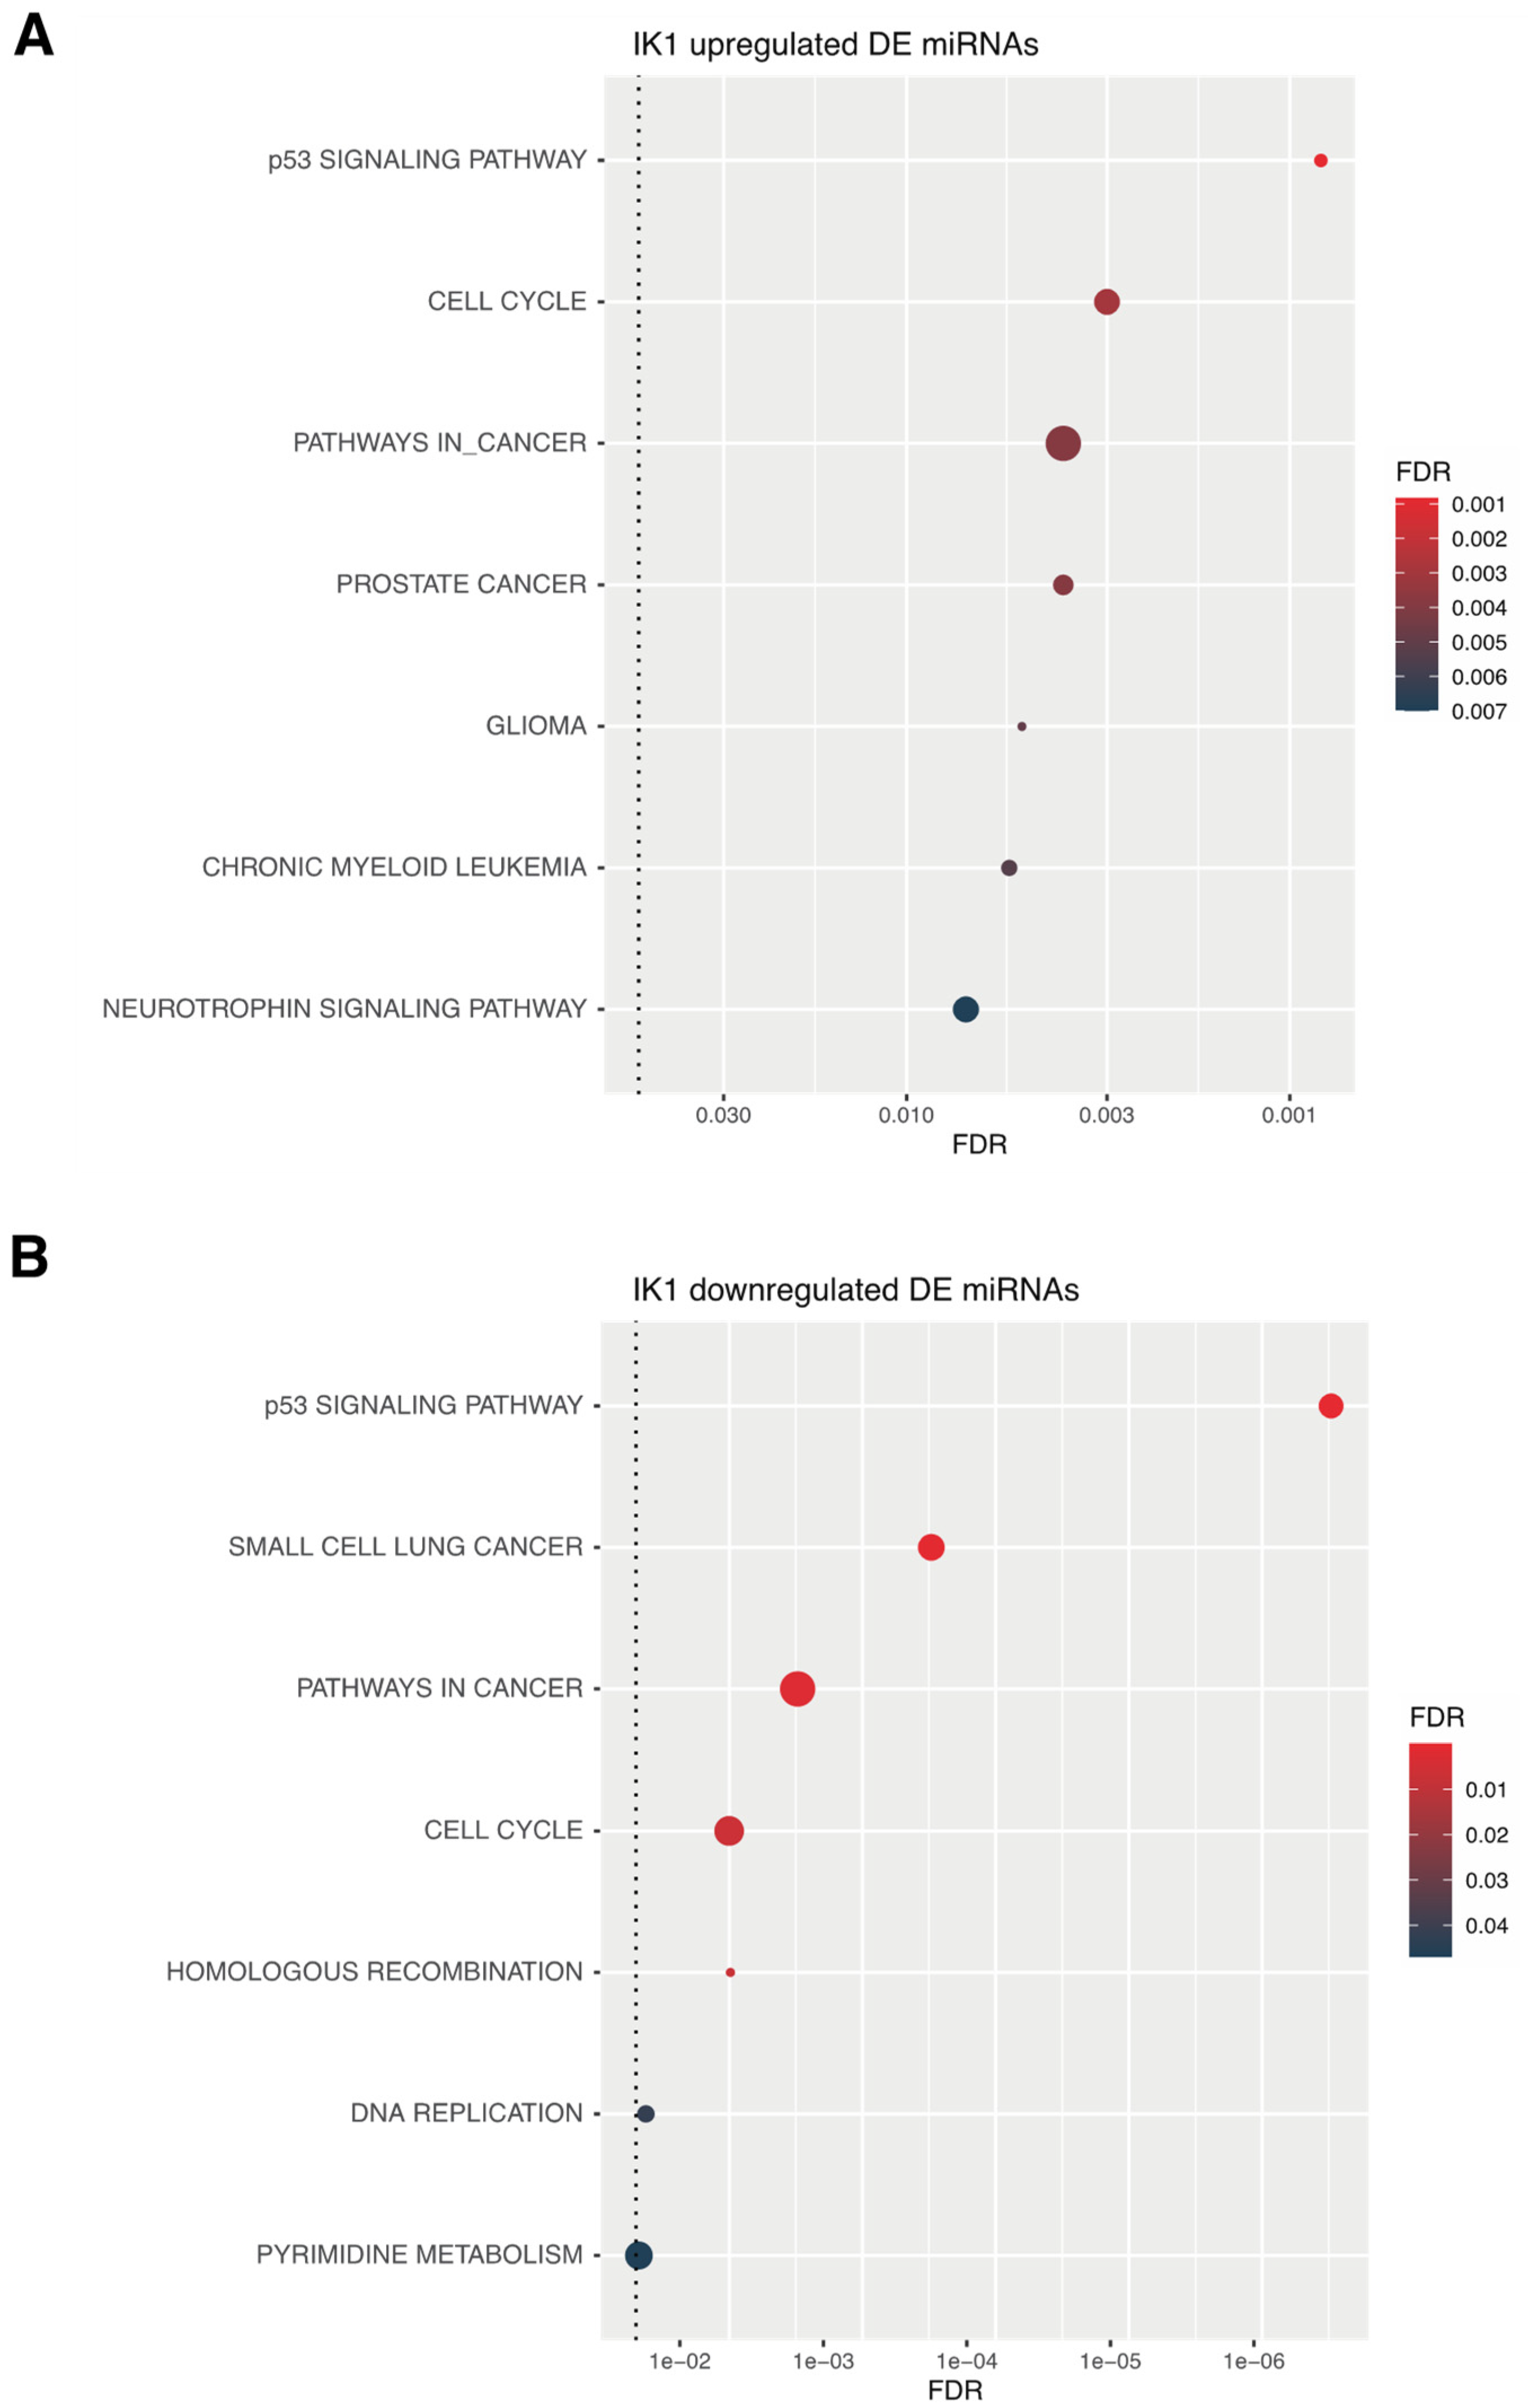
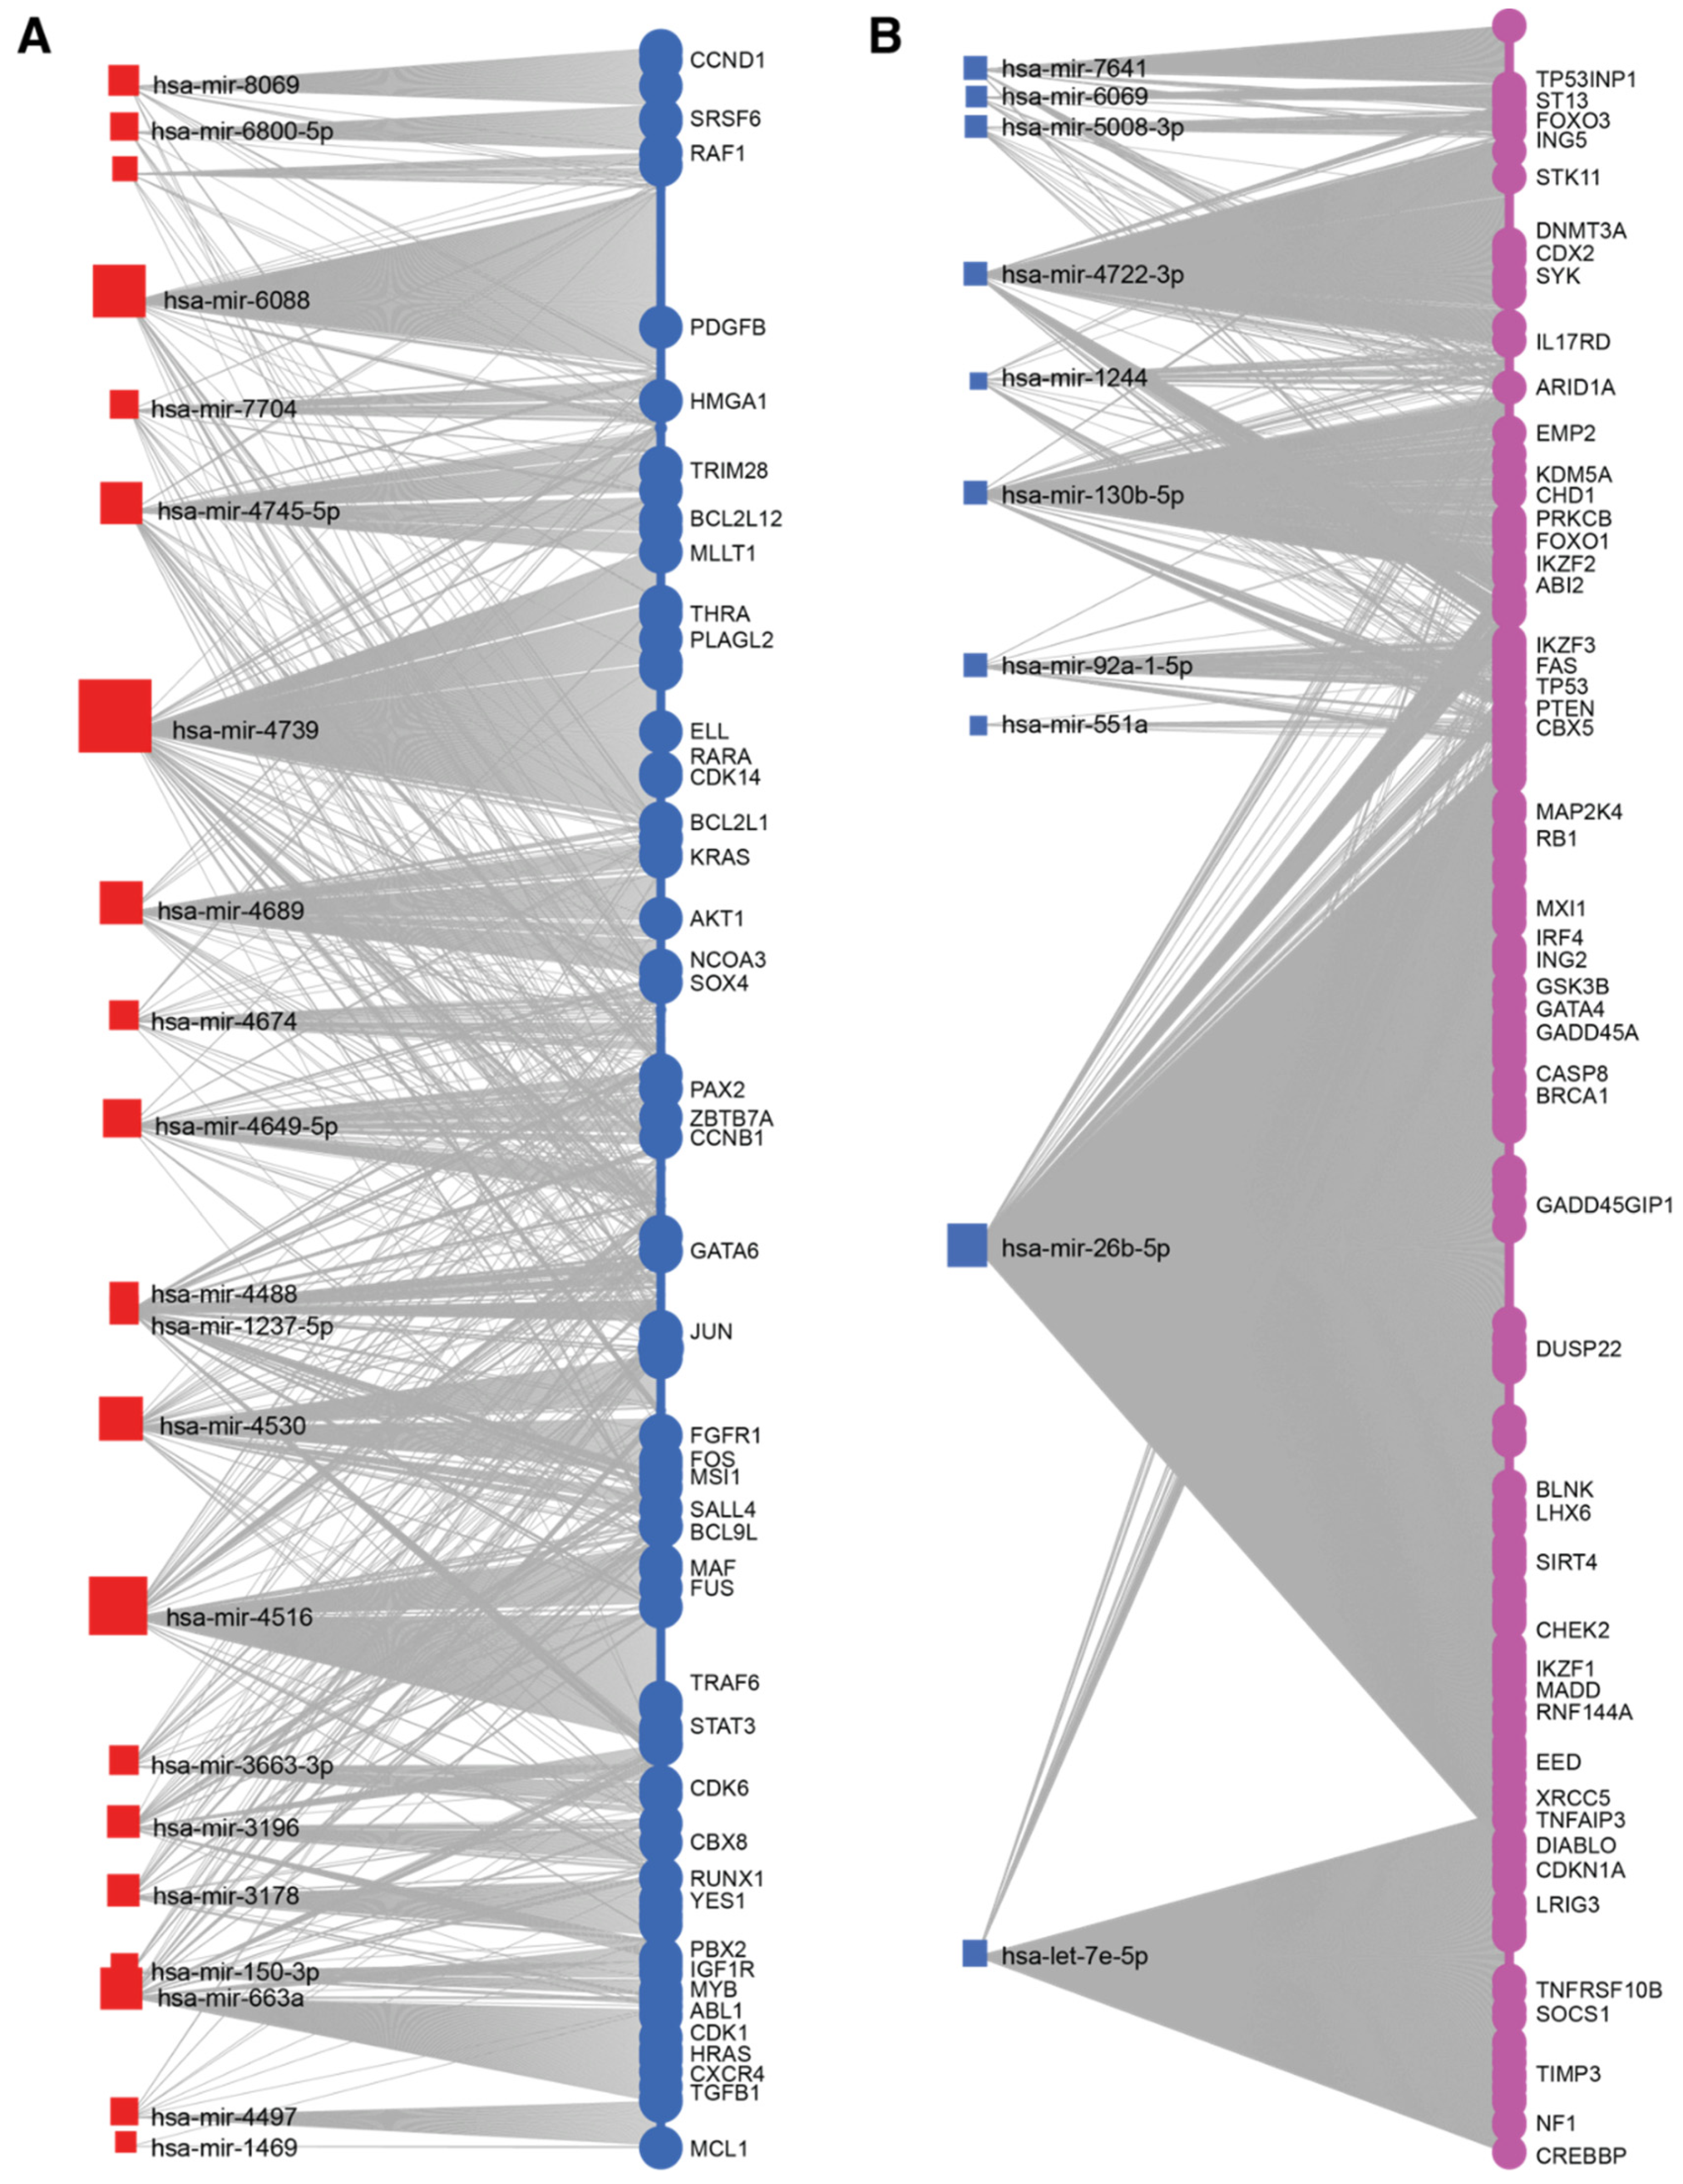
2.4. miRNA-mRNA Regulatory Networks of IK1-Regulated miRNAs

Complex networks of miRNA and their target genes regulate diverse biological processes. An individual miRNA can have many different mRNA targets, and likewise, a single mRNA can be regulated by multiple different miRNAs. To determine the putative target genes of IK1-regulated miRNAs, we collected the experimentally validated mRNA targets of both up- and down-regulated IK1 DE miRNAs contained in the miRTarBase miRNA-target interactions database [43]. This revealed a total of 1542 and 3290 putative target genes for the 21 upregulated and 10 down-regulated miRNAs, respectively (Table S4). Pathway analysis revealed the significantly enriched KEGG pathways for these two groups of target genes (Table S5). The combined set of target genes for the group of 21 IK1-upregulated DE miRNAs were significantly enriched (false discovery rate (FDR) < 0.05) in biological processes including cell cycle, the p53 signaling pathway and pathways in cancer (Figure 4A). As the biological phenotype in our experimental setup was cell cycle arrest upon IK1 induction (Figure 1), we evaluated the target genes of the IK1 up-regulated miRNAs contained within the KEGG cell cycle geneset. In agreement with the observed growth arrest, we found several positive regulators of cell cycle among the targets of IK1-upregulated miRs (e.g., CCDN1, CCDN2 and CDK6, targeted by hsa-miR-8069, hsa-miR-4516 and hsa-miR-3663-3p, respectively). Hence, Ikaros induced expression of miRNAs that regulate the expression of genes promoting cell cycle progression.
Interestingly, the targets of the IK1-downregulated miRNAs were also enriched in the p53 signaling pathway, cell cycle, and pathways in cancer (Figure 4B). The common pathways between up- and down-regulated IK1 DE miRNA targets exemplified how several cell cycle and cancer-associated genes can be targeted by multiple different miRNAs. Therefore, we compared the target genes and filtered the data to obtain only the unique non-overlapping target genes of either up- and down-regulated DE miRNAs (1081 and 2829 genes, respectively) (Table S6). Among the non-overlapping target genes for IK1 up-regulated miRNAs, we found several known oncogenes, such as ABL1, HRAS, KRAS, and MYB. In fact, comparing with a curated list of oncogenes, we found that 89 of the target genes for IK1 up-regulated miRNAs were known oncogenes (Figure 5A and Table S7). Similarly, comparing with a list of identified tumor suppressor genes, we found that 219 of the target genes for IK1 down-regulated miRNAs were tumor suppressor genes (Figure 5B and Table S7). The non-overlapping targets of IK1 down-regulated miRNAs included the tumor suppressors RB1, NF1, BLNK and GADD45A, as well as IKZF1 and the family member IKZF2 (Figure 5B). Furthermore, the non-overlapping target genes of IK1 down-regulated miRNAs included genes associated with apoptosis and programmed cell death (i.e., CASP3, CASP4, CASP7, CASP8, CASP9) (Table S6), suggesting IK1 induction leads to relief of miRNA-repression of these genes. Taken together, we found that Ikaros regulates the expression of mutliple miRNAs that are know to target several critical regulators of oncogenic cell growth and tumor suppressor functions.

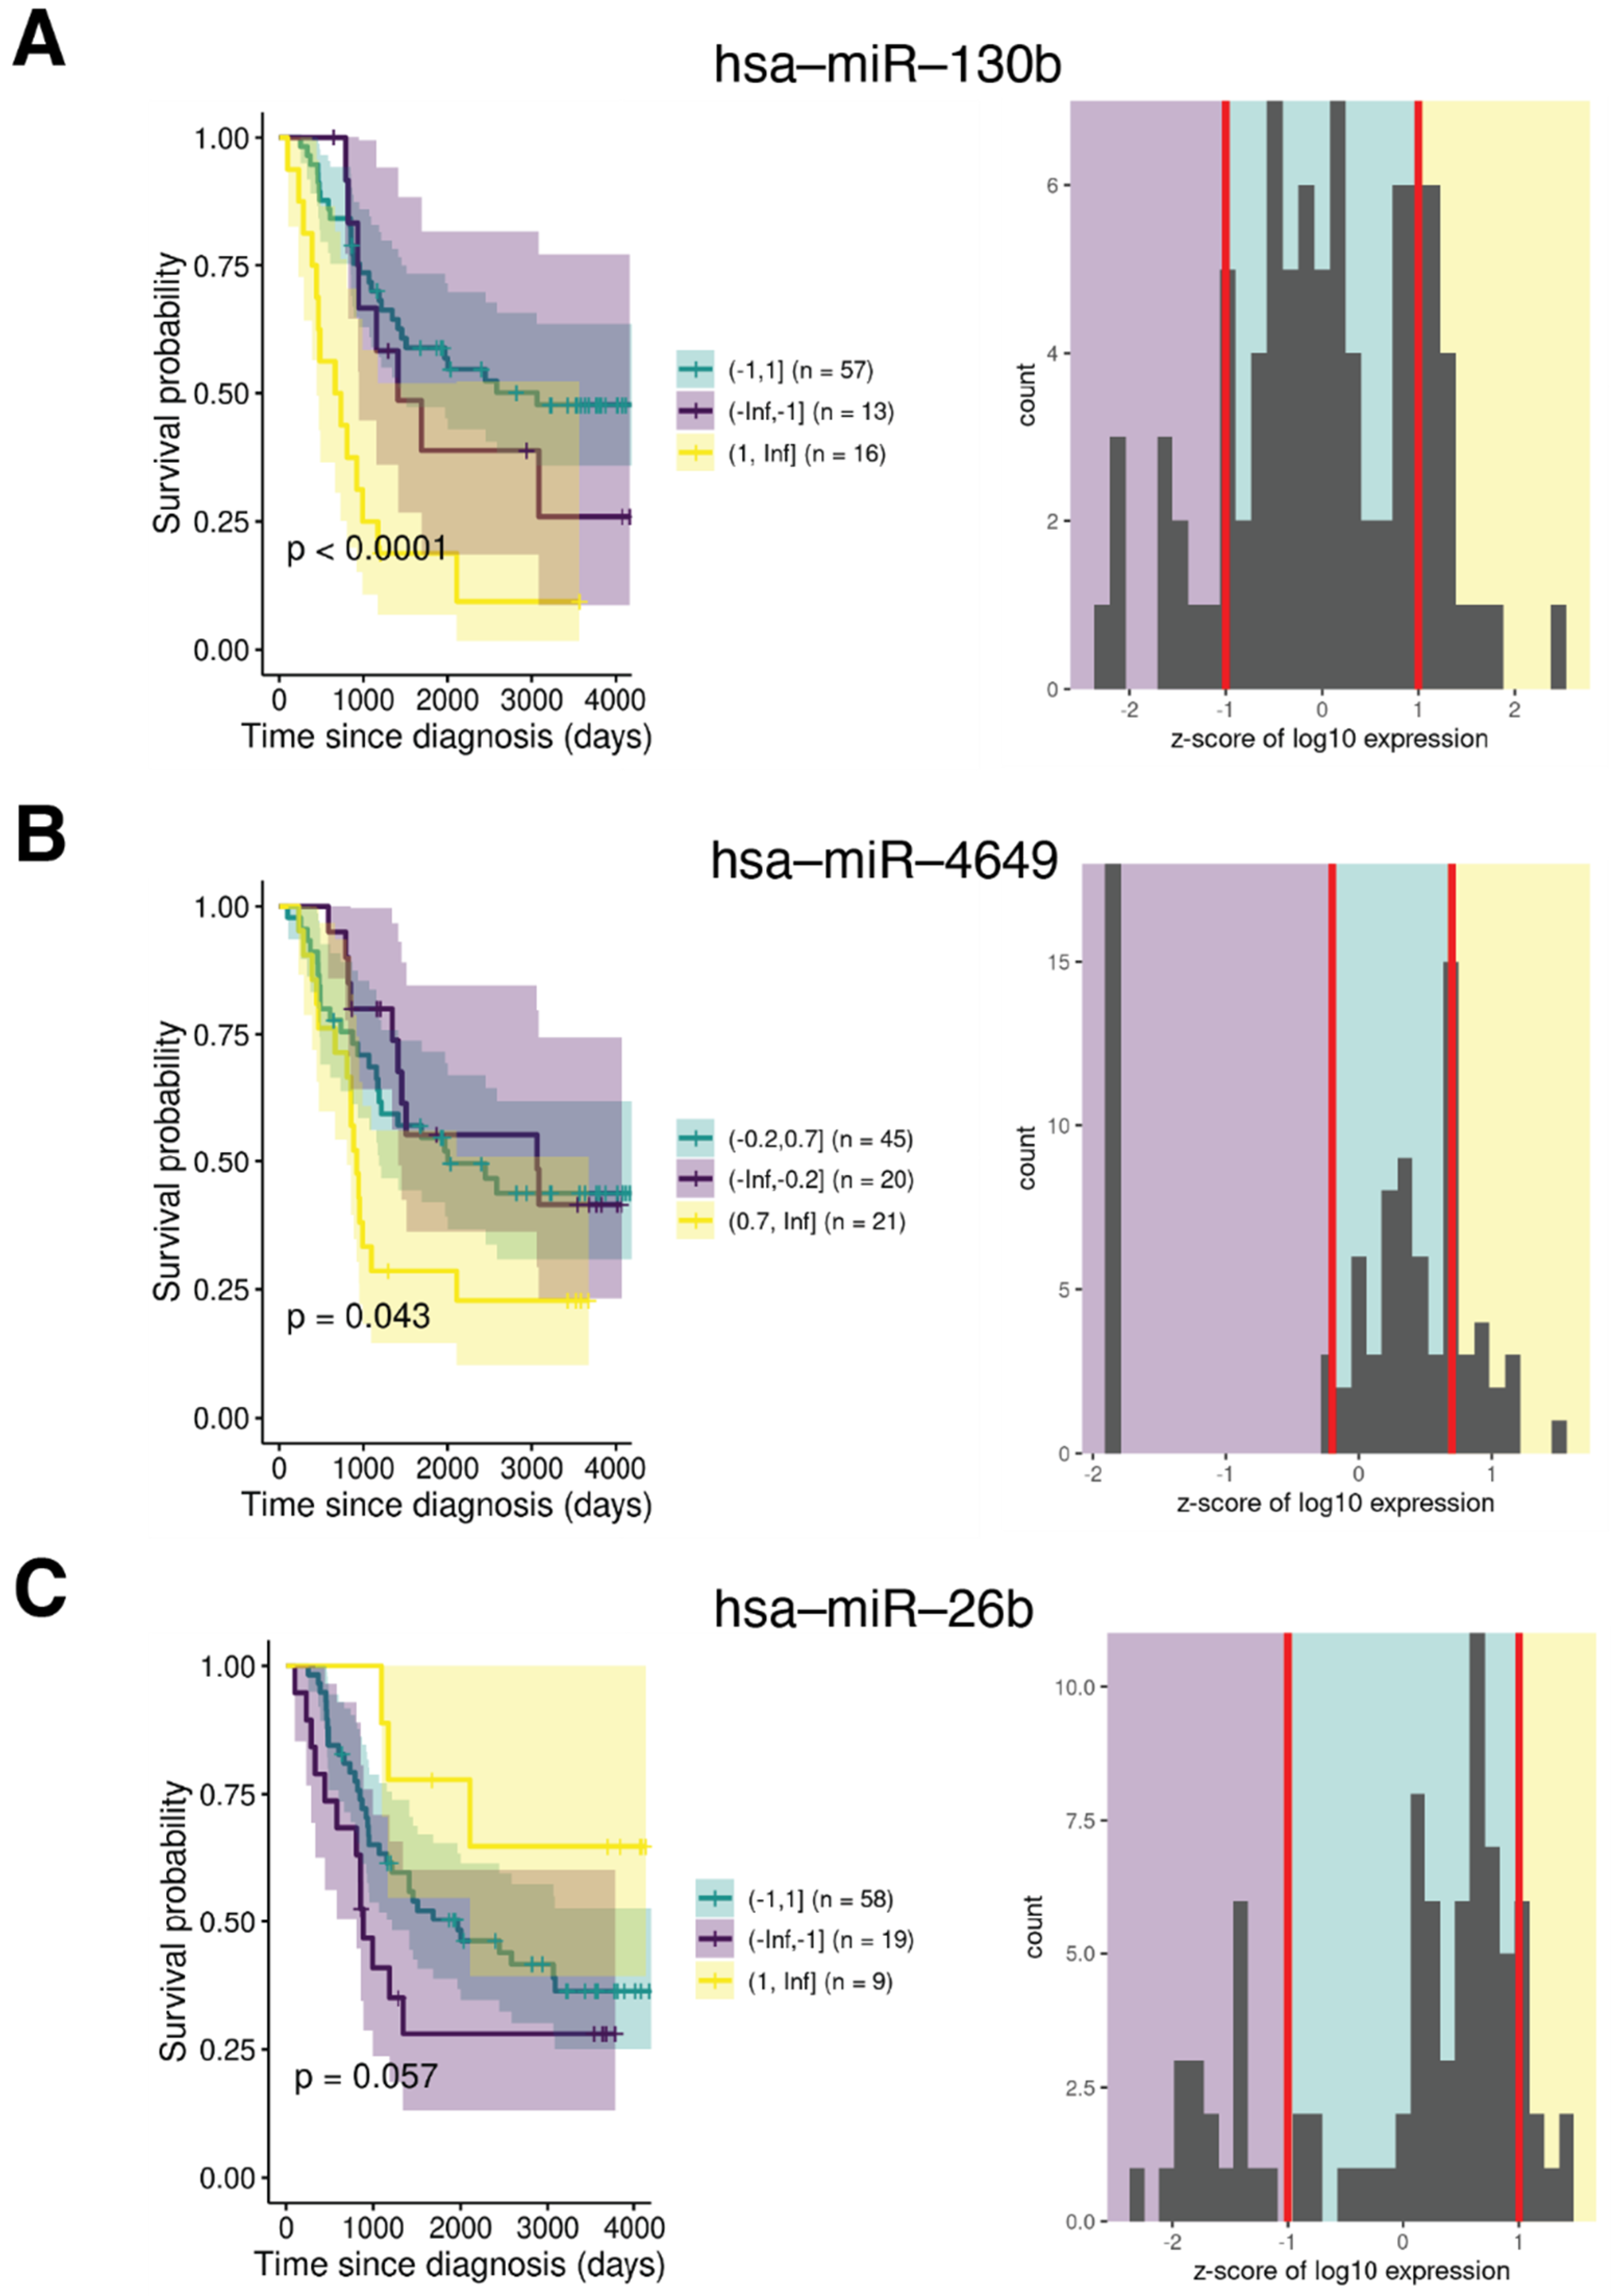
2.5. IK1-Regulated miRNA Expression Correlates with Overall Survival

We next evaluated the expression of the IK1-regulated miRNA genes as prognostic indicators in B-ALL. Using miRNA-seq data from a cohort of 86 primary bone marrow B-ALL specimens from the Therapeutically Applicable Research to Generate Effective Therapies (TARGET) project, we performed multivariate Cox analysis to evaluate the prognostic significance of the expression of IK1 DE miRNAs on overall survival (OS) [44]. Of the 31 total Ikaros-regulated DE miRNAs, the expression of 3 DE miRNAs showed significant correlation with OS in the TARGET dataset (Figure 6). The most significant miRNA (p < 0.0001) hsa-miR-130b was downregulated by IK1, and high expression of hsa-miR-130b correlated with overall worse outcome in this patient cohort of B-ALL (Figure 6A). In addition, the expression of another IK1-downregulated miRNA hsa-miR-26b and one IK1-upregulated miRNA hsa-miR-4649 were significantly associated with OS (p-value = 0.057 and p < 0.05, respectively). Patients with higher expression of hsa-miR-26b expression had a more favorable outcome, whereas patients with a higher expression of hsa-miR-4649 had a worse outcome in this B-ALL patient cohort (Figure 6B,C).

3. Materials and Methods

3.1. Cell Culture

Two IKZF1-mutated Ph+ B-ALL cell-lines (PDX2 and MXP5) were derived from previously described xenograft-expanded deidentified human B-ALL cells that were initially maintained in vitro on irradiated OP9 stroma cells [29,45,46,47]. These cells have adapted to in vitro growth without OP9 stroma cell support, and were maintained at 37 °C in humidified incubator with 5% CO2 in minimum essential medium alpha (MEMα) GlutaMAX (Gibco, Thermo Fisher Scientific, Waltham, MA, USA), supplemented with 20% FBS (Gibco, Thermo Fisher Scientific, Waltham, MA, USA).

3.2. Lentiviral Constructs and Transduction

Cloning and cell line generation was performed as described previously [29]. Briefly, full length Ikaros isoform (Ik1) with IRES-GFP and an empty vector IRES-GFP control were cloned into the TET-inducible expression vector pLVX-TRE3G-IRES (Takara Bio, San Jose, CA, USA) and transduced into B-ALL cells expressing TET activator pLVX-EF1a-Tet3G (Takara Bio, San Jose, CA, USA). Expression of wild-type IK1 and GFP control samples was induced with the addition of 1 ug/mL doxycycline, a TET analog.

3.3. Flow Cytometry and Sorting

GFP signal was monitored using LSR Fortessa (BD Bioscience, Franklin Lakes, NJ, USA). For cell cycle analysis, cells were permeabilized with Cytofix/Cytoperm kit (BD Bioscience, Franklin Lakes, NJ, USA), stained with DAPI and gated on GFP+. GFP+high cells were sorted using FACS Aria II (BD Bioscience, Franklin Lakes, NJ, USA). Data were analyzed using FlowJo and FACS Diva software.

3.4. Immunoblot Analysis

Protein was extracted from induced cells and Western blot was performed as described previously [29]. Blots were probed with an antibody raised against N-terminal of Ikaros (residues 1–80) [48] and α-tubulin (Biolegend, San Diego, CA, USA, cat #627902).

3.5. RNA Isolation

RNA was isolated using the Direct-zol RNA kit (Zymo Research, Irvine, CA, USA) following manufacturer’s instructions. RNA was then assessed for quality with the Agilent Bioanalyzer and quantified with the qubit fluorometer.

3.6. Microarray Data and Differential miRNA Expression Analysis

Purified RNA was used for hybridization on GeneChip™ miRNA 4.0 Arrays (ThermoFisher Scientific, Waltham, MA, USA) and processed as previously reported [49]. Briefly, raw CEL files were processed using the apt-probeset-summarize function within the Affymetrix Power Tools v1.18.0 (APT) software package (ThermoFisher Scientific, Waltham, MA, USA), and the Simplified Expression Analysis algorithm was used to summarize probesets and the Detectable Above BackGround (DABG) algorithm was used to assign p-values to probeset intensities. All annotation and library files for the miRNA v4.0 arrays were obtained from the manufacturer. Following probeset summarization, the average of 95 anti-genomic probesets was subtracted from each RNA expression probeset. Only probes for 2578 human mature miRNAs were selected for further analysis. Any value less than 0, below microarray background, was set to 0. Probesets with a DABG p > 0.05 were set to 0. These background normalized values were log2 transformed. To identify differentially expressed mature miRNAs, we compared MXP5 and PDX2 GFP control replicates to MXP5 and PDX2 IK1 replicates (each with independent duplicate samples) and applied Tukey’s HSD test with Benjamini and Hochberg correction for multiple testing. The differentially expressed miRNAs were identified according to the criteria of having a significant difference between mean signal for the CON and IK1 groups (Tukey’s HSD Difference > 1 and FDR corrected p < 0.05). This analysis was performed in the R 4.2.0 statistical environment.

3.7. Construction of miRNA-mRNA Networks and Pathway Enrichment Analysis

The mRNA targets of the differentially expressed miRNAs were collected from the miRTarBase v 8.0 [43] using the miRNetR package [50]. The miRNA-mRNA regulatory network was constructed based on the predicted and validated targets and visualized via Cytoscape software (version 3.4.0; www.cytoscape.org, accessed on 15 January 2021). Gene set enrichment analysis for the collection of all validated mRNA targets of either up- or down- differentially expressed miRNAs was performed against the KEGG geneset database [33] using the hypeR package with an false discovery rate (FDR) cutoff of less than 0.05 and a background size of 17,387 based on the number of target genes the miRTarBase v 8.0 [43]. We compared the list of IK1 up-regulated miRNA targets to a list of known oncogenes derived from ONGene [51], and similarly the list of IK1 down-regulated miRNA targets to a list of tumor suppressor genes derived from TSGene [52].

3.8. ChIP-Seq Analysis

We reanalyzed previously generated Ikaros ChIP-seq data (NCBI Gene Expression Omnibus accession GSE58825) [29] by alignment to the hg38 genome using bowtie2 version 2.4.5 [53]. Significantly enriched peaks were called against input control using MACS2 [54]. Only peaks that were present in two independent replicates for two independent B-ALL cell lines (ICN1 and LAX2) were used for downstream processing of data. In total, 4827 Ikaros peaks were annotated within 50 kb of annotated hg38 gene transcription start sites using homer [55]. Fold-enrichment (FE) signal values of ChIP-seq versus input were obtained using MACS2 and visualized using the trackplot R package [56].

3.9. Survival Analysis

Processed miRNA sequencing data was downloaded from the Genomic Data Commons (GDC) data portal (https://portal.gdc.cancer.gov/, accessed on 1 March 2021), National Cancer Institute (NCI) TARGET: Therapeutically Applicable Research to Generate Effective Treatments, dbGaP Study Accession: phs000218.v24.p8. Samples with missing survival data were excluded from the analysis. Hazard ratio (HR), 95% confidence intervals (CI) and log-rank p values were calculated. We applied the “survival” R package v2.38 (http://CRAN.R-project.org/package=survival/, accessed on 1 March 2021) for Cox regression analysis and the “survplot” R package v0.0.7 (http://www.cbs.dtu.dk/~eklund/survplot/, accessed on 15 January 2021) for generating Kaplan–Meier plots. We determined each percentile of miRNA expression by using z-scores for expression as a cutoff point to divide patients into high, mid and low expression groups.

4. Discussion

In this study, we used inducible expression of wild type IK1 in IKZF1-mutated human Ph+ B-ALL cell lines to study Ikaros tumor suppressor mechanisms in leukemia. Accordingly, IK1 induction in these cells resulted in growth arrest with cell cycle exit supporting the function of Ikaros as a tumor suppressor. Mechanisms attributed to Ikaros growth suppression in B-ALL include transcriptional regulation of a number of genes involved in various biological processes, including those that function in B cell development and act downstream of the pre-B cell receptor (pre-BCR) [29,57,58], as well as genes that limit the metabolic capacity of leukemia cells [45]. However, among the many transcriptional targets of Ikaros it remains unclear which are crucial for B-ALL growth suppression. Because miRNAs are implicated in B cell development [59], and have known oncogenic (oncomiRs) and tumor suppressor roles (tsmiRNAs) [60,61], we sought to investigate a potential role for Ikaros in the regulation of miRNA gene expression.
IKZF1 mutations are associated with poor prognosis and high recurrence rate in the Ph+ subtype of B-ALL [12,14]. We therefore established a system to identify IK1-regulated miRNAs based on the expression of IK1 in two independent IKZF1-mutated human Ph+ B-ALL cell lines (MXP5 and PDX2) and conducted global miRNA expression profiling by microarray analysis. Our results derived from biological replicates identified a total of 31 miRNAs that changed expression with IK1 growth suppression. Integrating differential miRNA expression with Ikaros ChIP-seq data revealed that the TSS regions (50 kb) of 9 Ikaros-responsive miRNAs were bound by Ikaros. Ikaros is known to regulate gene expression through recruitment of chromatin modifying complexes, including regulation of enhancer regions. Hence, the observed binding of Ikaros to these miRNA loci suggests that Ikaros can function to directly regulate the expression of these miRNAs. In the event of loss-of-function IKZF1 mutations, as are observed in subtypes of B-ALL, these miRNA genes are subsequently deregulated.
Ikaros is known to play critical roles in progenitor cells through the transcriptional regulation of stage-specific gene expression programs, and recognized Ikaros target genes include those encoding cytokines, cytokine receptors, and other factors central to progenitor cell proliferation and differentiation [62]. However, little is known about the role of Ikaros in the regulation of miRNA expression during lymphoid development. Here, we identified multiple Ikaros-regulated miRNAs in leukemia cells that have been previously suggested to function in B cell development, suggesting a potential role for Ikaros tumor suppression is to regulate developmental miRNA expression. More investigation is needed to understand the potential role for Ikaros to control the expression of developmental miRNA-mediated gene regulatory networks in normal B cell development and to understand how these become altered in leukemia. Comparably, an alternative Ikaros tumor suppressor role is to counteract distinctive oncogenic signals that lead to aberrant miRNA expression in leukemia. However, more studies are needed to understand the different oncogenic factors that contribute to aberrant miRNA expression in different types of leukemia, and to clarify the function of miRNAs in normal and malignant progenitor cells.
miRNAs are known to be pleiotropic in the context of oncogenesis, where a miRNA may have both oncogenic and tumor suppressive roles [61]. We hypothesized that miRNAs that were upregulated with IK1 induction may represent putative tsmiRNAs, and studying their corresponding target networks may reveal potential tumor suppression processes connected to B-ALL. We identified a total of 21 miRNAs upregulated upon IK1 induction, several of which have known growth suppressive roles (Table S2). For example, we identified miR-150 as a miRNA upregulated by IK1 induction; several studies have reported miR-150 functions in the immune system, regulating the development of B-cells, T-cells and NK cells [63,64]. Notably, miR-150 has previously been demonstrated to be expressed at lower levels in B-ALL compared to healthy control, including in the poor-outcome subgroup of MLL-rearranged leukemia, and furthermore, miR-150 was found to be downregulated in relapsed B-ALL compared to B-ALL in clinical remission (CR) [65,66,67]. Other potential IK1-upregulated tsmiR include; miR-4497, which has been reported as a tumor suppressor in squamous cell carcinoma [34]; miR-3663-3p, which was reported as a tsmiR in hepatocellular carcinoma and to be targeting CCND1 in gastric cancer [33,68]; and miR-3178, which was reported as a tsmiR in gastric cancer [69], was shown to be downregulated in hepatocellular carcinoma tumor endothelial cells and promoted the apoptosis and G1 phase arrest [70], and to represses DNA replication by repression of CDC6 [71].
Similarly, based on decreased expression with IK1-induced growth arrest, we postulated that miRNAs downregulated with IK1 may be putative oncomiRs in B-ALL. IK1 induction downregulated the expression levels of 10 distinct mature miRNAs, many which have recognized roles in cancer. Notably, we identified miR-130b as being downregulated by IK1 induction. miR-130b is highly expressed in B-ALL [72], including the poor prognosis subgroup of MLL-AF4 Acute leukemia, and mechanistic studies have explored miR-130b as an oncomiR in other cancers, such as colorectal and lung cancer [41,65,73,74]. It has been suggested that miR-130b regulates growth arrest in B-lymphoid differentiation, and these mechanisms contribute to the direct downregulation of tumor suppressor genes NR2F6 and SGMS1 in MLL-rearranged leukemia [74]. We furthermore identified miR-92a as a miRNA downregulated by IK1 induction; miR-92a is derived from the polycistronic miR-17-92 cluster (also known as oncomiR-1) and has been shown to play oncogenic roles to silence the tumor suppressor genes p53 and GATA1 [75]. Additional IK1-downregulated miRNAs included miR-7641, which has been previously shown to be highly expressed in metastatic cancer cells and to promote tumor cell progression and metastasis [39]; let-7e that has been shown to have a role in ovarian cancer cisplatin resistance through the regulation of DNA damage repair target genes BRCA1 and Rad51 [76], as well as cisplatin-resistance factors CCND1 and EZH2 [35]; and miR-551a, for which increased expression has been shown to be protective against chemotherapy-induced cell death [38].
To study the potential biological roles of IK1-regulated miRNAs, we collected lists of experimentally validated target genes and performed pathway enrichment analysis and network visualization. KEGG pathway enrichment analysis revealed a similar enrichment of cell cycle and cancer pathways for the targets of both IK1-up and downregulated miRNAs (Figure 4). Closer inspection of the list of target genes revealed some overlap of target genes between the targets of upregulated and downregulated miRNAs, reflecting how genes can be targeted by multiple miRNAs. However, a comparison of the target genes for IK1-up and IK1-downregulated miRNAs showed hundreds of targets unique to either IK1 up- and IK1 down-regulated miRNAs (Table S6), including many which have recognized roles as oncogenes (e.g., KRAS, HRAS) and tumor suppressor genes (e.g., GADD45A, TP53, BRCA1, etc.) Among the unique target genes involved in cancer pathways is the ABL1 gene that is a target gene of hsa-miR-663a, which was up-regulated with IK1 growth suppression. The Ph+ B-ALL cells used in the experimental model have constitutive expression of active ABL1 kinase through the BCR-ABL1 oncogene translocation. Hence, a possible tumor suppressive mechanism of Ikaros is to activate the expression of a miRNA (hsa-miR-663a) that represses ABL1 expression to restrict cell growth, and mutation in IKZF1 in Ph+ B-ALL could relieve such oncogene repression by reduced tsmiR levels. While it remains to be determined if Ikaros regulates the expression of key growth targets via miRNA intermediates, these results suggest that Ikaros tumor suppression may include extensive miRNA-mRNA growth networks.
Aberrant miRNA expression has been previously shown to serve as prognostic indicators to predict treatment response or disease relapse for hematologic malignancies and cancers [77]. We analyzed small RNA-seq data generated in B-ALL patients by the TARGET project and found three IK1-regulated miRNAs were associated with outcome in this cohort. Notably, patient survival analysis showed that high expression of identified IK1-repressed miRNAs hsa-miR-130 was specifically associated with poor outcome and might represent a potential biomarker in B-ALL. Two additional miRNAs were identified, albeit with lower significance. These 3 miRNAs were among those DE miRNAs not bound by Ikaros in ChIP-seq data (Figure 3). The mechanism of how Ikaros regulates the expression of these is currently unknown. Furthermore, as the prognosis analysis was performed on a limited patient cohort with unknown IKZF1-status, it is possible that future analysis with larger patient cohorts, or analysis of specific leukemia subtypes, might uncover additional correlations between other IK1-regulated miRNAs and patient outcome.
Herein, we have identified 31 miRNAs that are regulated by the tumor suppressor Ikaros in IKZF1-mutated Ph+ B-ALL cells. This included several miRNAs previously described as oncomiRs and tsmiRs, indicating that regulation of miRNAs is a part of Ikaros tumor suppressor function in B-ALL. Additional Ikaros-regulated miRNAs were identified that are less well-known in cancer, as well as miRNAs that have been described both as tsmiRs and oncomiRs in different cancer cell types. A limitation of this study was the use of microarray technology to identify Ikaros-regulated miRNAs. Because of its wider dynamic range as well as its capacity to identify a larger number of DE miRNAs, small RNA-sequencing protocols may generate more insight into mechanisms of Ikaros miRNA regulation [78]. Nevertheless, there is a gap in our knowledge of miRNA expression and biological function in different B-ALL subtypes. As more comprehensive miRNA expression datasets become available, from both patient samples and cell lines, it will be important to address the question of subtype-specific patterns of miRNA expression and their roles in different types of B-ALL. The roles of miRNA in hematopoiesis and leukemogenesis is an emerging field, and the biological functions of many miRNAs in leukemia remain unknown. Future work will focus on refining our understanding of the mechanisms modulated by the identified miRNAs and to determine whether they are key transcriptional targets of Ikaros tumor suppression in Ph+ B-ALL.

Supplementary Materials

The following supporting information can be downloaded at: https://www.mdpi.com/article/10.3390/epigenomes6040037/s1, Table S1: miRNA expression values in B-ALL cells. Table S2: Differential miRNA expression analysis with IK1 induction compared to CON. Table S3: Ikaros-bound DE miRNAs. Table S4: Target genes of IK1 DE miRNAs. Table S5: KEGG pathway enrichment of all experimentally validated targets of IK1 DE miRNAs. Table S6: Non-overlapping target genes of IK1 upregulated and downregulated DE miRNAs. Table S7: IK1 downregulated miRNA targets that annotate as tumor suppressor genes and targets of Ik1 upregulated miRNAs that annotate as oncogenes.

Author Contributions

Conceptualization, S.F. and H.S.; methodology, S.K., H.P., P.R. and A.P.; formal analysis, S.K., H.P., P.R., S.F., H.S., J.B. and A.R.; writing—original draft preparation, S.F. and S.K.; writing—review and editing, H.P., S.F. and H.S.; supervision, S.F. and H.S.; funding acquisition, S.F. and H.S. All authors have read and agreed to the published version of the manuscript.

Funding

This work was supported by grants from National Institutes of Health, R21CA209229 and R01CA230618 (S.F. and H.S.), and U54 GM115516 for the Northern New England Clinical and Translational Research Network. The content is solely the responsibility of the authors and does not necessarily represent the official views of the NIH.

Institutional Review Board Statement

Not applicable.

Informed Consent Statement

Not applicable.

Data Availability Statement

Raw and processed miRNA expression data can be found in NCBI GEO accession GSE209694.

Acknowledgments

We would like to acknowledge Scott Tighe in the UVM Shared Resources and Genomics core for helpful discussion and technical insight, and Markus Müschen for cell lines. Flow cytometry was performed at the UCSF Parnassus Flow Core (RRID:SCR_018206), which is supported by DRC Center Grant NIH P30 DK063720 and NIHS10 1S10OD021822-01. The graphical abstract was created with BioRender.com, accessed on 15 January 2021.

Conflicts of Interest

The authors declare no conflict of interest.

References

  1. Siegel, R.L.; Miller, K.D.; Jemal, A. Cancer statistics, 2020. CA Cancer J. Clin. 2020, 70, 7–30. [Google Scholar] [CrossRef] [PubMed]
  2. Slayton, W.B.; Schultz, K.R.; Kairalla, J.A.; Devidas, M.; Mi, X.; Pulsipher, M.A.; Chang, B.H.; Mullighan, C.; Iacobucci, I.; Silverman, L.B.; et al. Dasatinib Plus Intensive Chemotherapy in Children, Adolescents, and Young Adults With Philadelphia Chromosome-Positive Acute Lymphoblastic Leukemia: Results of Children’s Oncology Group Trial AALL0622. J. Clin. Oncol. 2018, 36, 2306–2314. [Google Scholar] [CrossRef]
  3. Wong, S.; Witte, O.N. The BCR-ABL story: Bench to bedside and back. Annu. Rev. Immunol. 2004, 22, 247–306. [Google Scholar] [CrossRef] [PubMed]
  4. Iacobucci, I.; Mullighan, C.G. Genetic Basis of Acute Lymphoblastic Leukemia. J. Clin. Oncol. 2017, 35, 975–983. [Google Scholar] [CrossRef] [PubMed]
  5. Jabbour, E.; Short, N.J.; Ravandi, F.; Huang, X.; Daver, N.; DiNardo, C.D.; Konopleva, M.; Pemmaraju, N.; Wierda, W.; Garcia-Manero, G.; et al. Combination of hyper-CVAD with ponatinib as first-line therapy for patients with Philadelphia chromosome-positive acute lymphoblastic leukaemia: Long-term follow-up of a single-centre, phase 2 study. Lancet Haematol. 2018, 5, e618–e627. [Google Scholar] [CrossRef]
  6. Chessells, J.M.; Veys, P.; Kempski, H.; Henley, P.; Leiper, A.; Webb, D.; Hann, I.M. Long-term follow-up of relapsed childhood acute lymphoblastic leukaemia. Br. J. Haematol. 2003, 123, 396–405. [Google Scholar] [CrossRef] [PubMed]
  7. Dinmohamed, A.G.; Szabo, A.; van der Mark, M.; Visser, O.; Sonneveld, P.; Cornelissen, J.J.; Jongen-Lavrencic, M.; Rijneveld, A.W. Improved survival in adult patients with acute lymphoblastic leukemia in the Netherlands: A population-based study on treatment, trial participation and survival. Leukemia 2016, 30, 310–317. [Google Scholar] [CrossRef]
  8. Sasaki, K.; Jabbour, E.; Short, N.J.; Jain, N.; Ravandi, F.; Pui, C.H.; Kantarjian, H. Acute lymphoblastic leukemia: A population-based study of outcome in the United States based on the surveillance, epidemiology, and end results (SEER) database, 1980-2017. Am. J. Hematol. 2021, 96, 650–658. [Google Scholar] [CrossRef] [PubMed]
  9. Wang, J.H.; Nichogiannopoulou, A.; Wu, L.; Sun, L.; Sharpe, A.H.; Bigby, M.; Georgopoulos, K. Selective defects in the development of the fetal and adult lymphoid system in mice with an Ikaros null mutation. Immunity 1996, 5, 537–549. [Google Scholar] [CrossRef] [Green Version]
  10. Nutt, S.L.; Heavey, B.; Rolink, A.G.; Busslinger, M. Commitment to the B-lymphoid lineage depends on the transcription factor Pax5. Nature 1999, 401, 556–562. [Google Scholar] [CrossRef] [PubMed]
  11. Nechanitzky, R.; Akbas, D.; Scherer, S.; Gyory, I.; Hoyler, T.; Ramamoorthy, S.; Diefenbach, A.; Grosschedl, R. Transcription factor EBF1 is essential for the maintenance of B cell identity and prevention of alternative fates in committed cells. Nat. Immunol. 2013, 14, 867–875. [Google Scholar] [CrossRef] [PubMed]
  12. Mullighan, C.G.; Su, X.; Zhang, J.; Radtke, I.; Phillips, L.A.; Miller, C.B.; Ma, J.; Liu, W.; Cheng, C.; Schulman, B.A.; et al. Deletion of IKZF1 and prognosis in acute lymphoblastic leukemia. N. Engl. J. Med. 2009, 360, 470–480. [Google Scholar] [CrossRef]
  13. Mullighan, C.G.; Goorha, S.; Radtke, I.; Miller, C.B.; Coustan-Smith, E.; Dalton, J.D.; Girtman, K.; Mathew, S.; Ma, J.; Pounds, S.B.; et al. Genome-wide analysis of genetic alterations in acute lymphoblastic leukaemia. Nature 2007, 446, 758–764. [Google Scholar] [CrossRef] [PubMed]
  14. Mullighan, C.G.; Miller, C.B.; Radtke, I.; Phillips, L.A.; Dalton, J.; Ma, J.; White, D.; Hughes, T.P.; Le Beau, M.M.; Pui, C.H.; et al. BCR-ABL1 lymphoblastic leukaemia is characterized by the deletion of Ikaros. Nature 2008, 453, 110–114. [Google Scholar] [CrossRef] [PubMed]
  15. Boer, J.M.; van der Veer, A.; Rizopoulos, D.; Fiocco, M.; Sonneveld, E.; de Groot-Kruseman, H.A.; Kuiper, R.P.; Hoogerbrugge, P.; Horstmann, M.; Zaliova, M.; et al. Prognostic value of rare IKZF1 deletion in childhood B-cell precursor acute lymphoblastic leukemia: An international collaborative study. Leukemia 2016, 30, 32–38. [Google Scholar] [CrossRef] [PubMed]
  16. Dorge, P.; Meissner, B.; Zimmermann, M.; Moricke, A.; Schrauder, A.; Bouquin, J.P.; Schewe, D.; Harbott, J.; Teigler-Schlegel, A.; Ratei, R.; et al. IKZF1 deletion is an independent predictor of outcome in pediatric acute lymphoblastic leukemia treated according to the ALL-BFM 2000 protocol. Haematologica 2013, 98, 428–432. [Google Scholar] [CrossRef] [PubMed] [Green Version]
  17. Pui, C.H.; Roberts, K.G.; Yang, J.J.; Mullighan, C.G. Philadelphia Chromosome-like Acute Lymphoblastic Leukemia. Clin. Lymphoma Myeloma Leuk 2017, 17, 464–470. [Google Scholar] [CrossRef] [PubMed]
  18. Stanulla, M.; Cave, H.; Moorman, A.V. IKZF1 deletions in pediatric acute lymphoblastic leukemia: Still a poor prognostic marker? Blood 2020, 135, 252–260. [Google Scholar] [CrossRef] [PubMed] [Green Version]
  19. Sun, L.; Liu, A.; Georgopoulos, K. Zinc finger-mediated protein interactions modulate Ikaros activity, a molecular control of lymphocyte development. EMBO J 1996, 15, 5358–5369. [Google Scholar] [CrossRef]
  20. Bartel, D.P. Metazoan MicroRNAs. Cell 2018, 173, 20–51. [Google Scholar] [CrossRef] [PubMed]
  21. Condrat, C.E.; Thompson, D.C.; Barbu, M.G.; Bugnar, O.L.; Boboc, A.; Cretoiu, D.; Suciu, N.; Cretoiu, S.M.; Voinea, S.C. miRNAs as Biomarkers in Disease: Latest Findings Regarding Their Role in Diagnosis and Prognosis. Cells 2020, 9, 276. [Google Scholar] [CrossRef] [PubMed] [Green Version]
  22. Ivey, K.N.; Srivastava, D. microRNAs as Developmental Regulators. Cold Spring Harb. Perspect. Biol. 2015, 7, a008144. [Google Scholar] [CrossRef] [PubMed] [Green Version]
  23. Bracken, C.P.; Scott, H.S.; Goodall, G.J. A network-biology perspective of microRNA function and dysfunction in cancer. Nat. Rev. Genet. 2016, 17, 719–732. [Google Scholar] [CrossRef] [PubMed]
  24. Li, Z.; Rana, T.M. Therapeutic targeting of microRNAs: Current status and future challenges. Nat. Rev. Drug Discov. 2014, 13, 622–638. [Google Scholar] [CrossRef]
  25. Hayes, J.; Peruzzi, P.P.; Lawler, S. MicroRNAs in cancer: Biomarkers, functions and therapy. Trends Mol. Med. 2014, 20, 460–469. [Google Scholar] [CrossRef]
  26. Rodriguez, P.D.; Paculova, H.; Kogut, S.; Heath, J.; Schjerven, H.; Frietze, S. Non-Coding RNA Signatures of B-Cell Acute Lymphoblastic Leukemia. Int. J. Mol. Sci. 2021, 22, 2683. [Google Scholar] [CrossRef] [PubMed]
  27. Schotte, D.; De Menezes, R.X.; Akbari Moqadam, F.; Khankahdani, L.M.; Lange-Turenhout, E.; Chen, C.; Pieters, R.; Den Boer, M.L. MicroRNA characterize genetic diversity and drug resistance in pediatric acute lymphoblastic leukemia. Haematologica 2011, 96, 703–711. [Google Scholar] [CrossRef] [Green Version]
  28. Han, B.W.; Feng, D.D.; Li, Z.G.; Luo, X.Q.; Zhang, H.; Li, X.J.; Zhang, X.J.; Zheng, L.L.; Zeng, C.W.; Lin, K.Y.; et al. A set of miRNAs that involve in the pathways of drug resistance and leukemic stem-cell differentiation is associated with the risk of relapse and glucocorticoid response in childhood ALL. Hum. Mol. Genet. 2011, 20, 4903–4915. [Google Scholar] [CrossRef] [PubMed]
  29. Schjerven, H.; Ayongaba, E.F.; Aghajanirefah, A.; McLaughlin, J.; Cheng, D.; Geng, H.; Boyd, J.R.; Eggesbø, L.M.; Lindeman, I.; Heath, J.L.; et al. Genetic analysis of Ikaros target genes and tumor suppressor function in BCR-ABL1(+) pre-B ALL. J. Exp. Med. 2017, 214, 793–814. [Google Scholar] [CrossRef] [Green Version]
  30. Turk, A.; Calin, G.A.; Kunej, T. MicroRNAs in Leukemias: A Clinically Annotated Compendium. Int. J. Mol. Sci. 2022, 23, 3469. [Google Scholar] [CrossRef] [PubMed]
  31. Tan, Z.; Jia, J.; Jiang, Y. MiR-150-3p targets SP1 and suppresses the growth of glioma cells. Biosci. Rep. 2018, 38. [Google Scholar] [CrossRef] [PubMed] [Green Version]
  32. Zhang, Q.; Zhou, X.; Wan, M.; Zeng, X.; Luo, J.; Xu, Y.; Ji, L.; Zhang, J.A.; Fan, P.; Zhong, J.; et al. FoxP3-miR-150-5p/3p suppresses ovarian tumorigenesis via an IGF1R/IRS1 pathway feedback loop. Cell Death Dis. 2021, 12, 275. [Google Scholar] [CrossRef] [PubMed]
  33. Takao, K.; Konishi, H.; Matsubara, D.; Shoda, K.; Arita, T.; Shimizu, H.; Komatsu, S.; Shiozaki, A.; Yamamoto, Y.; Kubota, T.; et al. MiR-3663-3p Inhibits the Progression of Gastric Cancer Through the CCND1 Pathway. Anticancer Res. 2021, 41, 2441–2449. [Google Scholar] [CrossRef] [PubMed]
  34. Chen, X.; Zhang, L.; Tang, S. MicroRNA-4497 functions as a tumor suppressor in laryngeal squamous cell carcinoma via negatively modulation the GBX2. Auris Nasus Larynx 2019, 46, 106–113. [Google Scholar] [CrossRef]
  35. Cai, J.; Yang, C.; Yang, Q.; Ding, H.; Jia, J.; Guo, J.; Wang, J.; Wang, Z. Deregulation of let-7e in epithelial ovarian cancer promotes the development of resistance to cisplatin. Oncogenesis 2013, 2, e75. [Google Scholar] [CrossRef] [Green Version]
  36. Gong, W.; Zheng, J.; Liu, X.; Ma, J.; Liu, Y.; Xue, Y. Knockdown of NEAT1 restrained the malignant progression of glioma stem cells by activating microRNA let-7e. Oncotarget 2016, 7, 62208–62223. [Google Scholar] [CrossRef] [Green Version]
  37. Wang, Y.; Hu, X.; Greshock, J.; Shen, L.; Yang, X.; Shao, Z.; Liang, S.; Tanyi, J.L.; Sood, A.K.; Zhang, L. Genomic DNA copy-number alterations of the let-7 family in human cancers. PLoS ONE 2012, 7, e44399. [Google Scholar] [CrossRef] [PubMed] [Green Version]
  38. Kang, H.; Kim, C.; Ji, E.; Ahn, S.; Jung, M.; Hong, Y.; Kim, W.; Lee, E.K. The MicroRNA-551a/MEF2C Axis Regulates the Survival and Sphere Formation of Cancer Cells in Response to 5-Fluorouracil. Mol Cells 2019, 42, 175–182. [Google Scholar] [CrossRef]
  39. Shen, S.; Song, Y.; Zhao, B.; Xu, Y.; Ren, X.; Zhou, Y.; Sun, Q. Cancer-derived exosomal miR-7641 promotes breast cancer progression and metastasis. Cell. Commun. Signal. 2021, 19, 20. [Google Scholar] [CrossRef]
  40. Yang, Y.; Yin, Z.X.; Wang, Z.Y.; Tian, S.B.; Wang, H.C.; Zhang, F.X.; Li, L.P.; Zheng, C.; Kong, S. miR-7641 depletion suppresses proliferation of gastric cancer cells by targeting ARID1A. Anticancer Drugs 2020, 31, 368–376. [Google Scholar] [CrossRef]
  41. Hirono, T.; Jingushi, K.; Nagata, T.; Sato, M.; Minami, K.; Aoki, M.; Takeda, A.H.; Umehara, T.; Egawa, H.; Nakatsuji, Y.; et al. MicroRNA-130b functions as an oncomiRNA in non-small cell lung cancer by targeting tissue inhibitor of metalloproteinase-2. Sci. Rep. 2019, 9, 6956. [Google Scholar] [CrossRef] [PubMed] [Green Version]
  42. Yan, W.; Wang, Y.; Chen, Y.; Guo, Y.; Li, Q.; Wei, X. Exosomal miR-130b-3p Promotes Progression and Tubular Formation Through Targeting PTEN in Oral Squamous Cell Carcinoma. Front. Cell. Dev. Biol. 2021, 9, 616306. [Google Scholar] [CrossRef] [PubMed]
  43. Huang, H.Y.; Lin, Y.C.; Cui, S.; Huang, Y.; Tang, Y.; Xu, J.; Bao, J.; Li, Y.; Wen, J.; Zuo, H.; et al. miRTarBase update 2022: An informative resource for experimentally validated miRNA-target interactions. Nucleic Acids Res. 2022, 50, D222–D230. [Google Scholar] [CrossRef] [PubMed]
  44. Roberts, K.G.; Li, Y.; Payne-Turner, D.; Harvey, R.C.; Yang, Y.L.; Pei, D.; McCastlain, K.; Ding, L.; Lu, C.; Song, G.; et al. Targetable kinase-activating lesions in Ph-like acute lymphoblastic leukemia. N. Engl. J. Med. 2014, 371, 1005–1015. [Google Scholar] [CrossRef] [Green Version]
  45. Chan, L.N.; Chen, Z.; Braas, D.; Lee, J.W.; Xiao, G.; Geng, H.; Cosgun, K.N.; Hurtz, C.; Shojaee, S.; Cazzaniga, V.; et al. Metabolic gatekeeper function of B-lymphoid transcription factors. Nature 2017, 542, 479–483. [Google Scholar] [CrossRef] [Green Version]
  46. Chen, Z.; Shojaee, S.; Buchner, M.; Geng, H.; Lee, J.W.; Klemm, L.; Titz, B.; Graeber, T.G.; Park, E.; Tan, Y.X.; et al. Signalling thresholds and negative B-cell selection in acute lymphoblastic leukaemia. Nature 2015, 521, 357–361. [Google Scholar] [CrossRef] [Green Version]
  47. Vo, T.T.; Herzog, L.O.; Buono, R.; Lee, J.S.; Mallya, S.; Duong, M.R.; Thao, J.; Gotesman, M.; Fruman, D.A. Targeting eIF4F translation complex sensitizes B-ALL cells to tyrosine kinase inhibition. Sci. Rep. 2021, 11, 21689. [Google Scholar] [CrossRef]
  48. Hahm, K.; Cobb, B.S.; McCarty, A.S.; Brown, K.E.; Klug, C.A.; Lee, R.; Akashi, K.; Weissman, I.L.; Fisher, A.G.; Smale, S.T. Helios, a T cell-restricted Ikaros family member that quantitatively associates with Ikaros at centromeric heterochromatin. Genes Dev. 1998, 12, 782–796. [Google Scholar] [CrossRef]
  49. Farina, N.H.; Ramsey, J.E.; Cuke, M.E.; Ahern, T.P.; Shirley, D.J.; Stein, J.L.; Stein, G.S.; Lian, J.B.; Wood, M.E. Development of a predictive miRNA signature for breast cancer risk among high-risk women. Oncotarget 2017, 8, 112170–112183. [Google Scholar] [CrossRef] [Green Version]
  50. Federico, A.; Monti, S. hypeR: An R package for geneset enrichment workflows. Bioinformatics 2020, 36, 1307–1308. [Google Scholar] [CrossRef]
  51. Liu, Y.; Sun, J.; Zhao, M. ONGene: A literature-based database for human oncogenes. J. Genet. Genom. 2017, 44, 119–121. [Google Scholar] [CrossRef] [PubMed]
  52. Zhao, M.; Sun, J.; Zhao, Z. TSGene: A web resource for tumor suppressor genes. Nucleic Acids Res. 2013, 41, D970–D976. [Google Scholar] [CrossRef] [PubMed] [Green Version]
  53. Langmead, B.; Salzberg, S.L. Fast gapped-read alignment with Bowtie 2. Nat. Methods 2012, 9, 357–359. [Google Scholar] [CrossRef] [PubMed] [Green Version]
  54. Zhang, Y.; Liu, T.; Meyer, C.A.; Eeckhoute, J.; Johnson, D.S.; Bernstein, B.E.; Nusbaum, C.; Myers, R.M.; Brown, M.; Li, W.; et al. Model-based analysis of ChIP-Seq (MACS). Genome Biol. 2008, 9, R137. [Google Scholar] [CrossRef] [Green Version]
  55. Heinz, S.; Benner, C.; Spann, N.; Bertolino, E.; Lin, Y.C.; Laslo, P.; Cheng, J.X.; Murre, C.; Singh, H.; Glass, C.K. Simple combinations of lineage-determining transcription factors prime cis-regulatory elements required for macrophage and B cell identities. Mol. Cell 2010, 38, 576–589. [Google Scholar] [CrossRef] [Green Version]
  56. Pohl, A.; Beato, M. bwtool: A tool for bigWig files. Bioinformatics 2014, 30, 1618–1619. [Google Scholar] [CrossRef] [Green Version]
  57. Trageser, D.; Iacobucci, I.; Nahar, R.; Duy, C.; von Levetzow, G.; Klemm, L.; Park, E.; Schuh, W.; Gruber, T.; Herzog, S.; et al. Pre-B cell receptor-mediated cell cycle arrest in Philadelphia chromosome-positive acute lymphoblastic leukemia requires IKAROS function. J. Exp. Med. 2009, 206, 1739–1753. [Google Scholar] [CrossRef]
  58. Witkowski, M.T.; Hu, Y.; Roberts, K.G.; Boer, J.M.; McKenzie, M.D.; Liu, G.J.; Le Grice, O.D.; Tremblay, C.S.; Ghisi, M.; Willson, T.A.; et al. Conserved IKAROS-regulated genes associated with B-progenitor acute lymphoblastic leukemia outcome. J. Exp. Med. 2017, 214, 773–791. [Google Scholar] [CrossRef] [Green Version]
  59. Zheng, B.; Xi, Z.; Liu, R.; Yin, W.; Sui, Z.; Ren, B.; Miller, H.; Gong, Q.; Liu, C. The Function of MicroRNAs in B-Cell Development, Lymphoma, and Their Potential in Clinical Practice. Front. Immunol. 2018, 9, 936. [Google Scholar] [CrossRef]
  60. Otmani, K.; Lewalle, P. Tumor Suppressor miRNA in Cancer Cells and the Tumor Microenvironment: Mechanism of Deregulation and Clinical Implications. Front. Oncol. 2021, 11, 708765. [Google Scholar] [CrossRef]
  61. Svoronos, A.A.; Engelman, D.M.; Slack, F.J. OncomiR or Tumor Suppressor? The Duplicity of MicroRNAs in Cancer. Cancer Res. 2016, 76, 3666–3670. [Google Scholar] [CrossRef] [PubMed] [Green Version]
  62. Ferreiros-Vidal, I.; Carroll, T.; Taylor, B.; Terry, A.; Liang, Z.; Bruno, L.; Dharmalingam, G.; Khadayate, S.; Cobb, B.S.; Smale, S.T.; et al. Genome-wide identification of Ikaros targets elucidates its contribution to mouse B-cell lineage specification and pre-B-cell differentiation. Blood 2013, 121, 1769–1782. [Google Scholar] [CrossRef] [PubMed]
  63. Bezman, N.A.; Chakraborty, T.; Bender, T.; Lanier, L.L. miR-150 regulates the development of NK and iNKT cells. J. Exp. Med. 2011, 208, 2717–2731. [Google Scholar] [CrossRef] [Green Version]
  64. Smith, N.L.; Wissink, E.M.; Grimson, A.; Rudd, B.D. miR-150 Regulates Differentiation and Cytolytic Effector Function in CD8+ T cells. Sci. Rep. 2015, 5, 16399. [Google Scholar] [CrossRef] [PubMed] [Green Version]
  65. Zhang, H.; Luo, X.Q.; Zhang, P.; Huang, L.B.; Zheng, Y.S.; Wu, J.; Zhou, H.; Qu, L.H.; Xu, L.; Chen, Y.Q. MicroRNA patterns associated with clinical prognostic parameters and CNS relapse prediction in pediatric acute leukemia. PLoS ONE 2009, 4, e7826. [Google Scholar] [CrossRef] [PubMed]
  66. Fang, Z.H.; Wang, S.L.; Zhao, J.T.; Lin, Z.J.; Chen, L.Y.; Su, R.; Xie, S.T.; Carter, B.Z.; Xu, B. miR-150 exerts antileukemia activity in vitro and in vivo through regulating genes in multiple pathways. Cell Death Dis. 2016, 7, e2371. [Google Scholar] [CrossRef]
  67. Bousquet, M.; Zhuang, G.; Meng, C.; Ying, W.; Cheruku, P.S.; Shie, A.T.; Wang, S.; Ge, G.; Wong, P.; Wang, G.; et al. miR-150 blocks MLL-AF9-associated leukemia through oncogene repression. Mol. Cancer Res. 2013, 11, 912–922. [Google Scholar] [CrossRef] [Green Version]
  68. Tian, J.; Li, J.; Bie, B.; Sun, J.; Mu, Y.; Shi, M.; Zhang, S.; Kong, G.; Li, Z.; Guo, Y. MiR-3663-3p participates in the anti-hepatocellular carcinoma proliferation activity of baicalein by targeting SH3GL1 and negatively regulating EGFR/ERK/NF-kappaB signaling. Toxicol. Appl. Pharmacol. 2021, 420, 115522. [Google Scholar] [CrossRef]
  69. Wu, J.C.; Liu, Z.H.; Ding, X.; Ke, R.S. miR-3178 as a prognostic indicator and tumor suppressor of gastric cancer. Ir. J. Med. Sci. 2022, 191, 139–145. [Google Scholar] [CrossRef]
  70. Li, W.; Shen, S.; Wu, S.; Chen, Z.; Hu, C.; Yan, R. Regulation of tumorigenesis and metastasis of hepatocellular carcinoma tumor endothelial cells by microRNA-3178 and underlying mechanism. Biochem. Biophys. Res. Commun. 2015, 464, 881–887. [Google Scholar] [CrossRef]
  71. Wu, X.; Li, S.; Hu, X.; Xiang, X.; Halloran, M.; Yang, L.; Williams, T.M.; Houghton, P.J.; Shen, C.; He, Z. mTOR Signaling Upregulates CDC6 via Suppressing miR-3178 and Promotes the Loading of DNA Replication Helicase. Sci. Rep. 2019, 9, 9805. [Google Scholar] [CrossRef] [PubMed] [Green Version]
  72. Mi, S.; Lu, J.; Sun, M.; Li, Z.; Zhang, H.; Neilly, M.B.; Wang, Y.; Qian, Z.; Jin, J.; Zhang, Y.; et al. MicroRNA expression signatures accurately discriminate acute lymphoblastic leukemia from acute myeloid leukemia. Proc. Natl. Acad. Sci. USA 2007, 104, 19971–19976. [Google Scholar] [CrossRef] [Green Version]
  73. Song, D.; Zhang, Q.; Zhang, H.; Zhan, L.; Sun, X. MiR-130b-3p promotes colorectal cancer progression by targeting CHD9. Cell Cycle 2022, 21, 585–601. [Google Scholar] [CrossRef] [PubMed]
  74. Malouf, C.; Antunes, E.T.B.; O’Dwyer, M.; Jakobczyk, H.; Sahm, F.; Landua, S.L.; Anderson, R.A.; Soufi, A.; Halsey, C.; Ottersbach, K. miR-130b and miR-128a are essential lineage-specific codrivers of t(4;11) MLL-AF4 acute leukemia. Blood 2021, 138, 2066–2092. [Google Scholar] [CrossRef]
  75. Li, Y.; Vecchiarelli-Federico, L.M.; Li, Y.J.; Egan, S.E.; Spaner, D.; Hough, M.R.; Ben-David, Y. The miR-17-92 cluster expands multipotent hematopoietic progenitors whereas imbalanced expression of its individual oncogenic miRNAs promotes leukemia in mice. Blood 2012, 119, 4486–4498. [Google Scholar] [CrossRef] [PubMed] [Green Version]
  76. Xiao, M.; Cai, J.; Cai, L.; Jia, J.; Xie, L.; Zhu, Y.; Huang, B.; Jin, D.; Wang, Z. Let-7e sensitizes epithelial ovarian cancer to cisplatin through repressing DNA double strand break repair. J. Ovarian Res. 2017, 10, 24. [Google Scholar] [CrossRef] [Green Version]
  77. Ting, C.Y.; Liew, S.M.; Price, A.; Gan, G.G.; Bee-Lan Ong, D.; Tan, S.Y.; Bee, P.C. Clinical significance of aberrant microRNAs expression in predicting disease relapse/refractoriness to treatment in diffuse large B-cell lymphoma: A meta-analysis. Crit. Rev. Oncol. Hematol. 2019, 144, 102818. [Google Scholar] [CrossRef] [PubMed]
  78. Git, A.; Dvinge, H.; Salmon-Divon, M.; Osborne, M.; Kutter, C.; Hadfield, J.; Bertone, P.; Caldas, C. Systematic comparison of microarray profiling, real-time PCR, and next-generation sequencing technologies for measuring differential microRNA expression. RNA 2010, 16, 991–1006. [Google Scholar] [CrossRef]
Figure 1. Ikaros induction in B-ALL cells reduces cell cycle. (A) Immunoblot analysis of Ikaros in IKZF1-deleted Ph+ B-ALL cells (MXP5 and PDX2) with stable expression of doxycycline (DOX) inducible empty vector (CON) or IK1 following 24 h of induction. IK1 and IK6 isoforms are indicated, α-tubulin was used as a loading control. (B) Growth competition analysis comparing the percentage of viable GFP+ MXP5 cells following DOX induction of CON and IK1 over the period of 12 days, starting with >95% GFP+ cells. Error bars, SEM; n = 3, significant differences were observed between IK1 and CON for all timepoints except day 2, p < 0.05; t-test. (C) Effect of IK1 induction on cell cycle distribution analyzed using flow cytometry, representing the percentage of cell populations in CON (left) and IK1 (right) cells. Error bars indicate standard deviation, n = 2, (*, p < 0.05; **, p < 0.005; t-test versus 0 h timepoint).
Epigenomes 06 00037 g001
Figure 2. Global miRNA expression profiling of IK1-regulated miRNAs. (A) MA plot showing significantly differentially regulated miRNAs with IK1 induction in both MXP5 and PDX2 B-ALL cells. Significantly down-regulated (blue), up-regulated (red) miRNAs, and miRNAs not changed with IK1 induction compared to controls (black) are colored. The names for the top 5 miRNAs for both directions are shown. Statistical details are reported in Material and Methods. (B) Expression barplots showing the normalized expression values for 5 IK1-upregulated (top row) and 5 IK1-downregulated miRNAs (bottom row). Error bars, SEM; n = 2.
Epigenomes 06 00037 g002
Figure 3. Ikaros binds to a subset of miRNA genes. Ikaros ChIP-seq from 2 Ph+ B-ALL cell lines with wild-type IKZF1 (ICN1 and LAX2) were analyzed. (A) Venn diagram comparing the total number of Ikaros binding sites from B-ALL cell lines within 50 kb of all annotated human miRNA genes and the 31 significantly IK1 differentially expressed miRNAs. Genome browser snapshot of Ikaros ChIP-seq signal surrounding (B) the MIR4674 locus encoding hsa-miR-4674 (chr9:136,526,173−136,566,259), and (C) the MIR551A locus encoding hsa-miR-551a (chr1:3,558,343−3,599,142). Locations of the miRNA genes are shaded. Shown are the read depth normalized fold enrichment (FE) ChIP-seq compared to input signal for both ICN1 and LAX2 datasets.
Epigenomes 06 00037 g003
Figure 4. Pathway analysis of IK1-regulated miRNAs. KEGG pathway enrichment analysis for the validated targets of all (A) IK1 upregulated differentially expressed miRNAs or all (B) IK1 downregulated differentially expressed miRNAs. Shown are the top 13 enriched Gene Ontology Biological Process genesets, the dot color represents the significance (false discovery rate (FDR)) and the dot size signifies the geneset size.
Epigenomes 06 00037 g004
Figure 5. miRNA-mRNA target networks for IK1-regulated miRNAs. The collection of mRNA targets for (A) 21 upregulated DE miRNAs highlighting oncogenic targets, and (B) for 10 downregulated miRNAs, highlighting tumor suppressor gene targets. Size of the miRNA nodes (squares) correspond to the number of target genes in miRTarBase for different miRNAs. Only some of the oncogene (A) and tumor suppressor (B) target genes are listed. For full list, see Table S7.
Epigenomes 06 00037 g005
Figure 6. Association of miRNA expression with overall survival in a cohort of B-ALL patients. Kaplan–Meier survival analysis revealed the difference of overall survival rate between patients with different expression levels of the indicated IK1-regulated miRNAs, based on z-score binning. The survival probability of B-ALL patients with high expression of (A) hsa-miR-130b and (B) hsa-miR-4649 is worse than that of patients with low expression. The high expression of (C) hsa-miR-26b has positive effect on overall survival probability. Shown are the Kaplan- Meier survival curves with p-values indicated, as well as the z-score bins showing the normalized miRNA expression counts on the Y-axis.
Epigenomes 06 00037 g006
Publisher’s Note: MDPI stays neutral with regard to jurisdictional claims in published maps and institutional affiliations.

