Article

Genetic Differentiation of the Bloodsucking Midge Forcipomyia taiwana (Diptera: Ceratopogonidae): Implication of the Geographic Isolation by the Central Mountain Ranges in Taiwan

1
Department of Molecular Biology and Human Genetics, Tzu Chi University, Hualien 97004, Taiwan
2
Department of Veterinary Medicine, College of Veterinary Medicine, National Pingtung University of Science and Technology, Pingtung 91201, Taiwan
3
Department of Entomology, National Chung Hsing University, Taichung 40227, Taiwan
4
Institute of Medical Science, Tzu Chi University, Hualien 97004, Taiwan
*
Author to whom correspondence should be addressed.
These authors contributed equally to this work.
Insects 2024, 15(1), 23; https://doi.org/10.3390/insects15010023
Submission received: 9 December 2023 / Revised: 25 December 2023 / Accepted: 31 December 2023 / Published: 1 January 2024
(This article belongs to the Collection Insects in Mountain Ecosystems)

Abstract

:

Simple Summary

Our study elucidates a genetic differentiation of F. taiwana populations across the central mountain ranges of Taiwan, which stands out as a significant geographical feature shaping these populations’ genetic landscape. The mountain range acts as a significant topographic barrier, influencing gene flow and contributing to distinct genetic clusters in eastern and western regions. Despite potential mechanisms for passive dispersal, such as human-mediated transportation and monsoon winds, the genetic divergence remains pronounced. These findings provide crucial insights for understanding the species’ molecular ecology and can inform targeted pest management strategies. Future research, involving more detailed genomic analyses, will be pivotal in exploring specific genetic adaptations and further elucidating gene flow across these geographical divisions.

Abstract

Forcipomyia (Lasiohelea) taiwana, a small bloodsucking midge, thrives in moderately moist habitats and is commonly found in grassy and bushy areas at an elevation below 250 m. This species exhibits a diurnal biting pattern and shows a marked preference for human blood. Although not known to transmit arthropod-borne diseases, the bites of F. taiwana can induce severe allergic reactions in some individuals. As a significant nuisance in Taiwan, affecting both daily life and the tourism industry, comprehensive studies on its population genetics across different geographical regions remain scarce. The central mountain ranges in Taiwan, comprising more than two hundred peaks above 3000 m in elevation, extend from the north to the south of the island, creating distinct eastern and western geographical divisions. This study utilizes microsatellite markers to explore the genetic differentiation of F. taiwana populations located in the eastern and western regions of the mountain ranges. Our findings reveal substantial genetic differentiation among populations inhabiting Taiwan’s western region compared to those in the eastern region. This indicates that the topographical barriers presented by the mountain ranges significantly restrict gene flow, particularly given the species’ limited active flight ability and habitat preferences. Although passive dispersal mechanisms, like wind or human activity, could contribute, this study concludes that the gene flow of F. taiwana between the western and eastern regions is primarily influenced by topographical constraints.

1. Introduction

Forcipomyia (Lasiohelea) taiwana (Shiraki) (Diptera: Ceratopogonidae), a minuscule bloodsucking midge of about 1.4 mm in length, is commonly found in the urban and suburban locales of Taiwan, especially during the spring and summer months [1]. Known for its marked predilection for human blood [2], the species exhibits diurnal biting behavior, typically starting around two hours after sunrise [3]. For females of this species, obtaining a blood meal is crucial for ovarian development and successful reproduction [4]. Although F. taiwana does not transmit arthropod-borne viruses, its bites may induce severe allergic reactions in certain individuals [5]. Additionally, large swarms of these midges can considerably disrupt outdoor activities, thereby adversely affecting Taiwan’s leisure sector [1].
Initially discovered in 1913 by Tokuichi Shiraki in Taichung County, Taiwan [6], F. taiwana was later identified across 11 Taiwanese counties, except Miaoli, Kaohsiung, Pingtung, and Taitung, between 1990 and 1991 [1]. Subsequent surveys from 2009 to 2012 revealed its presence throughout the island [3,7]. Thriving in moderately moist environments, F. taiwana is typically found in grassy, bush-rich areas, such as parks, school grounds, and villages near foothills and recreational sites [8]. Its altitudinal distribution mainly falls below 250 m, with occurrences up to 500 m [9]. The prevalence of this species is closely linked to human activity, particularly due to the female’s strong preference for human blood. The females exhibit limited flight capabilities, averaging around 2 m in height and rarely exceeding 4 m [8,10]. Their restricted straight flight ability suggests that walking at speeds over 1 m per second can effectively prevent bites, indicating that F. taiwana might not engage in active host-seeking behavior and that their egg-laying sites may coincide with adult habitats [8]. Breeding year-round, female F. taiwana typically deposit eggs in sunlit, humid soil, where blue-green or green algae, essential for larval nutrition, are abundant [8,11,12]. Following a blood meal, a gravid female lays approximately 40 eggs over two to three days [4,11,13]. The life cycle, spanning approximately 16 days in conditions of 26 °C and 70% relative humidity, includes embryogenesis (2–3 days), four larval stages (7–10 days), and pupal development (3 days) [13]. Hence, in environments with abundant human blood sources, F. taiwana populations can swiftly multiply.
While F. taiwana’s widespread presence is evident, the population genetics and genetic structure underlying its distribution remain poorly understood. To unravel the genetic underpinnings of F. taiwana’s distribution pattern, we employed microsatellite markers. Microsatellites, also known as simple sequence repeats or short tandem repeats, consist of 1–6 bp nucleotide repeats and can be found throughout eukaryotic nuclear genomes. They exhibit co-dominance, high polymorphism, follow Mendelian inheritance patterns, and are often selectively neutral in non-coding regions. In this study, we adopted PacBio long-read sequencing technology to develop microsatellite markers. This approach streamlined the process and significantly enhanced the efficiency of microsatellite marker development. We developed five sets of microsatellite markers and sampled 651 female F. taiwana specimens from eleven different geographic regions, situated on both sides of Taiwan’s central mountain ranges. Our results revealed considerable genetic differentiation between the populations on the western side compared to those on the eastern side of the range. This suggests that the topographical barriers posed by the mountain ranges might significantly impede gene flow within these populations. Such findings highlight that the dispersal of F. taiwana is intricately linked to the landscape, and that factors like wind or human-assisted spread, as potential passive dispersal mechanisms, warrant further investigation for a comprehensive understanding of F. taiwana’s dispersion mechanism.

2. Materials and Methods

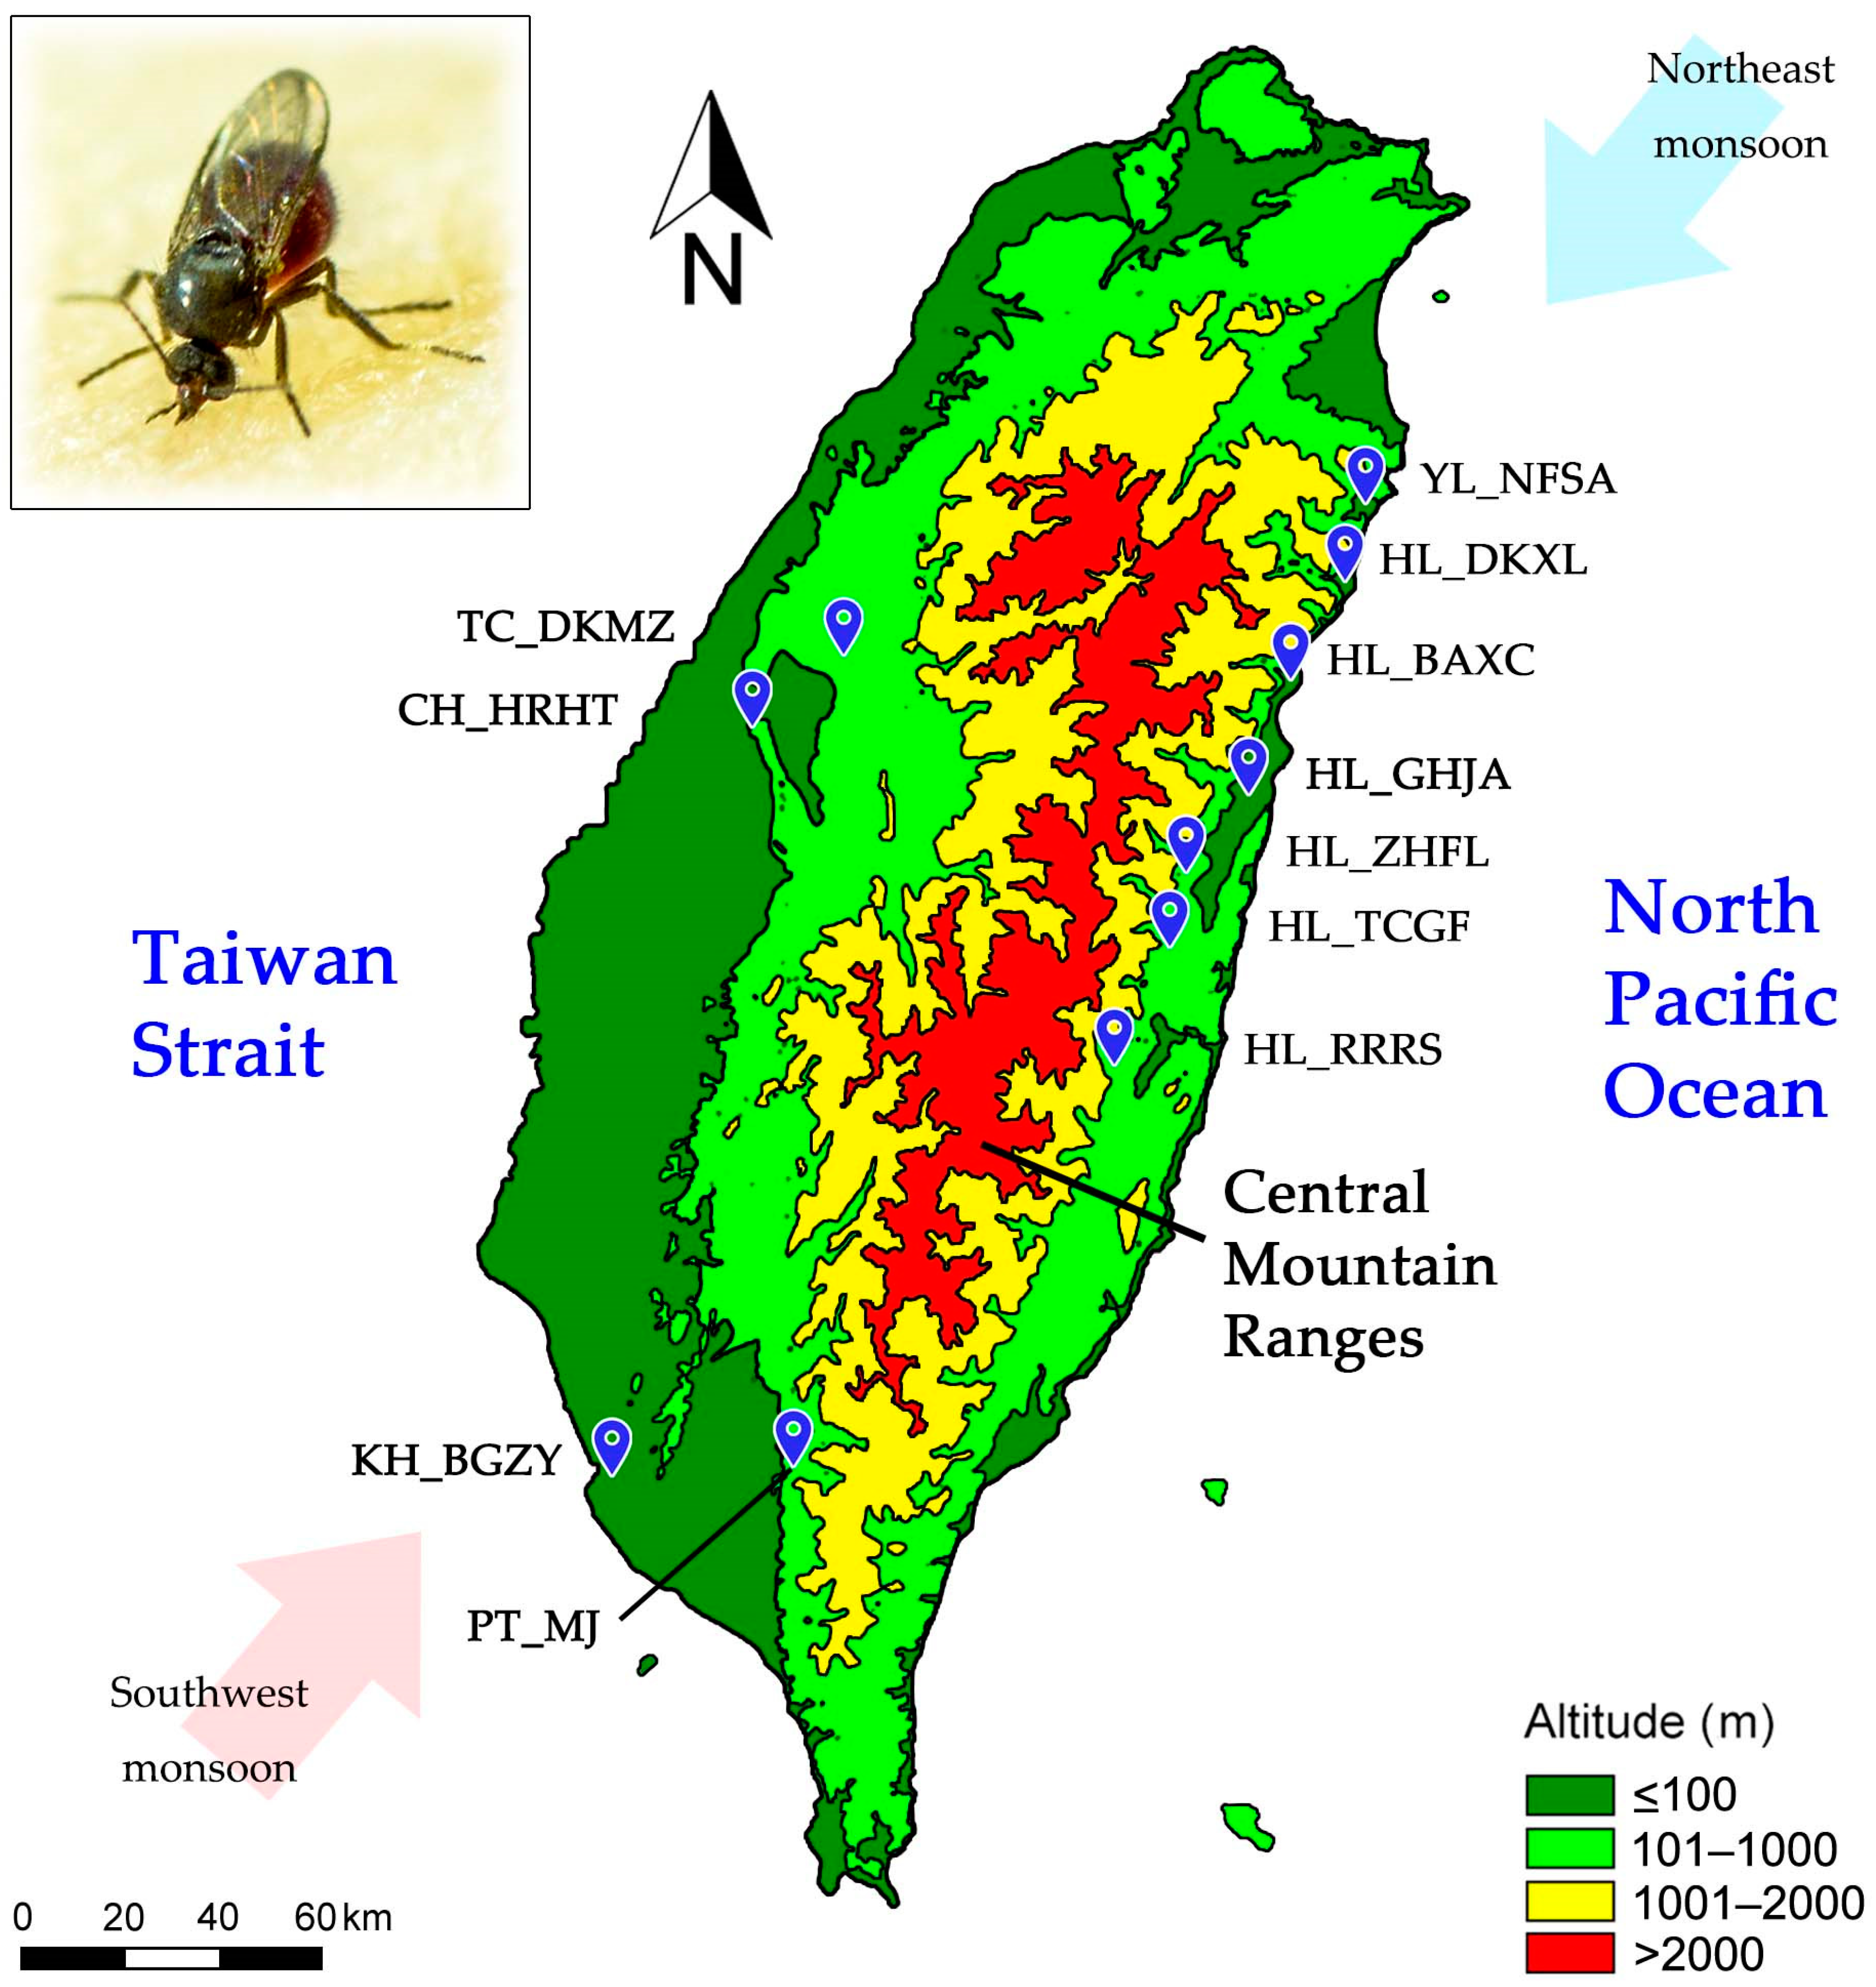
2.1. Sample Collection

In this study, 651 female F. taiwana specimens were collected from eleven different geographic locations in the eastern and western regions of the central mountain ranges (Figure 1). The identification of these specimens was conducted following the guidelines outlined in the ‘Catalogue and Keys of Chinese Ceratopogonidae (Insecta, Diptera)’ [14]. For the purpose of our study, a group of F. taiwana specimens collected from a specific geographic location was defined as a “population” (refer to Table 1 for detailed locations and sample sizes). To ensure the preservation of the genetic material, all collected specimens were immediately stored in 95% ethanol. Subsequent storage was performed at 4 °C to maintain the integrity of the samples until further analysis could be conducted. This approach was designed to optimize the quality of the genetic material for the subsequent development of microsatellite markers and detailed genetic analysis.

2.2. Isolation of Genomic DNA

For the extraction of polymerase chain reaction (PCR)-ready genomic DNA from F. taiwana specimens, we employed a modified version of the HotSHOT method [15]. The process began with the homogenization of each individual midge in 550 μL of 50 mM NaOH. This mixture was then heated to 95 °C for 20 min. Following this, the samples were rapidly cooled on ice for 5 min. After the initial lysis and cooling, the DNA solution was neutralized by adding 50 μL of 1M Tris-HCl (pH 8.0). The sample was then centrifuged at 16,000× g for 10 min at room temperature. The clear supernatant, containing the genomic DNA, can be kept at 4 °C for several weeks without significant degradation. For long-term preservation, the supernatant can be stored at −20 °C.

2.3. Amplification of Microsatellite Markers and Fragment Analysis

For the development of microsatellite markers in F. taiwana, we utilized Circular Consensus Sequencing reads (GenBank accession No. MW921469 to MW921473) generated from the PacBio Sequel System (Pacific Biosciences, Menlo Park, CA, USA). The primer design for PCR was facilitated using Primer 3 software using default settings [16], as detailed in Table 2. Following the method developed by Oetting et al. [17], with some modifications, each forward primer includes a 19 bp M13 sequence (CACGACGTTGTAAAACGAC) at its 5′ end. We employed fluorescent-labeled M13 primers (Life Technologies, Carlsbad, CA, USA) in the PCR reaction, enabling the generation of fluorescent-labeled fragments suitable for fragment analysis. The specific fluorescent labels used for different microsatellite markers were PET for P1, VIC for P2 and P4, and 6-FAM for P3 and P5. The PCR reactions were conducted in a 10 μL mixture, consisting of 5 μL of Taq master mix (amaR OnePCR from GeneDireX, Taoyuan, Taiwan), 1 μL of PCR-ready genomic DNA, 30 nM of the fluorescent-labeled M13 primer, and varying amounts of the specific forward and reverse primers (refer to Table 2 for details). The PCR conditions included an initial denaturation at 95 °C for 30 s, followed by 5 cycles of 95 °C for 30 s, 60 °C for 30 s, and 72 °C for 30 s. This was followed by 30 cycles at 95 °C for 30 s, 50 °C for 30 s, and 72 °C for 30 s, concluding with a final extension at 72 °C for 40 min. The PCR products were processed on the LabCycler 96 (SensoQuest, Göttingen, Germany). For fragment analysis, the fluorescent-labeled PCR products of the five microsatellite markers were pooled in equal volumes and analyzed using an ABI 3730XL DNA Analyzer (Applied Biosystems, Bedford, MA, USA). GeneScan 500 LIZ was employed as a size standard in this analysis.

2.4. Genotype Scoring and Data Analysis

For the analysis of microsatellite data, we used Geneious software (version R11) (Biomatters Ltd., Auckland, New Zealand), equipped with the Microsatellite Plugin (version 1.4.7), to conduct size analysis and peak calling. The data obtained from fragment analysis were subjected to population genetic analysis using GenAlEx (ver. 6.51b2) [18,19]. We performed frequency-based analyses, including the calculation of the number of effective alleles (Ne), allele frequencies, observed heterozygosities (Ho), expected heterozygosities (He), and the inbreeding coefficient/fixation index (F). Analysis of Molecular Variance (AMOVA) was used to assess pairwise genetic differentiation (FST) with 999 permutations. For visualizing the hierarchical clustered heatmap based on pairwise FST values derived from AMOVA, we employed the pheatmap package (version 1.0.12) in R. Both AMOVA and Principal Coordinate Analysis (PCoA) were performed using the GenAlEx software. To identify the genetic structure of the sampled populations, we utilized the Bayesian clustering algorithm implemented in the software STRUCTURE (ver. 2.3.4) [20]. We ran the analysis under an admixture model with correlated allele frequencies. For each potential number of clusters (K), ranging from one to five, we conducted 50 independent runs to ensure consistency across results. Each run consisted of a burn-in period of 100,000 iterations followed by 100,000 Markov Chain Monte Carlo (MCMC) replicates. The optimal number of clusters was determined using the ΔK method [21], as implemented in Structure Harvester [22]. This approach assesses the rate of change in the log probability of data between successive K values to identify the most likely number of genetic clusters. Following the determination of the optimal K, we utilized Clumpp (ver. 1.1.2) software [23] to align multiple runs and average the membership coefficients for each individual across all runs for the best K. This step was crucial to account for label switching and multimodality issues inherent in STRUCTURE outputs. We selected the Greedy algorithm with 1000 random input orders in Clumpp to achieve the optimal alignment of individual assignments across different runs.

3. Results

3.1. Genetic Structures of F. taiwana Populations Revealed by Microsatellite Analysis

Taiwan is geographically divided into distinct eastern and western regions by a series of mountain ranges, which run through the heart of the island from the north to the south (Figure 1). These are referred to as the central mountain ranges in this manuscript. The western populations of F. taiwana are separated from their eastern counterparts by the mountain ranges, which serve as a significant geographical barrier with an average elevation of 2000 m. To determine the genetic structure of F. taiwana populations on either side of the mountain ranges, we sampled female F. taiwana specimens from eleven geographical locations (Figure 1). Specifically, in the eastern region, 333 specimens were collected from seven locations, including Hualien County (HL) and Yilan County (YL). In the western region, 189 specimens were gathered from Taichung City (TC) and Changhua County (CH), and 129 specimens from Pingtung County (PT) and Kaohsiung City (KH) in the southwestern region (Table 1).
We designed five microsatellite markers for F. taiwana, utilizing circular consensus sequencing reads from PacBio long-read sequencing. A total of 651 samples from eleven locations, referred to as populations in this study, were genotyped using these markers (Table 2). All markers were polymorphic, with fragment sizes ranging from 138 to 465 bp, and the number of alleles per locus varied from 5 to 8. Missing data were minimal, observed as only 0.15% in P1 and P2. Analysis via Micro-Checker software [24] indicated no evidence of null alleles across all examined populations.
The heterozygosity analysis (Ho, He, and uHe) of the eleven F. taiwana populations, detailed in Table 3, reveals diverse genetic profiles. Some populations displayed high levels of both observed (Ho) and expected (He) heterozygosity, indicative of significant genetic diversity and effective random mating. In contrast, discrepancies between Ho and He in other populations suggest potential inbreeding or population substructuring. For example, in the TC_DKMZ population, the alignment of Ho (0.589), He (0.566), and uHe (0.569) for locus P1 demonstrated a good alignment of observed and expected heterozygosity, indicative of a rich genetic variation and random mating. However, the HL_RRRS population showed a lower Ho (0.106) compared to He (0.173) for locus P3, hinting at genetic uniformity and possible inbreeding, yet other loci in the same population (P1, P2, and P5) displayed closer Ho and He values, suggesting the existence of subpopulation structures. The inbreeding coefficient (F) further illustrates this complexity, with positive and negative values across different populations and loci. The mean values of F over the five loci in each population range from −0.046 (HL_ZHFL) to 0.111 (HL_RRRS). These findings underscore the complex genetic structures within F. taiwana populations, characterized by varying levels of heterozygosity and inbreeding coefficients.

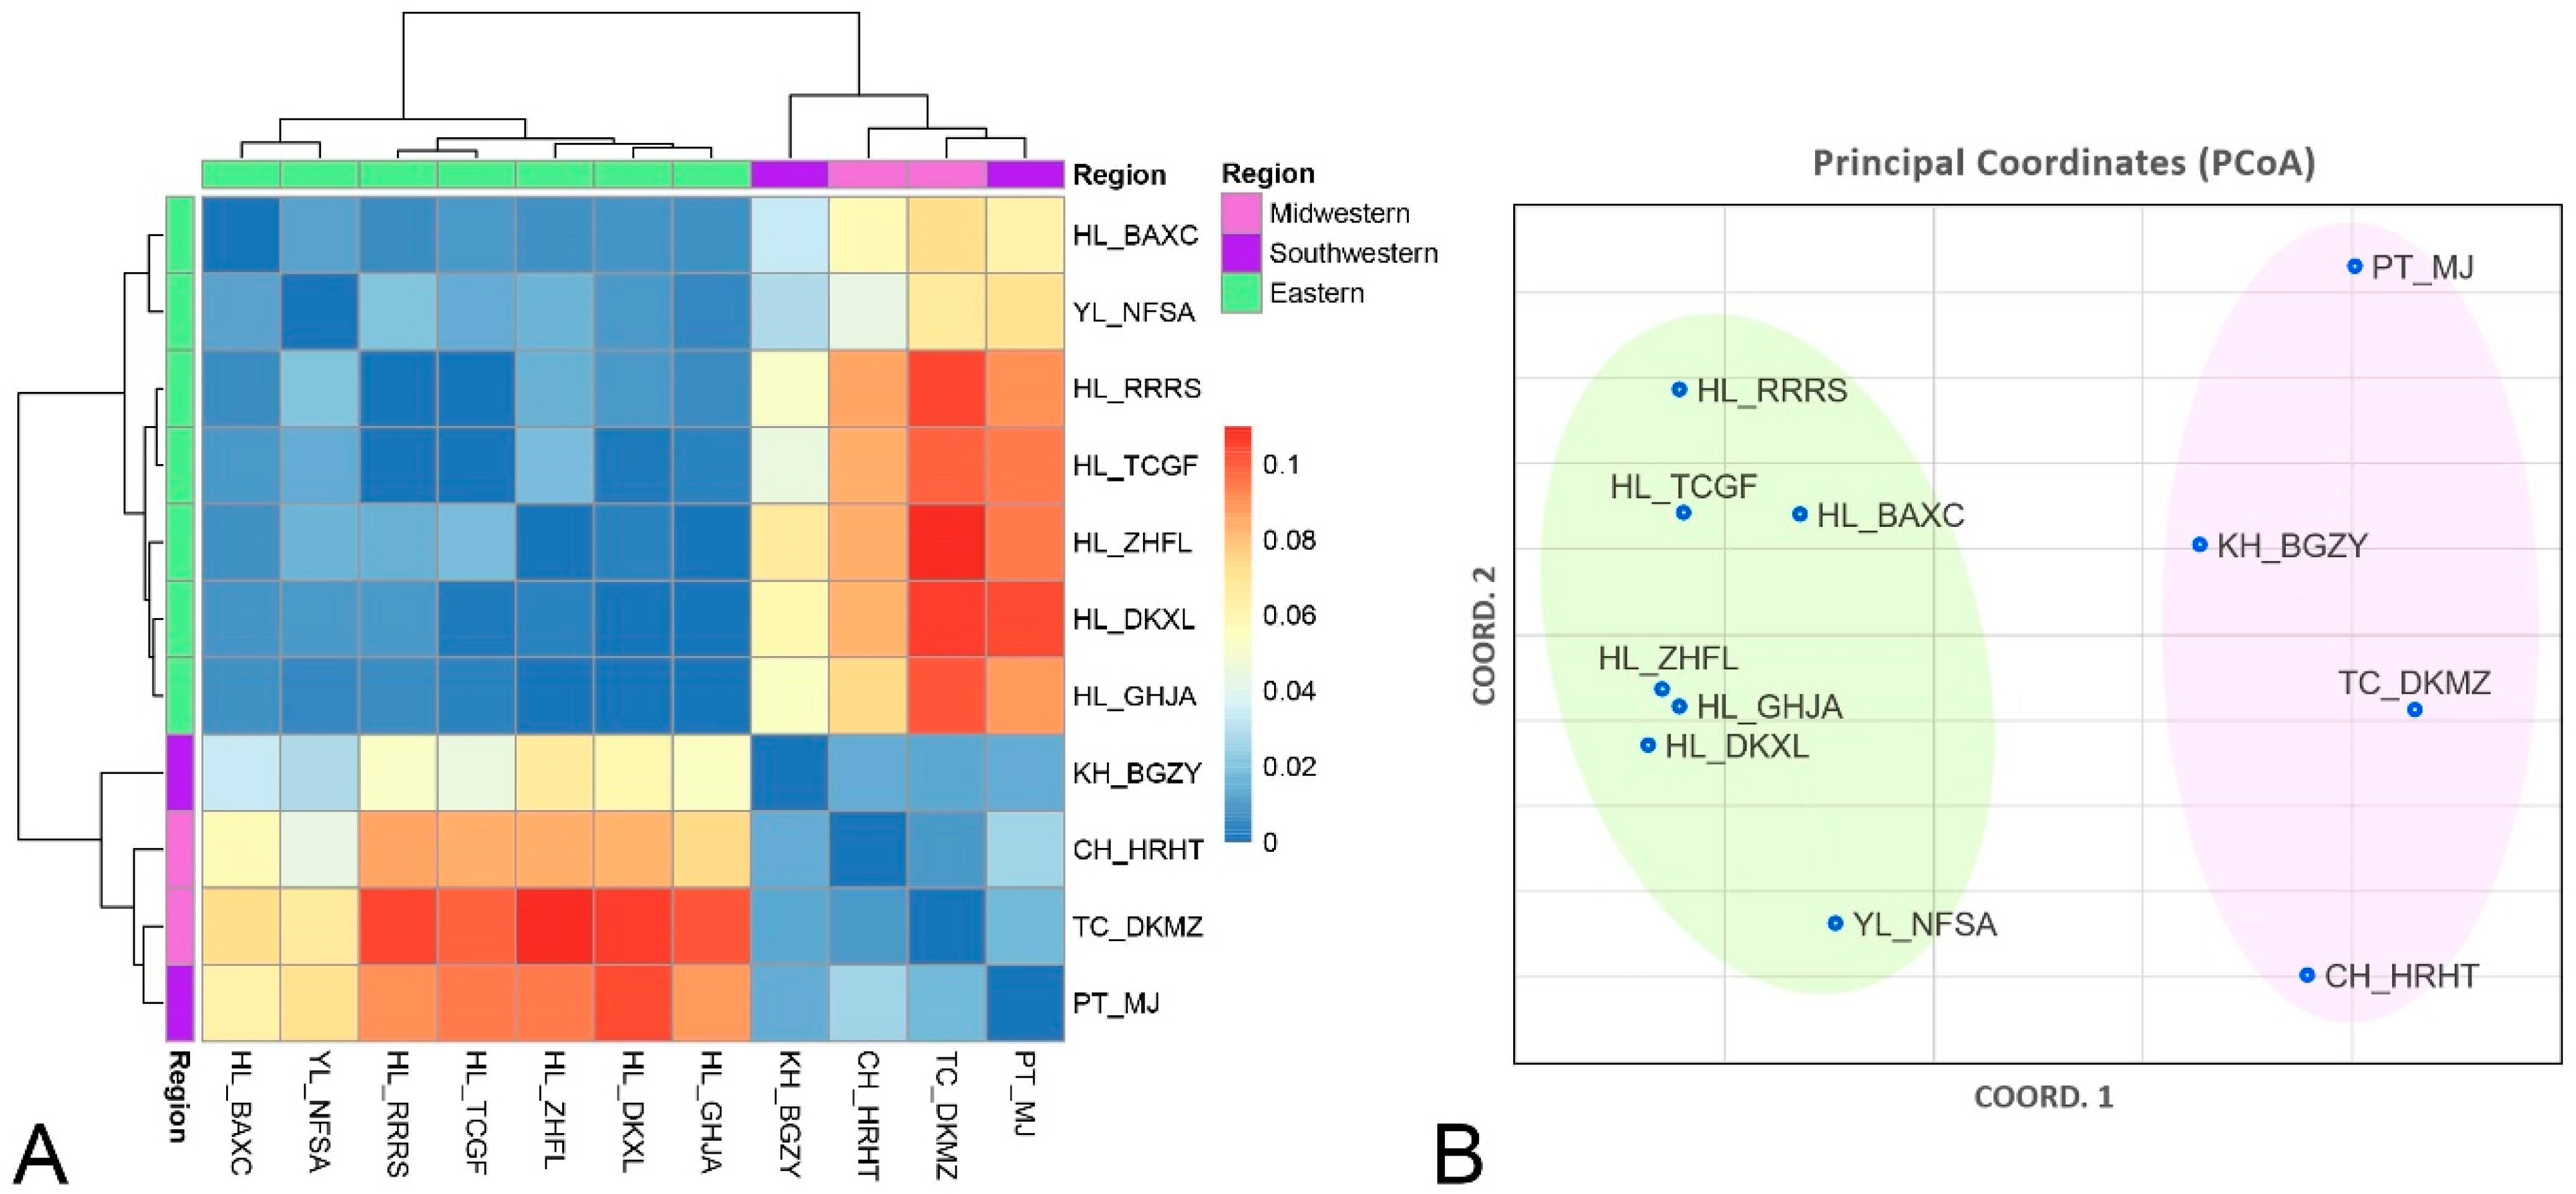
3.2. Regional Genetic Differentiation in F. taiwana across Taiwan’s Central Mountain Range by the Analysis of Molecular Variance

To assess the extent of genetic differentiation among F. taiwana populations across the central mountain ranges, we employed the Analysis of Molecular Variance (AMOVA) method [25]. We separated the eleven populations into three regions (eastern, midwestern, southwestern) for AMOVA analysis (Table 1). AMOVA results reveal the distribution of genetic variation at different hierarchical levels. Intriguingly, the majority of genetic variability (92%) is found within individuals, highlighting significant intra-individual genetic diversity. In contrast, variation among regions (eastern, midwestern, southwestern) contributes 5% to the total genetic variance, indicating a moderate, yet significant, geographic impact on genetic differentiation. Meanwhile, variation among populations within these regions is relatively minor (1%), pointing to extensive gene flow, or inherent genetic similarities, among these populations. The genetic variation between individuals within populations is about 2%, suggesting limited genetic differentiation at this level. The fixation indices, including differentiation among regions (FRT = 0.055, p = 0.001), among populations within regions (FSR = 0.01, p = 0.001), overall population differentiation (FST = 0.064, p = 0.001), inbreeding within populations (FIS = 0.021, p = 0.08), and total genetic differentiation (FIT = 0.084, p = 0.001), collectively mirror these patterns of genetic variation. When the eleven F. taiwana populations were grouped into two regions, eastern and western, for AMOVA analysis, the variation among these regions accounted for 6%. The differentiation among regions (FRT) became 0.064 (p = 0.001), and the overall population differentiation (FST) reached 0.075 (p = 0.001). The moderate FST value indicates a noticeable level of genetic differentiation among populations, while the non-significant FIS value suggests that inbreeding is not a major concern within populations.
Further investigation into genetic differentiation and gene flow among F. taiwana populations was carried out by calculating pairwise FST values (Table 4) and the number of migrants (Nm) (Table 5). The observed higher FST values and lower Nm in Table 5 suggest pronounced genetic differentiation between populations from the western (TC_DKMZ, CH_HRHT, PT_MJ, and KH_BGZY) and the eastern (HL_BAXC, HL_DKXL, HL_GHJA, YL_NFSA, HL_RRRS, HL_TCGF, and HL_ZHFL) regions. This pattern indicates potential barriers to gene flow. A notable example is the FST of 0.11 between TC_DKMZ (western) and HL_ZHFL (eastern), which signifies significant genetic differentiation. Conversely, genetic differentiation between the midwestern (TC_DKMZ and CH_HRHT) and the southwestern (PT_MJ, and KH_BGZY) regions is less pronounced, exemplified by an FST of 0.026 between CH_HRHT (midwestern) and PT_MJ (southwestern). Within regions, the lower FST values and higher Nm, as depicted in Table 5, indicate reduced genetic differentiation and increased gene flow among populations, likely due to their closer geographical proximity and similar environmental conditions.
These patterns of genetic differentiation and gene flow are further substantiated by the results of the hierarchical clustered heatmap and Principal Coordinate Analysis (PCoA), based on the FST values. The heatmap (Figure 2A) distinctly reveals intra-regional genetic homogeneity within F. taiwana populations. In contrast, the PCoA (Figure 2B) demonstrates that the western populations form a distinct cluster, separate from the eastern populations, highlighting the clear genetic divergence between these two regions.

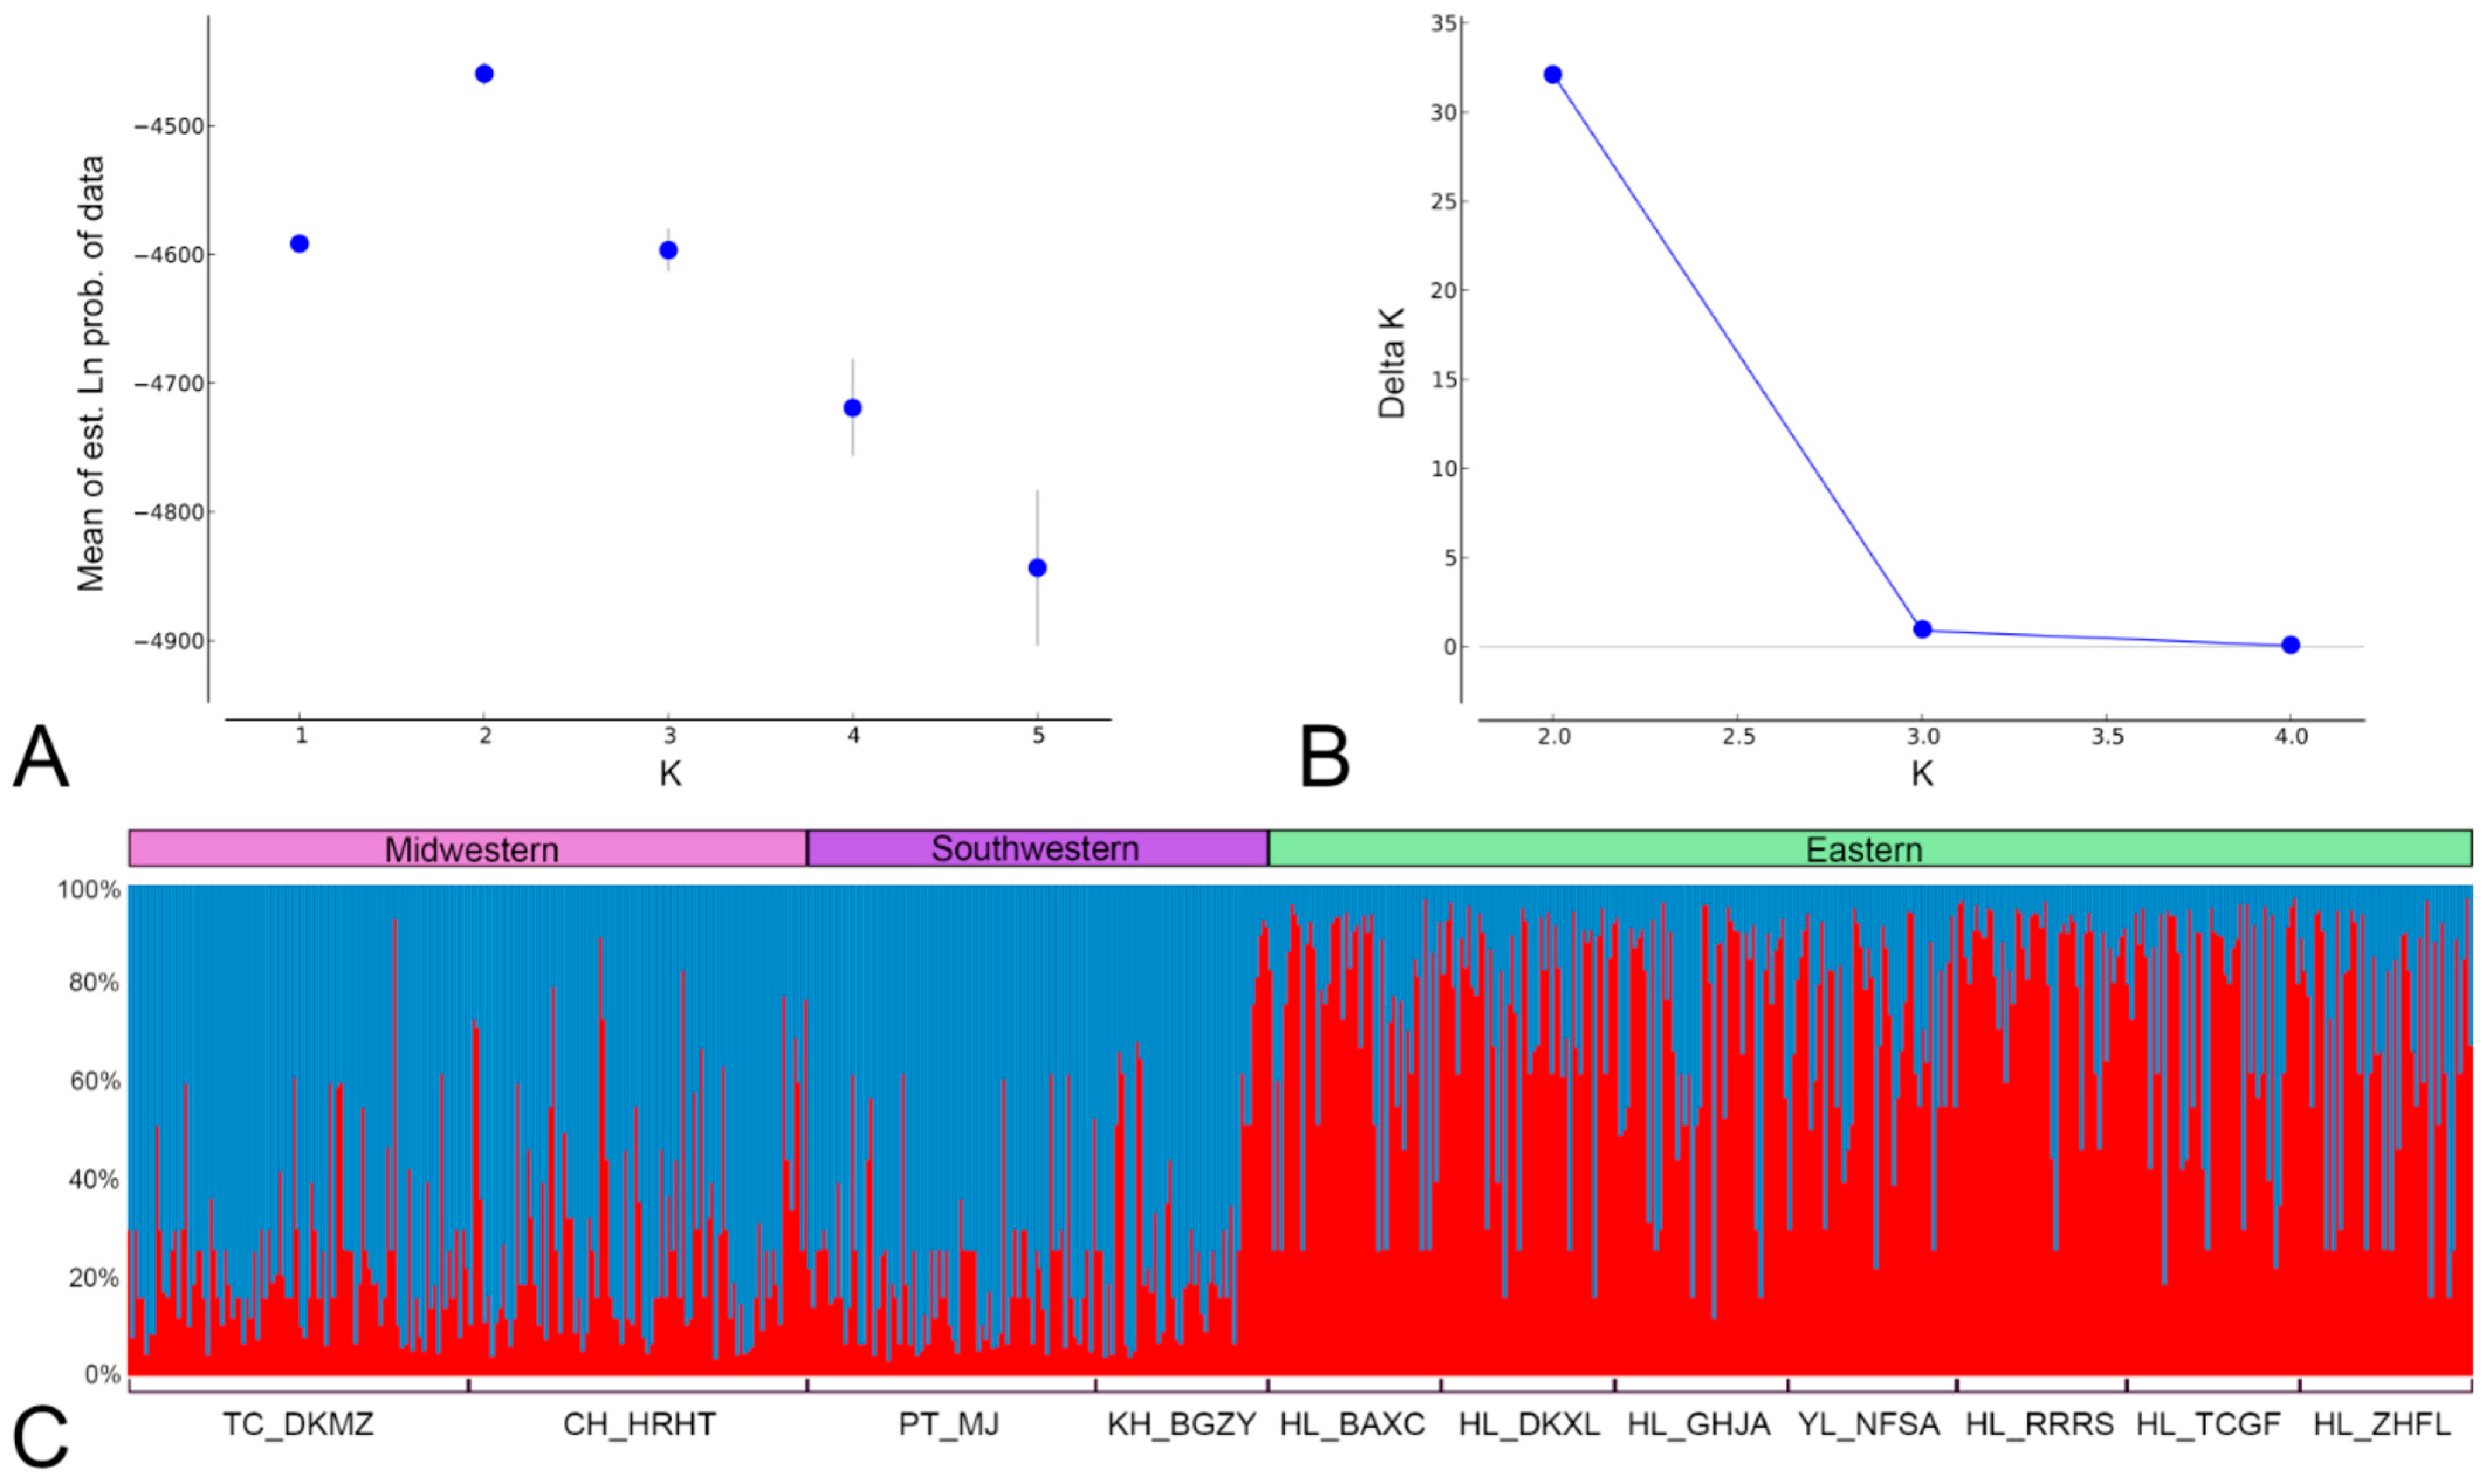
3.3. Bayesian Clustering Analysis of F. taiwana Unveiling Two Distinct Genetic Clusters across Taiwan’s Central Mountain Range

While AMOVA provided initial insights into the distribution of genetic variation across F. taiwana populations, we furthered our analysis using STRUCTURE software, a model-based Bayesian clustering analysis [20], to identify distinct genetic clusters within the eleven populations. The results revealed that the most likely number of genetic clusters (K) within the eleven F. taiwana populations was determined to be two. This was ascertained through the evaluation of the rate of change in the log probability of data between successive K values, which showed a clear peak at K = 2 (Figure 3A,B). In the STRUCTURE results, Cluster 1 predominantly comprised individuals from the western populations, while Cluster 2 mainly included individuals from the eastern populations (Figure 3C). This indicates that F. taiwana populations inhabiting the western region of Taiwan have a distinct genetic makeup compared to those in the eastern region. The admixture analysis revealed that most individuals from a specific population belonged predominantly to one cluster, reflecting a strong regional genetic structure, but some exhibited mixed ancestry. Notably, certain individuals from the KH_BGZY population in the western region displayed significant characteristics of Cluster 2 (Figure 3C), hinting at some level of gene flow between populations situated on opposite sides of the mountain ranges. This is likely attributable to historical migration or recent human-mediated movement. The FST ranged from 0.12 to 0.29, confirming moderate genetic differentiation between the identified clusters. These STRUCTURE findings corroborate the AMOVA results, highlighting significant genetic variation among populations located on either side of the central mountain ranges. This genetic division is probably indicative of the ecological barrier imposed by the mountain ranges.

4. Discussion

Taiwan’s mountain ranges, comprising 268 peaks exceeding 3000 m in elevation, bisect the island into two distinct halves along a north–south axis. This geographic division creates a stark contrast between the rugged, steep terrain of eastern Taiwan and the gentler, rolling landscapes with expansive plains in the west. Such topographical diversity fosters varied ecosystems and communities across the eastern and western regions of the island. Previous studies have indicated genetic divergence in species inhabiting low-elevation areas on the eastern and western flanks of Taiwan [26,27]. In this study, we used microsatellite markers to genotype and provide the genetic evidence to demonstrate that the population structure of F. taiwana in western Taiwan is distinctly different from its counterpart in the eastern region.
In population genetics, the commonly utilized DNA markers can be developed from mitochondrial DNA (mtDNA) or nuclear genome. While mtDNA markers are relatively easy to develop, they come with several limitations: (1) only the maternal lineage can be traced, (2) mtDNA may be subject to selection pressures, (3) individuals may have multiple mtDNA haplotypes, and (4) mtDNA sequences can integrate into the nuclear genome, producing nonfunctional nuclear copies with sequence variations [28,29]. These factors can complicate the analysis and interpretation in mtDNA-based studies. In contrast, nuclear markers, such as microsatellite DNA, offer advantages like co-dominance, high polymorphism, Mendelian inheritance, and high variability in non-coding regions. Traditionally, developing microsatellite markers has been labor-intensive and expensive [30]. However, in this study, we developed microsatellite primers de novo and circumvented the traditional, laborious methods of microsatellite identification by employing PacBio long-read sequences. This approach, leveraging third-generation sequencing technology, makes microsatellite marker development more feasible and accessible.
The evaluation of observed heterozygosity (Ho), expected heterozygosity (He), and inbreeding coefficient (F) across eleven F. taiwana populations revealed a diverse genetic landscape. Some populations demonstrate high Ho and He, indicating substantial genetic diversity and effective random mating. However, discrepancies between Ho and He in other populations hint at possible inbreeding or population substructuring. We observed mixed F values within certain populations, with higher F values at specific loci, such as HL_RRRS (F = 0.386 for P3 and F = 0.327 for P4), YL_NFSA (F = 0.228 for P3), HL_BAXC (F = 0.247 for P3), HL_TCGF (F = 0.237 for P3), and KH_BGZY (F = 0.286 for P4). Notably, this pattern was not uniform across all loci within the same populations (Table 3). This variability could be attributed to various factors, including subpopulation structures. Pesticide use, often employed to control F. taiwana populations, might induce subpopulation structures as genetic variants conferring resistance could become dominant. This shift could alter allele frequencies, potentially increasing F values. However, confirming this hypothesis requires further targeted research, taking into account both ecological and genetic factors. Despite observing mixed F values in some populations, Analysis of Molecular Variance (AMOVA) results suggest that inbreeding is not a predominant issue within these populations.
Analysis of pairwise FST from AMOVA, along with the hierarchical clustered heatmap and Principal Coordinate Analysis (PCoA), revealed that F. taiwana populations in western Taiwan form a distinct cluster, distinctly separated from those in the eastern region. The FRT value (FRT = 0.064, p = 0.001) suggests moderate genetic differentiation between the eastern and western regions. This observation is further corroborated by model-based clustering analysis using STRUCTURE software, reinforcing the notion of clear genetic divergence between these two regions. Notably, some individuals from the KH_BGZY population in the western region exhibit genetic characteristics typical of eastern populations. KH_BGZY, being the Taiwan Native Botanical Garden, might have inadvertently caused the human-mediated dispersion of F. taiwana. This could have happened if larvae, which reside in the soil, were unintentionally transported during the transplantation of plants from the eastern region to the botanical garden. Such an event could introduce genetic material from the eastern population into the western population.
The central mountain ranges in Taiwan acts as a significant topographic barrier, potentially restricting the intermixing of populations on either side, and thus facilitating early stages of genetic differentiation despite ongoing gene flow. Given F. taiwana’s average flight height of 2 m and limited flying ability [8,10], active flight over the central mountain ranges is almost impossible. Furthermore, F. taiwana’s habitat is predominantly below 500 m in elevation, indicating difficulty in colonizing higher elevations. These factors suggest that the topographic barrier created by the central mountain ranges significantly restricts gene flow, as evidenced in this study. While passive dispersal mediated by human activities, such as transportation via vehicles, could contribute to F. taiwana dispersion, the marked genetic differentiation between western and eastern populations implies that this human-mediated movement, though present, may have limited effect. Additionally, Taiwan’s distinct monsoon winds, including the southwest monsoon in summer and the northeast monsoon in winter (Figure 1), could theoretically facilitate passive dispersion. However, considering their directional patterns, their contribution to gene flow between the eastern and western regions appears limited. Thus, we conclude that the gene flow of F. taiwana between these regions is primarily influenced by the topographic constraints imposed by Taiwan’s mountain ranges.

Author Contributions

Conceptualization, M.-D.L. and Y.-H.C.; Investigation, Y.-C.K. and M.-C.S.; Methodology, M.-D.L., Y.-H.C., S.-C.W., C.-F.L. and W.-C.T.; Visualization, S.-C.W.; Writing—original draft preparation, M.-D.L. and Y.-H.C.; Writing—review and editing, M.-D.L. and Y.-H.C.; Supervision and Project administration, M.-D.L.; Funding acquisition, M.-D.L. All authors have read and agreed to the published version of the manuscript.

Funding

This research was funded by the National Science and Technology Council of Taiwan, grant numbers MOST 111-2327-B-320-001 and MOST 110-2327-B-320-001 to M.-D.L.

Data Availability Statement

The data presented in this study are available on request from the corresponding author.

Acknowledgments

The authors acknowledge the Genomics Center for Clinical and Biotechnological Applications of National Core Facility for Biopharmaceuticals, Taiwan (NSTC 112-2740-B-A49-001 and MOST 110-2740-B-A49A-501) for sequencing.

Conflicts of Interest

The authors declare no conflict of interest. The funders had no role in the design of the study; in the collection, analyses, or interpretation of data; in the writing of the manuscript; or in the decision to publish the results.

References

  1. Chuang, Y.Y.; Lin, C.S.; Wang, C.H.; Yeh, C.C. Distribution and seasonal occurrence of Forcipomyia taiwana (Diptera: Ceratopogonidae) in the Nantou area in Taiwan. J. Med. Entomol. 2000, 37, 205–209. [Google Scholar] [CrossRef] [PubMed]
  2. Chen, C.S.; Lien, J.C.; Lin, Y.N.; Hsu, S.J. The diurnal biting pattern of a bloodsucking midge Forcipomyia (Lasiohelea) taiwana (Shiraki) (Diptera, Ceratopogonidae). Chin. J. Microbiol. Immunol. 1981, 14, 54–56. [Google Scholar]
  3. Shih, C.L.; Liao, Q.M.; Wang, Y.Y.; Tu, W.C. Abundance and host-seeking activity of the biting midge, Forcipomyia taiwana (Diptera: Ceratopogonidae). J. Asia Pac. Entomol. 2019, 22, 1053–1059. [Google Scholar] [CrossRef]
  4. Wang, S.C.; Ching, Y.H.; Krishnaraj, P.; Chen, G.Y.; Radhakrishnan, A.S.; Lee, H.M.; Tu, W.C.; Lin, M.D. Oogenesis of Hematophagous Midge Forcipomyia taiwana (Diptera: Ceratopogonidae) and Nuage Localization of Vasa in Germline Cells. Insects 2020, 11, 106. [Google Scholar] [CrossRef] [PubMed]
  5. Chen, Y.H.; Hwang, G.Y.; Chen, P.C.; Tu, W.C.; Lee, M.F. Molecular cloning and immunologic characterization of for t 2: A major allergen from the biting midge Forcipomyia taiwana. Allergy 2011, 66, 703–705. [Google Scholar] [CrossRef] [PubMed]
  6. Shiraki, T. Investigation on general injurious insects. Taiwan. Sotokufu Noji Shikenjo Tolubetsu Hokodu 1913, 8, 286–297. [Google Scholar]
  7. Yeh, W.B.; Lee, H.M.; Tu, W.C.; Tang, L.C.; Lee, P.Y. Molecular differentiation and diversity of Forcipomyia taiwana (Diptera: Ceratopogonidae) based on the mitochondrial cytochrome oxidase II sequence. J. Med. Entomol. 2009, 46, 249–256. [Google Scholar] [CrossRef] [PubMed]
  8. Chen, C.S.; Lin, C.N.; Chung, C.L.; Hung, H. Preliminary observations on the larval breeding sites and adult resting places of a bloodsucking midge, Forcipomyia (Lasiohelea) taiwana (Shiraki) (Diptera: Ceratopogonidae). Nat’l Chung Hsing Univ. Bull. Soc. Entomol. 1979, 14, 51–59. [Google Scholar]
  9. Hsieh, P.Y. Studies on the oviposition, population dynamics and the susceptibility to insect growth regulators of biting midge. In Forcipomyia Taiwana (Shiraki) (Diptera: Ceratopogonidae); National Chung Hsing University: Taichung, Taiwan, 2007. [Google Scholar]
  10. Shih, C.L.; Tu, W.C. Blood-sucking behavior of female Forcipomyia taiwana (Shiraki) (Diptera: Ceratopogonidae). Formos. Entomol. 2019, 39, 105–114. [Google Scholar]
  11. Sun, W.K.C. Study of a biting midge, Forcipomyia (Lasiohelea) taiwana (Shiraki) (Diptera: Ceratopogonidae). I. Description of the complete life cycle of the midge reared in the laboratory. Biol. Bull. Tunghai Univ. Taiwan. Taichung 1967, 29, 1–10. [Google Scholar]
  12. Yeh, C.C.; Chuang, Y.Y. Colonization and bionomics of Forcipomyia taiwana (Diptera:Ceratopogonidae) in the laboratory. J. Med. Entomol. 1996, 33, 445–448. [Google Scholar] [CrossRef] [PubMed]
  13. Luo, Y.P. Establishing and maintaining colonies of Forcipomyia taiwana in the laboratory. J. Vector Ecol. 2018, 43, 328–333. [Google Scholar] [CrossRef] [PubMed]
  14. Yu, Y. (Ed.) Catalogue and Keys of Chinese Ceratopogonidae (Insecta, Diptera); Military Medical Science Press: Beijing, China, 2005; p. 187. [Google Scholar]
  15. Meeker, N.D.; Hutchinson, S.A.; Ho, L.; Trede, N.S. Method for isolation of PCR-ready genomic DNA from zebrafish tissues. Biotechniques 2007, 43, 610–614. [Google Scholar] [CrossRef] [PubMed]
  16. Untergasser, A.; Cutcutache, I.; Koressaar, T.; Ye, J.; Faircloth, B.C.; Remm, M.; Rozen, S.G. Primer3—New capabilities and interfaces. Nucleic Acids Res. 2012, 40, e115. [Google Scholar] [CrossRef] [PubMed]
  17. Oetting, W.S.; Lee, H.K.; Flanders, D.J.; Wiesner, G.L.; Sellers, T.A.; King, R.A. Linkage analysis with multiplexed short tandem repeat polymorphisms using infrared fluorescence and M13 tailed primers. Genomics 1995, 30, 450–458. [Google Scholar] [CrossRef]
  18. Peakall, R.; Smouse, P.E. GENALEX 6: Genetic analysis in Excel. Population genetic software for teaching and research. Mol. Ecol. Notes 2006, 6, 288–295. [Google Scholar] [CrossRef]
  19. Peakall, R.; Smouse, P.E. GenAlEx 6.5: Genetic analysis in Excel. Population genetic software for teaching and research—An update. Bioinformatics 2012, 28, 2537–2539. [Google Scholar] [CrossRef]
  20. Pritchard, J.K.; Stephens, M.; Donnelly, P. Inference of population structure using multilocus genotype data. Genetics 2000, 155, 945–959. [Google Scholar] [CrossRef]
  21. Evanno, G.; Regnaut, S.; Goudet, J. Detecting the number of clusters of individuals using the software STRUCTURE: A simulation study. Mol. Ecol. 2005, 14, 2611–2620. [Google Scholar] [CrossRef]
  22. Earl, D.A.; vonHoldt, B.M. STRUCTURE HARVESTER: A website and program for visualizing STRUCTURE output and implementing the Evanno method. Conserv. Genet. Resour. 2012, 4, 356–361. [Google Scholar] [CrossRef]
  23. Jakobsson, M.; Rosenberg, N.A. CLUMPP: A cluster matching and permutation program for dealing with label switching and multimodality in analysis of population structure. Bioinformatics 2007, 23, 1801–1806. [Google Scholar] [CrossRef] [PubMed]
  24. Van Oosterhout, C.; Hutchinson, W.F.; Wills, D.P.M.; Shipley, P. micro-checker: Software for identifying and correcting genotyping errors in microsatellite data. Mol. Ecol. Notes 2004, 4, 535–538. [Google Scholar] [CrossRef]
  25. Meirmans, P.G. Using the AMOVA framework to estimate a standardized genetic differentiation measure. Evolution 2006, 60, 2399–2402. [Google Scholar] [CrossRef] [PubMed]
  26. Toda, M.; Nishida, M.; Matsui, M.; Lue, K.-Y.; Ota, H. Genetic variation in the Indian rice frog, Rana limnocharis (Amphibia: Anura), in Taiwan, as revealed by allozyme data. Herpetologica 1998, 54, 73–82. [Google Scholar]
  27. Shih, H.T.; Hung, H.C.; Schubart, C.D.; Chen, C.A.; Chang, H.W. Intraspecific genetic diversity of the endemic freshwater crab Candidiopotamon rathbunae (Decapoda, Brachyura, Potamidae) reflects five million years of the geological history of Taiwan. J. Biogeogr. 2006, 33, 980–989. [Google Scholar] [CrossRef]
  28. Song, H.; Buhay, J.E.; Whiting, M.F.; Crandall, K.A. Many species in one: DNA barcoding overestimates the number of species when nuclear mitochondrial pseudogenes are coamplified. Proc. Natl. Acad. Sci. USA 2008, 105, 13486–13491. [Google Scholar] [CrossRef]
  29. Zhang, D.X.; Hewitt, G.M. Nuclear integrations: Challenges for mitochondrial DNA markers. Trends Ecol. Evol. 1996, 11, 247–251. [Google Scholar] [CrossRef]
  30. Glenn, T.C.; Schable, N.A. Isolating microsatellite DNA loci. Methods Enzymol. 2005, 395, 202–222. [Google Scholar] [CrossRef]
Figure 1. Sampling Locations of F. taiwana in Taiwan. The map illustrates the altitude of the landscape, with variations indicated by the color code. The wind directions of the southwest monsoon in summer (pink arrow) and the northeast monsoon in winter (blue arrow) are shown. The scale bar represents 60 km. Inset: A female F. taiwana biting human skin.
Insects 15 00023 g001
Figure 2. Genetic Differentiation of F. taiwana Populations between the Western and the Eastern Regions. (A) A hierarchical clustered heatmap, constructed based on FST values, reveals a pronounced inter-regional genetic differentiation and a notable intra-regional genetic homogeneity among these populations. The heatmap includes a color code for geographical regions on the right, along with a color bar representing the range of FST values. (B) The Principal Coordinate Analysis (PCoA), utilizing these FST values, demonstrates that the western populations (TC_DKMZ, CH_HRHT, PT_MJ, and KH_BGZY) form a distinct cluster, separate from the eastern populations (HL_BAXC, HL_DKXL, HL_GHJA, YL_NFSA, HL_RRRS, HL_TCGF, HL_ZHFL). The x-axis (COORD.1) accounts for 80% of the observed variation, while the y-axis (COORD.2) accounts for 8.84%.
Insects 15 00023 g002
Figure 3. Bayesian Clustering Analysis of F. taiwana Using STRUCTURE Reveals Two Distinct Genetic Clusters. The optimal number of genetic clusters was determined using the ΔK method, as implemented on the Structure Harvester website. (A) Displays the mean estimated log probability of the data for different assumed numbers of genetic clusters (K), ranging from 1 to 5. The likelihood of the data peaks at K = 2, indicating this as the optimal number of genetic clusters. (B) Shows the Delta K values, calculated based on the rate of change in log probability between successive K values, with a pronounced peak at K = 2, further supporting the existence of two distinct genetic clusters. (C) Illustrates the percentage stacked bar chart of aligned clustering results for K = 2, generated using Clumpp software. Each individual is represented by a vertical bar partitioned into colored segments indicating their estimated membership in the two clusters. Cluster 1 mainly includes individuals from western populations (TC_DKMZ, CH_HRHT, PT_MJ, and KH_BGZY), while Cluster 2 consists primarily of individuals from eastern populations (HL_BAXC, HL_DKXL, HL_GHJA, YL_NFSA, HL_RRRS, HL_TCGF, and HL_ZHFL). Populations are delineated along the x-axis, with regional labels provided above the chart.
Insects 15 00023 g003
Table 1. Geographic Locations and Sample Sizes of F. taiwana Specimens.
Geographic Location in Taiwan (Code)Geographic RegionLatitudeLongitudeAltitude (Meters)Sample Size
Nan’ao Farm, Su’ao Township, Yilan County (YL_NFSA)Eastern24.453121.7901847
Taiwan Cement DAKA Park, Xiulin Township, Hualien County (HL_DKXL)Eastern24.300121.7511348
Bo’ai Road, Xincheng Township, Hualien County (HL_BAXC)Eastern24.126121.6511847
Guanghua 10th Street, Ji’an Township, Hualien County (HL_GHJA)Eastern23.932121.5585448
Zhonghua Road, Fenglin Town, Hualien County (HL_ZHFL)Eastern23.747121.45110048
Tangchang Street, Guangfu Township, Hualien County (HL_TCGF)Eastern23.658121.42012148
Ruisui Ranch, Ruisui Township, Hualien County (HL_RRRS)Eastern23.479121.34515447
Dakeng Scenic Area, Minzheng Li, Taichung City (TC_DKMZ)Midwestern24.172120.75220595
Hushan Rock, Huatan Township, Changhua County (CH_HRHT)Midwestern24.043120.5595694
Majia Township, Pingtung Country (PT_MJ)Southwestern22.703120.64822881
Native Botanical Garden, Zuoying District, Kaohsiung City (KH_BGZY)Southwestern22.680120.301948
Table 2. Characteristics of the Five Microsatellite Loci of F. taiwana Used in This Study.
LocusSize Range (bps)Motif Type 1Primer Sequences 2 and the Concentration of the Primers Used in the PCR ReactionsNumber of AllelesAccession Number
P1138~183(TAA)7F: TCAGGCTCGTACGGTTTACT (200 nM)7MW921469
R: GGAAGTCAAAATAGGAGTTTCTCAA (200 nM)
P2213~239(ATT)8F: AAATCAATAAATATTACGAGTTTTCCA (100 nM)8MW921470
R: TTTTTATCGTTCAAAATCCTTCTG (200 nM)
P3256~264(TGA)6F: GGGGCCTCCTCATAAGTACC (100 nM)5MW921471
R: TGCATTTCTTGCACTCCATT (200 nM)
P4348~359(CAA)6 + (CCA)6F: CCCACGCACTAACGAGAGTT (150 nM)5MW921472
R: AGCGGGAGTTCCATTTCTCT (200 nM)
P5453~465(TTC)7F: TCCTCACCCCAAAAAGTGAC (100 nM)6MW921473
R: AGGGAGCGACTTCAAATCAA (200 nM)
1 The number of repeats for microsatellite markers in the PCR-amplified sequences deposited in GenBank is indicated; 2 All of the forward (F) primers have an M13 primer sequence (CACGACGTTGTAAAACGAC) extension at their 5′ ends.
Table 3. Genetic Structure of F. taiwana Across Eleven Populations and Five Microsatellite Loci.
PopulationLocusNNaNeHoHeuHeF
TC_DKMZP1954.0002.3060.5890.5660.569−0.041
P2954.0001.1370.1260.1200.121−0.048
P3952.0001.1340.1260.1180.119−0.067
P4954.0001.3670.2630.2680.2700.019
P5954.0001.1490.1160.1300.1300.107
CH_HRHTP1944.0002.2230.5960.5500.553−0.083
P2945.0001.2420.1600.1950.1960.181
P3945.0001.2290.1810.1860.1870.028
P4944.0001.5700.3830.3630.365−0.055
P5944.0001.3660.2450.2680.2690.087
PT_MJP1803.0001.6660.3630.4000.4020.094
P2814.0001.1900.1730.1600.161−0.082
P3812.0001.2610.2100.2070.208−0.014
P4813.0001.4120.2720.2920.2930.069
P5813.0001.1910.1730.1600.161−0.077
KH_BGZYP1483.0002.2510.5000.5560.5620.100
P2485.0001.5490.3330.3550.3580.060
P3483.0001.3170.2710.2410.243−0.125
P4483.0001.5390.2500.3500.3540.286
P5484.0001.1860.1670.1570.159−0.062
HL_BAXCP1475.0001.9580.5110.4890.495−0.043
P2477.0002.3450.5320.5740.5800.073
P3472.0001.3940.2130.2820.2860.247
P4475.0001.2460.1700.1980.2000.139
P5472.0001.3940.2550.2820.2860.096
HL_DKXLP1486.0002.3130.6670.5680.574−0.174
P2487.0002.9560.6880.6620.669−0.039
P3482.0001.1100.1040.0990.100−0.055
P4484.0001.1350.1040.1190.1200.126
P5483.0001.5670.3330.3620.3660.079
HL_GHJAP1485.0001.9450.5000.4860.491−0.029
P2487.0002.8550.6460.6500.6570.006
P3482.0001.0870.0830.0800.081−0.043
P4483.0001.2900.2080.2250.2270.072
P5483.0001.6400.3330.3900.3950.146
YL_NFSAP1475.0002.3920.5740.5820.5880.013
P2476.0002.2950.5960.5640.570−0.056
P3472.0001.1600.1060.1380.1390.228
P4474.0001.5080.2980.3370.3410.116
P5473.0001.6550.4470.3960.400−0.129
HL_RRRSP1475.0002.1790.6380.5410.547−0.180
P2466.0002.6350.5870.6210.6270.054
P3472.0001.2090.1060.1730.1750.386
P4474.0001.4620.2130.3160.3190.327
P5472.0001.3670.2770.2680.271−0.031
HL_TCGFP1485.0002.3830.5830.5800.586−0.005
P2487.0003.1300.7080.6810.688−0.041
P3483.0001.1580.1040.1370.1380.237
P4484.0001.3830.2710.2770.2800.023
P5482.0001.3580.2710.2640.266−0.027
HL_ZHFLP1486.0001.8010.4580.4450.450−0.030
P2486.0002.1220.6250.5290.534−0.182
P3482.0001.1800.1670.1530.154−0.091
P4483.0001.1350.1250.1190.120−0.051
P5482.0001.6790.3540.4040.4090.124
N: Number of successfully genotyped samples; Na: Number of different alleles; Ne: Number of effective alleles; Ho: Observed heterozygosity; He: Expected heterozygosity; uHe: Unbiased heterozygosity: (2N/(2N − 1)) × He; F: Inbreeding coefficient: (HeHo)/He.
Table 4. Pairwise FST Values and Statistical Significance for F. taiwana Populations. FST values are presented below the diagonal, while p-values, derived from 999 permutations, are shown above the diagonal.
TC_DKMZCH_HRHTPT_MJKH_BGZYHL_BAXCHL_DKXLHL_GHJAYL_NFSAHL_RRRSHL_TCGFHL_ZHFL
TC_DKMZ0.0000.0140.0040.0200.0010.0010.0010.0010.0010.0010.001
CH_HRHT0.0090.0000.0010.0140.0010.0010.0010.0010.0010.0010.001
PT_MJ0.0170.0260.0000.0140.0010.0010.0010.0010.0010.0010.001
KH_BGZY0.0120.0140.0140.0000.0010.0010.0010.0010.0010.0010.001
HL_BAXC0.0730.0570.0620.0340.0000.0650.0900.0280.1050.0680.109
HL_DKXL0.1060.0830.1030.0580.0080.0000.4370.0620.0530.2950.196
HL_GHJA0.1010.0740.0890.0530.0070.0000.0000.1410.1030.1790.396
YL_NFSA0.0680.0430.0720.0280.0110.0100.0050.0000.0030.0110.021
HL_RRRS0.1050.0860.0910.0520.0060.0090.0060.0200.0000.4130.018
HL_TCGF0.1000.0840.0950.0440.0090.0020.0040.0140.0000.0000.010
HL_ZHFL0.1100.0840.0950.0660.0070.0040.0000.0160.0150.0180.000
Table 5. Pairwise Comparison of the Number of migrants (Nm) Among F. taiwana Populations. Nm, calculated using the formula Nm = ((1/FST) − 1)/4, is shown below the diagonal. n.a. (not applicable) indicates cases where FST = 0.
TC_DKMZCH_HRHTPT_MJKH_BGZYHL_BAXCHL_DKXLHL_GHJAYL_NFSAHL_RRRSHL_TCGFHL_ZHFL
TC_DKMZ0.000
CH_HRHT27.5710.000
PT_MJ14.5849.3870.000
KH_BGZY19.94718.18517.7460.000
HL_BAXC3.1864.0993.7807.1720.000
HL_DKXL2.1082.7622.1664.03929.8080.000
HL_GHJA2.2183.1242.5654.45936.629n.a.0.000
YL_NFSA3.4445.5173.2468.61721.59525.79248.2820.000
HL_RRRS2.1292.6422.5024.57438.29127.38738.79012.2120.000
HL_TCGF2.2542.7112.3835.37028.100119.46961.55118.122n.a.0.000
HL_ZHFL2.0272.7172.3843.52037.65063.288n.a.15.11816.69813.9200.000
Disclaimer/Publisher’s Note: The statements, opinions and data contained in all publications are solely those of the individual author(s) and contributor(s) and not of MDPI and/or the editor(s). MDPI and/or the editor(s) disclaim responsibility for any injury to people or property resulting from any ideas, methods, instructions or products referred to in the content.

