
Population Dynamics of Insect Pests and Beneficials on Different Snap Bean Cultivars


Abstract
:Simple Summary
Abstract
1. Introduction
2. Materials and Methods
2.1. Experiment Site Conditions
2.2. Snap Bean Cultivars and Cultural Practice
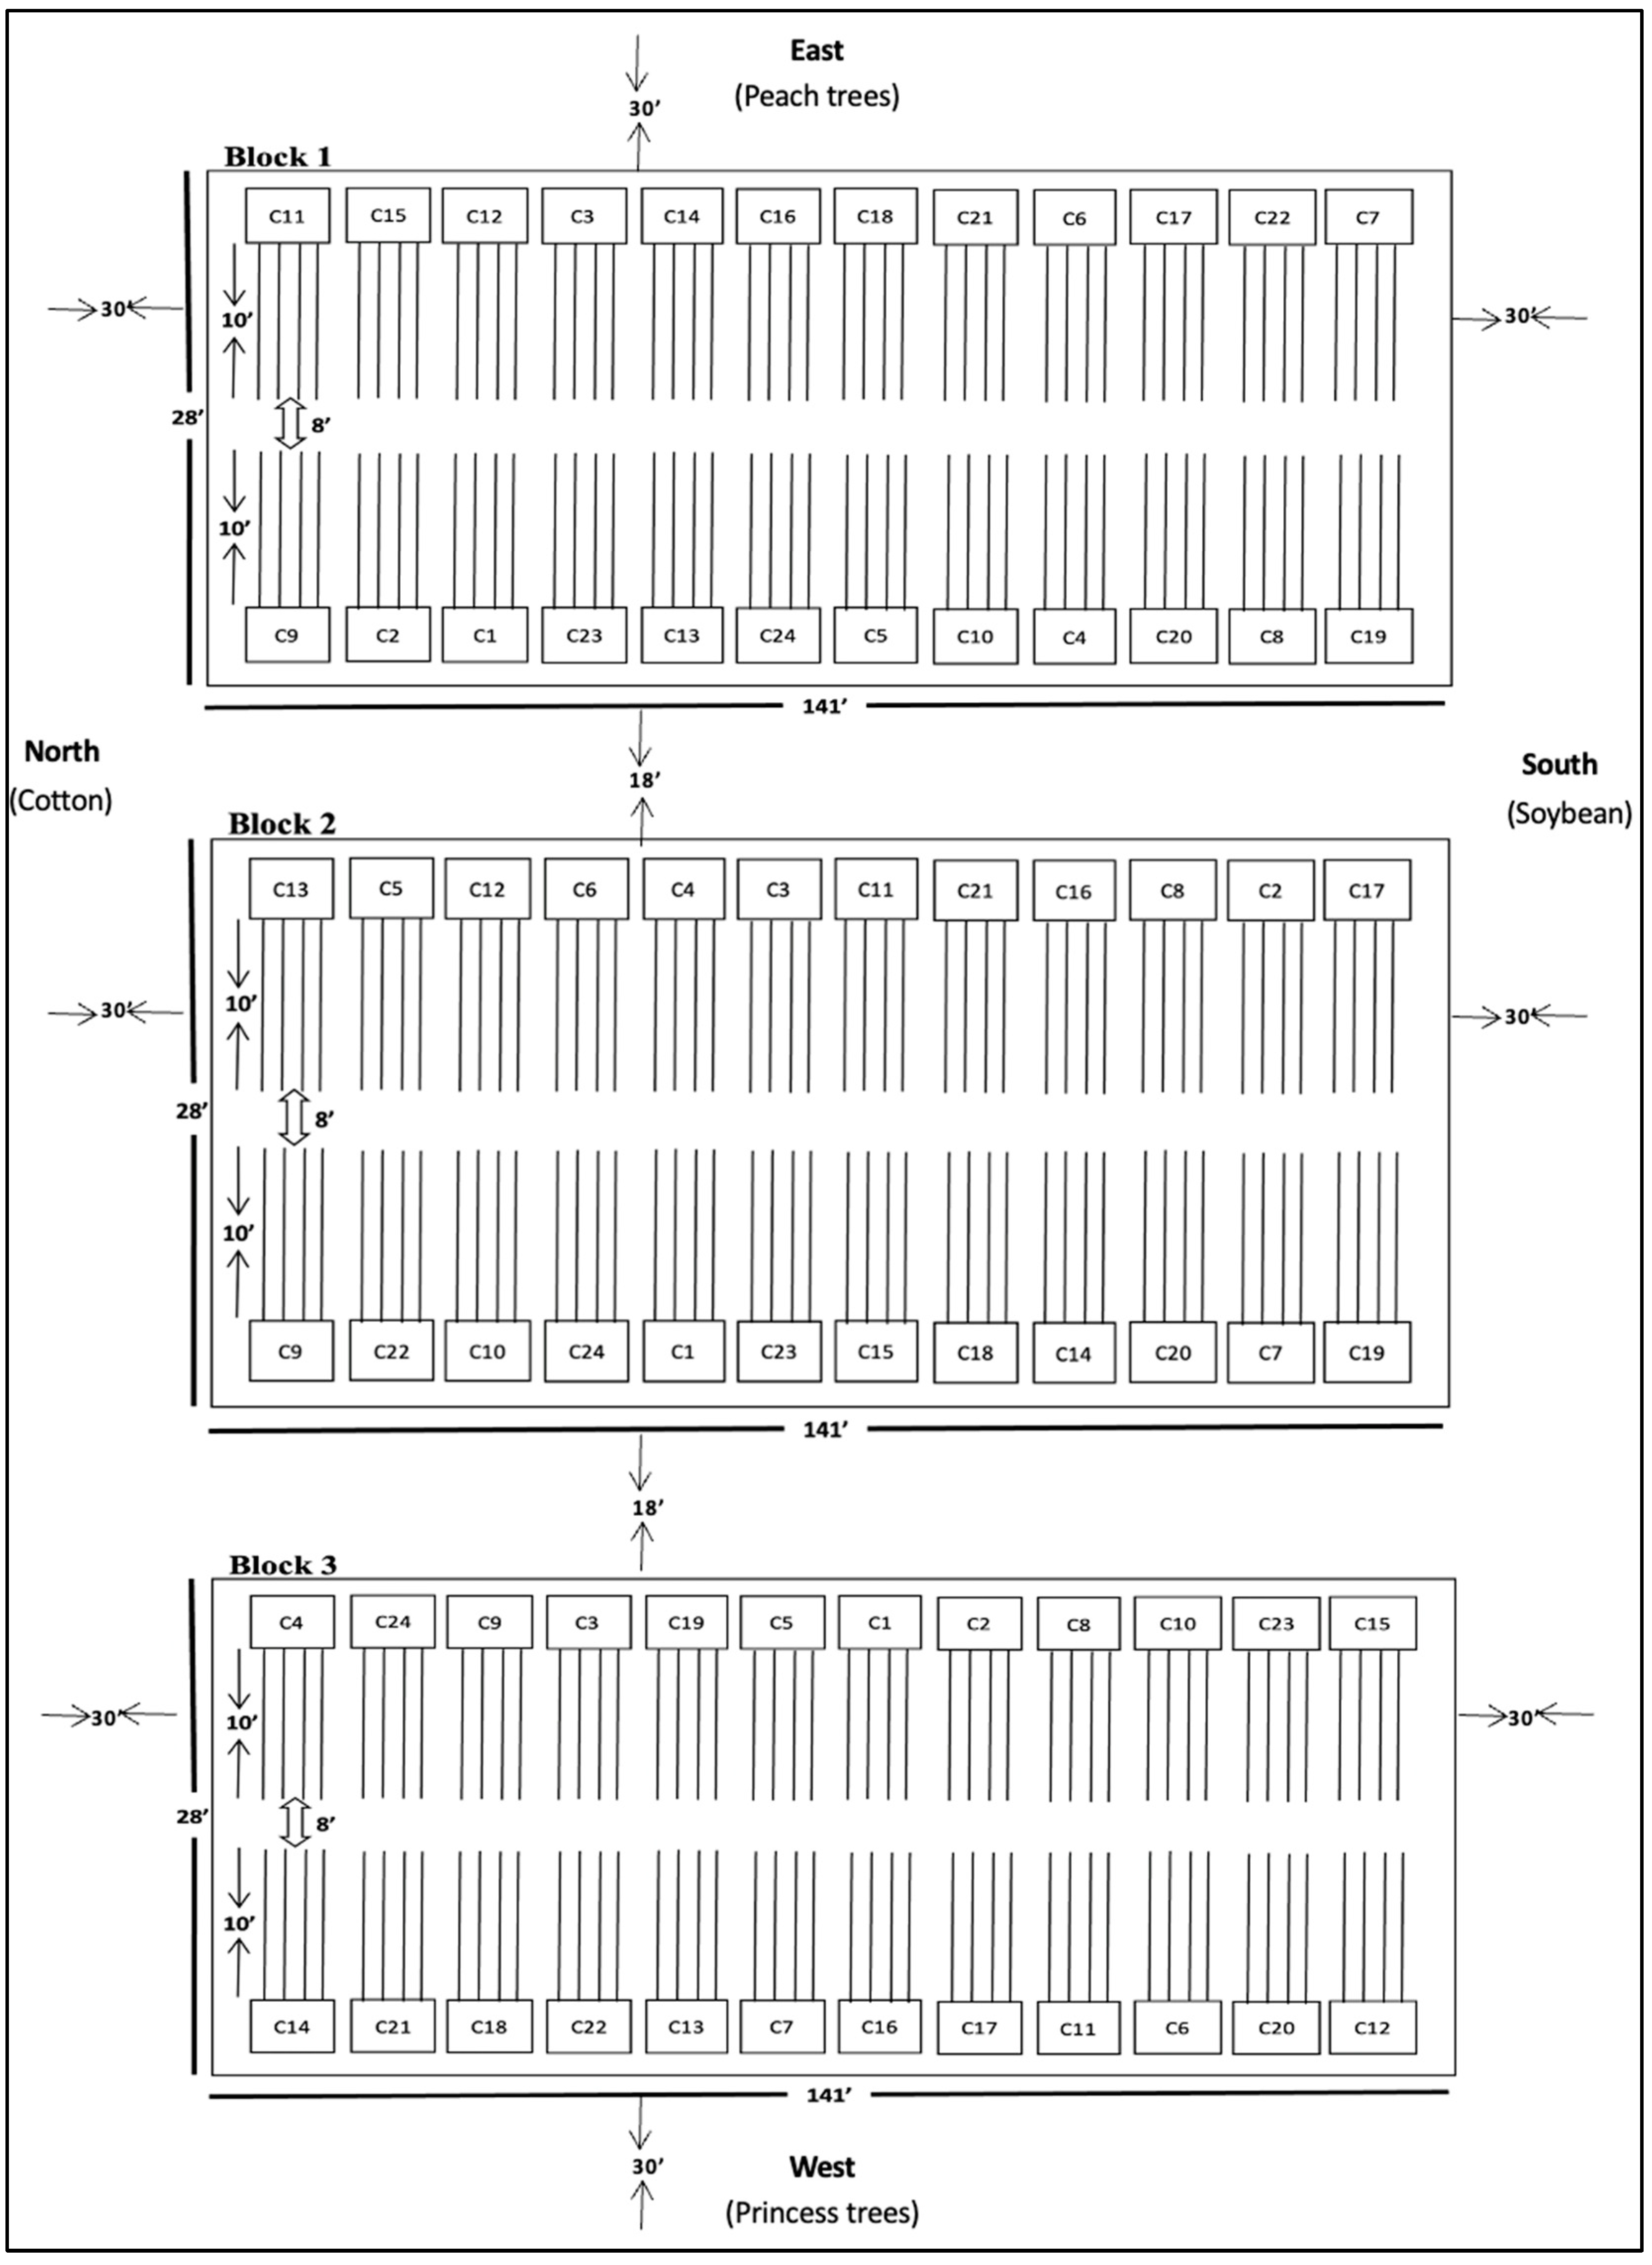
2.3. Experiment Design and Layout
2.4. Weather Information
2.5. Insect Samplings
2.6. Data Analysis
2.6.1. Numbers of Insects
2.6.2. Correlations between the Numbers of Each Insect and Climatic Factors
3. Results
3.1. Fall Season Experiment in 2020
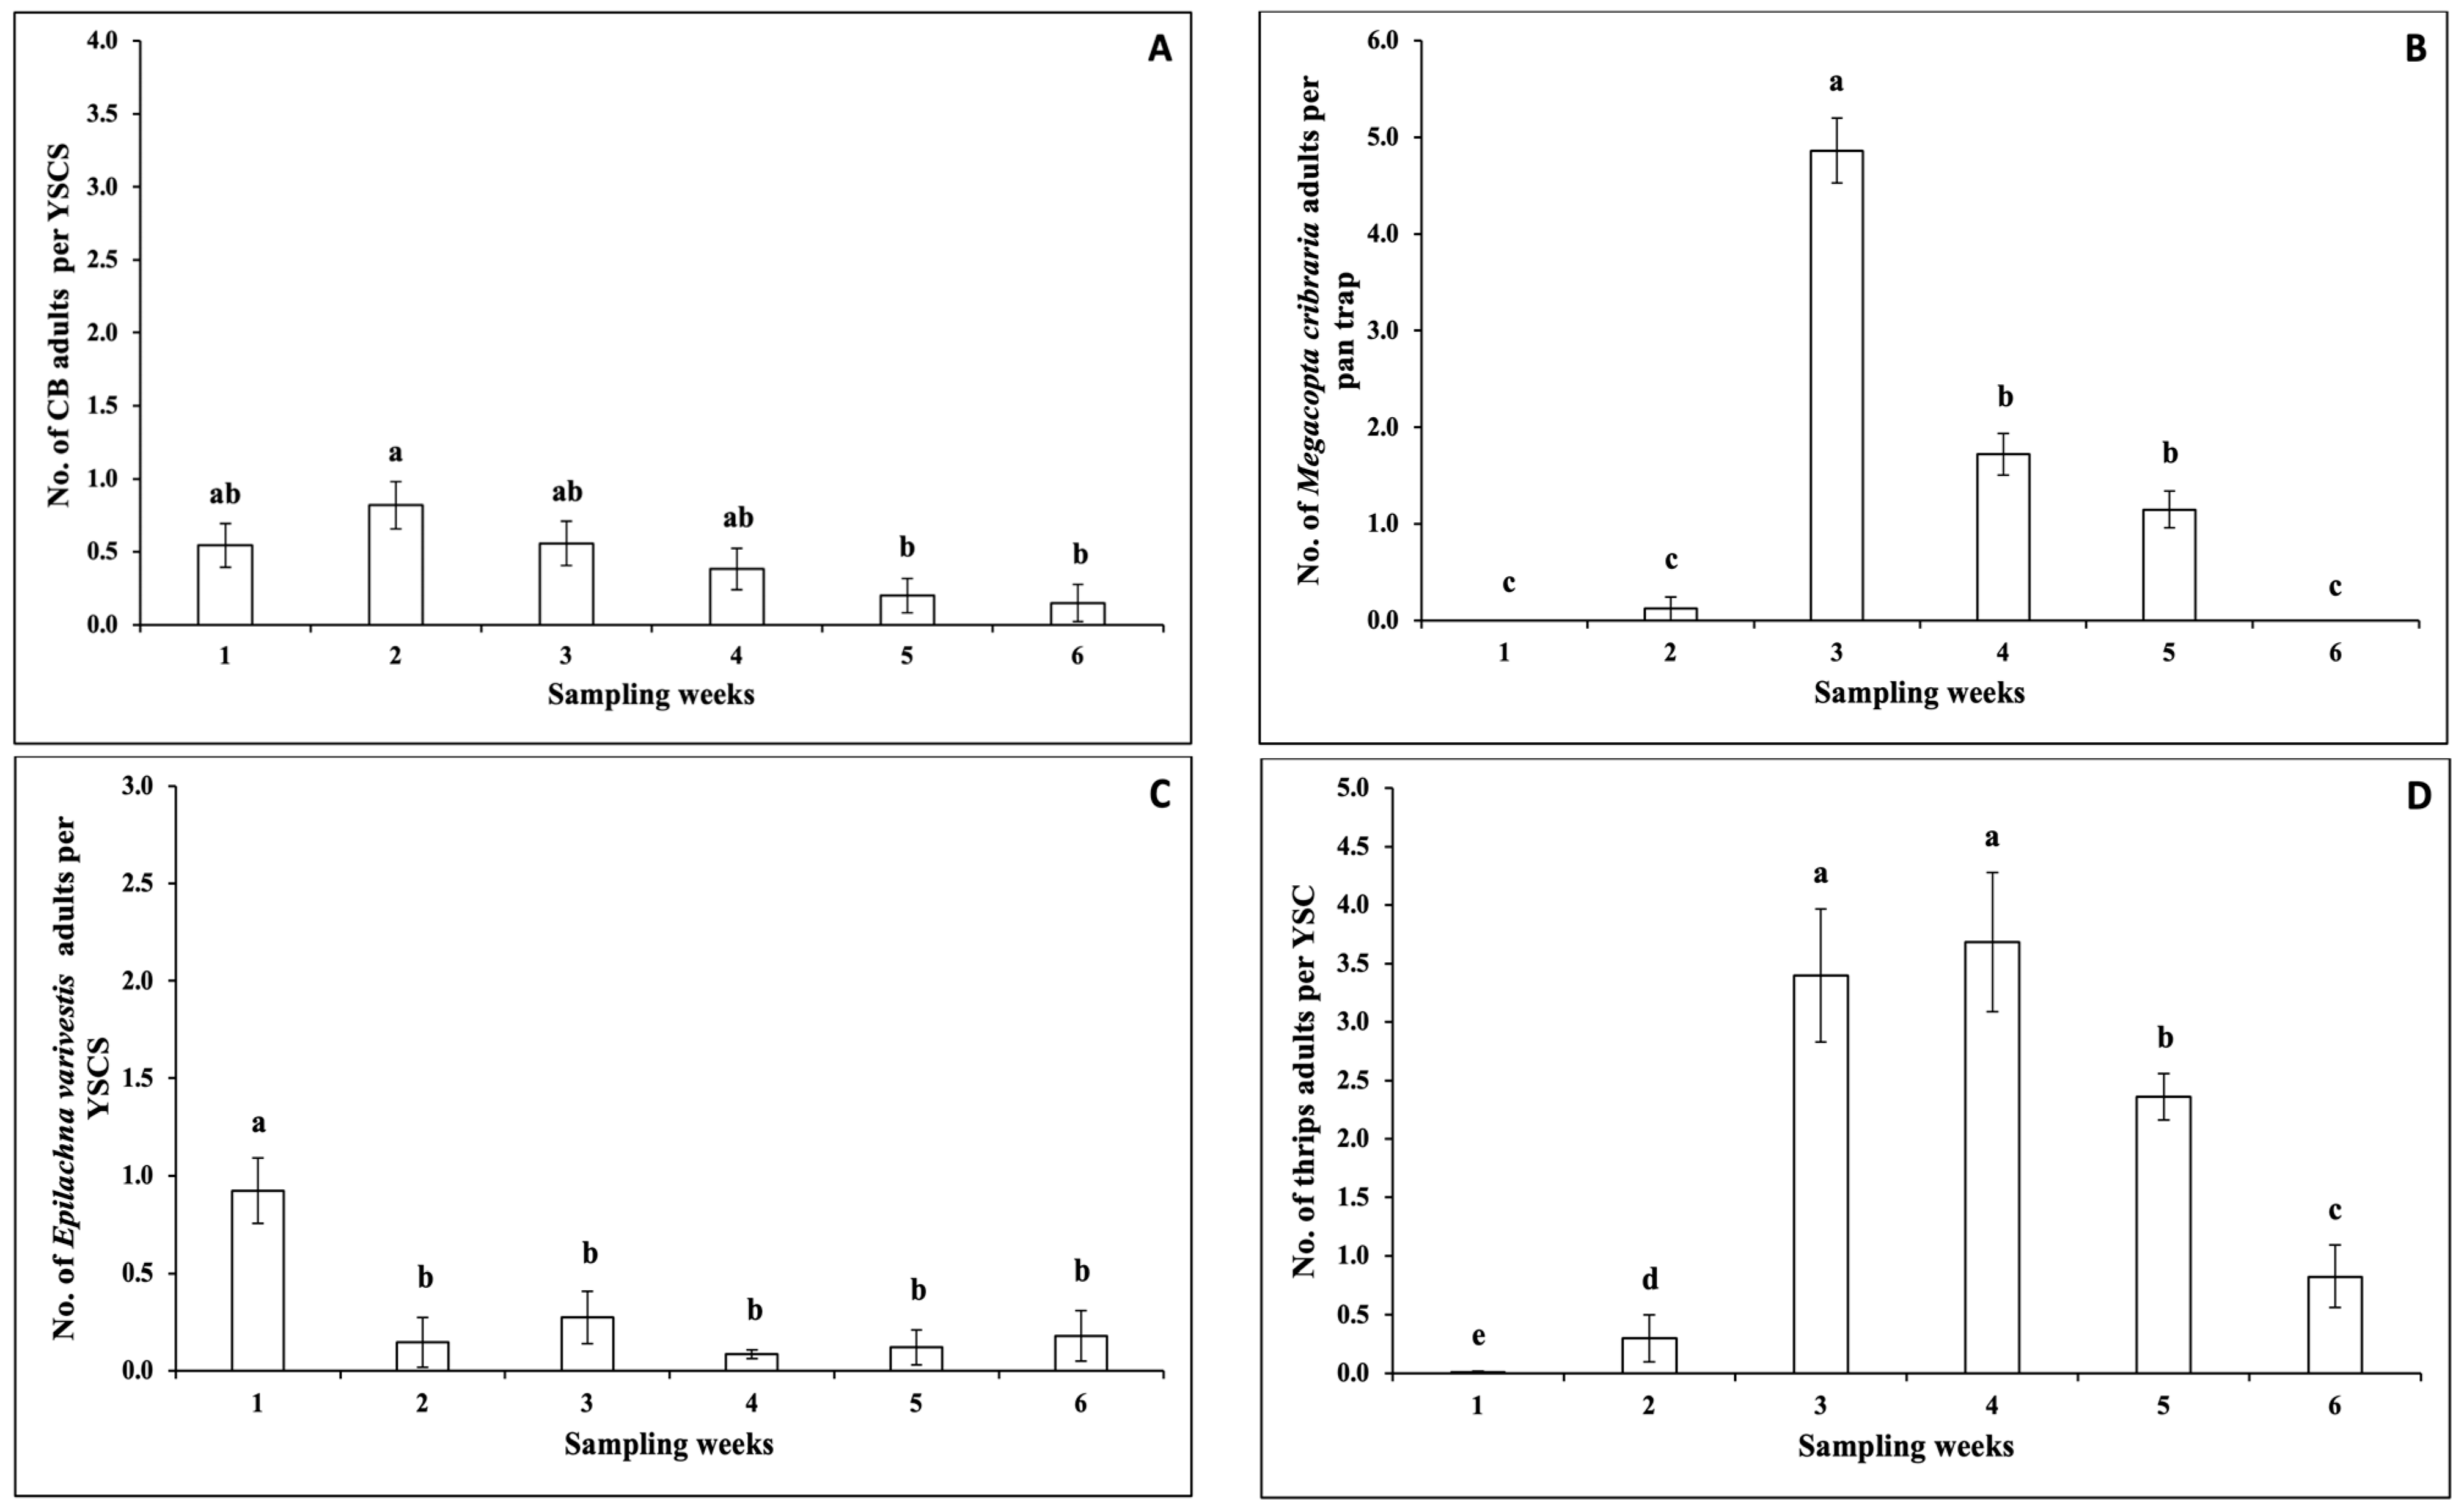
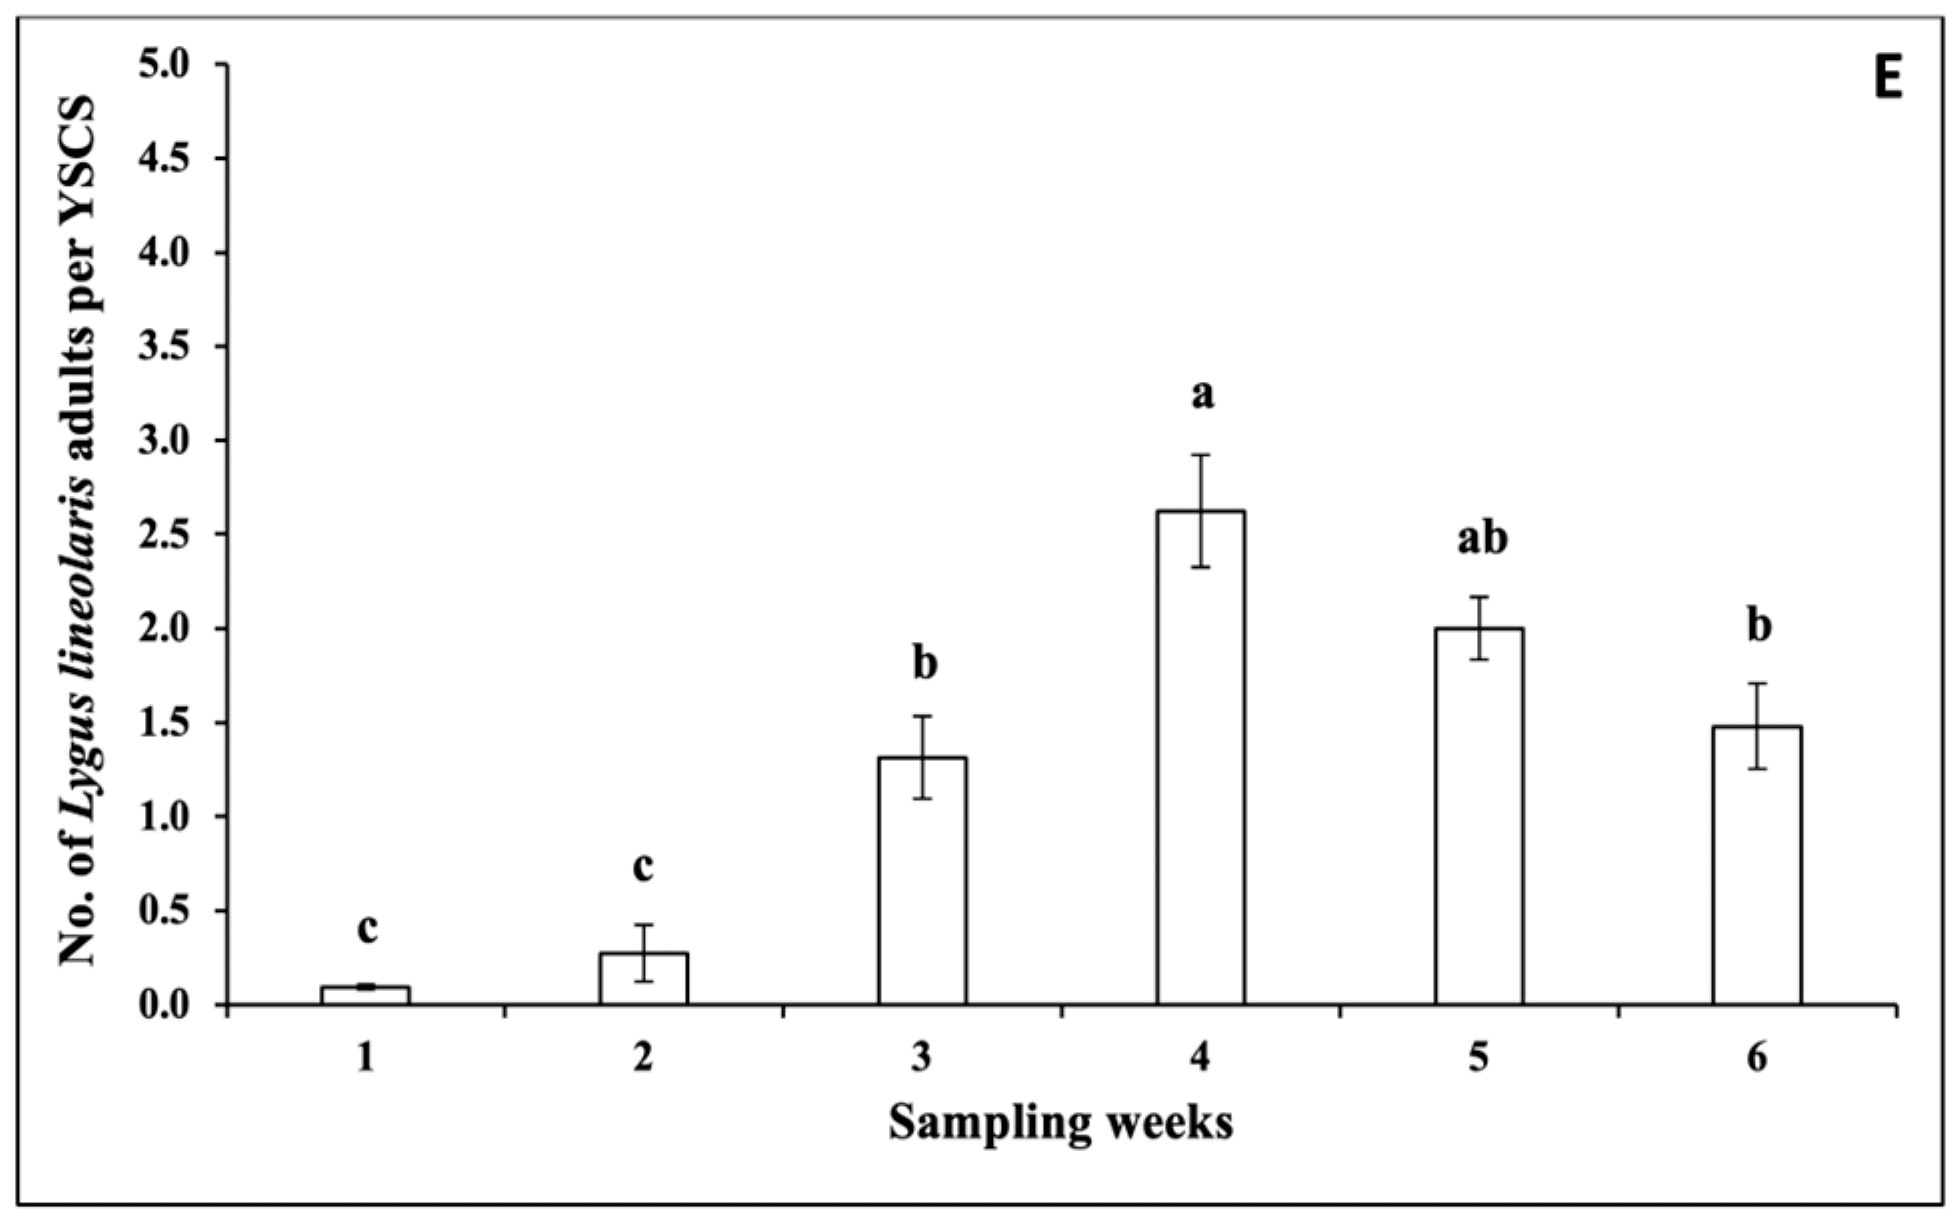
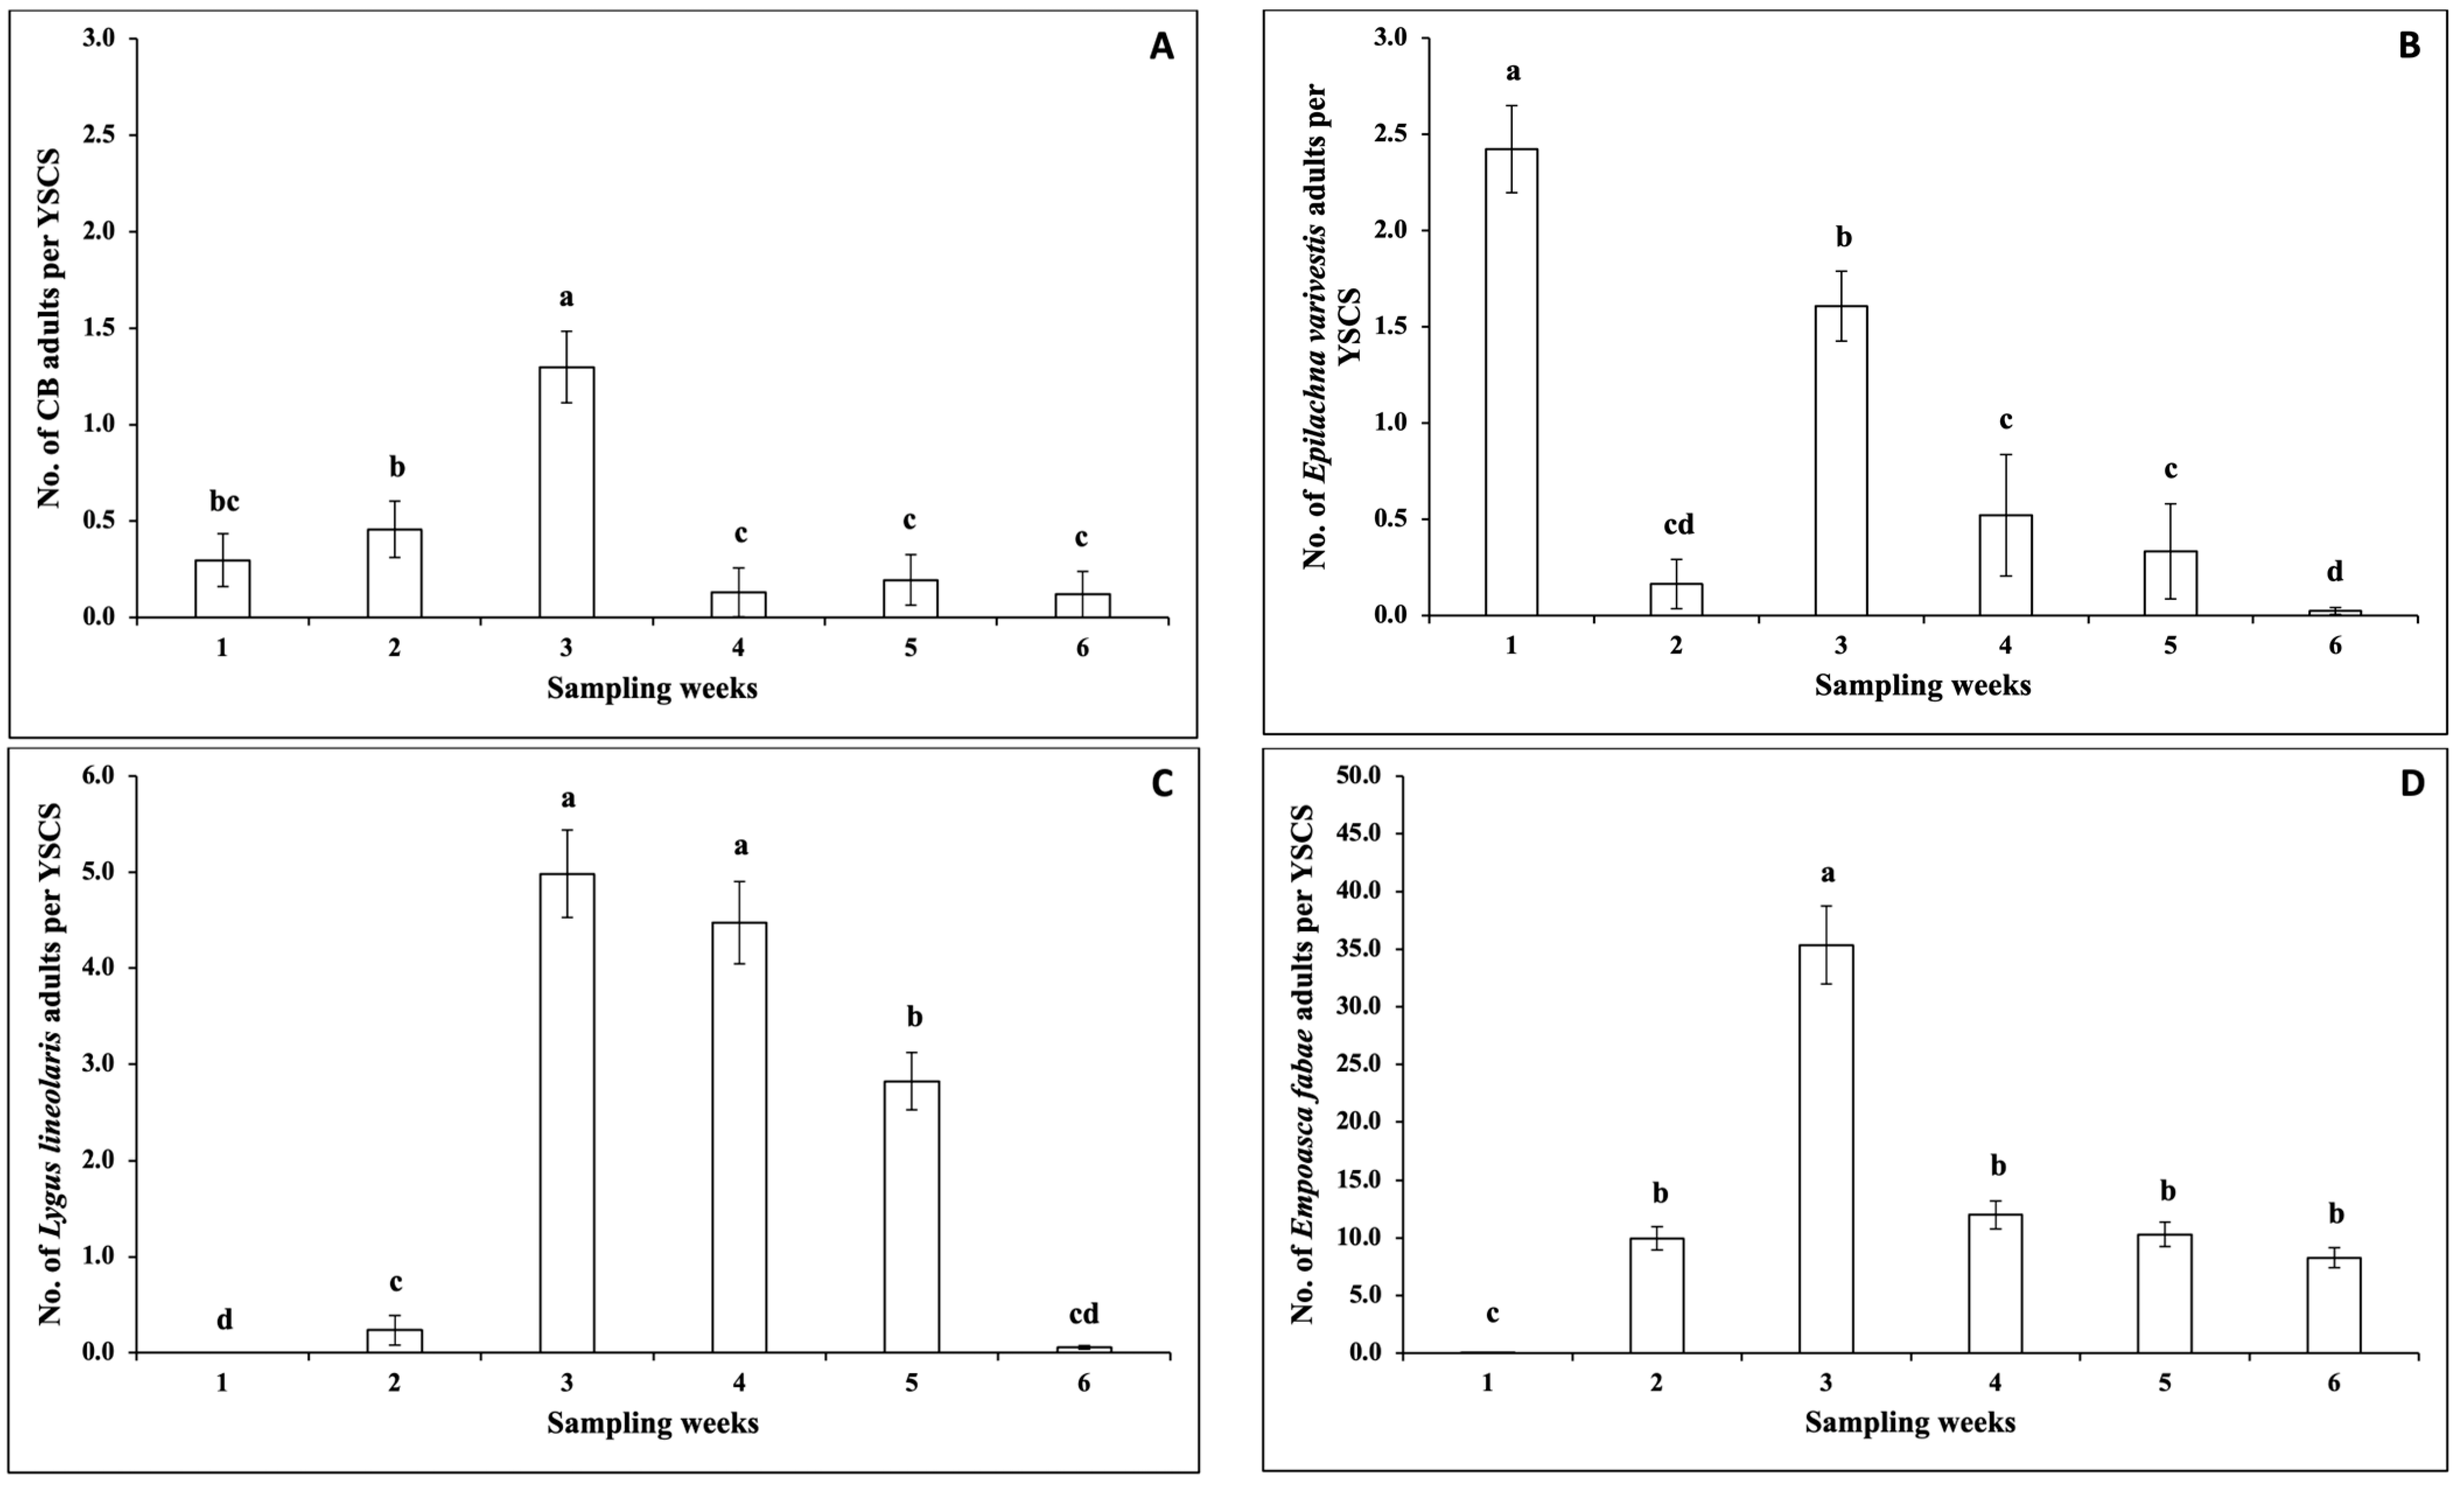
3.1.1. Insect Pests
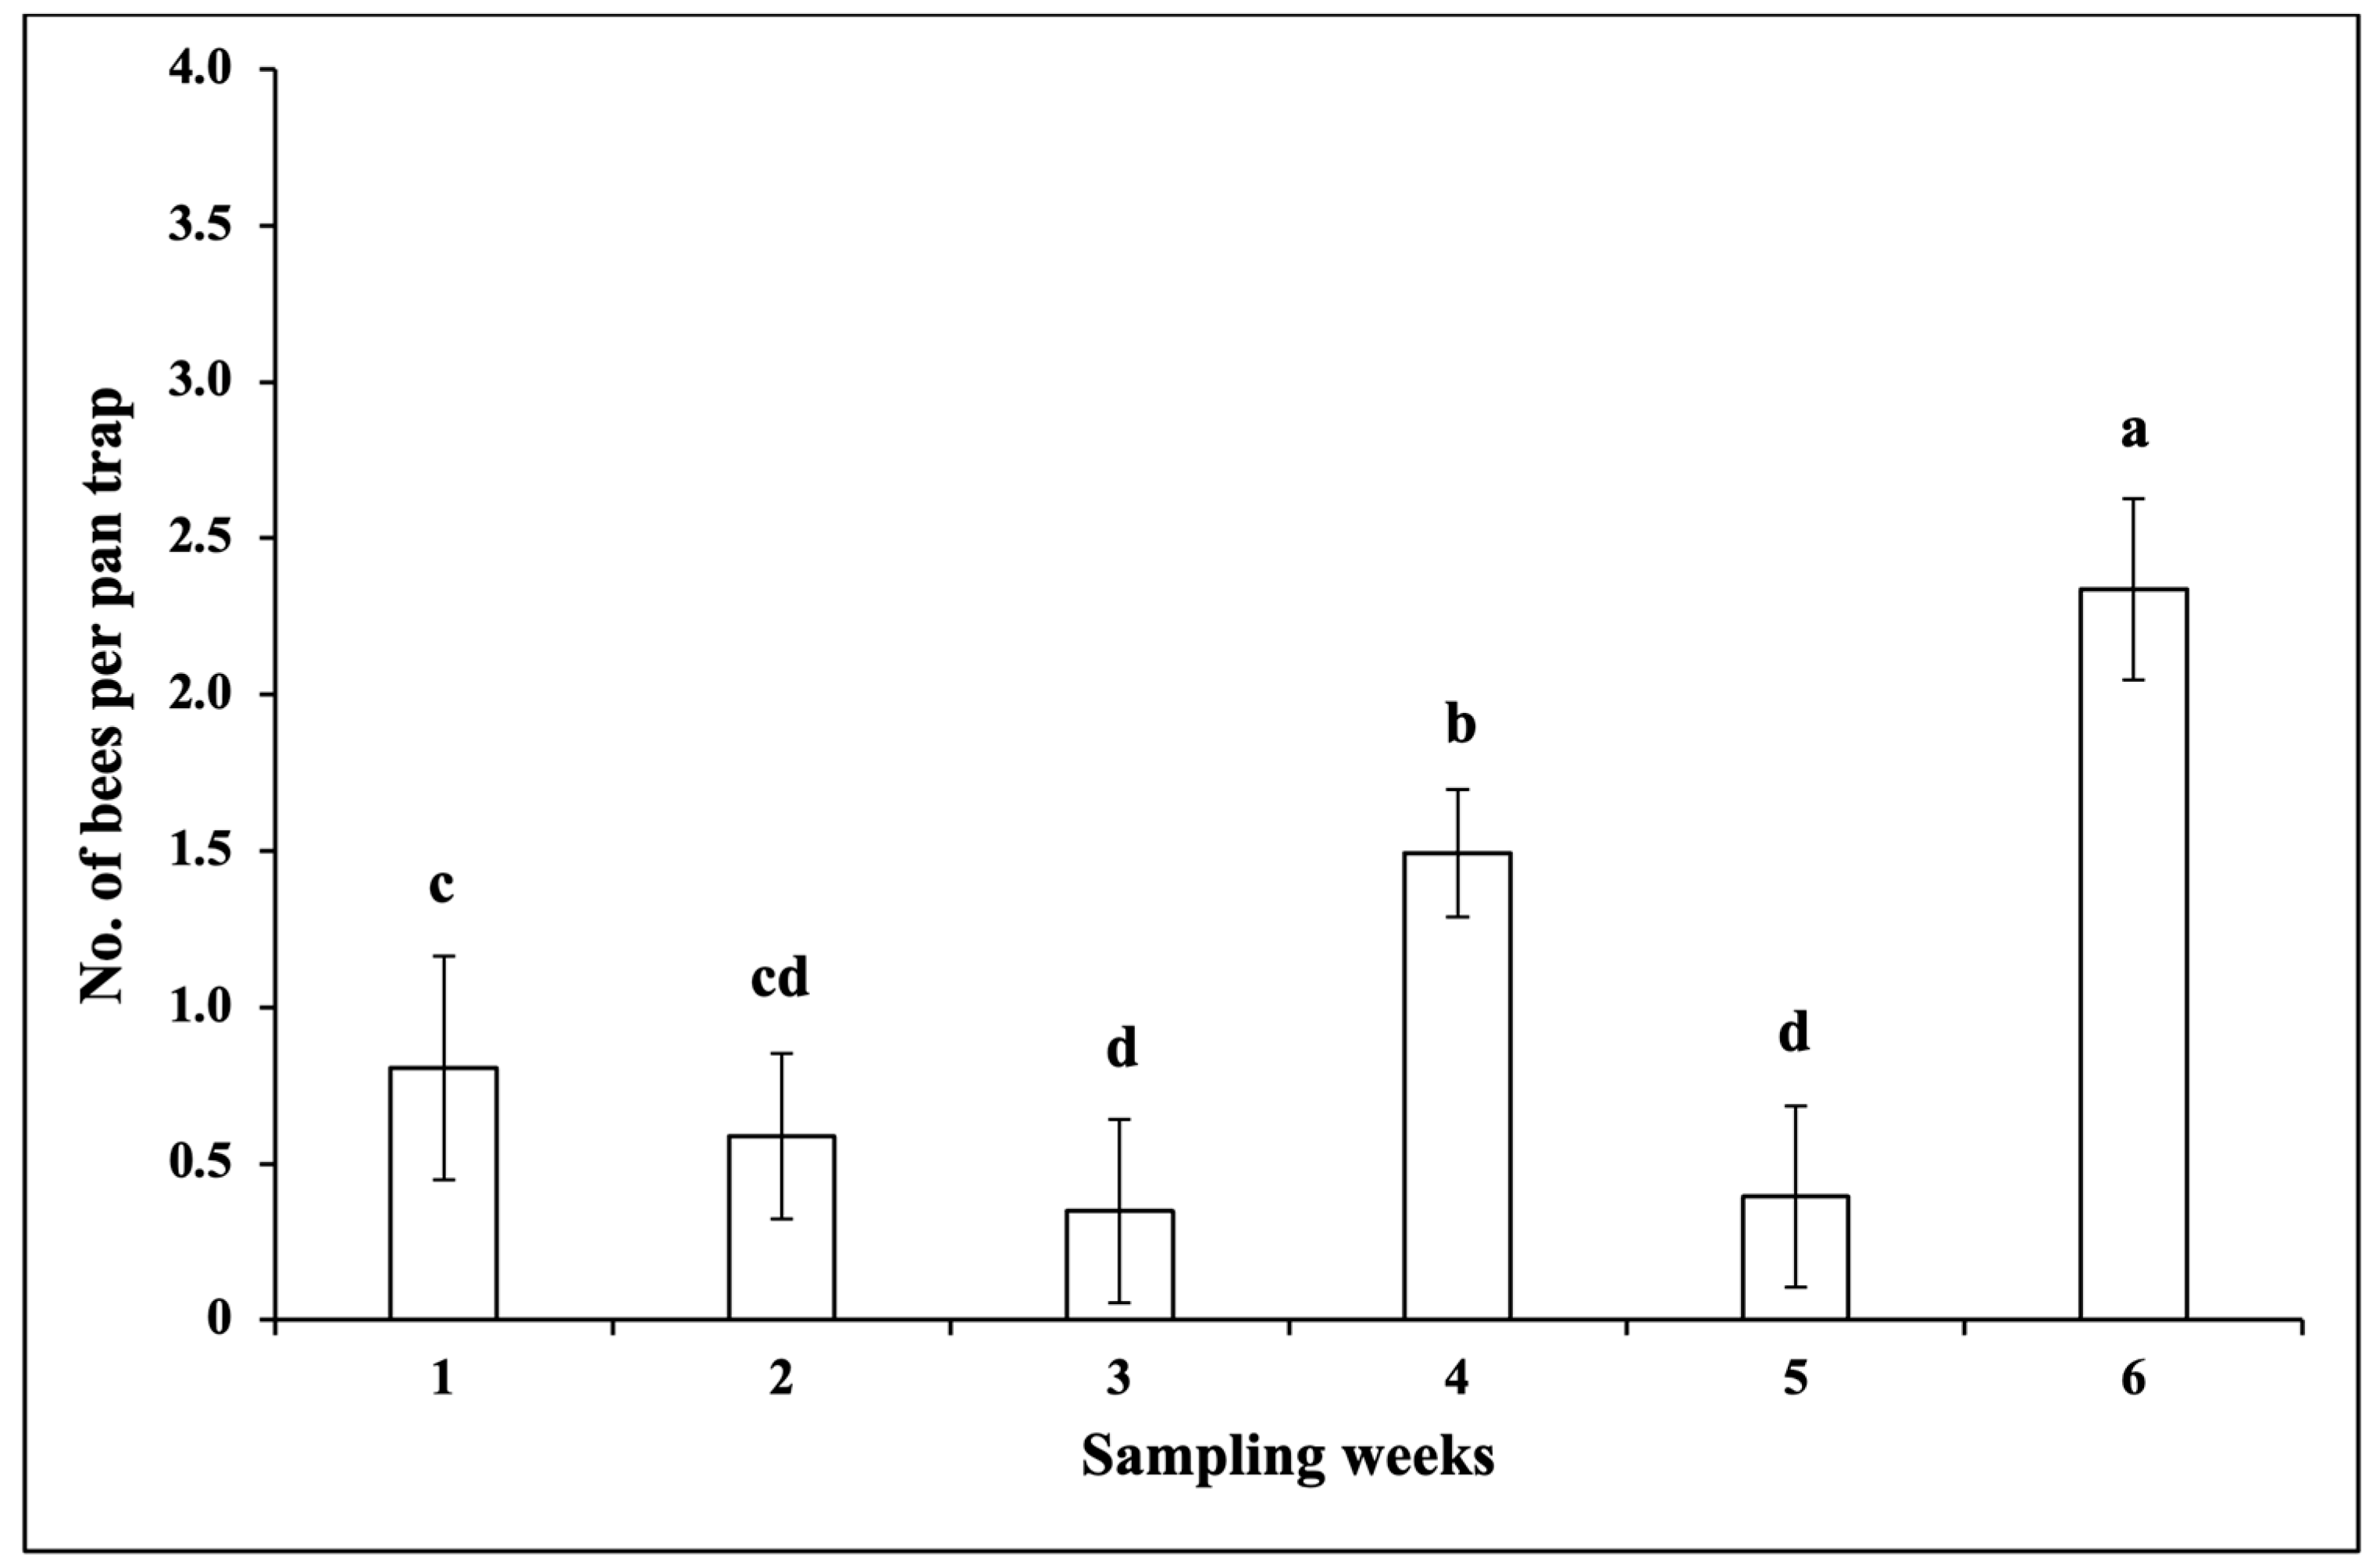
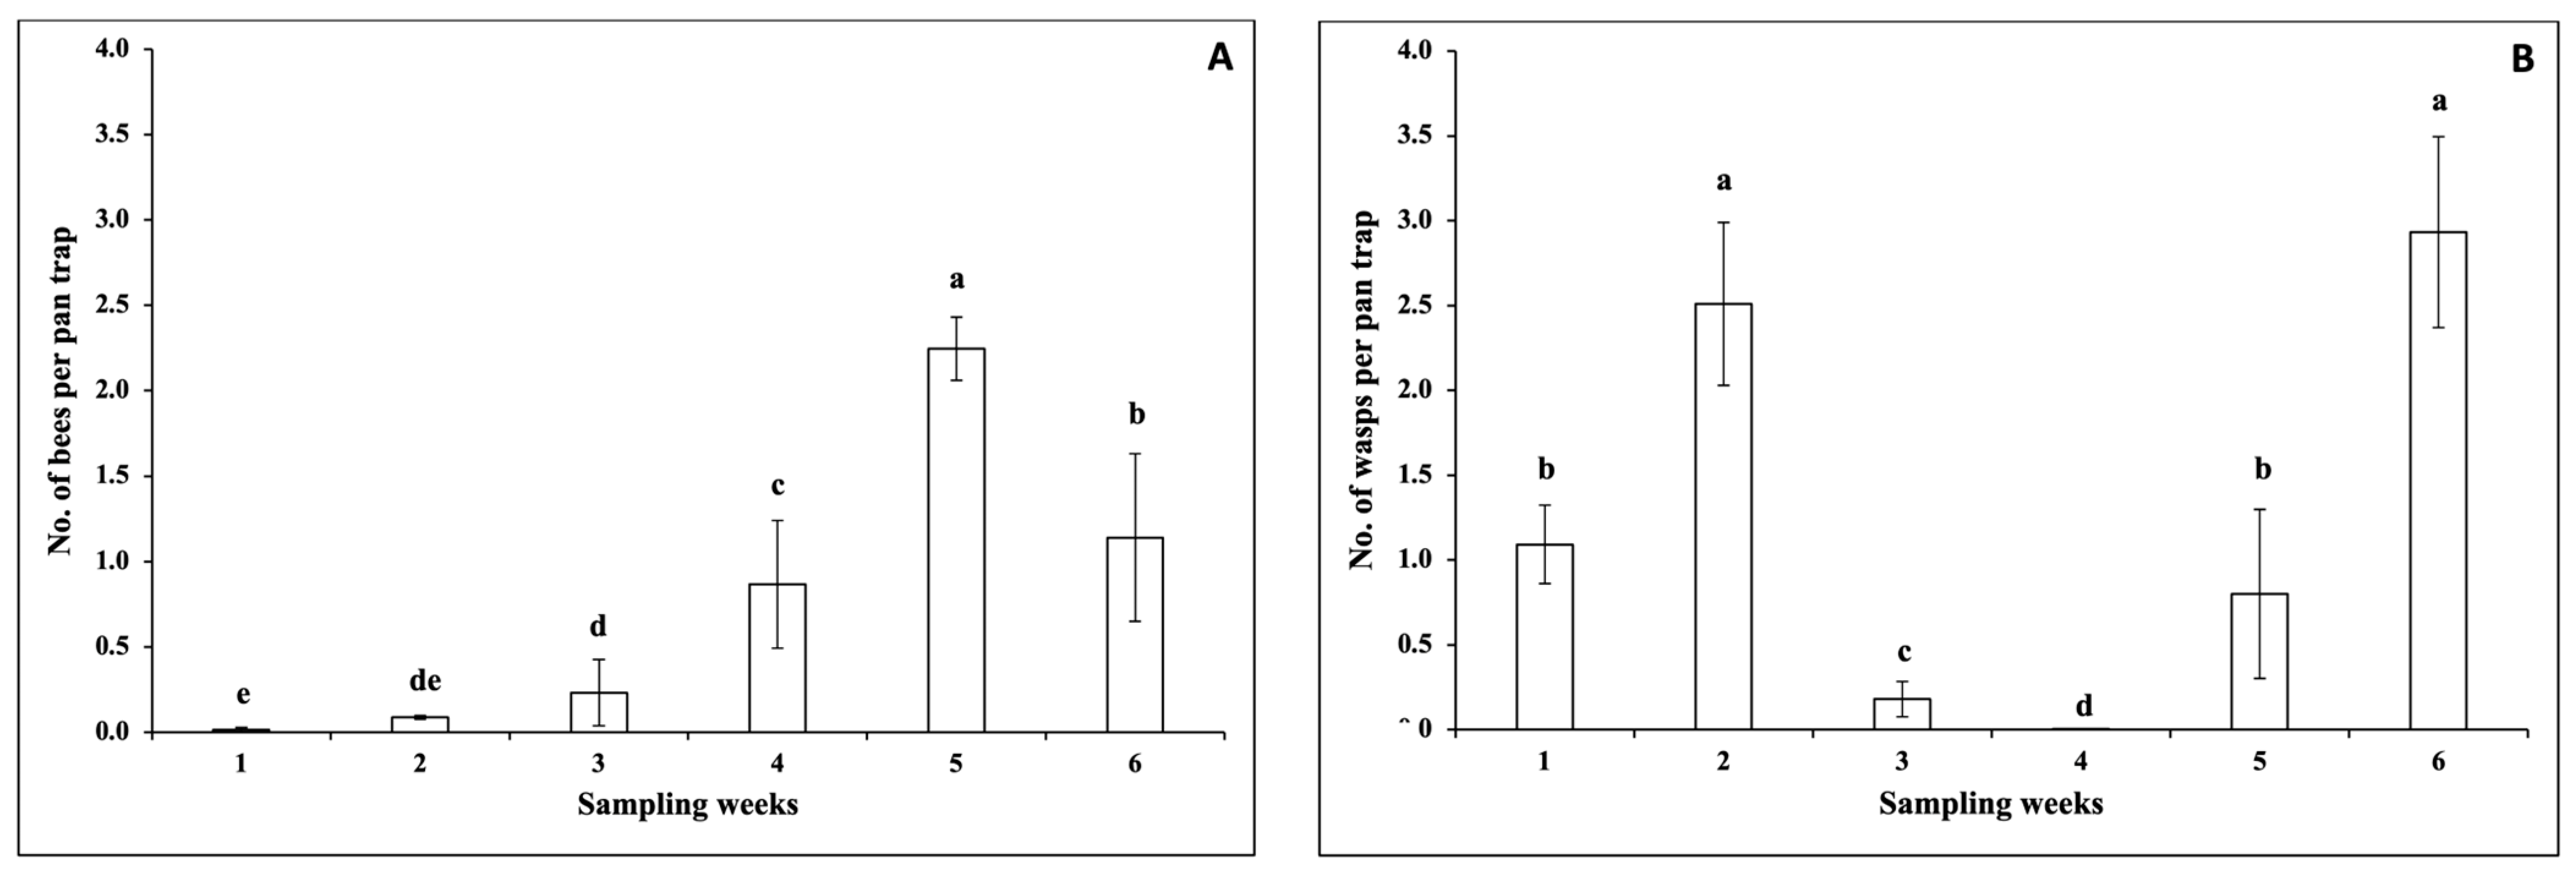
3.1.2. Pollinators
3.1.3. Natural Enemies
3.1.4. Correlations between the Numbers of Insects and Climatic Factors
3.2. Spring Season Experiment in 2021
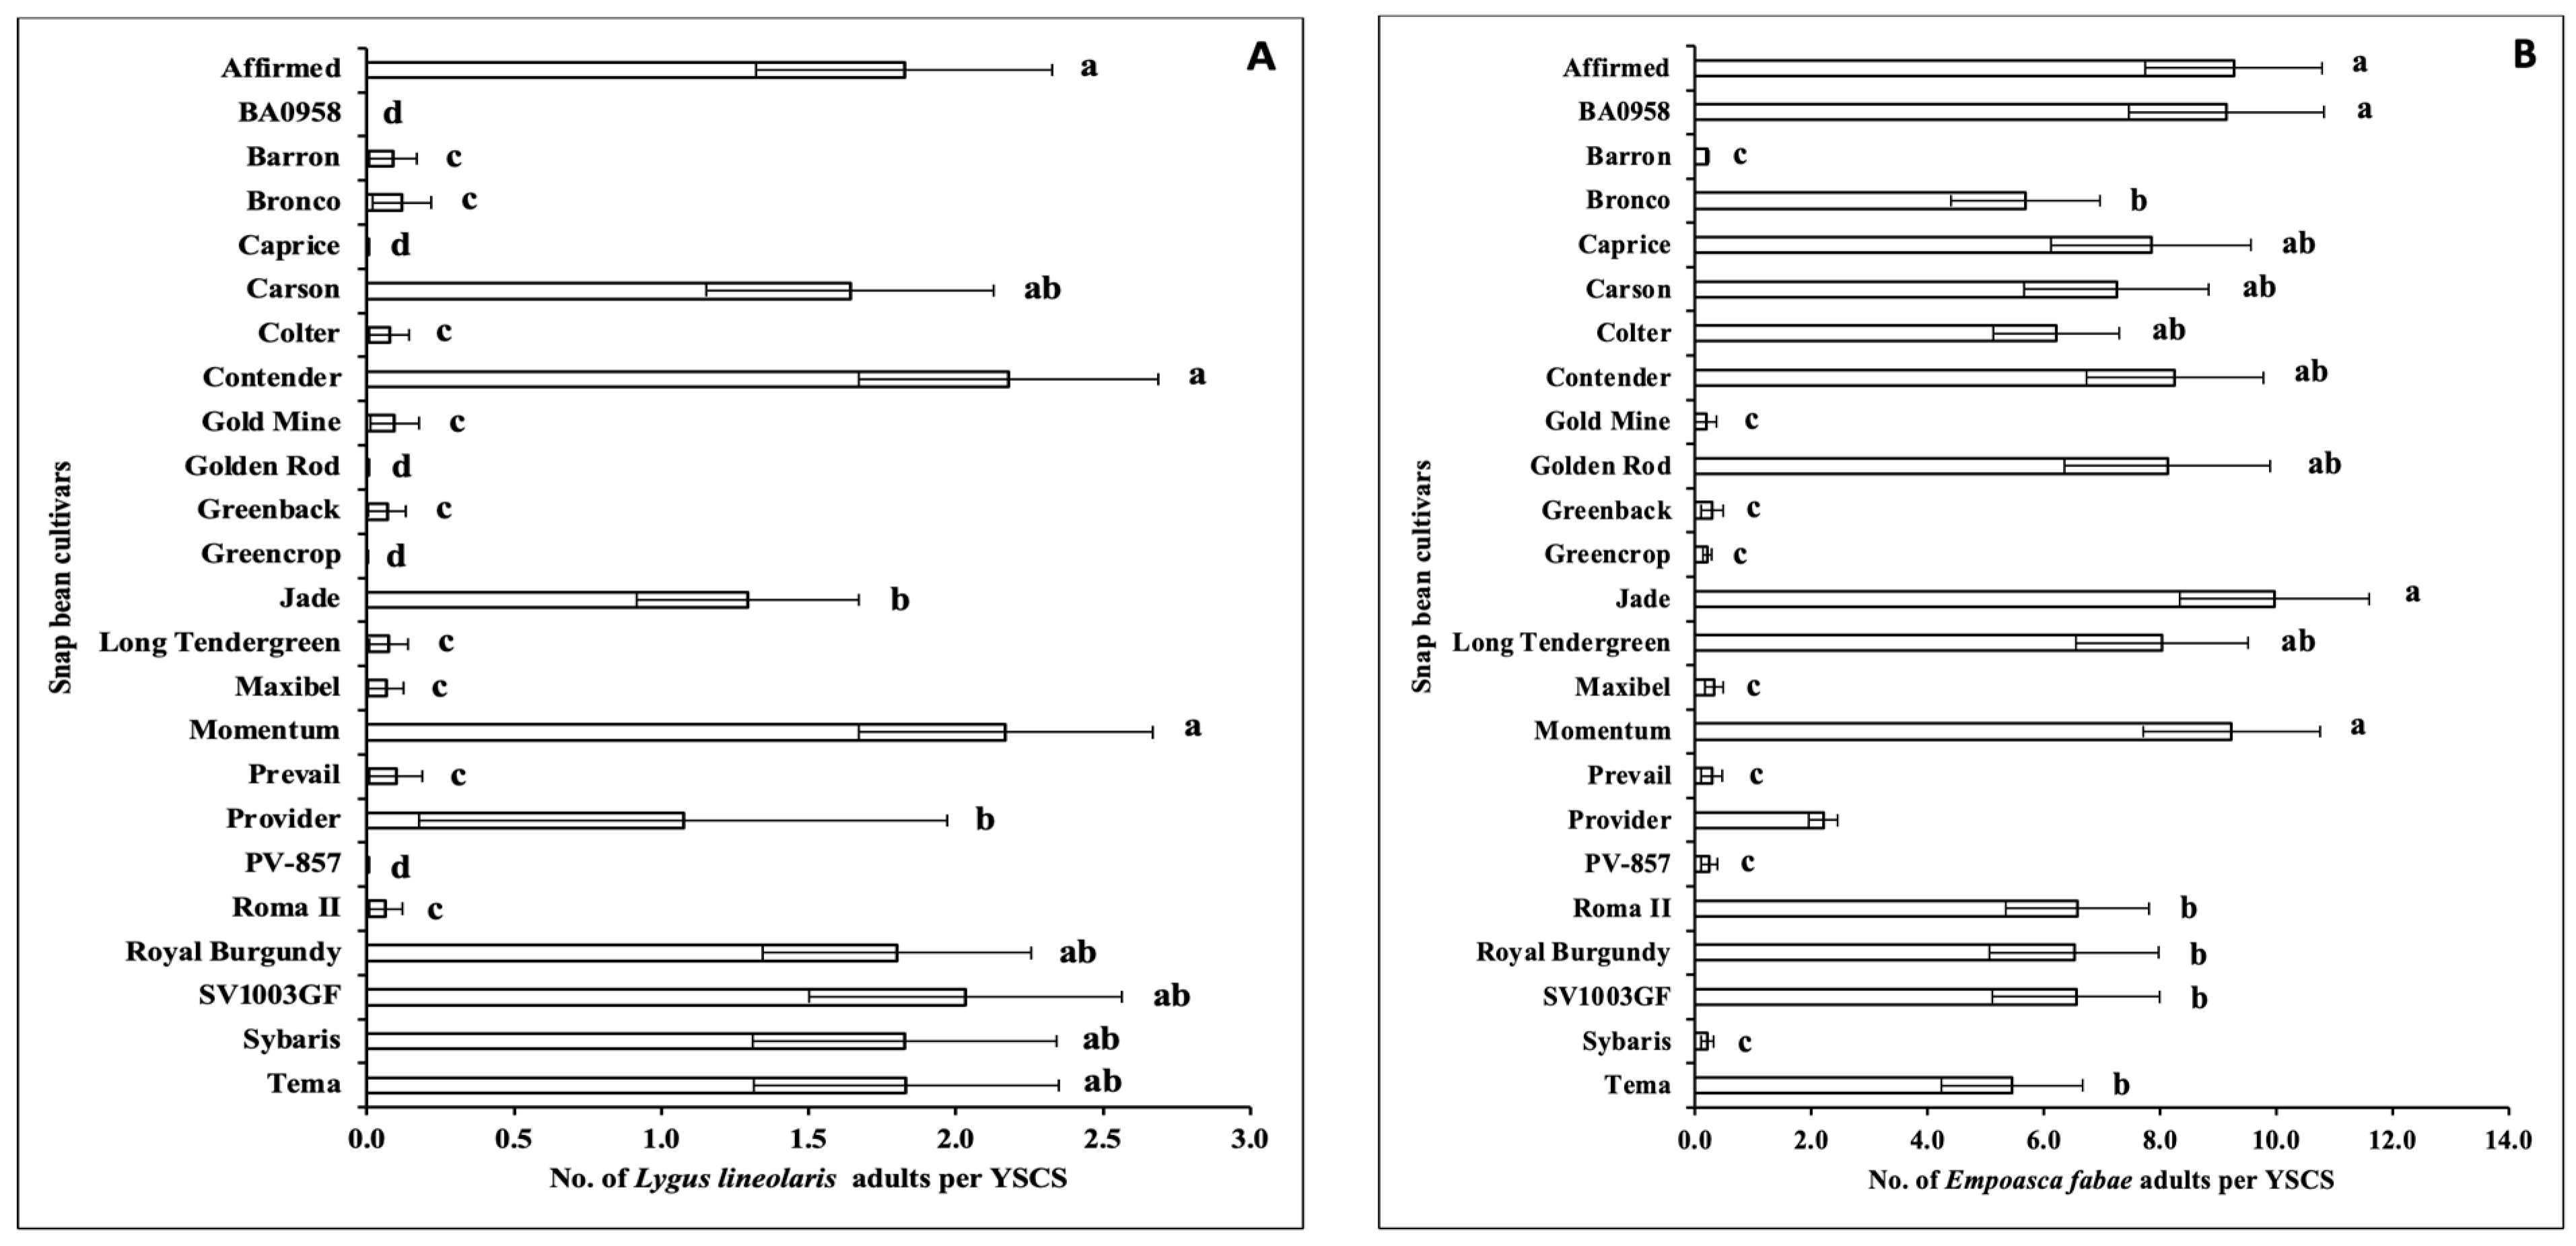
3.2.1. Insect Pests
3.2.2. Pollinators
3.2.3. Natural Enemies
3.2.4. Correlations between the Numbers of Insects and Climatic Factors
4. Discussion
5. Conclusions
Author Contributions
Funding
Data Availability Statement
Acknowledgments
Conflicts of Interest
References
- Crop Profile for Beans (Snap) in Georgia. 2003. Available online: https://ipmdata.ipmcenters.org/documents/cropprofiles/GAsnapbeans.pdf (accessed on 13 September 2022).
- Davis, W.; Lucier, G. Vegetable and Pulses Outlook: April 2021. 2021. Available online: https://www.ers.usda.gov/webdocs/outlooks/100969/vgs-366.pdf?v=9912.7 (accessed on 13 September 2022).
- Muthomi, J.W.; Fulano, A.M.; Wagacha, J.M.; Mwang’ombe, A.W. Management of snap bean insect pests and diseases by use of antagonistic fungi and plant extracts. Sustain. Agric. Res. 2017, 6, 52–63. [Google Scholar] [CrossRef] [Green Version]
- UGA Vegetable Team. Commercial Snap Bean Production in Georgia; Bulletin 1369; University of Georgia Cooperative Extension: Athens, GA, USA, 2013. [Google Scholar]
- Little, E.L. 2016 Georgia Plant Disease Loss Estimates; Annual publication 102-9; University of Georgia Cooperative Extension: Athens, GA, USA, 2019. [Google Scholar]
- Little, E.L. 2017 Georgia Plant Disease Loss Estimates; Annual publication 102-10; University of Georgia Cooperative Extension: Athens, GA, USA, 2019. [Google Scholar]
- Li, Y.; Mbata, G.N.; Punnuri, S.; Simmons, A.M.; Shapiro-Ilan, D.I. Bemisia tabaci on vegetables in the southern United States: Incidence, impact, and management. Insects 2021, 12, 198. [Google Scholar] [CrossRef] [PubMed]
- Horowitz, A.R.; Ghanim, M.; Roditakis, E.; Nauen, R.; Ishaaya, I. Insecticide resistance and its management in Bemisia tabaci species. J. Pest. Sci. 2020, 93, 893–910. [Google Scholar] [CrossRef]
- Jensen, S.E. Insecticide resistance in the western flower thrips, Frankliniella occidentalis. Integr. Pest Manag. Rev. 2000, 5, 131–146. [Google Scholar] [CrossRef]
- Dent, D.; Binks, R.H. Host plant resistance. In Insect Pest Management, 3rd ed.; Dent, D., Binks, R.H., Eds.; CAB International: Wallingford, UK, 1991; pp. 103–150. [Google Scholar]
- da Silva, A.G.; Boiça Júnior, A.L.; da Silva Farias, P.R.; Rodrigues, N.E.L.; de Souza, B.H.S.; Bottega, D.B.; Chiorato, A.F. Non-preference for oviposition and antibiosis in bean cultivars to Bemisia tabaci biotype B (Hemiptera: Aleyrodidae). Rev. Colomb. Entomol. 2014, 40, 7–14. [Google Scholar]
- Jesus, F.G.; Martins, F.S.; Rocha, F.S.; Boiça Júnior, A.L.; Carbonell, S.A.M.; Chiorato, A.F. Behavior of bean genotypes to attack by Bemisia tabaci (Genn.) biotype B (Hemiptera: Aleyrodidae). Arq. Inst. Biológico 2010, 77, 635–641. [Google Scholar] [CrossRef]
- Li, Y.; Mbata, G.N.; Simmons, A.M.; Punnuri, S. Susceptibility of snap bean cultivars to the sweetpotato whitefly, Bemisia tabaci, in the southern United States. Crop Prot. 2022, 159, 106022. [Google Scholar] [CrossRef]
- McFarlane, J.S.; Rieman, G.H. Leafhopper resistance among bean varieties. J. Econ. Ent. 1943, 36, 639. [Google Scholar] [CrossRef]
- Wolfenbarger, D.; Sleesman, J.P. Resistance in common bean lines to the potato leafhopper. J. Econ. Entomol. 1961, 54, 846–849. [Google Scholar] [CrossRef]
- Wolfenbarger, D. Resistance of Beans (Phaseolus, Glycine Max, Vigna Sinensis, Vicia Faba, and Dolichos Lablab) to the Mexican Bean Beetle and the Potato Leafhopper. Ph.D. Dissertation, Ohio State University, Columbus, OH, USA, 1961. [Google Scholar]
- Cranshaw, W.S.; Radcliffe, E.B. Influence of cultivar and plant age on European corn borer (Lepidoptera: Pyralidae) infestation in snap bean. J. Econ. Entomol. 1984, 77, 374–376. [Google Scholar] [CrossRef]
- Ollerton, J.; Winfree, R.; Tarrant, S. How many flowering plants are pollinated by animals? Oikos 2011, 120, 321–326. [Google Scholar] [CrossRef]
- Anderson, D.L.; Sedgley, M.; Short, J.R.T.; Allwood, A.J. Insect pollination of mango in northern Australia. Aust. J. Agric. Res. 1982, 33, 541–548. [Google Scholar] [CrossRef]
- Carvalheiro, L.G.; Seymour, C.L.; Veldtman, R.; Nicolson, S.W. Pollination services decline with distance from natural habitat even in biodiversity-rich areas. J. Appl. Ecol. 2010, 47, 810–820. [Google Scholar] [CrossRef]
- Franceschinelli, E.V.; Ribeiro, P.L.M.; Mesquita-Neto, J.N.; Bergamini, L.L.; Madureira de Assis, I.; Elias, M.A.S.; Fernandes, P.M.; Carvalheiro, L.G. Importance of biotic pollination varies across common bean cultivars. J. Appl. Entomol. 2021, 146, 32–43. [Google Scholar] [CrossRef]
- Giannini, T.C.; Cordeiro, G.D.; Freitas, B.M.; Saraiva, A.M.; Imperatriz-Fonseca, V.L. The dependence of crops for pollinators and the economic value of pollination in Brazil. J. Econ. Entomol. 2015, 108, 849–857. [Google Scholar] [CrossRef] [PubMed]
- George, J.; Glover, J.P.; Gore, J.; Crow, W.D.; Reddy, G.V.P. Biology, ecology, and pest management of the tarnished plant bug, Lygus lineolaris (Palisot de Beauvois) in southern row crops. Insects 2021, 12, 807. [Google Scholar] [CrossRef]
- Mouden, S.; Sarmiento, K.F.; Klinkhamer, P.G.L.; Leiss, K.A. Integrated pest management in western flower thrips: Past, present and future. Pest Manag. Sci. 2017, 73, 813–822. [Google Scholar] [CrossRef] [PubMed] [Green Version]
- Naranjo, S.E. Conservation and evaluation of natural enemies in IPM systems for Bemisia tabaci. Crop Prot. 2001, 20, 835–852. [Google Scholar] [CrossRef] [Green Version]
- Glinwood, R.; Ahmed, E.; Qvarfordt, E.; Ninkovic, V.; Pettersson, J. Airborne interactions between undamaged plants of different cultivars affect insect herbivores and natural enemies. Arthropod-Plant Interact. 2009, 3, 215–224. [Google Scholar] [CrossRef] [Green Version]
- Hauri, K.C.; Glassmire, A.E.; Wetzel, W.C. Chemical diversity rather than cultivar diversity predicts natural enemy control of herbivore pests. Ecol. Appl. 2021, 31, e02289. [Google Scholar] [CrossRef]
- Helmi, A.; Rashwan, R. Susceptibility of some solanaceous plant cultivars to sap-sucking insects infestation and their associated natural enemies. J. Plant Prot. Pathol. 2015, 6, 763–781. [Google Scholar] [CrossRef] [Green Version]
- Krauss, J.; Härri, S.A.; Bush, L.; Husi, R.; Bigler, L.; Power, S.A.; Müller, C.B. Effects of fertilizer, fungal endophytes and plant cultivar on the performance of insect herbivores and their natural enemies. Funct. Ecol. 2007, 21, 107–116. [Google Scholar] [CrossRef]
- da Silva, A.G.; Boiça Júnior, A.L.; da Silva Farias, P.R.; de Souza, B.H.S.; Rodrigues, N.E.L.; Carbonell, S.A.M. Common bean resistance expression to whitefly in winter and rainy seasons in Brazil. Sci. Agric. 2019, 76, 389–397. [Google Scholar] [CrossRef] [Green Version]
- Huff, F.A. Relation between leafhopper influxes and synoptic weather conditions. J. Appl. Meteorol. Climatol. 1963, 2, 39–43. [Google Scholar] [CrossRef]
- Showers, W.B.; De Rozari, M.B.; Reed, G.L.; Shaw, R.H. Temperature-related climatic effects on survivorship of the European corn borer. Environ. Entomol. 1978, 7, 717–723. [Google Scholar] [CrossRef]
- Weather Atlas. 2021. Available online: https://www.weather-us.com/en/georgia-usa-climate#climate_text_1 (accessed on 16 July 2021).
- SoilWeb. 2021. Available online: https://casoilresource.lawr.ucdavis.edu/gmap/ (accessed on 16 July 2021).
- Naranjo, S.E.; Flint, H.M. Spatial distribution of adult Bemisia tabaci in cotton and development and validation of fixed-precision sequential sampling plans for estimating population density. Environ. Entomol. 1995, 24, 261–270. [Google Scholar] [CrossRef]
- Yin, G.; Ma, Y. Pearson-type goodness-of-fit test with bootstrap maximum likelihood estimation. Electron. J. Stat. 2013, 7, 412–427. [Google Scholar] [CrossRef] [PubMed] [Green Version]
- SAS Institute. SAS/STAT User’s Guide; Version 9.4; SAS Institute: Cary, NC, USA, 2003. [Google Scholar]
- Gui, H.L. Susceptibility of bean varieties to insect infestation. Ohio Agric. Expt. Sta. Bull. 1945, 659, 112–113. [Google Scholar]
- Hagel, G.T. Lygus spp.: Damage to beans by reducing yields, seed pitting, and control by varietal resistance and chemical sprays. J. Econ. Entomol. 1978, 71, 613–615. [Google Scholar] [CrossRef]
- Taksdal, G. Ecology of plant resistance to the tarnished plant bug, Lygus lineolaris. Ann. Entomol. Soc. Am. 1963, 56, 69–74. [Google Scholar] [CrossRef]
- Roulston, T.H.; Goodell, K. The role of resources and risks in regulating wild bee populations. Annu. Rev. Entomol. 2011, 56, 293–312. [Google Scholar] [CrossRef] [Green Version]
- Free, J.B. Insect Pollination of Crops, 2nd ed.; Academic Press: London, UK, 1993; p. 684. [Google Scholar]
- Ibarra-Perez, F.J.; Barnhart, D.; Ehdaie, B.; Knio, K.M.; Waines, J.G. Effects of insect tripping on seed yield of common beans. Crop Sci. 1999, 39, 428–433. [Google Scholar] [CrossRef]
- Ramos, D.D.L.; Bustamante, M.M.; Silva, F.D.D.S.E.; Carvalheiro, L.G. Crop fertilization affects pollination service provision–common bean as a case study. PLoS ONE 2018, 13, e0204460. [Google Scholar] [CrossRef] [PubMed] [Green Version]
- Riechert, S.E.; Lockley, T. Spiders as biological control agents. Annu. Rev. Entomol. 1984, 29, 299–320. [Google Scholar] [CrossRef]
- Nyffeler, M.; Benz, G. Spiders in natural pest control: A review. J. Appl. Entomol. 1987, 103, 321–339. [Google Scholar] [CrossRef] [Green Version]
- Kataria, S.K.; Singh, P.; Kaur, B.; Kaur, J. Population dynamics of whitefly, Bemisia tabaci Gennadius and leaf hopper, Amrasca biguttula biguttula Ishida in cotton and their relationship with climatic factors. J. Entomol. Zool. Stud. 2017, 5, 976–983. [Google Scholar]
- Nottingham, L.B. Development and Evaluation of Integrated Approaches for Managing of Mexican Bean Beetle, Epilachna varivestis Mulsant. Ph.D. Dissertation, Virginia Polytechnic Institute and State University, Blacksburg, VA, USA, 2016. [Google Scholar]
- Seni, A. Role of abiotic factors on the incidence of major insect pests of pigeonpea, Cajanus cajan (L.) Millsp. J. Entomol. Res. 2021, 45, 886–890. [Google Scholar] [CrossRef]
- Abrahamczyk, S.; Kluge, J.; Gareca, Y.; Reichle, S.; Kessler, M. The influence of climatic seasonality on the diversity of different tropical pollinator groups. PLoS ONE 2011, 6, e27115. [Google Scholar] [CrossRef] [Green Version]
- González, A.; Dalsgaard, B.; Ollerton, J.; Timmermann, A.; Olesen, J.; Andersen, L.; Tossas, A. Effects of climate on pollination networks in the West Indies. J. Trop. Ecol. 2009, 25, 493–506. [Google Scholar] [CrossRef]
- Aneni, T.; Aisagbonhi, C.; Iloba, B.; Adaigbe, V.; Ogbebor, C. Influence of weather factors on seasonal population dynamics of Coelaenomenodera elaeidis (Coleoptera: Chrysomelidae) and its natural enemies in Nifor, Nigeria. Am. J. Plant Sci. 2014, 5, 42–47. [Google Scholar] [CrossRef] [Green Version]
- de Sassi, C.; Tylianakis, J.M. Climate change disproportionately increases herbivore over plant or parasitoid biomass. PLoS ONE 2012, 7, e40557. [Google Scholar] [CrossRef]
- Romo, C.M.; Tylianakis, J.M. Elevated temperature and drought interact to reduce parasitoid effectiveness in suppressing hosts. PLoS ONE 2013, 8, e58136. [Google Scholar] [CrossRef] [Green Version]
- Kitayama, K.; Stinner, R.E.; Rabb, R.L. Effects of temperature, humidity and soybean maturity on longevity and fecundity of the adult Mexican bean beetle, Epilachna varivestis. Environ. Entomol. 1979, 8, 458–464. [Google Scholar] [CrossRef]
- Marcovitch, S.; Stanley, W.W. The climatic limitations of the Mexican bean beetle. Ann. Entomol. Soc. Am. 1930, 23, 666–686. [Google Scholar] [CrossRef]
- Mellors, W.K.; Bassow, F.E. Temperature-dependent development of Mexican bean beetle (Coleoptera: Coccinellidae) immatures on snap bean and soybean foliage. Ann. Entomol. Soc. Am. 1983, 76, 692–698. [Google Scholar] [CrossRef] [Green Version]
- Sweetman, H.L. The effects of temperature and moisture on the distribution of the Mexican bean beetle, Epilachna corrupta, Mulsant. Ann. Entomol. Soc. Am. 1932, 25, 224–240. [Google Scholar] [CrossRef]
- Wilson, K.G.; Stinner, R.E.; Rabb, R.L. Effects of temperature, relative humidity, and host plant on larval survival of the Mexican bean beetle, Epilachna varivestis Mulsant. Environ. Entomol. 1982, 11, 121–126. [Google Scholar] [CrossRef]
- Hussain, M.; Akram, M.; Abbas, Q.; Ahmad, S.; Babar, T.K.; Karar, H. Impact of environmental factors on the population dynamics of leaf hopper Amrasca biguttula biguttula Ishida (Homoptera: Jassidae) on various transgenic cotton genotypes in Multan. Acad. J. Entomol. 2014, 7, 27–31. [Google Scholar] [CrossRef]
- Kadam, D.B.; Kadam, D.R.; Umate, S.M. Effects of weather parameters on incidence sucking pests on Bt cotton. Int. J. Plant Prot. 2015, 8, 211–213. [Google Scholar] [CrossRef]
- Laxman, P.; Samatha, C.; Sammaiah, C. Sucking pest on Bt and non Bt-cotton. Indian J. Entomol. 2013, 75, 167–169. [Google Scholar]
- Gebremedhn, H.; Tadesse, A.; Belay, T. Relating climatic factors to foraging behavior of honeybees (Apis mellifera) during blooming period of Guizotia abyssinica (L.F.). Livest. Res. Rural Dev. 2014, 26, 60. [Google Scholar]
- Nikolova, I.; Georgieva, N.; Kirilov, A.; Mladenova, R. Dynamics of dominant bees–pollinators and influence of temperature, relative humidity and time of day on their abundance in forage crops in Pleven region, Bulgaria. J. Glob. Agric. Ecol. 2016, 5, 200–209. [Google Scholar]
- Munyuli, M.T. Climatic, regional land-use intensity, landscape and local variables predicting best the occurrence and distribution of bee community diversity in various farmland habitats in Uganda. Psyche 2013, 38, 564528. [Google Scholar] [CrossRef]
- Omoloye, A.A.; Akinsola, P.A. Foraging sources and effects of selected plant characters and weather variables on the visitation intensity of honeybee, Apis mellifera adansonii (Hymenoptera: Apidae) in the Southwest Nigeria. J. Apic. Sci. 2006, 50, 51–60. [Google Scholar]
- Choudhary, P.K.; Kumawat, K.C.; Jakhar, S. Seasonal abundance of aphid, Rhopalosiphum maidis (Fitch) and its natural enemies on barley (Hordeum vulgare Linn.) and predatory potential of major Coccinellid predators on aphid (Rhopalosiphum maidis). J. Pharm. Innov. 2022, 11, 2760–2764. [Google Scholar]
- Kashyap, N.; Painkra, G.P.; Painkra, K.L.; Bhagat, P.K. Insect-pests succession, natural enemies and their correlation with weather parameters in mustard crop. J. Plant Dev. Sci. 2018, 10, 563–568. [Google Scholar]


| Sampling Weeks (Dates) | Temperature (°C) | Relative Humidity (%) | Rainfall (mm) | ||||
|---|---|---|---|---|---|---|---|
| Minimum | Average | Maximum | Minimum | Average | Maximum | ||
| 2020 fall | |||||||
| 1 (28/Sep.–04/Oct.) | 10.98 (±0.65) | 17.42 (±0.66) | 23.87 (±1.34) | 41.38 (±6.48) | 73.76 (±5.37) | 94.88 (±3.37) | 0.11 (±0.00) |
| 2 (05/Oct.–11/Oct.) | 18.04 (±1.88) | 23.06 (±1.08) | 28.07 (±1.50) | 55.30 (±4.67) | 83.65 (±2.27) | 99.27 (±0.56) | 2.83 (±0.08) |
| 3 (12/Oct.–18/Oct.) | 12.87 (±2.19) | 19.44 (±2.14) | 26.02 (±2.18) | 48.12 (±1.74) | 77.35 (±2.93) | 96.39 (±1.93) | 0.04 (±0.00) |
| 4 (19/Oct.–25/Oct.) | 16.95 (±0.81) | 21.70 (±0.45) | 26.44 (±0.66) | 58.61 (±2.54) | 86.48 (±2.56) | 98.77 (±0.77) | 1.92 (±0.06) |
| 5 (26/Oct.–01/Nov.) | 13.54 (±8.61) | 19.01 (±9.84) | 24.49 (±11.14) | 51.79 (±5.72) | 80.07 (±3.95) | 96.51 (±2.02) | 0.51 (±0.01) |
| 6 (02/Nov.–08/Nov.) | 9.21 (±4.83) | 15.83 (±3.36) | 22.45 (±2.15) | 42.08 (±7.71) | 70.13 (±6.39) | 95.21 (±1.89) | 0.83 (±0.03) |
| 2021 spring | |||||||
| 1 (10/May–16/May) | 11.71 (±2.88) | 18.19 (±1.13) | 24.57 (±1.91) | 45.02 (±8.31) | 74.01 (±5.12) | 98.61 (±0.86) | 5.33 (±0.17) |
| 2 (17/May–23/May) | 14.16 (±1.01) | 21.66 (±0.29) | 28.43 (±1.05) | 37.52 (±2.50) | 66.65 (±1.22) | 97.20 (±1.27) | 0.15 (±0.01) |
| 3 (24/May –30/May) | 16.49 (±1.83) | 23.78 (±0.89) | 30.87 (±1.94) | 33.80 (±2.10) | 66.67 (±2.03) | 96.76 (±1.01) | 2.47 (±0.09) |
| 4 (31/May –06/June) | 16.97 (±2.09) | 23.43 (±0.73) | 30.30 (±1.25) | 40.43 (±2.04) | 72.20 (±2.49) | 99.64 (±0.20) | 0.62 (±0.02) |
| 5 (07/June–13/June) | 20.30 (±0.60) | 24.29 (±0.34) | 31.19 (±0.78) | 52.10 (±3.42) | 85.38 (±2.36) | 99.71 (±0.19) | 4.79 (±0.12) |
| 6 (14/June–20/June) | 19.41 (±1.09) | 24.91 (±0.64) | 30.97 (±2.60) | 47.06 (±7.37) | 74.54 (±5.51) | 96.50 (±1.50) | 9.40 (±0.28) |
| Insect Pests | Fixed Effects | F | df | p |
|---|---|---|---|---|
| Cucumber beetle | ||||
| Week × Cultivar | 0.29 | 115, 286 | 1.00 | |
| Week | 4.39 | 5, 286 | 0.0007 | |
| Cultivar | 0.26 | 23, 286 | 1.00 | |
| Megacopta cribraria | ||||
| Week × Cultivar | 0.73 | 115, 286 | 0.97 | |
| Week | 88.61 | 5, 286 | <0.0001 | |
| Cultivar | 0.45 | 23, 286 | 0.99 | |
| Epilachna varivestis | ||||
| Week × Cultivar | 0.21 | 115, 276 | 1.00 | |
| Week | 5.72 | 5, 276 | <0.0001 | |
| Cultivar | 0.37 | 23, 276 | 1.00 | |
| Thrips | ||||
| Week × Cultivar | 1.09 | 115, 286 | 0.06 | |
| Week | 70.18 | 5, 286 | <0.0001 | |
| Cultivar | 0.27 | 23, 286 | 1.00 | |
| Lygus lineolaris | ||||
| Week × Cultivar | 0.62 | 115, 286 | 1.00 | |
| Week | 28.79 | 5, 286 | <0.0001 | |
| Cultivar | 0.37 | 23, 286 | 1.00 | |
| Empoasca fabae | ||||
| Week × Cultivar | 1.75 | 115, 286 | <0.0001 | |
| Week | 14.19 | 5, 286 | <0.0001 | |
| Cultivar | 2.10 | 23, 286 | 0.0028 |
| Cultivars | Sampling Weeks | Average Counts among Weeks | |||||
|---|---|---|---|---|---|---|---|
| 1 | 2 | 3 | 4 | 5 | 6 | ||
| Affirmed | 0.99 ± 0.58 bD | 6.63 ± 1.53 bcC | 16.24 ± 2.51 aA | 8.28 ± 1.73 abB | 8.25 ± 1.78 aB | 8.29 ± 1.73 cdB | 6.25 ± 0.90 |
| BA0958 | 0.66 ± 0.47 bcD | 9.28 ± 1.84 abA | 4.97 ± 1.32 fgC | 4.64 ± 1.27 cC | 5.61 ± 1.43 cB | 6.63 ± 1.53 dB | 4.16 ± 0.70 |
| Barron | 0.33 ± 0.33 cD | 5.30 ± 1.36 cdB | 11.60 ± 2.08 bA | 4.64 ± 1.27 cB | 4.29 ± 1.24 dBC | 3.98 ± 1.17 fgC | 3.41 ± 0.71 |
| Bronco | 2.32 ± 0.89 aD | 4.31 ± 1.22 deC | 8.29 ± 1.73 dA | 8.28 ± 1.73 abA | 7.59 ± 1.69 bA | 6.96 ± 1.57 dB | 5.73 ± 0.75 |
| Caprice | 1.33 ± 0.67 bD | 10.93 ± 2.01 aA | 6.96 ± 1.57 eB | 6.30 ± 1.49 bcB | 4.79 ± 1.31 cdC | 3.32 ± 1.07 gC | 4.63 ± 0.68 |
| Carson | 1.33 ± 0.67 bB | 4.97 ± 1.32 cdA | 4.31 ± 1.22 gA | 4.97 ± 1.32 cA | 4.95 ± 1.34 cdA | 4.97 ± 1.32 efA | 3.88 ± 0.59 |
| Colter | 0.99 ± 0.58 bD | 5.63 ± 1.41 cC | 8.29 ± 1.73 dA | 6.96 ± 1.57 bB | 6.44 ± 1.55 bcB | 5.97 ± 1.45 deC | 4.80 ± 0.72 |
| Contender | 0.33 ± 0.33 cD | 4.64 ± 1.27 cdB | 5.64 ± 1.41 fA | 3.31 ± 1.07 dC | 3.96 ± 1.19 dBC | 4.64 ± 1.27 fB | 2.83 ± 0.60 |
| Gold Mine | 0.33 ± 0.33 cE | 3.31 ± 1.07 eD | 12.60 ± 2.17 abA | 9.28 ± 1.84 aB | 7.26 ± 1.65 bC | 5.31 ± 1.36 efC | 4.11 ± 0.84 |
| Golden Rod | 0.00 ± 0.00 cD | 9.28 ± 1.84 abA | 2.32 ± 0.89 gC | 8.28 ± 1.73 abA | 6.44 ± 1.55 bcB | 4.64 ± 1.27 fB | 1.61 ± 1.06 |
| Greenback | 0.66 ± 0.47 bcD | 7.29 ± 1.61 bcB | 9.94 ± 1.91 cA | 4.97 ± 1.32 cC | 4.95 ± 1.34 cdC | 4.97 ± 1.32 efC | 4.23 ± 0.71 |
| Greencrop | 0.33 ± 0.33 cC | 4.64 ± 1.27 cdA | 3.98 ± 1.17 gB | 4.97 ± 1.32 cA | 4.79 ± 1.31 cdA | 4.64 ± 1.27 fA | 2.95 ± 0.62 |
| Jade | 0.33 ± 0.33 cD | 5.30 ± 1.36 cdB | 9.28 ± 1.84 cdA | 6.96 ± 1.57 bB | 4.95 ± 1.34 cdB | 2.98 ± 1.01 gC | 3.44 ± 0.71 |
| Long Tendergreen | 0.66 ± 0.47 bcD | 7.29 ± 1.61 bcBC | 8.29 ± 1.73 dB | 6.96 ± 1.57 bC | 8.91 ± 1.86 aB | 10.94 ± 2.01 bA | 5.46 ± 0.88 |
| Maxibel | 0.99 ± 0.58 bD | 4.97 ± 1.32 cdC | 7.29 ± 1.61 eB | 6.96 ± 1.57 bB | 7.92 ± 1.74 abB | 8.95 ± 1.80 cA | 5.09 ± 0.76 |
| Momentum | 0.33 ± 0.33 cD | 2.32 ± 0.89 fC | 13.26 ± 2.24 abA | 5.30 ± 1.36 cB | 5.78 ± 1.46 cB | 6.30 ± 1.49 deB | 3.53 ± 0.74 |
| Prevail | 0.66 ± 0.47 bcC | 4.64 ± 1.27 cdAB | 8.29 ± 1.73 dA | 6.63 ± 1.53 bA | 7.26 ± 1.65 bA | 7.96 ± 1.69 cdA | 4.61 ± 0.76 |
| Provider | 1.66 ± 0.75 bC | 7.29 ± 1.61 bcA | 7.63 ± 1.65 deA | 6.96 ± 1.57 bA | 6.27 ± 1.52 bcA | 5.64 ± 1.41 eB | 5.30 ± 0.73 |
| PV-857 | 0.00 ± 0.00 cD | 6.30 ± 1.49 cB | 8.29 ± 1.73 dA | 3.65 ± 1.12 dC | 3.47 ± 1.10 eC | 3.32 ± 1.07 gC | 1.39 ± 0.59 |
| Roma II | 0.66 ± 0.47 bcD | 3.64 ± 1.12 deC | 7.95 ± 1.69 deB | 4.64 ± 1.27 cC | 8.75 ± 1.84 aB | 12.93 ± 2.21 aA | 4.63 ± 0.77 |
| Royal Burgundy | 1.33 ± 0.67 bC | 4.31 ± 1.22 deB | 12.26 ± 2.14 bA | 5.63 ± 1.41 bcB | 4.79 ± 1.31 cdB | 3.98 ± 1.17 dB | 4.41 ± 0.65 |
| SV1003GF | 0.33 ± 0.33 cD | 6.63 ± 1.53 bcB | 11.27 ± 2.04 bcA | 3.98 ± 1.17 cdC | 3.63 ± 1.13 dC | 3.32 ± 1.07 gC | 3.24 ± 0.68 |
| Sybaris | 0.99 ± 0.58 bC | 7.95 ± 1.69 bB | 14.58 ± 2.36 aA | 6.96 ± 1.57 bB | 7.92 ± 1.74 abB | 8.95 ± 1.80 cB | 6.18 ± 0.89 |
| Tema | 2.98 ± 1.01 aD | 6.30 ± 1.49 cB | 11.27 ± 2.04 bcA | 4.97 ± 1.32 cC | 5.12 ± 1.36 cC | 5.30 ± 1.36 efC | 5.51 ± 0.72 |
| Average counts among cultivars | 0.47 ± 0.29 | 5.61 ± 0.53 | 8.18 ± 0.74 | 5.79 ± 0.54 | 5.79 ± 0.54 | 5.57 ± 0.53 | |
| Insect Pests | Fixed Effects | F | df | p |
|---|---|---|---|---|
| Cucumber beetle | ||||
| Week × Cultivar | 0.34 | 115, 284 | 1.00 | |
| Week | 10.38 | 5, 284 | <0.0001 | |
| Cultivar | 0.25 | 23, 284 | 1.00 | |
| Epilachna varivestis | ||||
| Week × Cultivar | 0.43 | 115, 284 | 1.00 | |
| Week | 7.06 | 5, 284 | <0.0001 | |
| Cultivar | 0.38 | 23, 284 | 1.00 | |
| Lygus lineolaris | ||||
| Week × Cultivar | 0.77 | 101, 284 | 0.94 | |
| Week | 3.72 | 5, 284 | 0.00 | |
| Cultivar | 4.64 | 23, 284 | <0.0001 | |
| Empoasca fabae | ||||
| Week × Cultivar | 0.91 | 107, 284 | 0.71 | |
| Week | 82.99 | 5, 284 | <0.0001 | |
| Cultivar | 11.00 | 23, 284 | <0.0001 |
Disclaimer/Publisher’s Note: The statements, opinions and data contained in all publications are solely those of the individual author(s) and contributor(s) and not of MDPI and/or the editor(s). MDPI and/or the editor(s) disclaim responsibility for any injury to people or property resulting from any ideas, methods, instructions or products referred to in the content. |
© 2023 by the authors. Licensee MDPI, Basel, Switzerland. This article is an open access article distributed under the terms and conditions of the Creative Commons Attribution (CC BY) license (https://creativecommons.org/licenses/by/4.0/).
Share and Cite
Li, Y.; Mbata, G.N.; Simmons, A.M. Population Dynamics of Insect Pests and Beneficials on Different Snap Bean Cultivars. Insects 2023, 14, 230. https://doi.org/10.3390/insects14030230
Li Y, Mbata GN, Simmons AM. Population Dynamics of Insect Pests and Beneficials on Different Snap Bean Cultivars. Insects. 2023; 14(3):230. https://doi.org/10.3390/insects14030230
Chicago/Turabian StyleLi, Yinping, George N. Mbata, and Alvin M. Simmons. 2023. "Population Dynamics of Insect Pests and Beneficials on Different Snap Bean Cultivars" Insects 14, no. 3: 230. https://doi.org/10.3390/insects14030230